Communication

Quality Control of Slot-Die Coated Aluminum Oxide Layers for Battery Applications Using Hyperspectral Imaging

Department Chemical Surface and Reaction Technology, Fraunhofer Institute for Material and Beam Technology (IWS) Dresden, Winterbergstr. 28, Dresden 01277, Germany
*
Author to whom correspondence should be addressed.
These authors contributed equally to this work.
J. Imaging 2016, 2(2), 12; https://doi.org/10.3390/jimaging2020012
Submission received: 30 November 2015 / Revised: 23 March 2016 / Accepted: 1 April 2016 / Published: 7 April 2016
(This article belongs to the Special Issue Soft Computing in Image Processing)

Abstract

:
Hyperspectral inspection using imaging systems is becoming more and more important for quality control tasks in several industries, replacing well trained operators or established machine vision systems based on RGB-systems. Hyperspectral imaging (HSI) on thin coated substrates is challenging due to the high reflectivity of the substrates. Nevertheless, the thin films contribute to the spectral data and can be evaluated. Therefore, the performance of inspection systems can be increased significantly. However, the large amount of data generated by HSI has to be processed and evaluated for quality information about the product. In this paper, thin aluminum oxide (Al2O3) layers on stainless steel foil are investigated by HSI. These substrates can be used for the growth of vertically aligned carbon nanotubes (VA-SWCNT) for battery electrodes. HSI and spectral ellipsometry in combination with Partial Least Squares regression (PLS) was used to estimate the thickness of the Al2O3 layers and to calculate quality parameters for a possible monitoring process. The PLS model shows a R2CV of 0.979 and a RMSECV of 3.6.

Graphical Abstract

1. Introduction

Visual inspection is an important tool for defect detection and quality control in industrial applications. Usually visual inspection tasks are performed by trained operators and therefore are liable to the subjectivity of the operators and the variability between the operators. In addition, this kind of inspection is relatively expensive due to the need for well-trained operators. For this reason, camera based systems are becoming more and more popular. They allow for a non-destructive, objective, and complete inline quality control [1,2].
Standard visual inspection cameras are limited in their detection capabilities of spectral information. While a monochrome camera only measures an integral intensity of the whole visible spectral range, RGB cameras at least get three values from different spectral regions. For some monitoring tasks, this may not be sufficient. To overcome this drawback, hyperspectral cameras can be used. Hyperspectral imaging (HSI) is a relatively new technology, first used in the 1980s for remote sensing [3]. Nowadays there is a wide range of applications, e.g. in agriculture, medicine, and food surveillance [4,5,6]. HSI allows the acquisition of hyperspectral images, meaning that there is a complete wavelength spectrum for every pixel of an image. Furthermore the measurable wavelength range is not restricted to the visible range, but can be extended in the ultraviolet, near infrared, and even the mid-infrared range [7].
Thin oxide layers on a reflecting substrate, like stainless steel foil, show characteristic reflection spectra depending on their layer thickness and optical properties. Small changes in this properties lead to a different spectral signature, which can be observed using a spectrometer or ellipsometer and e.g., analyzed to calculate the layer thickness [8]. To obtain a complete thickness map of a coated substrate a time consuming mapping procedure is necessary, when a single point spectrometer or ellipsometer is used. A faster and inline suitable method should be an imaging spectrometer [9].
The present work introduces a framework for the layer thickness control of slot-die coated aluminum oxide (Al2O3) layers on a stainless steel foil using HSI in the visible and near infrared wavelength range (VNIR, 400 nm–1000 nm). The coated steel foils can be used as substrate for the continuous production of vertically aligned carbon nanotubes (VA-CNTs) for battery applications [10].
The proposed framework can be used to control the layer thickness of the Al2O3 and to detect uncoated areas. The layer thickness is calculated using Partial Least Squares regression (PLS) and Principal Component Regression (PCR) with reference values obtained by spectroscopic ellipsometry. The method was developed using offline measurements, herein Section 2 describes the used techniques, while Section 3 illustrates the results of the developed method.

2. Methods

2.1. Slot-Die Coating

For the deposition of thin Al2O3 layers on stainless steel foil (1.4541 Braun Metall) a 90 mm wide Slot-Die coating system from FMP Technology (100 μm slot width, 100 μm gap) was used in the 9 o’clock position on a JWS roll-to-roll lab coater with a web speeds of 0.3 m/min. The flow rate of a 375 mM aluminum sec-butoxide precursor solution (27.71 g aluminum sec-butoxide, 11.26 g acetylacetone, 300 mL isopropanol) was adjusted for wet film thicknesses of 5 μm (0.15 mL/min). After coating, the films were pre-annealed at 200 °C for 5 min and then annealed again for 5 min at 350 °C. This was done by manually pulling the coated steel foil through an oven.
The produced continuous sample sheets were cut into smaller pieces (sample size 9.5 cm × 3 cm) for the hyperspectral analysis. In summary, 208 samples were obtained.

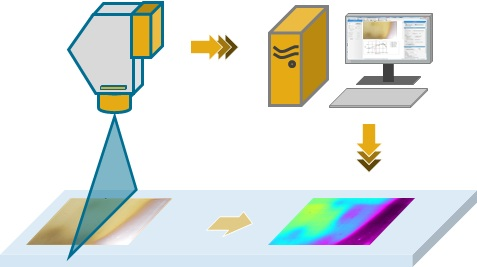
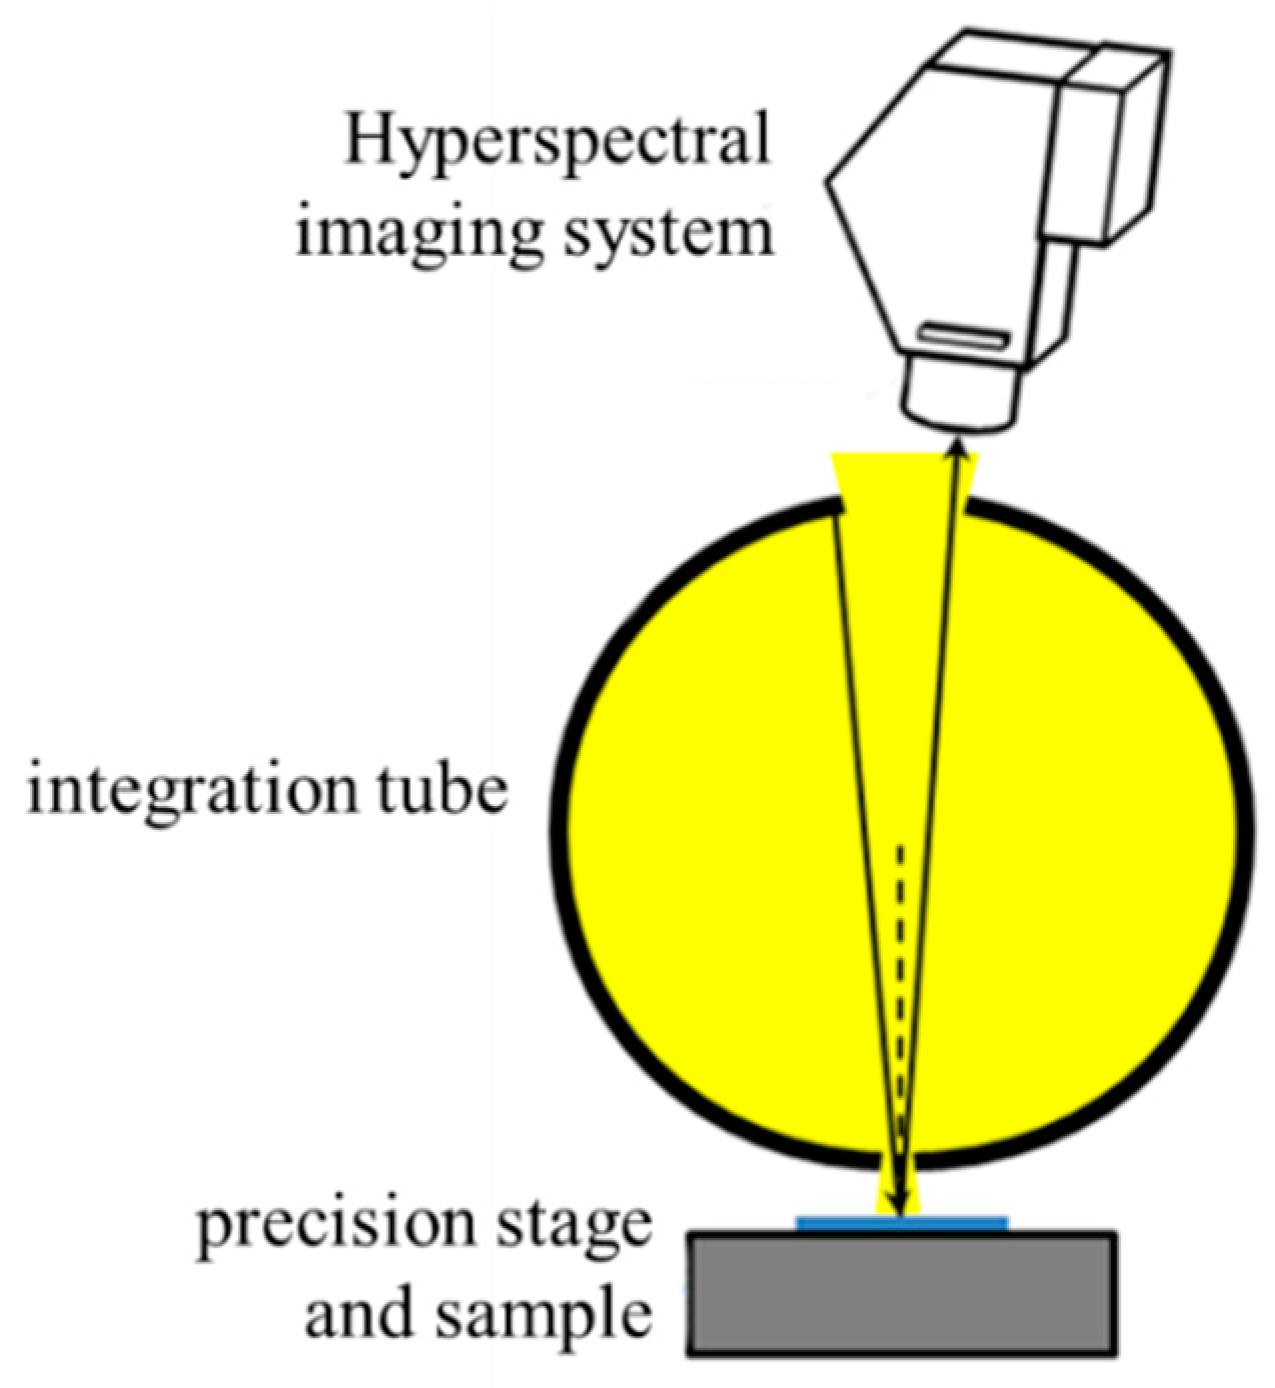
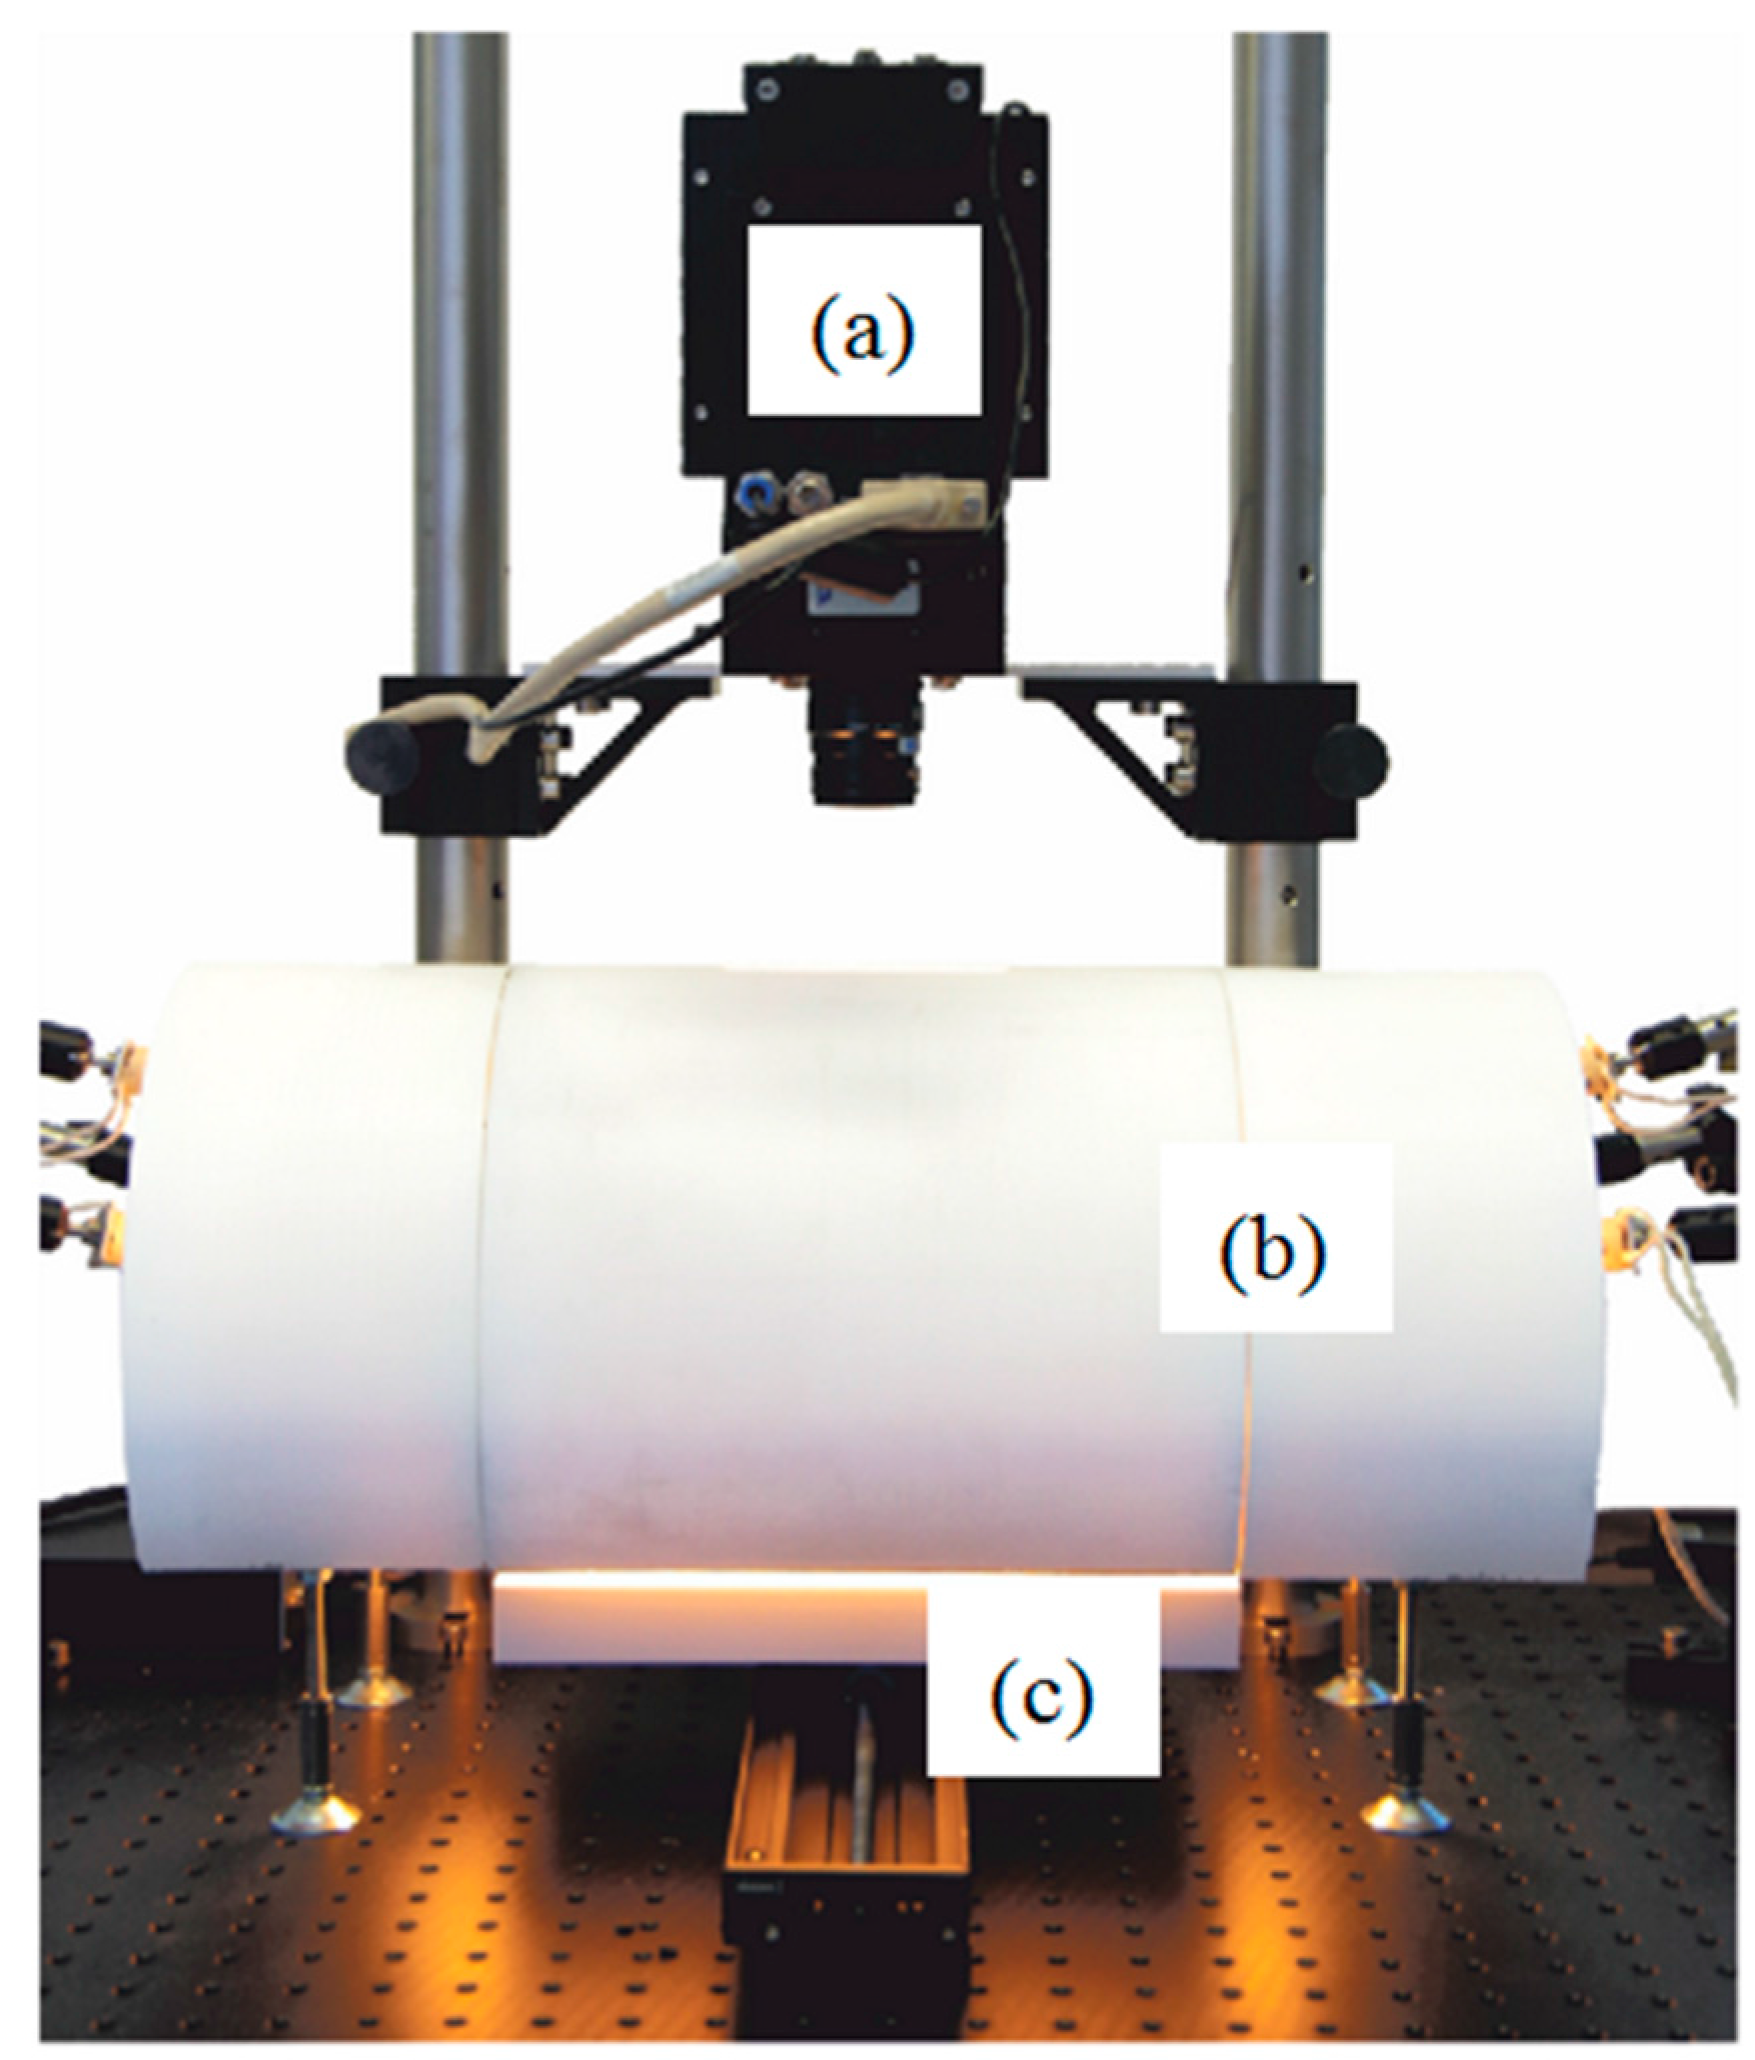
2.2. Measurement Setup and Data Pre-Treatment

The hyperspectral pushbroom imaging system consists of a Luca R CCD detector (Andor Technology Ltd., Belfast, UK) and a reflective spectrograph (Headwall Photonics Inc., Fitchburg, MA, USA) equipped with a 28 mm lens (Jos. Schneider Optische Werke GmbH, City, Germany), a 25 μm optical slit, a conveying stage MoCo DC (PI miCos GmbH, Eschbach, Germany), and a broadband halogen lighting. For data analysis, the imanto® pro software package (Fraunhofer IWS Dresden, Dresden, Germany) was used. The software allows the control of all measurement parameters as well as visualization and basic pre-processing of the acquired hyperspectral images.
The used hyperspectral camera operates in the visible and near-infrared range (VNIR, between 400 nm and 1000 nm), 764 pixels on the CCD were used in spectral dimension. To increase the Signal-to-Noise Ratio (SNR) and to reduce the amount of data, a binning of 2 × 2 was applied, resulting in 502 spatial and 382 spectral pixels per frame (spatial dispersion approx. 200 μm and spectral dispersion approx. 1.5 nm). The frame rate was set to 20 Hz and the integration time to 10 ms. The speed of the conveying stage was set to 4 mm/s.
The gathered reflection spectra were corrected against dark and white references using the following equation:
R ( λ ) = R 0 ( λ ) D ( λ ) W ( λ ) D ( λ )
where R0 ( λ ) is the raw reflectance intensity image at wavelength λ and R ( λ ) is the corrected reflected intensity. The dark reference D ( λ ) was recorded with a closed beam path, while the white reference W ( λ ) was obtained using a spectralon reference. In addition, all spectra were unit vector normalized.

2.3. Spectroscopic Ellipsometry

The ellipsometric measurements were done using an ellipsometer from J.A. Woollam CO. (Lincoln, CA, USA) under incident angels of 60°, 65°, and 70° for wavelengths between 350 nm and 1050 nm with 10 nm increments. Ellipsometric data is expressed by the amplitude ratio ψ and the phase difference Δ between s- and p-polarized light.
ψ = tan ( | r s | | r p | ) ;   Δ   =   δ r p δ r s
where δrp and δrs are the phases of the reflection coefficient for p- and s-polarization and |rp| and |rs| are their respective amplitudes. The obtained spectra for ψ and Δ were analyzed using the WVASE32 software. To describe the index of dispersion (n(λ)) and the absorption coefficient (k(λ)) for the Al2O3 layers, a Chauchy-dispersion model was used [11]:
n ( λ ) = A n + B n λ 2 + C n λ 4
k ( λ ) = A k exp [ B k ( 1 λ 1 C k ) ]
where An/k, Bn/k, and Cn/k are regression parameters.
The optical properties of the stainless steel foil are obtained using a direct fit for n(λ) and k(λ).

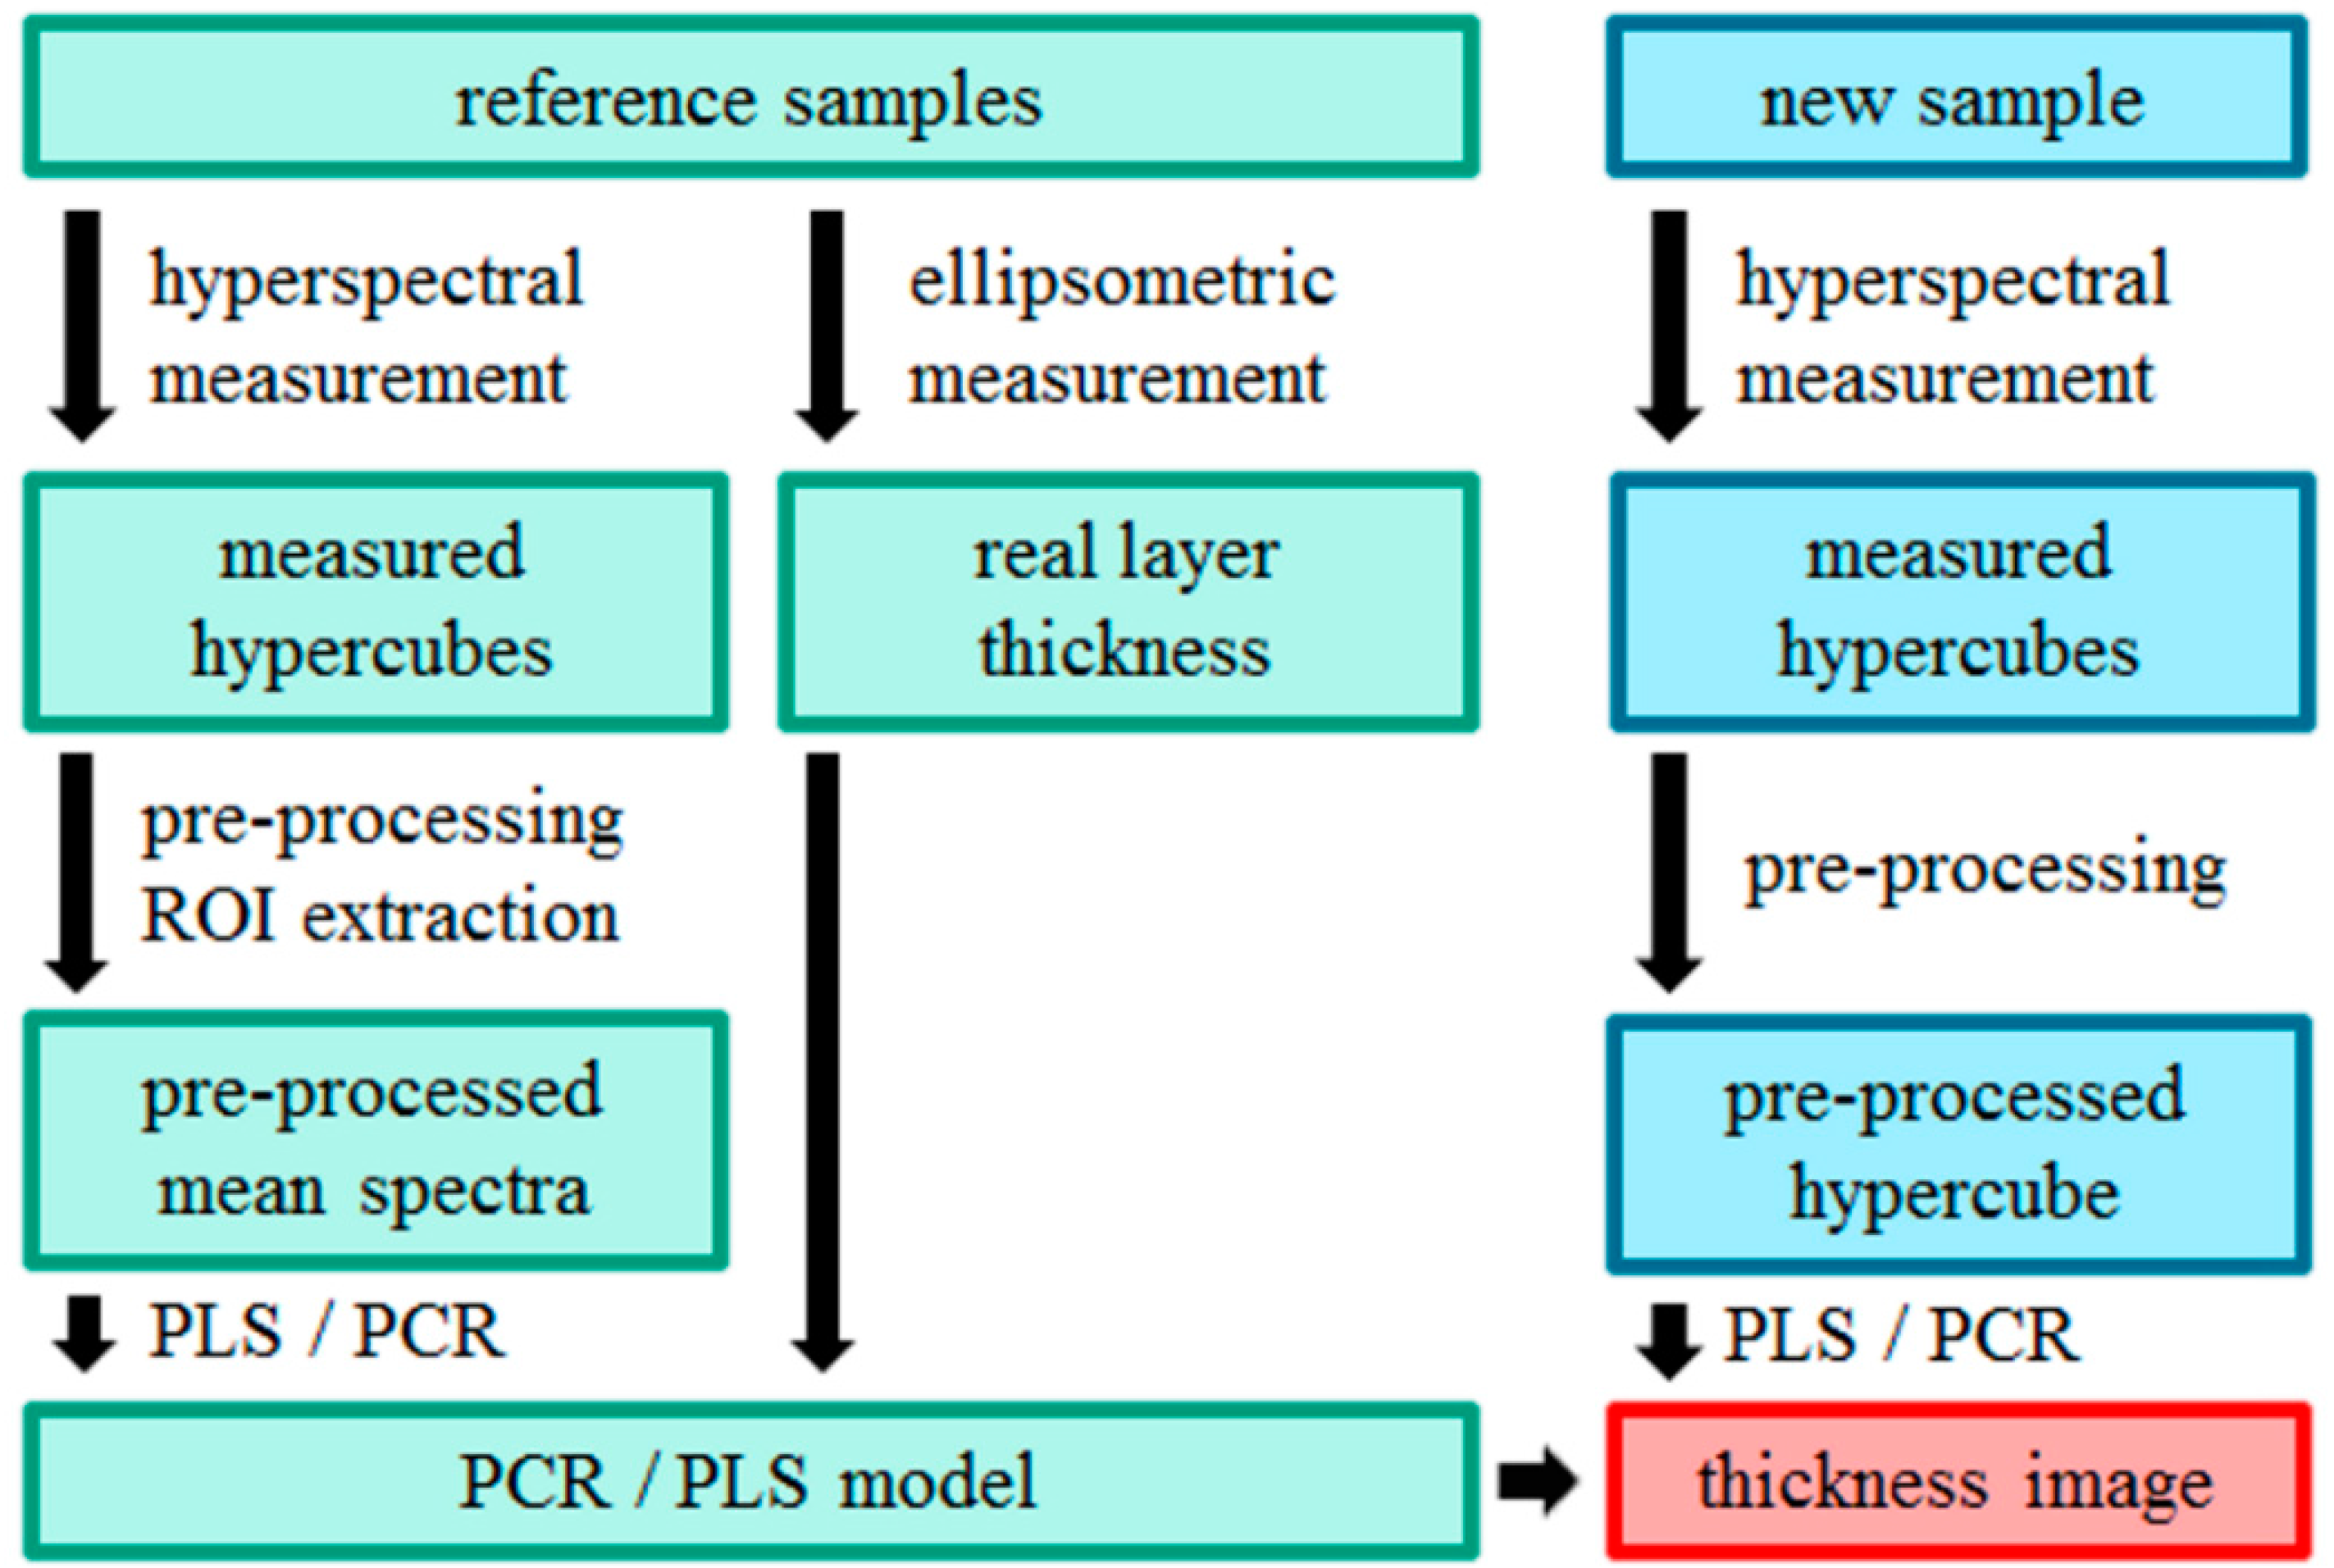
2.4. Data Analysis Methods

Principal Component Analysis (PCA)

Multivariate data analysis was done to predict the Al2O3 layer thickness under use of the measured reflection spectra. Two different multivariate regression methods were used and compared: Principal Component Regression (PCR) and Partial Least Squares regression (PLS). Both methods are able to deal with the high amount of collinearity, present in the spectral data and can be used to predict the Al2O3 layer thickness of new samples directly from their reflectance spectra.
PCR uses Principal Component Analysis (PCA) to obtain a new set of a few, linear independent variables from the spectra, which are used as regressors for multiple linear regression.
Principal component analysis is a widely used technique for analysis of complex and collinear data. PCA projects the original variables onto new ones, called latent variables. These new variables are orthogonal to each other and arranged by their ability, to describe the variance of the original data in decreasing order. For the PCR, only the most important latent variables are retained and used for regression [12].
When PCA is applied to a matrix X (with one spectrum of length λ per row) this can be expressed as:
X = L P T + E
L(x·p) and P(λ·p) are the scores and the loadings matrix for p principal components, while E is the residual matrix of the model. When a PCA model is built, the scores (Ln) of new spectral data (Xn) can be calculated using the equation:
L n = X n P
PCR uses the score values from the spectra in the data matrix X as regressors for multiple linear regression with the Y-values (here the Al2O3 layer thickness derived from spectroscopic ellipsometry).
Instead of decomposing the data matrix X into scores and loadings and using them for regression with the Y values, PLS uses the Y values during the decomposition process. It performs decomposition on both spectral data (X matrix) and layer thickness values (Y values) simultaneously, to find linear prediction models between the decomposed X matrix and the measured Al2O3 thickness values Y. The compression of the X matrix yields latent variables that describe the maximum covariance between the spectral information in the reflectance spectra and the measured thickness values [12].
To estimate the accuracy and the optimal number of latent variables, leave-on-out cross-validation was used for this work. In general, to achieve stable and efficient models, a minimum number of latent variables should be used in the prediction models [12]. The minimal numbers of latent variables was defined at the lowest value of the predicted residual error (PRESS) between the predicted and reference values of the Al2O3 layer thickness:
P R E S S = ( y c a l y m ) 2
Accuracy and predictive power of the PLS and PCR models are compared using the regression coefficient for calibration (R2C) and cross-validation (R2CV) as well as the root mean squared error for calibration (RMSEC) and cross-validation (RMSECV):
R M S E C = ( y c a l y m ) 2 n
R M S E C V = ( y c v y m ) 2 n
where n is the number of samples, ym the real Al2O3 layer thickness obtained by spectroscopic ellipsometry, ycal the layer thickness obtained by the calibration model and ycv the layer thickness estimated by the cross-validation model.
All calculations were conducted using the software The Unscrambler X (CAMO, Trondheim, Norway).

3. Results

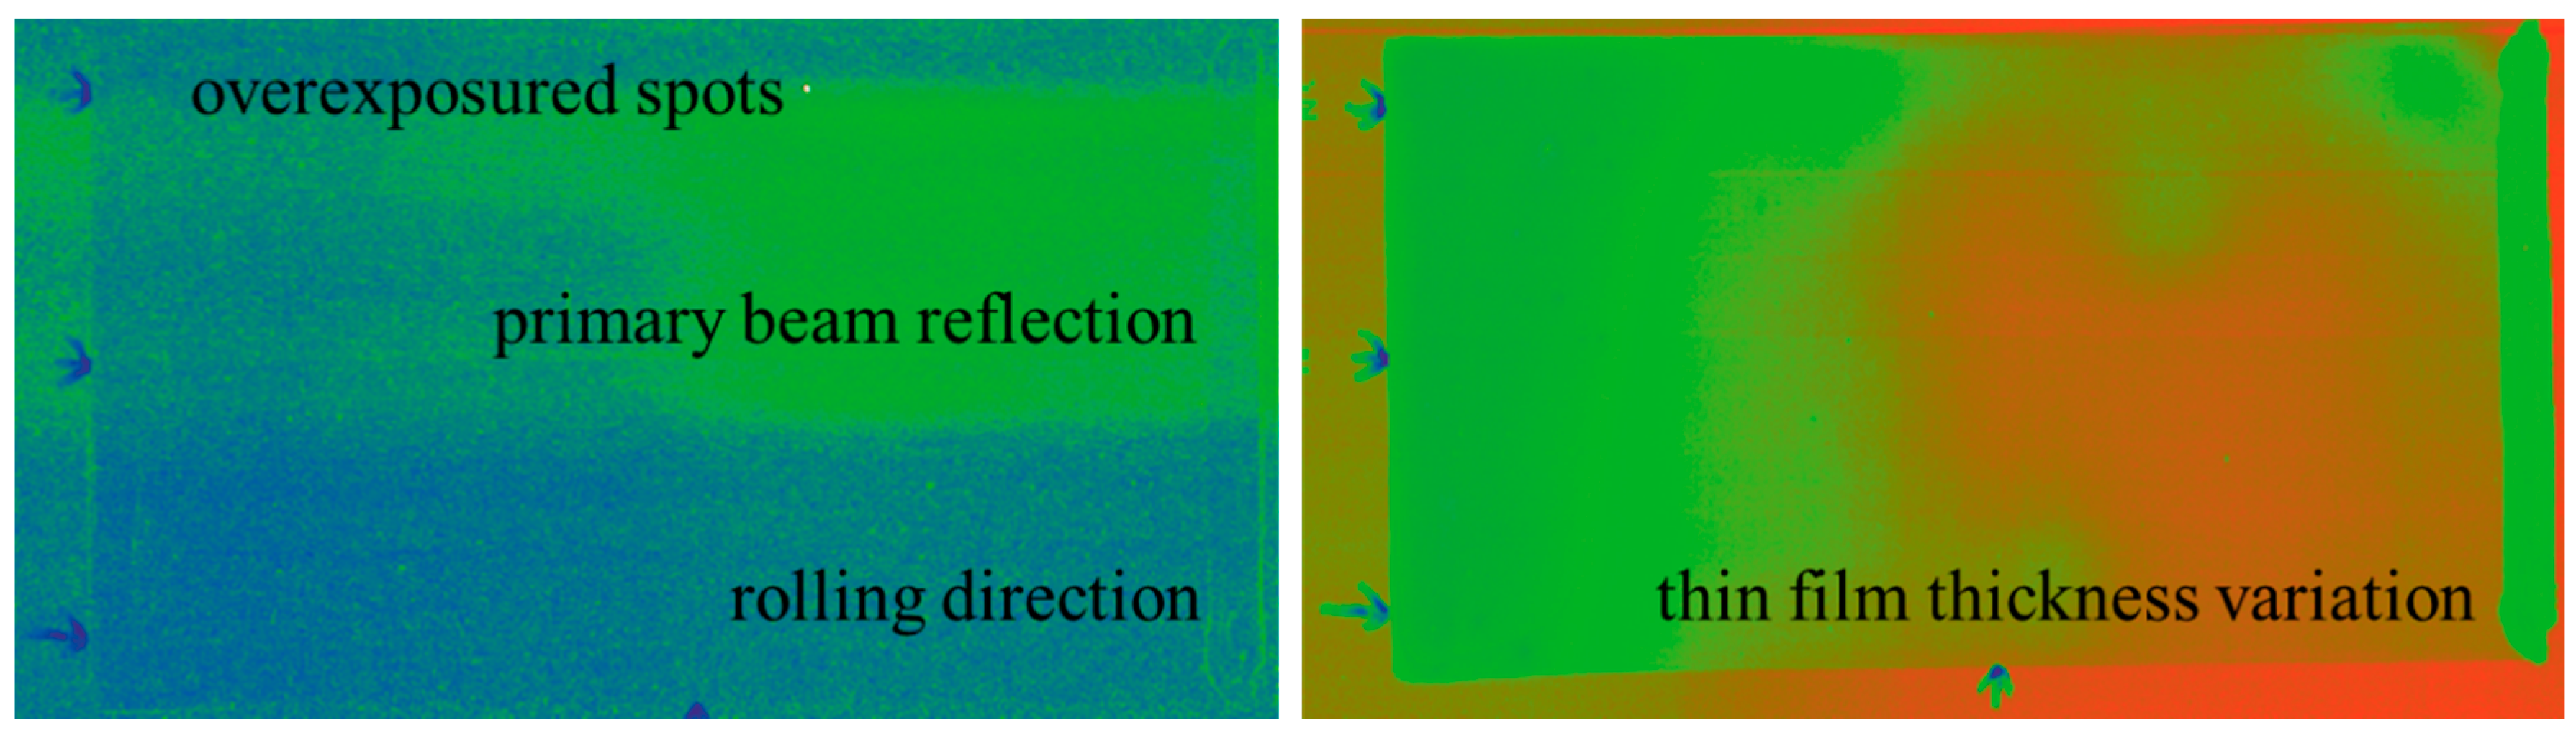
3.1. Hyperspectral Imaging of Thin Films

Thin film hyperspectral imaging of highly reflective substrates is a challenging task. Normal hyperspectral starter kits are mostly equipped with some halogen lighting bulbs for direct lighting, but for thin film imaging the demand for a homogeneous and diffuse lighting must be met. Normally, in single point spectroscopic measurements an integrating sphere will be used. However, the exit aperture in integration spheres is only designed for a small spot size and cannot be used for line lighting as it is needed in hyperspectral measurements. In the presented setup, a line width of up to 30 cm must be illuminated. Appropriate integration spheres will be on one hand very large and on the other hand quiet expensive due to a needed gold coating. To overcome these limitations an integration tube made of optical PTFE was designed and manufactured [9]. The optical PTFE (Berghof Fluoroplastic GmbH, Eningen, Germany) is a sintered material of mm-sized PTFE spheres. An advantage is the high reflection of > 98% from 400 nm up to 2500 nm with no absorption bands. Furthermore, the fine PTFE spheres are scattering centers, therefore multiple reflections and a very bright, homogeneous lighting can be achieved. The integration tube is equipped with broadband halogen lighting lamps with a primary beam stop. Six lamps with a maximum power of 120 W, the needed power supplies are controllable and stabilized to suppress the 50 Hz line frequency (Fraunhofer IWS Dresden, Dresden, Germany). The hyperspectral view port is aligned in the same axis as the exit slit (exit slit width: 5 cm). To avoid shadowing effects, the hyperspectral imaging system is tilted by 0.5° out of the vertical axis (viewport width 1 cm). Figure 1 shows the principle setup of the illumination setup.
To determine the homogeneity of the integration tube, the intensity levels were measured on five positions on the exit slit (width: 30 cm) from left to right for three different power levels. The measurement was carried out with a Unitest Luxmeter 93560 (Ch. Beha GmbH, Glottertal, Germany). As shown in Table 1, the homogeneity is >95%. The remaining uncertainty of the lighting is corrected during the measurements by the spectroscopic bright filed correction (I/I0).
Figure 2 shows the differences of a sample, one time illuminated directly and one time illuminated by the integration tube. The stainless steel plate was coated in a preliminary test of the slot-die coating process as mentioned in Section 2.1. With direct lighting, influences from the substrate, like grains and rolling direction are visible due to the varying reflectance behavior. Also undesired effects from the lighting itself as inhomogeneous primary beam reflections and local overexposures (due to dust or residues of the coating process) are observed. With the same sample illuminated by the integration tube, the substrate effects become irrelevant, while the thin film as well as thickness variations will be clearly visible. It is also shown, that the data quality is primarily determined by the lighting. Only a homogeneous, diffuse lighting as it is ensured by the integration tube allows a 100% thin film imaging. A further advantage of the presented integration tube is the cost benefit in comparison to standard integration spheres.

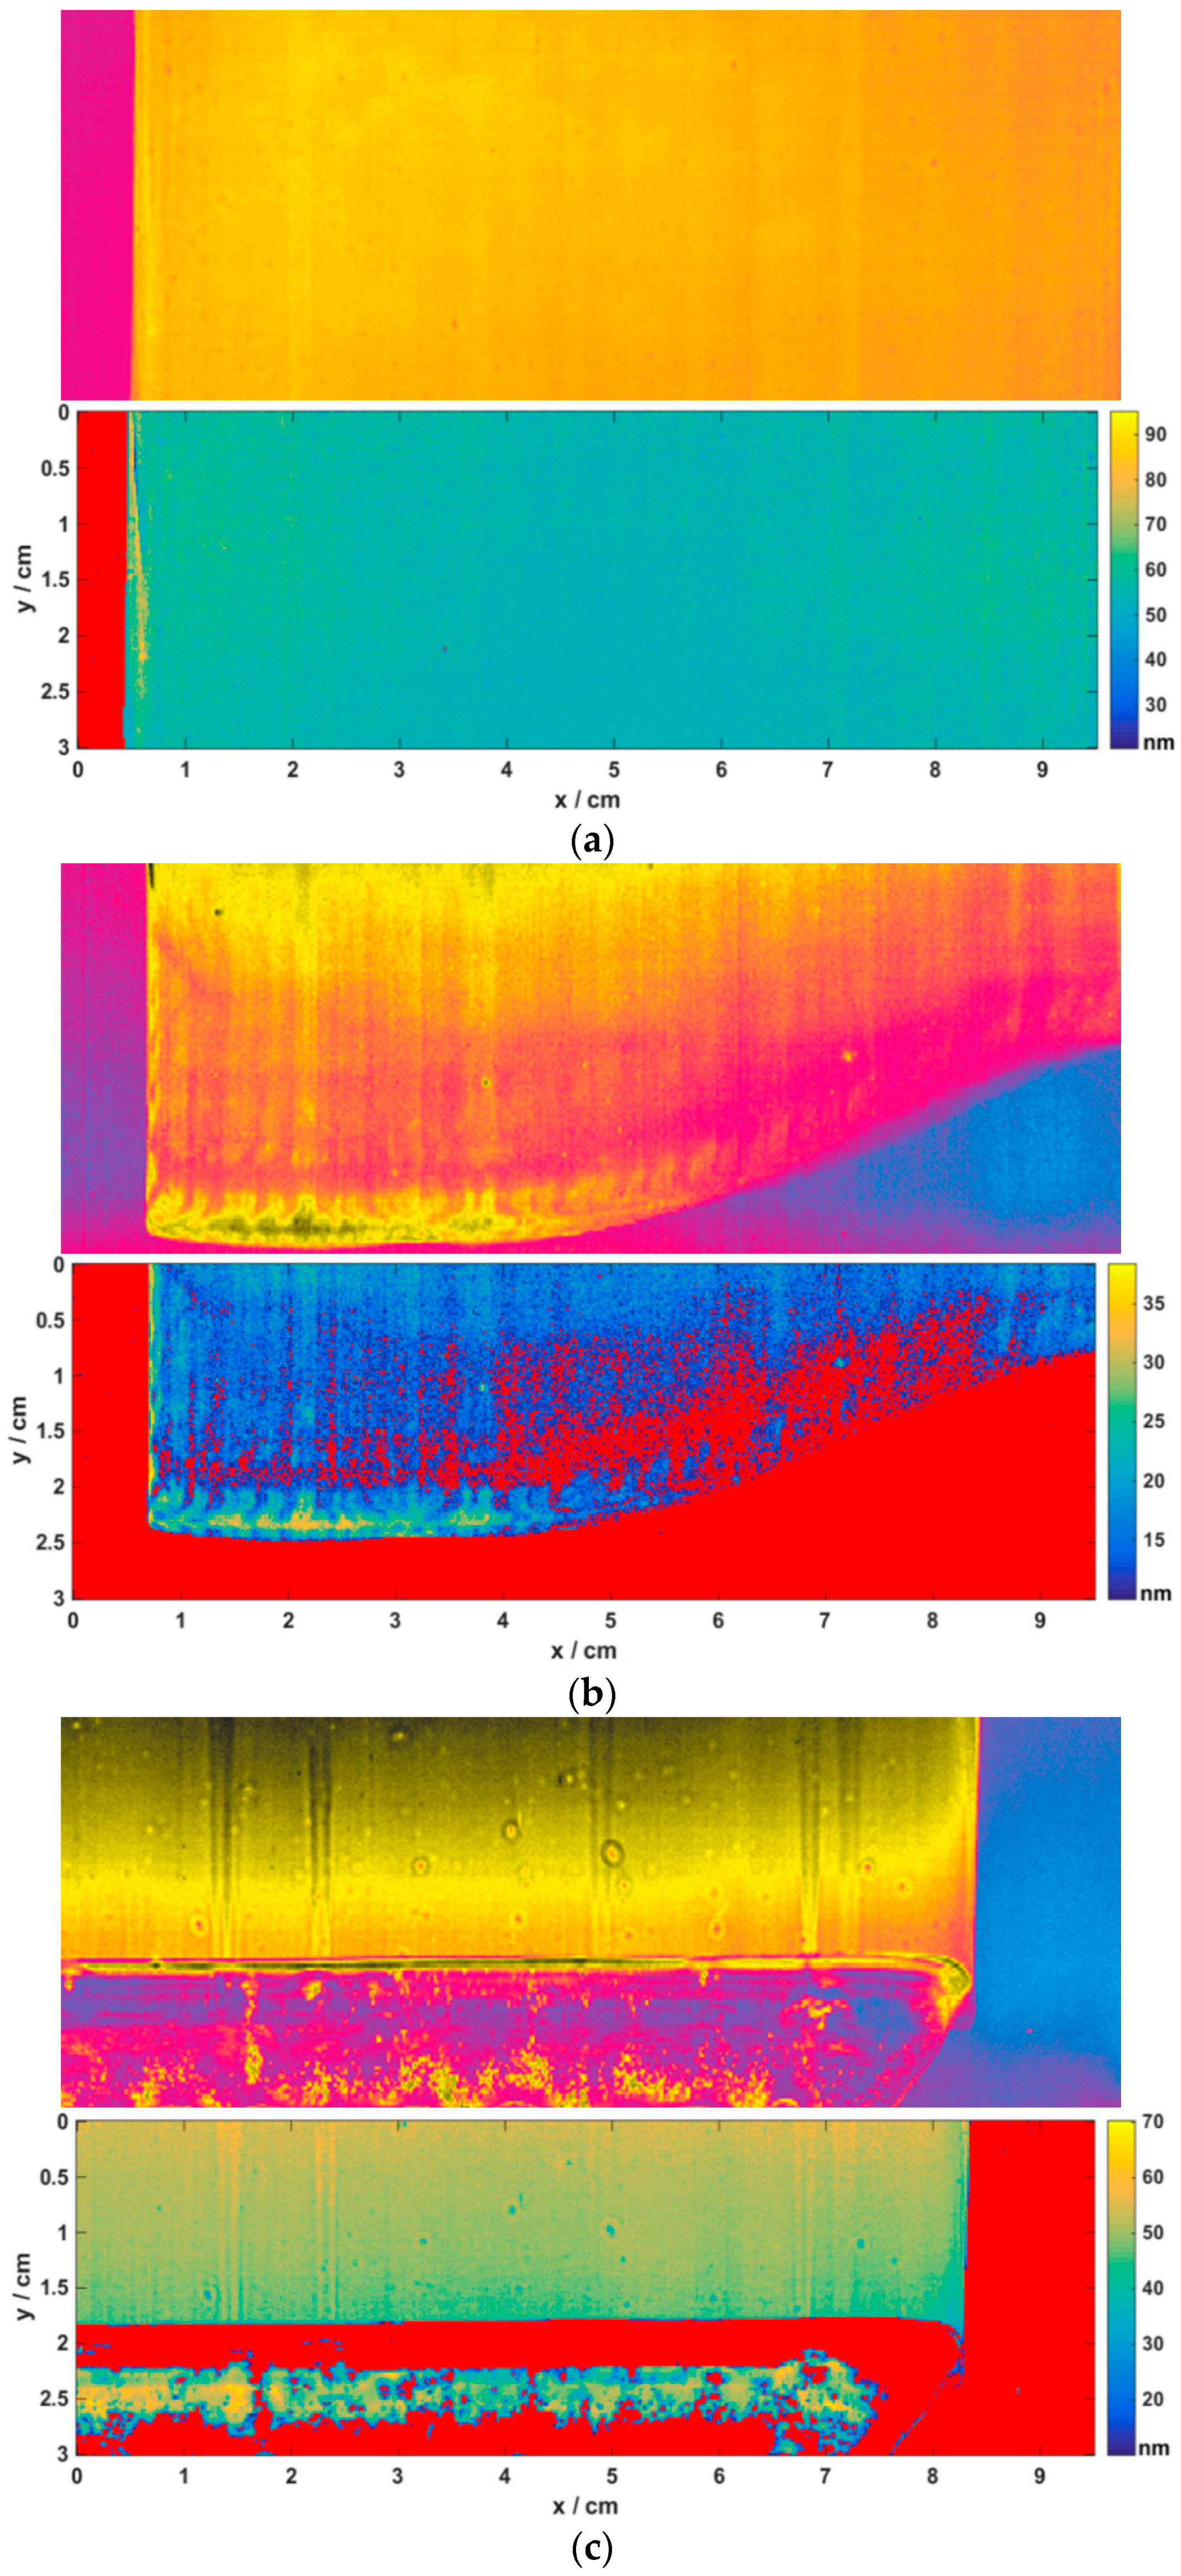
3.2. HSI of Al2O3 Coated Stainless-Steel Foils

The measurement setup used for the experiments is shown in Figure 3.
In total, 208 samples with an area of approx. 9.5 cm × 3 cm (~28 cm2) were measured. Twelve samples were chosen as references and analyzed using spectroscopic ellipsometry, two reference samples are uncoated and the remaining samples do not show any defects and appear to be uniformly coated. The further samples were selected to cover the whole range of possible Al2O3 layer thickness produced by the slot-die coating system.
To analyze the ellipsometric measurements, an optical model for the samples was developed, consisting of the substrate layer and one Cauchy-dispersion layer. The optical properties (n and k) of the substrate were estimated from the measurements of the substrate reference samples. The Cauchy parameters (A-Cn/k) were calculated, considering all measurements of the coated reference samples. Therefore, only one set of Cauchy parameters was obtained. The layer thickness was calculated for every coated reference sample independently. Table 2 shows the results of the spectroscopic ellipsometry of the Al2O3 layer. The obtained Cauchy parameters are in the range of previously reported values [8].
The thickness range of the analyzed samples is between 52.4 nm and 66.2 nm. Despite this thickness difference seeming to be relatively small, empirical observation has shown that the film thickness has a significant effect on the quality of the produced VACNT. The optimal Al2O3 layer thickness was identified to be approx. 54 nm in previous experiments [10].

3.2.1. Multivariate Data Analysis

Multivariate data analysis was used to build prediction models for the calculation of Al2O3 layer thickness based on the hyperspectral measurements. The workflow of the data analysis is shown in Figure 4 and is describe in detail in the following section.
To build the PLS and PCR models for the estimation of the Al2O3 layer thickness, on every reference sample a Region Of Interest (ROI) was defined. This ROI was located in the middle of the sample with an area of approx. 2 cm × 1 cm containing 4000 spectra, which were averaged to obtain one spectra per reference sample. These mean spectra were used as X matrix to build the prediction models. The Al2O3 layer thickness obtained by spectroscopic ellipsometry was used as Y values. The best received models are shown in Table 3.
It is visible that both models are nearly equally good with R2CV of 0.979 and RMSECV of 3.6 for PLS and R2CV of 0.978 and RMSECV of 3.7 for PCR, respectively. In addition, both models used four latent variables for the prediction. Because of the slightly better performance, PLS was chosen for the further calculations.
To get the film thickness maps of the test samples, the dot product for all spectra in the hypercube of the test samples and the regression coefficients of the PLS model are calculated. Areas with a layer thickness below 5 nm threshold are marked as substrate. Some results are shown in Figure 5.
Partially, the test samples show uncoated areas or large coating defects. To avoid an individual evaluation of every sample, certain quality parameters must be defined—especially for a possible automated inline application. In the following, the calculation of the quality control parameters is explained.

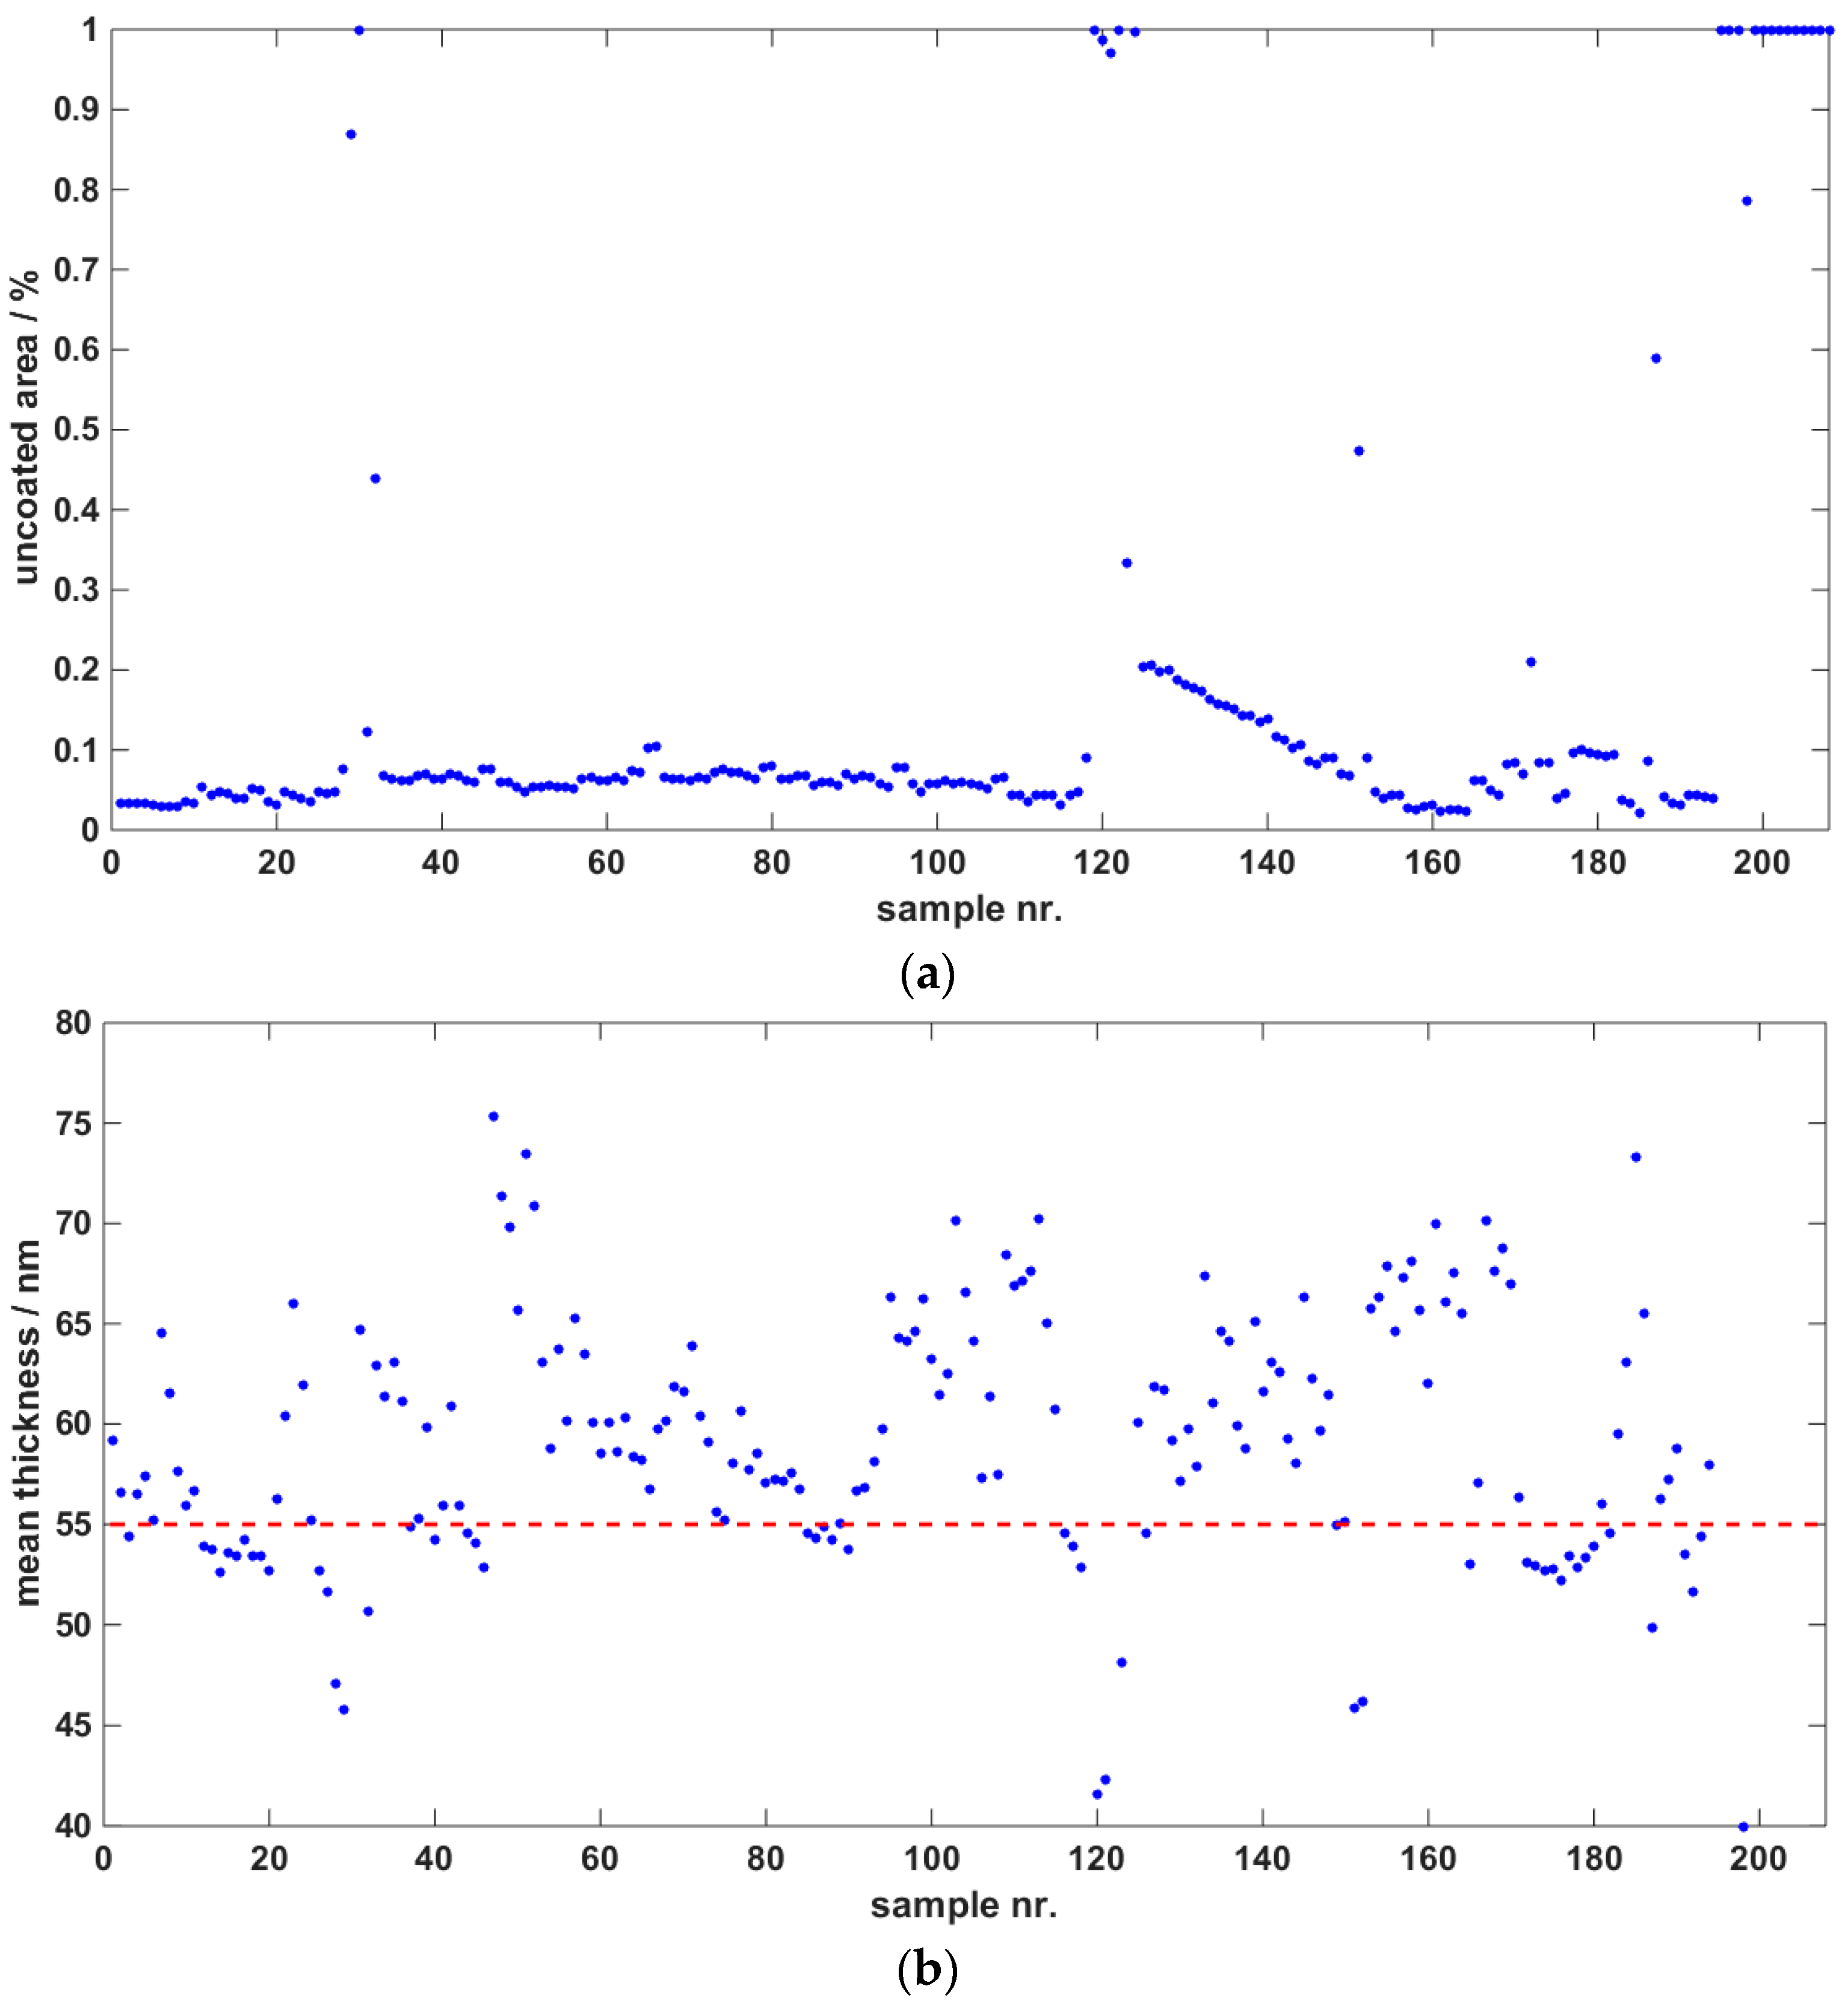
3.2.2. Quality Control Parameter

According to the requirements of the slot-die coating process, the mean Al2O3 layer thickness and the percentage of uncoated area were taken into account for quality control parameters. Further possible parameters could be also the variance of the layer thickness (control of uniformity of the Al2O3 layer) or the number of small coating defects. The two selected control parameters were calculated for all 208 samples. Figure 6a shows the percentage of the uncoated sample area. It is remarkable that the uncoated region is mostly up to 10% of the samples area. This is caused by the limited width of the slot-die coating head. Some samples show significantly higher percentages of uncoated area, especially samples 29–32, 119–124, and 195–208 (Table S1, Supplementary Materials). These samples are not properly coated, because the coating was stopped to fix errors during the process, the sample shown in Figure 5b,c illustrates this issue. Furthermore, starting at sample 125, a slow decrease of the uncoated area is observed. This is caused by a displacement of the steel foil during the coating process and further slow moving into the normal position.
In Figure 6b the calculated mean thickness of the Al2O3 layer is shown. For some samples no mean layer thickness can be achieved (e.g. samples 195–208), because they are completely uncoated (see Table S1, Supplementary Materials). The red dotted line indicates the desired layer thickness of the Al2O3. Despite the coating conditions were kept constant during the whole process, the mean layer thickness is varying very rapidly. This is partly due to the stops of the coating process but also indicates that further parameters with influences on the layer thickness and are not yet considered.

4. Conclusions and Outlook

Within this contribution a hyperspectral imaging solution for the quality control of thin films is presented. Technical enhancements of the lighting enable this promising spectroscopic technique for a 100% imaging and quality control. The developed integration tube shows a homogeneity of more than 95% for the full exit slit width (30 cm). Furthermore, this solution is well suited for applications in the visible and near infrared spectral range (more than 98% reflectance from 400 to 2500 nm) and is cost-effective in contrast to standard integration spheres.
On the example of a continuously slot-die coating process the method was applied as an offline monitoring system. Using HSI in combination with spectroscopic ellipsometry and PLS, it was possible to obtain full Al2O3 thickness maps of the investigated sample areas. Quality control parameters like uncoated area percentage and mean layer thickness allows a fast data evaluation and enables the HSI for usage as an inline monitoring system.
In general, the evaluated slot-die coating process runs clearly non-uniform. In combination with process know-how it is possible to detect process errors like coating stops and displacement of the steel foil. The observed strong variations in the mean layer thickness of the samples indicate the need of further research. The proposed monitoring method could help to improve the process, supplying inline quality parameters during the process optimization.
In the following work, the HSI setup will be integrated in the slot-die coater to run tests under real-life conditions. Additionally the method will be applied to further layer systems and coating technologies.

Supplementary Materials

The following are available online at https://www.mdpi.com/2313-433X/2/2/12/s1, Table S1: Calculated mean layer thickness and percentage of uncoated area for all analyzed samples.

Acknowledgments

This work has received funding from the European Union’s Seventh Program for research, technological development, and demonstration under grant agreement number 309530 (Process Line Implementation for Applied Surface Nanotechnologies; PLIANT project).

Author Contributions

Florian Gruber conducted the research presented in this study and wrote the paper. Philipp Wollmann, Wulf Grählert, and Stefan Kaskel contributed to the development of the overall research design, provided guidance along the way, and aided in the writing of the paper. Benjamin Schumm prepared the Al2O3 samples.

Conflicts of Interest

The authors declare no conflict of interest.

References

  1. Liu, J.J.; Bharati, M.H.; Dunn, K.G.; MacGregor, J.F. Automatic masking in multivariate image analysis using support vector machines. Chemom. Intell. Lab. Syst. 2005, 79, 42–54. [Google Scholar] [CrossRef]
  2. Liu, J.J.; MacGregor, J.F.; Duchesne, C.; Bartolacci, G. Flotation froth monitoring using multiresolutional multivariate image analysis. Miner. Eng. 2005, 18, 65–76. [Google Scholar] [CrossRef]
  3. Solomon, J.; Rock, B. Imaging spectrometry for earth remote sensing. Science 1985, 228, 1147–1152. [Google Scholar]
  4. Uno, Y.; Prasher, S.; Lacroix, R.; Goel, P.; Karimi, Y.; Viau, A.; Patel, R. Artificial neural networks to predict corn yield from Compact Airborne Spectrographic Imager data. Comput. Electron. Agric. 2005, 47, 149–161. [Google Scholar] [CrossRef]
  5. Li, Q.; He, X.; Wang, Y.; Liu, H.; Xu, D.; Guo, F. Review of spectral imaging technology in biomedical engineering: Achievements and challenges. J. Biomed. Opt. 2013, 18, 100901. [Google Scholar] [CrossRef] [PubMed]
  6. Gowen, A.; O’Donnell, C.; Cullen, P.; Downey, G.; Frias, J. Hyperspectral imaging—An emerging process analytical tool for food quality and safety control. Trends Food Sci. Tecnol. 2007, 18, 590–598. [Google Scholar] [CrossRef]
  7. Hugger, S.; Fuchs, F.; Jarvis, J.; Yang, Q.K.; Rattunde, M.; Ostendorf, R.; Wagner, J. Quantum Cascade Laser based active hyperspectral imaging for standoff detection of chemicals on surfaces. Proc. SPIE 2016, 9755. [Google Scholar] [CrossRef]
  8. Lohner, T.; Serenyi, M.; Petrik, P. Characterization of sputtered aluminum oxide films using spectroscopic ellipsometry. Int. J. New. Hor. Phys. 2015, 2, 1–4. [Google Scholar]
  9. Grählert, W.; Wollmann, P.; Gruber, F. Anordnung zur Bestimmung von Eigenschaften und/oder Parametern einer Probe und/oder mindestens einer auf oder an einer Oberfläche einer Probe ausgebildeten Schicht. Patent WO2015197555 A1, DE Patent DE 10 2014 009 372 A1, 23 June 2014. [Google Scholar]
  10. Piwko, M.; Althues, H.; Schumm, B.; Kaskel, S. Confocal microscopy for process monitoring and wide-area height determination of vertically-aligned carbon nanotube forests. Coatings 2015, 5, 477–487. [Google Scholar] [CrossRef]
  11. Fujiwara, H. Spectroscopic Ellipsometry: Principles and Applications; John Wiley & Sons: New York, NY, USA, 2007. [Google Scholar]
  12. Kessler, W. Multivariate Datenanalyse: Für die Pharma, Bio-und Prozessanalytik; John Wiley & Sons: New York, NY, USA, 2007. [Google Scholar]
Figure 1. Principle setup of the designed integration tube.
Jimaging 02 00012 g001
Figure 2. One stainless steel plate (sample size DIN A4) with Al2O3 thin film and different illumination; (left) direct lighting; (right) integration tube (both images shown at 734 nm).
Jimaging 02 00012 g002
Figure 3. Hyperspectral measurement setup; (a): HSI system; (b): integration tube for sample illumination; (c): precision stage for sample movement.
Jimaging 02 00012 g003
Figure 4. Workflow for the calculation of the thickness of the Al2O3 layer based on HSI and spectroscopic ellipsometry.
Jimaging 02 00012 g004
Figure 5. Different samples of the test data set, samples with (a): nearly no defects and homogeneous layer thickness; (b): thin layer thickness and uncoated areas (c) coating defects and inhomogeneous layer thickness. The original data at 750 nm as well as the color-coded thickness map is shown (uncoated areas are marked red).
Jimaging 02 00012 g005
Figure 6. Calculated control parameters; (a): uncoated area per sample; (b): mean Al2O3 layer thickness obtained by PLS, the red line indicates the estimated layer thickness.
Jimaging 02 00012 g006
Table 1. Measured intensity levels at the exit slit of the integration tube (values in 103 lux).
Exit Slit Position (Left to Right)2 cm8 cm15 cm22 cm28 cm
Power Supply LevelIntensity Levels
3 V0.30.30.30.30.3
8 V7.47.47.27.27.5
12 V29.128.128.028.029.0
Table 2. Results of spectroscopic ellipsometry for the Al2O3 layers.
ParameterThickness (nm)AnBnCnAkBkCk
--52.4–66.21.58270.0191−0.00130.13590.3828400
Table 3. PLS and PCR model for the prediction of Al2O3 layer thickness.
ModelNo. of Latent VariablesR2CRMSECR2CVRMSECV
PLS40.9961.50.9793.6
PCR40.9922.00.9783.7

