
Effects of Cell Design Parameters on Zinc-Air Battery Performance

Department of Energy Engineering, School of Science and Engineering, National United University, Miaoli 360302, Taiwan
*
Author to whom correspondence should be addressed.
Batteries 2022, 8(8), 92; https://doi.org/10.3390/batteries8080092
Submission received: 7 November 2021
/
Revised: 14 March 2022
/
Accepted: 19 April 2022
/
Published: 15 August 2022
Abstract
:Zn-air batteries have attracted considerable attention from researchers owing to their high theoretical energy density and the abundance of zinc on Earth. The modification of battery component materials represent a common approach to improve battery performance. The effects of cell design on cell performance are seldom investigated. In this study, we designed four battery structures as follows. Cell 1: close-proximity electrode, Cell 2: equal-area electrode, Cell 3: large zinc electrode, and Cell 4: air channel flow. The effects of four factors: (1) carbon paste, (2) natural and forced air convection, (3) anode/cathode area ratio, and (4) anode–cathode distance were also investigated. Results showed that the addition of carbon paste on the air side of 25BC increased cell power density under forced air convection. Moreover, cell performance also improved by increasing the anode/cathode ratio and by decreasing the anode–cathode distance. These four types of cells were compared based on the oxygen reduction reaction electrode area. Cell 3 displayed the highest power density. In terms of volumetric power density, the proximity cell (Cell 1) exhibited the highest power density among the cells. Therefore, this cell configuration may be suitable for portable applications.
1. Introduction
Metal–air batteries consist of a metal anode, such as Zn, Al, Mg, Na, and Li; a porous carbon cathode; an electrolyte; and a separator. They have been extensively researched due to their high theoretical energy density ranging from 1085 (Zn-air) to 3463 Wh kg−1 (Li-air) [1,2] compared with that of commercial lithium-ion batteries (120–220 Wh kg−1) [3]. Al, Na, and Mg account for 8.13%, 2.83%, and 2.09% of the Earth’s crust, respectively [4]. Therefore, metal–air batteries contain desirable properties for use in large-scale energy storage applications. As illustrated in Figure 1, among metal–air batteries, the highest number of patents filed have been for Zn-air batteries, followed by Li-air, Al-air, Mg-air, Na-air, and K-air batteries. The number of patents filed for secondary metal–air batteries are considerably lower than that for primary metal–air batteries. The Zn-air battery exhibits the highest level of technological readiness among metal–air batteries.
Zn-air batteries are environmentally friendly and safe and contain a high energy density. Primary Zn-air batteries have been commercialized as button cells and prismatic cells for use in hearing aids and medical devices. Some future development targets for Zn-air batteries include flexible cells for application in wearable electronics [5,6], rechargeable batteries for energy storage [7], and high-energy-density batteries for use in electric vehicles [8,9]. In the near future, microgrids and smart grid facilities will require energy storage systems to offer rapid response and long-term storage periods [10].
1.1. Overview of Zn-Air Batteries
Zn-air primary batteries have been commercialized, and secondary and flexible batteries are being investigated by researchers to address several technical challenges, such as zinc corrosion, zinc dendrite formation, gas bubble generation during charging, inadequate cycle life, and inadequate energy storage efficiency. Several review papers are available in the literature [11,12,13,14,15]. Chakkaravarthy et al. [11] reviewed the general properties of Zn-air batteries in 1981. Air electrodes with dual pores, double skeleton catalysts, or pore formers were mentioned. The cell structures and configurations of primary, mechanically rechargeable, and secondary Zn-air batteries were also briefly described. Caramia and Bozzini reviewed Zn-air batteries from a materials science perspective [12]. Various porous forms of zinc, such as powders, pellets, or fibers of different sizes, were applied as anode materials instead of solid sheets to increase the anode surface area and battery output current. Zinc fibers have better electric conductivity than zinc powders at a given porosity. Li and Dai published a similar comprehensive review on the key components of Zn-air batteries [13]. Separators and bifunctional catalysts for the cathode were discussed in their paper. For rechargeable Zn-air batteries, the authors proposed several oxides, such as Co3O4 and MnOx, and a core-corona structure as candidates for use in bifunctional catalysts. In the three-electrode configuration, the electrode for the oxygen evolution reaction (OER) during charging differed from the electrode for the oxygen reduction reaction (ORR) during discharging. Zn-air batteries with a three-electrode configuration possess considerably better charge/discharge efficiency and cycle life than those with a two-electrode configuration. Mainar et al. [14] extensively reviewed candidate electrolytes for use in rechargeable Zn-air batteries, including acidic, alkaline, and neutral electrolytes and solid polymer, gel polymer, ionic liquid, and deep eutectic solvents. They suggested that alkaline electrolytes with additives were needed to extend the cycle life of the zinc anode. Carbonate and fluoride ions in KOH saturated with ZnO can reduce zinc dissolution and polarize the hydrogen evolution reaction. Han et al. [15] summarized the research progress on vanadium–air, Zn-air, and lithium–air secondary flow batteries. The power densities (mW cm−2) of these batteries were in the order of 234 ± 20 for Zn-air, 30 ± 11 for vanadium–air, and 4.1 ± 3.6 for lithium metal–air batteries. The energy efficiencies (%) were 60 ± 11 for Zn-air and 32 ± 14 for vanadium–air batteries. The high power density and energy efficiency numbers indicate that secondary Zn-air flow batteries are more technically advanced than other types of secondary metal–air batteries.
1.2. Electrolyte Additives
The focuses of research on secondary Zn-air batteries center on extending the life cycle and improving the performance of bifunctional electrodes. Electrolyte additives, such as ethanol [16] and ZnO + KF + K2CO3 [17], have been used to avoid dendritic zinc deposition and reduce the rate of corrosion.
1.3. Bifunctional Catalyst for Air Electrode
Air electrodes with bifunctional capabilities have higher energy density than air electrodes with a three-electrode configuration. Novel catalysts and their substrates have been proposed for Zn-air batteries. For example, α-MnO2 was deposited on various conductive carbon substrates to improve its overall activity [18]. The hybrid nanocomposite La2O3/Co3O4/MnO2-CNT was prepared by following a facile hydrothermal self-assembly process [19]. This secondary static electrolyte Zn-air battery exhibited an energy efficiency of 51% in the 21st cycle, and as a primary Zn-air battery, its energy density measured 970 Wh kg−1. High battery capacity was achieved by depositing ultrathin CeO2 nanoflakes on a three-dimensional graphene network support [20] located on the air electrode. Metal capacities of 613, 839, and 21,166 mAh gc−1 were achieved for the Zn-air, Al-air, and Li-oxygen batteries, respectively. High-surface-area α-MnO2 was prepared from Mn2O3 by means of acid digestion [21]. The catalyst layer of the air electrode was prepared from α-MnO2/carbon nano-fiber/polytetrafluoroethylene (PTFE). The air efficiency of this electrode (53 ± 6%, ratio of ORR voltage to OER voltage) was found to be contingent on surface water content (dry air electrode) than on catalyst morphology. High-surface-area (108 m2 g−1) mesoporous MnCo2O4 was prepared using the hard template method and mesoporous silica as an inorganic template [22]. A long cycle life of 250 cycles with a capacity of 600 mAh gzn−1 was achieved. This material was found to be more active than NiFe2O4 and CoFe2O4 according to polarization measurements of air electrodes (containing catalyst, graphitic carbon, and PTFE).
1.4. Surface Morphology of Air Electrode
An alternative approach is to alter the electrode surface morphology. A novel approach to improving air electrodes involves growing needle-like or dendritic deposits on the surface [23]. Due to surface tension, the gas bubbles generated during charging are able to easily escape from the electrode surface, thus reducing its internal resistance. Good ORR and OER activity were obtained by depositing ternary alloy PtRuCu on the surface of Cu nanoneedles grown on a Cu form [24]. A power density of 169 mW cm−2 and capacity of 783 mAh gzn−1 were achieved using this electrode.
Power density represents an important factor of Zn-air batteries for mobile and transportation applications. Various factors that affect battery output power density have been examined in the literature [20,25,26,27,28,29,30,31,32,33,34,35,36,37,38,39,40,41,42,43,44,45], as described in the following text and illustrated in Figure 2.
1.5. Effects of Air Electrode Catalyst on Cell Power Density
Various types of catalysts on air electrodes significantly influence the output power density of the resulting cell. For example, Xu et al. [19] used a hybrid La2O3-Co3O4-MnO2 nanocomposite as a catalyst on an air electrode and reported an increase in battery power density from 118 mW cm−2 (MnO2 catalyst) to 295 mW cm−2 (hybrid). Alternative electrode surface morphologies to increase power density have also been studied, such as a needle-like surface [24] by Wang et al. and a flower-like catalyst [25] by Li et al. The effects of substrates have been investigated. Low voltage loss between the OER and ORR of an air electrode (0.57 V) was achieved by Xu et al. [26] through the deposition of Ni/Co oxide onto a large-area, conductive Ni-foam instead of a carbon-based material, such as carbon fiber or glassy carbon. Han et al. [27] studied catalysts such as NiSe2/CC, Pt/C+RuO2, N-NiSe2/CC and reported an increase in output power density from 35 to 112 mW cm−2.
1.6. Effects of Zinc Type on Cell Power Density
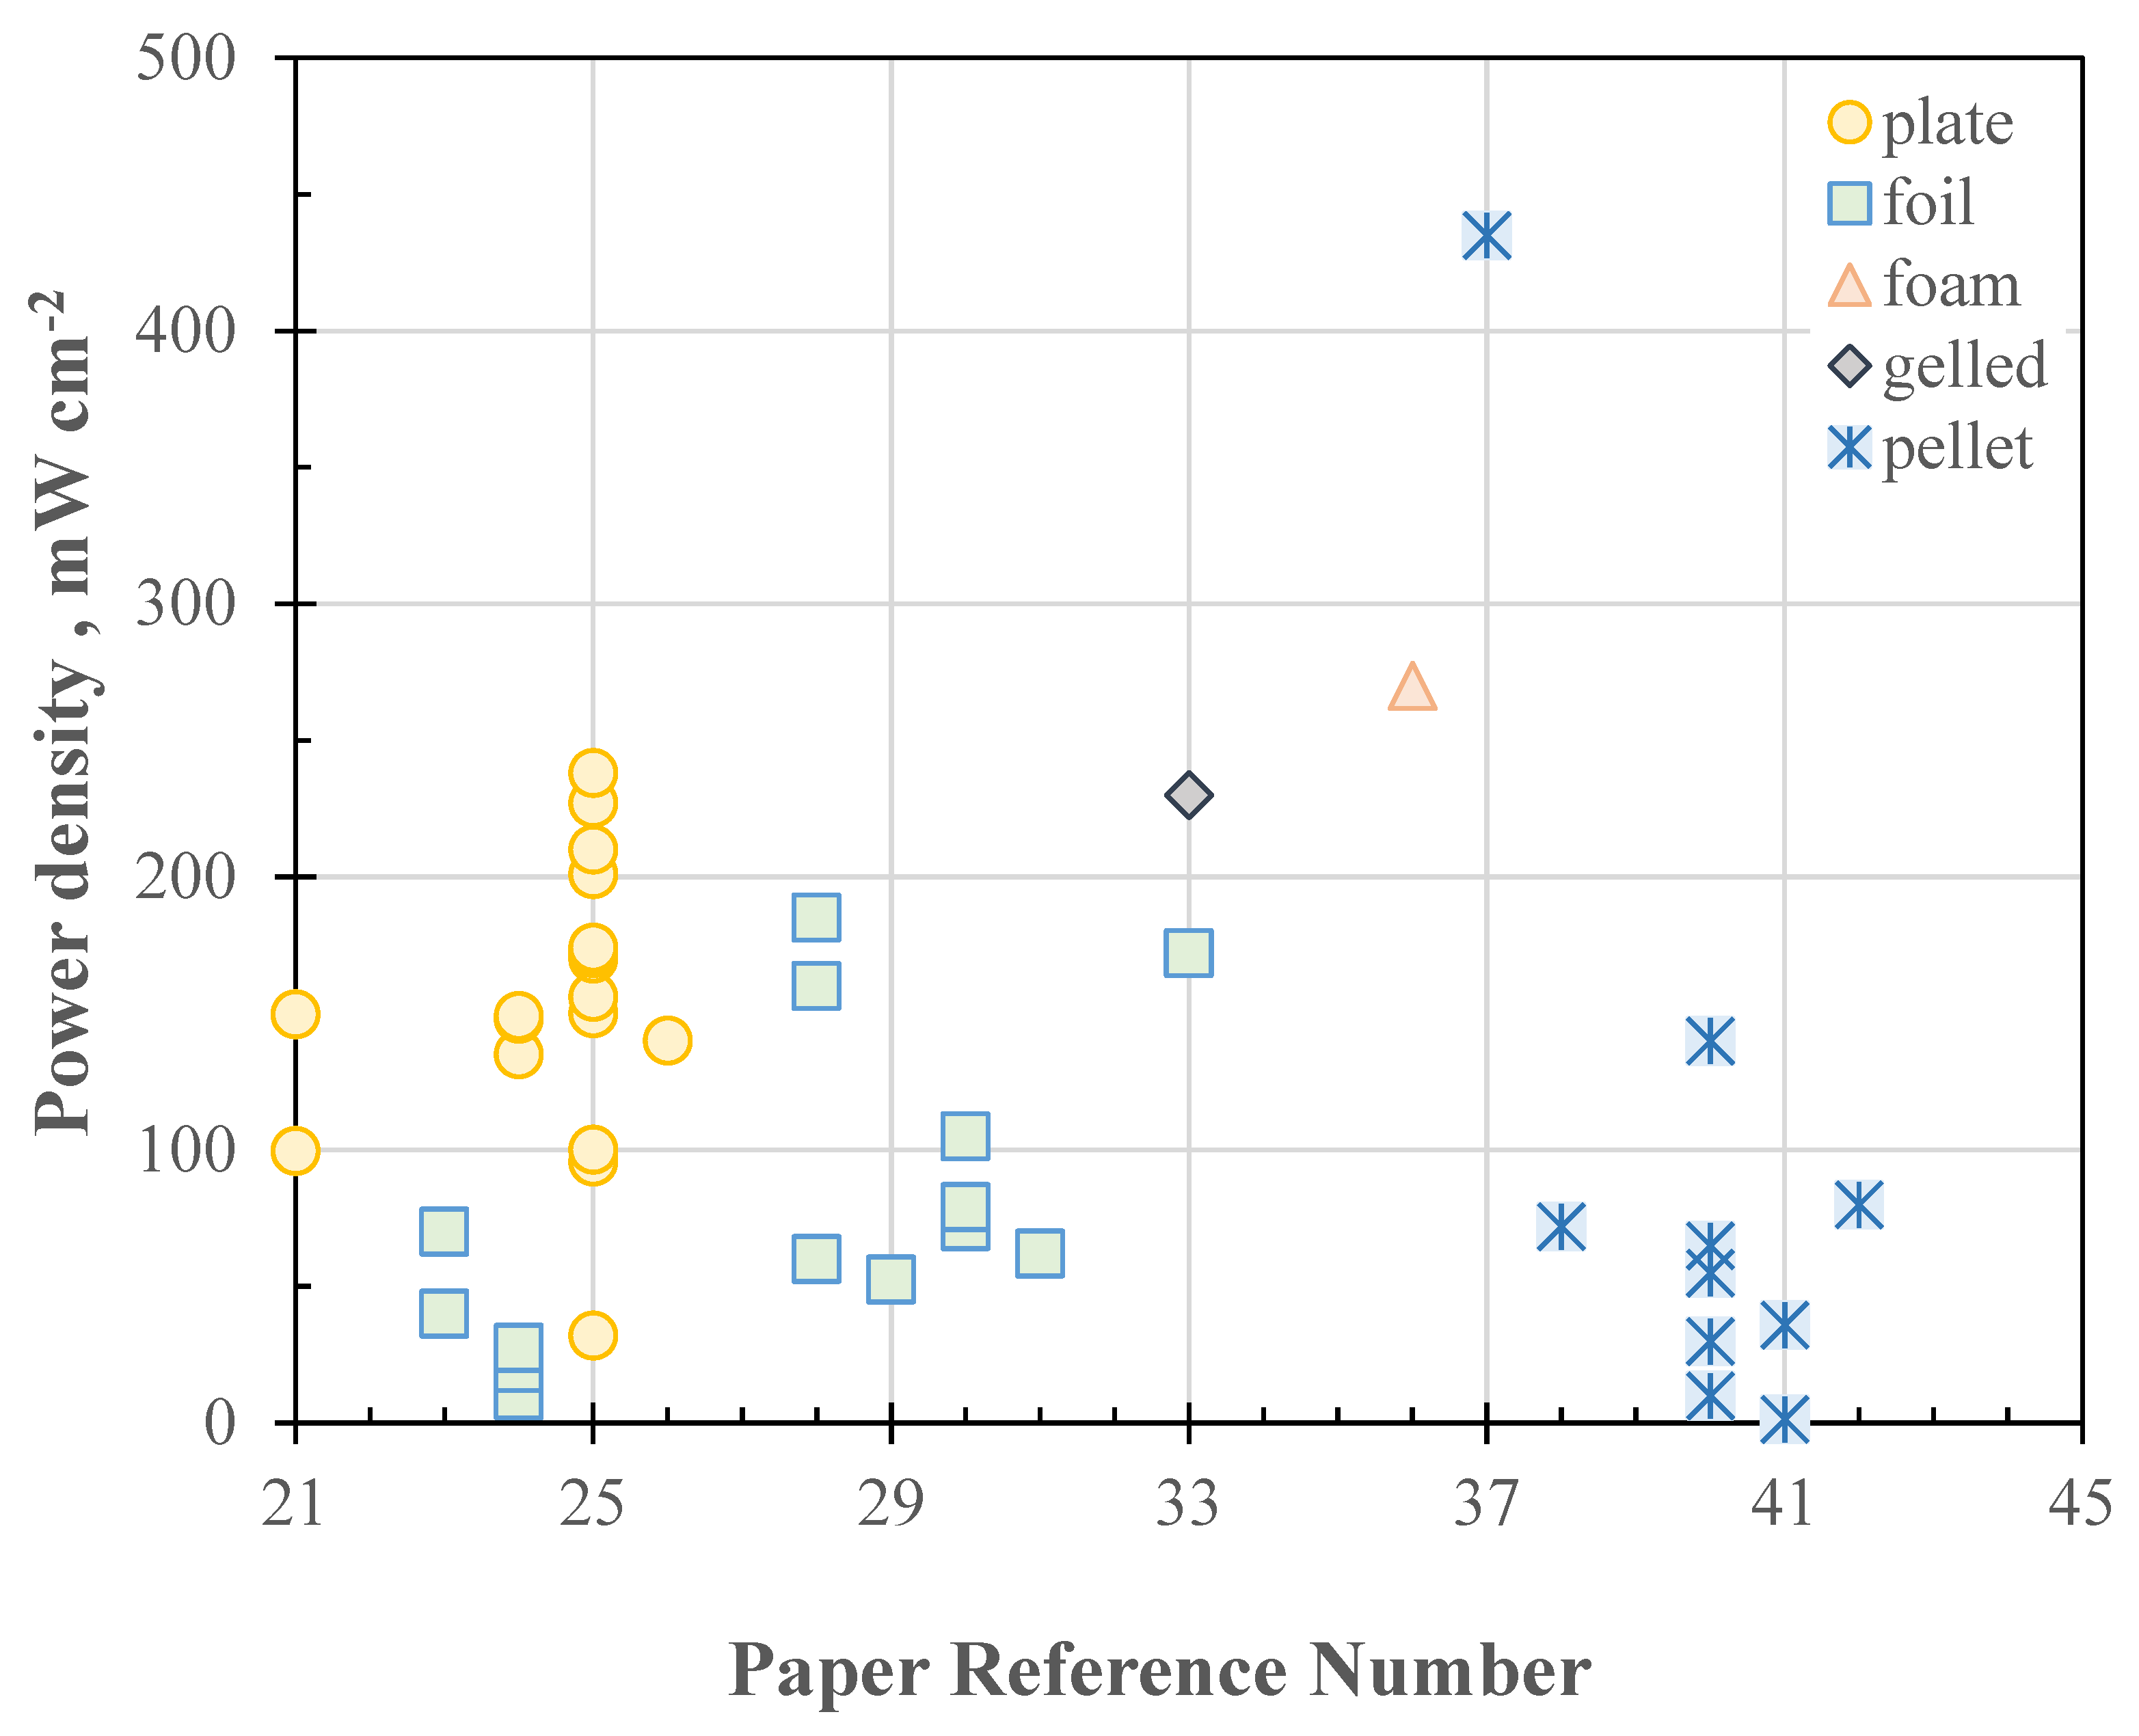
Five types of zinc electrodes have been reported in the literature, namely plate [19,24,25,28,29,30], foil [26,27,31,32,33,34,35,36], gel [37,38], foam [39], and pellet (including powder, slurry, and granules) [41,42,43,44,45]. The power density of Zn-air batteries ranges from 10 to 435 mW cm−2 depending on the type of zinc electrode used. The power density of batteries with zinc plate electrodes ranges from 100 to 250 mW cm−2. The power densities of batteries with zinc foil and zinc gel electrodes range from 10 to 180 mW cm−2 and 10 to 100 mW cm−2, respectively. The power densities of batteries using different types of zinc pellets differ considerably from each other resulting largely from differences in collector design [41,42,43,44,45]. The power densities of batteries with zinc slurry and granules differ considerably depending on the type of slurry and granule. In addition, the power density of Zn-air batteries varies considerably depending on many other factors, such as catalysis, membrane, electrode, electrolyte additives, and cell design parameters.
1.7. Effect of Cell Configuration on Power Density
The approaches followed in the aforementioned papers had the aim of improving battery performance by introducing new materials or by modifying the surface of electrodes. However, battery power density is affected by cell configuration or structure, in addition to the type of zinc used and the catalyst on the air electrode. The power density of Zn-air batteries can be increased from 135 to 170 mW cm−2 by reducing the distance between the anode and cathode from 2.5 to 1 cm [28]. Park et al. [31] reduced the inter-electrode distance from 4 to 1 cm, and consequently, the power density increased from 60 to 185 mW cm−2. Jiao et al. [28] increased the flow rate on the air side from 20 to 100 mL min−1. Consequently, the power density increased from 150 to 227 mW cm−2. For a similar cell configuration and catalyst on an air electrode, the cell with a liquid electrolyte exhibited a higher power density than the cell with a gel-type electrolyte [19,27].
1.8. Motivation and Scope of Present Study
In this study, we aimed to identify the effects of cell design parameters on power density. To this end, we studied the following design parameters: anode–cathode distance, ratio of node/cathode area, fluid dynamics on the air-side electrode, and carbon content in the catalyst layer. We tested four types of cells.
- Cell 1 (proximity cell): electrodes are in close proximity (less than 1 mm),
- Cell 2 (aqueous electrolyte cell): equal-area electrodes separated with aqueous electrolyte,
- Cell 3 (cathode limited cell): large zinc electrode area and small air electrode area,
- Cell 4 (air flow channel cell): channel flow on the air side.
To ensure a fair comparison and to control for other factors affecting cell power density, a commercially available carbon paper (25BC) was employed as the air electrode without any treatment. A zinc plate was chosen as the zinc electrode. An aqueous 6 M KOH solution was selected as an electrolyte. The aforementioned materials were used in all tests without modification, unless mentioned otherwise.
Computer modeling was used to supplement the experimental investigations. Models of Cells 1, 2, and 3 were constructed, and the current distribution within the cells and cell voltage–current curves (E-I curve) were calculated. However, the modeling results were employed only as qualitative references since many of the parameter values used in the model calculations were best-fitted values.
This paper is structured as follows. In Section 1, the configurations of individual cells under study and their unique characteristics are described. The experimental conditions and testing equipment and setup are also mentioned. In Section 2, the governing equations and parameters used in the COMSOL computer model are presented. COMSOL is a commercial software that can simulated electrochemical phenomena. In Section 3, the results and discussion of each cell are reported, in addition to volumetric power density, which was calculated based on cell volume. The performance of each type of cell was calculated and compared with the area power density of the conventional cell. This calculation was based on the active electrode area. Finally, our conclusions are presented in Section 4.
2. Experimental and Computer Modeling
A total of four cells were built and tested, namely a proximity cell (Cell 1), aqueous electrolyte cell (Cell 2), cathode limited cell (Cell 3), and air flow channel cell (Cell 4). Each cell was employed for a particular purpose, which are described as follows. The cell voltages of all the tested cells were controlled using a potentiostat (AutoLab PGSTA302N) with a two-electrode configuration. The working electrode was connected to a sensor, and the reference electrode was connected to the counter electrode. The cell voltage was scanned at a rate of 2 mV s−1 from the open cell voltage to 0.8, 0.4, or 0.2 V depending on the cell under test. In all experiments, the electrolyte was composed of 6.0 M aqueous KOH, and the anode was a zinc plate (Summit-Tech Company, 1 mm thick) polished with sandpaper (SHARK BRAND, grades #100 and #1000) before each test.
A separate experiment was conducted to test the effects of carbon layer thickness on the output power density of the cells. The catalyst layer comprised carbon paper coated with an additional carbon layer. The preparation and coating procedure of this carbon layer is detailed in Section 2.6.
The current density at the cell voltage of 0.2 V Imax and the maximum power density Pmax were used as performance indices. The Imax and Pmax calculations were based on the active cathode area. An additional maximum power density P’max was calculated using electrolyte volume.
Table 1 summarizes the experiments conducted using each cell. The experiments involving each type of cell were repeated at least five times, with a 60 min interval between two repetitions to ensure reproducibility. The symbol ○ in Table 1 indicates that the experiment factor was compared for the same type of cell. For instance, the symbol ○ at the cross section of “Cell 1” and “Modified ORR electrode” means that the performance of Cell 1 with the carbon paper 25BC-based cathode and modified ORR cathode was measured and compared. The effect of the ORR electrode on Cell 1 may not be the same as that on Cells 2 and 3 due to other factors. The symbol △ in Table 1 means that the types of cells were compared with respect to the experimental factor. For example, the symbol △ at the cross section of “Cell 1” and “Anode/cathode distance” implies that the anode/cathode distance was compared for Cells 1, 2, 3, and 4. The ○symbol means the experiment factor was compared in the same type of cell.
2.1. Configuration of Cells under Investigation
In this study, we aimed to evaluate the effects of various cell configurations on cell power density. For a fair comparison, commercial materials were used for both the anode and cathode without any modification, unless otherwise mentioned. The cathode was carbon paper (SGL, 25 BC) backed by a nickel mesh in the cases of Cells 1, 2, and 3; the nickel mesh served as a current collector. In Cell 4, the cathode was carbon paper, and a graphite channel plate was used as the current collector. In total, four types of Zn-air batteries were tested in this study. A zinc plate (1 mm thick) polished with sandpaper was used as the anode.
2.2. Configuration of Cells under Investigation—Cell 1
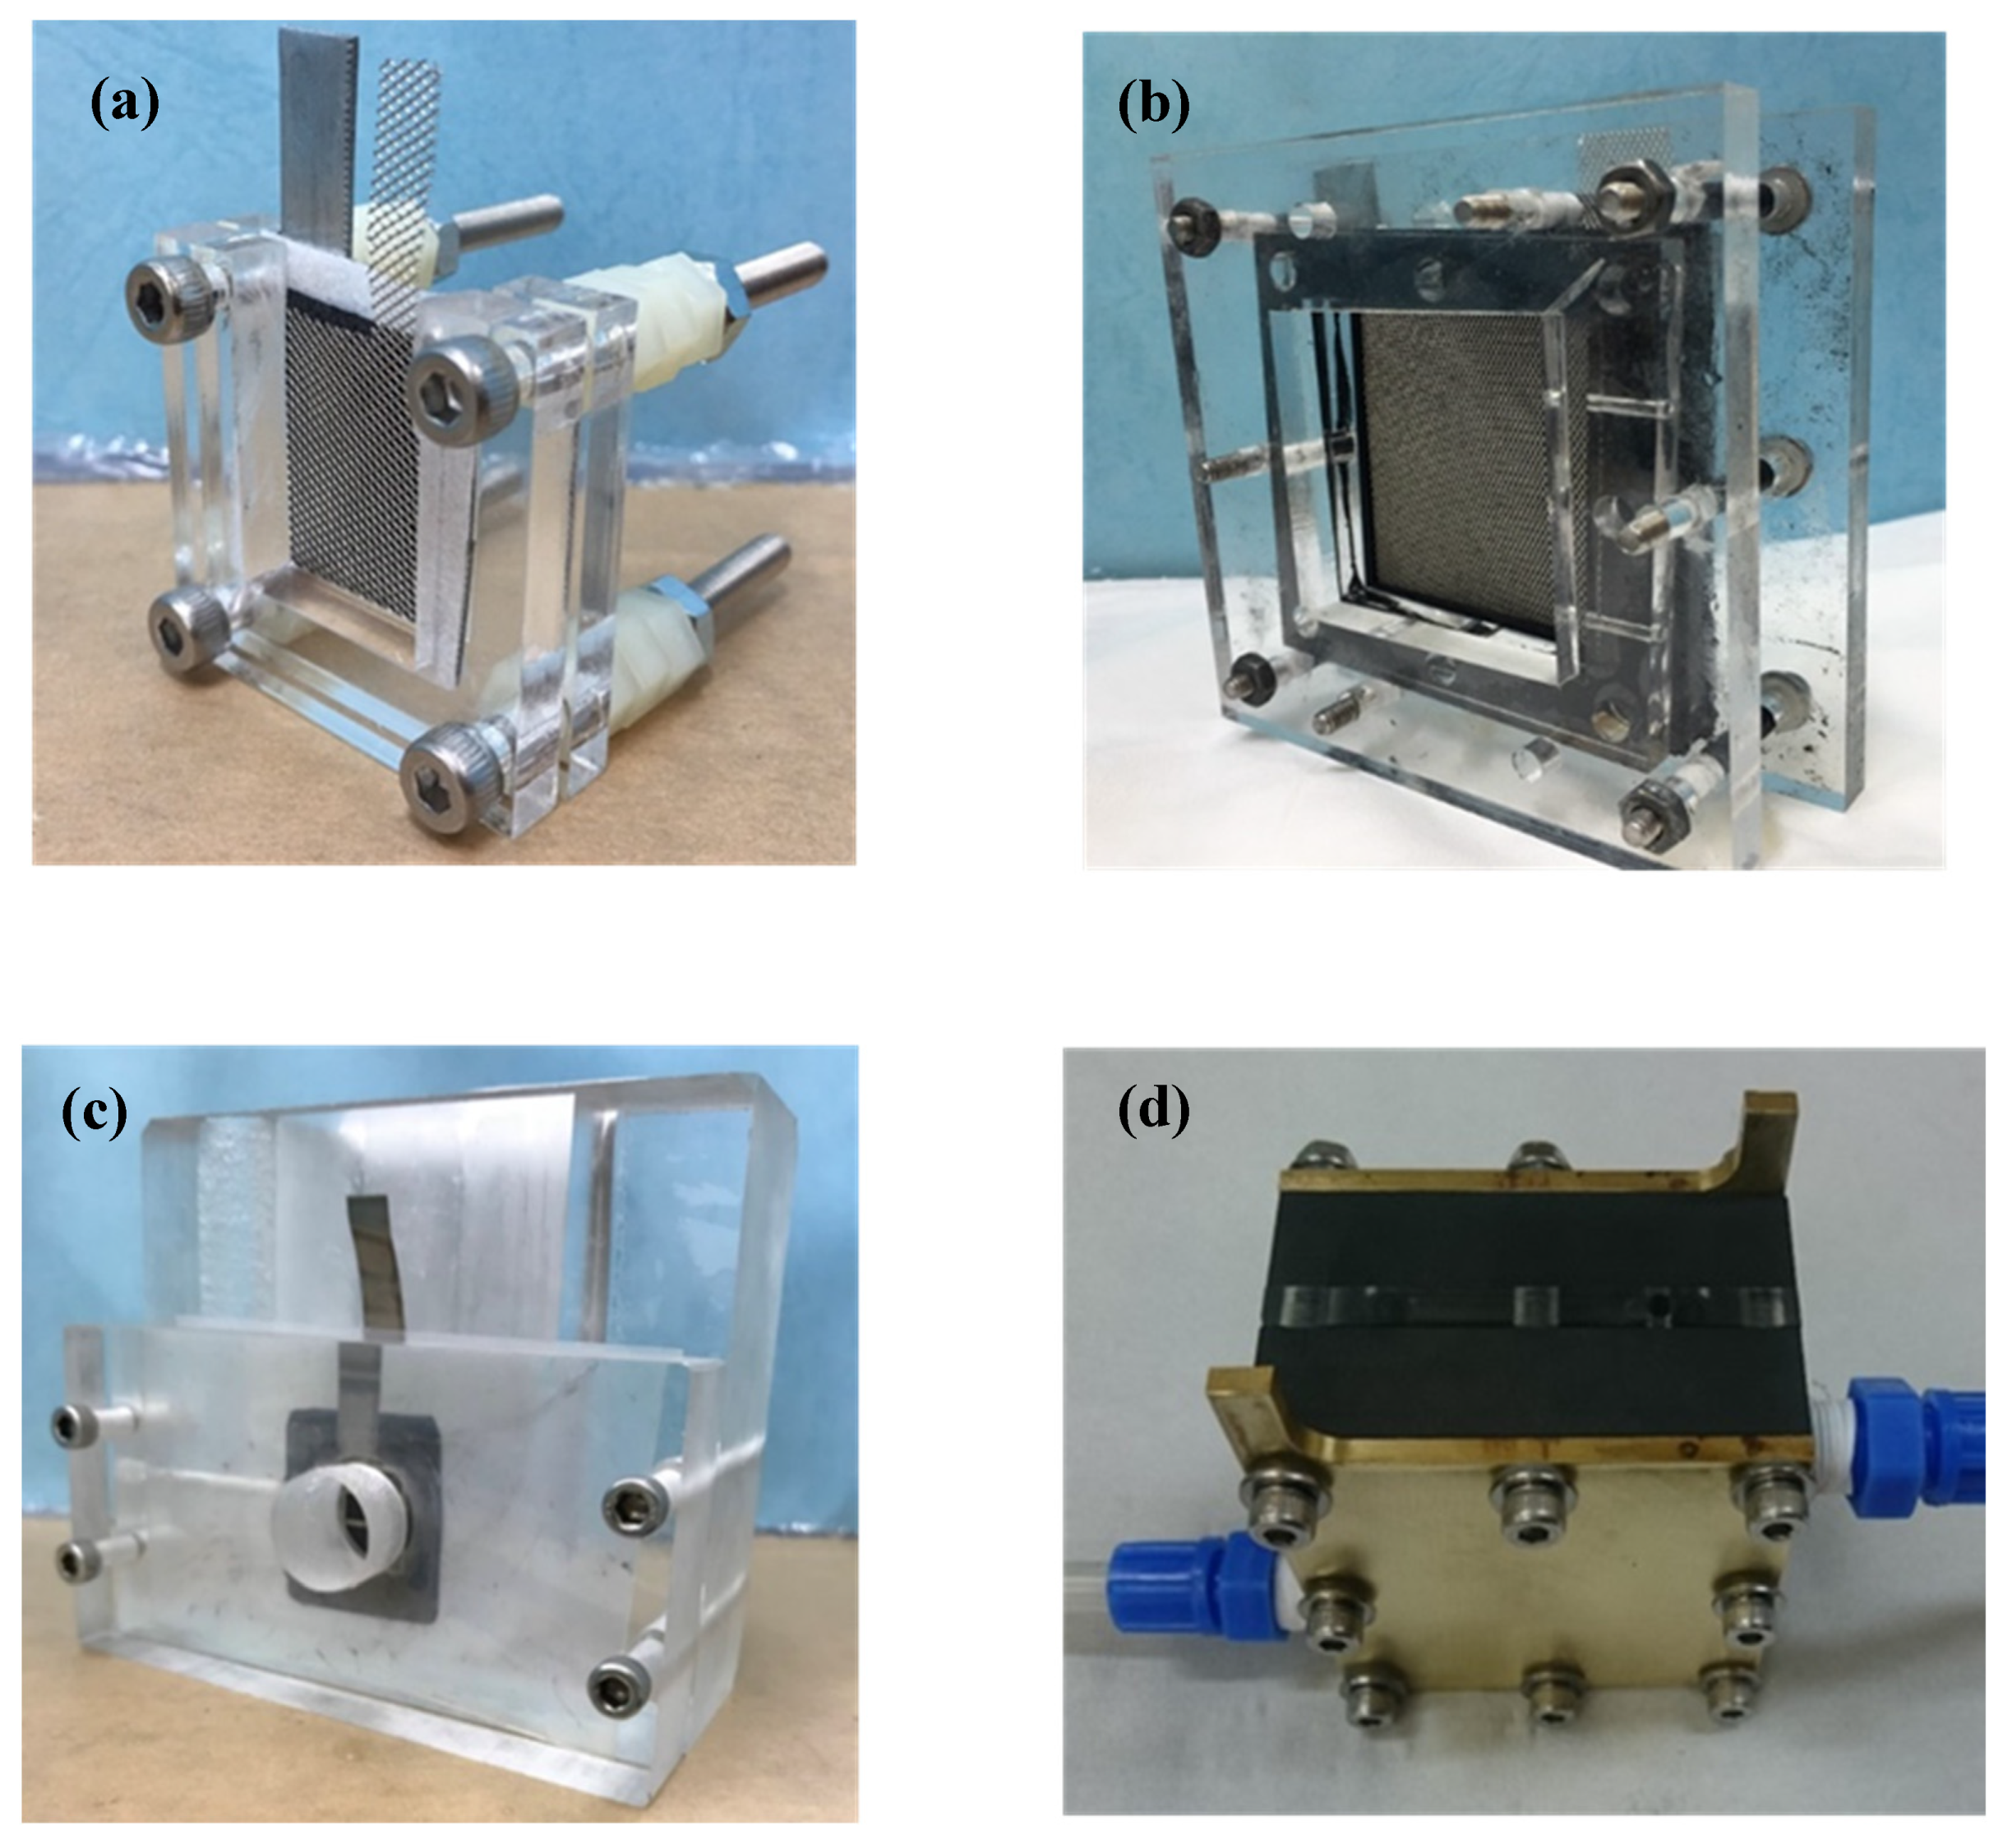
Cell 1 is a proximity cell in which the anode and cathode are in close proximity. Because the internal resistance of this cell is relatively low due to shortening of the electrode distance, high output power can be obtained, as illustrated in Figure 2. Both the anode and cathode were composed of carbon paper, and their active areas measured 2 cm × 2 cm. Porous paper saturated with 6 M KOH was used as the separator. The distance between the anode and cathode was approximately 1 mm, as shown in Figure 3a. The total electrolyte volume was approximately 0.3 mL. The electrodes and the separator were clamped together using two u-shaped acrylic plates.
2.3. Configuration of Cells under Investigation—Cell 2
Cell 2 was an aqueous electrolyte cell in which aqueous KOH was filled between the anode and cathode. In contrast to the proximity cell, in this cell, the electrodes were maintained at a certain distance. An adequate amount of electrolyte was filled between the electrodes. The active areas of the anode and cathode were 5 cm × 5 cm, and the anode and cathode were separated using a 0.5 cm–thick spacer. The spacer was filled with aqueous 6.0 M KOH, as illustrated in Figure 3b. The electrodes and separator were clamped together using two acrylic plates. The electrolyte volume was 12.5 mL. An opening was made in the cathode-side acrylic plate for air circulation.
2.4. Configuration of Cells under Investigation—Cell 3
Cell 3 was the cathode limited cell, where the active anode area (4 cm × 3.5 cm = 14 cm2) was considerably larger than the active cathode area (1 cm in diameter, 0.785 cm2). Cell polarization was limited by the cathode. With this cell, we tested cathode performance. The distance between the anode and cathode was set to 3 cm, as illustrated in Figure 3c. Electrolytes were placed in between the electrodes at an ample quantity (70 mL). A Pt wire was used as the reference electrode.
2.5. Configuration of Cells under Investigation—Cell 4
Cell 4 was an air flow channel cell in which a graphite channel plate was used on the cathode side to facilitate air flow. This cell was tested to determine the effect of convection air flow on cell output power density. Air was blown through a three-line parallel and serpentine channel by using an air pump (TEION). The anode was a zinc plate embedded on a graphite plate. The active anode area was 3.3 cm × 3.3 cm. Gold-plated copper plates were used as the current collector and the end plate, as illustrated in Figure 3d. The cathode area of Cell 4a was 3.6 cm × 3.6 cm and that of Cells 4b and 4c was 4.2 cm × 4.2 cm. In this cell, three spacers with thicknesses of 0.5, 1.0, and 1.5 cm were used. The corresponding electrolyte volumes were 5.1, 10.2, and 15.4 mL, respectively.
2.6. Modified 25BC Carbon Paper as Cathode
Carbon slurry was prepared by mixing 60 wt.% Teflon suspension, ethylene glycol, and carbon powder (XC72R, Well Being Enterprise) at a weight ratio of 0.05:7:1. The slurry was mixed using a planetary mixer (AR-100, THINKY) for 5 min and hand coated on commercial 25BC carbon paper (SGL) using a doctor coater; it was then dried, preheated at 350 °C for 3 min, and hot pressed at 350 °C for 5 min using a hot press (Xinchang Technology Enterprise Society). The thickness of the carbon slurry layer was 1 mm. This carbon-coated 25BC carbon paper was called modified 25BC.
2.7. Computer Modeling of Testing Cells—Current Distribution
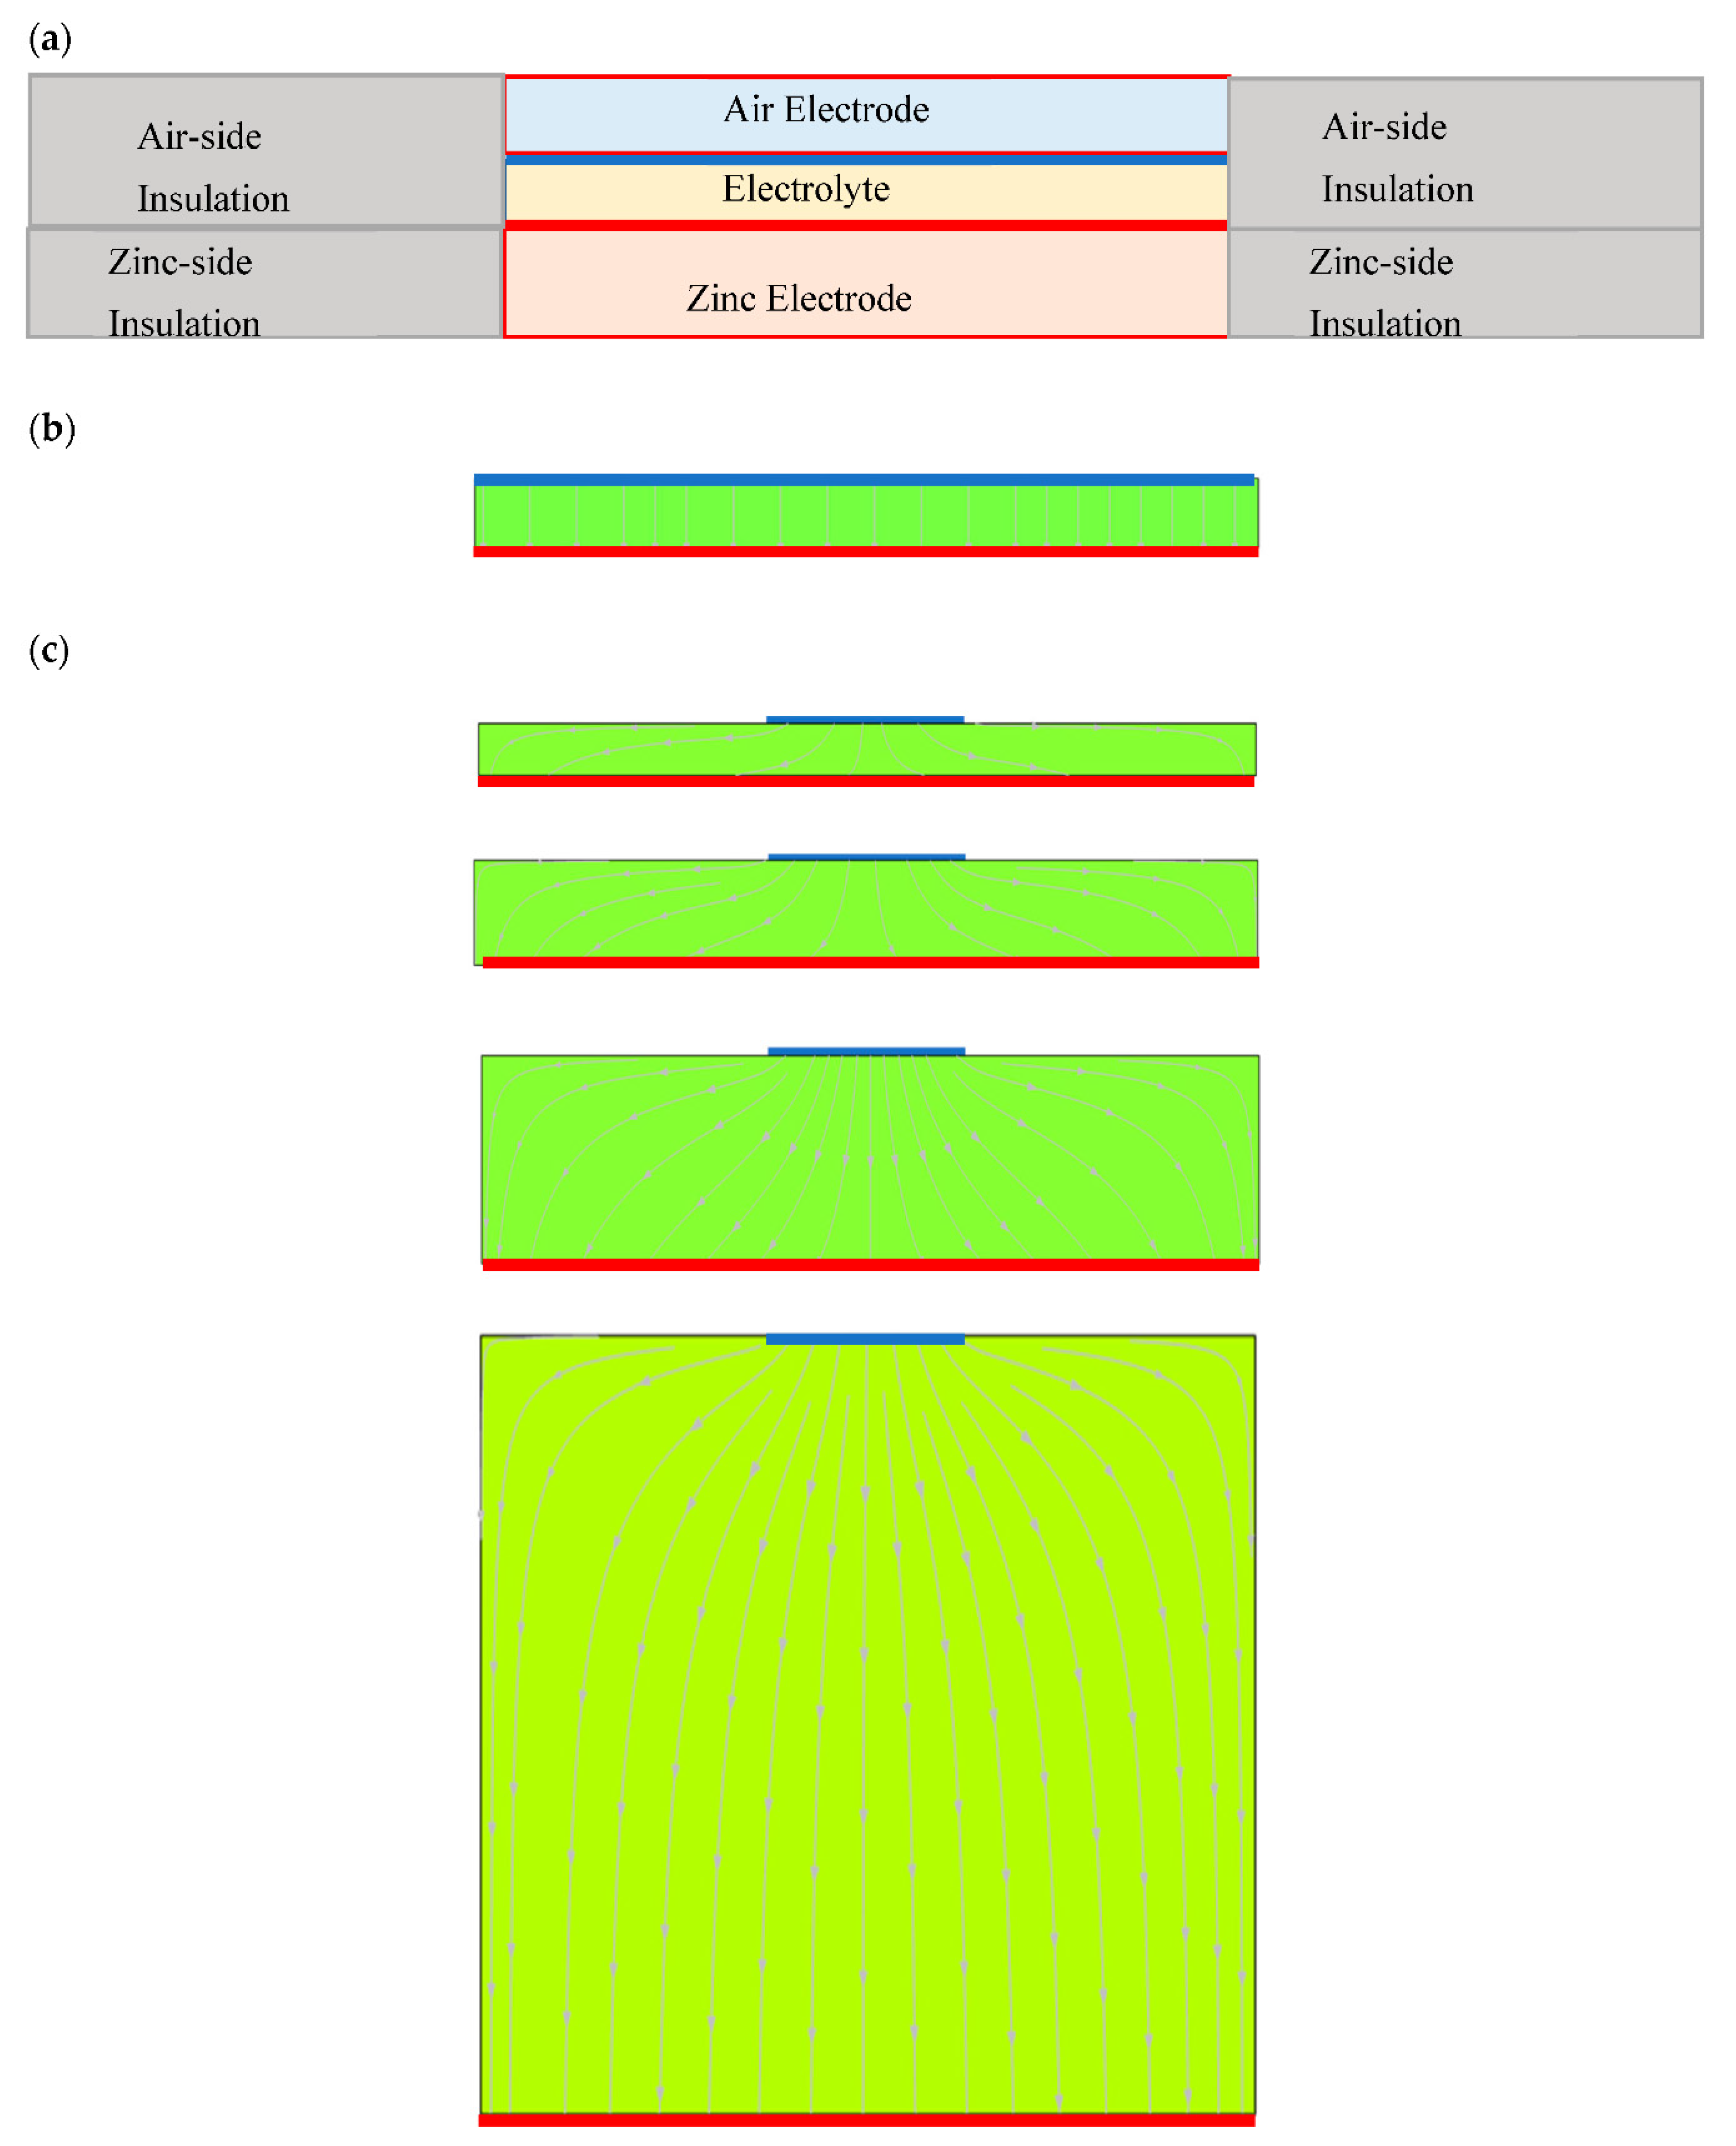
Modeling studies related to Zn-air batteries are rare. Zn-air batteries were ultrasonically excited to enhance their discharge performance in research by [45]. COMSOL was employed in their study to calculate the ultrasonic wave and its intensity. The E-I curve was calculated using the electrolysis module in COMSOL 5.6. The current and potential distributions of Cells 1, 2, and 3 were calculated using the electrochemistry module in COMSOL 5.6. COMSOL 5.6 requires a minimum of 4 GB of RAM and 2–13 GB of storage space. We used it on a personal computer with Windows 10 software, 64.0 GB RAM and Intel Core i7-7700 CPU, 3.60 GHz/3.60 GHz. Components of cell 1~4 cross-sections used for computer modeling, as Figure 4. Figure 4a is configuration of Cells 1 and 2 used for modeling. Figure 4b shows streamline of current flow of Cell 1 and 2. Figure 4c displays Cell 3 and 4 used for modeling with different anode/cathode distances (2, 4, 8, and 30 mm). The streamline arrows denote current flow in the electrolyte.
The E-I curve was calculated using the electroanalysis module and adopting the Butler–Volmer equation to express the electrochemical reaction. Mass transfer was included by expressing the exchange current density as a function of reactant and product concentration.
Both the anode and cathode were pointed electrodes and distant from each other. The effects of cell dimension and configurations were not considered. However, the dynamic variation of species concentration between pointed electrodes was calculated.
For calculating the secondary current distribution, the electrochemical module was employed. In this case, the Butler–Volmer equation was also used to express the electrochemical reaction. One equation was used for the air electrode side to represent the ORR. Two equations were used for the zinc electrode side, where one represented the anodic dissolution of zinc and the other represented the hydrogen evolution reaction.
3. Results and Discussion
3.1. Cell 1
The E-I curves and power density-current curves (P-I curves) of Cell 1 with 25BC and modified 25BC as the cathode are illustrated in Figure 5a,b, respectively. During voltage scanning, the current increased as the voltage decreased until a threshold voltage was reached, after which the current decreased as the cell voltage decreased. A maximum current density behavior was observed. The maximum current densities (Imax) achieved with the cells using 25BC and modified 25BC as the cathode were 53 and 60 mA cm−2, respectively. The corresponding maximum power densities (Pmax) were 32.0 and 52.6 mW cm−2, respectively. The power density values were calculated on the basis of the active electrode area. The internal resistance (Rint) of the cells was calculated using the slope of the E-I curve (ΔE/ΔI), which was calculated using the voltage and current data between 20 and 50 mA cm−2. The Rint value of the cells with 25BC and modified 25BC cathodes were 5.9 and 4.9 mohm cm−2, respectively.
Zinc passivation was observed during the measurement of the E-I curve. The color of the zinc surface changed from a bright metallic color to black. The zinc anode with the 25BC cathode was passivated. A loss of activation voltage was observed at low currents. The activation voltage loss was reduced in the cell with the polished zinc anode and modified 25BC cathode.
The model-calculated E-I curve is plotted as the dashed line in Figure 5a for comparison. The dashed curves of condition 1, the E-I curve was calculated using the COMSOL electrolysis module, and a reversible reaction was assumed with the Butler–Volmer equation. Under Condition 2, the electrolysis module was used, and a reversible reaction was assumed with the Butler–Volmer equation. For calculations under Condition 3, the electrochemistry module was used, and an irreversible reaction was assumed with the Butler–Volmer equation. According the model-calculated E-I curves, a reasonable result was obtained. The maximum current behavior exhibited by the model-calculated curves is similar to that exhibited by the experimentally measured curves. This can be ascribed to the limiting of species mass transfer in the modeling process. Therefore, the maximum current behavior can possibly be ascribed to mass transfer being limited on the zinc side or the oxygen reduction side.
During voltage scanning, this increase then decrease in current can be attributed to the following possible factors: mass transfer limiting due to the ORR, mass transfer limiting due to zinc dissolution, and zinc passivation.
3.2. Cell 2
The configuration of Cell 2 is similar to that of Cell 1. A zinc plate was installed parallel to the air electrode with a reaction area of 25 cm2, and the distance between the two electrodes was 5 mm. The space between the two electrodes was filled with electrolyte, and a porous separator was not used. Due to high electrolyte conductivity (6 M KOH, approximately 65 S m−1), electrode distance had little effect on the cell’s E-I curve or on its maximum power density. Moreover, the modeling results indicated that the E-I curve remained unchanged for electrode distances of up to 30 mm. The current distribution was relatively uniform, as illustrated in Figure 4b. The arrows indicate the direction of current flow.
Air was supplied using a fan to enhance air supply. Figure 6 present the E-I curves and P-I curves, respectively. These curves show that the Pmax values of this cell under natural convection (without air fan) or under forced air convection (with air fan) with 25BC or modified 25BC cathodes were 29.1 and 30.6 mW cm−2 at 50 mA cm−2. Thus, the Pmax of Cell 2 was unaffected by the mass transfer rate on the air side. The mass transfer rate on the zinc side or zinc passivation may have limited the Pmax of Cells 1 and 2.
3.3. Cell 3
To eliminate the possible limitation of Pmax by the zinc electrode, in Cell 3, the size of the zinc electrode was increased. The E-I and P-I curves were measured for zinc electrode area/air electrode area ratios of 1:1 to 18:1. According to the results, Pmax increased as the anode/cathode area ratio was increased from 1:1 to 8:1. Figure 7a,b illustrate the E-I and P-I curves for the anode/cathode area ratio of 8:1. The Pmax of Cell 3 increased significantly compared with those of Cells 1 and 2. At area ratios higher than 8:1 (8:1–18:1), Pmax decreased as the area ratio increased, as illustrated in Figure 8. Nonuniform current distribution may one of the factors underlying this behavior.
An unequal electrode size may lead to uneven current distribution. As mentioned before, Figure 4c depicts the current distribution of Cell 3 for different electrode separation distances (2, 4, 8, and 30 mm). According to the top panel of Figure 4c, for the electrode distance of 2 mm, the current flow from the cathode to the anode was concentrated close to the cathode. The current through the zinc electrode was uneven. As the electrode distance increased, the current through the zinc electrode became uniform. Current distribution on the zinc electrode was relatively uniform when the electrodes were 30 mm apart.
The E-I and P–I curves of Cell 3 under natural convection and forced air convection were almost similar. This suggested that mass transfer on the air side has a minor effect on these curves. Pmax was 50 mW cm−2 at the current density of 150 mA cm−2. Pmax increased significantly with an increase in the surface area of the zinc electrode. This suggested that the zinc electrode was the factor limiting Pmax in the present cell configuration (Cells 1, 2, and 3).
Through increases to the surface area ratio of the zinc electrode to the air electrode from 1 to 8, the limiting factor shifted to the air side. Figure 7b shows the E-I and P-I curves of the cell with modified 25BC as the cathode under natural and forced air convection. The corresponding Pmax values were 72.0 and 88.3 mW cm−2 at the current densities of 205 and 240 mA cm−2, respectively. Forced air convection with electrode modification significantly affected Pmax.
3.4. Cells 4a–c
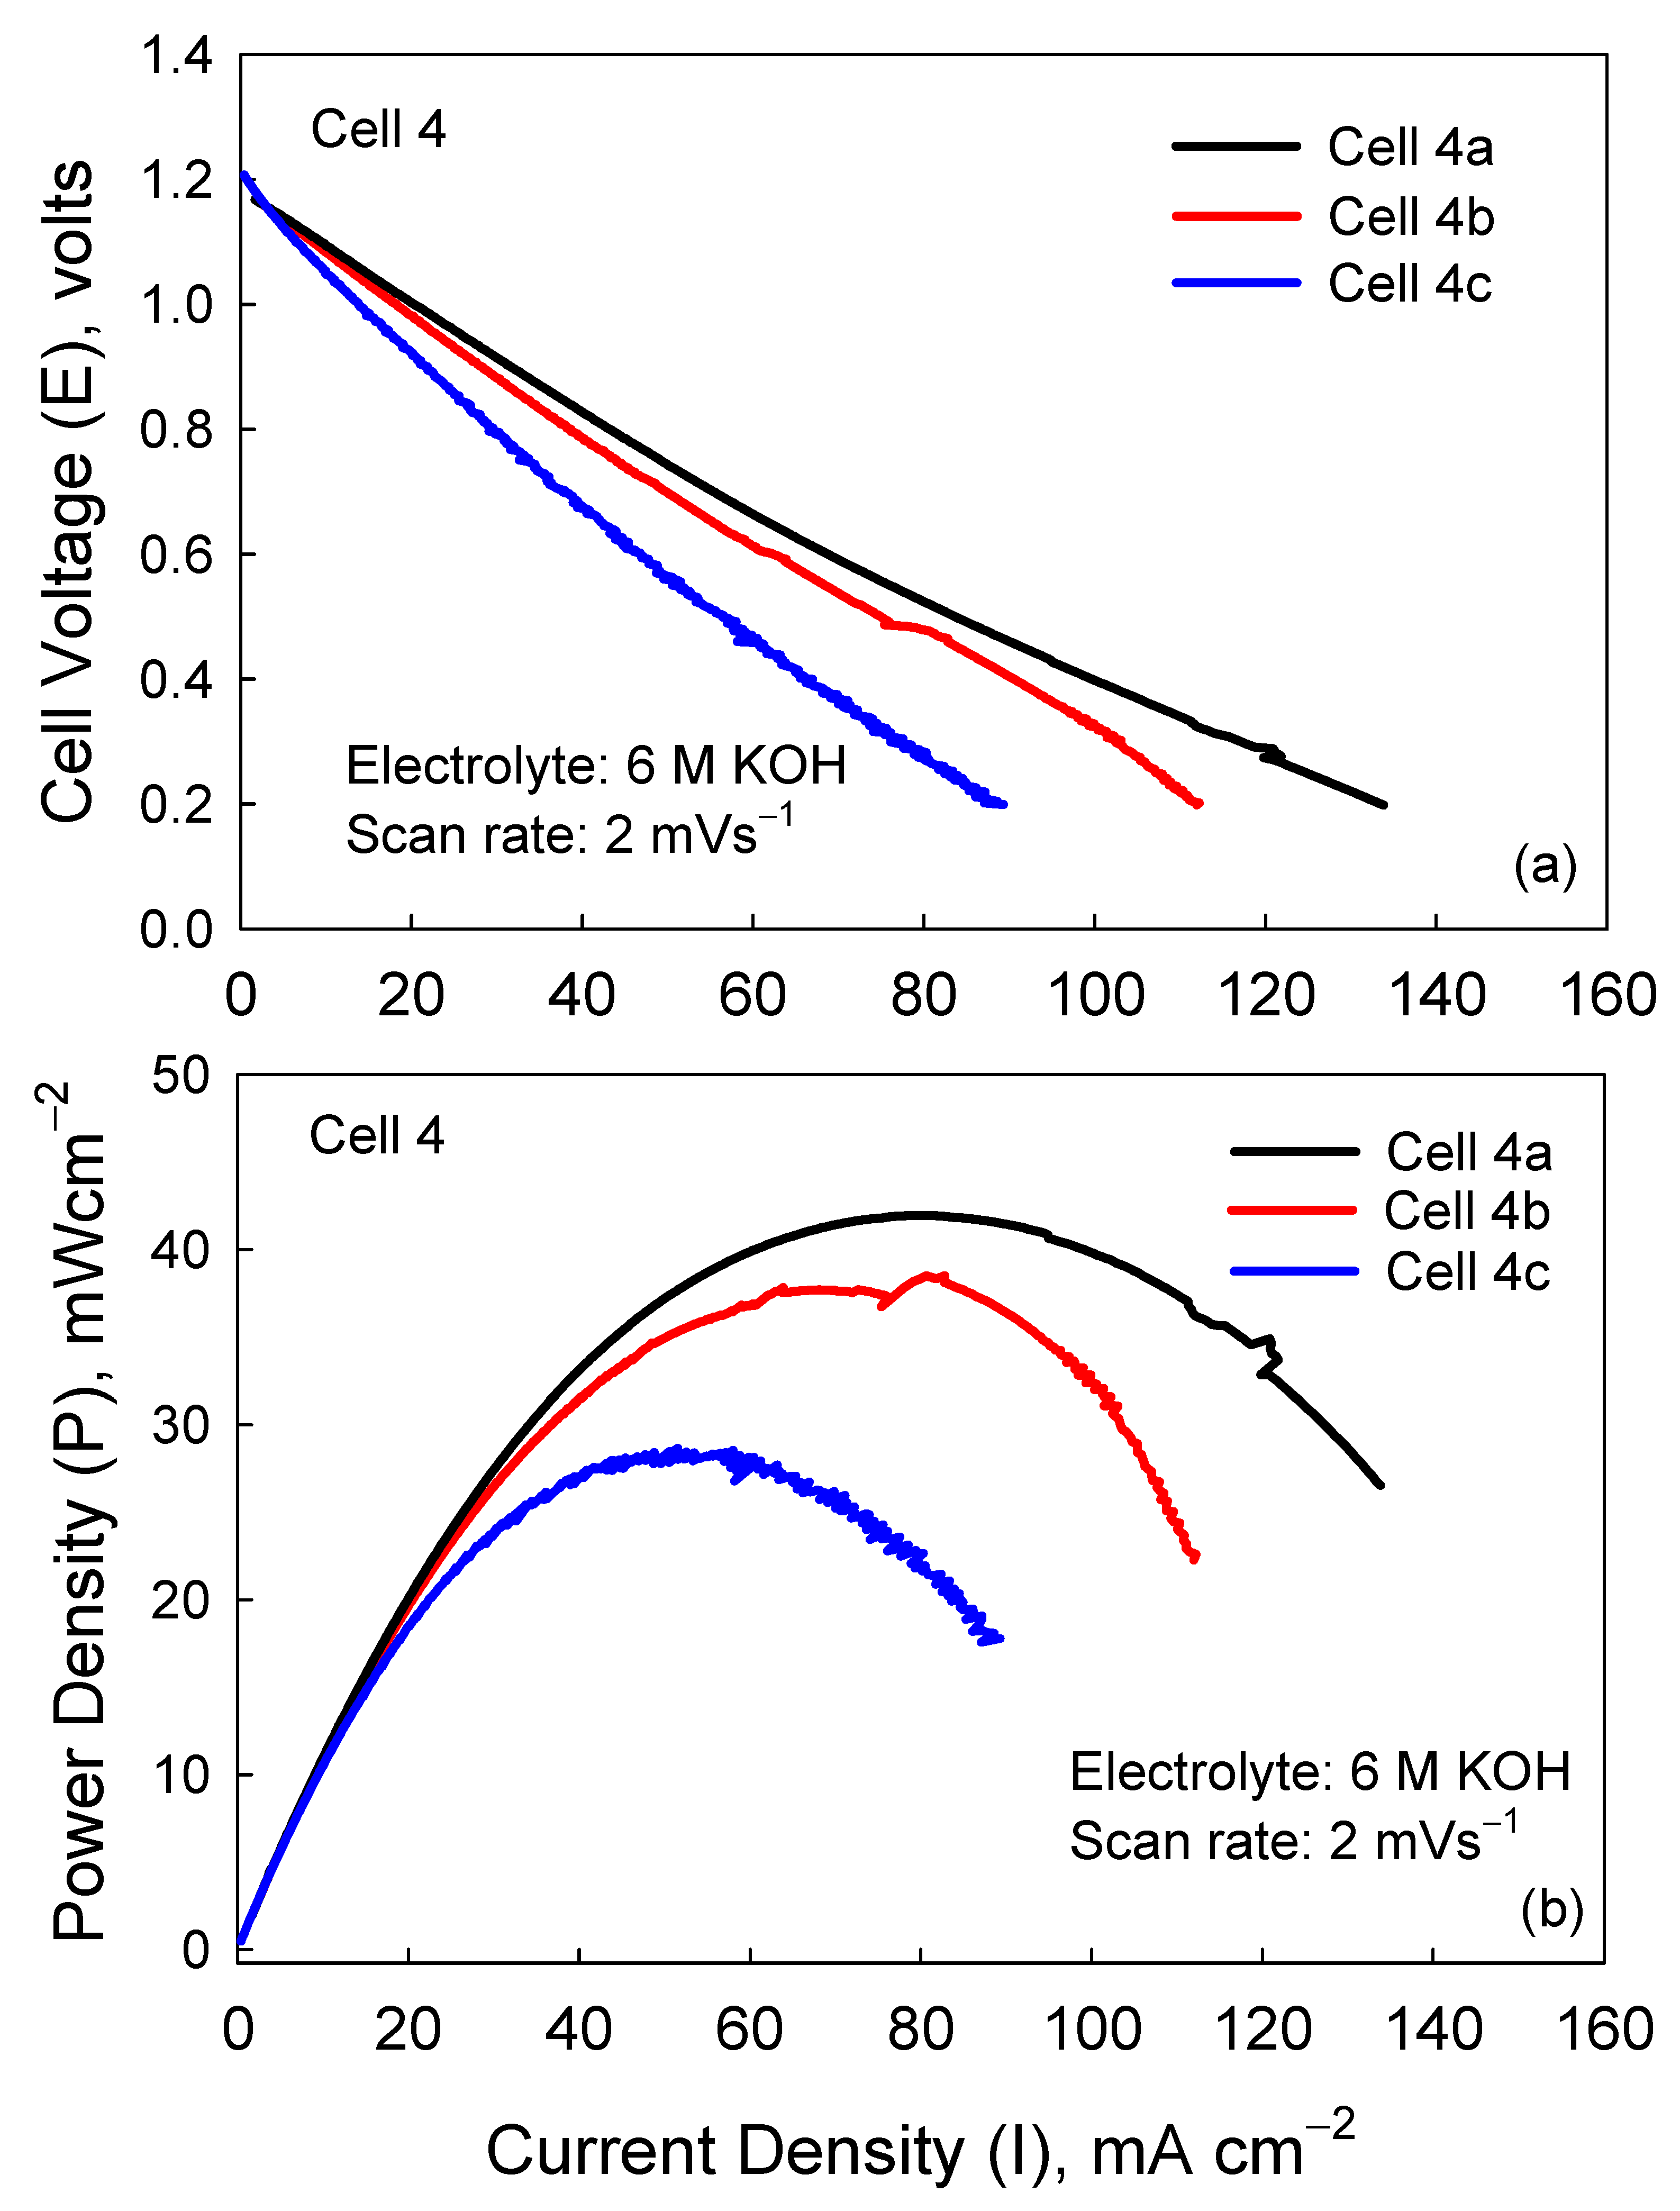
A serpentine flow channel made of graphite was used in Cells 4a, 4b, and 4c. Spacers with thicknesses of 5, 10, and 15 mm were used in Cells 4a, 4b, and 4c, respectively. As illustrated in Figure 9a, the current density (Imax) of these cells at 0.2 V was 133.8 mA cm−2 for Cell 4a, 112.2 mA cm−2 for Cell 4b, and 89.7 mA cm−2 for Cell 4c. According to Figure 9b, Pmax was 41.9 mW cm−2 for Cell 4a, 38.5 mW cm−2 for Cell 4b, and 28.6 mW cm−2 for Cell 4c.
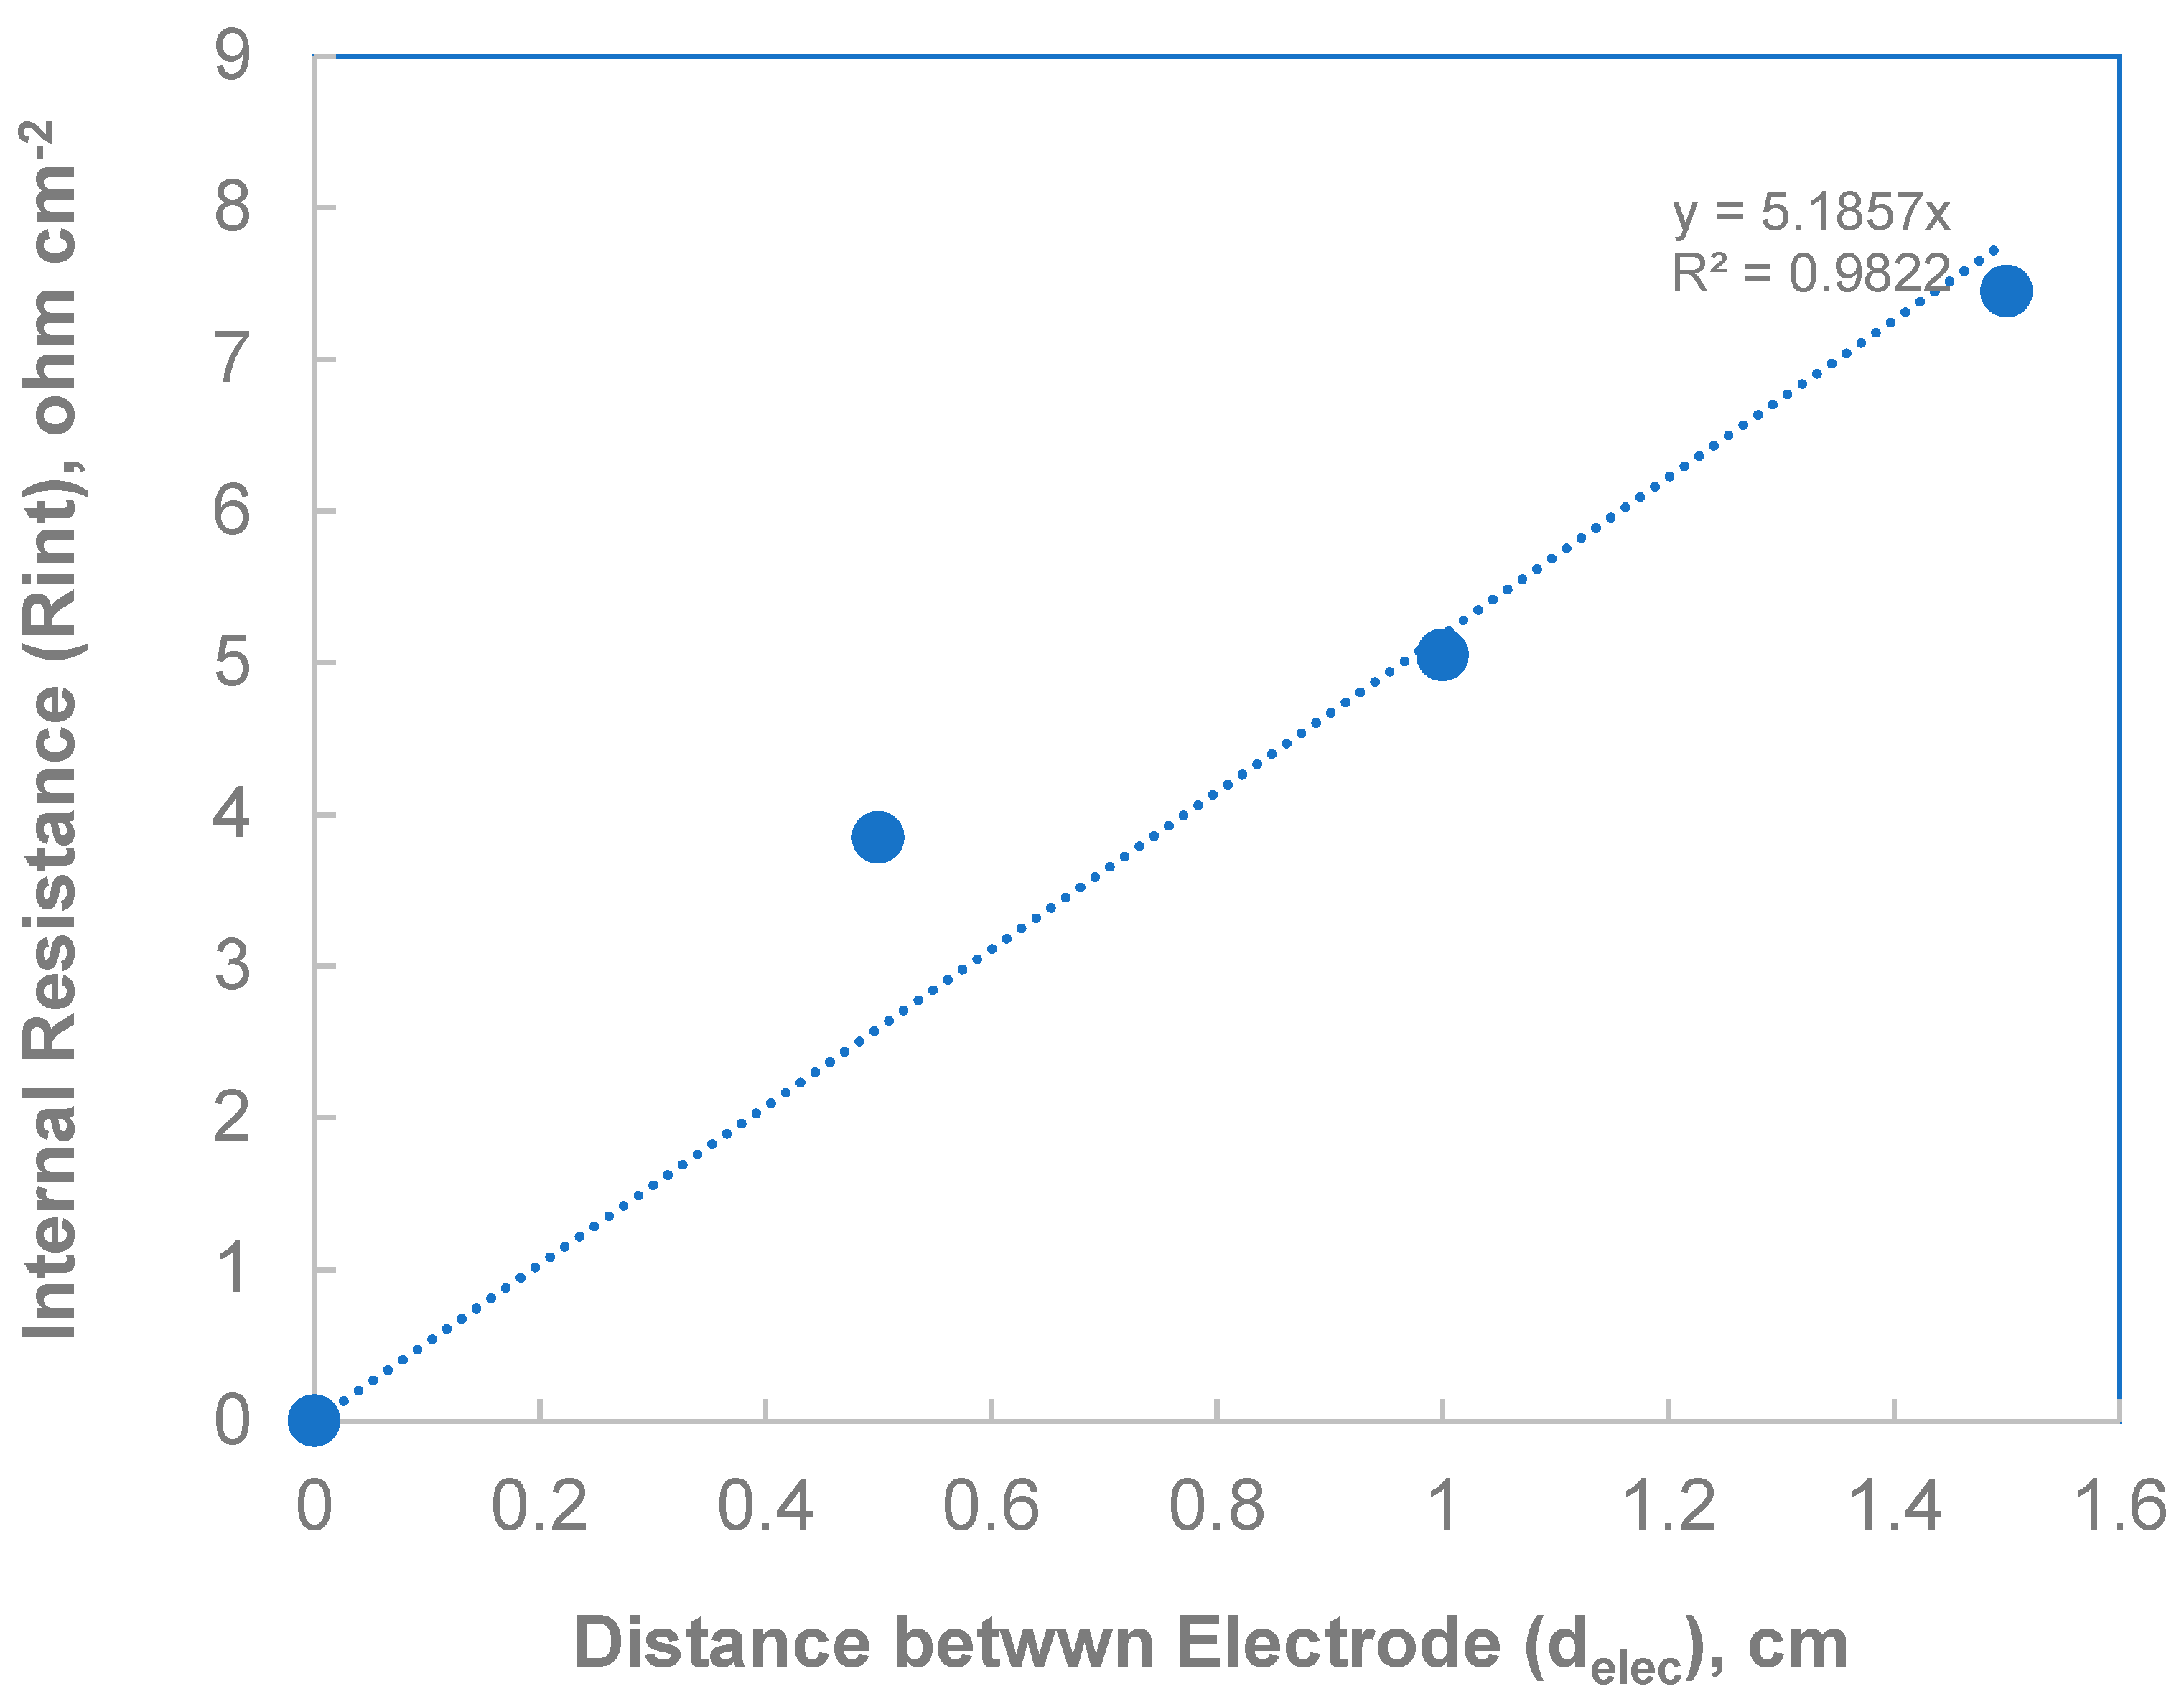
Figure 10 is the plot of internal resistance (Rint) versus electrode distance. The Rint is calculated from the slope of the E-I curve. The Rint of Cell 4 increased as the distance between electrodes increased. Owing to the high electrolyte conductivity, the electrolyte conductivity had a negligible effect on the variation of Rint. Rint may be ascribed to hydrogen gas bubbles in the electrolyte. The order for current density at 0.2 V and power density was Cell 4a > Cell 4b > Cell 4c, and the order for anode–cathode distance was Cell 4a < Cell 4b < Cell 4c.
3.5. Volumetric Power Density Versus Power Density Based on Cathode Area
Table 3 summarizes the Pmax values of Cells 1, 2, 3, 4a, 4b, and 4c. The maximum achievable power density of a cell Pmax is calculated based on unit cathode active area. Under natural convection, Pmax increased with the zinc electrode area as given by Cell 3 data. Modified 25BC can provide a higher amount of carbon for oxygen reduction than 25BC, and the Pmax of the cell with the modified 25BC electrode was higher than that of the cell with the 25BC electrode. The volume of electrolyte used in each cell is listed in Table 4. The power density calculated based on the electrolyte volume P’max is listed in the same table. Cell 1 had the highest P’max value among all cells. Although Cell 1 has the lowest cell output power, its high volumetric power density renders Cell 1 the best cell configuration for portable applications.
In this work, we studied several cell design parameters and operating conditions, such as anode–cathode distance, anode/cathode area ratio, natural convection/forced convection, and flow channel on the air side. The results reflect general principles of cell design. They can be considered qualitatively rather than quantitatively.
4. Conclusions
Zn-air batteries have attracted considerable attention from researchers due to their high energy density, low cost, and the abundance of zinc. Many research projects have been completed, and patents have been filed for novel electrolyte additives, bifunctional catalysts for air electrodes, and zinc electrodes. In this study, we analyzed the effects of cell configuration on cell performance. A total of four types of cells were built and tested to investigate the effects of the following factors on cell performance: (1) ORR electrode with carbon paste, (2) air diffusion by natural and forced air convection, (3) anode/cathode area ratio, and (4) anode–cathode distance. According to the results, the addition of carbon paste on 25BC on the air side increased cell power density under forced air convection. Increasing the anode/cathode area ratio increased the cell power density, and the best area ratio in this study was 8. As the anode–cathode distance decreased, the internal resistance decreased. Moreover, cell performance increased, but zinc passivation occurred easily. Finally, four types of cells were compared with 25BC as the ORR electrode, and the results were obtained based on the ORR electrode area. Cell 3 performed the best, and its maximum power density measured approximately 54 mW cm−2. In terms of volumetric power density, the proximity cell (Cell 1) exhibited the highest power density among the cells studied herein. Therefore, this cell configuration is suitable for portable applications.
For fair comparison in this study, we selected a zinc plate as the anode and plain carbon paper as the cathode. To boost cell power density, the zinc plate should be replaced with a zinc powder/metal mesh, a good catalyst should be used in the cathode active layer, and hydrophobicity should be enhanced in the cathode diffusion layer.
Author Contributions
C.-T.L. executed this project, performed data analysis, and supervised graduate students Z.-Y.Z., S.-W.C. and Y.-L.C. Moreover, she prepared the draft of this manuscript. The graduate students performed experimental work, data collection, and primary analysis. K.-L.H. conceptualized this project and served as the principal investigator. He edited the draft of this manuscript and is the corresponding author. All authors have read and agreed to the published version of the manuscript.
Funding
This project was conducted under the National Energy Program under the Ministry of Science and Technology (MOST), funding number: 107-3113-E-194-002. The authors thank MOST for the financial support provided to this project.
Institutional Review Board Statement
This study did not involve humans or animals. This study did not require ethical approval.
Informed Consent Statement
Not applicable.
Data Availability Statement
Since authors do not have permanent website. Data are available upon request.
Conflicts of Interest
The authors declare no conflict of interest. The funders had no role in the design of the study; in the collection, analyses, or interpretation of data; in the writing of the manuscript; or in the decision to publish the results.
References
- Zhang, X.; Wang, X.-G.; Xie, Z.; Zhou, Z. Recent progress in rechargeable alkali metal-air batteries. Green Energy Environ. 2016, 1, 4–17. [Google Scholar] [CrossRef]
- Liu, Y.; Sun, Q.; Li, W.; Adair, K.R.; Li, J.; Sun, X. A comprehensive review on recent progress in aluminum-air batteries. Green Energy Environ. 2017, 2, 246–277. [Google Scholar] [CrossRef]
- Shen, X.; Liu, H.; Cheng, X.-B.; Yan, C.; Huang, J.-Q. Beyond lithium ion batteries: Higher energy density battery systems based on lithium metal anodes. Energy Storage Mater. 2018, 12, 161–175. [Google Scholar] [CrossRef]
- Shkolnikov, E.I.; Zhuk, A.Z.; Vlaskin, M.S. Aluminum as energy carrier: Feasibility analysis and current technologies overview. Renew. Sustain. Energy Rev. 2011, 15, 4611–4623. [Google Scholar] [CrossRef]
- Xu, Y.; Zhang, Y.; Guo, Z.; Ren, J.; Wang, Y.; Peng, H. Flexible, stretchable, and rechargeable fiber-shaped zinc- air battery based on cross-stacked carbon nanotube sheets. Angew. Chem. 2015, 127, 15610–15614. [Google Scholar] [CrossRef]
- Suren, S.; Kheawhom, S. Development of a High Energy Density Flexible Zinc-Air Battery. J. Electrochem. Soc. 2016, 163, A846–A850. [Google Scholar] [CrossRef]
- Zhao, J.; Wei, D.; Zhang, C.; Shao, Q.; Murugadoss, V.; Guo, Z.; Jiang, Q.; Yang, X. An Overview of Oxygen Reduction Electrocatalysts for Rechargeable Zinc-Air Batteries Enabled by Carbon and Carbon Composites. Eng. Sci. 2021, 15, 1–19. [Google Scholar] [CrossRef]
- Sherman, S.B.; Cano, Z.P.; Fowler, M.; Chen, Z. Range-extending Zinc-air battery for electric vehicle. AIMS Energy 2018, 6, 121–145. [Google Scholar] [CrossRef]
- Goldstein, J.; Brown, I.; Koretz, B. New developments in the Electric Fuel Ltd. zinc/air system. J. Power Source 1999, 80, 171–179. [Google Scholar] [CrossRef]
- Georgious, R.; Refaat, R.; Garcia, J.; Daoud, A.A. Review on Energy Storage Systems in Microgrids. Electronics 2021, 10, 2134. [Google Scholar] [CrossRef]
- Chakkaravarthy, C.; Waheed, A.K.A.; Udupa, H.V.K. Zn–air alkaline batteries—A review. J. Power Sources 1981, 6, 203–228. [Google Scholar] [CrossRef]
- Caramia, V.; Bozzini, B. Materials science aspects of Zn–air batteries: A review. Mater. Renew. Sustain. Energy 2014, 3, 28. [Google Scholar] [CrossRef]
- Li, Y.; Dai, H. Recent advances in Zn–air batteries. Chem. Soc. Rev. 2014, 43, 5257–5275. [Google Scholar] [CrossRef]
- Mainar, A.R.; Iruin, E.; Colmenares, L.C.; Kvasha, A.; Meatza, I.d.; Bengoechea, M.; Leonet, O.; Boyano, I.; Zhang, Z.; Blazquez, J.A. An overview of progress in electrolytes for secondary Zn–air batteries and other storage systems based on zinc. J. Energy Storage 2018, 15, 304–328. [Google Scholar] [CrossRef]
- Han, X.; Li, X.; White, J.; Zhong, C.; Deng, Y.; Hu, W.; Ma, T. Metal–Air Batteries: From Static to Flow System. Adv. Energy Mater. 2018, 8, 1801396. [Google Scholar] [CrossRef]
- Hosseini, S.; Han, S.J.; Arponwichanop, A.; Yonezawa, T.; Kheawhom, S. Ethanol as an electrolyte additive for alkaline Zn–air flow batteries. Sci. Rep. 2018, 8, 11273. [Google Scholar] [CrossRef]
- Mainar, A.R.; Colmenares, L.C.; Grande, H.J.; Blázquez, J.A. Enhancing the cycle life of a Zn–air battery by means of electrolyte additives and zinc surface protection. Batteries 2018, 4, 46. [Google Scholar] [CrossRef]
- Li, P.C.; Hu, C.C.; You, T.H.; Chen, P.Y. Development and characterization of bi-functional air electrodes for rechargeable Zn–air batteries: Effects of carbons. Carbon 2017, 111, 813–821. [Google Scholar] [CrossRef]
- Xu, N.; Qiao, J.; Zhang, X.; Ma, C.; Jian, S.; Liu, Y.; Pei, P. Morphology controlled La2O3/Co3O4/MnO2-CNTs hybrid nanocomposites with durable bi-functional air electrode in high- performance Zn–air energy storage. Appl. Energy 2016, 175, 495–504. [Google Scholar] [CrossRef]
- Ti, X.; Liu, Z.; Song, L.; Wang, D.; Zhang, Z. Three-dimensional graphene network supported ultrathin CeO2 nanoflakes for oxygen reduction reaction and rechargeable metal-air batteries. Electrochim. Acta 2018, 263, 561–569. [Google Scholar] [CrossRef]
- Mainar, A.R.; Colmenares, L.C.; Leonet, O.; Alcaide, F.; Iruin, J.J.; Weinberger, S.; Hacker, V.; Iruin, E.; Urdanpilleta, I.; Blazquez, J.A. Manganese oxide catalysts for secondary zinc air batteries: From electrocatalytic activity to bifunctional air electrode performance. Electrochim. Acta 2016, 217, 80–91. [Google Scholar] [CrossRef]
- Ishihara, T.; Yokoe, K.; Miyano, T.; Kusaba, H. Mesoporous MnCo2O4 spinel oxide for a highly active and stable air electrode for Zn–air rechargeable battery. Electrochim. Acta 2019, 300, 455–460. [Google Scholar] [CrossRef]
- Lu, C.T.; Chiu, Y.W.; Li, M.J.; Hsueh, K.L.; Hung, J.S. Reduction of the electrode overpotential of the oxygen evolution reaction by electrode surface modification. Int. J. Electrochem. Sci. 2017, 2017, 7494571. [Google Scholar] [CrossRef]
- Wang, H.; Min, Y.; Li, P.; Yang, J.; Li, J. In situ integration of ultrathin PtRuCu alloy overlayer on copper foam as an advanced free-standing bifunctional cathode for rechargeable Zn–air batteries. Electrochim. Acta 2018, 283, 54–62. [Google Scholar] [CrossRef]
- Li, Y.; Zhou, Z.; Cheng, G.; Han, S.; Zhou, J.; Yuan, J.; Sun, M.; Yu, L. Flower-like NiCo2O4eCN as efficient bifunctional electrocatalyst for Zn–air battery. Electrochim. Acta 2020, 341, 135997. [Google Scholar] [CrossRef]
- Xu, N.; Wilsonc, J.A.; Wang, Y.D.; Suc, T.; Weia, Y.; Qiaoa, J.; Zhou, X.D.; Zhang, Y.; Sun, S. Flexible self-supported bi-metal electrode as a highly stable carbon- and binder-free cathode for large-scale solid-state Zn–air batteries. Appl. Catal. B 2020, 272, 118953. [Google Scholar] [CrossRef]
- Han, S.; Hao, Y.; Guo, Z.; Yu, D.; Huang, H.; Hu, F.; Li, L.; Chen, H.Y.; Penga, S. Self-supported N-doped NiSe2 hierarchical porous nanoflake arrays for efficient oxygen electrocatalysis in flexible Zn–air batteries. Chem. Eng. J. 2020, 401, 126088. [Google Scholar] [CrossRef]
- Jiao, D.; Ma, Z.; Li, J.; Han, Y.; Mao, J.; Ling, T.; Qiao, S. Test factors affecting the performance of zinc–air battery. J. Energy Chem. 2020, 44, 1–7. [Google Scholar] [CrossRef]
- Xu, K.; Loh, A.; Wang, B.; Li, X. Enhancement of Oxygen Transfer by Design Nickel Foam Electrode for Zinc−Air Battery. J. Electrochem. Soc. 2018, 165, A809–A818. [Google Scholar] [CrossRef]
- Mohamad, A.A. Zn/gelled 6 M KOH/O2 zinc—Air battery. J. Power Sources 2006, 159, 752–757. [Google Scholar] [CrossRef]
- Park, J.E.; Lim, M.S.; Kim, J.K.; Choi, H.J.; Sung, Y.S.; Cho, Y.-H. Optimization of cell components and operating conditions in primary and rechargeable zinc–air battery. J. Ind. Eng. Chem. 2019, 69, 161–170. [Google Scholar] [CrossRef]
- Chen, Y.; Wang, H.; Ji, S.; Pollet, B.G.; Wang, R. Toward high performance of Zn–air battery using hydrophobic carbon foam-based diffusion electrode. J. Ind. Eng. Chem. 2019, 71, 284–292. [Google Scholar] [CrossRef]
- Xu, Q.; Jiang, H.; Li, Y.; Liang, D.; Hu, Y.; Li, C. In-situ enriching active sites on co-doped Fe-Co4N@N-C nanosheet array as air cathode for flexible rechargeable Zn–air batteries. Appl. Catal. B 2019, 256, 117893. [Google Scholar] [CrossRef]
- Ji, D.; Fan, L.; Li, L.L.; Mao, N.; Qinm, X.; Peng, S.; Ramakrishna, S. Hierarchical catalytic electrodes of cobalt-embedded carbon nanotube / carbon flakes array for flexible solid-state Zn–air batteries. Carbon 2019, 142, 379–387. [Google Scholar] [CrossRef]
- Wang, H.F.; Tang, C.; Wang, B.; Li, B.Q.; Cui, X.; Zhang, Q. Defect-rich carbon fiber electrocatalysts with porous graphene skin for flexible solid-state zinc–air batteries. Energy Storage Mater. 2018, 15, 124–130. [Google Scholar] [CrossRef]
- Zhang, L.; Yang, X.; Cai, R.; Chen, C.; Xia, Y.; Zhang, H.; Yang, D.; Yao, X. Air cathode of zinc–air batteries: A highly efficient and durable aerogel catalyst for oxygen reduction. Nanoscale 2019, 11, 826–832. [Google Scholar] [CrossRef]
- Jiratchayamaethasakul, C.; Srijaroenpramong, N.; Arpavate, W.; Wongyao, N.; Therdthianwong, A.; Therdthianwong, S. Effects of anode orientation and flow channel design on performance of refuelable Zn–air fuel cells. J. Appl. Electrochem. 2014, 44, 1205–1218. [Google Scholar] [CrossRef]
- Tsehaye, M.T.; Alloin, F.; Iojoiu, G.; Tufa, R.A.; Aili, D.; Fischer, P.; Velizarov, S. Membranes for Zn–air batteries: Recent progress, challenges and perspectives. J. Power Sources 2020, 475, 228689. [Google Scholar] [CrossRef]
- Bockelmann, M.; Kunz, U.; Turek, T. Electrically rechargeable zinc-oxygen flow battery with high power density. Electrochem. Commun. 2016, 69, 24–27. [Google Scholar] [CrossRef]
- Pei, P.; Ma, Z.; Wang, K.; Wang, X.; Song, M.; Xu, H. High performance zinc air fuel cell stack. J. Power Sources 2014, 249, 13–20. [Google Scholar] [CrossRef]
- Han, J.J.; Li, N.; Zhang, T.Y. Ag/C nanoparticles as an cathode catalyst for a Zn–air battery with a flowing alkaline electrolyte. J. Power Sources 2009, 193, 885–889. [Google Scholar] [CrossRef]
- Lao-atiman, W.; Olaru, S.; Arpornwichanop, A.; Kheawhom, S. Discharge performance and dynamic behavior of refuellable Zn–air battery. Sci. Data 2019, 6, 168. [Google Scholar] [CrossRef] [PubMed]
- Choi, N.H.; Olmo, D.d.; Fischer, P.; Pinkwart, K.; Tübke, J. Development of Flow Fields for Zinc Slurry Air Flow Batteries. Batteries 2021, 6, 15. [Google Scholar] [CrossRef]
- Mele, C.; Bilotta, A.; Bocchetta, P.; Bozzini, B. Characterization of the particulate anode of a laboratory flow Zn–air fuel cell. J. Appl. Electrochem. 2017, 47, 877–888. [Google Scholar] [CrossRef]
- Hosseini, S.; Lao-atiman, W.; Han, S.J.; Arpornwichanop, A.; Yonezawa, T.; Kheawhom, S. Discharge Performance of Zinc-Air Flow Batteries Under the Effects of Sodium Dodecyl Sulfate and Pluronic F-127. Sci. Rep. 2018, 8, 14909. [Google Scholar] [CrossRef]
Figure 1.
Number of metal–air battery patents filed. Patent search range: TAC, Title/Abstract/Claims. Lithium–air battery search keyword: (metal-air battery) AND (lithium) AND (secondary OR rechargeable); Sodium–air battery search keyword: (metal-air battery) AND (sodium) AND (secondary OR rechargeable); keywords for other metal–air batteries follow a similar searching criterion. The AND and OR are logic operator employed during patent search.
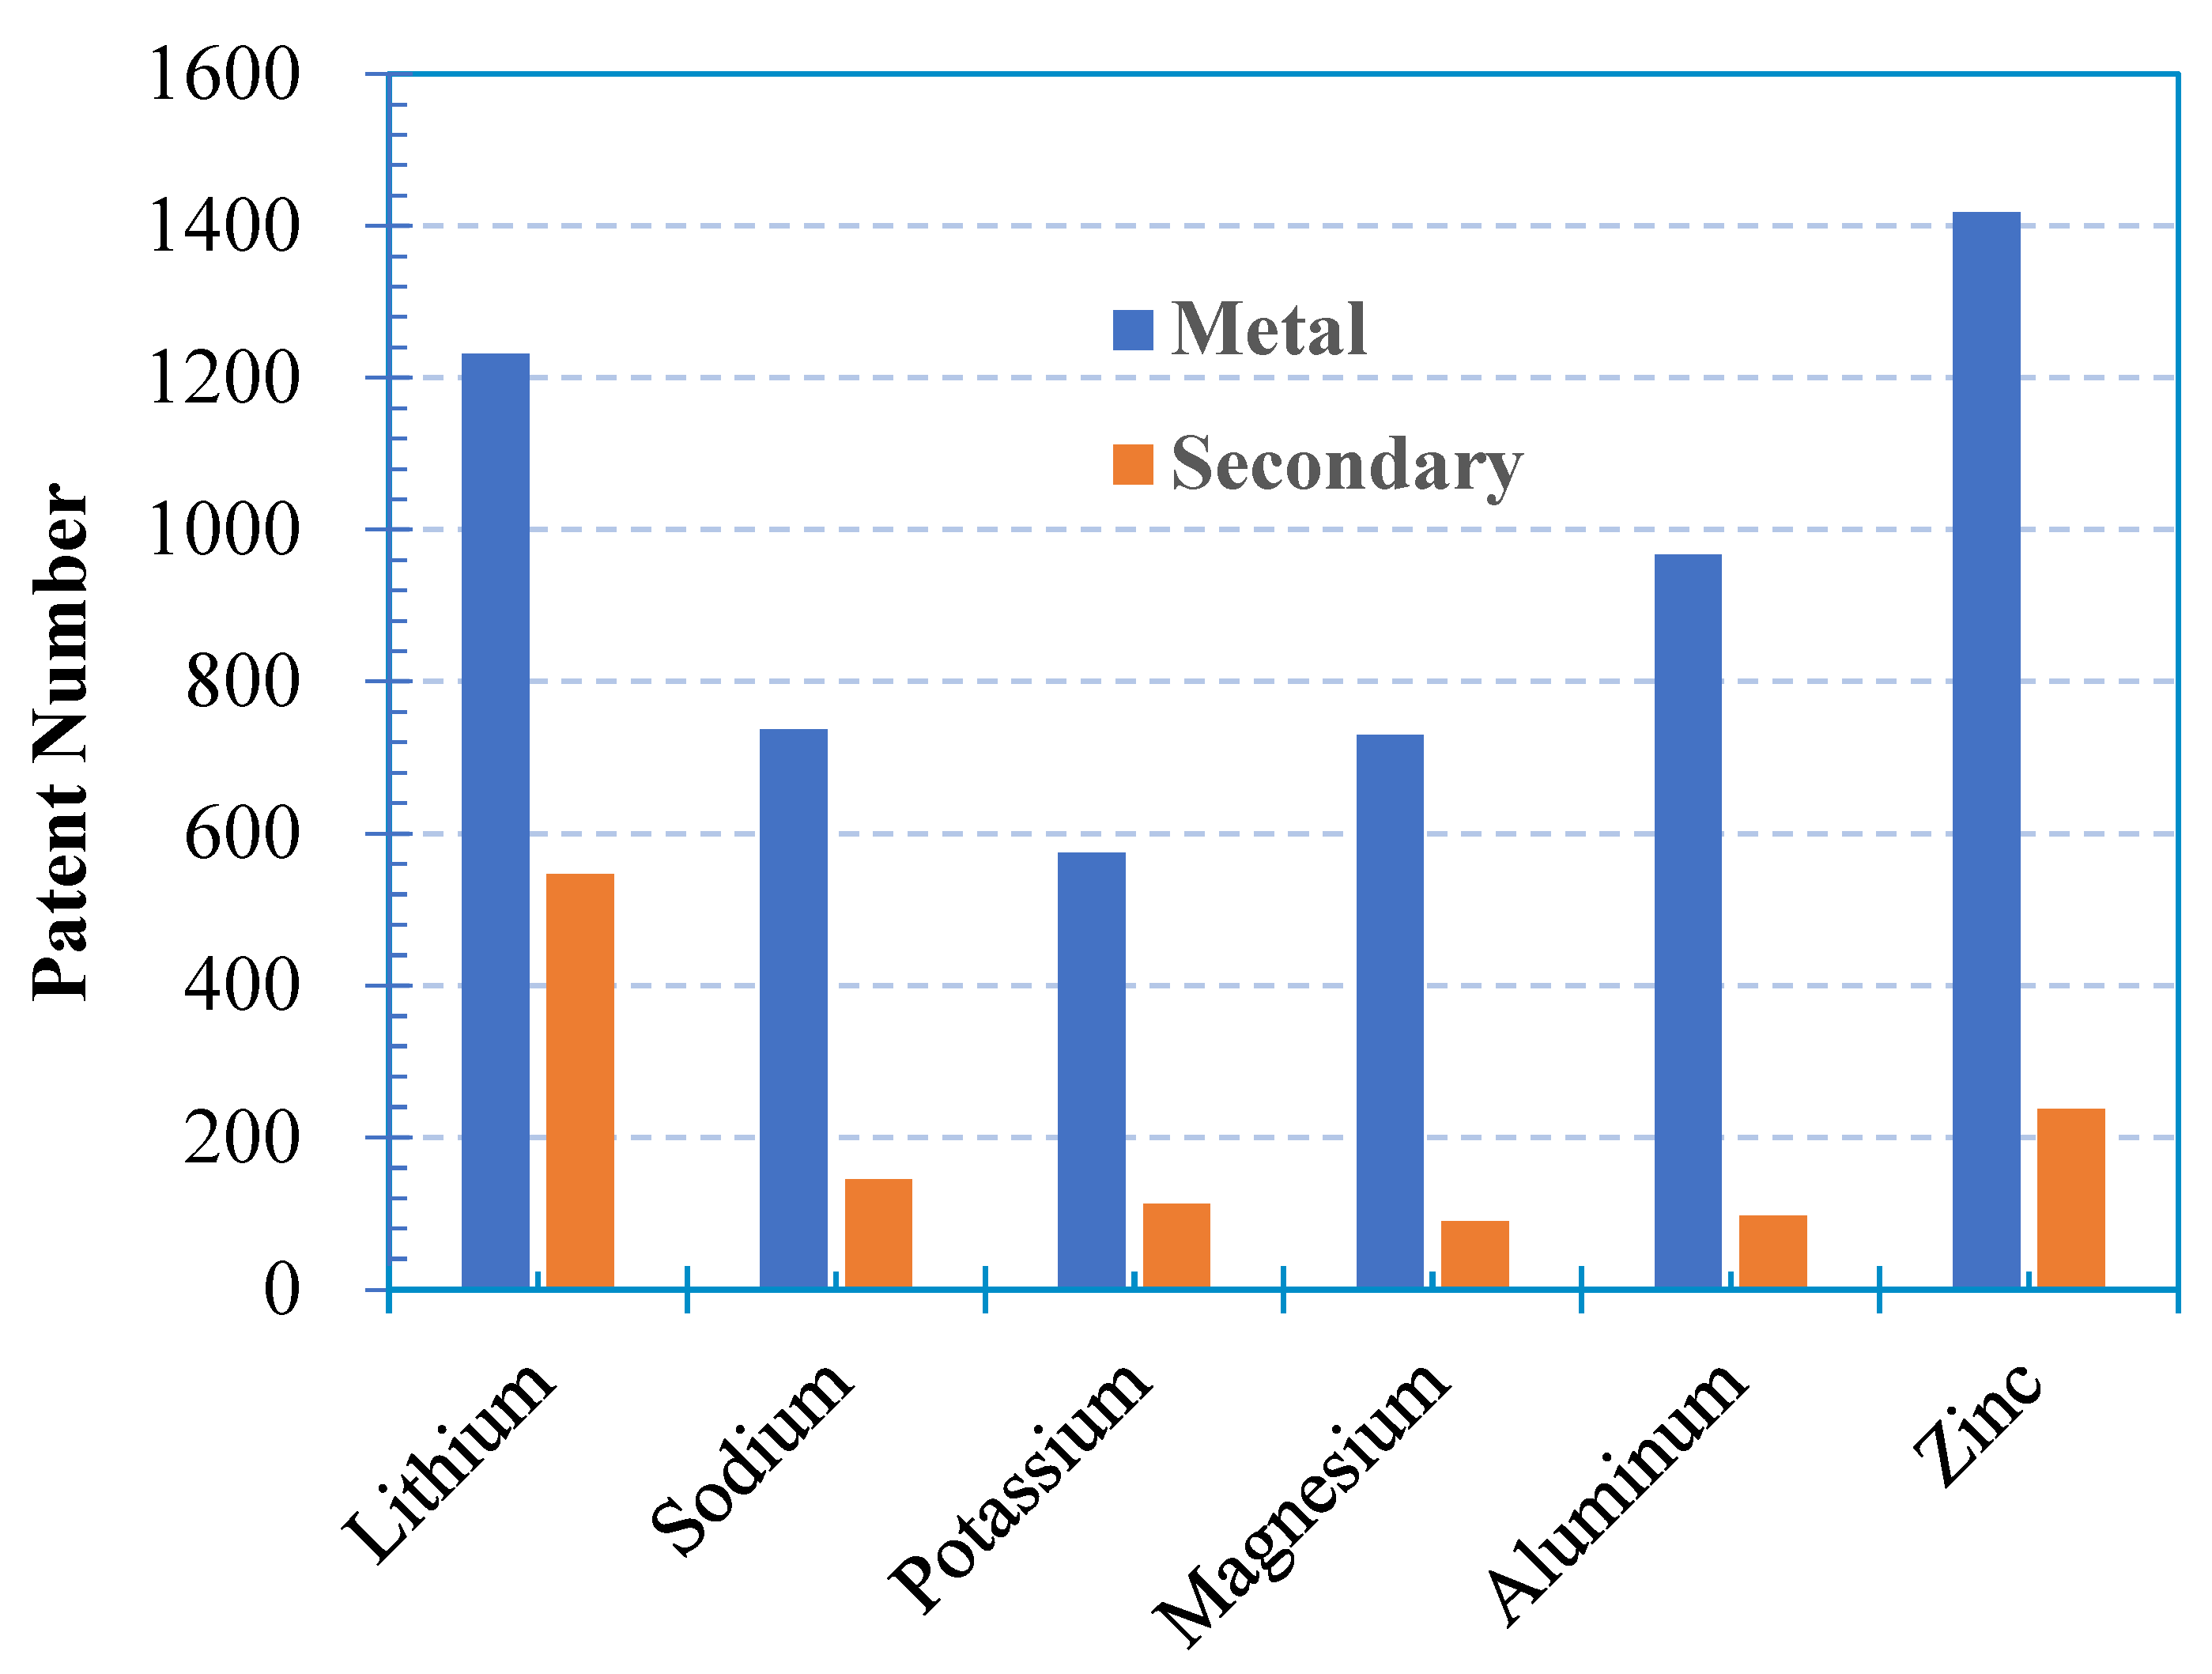
Figure 2.
Power density of Zn-air battery as reported in various papers [24,25,26,27,28,29,30,31,32,33,34,35,36,37,38,39,40,41,42,43,44,45]. Zinc plate and foil were commonly employed in the laboratory investigations.

Figure 3.
The four types of cells used in this study. (a) Cell 1: Close-proximity electrode; (b) Cell 2: Equal-area electrode; (c) Cell 3: Cell from Taipower with large zinc electrode; and (d) Cell 4: Air channel flow.
Figure 3.
The four types of cells used in this study. (a) Cell 1: Close-proximity electrode; (b) Cell 2: Equal-area electrode; (c) Cell 3: Cell from Taipower with large zinc electrode; and (d) Cell 4: Air channel flow.

Figure 4.
Components of cell cross-sections used for computer modeling. (a) Configuration of Cells 1 and 2 used for modeling. (b) Streamline of current flow of Cell 1 and 2. (c) Cell 3 and 4 used for modeling with different anode/cathode distances (2, 4, 8, and 30 mm). The streamline arrows denote current flow in the electrolyte.

Figure 5.
Performance of Cell 1 with 25BC and modified 25BC as ORR electrode: (a) plots of cell voltage versus current density (E-I) curves. (b) plots of power density versus current density (P-I) curve. In figure (a), the dashed curves of condition 1, the E-I curve was calculated using the COMSOL electrolysis module, and a reversible reaction was assumed with the Butler–Volmer equation. Under Condition 2, the electrolysis module was used, and a reversible reaction was assumed with the Butler–Volmer equation. For calculations under Condition 3, the electrochemistry module was used, and an irreversible reaction was assumed with the Butler–Volmer equation.

Figure 6.
The E-I and P-I curves of Cell 2 with 25BC as ORR electrode under natural and forced air convection.
Figure 6.
The E-I and P-I curves of Cell 2 with 25BC as ORR electrode under natural and forced air convection.
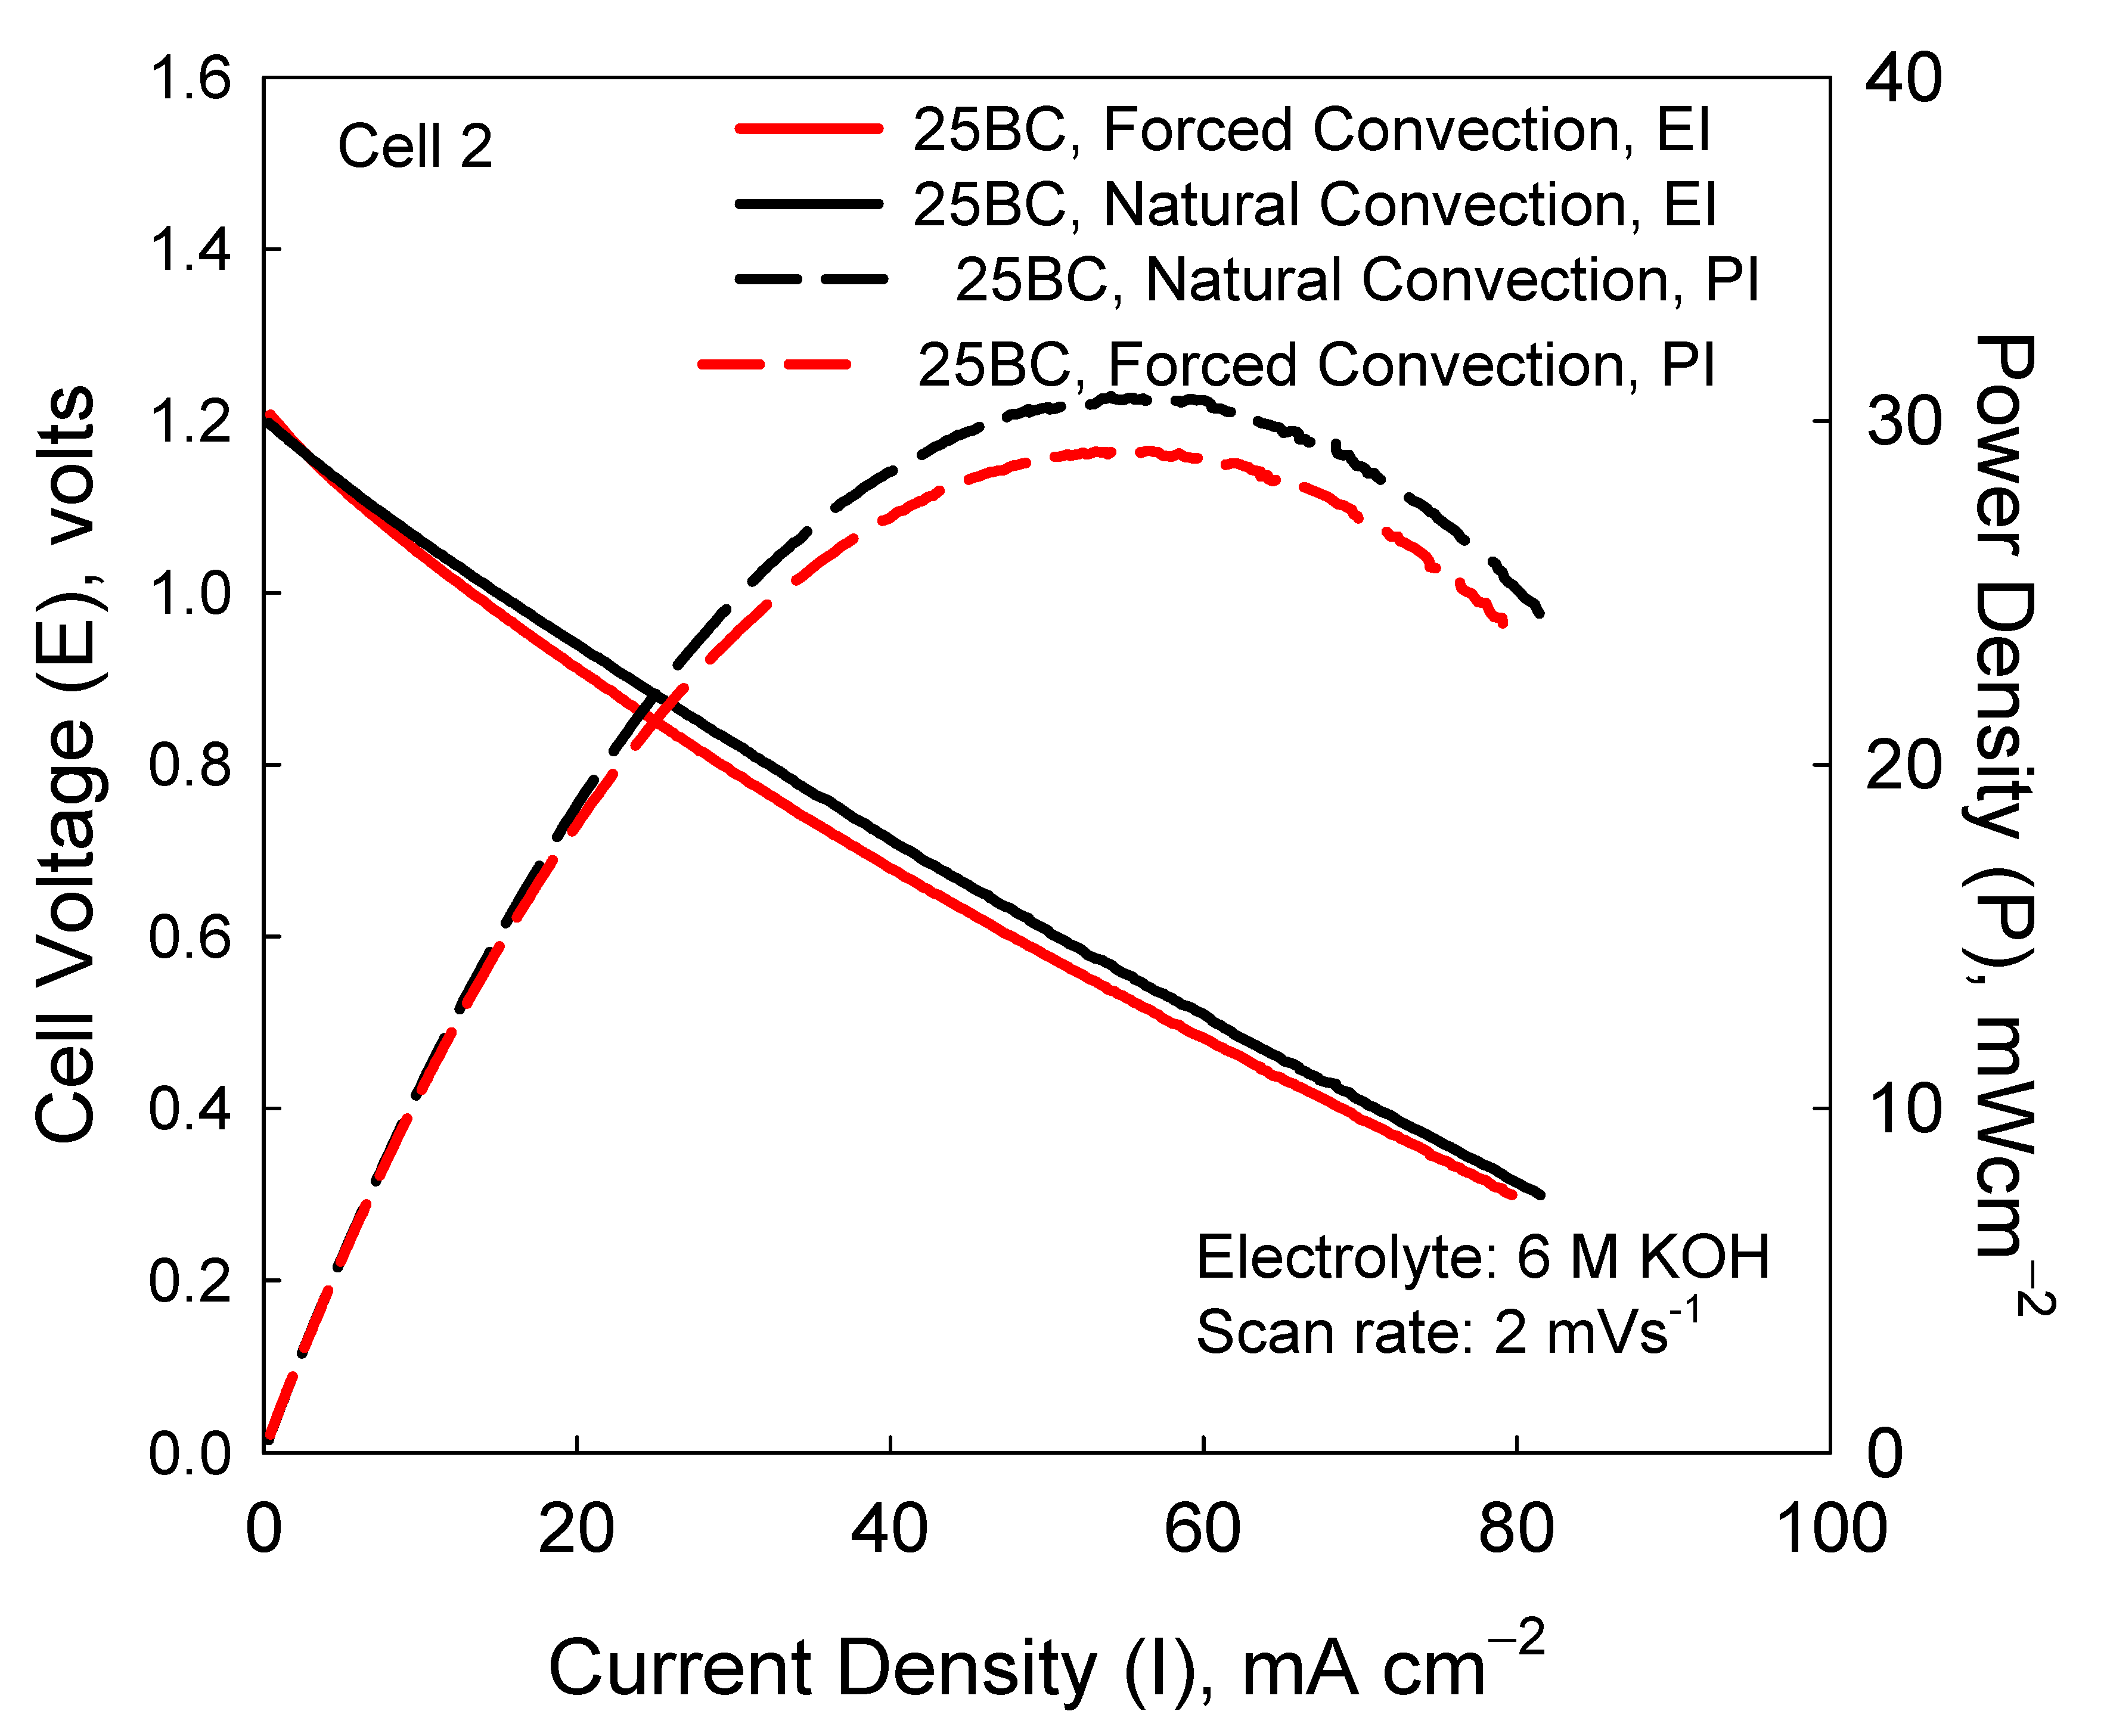
Figure 7.
The E-I and P–I curves of Cell 3: (a) 25BC as ORR electrode and (b) modified 25BC as ORR electrode.
Figure 7.
The E-I and P–I curves of Cell 3: (a) 25BC as ORR electrode and (b) modified 25BC as ORR electrode.
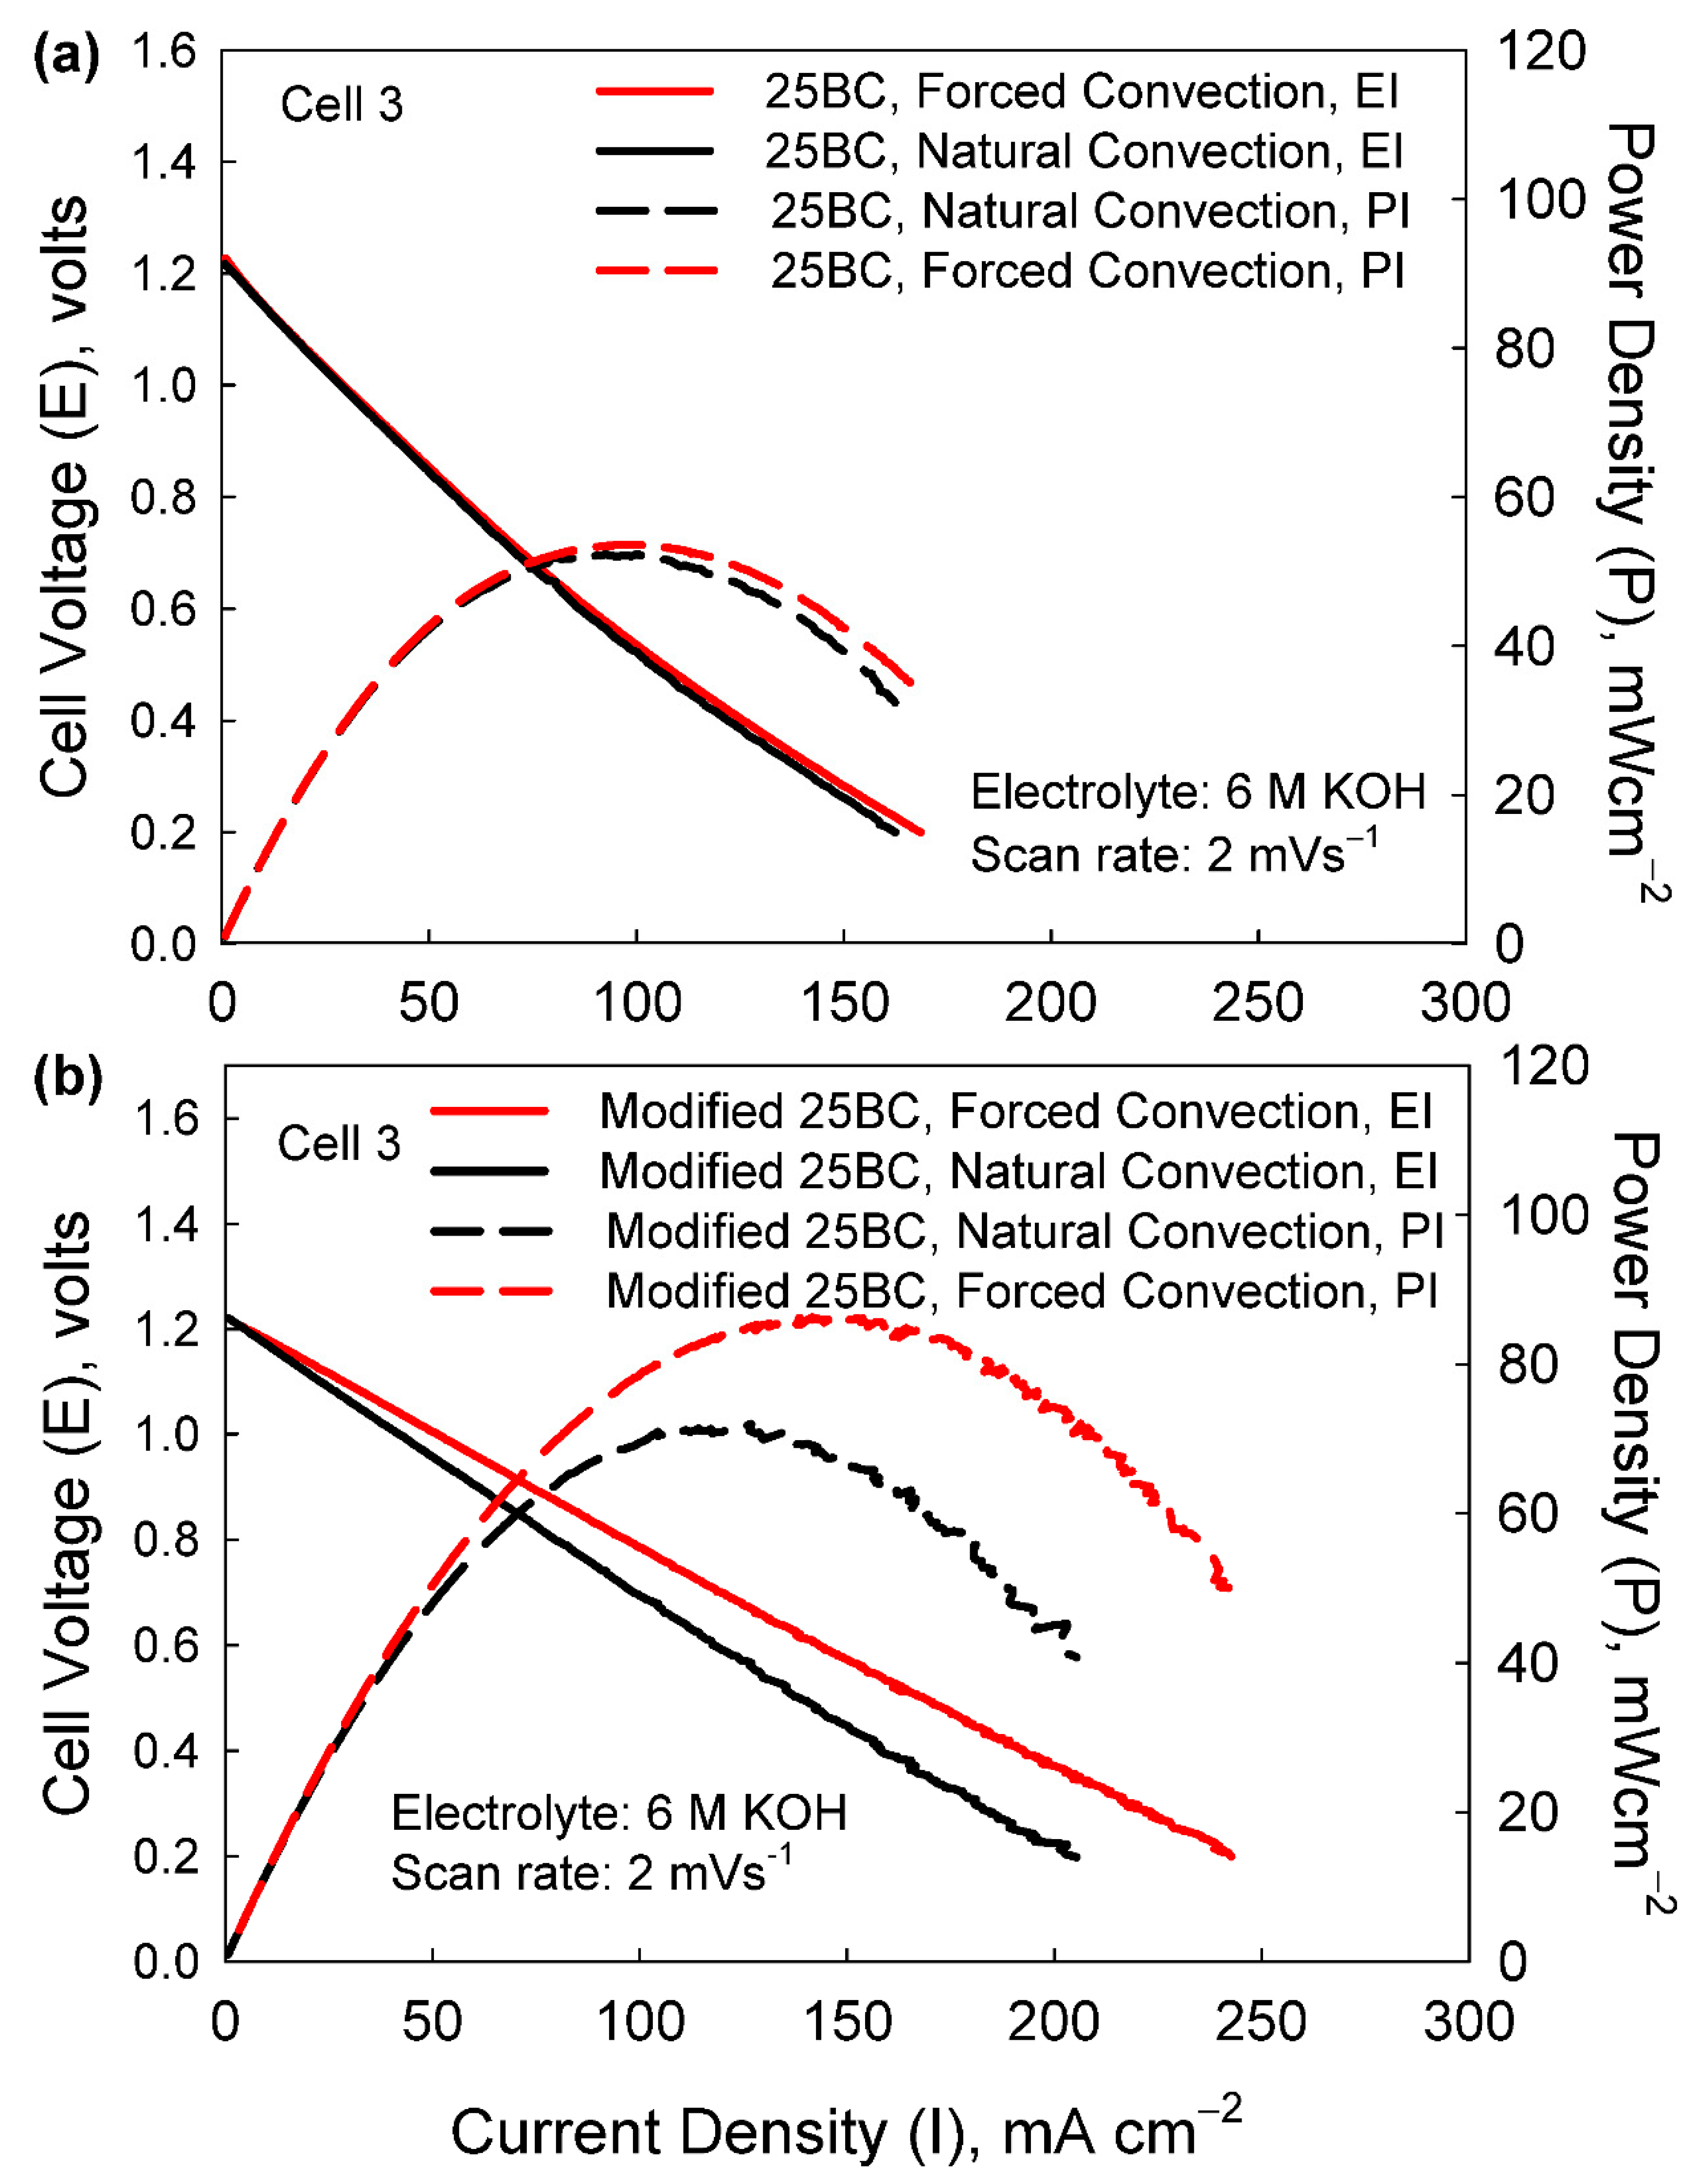
Figure 8.
Plot of Pmax against area ratio of zinc electrode to air electrode in case of Cell 3.
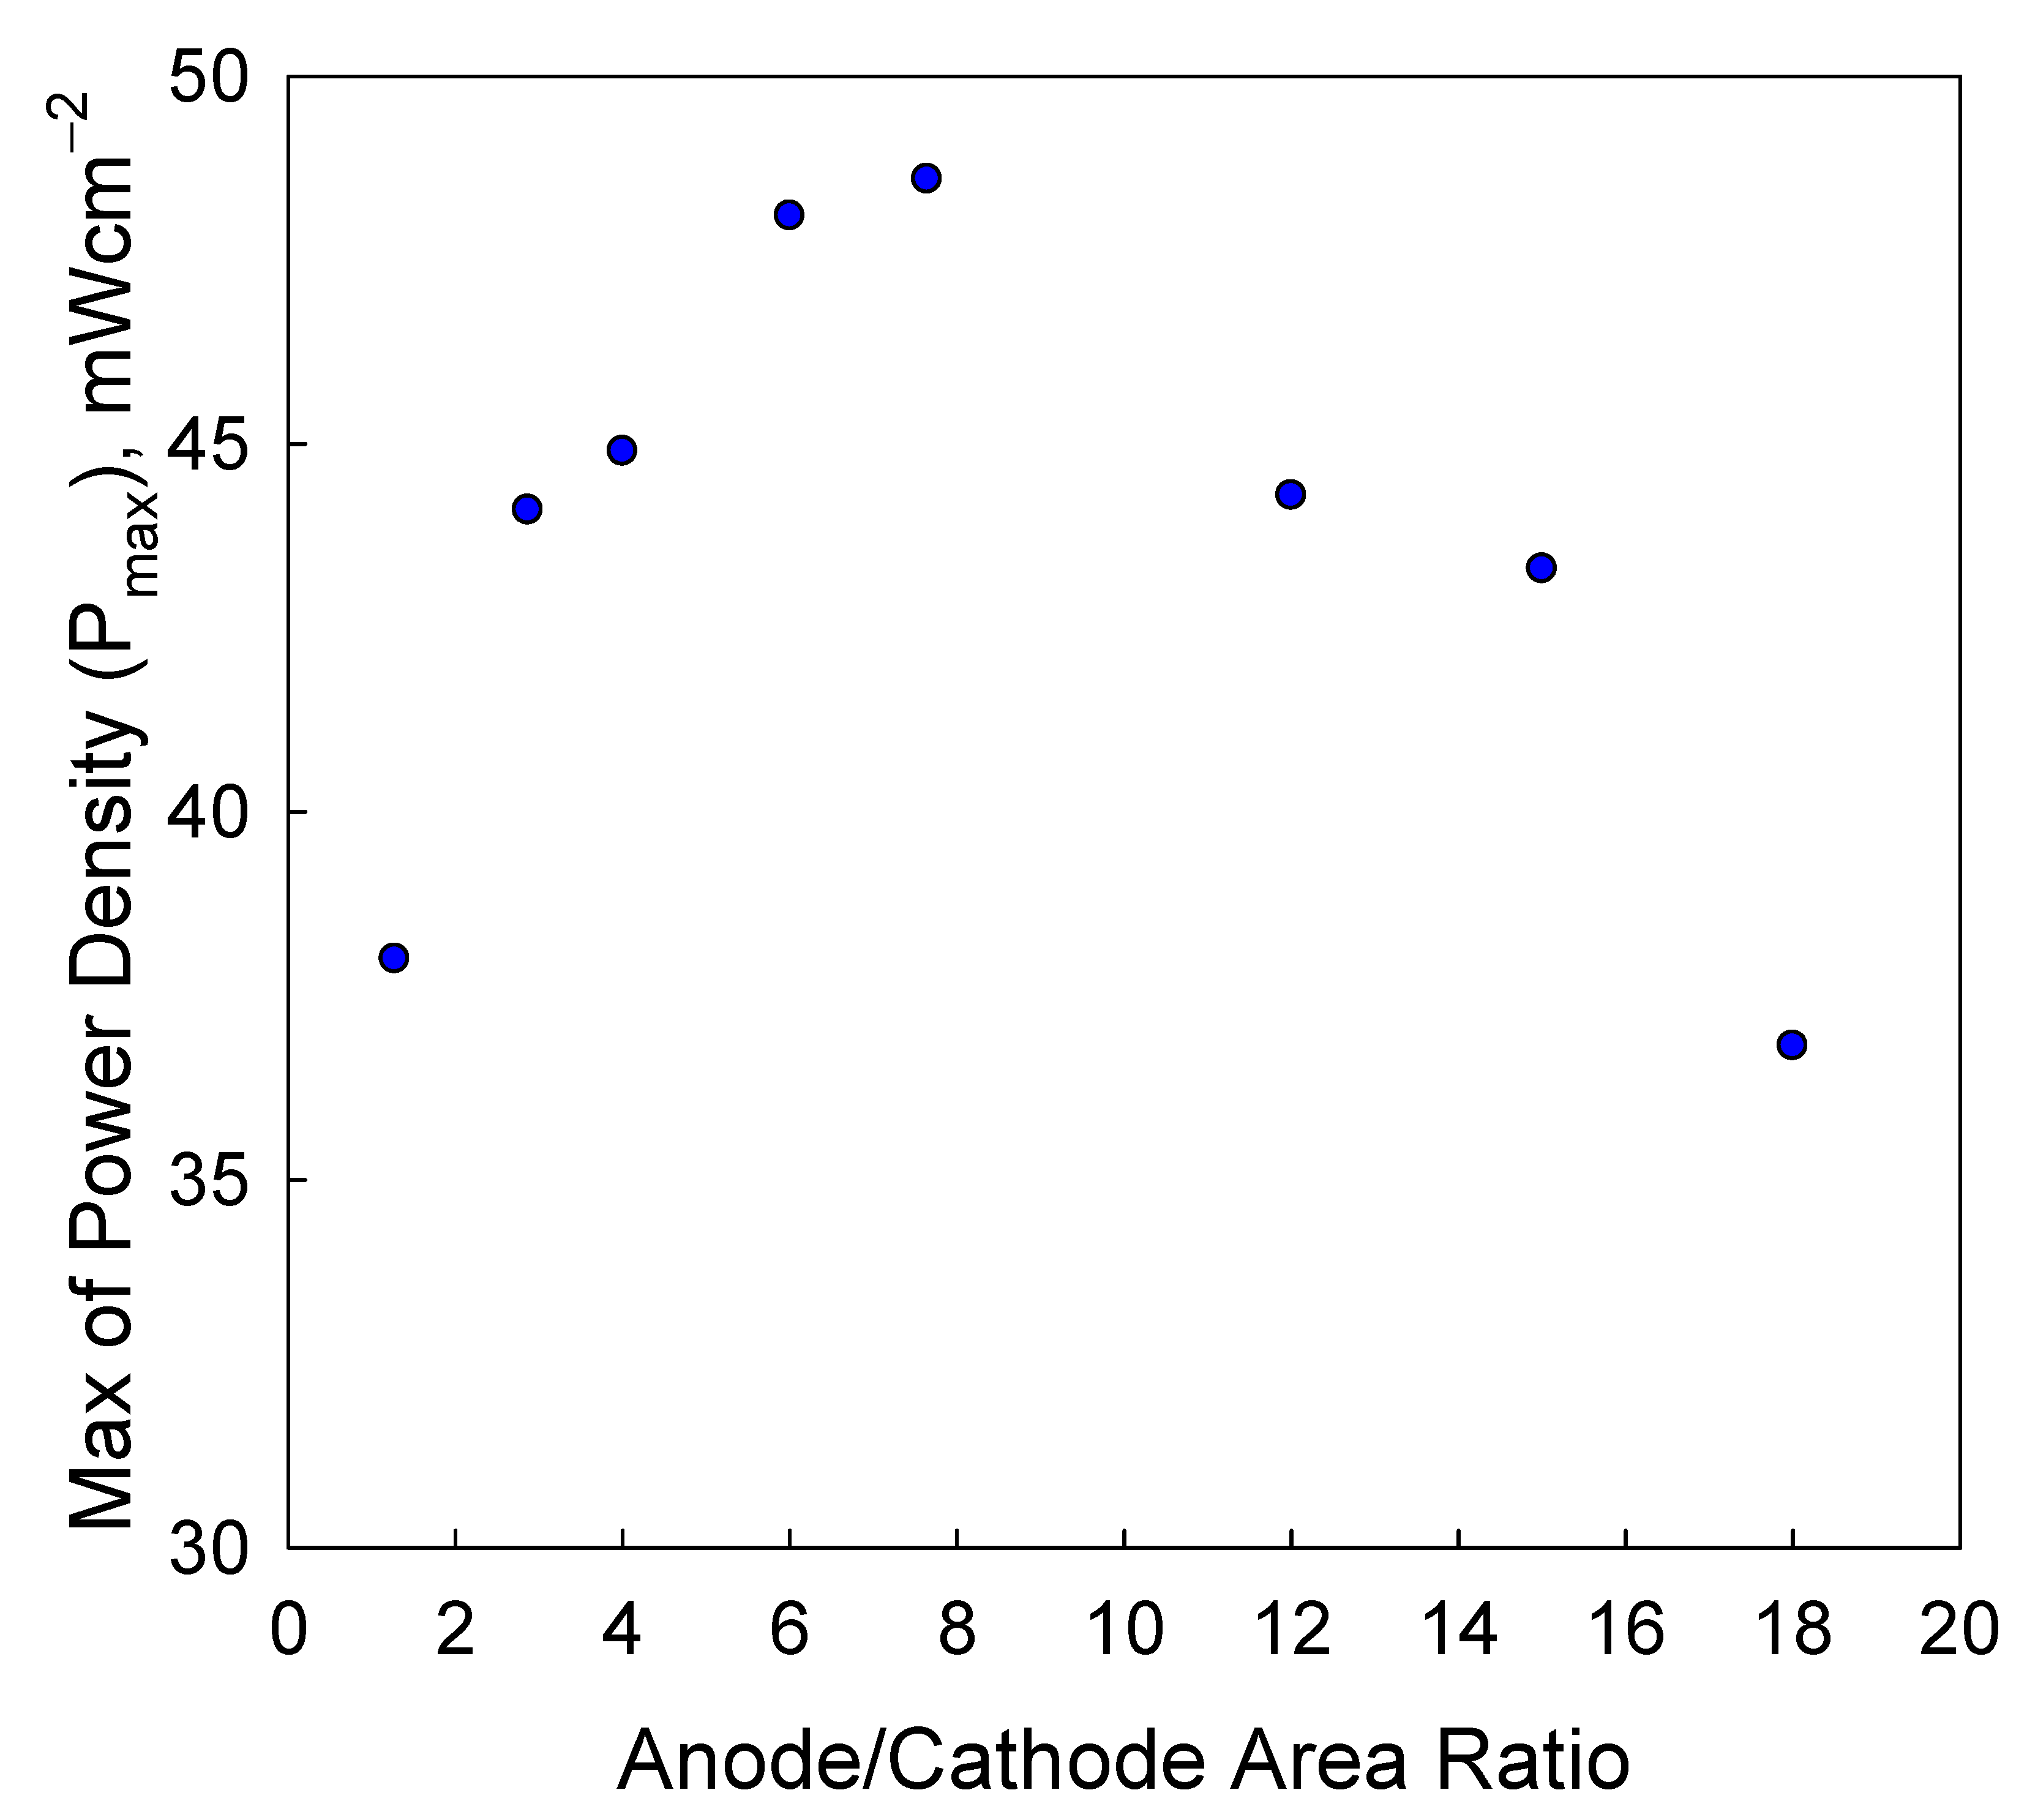
Figure 9.
The E-I and P-I curves of Cells 4a–c with 25BC as the ORR electrode, (a) E-I curves; (b) P-I curves. Three spacers with thicknesses of 0.5, 1.0, and 1.5 cm were used in Cell 4a, 4b, and 4c, respectively.
Figure 9.
The E-I and P-I curves of Cells 4a–c with 25BC as the ORR electrode, (a) E-I curves; (b) P-I curves. Three spacers with thicknesses of 0.5, 1.0, and 1.5 cm were used in Cell 4a, 4b, and 4c, respectively.

Figure 10.
Plot of the anode–cathode distance against internal resistance Rint.


Table 1.
Outline of experimental conditions.
| Factor | Modified ORR Electrode | Forced Air Convection | Anode/Cathode Area Ratio | Anode/Cathode Distance | |
|---|---|---|---|---|---|
| Cell Type | |||||
| Cell 1 | ○ | ○ | △ | ||
| Cell 2 | ○ | ○ | △ | ||
| Cell 3 | ○ | ○ | ○ | △ | |
| Cell 4 | ○ | ○ & △ | |||
Table 2.
Parameter values for linear scanning voltammetry.
| c_bulk | Reactant bulk concentration | 1600 [mmol/L] |
| Cdl | Double layer capacitance | 0.5 [F/m^2] |
| DA | Reactant diffusion coefficient | 3.5 × 10⁻⁹ [m^2/s] |
| DB | Product diffusion coefficient | 3.5 × 10⁻⁹ [m^2/s] |
| E_eqref1 | Equilibrium potential of RXN 1 | 1.25 [V] |
| E_vertex1 | Start potential | 1.3 [V] |
| E_vertex2 | Switching potential | 0.4 [V] |
| i0ref1 | Reference exchange current density of RXN 1 | 1.0 × 10 [A/m^2] |
| K0 | Reaction rate (dimensionless) | 1.00 × 10¹⁰ |
| T | Temperature | 298.15 [K] |
| v | Voltametric scan rate | 0.002 [V/s] |
| L | Outer bound on diffusion layer | 6 × sqrt(DA × 2 × abs(E_vertex1 − E_vertex2)/v) |
| cB0 | Initial product concentration at electrode | c_bulk/(1 + exp(−E_vertex1 × F_const/(R_const × T))) |
| Alpha_a | Anodic charge transfer coefficient | 0.7 |
Table 3.
Parameter values of Cells 1 and 2 for linear scanning voltammetry modeling.
| sigma_l | Electrolyte conductivity 65 S/m 6M KOH | 5.0 × 10² [S/m] |
| T | Temperature | 25 + 273 [K] |
| disp | Cathode displacement in parametric sweep | 0 [mm] |
| a_H | Proton activity | 0.5 × 2 × 180 [g/dm3]/98.1 [g/mol]/(1 [mol/dm3]) |
| c_Zn | Zinc concentration | 50 [g/dm3]/65.4 [g/mol] |
| E_O2 | Equilibrium potential, Oxygen oxidation reaction | 1.229 [V] − R_const × T/(2 × F_const) × log(0.9/(1 × a_H^2)) |
| E_Zn | Equilibrium potential, Zinc reaction | −0.763 [V] − R_const × T/(2 × F_const) × log(1/(0.1 × c_Zn/1 [mol/dm3])) |
| E_H | Equilibrium potential, Hydrogen evolution | 0-R_const × T/(F_const) × log(1/a_H) |
| i0_O2 | Exchange current density, Oxygen oxidation reaction | 0.1 × i0_Zn |
| i0_Zn | Exchange current density, Zinc reaction | −1.0 × 10⁻⁷ [A/m^2] |
| i0_H | Exchange current density, Hydrogen evolution | −1 × 10⁻¹¹ [A/m^2] |
| alphaa_O2 | Anodic transfer coefficient, Oxygen oxidation reaction | 2-alphac_O2 |
| alphac_O2 | Cathodic transfer coefficient, Oxygen oxidation reaction | 0.6 |
| alphaa_Zn | Anodic transfer coefficient, Zinc reaction | 1.1 |
| alphac_Zn | Cathodic transfer coefficient, Zinc reaction | 2-alphaa_Zn |
| phisext | External electric potential | 0.9 [V] |
Table 4.
Area power density and volumetric power density results for comparison.
| Cell | Pmax, mW | Cathode Area (Acathode) cm2 | Pmax/Acathode | Velectrolyte | Pmax/Velectolyte | |||
|---|---|---|---|---|---|---|---|---|
| 25BC | Modified 25BC | 25BC | Modified 25BC | cm3 | 25BC | Modified 25BC | ||
| 1 | 32.0 | 52.6 | 4.0 | 8 | 13.15 | 0.4 | 320.0 | 131.5 |
| 2 | 29.1 | 30.6 | 25.0 | 1.16 | 1.22 | 12.5 | 58.0 | 2.45 |
| 3 | 72.0 | 88.3 | 1.0 | 72.0 | 88.3 | 42.0 | 2.0 | 2.10 |
| 4a | 41.9 | 10.0 | 4.19 | 5.1 | 82.0 | |||
| 4b | 38.5 | 10.0 | 3.85 | 10.2 | 38.0 | |||
| 4c | 28.6 | 10.0 | 2.86 | 15.4 | 19.0 | |||
Publisher’s Note: MDPI stays neutral with regard to jurisdictional claims in published maps and institutional affiliations. |
© 2022 by the authors. Licensee MDPI, Basel, Switzerland. This article is an open access article distributed under the terms and conditions of the Creative Commons Attribution (CC BY) license (https://creativecommons.org/licenses/by/4.0/).
Share and Cite
MDPI and ACS Style
Lu, C.-T.; Zhu, Z.-Y.; Chen, S.-W.; Chang, Y.-L.; Hsueh, K.-L. Effects of Cell Design Parameters on Zinc-Air Battery Performance. Batteries 2022, 8, 92. https://doi.org/10.3390/batteries8080092
AMA Style
Lu C-T, Zhu Z-Y, Chen S-W, Chang Y-L, Hsueh K-L. Effects of Cell Design Parameters on Zinc-Air Battery Performance. Batteries. 2022; 8(8):92. https://doi.org/10.3390/batteries8080092
Chicago/Turabian StyleLu, Cian-Tong, Zhi-Yan Zhu, Sheng-Wen Chen, Yu-Ling Chang, and Kan-Lin Hsueh. 2022. "Effects of Cell Design Parameters on Zinc-Air Battery Performance" Batteries 8, no. 8: 92. https://doi.org/10.3390/batteries8080092
Note that from the first issue of 2016, this journal uses article numbers instead of page numbers. See further details here.