Article

Influence of the Ambient Storage of LiNi0.8Mn0.1Co0.1O2 Powder and Electrodes on the Electrochemical Performance in Li-ion Technology

by
Iratxe de Meatza
1,2,*,
Imanol Landa-Medrano
1,
Susan Sananes-Israel
1,
Aitor Eguia-Barrio
1,
Oleksandr Bondarchuk
3,
Silvia Lijó-Pando
1,
Iker Boyano
1,
Verónica Palomares
2,
Teófilo Rojo
2,
Hans-Jürgen Grande
1,4 and
Idoia Urdampilleta
1
1
CIDETEC, Basque Research and Technology Alliance (BRTA), 20014 Donostia-San Sebastian, Spain
2
Department of Organic and Inorganic Chemistry, Universidad del País Vasco (UPV/EHU), P.O. Box 664, 48080 Bilbao, Spain
3
International Iberian Nanotechnology Laboratory, Av. Mestre José Veiga, s/n, 4715-330 Braga, Portugal
4
POLYMAT, University of the Basque Country, UPV/EHU, Avda. Tolosa 72, 20018 Donostia-San Sebastian, Spain
*
Author to whom correspondence should be addressed.
Batteries 2022, 8(8), 79; https://doi.org/10.3390/batteries8080079
Submission received: 5 July 2022 / Revised: 24 July 2022 / Accepted: 25 July 2022 / Published: 28 July 2022
(This article belongs to the Special Issue Lithium-Ion Batteries Aging Mechanisms, 2nd Edition)

Abstract

:
Nickel-rich LiNi0.8Mn0.1Co0.1O2 (NMC811) is one of the most promising Li-ion battery cathode materials and has attracted the interest of the automotive industry. Nevertheless, storage conditions can affect its properties and performance. In this work, both NMC811 powder and electrodes were storage-aged for one year under room conditions. The aged powder was used to prepare electrodes, and the performance of these two aged samples was compared with reference fresh NMC811 electrodes in full Li-ion coin cells using graphite as a negative electrode. The cells were subjected to electrochemical as well as ante- and postmortem characterization. The performance of the electrodes from aged NM811 was beyond expectations: the cycling performance was high, and the power capability was the highest among the samples analyzed. Materials characterization revealed modifications in the crystal structure and the surface layer of the NMC811 during the storage and electrode processing steps. Differences between aged and fresh electrodes were explained by the formation of a resistive layer at the surface of the former. However, the ageing of NMC811 powder was significantly mitigated during the electrode processing step. These novel results are of interest to cell manufacturers for the widespread implementation of NMC811 as a state-of-the-art cathode material in Li-ion batteries.

1. Introduction

It is already 30 years since the commercialization of the first Li-ion battery allowed the revolution of portable devices that have become an indivisible part of our day-to-day [1]. Laptops, cell phones and other electronic devices would not be as powerful if fed by other energy storage systems such as nickel-cadmium or nickel metal hydride batteries [2]. Nevertheless, Li-ion batteries are nowadays facing a more ambitious challenge: they have been nominated to enable the wide implementation of electric vehicles in our society [3]. Even though their driving range is approximately 400 km for most of the models and most of them are still not able to be charged fast, they fulfill the requirements of a wide sector of the population [4]. In fact, electric vehicle sales have significantly grown in recent years, and their growth is expected to be more prominent in the future [5]. For that aim, it is necessary to increase the energy density of the cells, which are the building blocks of the battery packs powering these electric vehicles [6].
From a materials point of view, anodes in lithium-ion batteries principally consist of graphite as the active material [7]. However, silicon is being included in the formulation, in small fractions, to increase the capacity of the negative electrodes [8]. Indeed, the capacity is 10-fold higher than that of graphite, and the substitution of 10% of the graphite in the electrode by silicon would theoretically double the specific capacity (from ~360 mAh/g of graphite to ~680 mAh/g of 10% Si + 90% graphite) [9]. Moreover, research in anodes is not limited to the adoption of Si in the formulation: lithium metal is the next step on the ladder leading to the increase in energy density [10]. On the cathode side, lithium-ion cells based on the layered LiNixCoyMnzO2 (NMC, with x + y + z = 1) cathode material have gained much interest and have already been implemented in some electric vehicles [11]. Moreover, it has been accepted that as a result of the increase of Ni content in the material, its capacity, as well as its energy density, are increased [12], even though this is usually calculated using a fixed cut-off voltage for the comparison of the different NMC samples, which, in turn, have different Li+ extractions ratios for the same cut-off voltage [13]. Thus, the original LiNi0.3Co0.3Mn0.3O2 (NMC111) has now been overtaken by LiNi0.5Co0.3Mn0.2O2 (NMC532), LiNi0.6Co0.2Mn0.2O2 (NMC622), LiNi0.8Co0.1Mn0.1O2 (NMC811) and ultimately LiNi0.9Co0.05Mn0.05O2 (NMC90505) [14]. While the latter is still beyond state-of-the-art, NMC811 is targeted as the next NMC material for the automotive industry [15]. Nevertheless, the main trade-off of the extra capacity provided by higher nickel content is the decrease in the stability of the NMC811 towards oxidation upon charge [16]. In particular, the occurrence of irreversible reactions at higher potentials with the increase of Ni leads to the formation of an insulating layer at the surface of the NMC particles, the increase of the cell impedance, the evolution of oxygen, the loss of active material and, due to all these factors, the decrease of cycle life of the cells [14]. Thus, material developers are currently focused on optimizing the characteristics and testing conditions of these materials to obtain a successful balance between high energy density and acceptable cycling performance.
The increase of Ni (or, to be more accurate, the decrease of Co) in the material presents another difficulty from a structural point of view. In the crystal structure of NMC, Co3+ is placed in the center of the hexagon, surrounded by Ni and Mn atoms [17]. The decrease of Co content in the material favors the mixing of Ni and Li upon delithiation in a phenomenon known as cation mixing [18]. This occurs because the sizes of Ni2+ (0.69 Å) and Li+ (0.76 Å) are similar [19]. Thus, Li cations are trapped at the atomic positions where nickel ions should be located. Doping of the NMC has been suggested as a possible solution to minimize cation mixing [20]. Other alternatives involve the overlithiation of NMC or the decrease of its nickel content [17]. Finally, stability issues with high-nickel NMCs are not limited to the cycling stage. It has been observed that these materials are sensitive to exposure to ambient moisture, with higher instability caused by the increase of Ni content [21]. Indeed, the analysis of NMC stability towards ambient storage has been a research topic that has attracted the interest of many research groups in recent years. Jung et al. analyzed the influence of ambient storage on NMC811 using electrochemical cycling, Raman spectroscopy and X-ray photoelectron spectroscopy [22]. They observed the formation of a significant amount of nickel carbonate on the surface of the aged NMC811, which compromised the cycling stability of the cells based on this electrode. The formation of carbonates upon ambient storage was further analyzed by Sicklinger et al. [23]. In their work, NMC111 and NMC811 were aged in the same conditions and the surface contaminants formed (carbonates and hydroxides) were quantified by means of thermogravimetric analysis coupled with mass spectroscopy. Interestingly, they demonstrated that the impurities formed could be partially removed from the aged samples when they were subjected to a thermal treatment. In a recent study, Busà et al. [12] exposed NMC811 electrodes to different degrees of humidity. They evidenced that after 28 days of air exposure, the formation of lithium hydroxide and carbonate on the NMC surface significantly limited the cycling stability of the cells due to the decrease in the electronic and ionic conductivity of the aged samples.
In all these works, aging was performed in the electrodes, while the influence of processing ambient-stored NMC811 powder was not discussed. Furthermore, it is not trivial for the industry to investigate the conditions in which high-nickel NMC powder and electrodes can be stored. This has motivated the present study. In this work, NMC811 was exposed to ambient air for 1 year, and electrodes were prepared by processing this powder. In parallel, electrodes were also prepared with fresh NMC811. Furthermore, electrodes prepared with fresh-NMC were also ambient-air exposed for 1 year. To sum up, this study compared fresh-NMC electrodes (fresh), NMC electrodes subjected to ambient storage (aged-electrodes) and electrodes prepared with aged NMC powder (aged-NMC). These electrodes were subjected to galvanostatic cycling, power tests, electrochemical impedance spectroscopy (EIS) and different materials characterization techniques.

2. Materials and Methods

2.1. Electrode Preparation

NMC811 (T81R from Targray) was used as the active material in the positive electrode. The other two materials in the positive electrode were PVDF (Polyvinylidene fluoride, PVDF Solef® 5130) as the binder and carbon black (C-NERGY Super C65 from IMERYS Carbon & Graphite) as the conductive additive. A PVDF in N-methyl pyrrolidone (NMP) solution was initially prepared. Then, C65 was added while stirring. Finally, NMC811 was included in the solution, and the slurry was cast onto aluminum foil (acquired from Hydro, 20 μm thick) at Cidetec’s electrode manufacturing line. The loading of the coating was 20 mg/cm2 (4.0 mAh/cm2 calculated using 190 mAh/g as the capacity of NMC811, based on the datasheet of the material). After drying, the electrodes were calendered to 3.0 g/cm3 (37% porosity) at room temperature. The electrode formulation was 95% NMC811, 3% PVDF and 2% C65.
The positive electrodes consisting of the aged NMC were prepared at a laboratory scale due to the low amount of material subjected to aging, which was not enough to work at the pilot plant scale. The slurry preparation method was the same as for the rest of the samples, but the coating of the current collector was conducted using a laboratory-scale doctor blade. The mass loading and the electrode density were the same for these electrodes and the electrodes prepared at the coating line. Despite different coating scales, FE-SEM imaging displayed no remarkable difference in the morphology of these electrodes (Figure S1).
The negative electrode consisted of graphite (MEG-2C, SGL Carbon) as the active material, carbon black (C-NERGY Super C45 from IMERYS Carbon & Graphite) as the conductive additive, carboxymethylcellulose (CMC, Walocel 2000 from DOW) as a disperser and thickener and Styrene-Butadiene Rubber (SBR, BM-451B from ZEON) as the binder. CMC was initially dispersed in water, and C45 was added to this dispersion under stirring. Later, graphite and SBR were subsequently added to the solution. The slurry was cast onto copper foil (Furukawa, 8 μm thick), dried and calendered at Cidetec’s pilot plant facilities at room temperature. The electrode loading and final densities were 13 mg/cm2 (4.4 mAh/cm2, based on the datasheet of the material) and 1.45 g/cm3 (35% porosity), respectively. The electrode formulation was 94% graphite, 2% C45, 2% CMC and 2% SBR.

2.2. Aging of the Electrodes/Materials

Two different aging procedures were analyzed in the current study. On the one hand, NMC powder was stored under ambient air for 1 year at ~55% relative humidity and 15–25 °C and processed later to obtain electrodes with aged NMC (hereafter referred to as Aged-NMC). On the other hand, a coating prepared with fresh NMC was subjected to exposure to ambient air for one year, and after this period, electrodes were cut, vacuum dried (120 °C and 10 mbar for 16 h) and tested (hereafter Aged-electrode). The cells aged under these conditions were compared with NMC electrodes not subjected to aging (hereafter fresh). The same NMC811 batch was used during all the studies. NMC “fresh” powder and NMC fresh electrodes were stored and sealed in a dry room (dew point = −40 °C) to avoid aging from the ambient humidity.

2.3. Assembly of Coin Cells

Ø = 17.7 and 16.6 mm disks were punched with a high precision disk cutter from the graphite and NMC coatings, respectively. These electrodes were dried for 16 h at 120 °C under a vacuum (10 mbar) prior to the assembly of the coin cells (CR2025, Hohsen). On the other hand, the covers of the coin cells were cleaned with ethanol in an ultrasonic bath for 15 min and dried at 60 °C for 1 h. The coin cells were assembled with a separator (18.92 mm diameter glass fiber, Albet GF 52) and 100 µL of electrolyte solution 1 mol/L Lithium hexafluorophosphate in (1:1 vol.%) ethylene carbonate:dimethyl carbonate + 2 wt.% vinylene carbonate–99.9% (1 M LiPF6 in EC:DMC (1:1) + 2% VC) purchased from Solvionic was added. Cell assembly was conducted in dry-room facilities (dew point = −40 °C).

2.4. Electrochemical Testing

The cells were tested at 25 ± 1 °C inside a room controlled with air conditioning. All the cells were initially formed at C/20 C-rate between 4.2 and 2.8 V. A constant voltage (CV) step until C/40 was included. Then, three cells per type of positive electrode were subjected to each of the two different test plans. The first one consisted of a charge to 30% of State of Charge (SOC) and an impedance scan. Later, they were cycled at C/3 until reaching 80% of State of Health (SOH). In this case, the charge consisted of the CV step (to C/10) following the constant current step. During this galvanostatic cycling, periodical checkup tests were conducted. These tests consisted of a single cycle at C/20 used to perform a differential capacity analysis (dQ/dV) and a subsequent charge to 50% of SOC. At this stage of charge, a discharge pulse at 1C (0.19 A/gNMC) was applied for 30 s in order to calculate the DC resistance on the basis of Ohm’s law. Finally, cells were charged to 100% SOC and C/3 galvanostatic cycling was continued. After reaching 80% SOH, the cells were charged to 30% SOC and subjected to EIS analysis. This electrochemical testing protocol was also followed and described in previous work [24]. After EIS experiments, the cells were subjected to postmortem analysis.
The second testing protocol consisted of a power test. The cells were charged to 50% of SOC and subjected to different discharge C-rates: 1C, 3C, 5C, 8C, 10C, 12C, 15C, 17C and 20C. These pulses were limited by time (10 s) and voltage (2.8 V).
Galvanostatic experiments were conducted using a BaSyTec CTS Battery Test System. Furthermore, electrochemical impedance spectroscopy measurements were performed using a Potentiostat/Galvanostat PGSTAT30 equipped with a Frequency Response Analyzer (FRA2, N4L). Impedance spectra were fitted using Zview software version 3.5f (Scribner). Spectra were obtained between 106 and 10−2 Hz with a perturbation amplitude of 10 mV at the beginning- and end-of-life of the cells.

2.5. Postmortem Characterization

After reaching 80% SOH, setting the cells at 30% SOC and conducting the EIS analyses, the cells were introduced in an Ar-filled glove box (MBraun) and disassembled inside ([O2] < 0.1 ppm, [H2O] < 0.5 ppm). The electrodes were thoroughly cleaned inside the glove box using dimethyl carbonate to remove the salts from the electrolyte. Afterwards, they were dried and sealed in bags to minimize their exposition to ambient air before their corresponding analysis. The positive electrodes were analyzed by means of X-ray diffraction (XRD), field emission scanning electron microscopy (FE-SEM) and X-ray photoelectron spectroscopy (XPS).
The crystal structure of the NMC electrodes after cycling, as well as before and after the aging protocols in electrode and powder forms, was analyzed by XRD using a Bruker D8 Discover diffractometer (Cu Kα radiation, λ = 0.154 nm) equipped with a LynxEye PSD detector. The diffractograms were recorded between 2θ = 10° and 85° at 0.003° s−1, while the obtained data were fitted by means of the Pattern Matching method using the FULLPROF program [25]. The morphology of the same electrodes and powders was characterized by field emission scanning electron microscopy (FE-SEM, ULTRA plus ZEISS). The samples were prepared in the lab and stuck to the holder using carbon adhesive tape. FE-SEM micrographs at different magnifications (from ×200 to ×20,000) were obtained. In addition, the composition of the sample was confirmed using energy-dispersive X-ray spectroscopy (EDX). The XPS spectra of the same samples were collected at pass energies of 200 eV and 20 eV for survey spectra and individual elements, respectively. Charge neutralization was achieved with both low-energy electron and argon ion flood guns (0.5 eV, 100 μA and 70 μA current, respectively) during XPS measurements. The XPS spectra were peak-fitted using Avantage processing software (Thermo Fisher Scientific—East Grinstead, United Kingdom). The Lorentzian/Gaussian line shape and “Smart” background subtraction were used for peak fitting. Quantification was carried out using sensitivity factors provided by the Avantage’s library. Elemental composition depth profiling was carried out by means of the ion source (MAGCIS, Thermo Fisher Scientific) operated in monoatomic mode with beam energy 500 eV, current 0.9 μA. The sputtering rate established for Ta2O5 film was 0.045 nm/sec. The Ar+ beam was raster-scanned over a 2 mm × 2 mm area.

3. Results and Discussion

3.1. Electrochemical Experiments

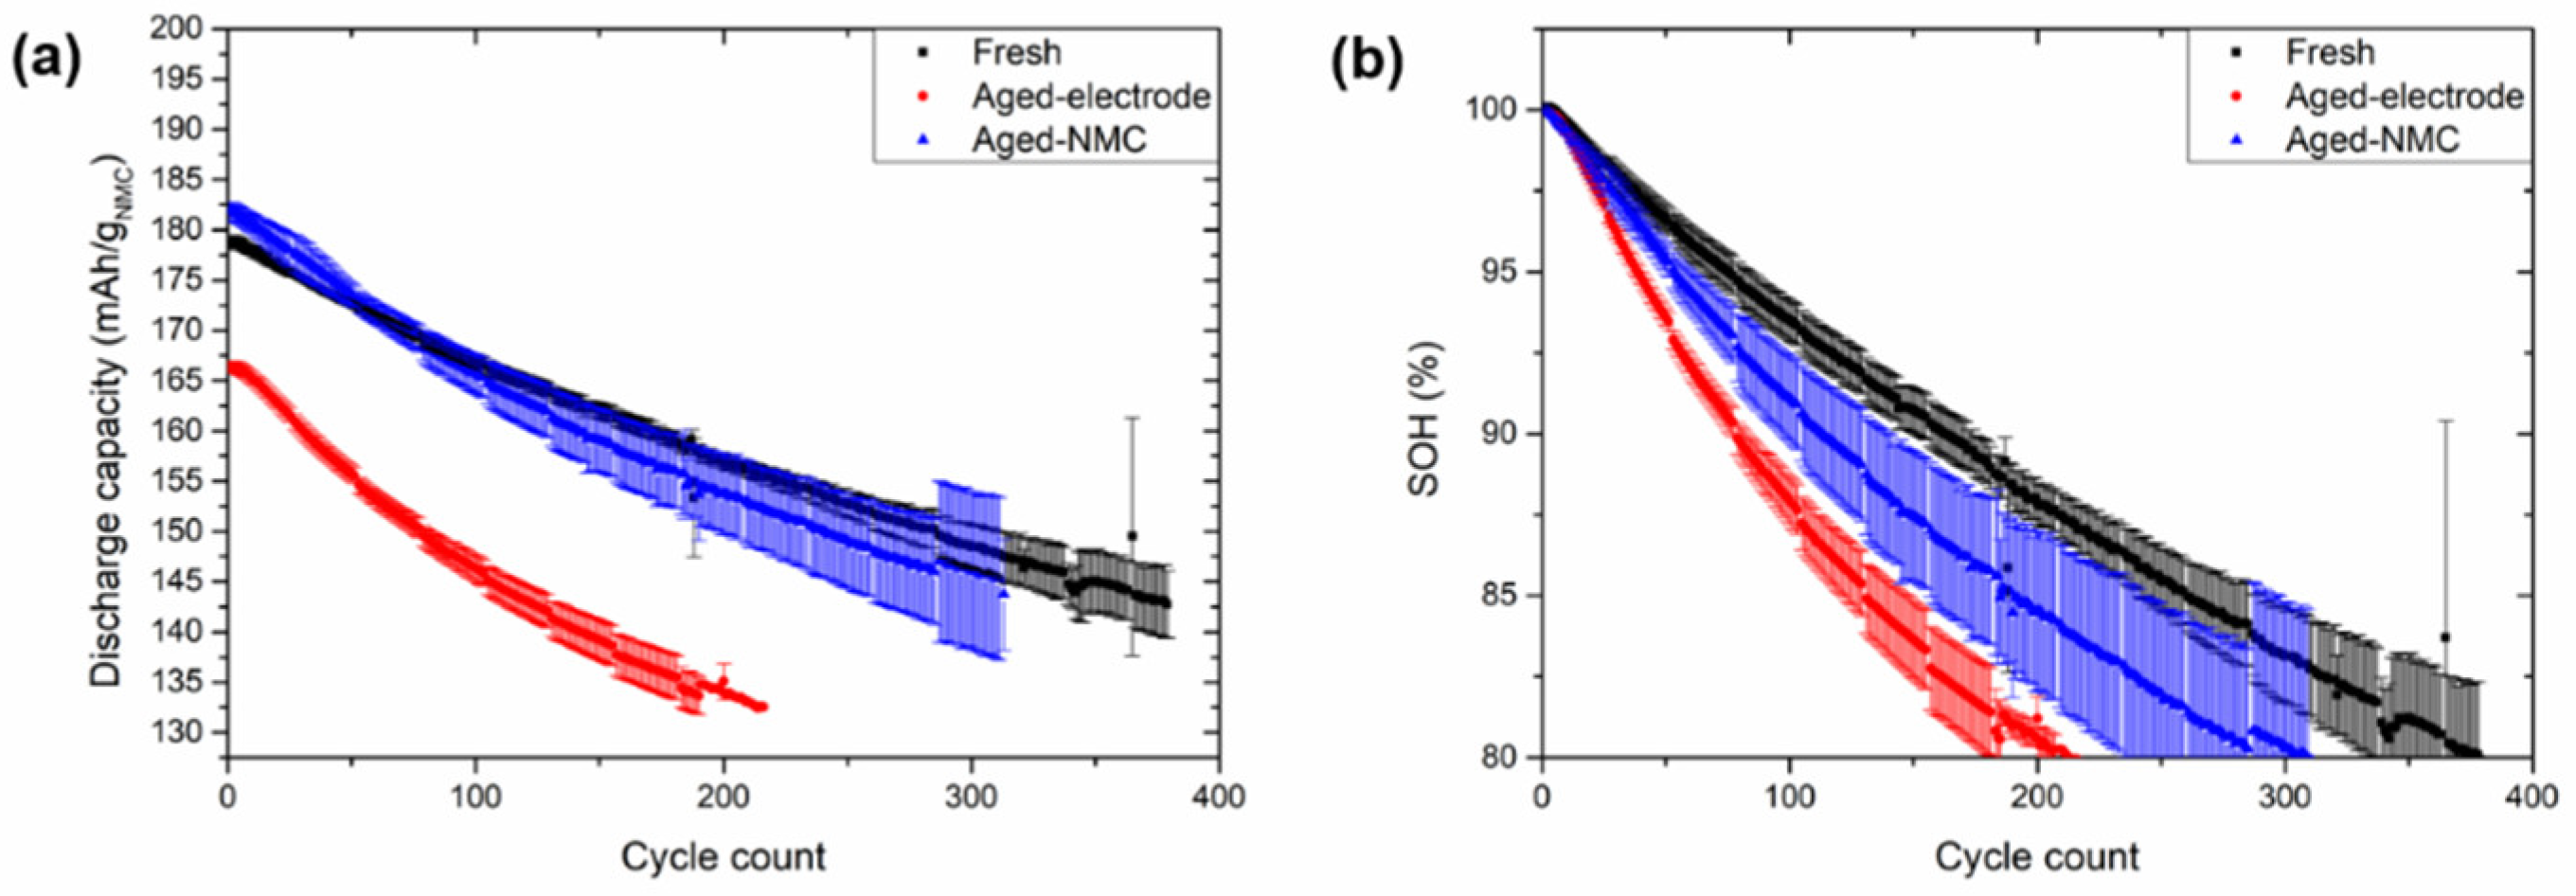
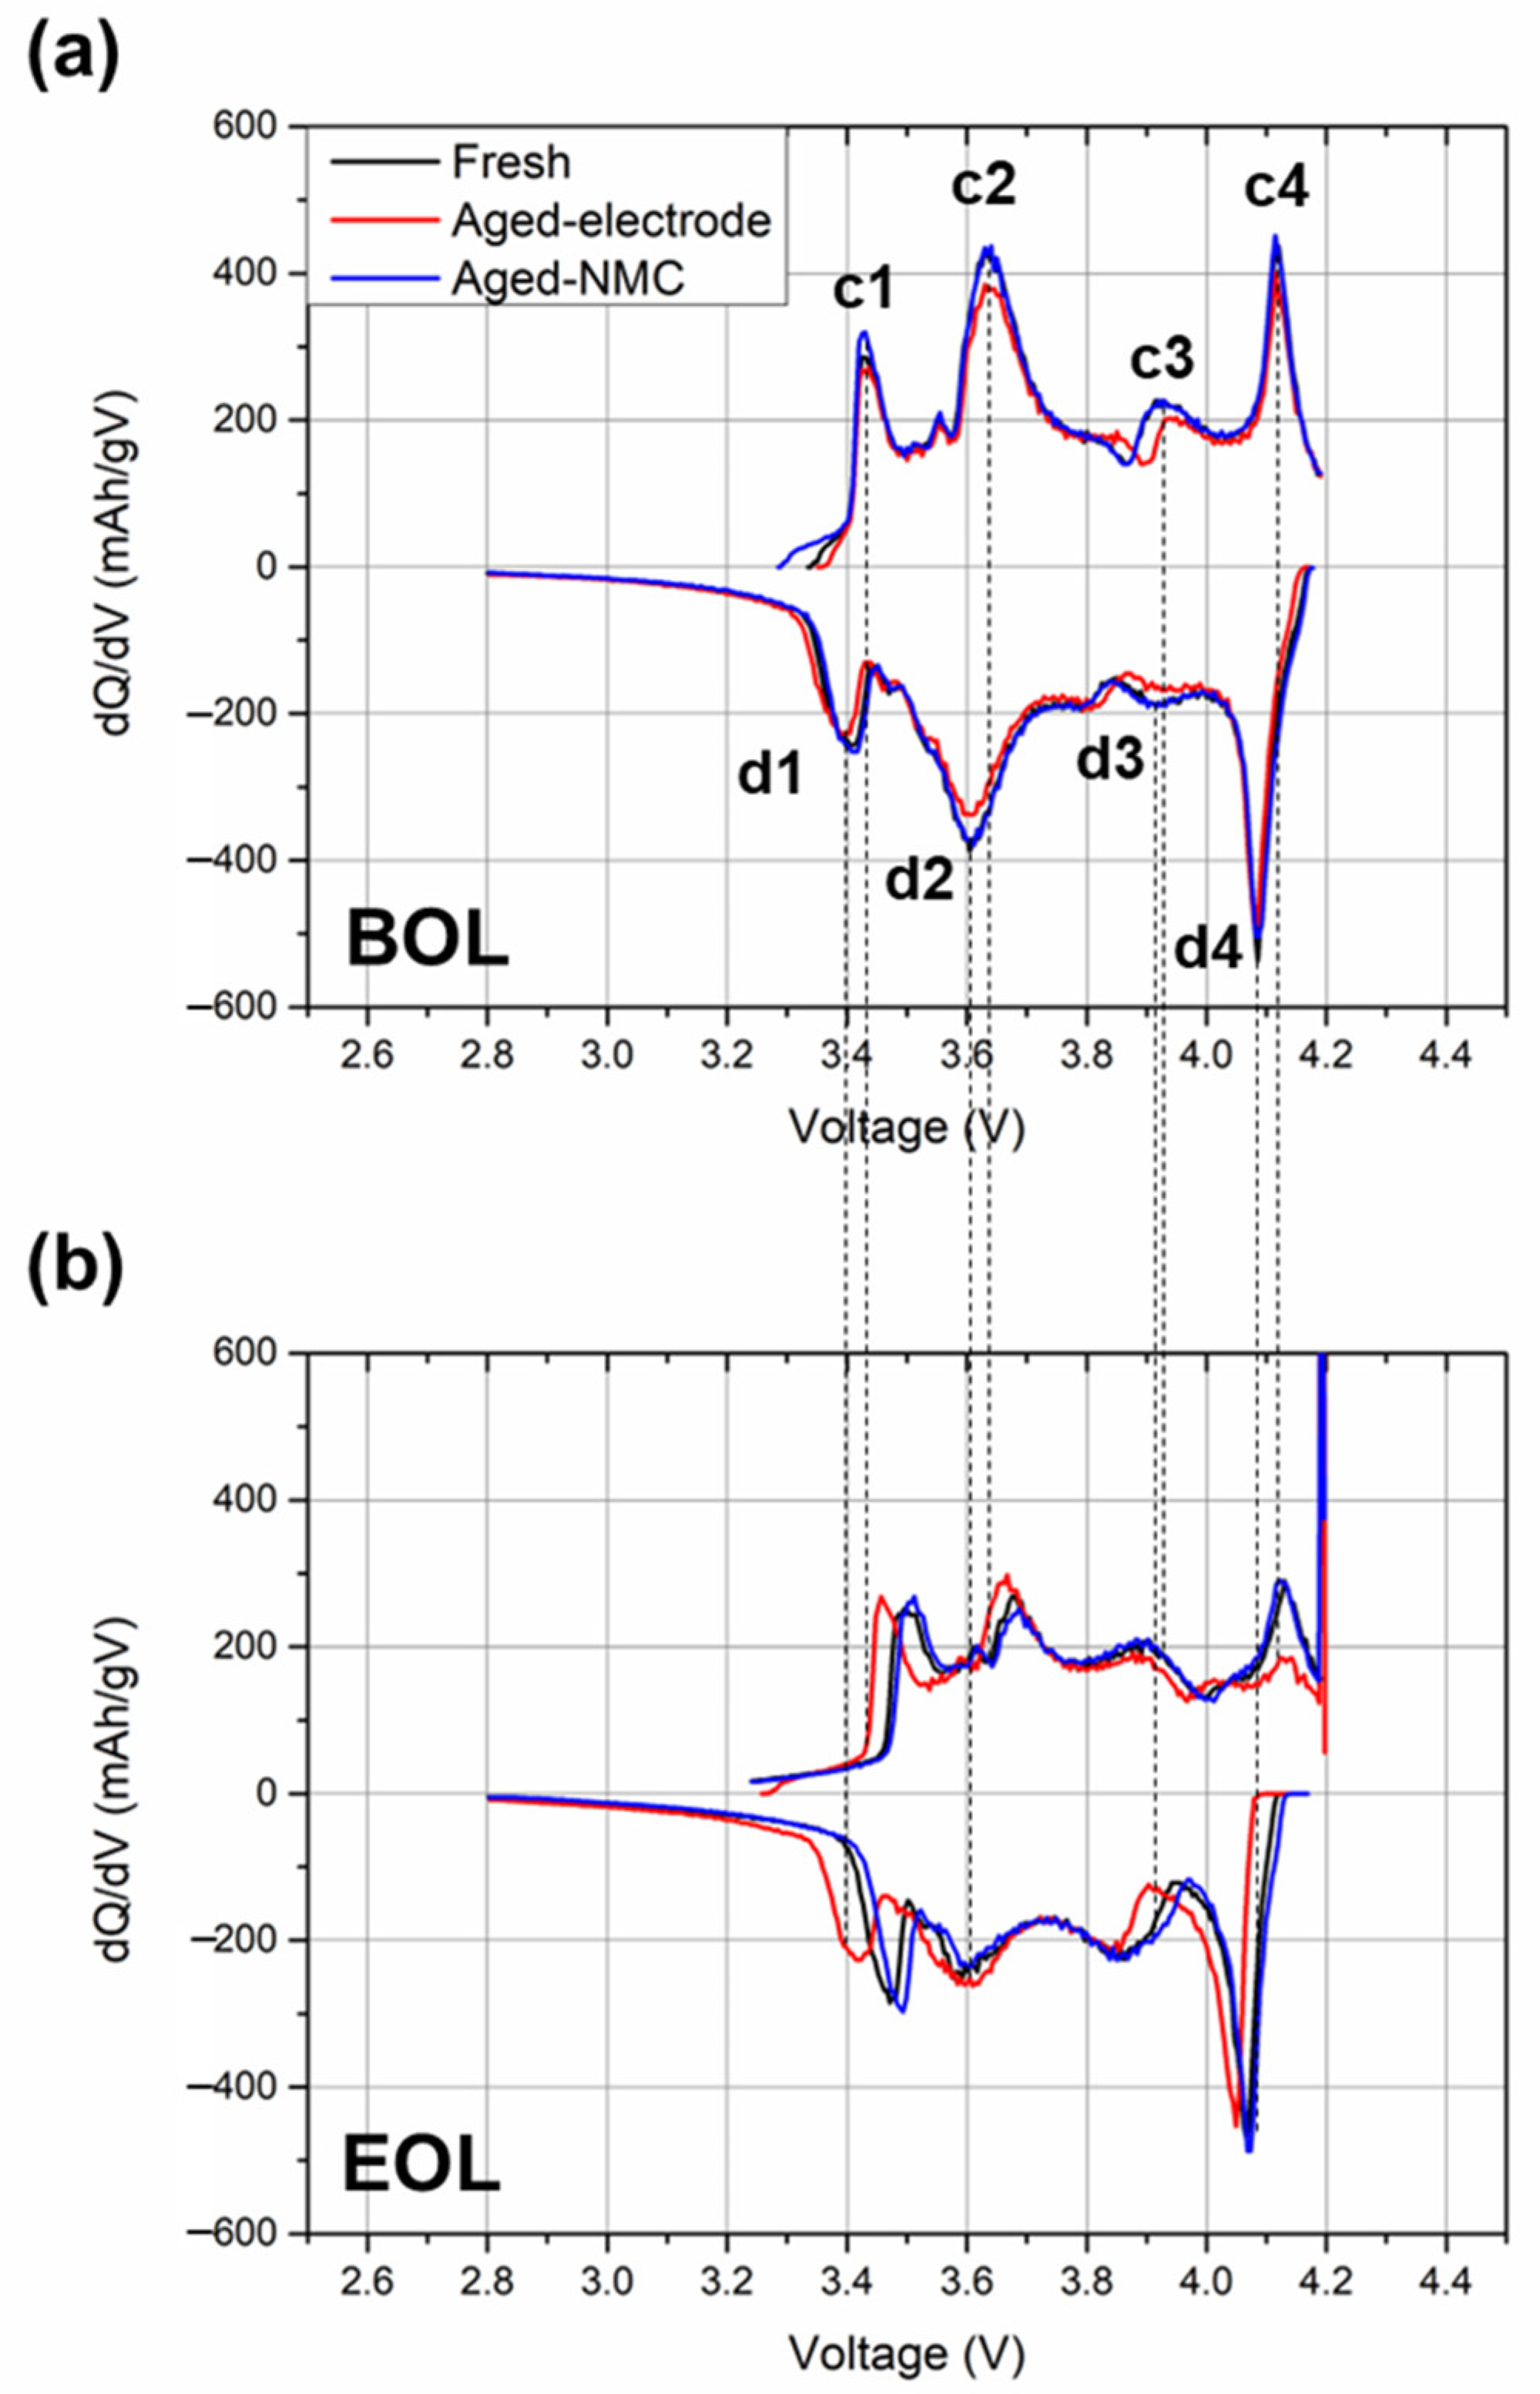
3.1.1. Galvanostatic Cycling
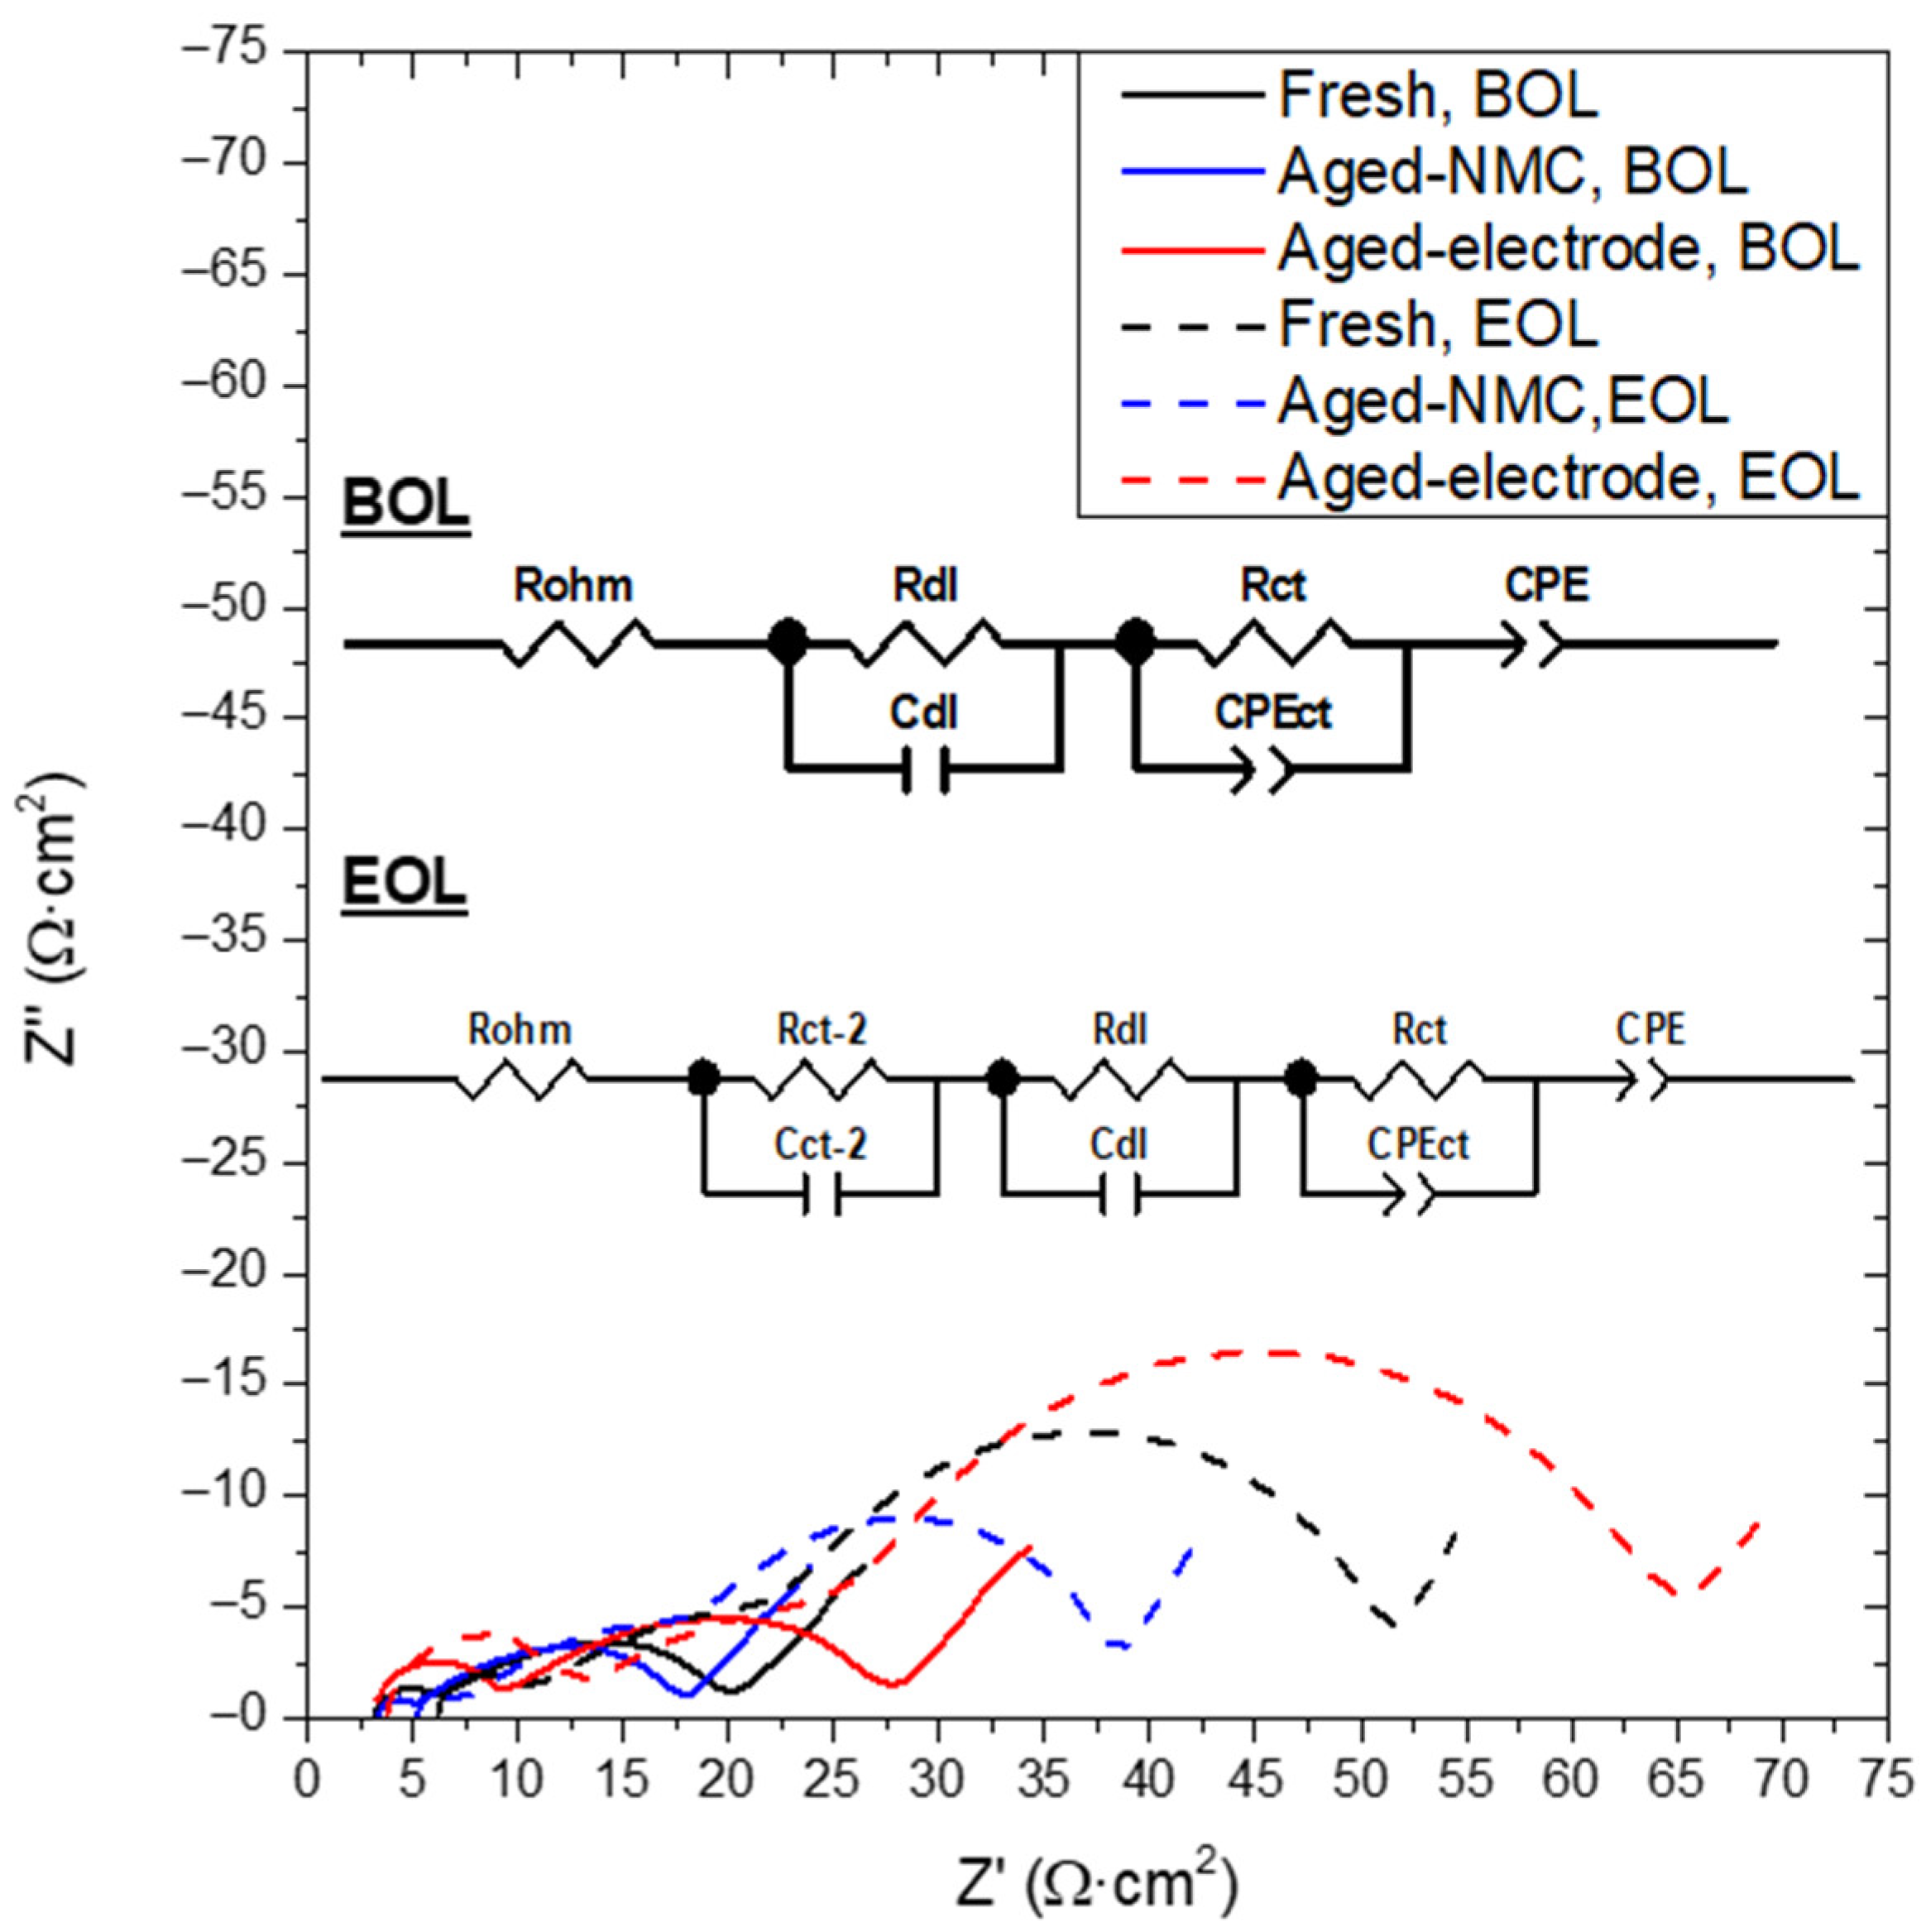
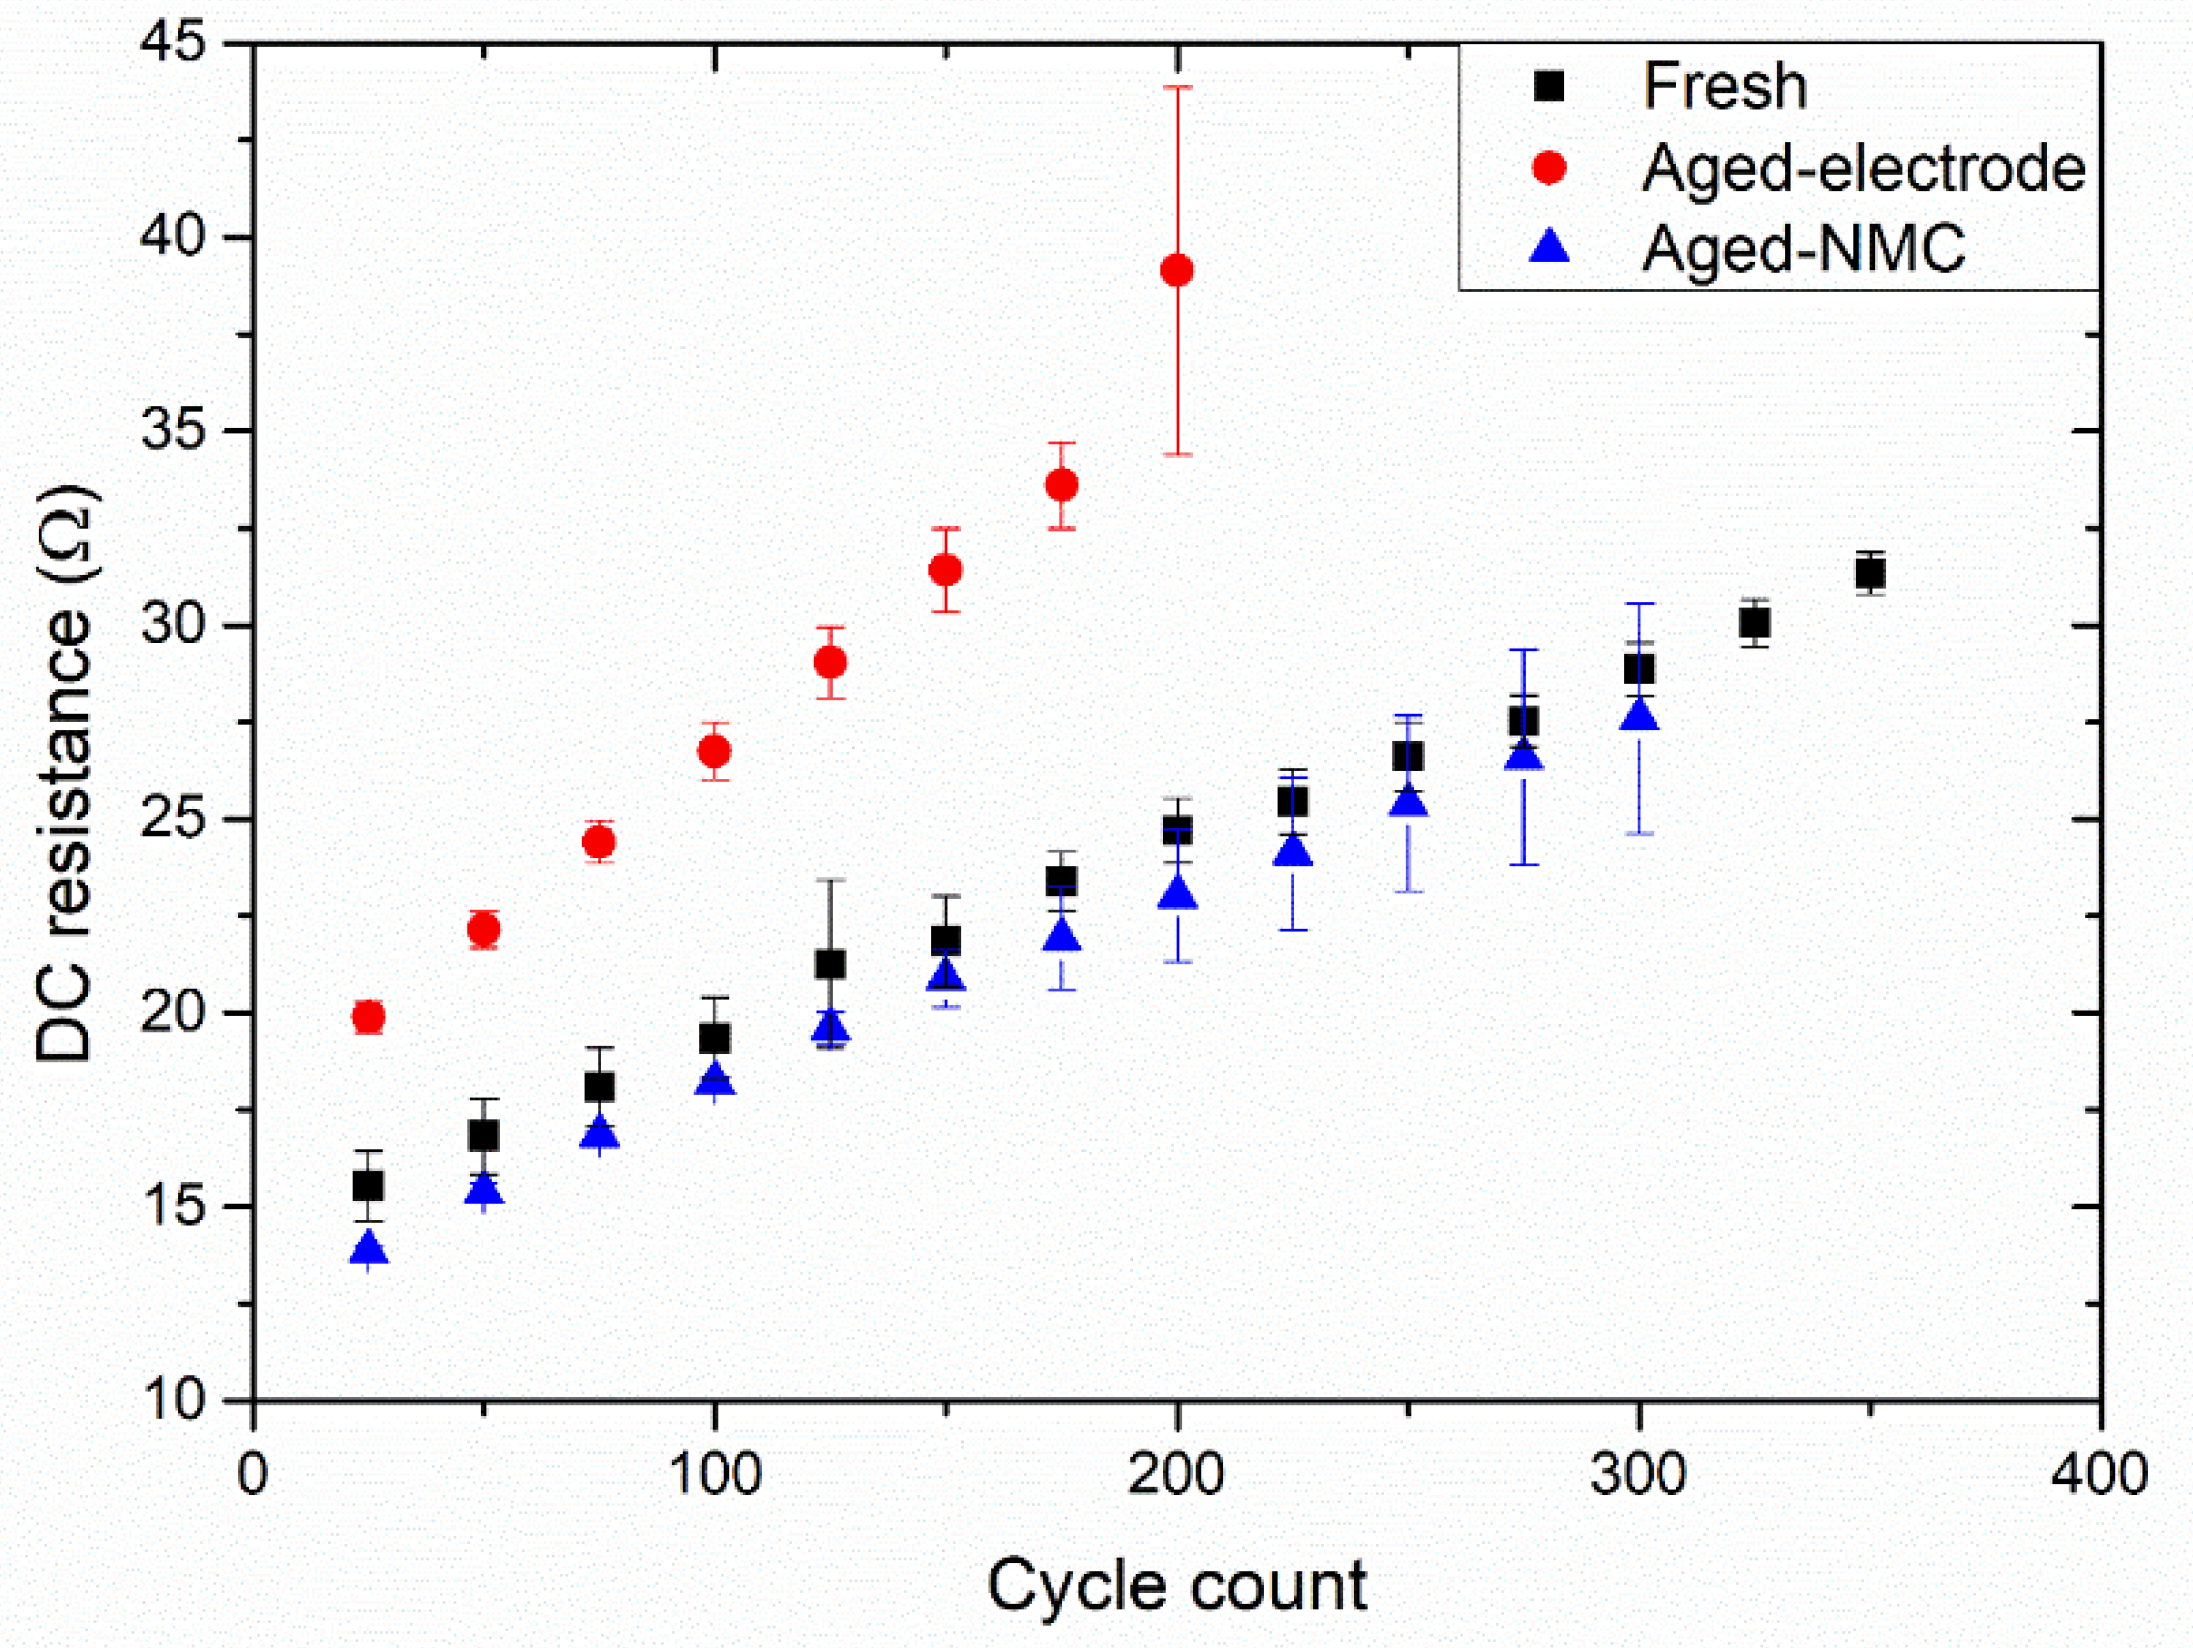
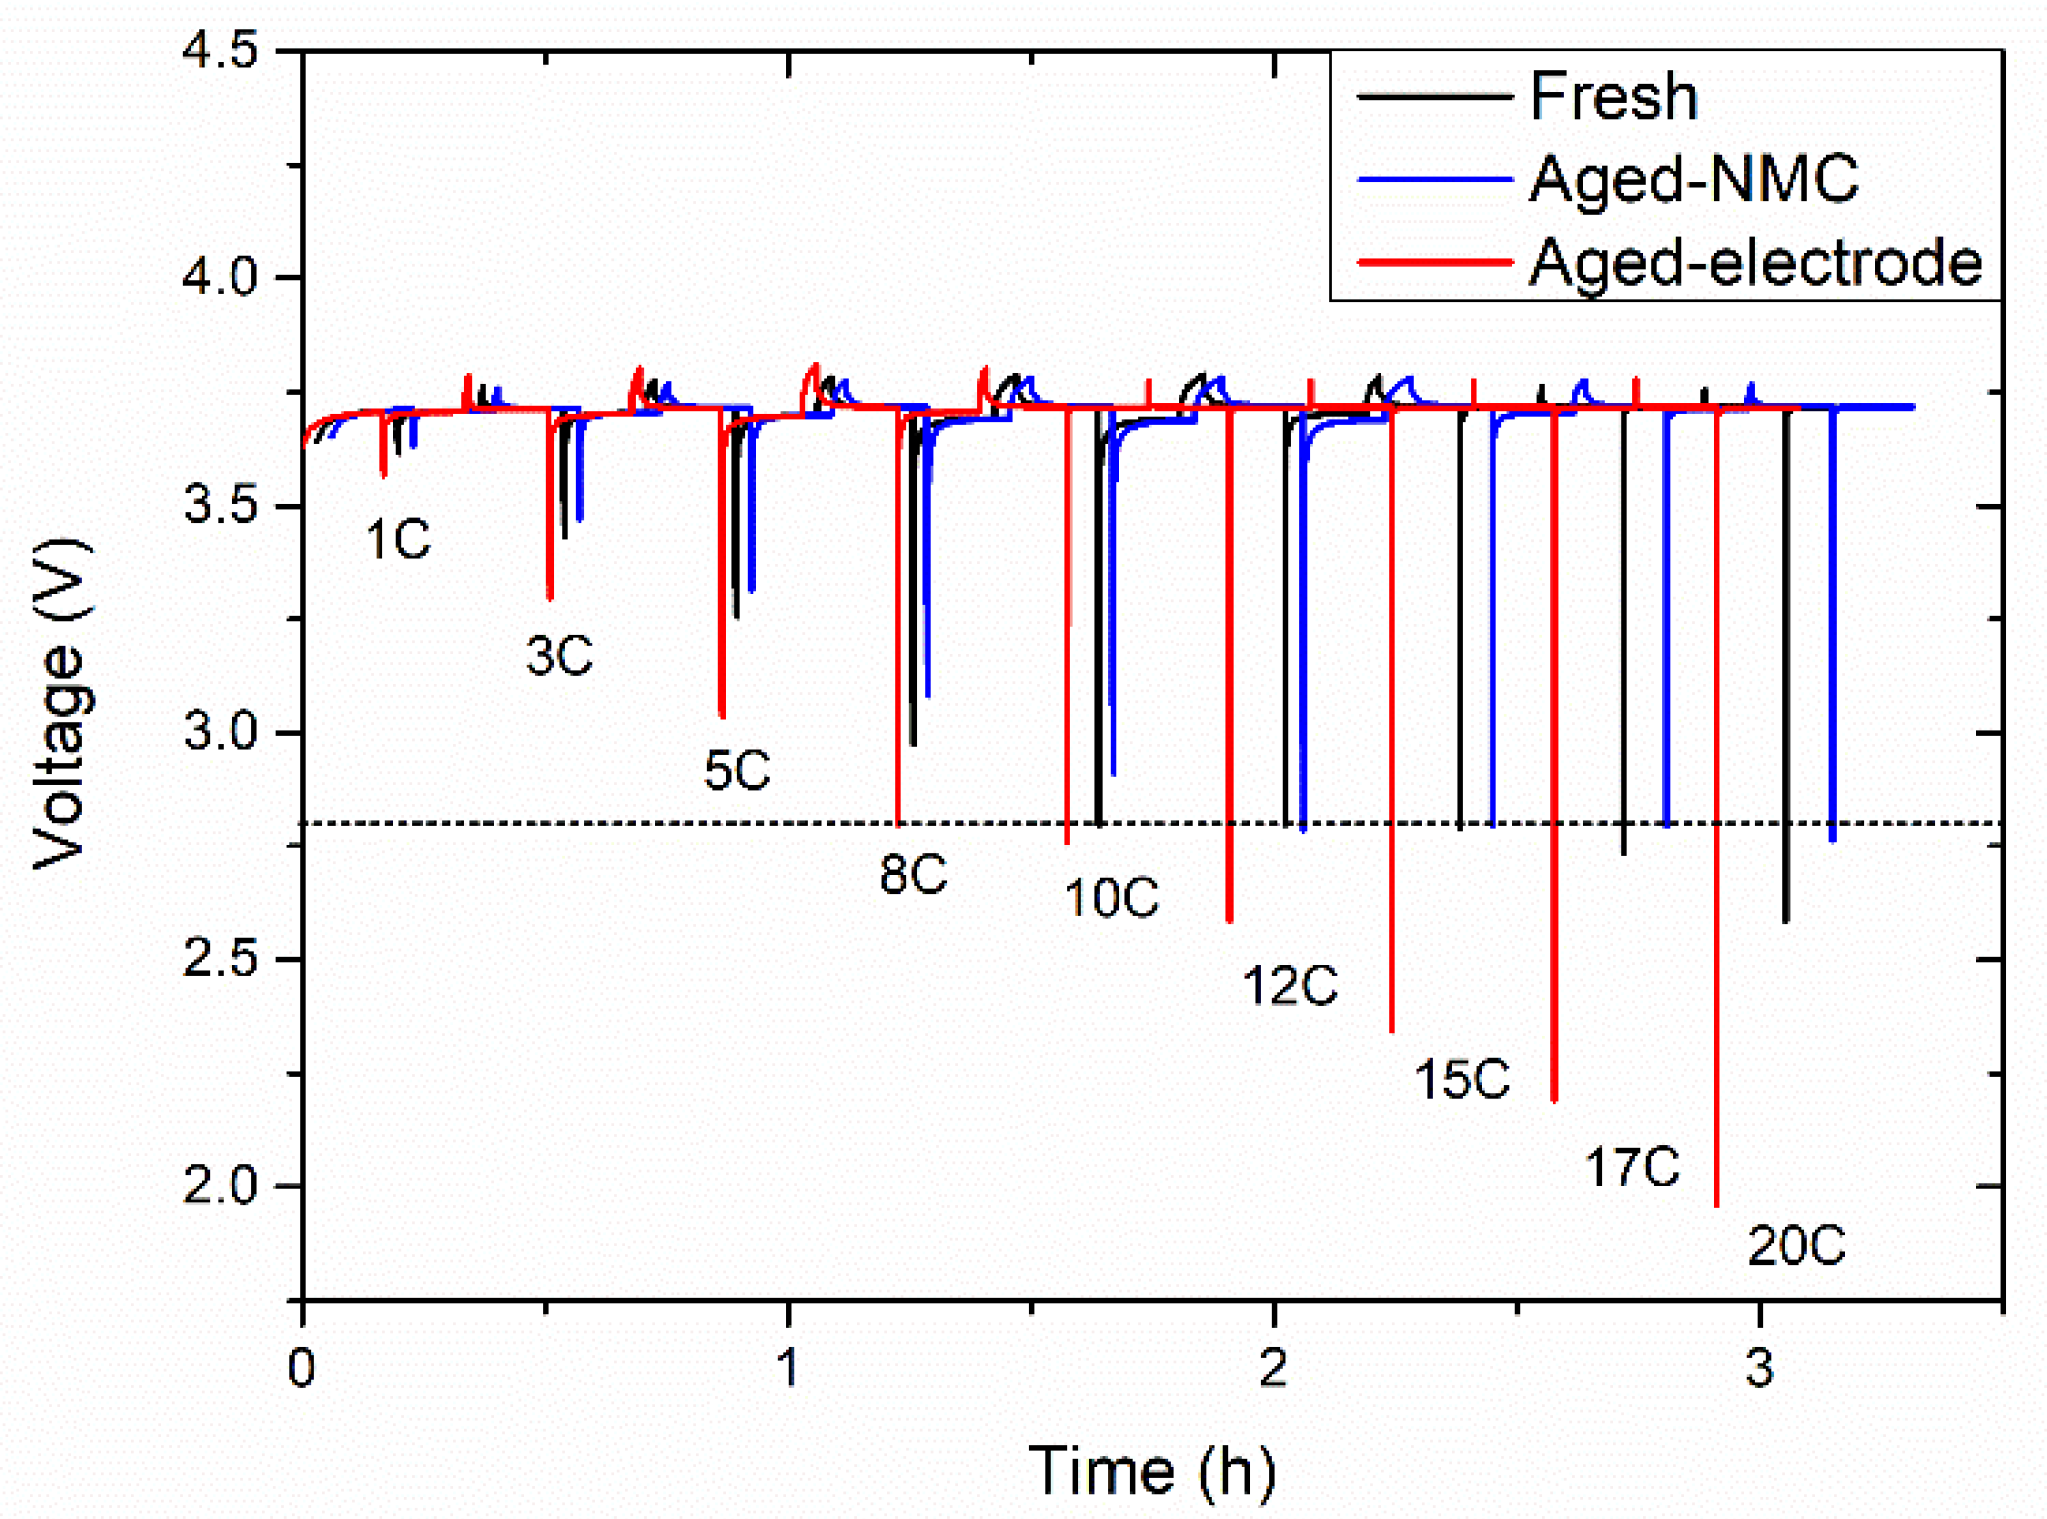
Li-ion cells consisting of fresh, aged-electrode (electrode exposed to calendar aging) and aged-NMC (electrodes prepared with NMC powder exposed to calendar aging) cathodes were subjected to galvanostatic cycling at C/3 to analyze the discharge capacity and the capacity retention. The evolution of these two parameters upon the cycling life of the cells is shown in Figure 1. In addition, the Coulombic efficiency of these cells is shown in Figure S2.
The capacity provided by the cells with the different positive electrodes is shown in Figure 1a, while the corresponding SOH evolution is represented in Figure 1b. The discharge capacity achieved by the cells with the aged-electrodes was lower from the beginning-of-life (BOL) of these cells. In fact, they could only provide 166.4 ± 0.6 mAh/g and completed 213 cycles before reaching 80% of SOH. In any case, the unsuccessful electrochemical performance provided by these cells was expected based on the works reported in the literature [22]. On the other hand, the results obtained with the cells using the aged-NMC electrodes outperformed those with the aged-electrodes in terms of capacity retention and discharge capacity. In fact, they achieved 313 cycles before their end-of-life (EOL) and, interestingly, provided higher discharge capacity in the first cycles than the cells consisting of the fresh coatings (189.9 ± 0.9 and 178.6 ± 0.6 mAh/g, respectively). The latter, however, exhibited longer cyclability as they completed 379 cycles above 80% SOH.
The complementary electrochemical experiments facilitated a better perspective of the capabilities of the cells with the different positive electrodes. Firstly, the cells were subjected to EIS at BOL (just after formation) and EOL (after reaching 80% SOH). Note that EIS experiments were conducted after setting the cells at 30% SOC. The corresponding Nyquist plots, as well as the equivalent circuits used to fit the spectra, are shown in Figure 2. In addition, the assignment of the different features was reported in previous work [24] and is further discussed in the Supporting Information together with the Bode diagrams (Figure S3). The values obtained by the fitting of the spectra are compiled in Table S1.
Fitting of the spectra showed that the ohmic resistance (Rohm) was very similar for all the cells at their BOL. Thus, the differences obtained in the electrochemical experiments could not be ascribed to differences in the casing or the contacts. It was also similar to the EOL, with a slightly lower value for the cells with aged-electrodes due to their lower cycle life. In contrast, those made of aged-electrodes were the cells with the highest double layer resistance (Rdl) at both the BOL and EOL. This suggests the formation of a resistive layer in the interfaces of the particles during storage-aging as reported by other authors [12]. On the other hand, the cells with the aged-NMC electrodes had the lowest interface resistance at BOL and EOL. Thus, the electrodes processed with the aged-NMC had lower double layer resistance than those processed with fresh NMC both before and after being subjected to galvanostatic cycling. Finally, the resistances attributed to charge transfer (Rct and Rct-2) were also determined. On the one hand, the cells with the aged-electrodes and the fresh electrodes had similar values at their BOL. This suggests that storage-aging affected the particle surface, while the core of the particles remained initially unaffected. As can be seen by the EOL, the cells with the aged-electrodes had the highest charge transfer resistance, while those with fresh electrodes provided a lower value. In contrast, the cells assembled with the aged-NMC had the lowest charge transfer resistance both at the BOL and EOL. Based on the conclusions obtained from the comparison of the aged and the fresh electrodes, a similar charge transfer resistance could be expected for these cells since the storage-aging should only affect the surface of the particles. The use of ambient aged NMC powder impacted the charge transfer resistance of these electrodes. This can be associated with the crystalline structure and will be discussed in Section 3.2.1 (XRD).
In addition, checkup experiments consisting of a C/10 galvanostatic cycle and a DC resistance measurement were conducted every 25 cycles of the cycling performance experiments discussed above. The evolution of this resistance during the cycle life of the cells is shown in Figure 3.
The experiments, consisting of a 1C discharge pulse of 30 s, evidenced that the DC resistance was higher for the cells with aged-electrodes. This is in good agreement with the results of the galvanostatic cycling and the higher AC resistance determined by the EIS experiments. Furthermore, the DC resistance was very similar for the cells with the fresh and the aged-NMC electrodes during all their cycle life. Thus, the increase of the DC resistance of the cell was discarded as the main reason for the lower cycling performance of the cells with aged-NMC. As mentioned, each of the DC resistance measurements was coupled with a C/20 galvanostatic cycle. By analyzing the capacity obtained throughout the voltage profile, it is possible to assign the plateaus to the different electrochemical reactions. The evolution of the voltage and the area of the signals obtained during the cycle life of the cells is useful to extract information on their aging processes. This technique is known as differential capacity analysis (dQ/dV) [26]. The dQ/dV of cells with different cathodes during all their cycle life are shown in Figure S4, while those from the 25th cycle (BOL) and the last dQ/dV completed before reaching 80% SOH (EOL) are shown in Figure 4.
Positive and negative values in the Y-axis of the dQ/dV correspond to the charge and discharge reactions, respectively. Four main features can be observed in each of them, which are assigned to different electrochemical processes in the literature [26]. Starting from the charge reaction, the first peak (c1) is associated with the lithiation of the graphite anode. The other three peaks (c2, c3 and c4) are useful for analyzing the reactions in the NMC, even if graphite also contributes to these signals [27]. Subsequently, c2 is ascribed to the transition from the initial hexagonal phase (H1) to monoclinic (M) upon delithiation. In c3, NMC undergoes the transition from M to a second hexagonal phase (H2). The last peak (c4) is associated with the transition from H2 to a third hexagonal phase (H3). This process is usually associated with the degradation of the battery, particularly for high-nickel NMC. Finally, the vertical line at 4.2 V is related to the CV step of the charge: the longer the line, the higher the charge capacity that was obtained in this step. In the subsequent discharge, H3→H2, H2→M and M→H1 in combination with graphite delithiation reactions occur in d4, d3 and d2, while d1 is exclusively associated with the delithiation of graphite. dQ/dV in the BOL (Figure 4a) shows that the reactions occur at the same voltage regardless of the positive electrode. The size of the peaks was smaller for the cells with the aged-electrode, in good agreement with the lower capacity obtained. On the other hand, the cells with the fresh and aged-NMC electrodes were overlapped. The discharge capacities in these cycles were 193.6 ± 0.6 and 193.1 ± 1.3 mAh/g, respectively. The subsequent discharge capacities at C/3 were 175.6 ± 0.1 and 177.7 ± 1.8 mAh/g, respectively: the capacity of the cells was higher for the cells with the aged-NMC when the C-rate was increased from C/20 to C/3, which is in good agreement with the lower charge transfer and double layer resistances of the electrodes in these cells (determined by EIS experiments).
The dQ/dV at the EOL of the cells is shown in Figure 4b. In addition, dashed lines were included in the figure to compare the voltage at which each of the features occurs compared to those in Figure 4a. Upon charge, c1 and c2 exhibited an increased voltage during their cycle life. Interestingly, the associated d1 signal upon discharge occurred at a lower voltage. A c1-d1 redox pair was exclusively ascribed to the delithiation/lithiation of graphite, while the other contributions were influenced by the reaction of NMC811. Thus, the increased overpotential of c1 and decreased overpotential of d1 could be associated with the slippage of the graphite and the NMC811 electrodes [28]. The lower overpotential for the cells cycled for a larger number of cycles suggests that the mismatch was increased with the number of cycles. The area of the c1-d1 peaks was slightly decreased when the curves at BOL and EOL were compared. However, this decrease was significantly lower than for the rest of the cells, indicating that the delithiation and lithiation of the anodes were not significantly affected even at the EOL of the cells. In contrast, the magnitude of the rest of the redox pairs except c3-d3 was decreased. In addition, d4 also almost maintained the original area by the EOL. Based on the discussion in Figure 4a, the decrease of the c2-d2 and c4-d4 peaks points out that the H1 → M and H2 → H3 transitions (and the subsequent M → H1) occur to a lower extent as a result of the EOL of the cells. It is difficult to evaluate the evolution of the c3-d3 redox pair as the signals are wider and might also partially include the H1 → M transition, which should really occur at a lower potential. Nevertheless, it is not likely that M → H2 and H2 → M are bottleneck reactions for charge and discharge, respectively. One of the most meaningful features in the charge profile by the EOL of the cells appeared at 4.2 V: as mentioned, the vertical line observed was due to the CV step included by the end of the charge. The presence of this charge step might be the reason for the very small differences observed between the d4 signals at the BOL and the EOL; once the CV step was completed, there were similar amounts of NMC811 in the H3 phase to subsequently obtain a similar H3 → H2 reaction capacity. The very different size of the c4 feature at BOL and EOL, in combination with the similar size of d4, confirms that a significant fraction of the charge is occurring at this CV step. Again, it is difficult to compare d3 at the BOL and EOL, while the area d2 is lower by the end of life. Considering both the slight voltage shift for c2 and the influence of the CV step, it can be deduced that, apart from the possible loss of active material, the overpotential caused by the increase of both the charge transfer and the double layer resistances might also be influencing the cycle life of the cells. Indeed, these dQ/dV were conducted on galvanostatic cycles performed at C/20 while regular cycling consisted of C/3 cycles; at the latter C-rate, the influence of overpotential was increased.

3.1.2. Power Tests

The response of the cells to high currents was explored by conducting discharge power tests. After formation, the cells were set at 50% SOC and 1C, 3C, 5C, 8C, 10C, 12C, 15C, 17C and 20C discharges were conducted with 10 s and 2.8 V time and voltage cut-offs. Cells were charged to 50%SOC after each discharge pulse. The galvanostatic curves for the different samples are shown in Figure 5.
As could be expected based on the impedance analyses previously discussed, the cells with the aged-electrodes showed the worst power capability among those included in this study. In fact, they were the sole type of cell unable to resist 8C pulses without reaching the discharge cut-off limit. Again, the power tests were in good agreement with the EIS results of the cells with the fresh and aged-NMC electrodes. The latter, which had the lower interface resistance, could resist pulses up to 10C. Moreover, none of the cells with the fresh electrodes could be subjected to the same current without reaching the 2.8 V cut-off.
To sum up the electrochemical experiments, cells assembled with the aged-electrodes provided the worst electrochemical performance in all the experiments conducted. They provided the lowest discharge capacity, capacity retention and power capability. This is in good agreement with the highest AC and DC resistances observed for these cells. The most unforeseen performance was obtained with the cells with aged-NMC. They exhibited the lowest interface and charge transfer resistances, and their discharge capacity was higher during the first cycles, particularly with increasing C-rate. Their capacity retention, however, was lower than for the cells with fresh electrodes. In order to shed some light on the reasons leading to these controversial results, the electrodes and NMC powders were subjected to different materials characterization techniques. These experiments will be discussed in the following section.

3.2. Materials Characterization

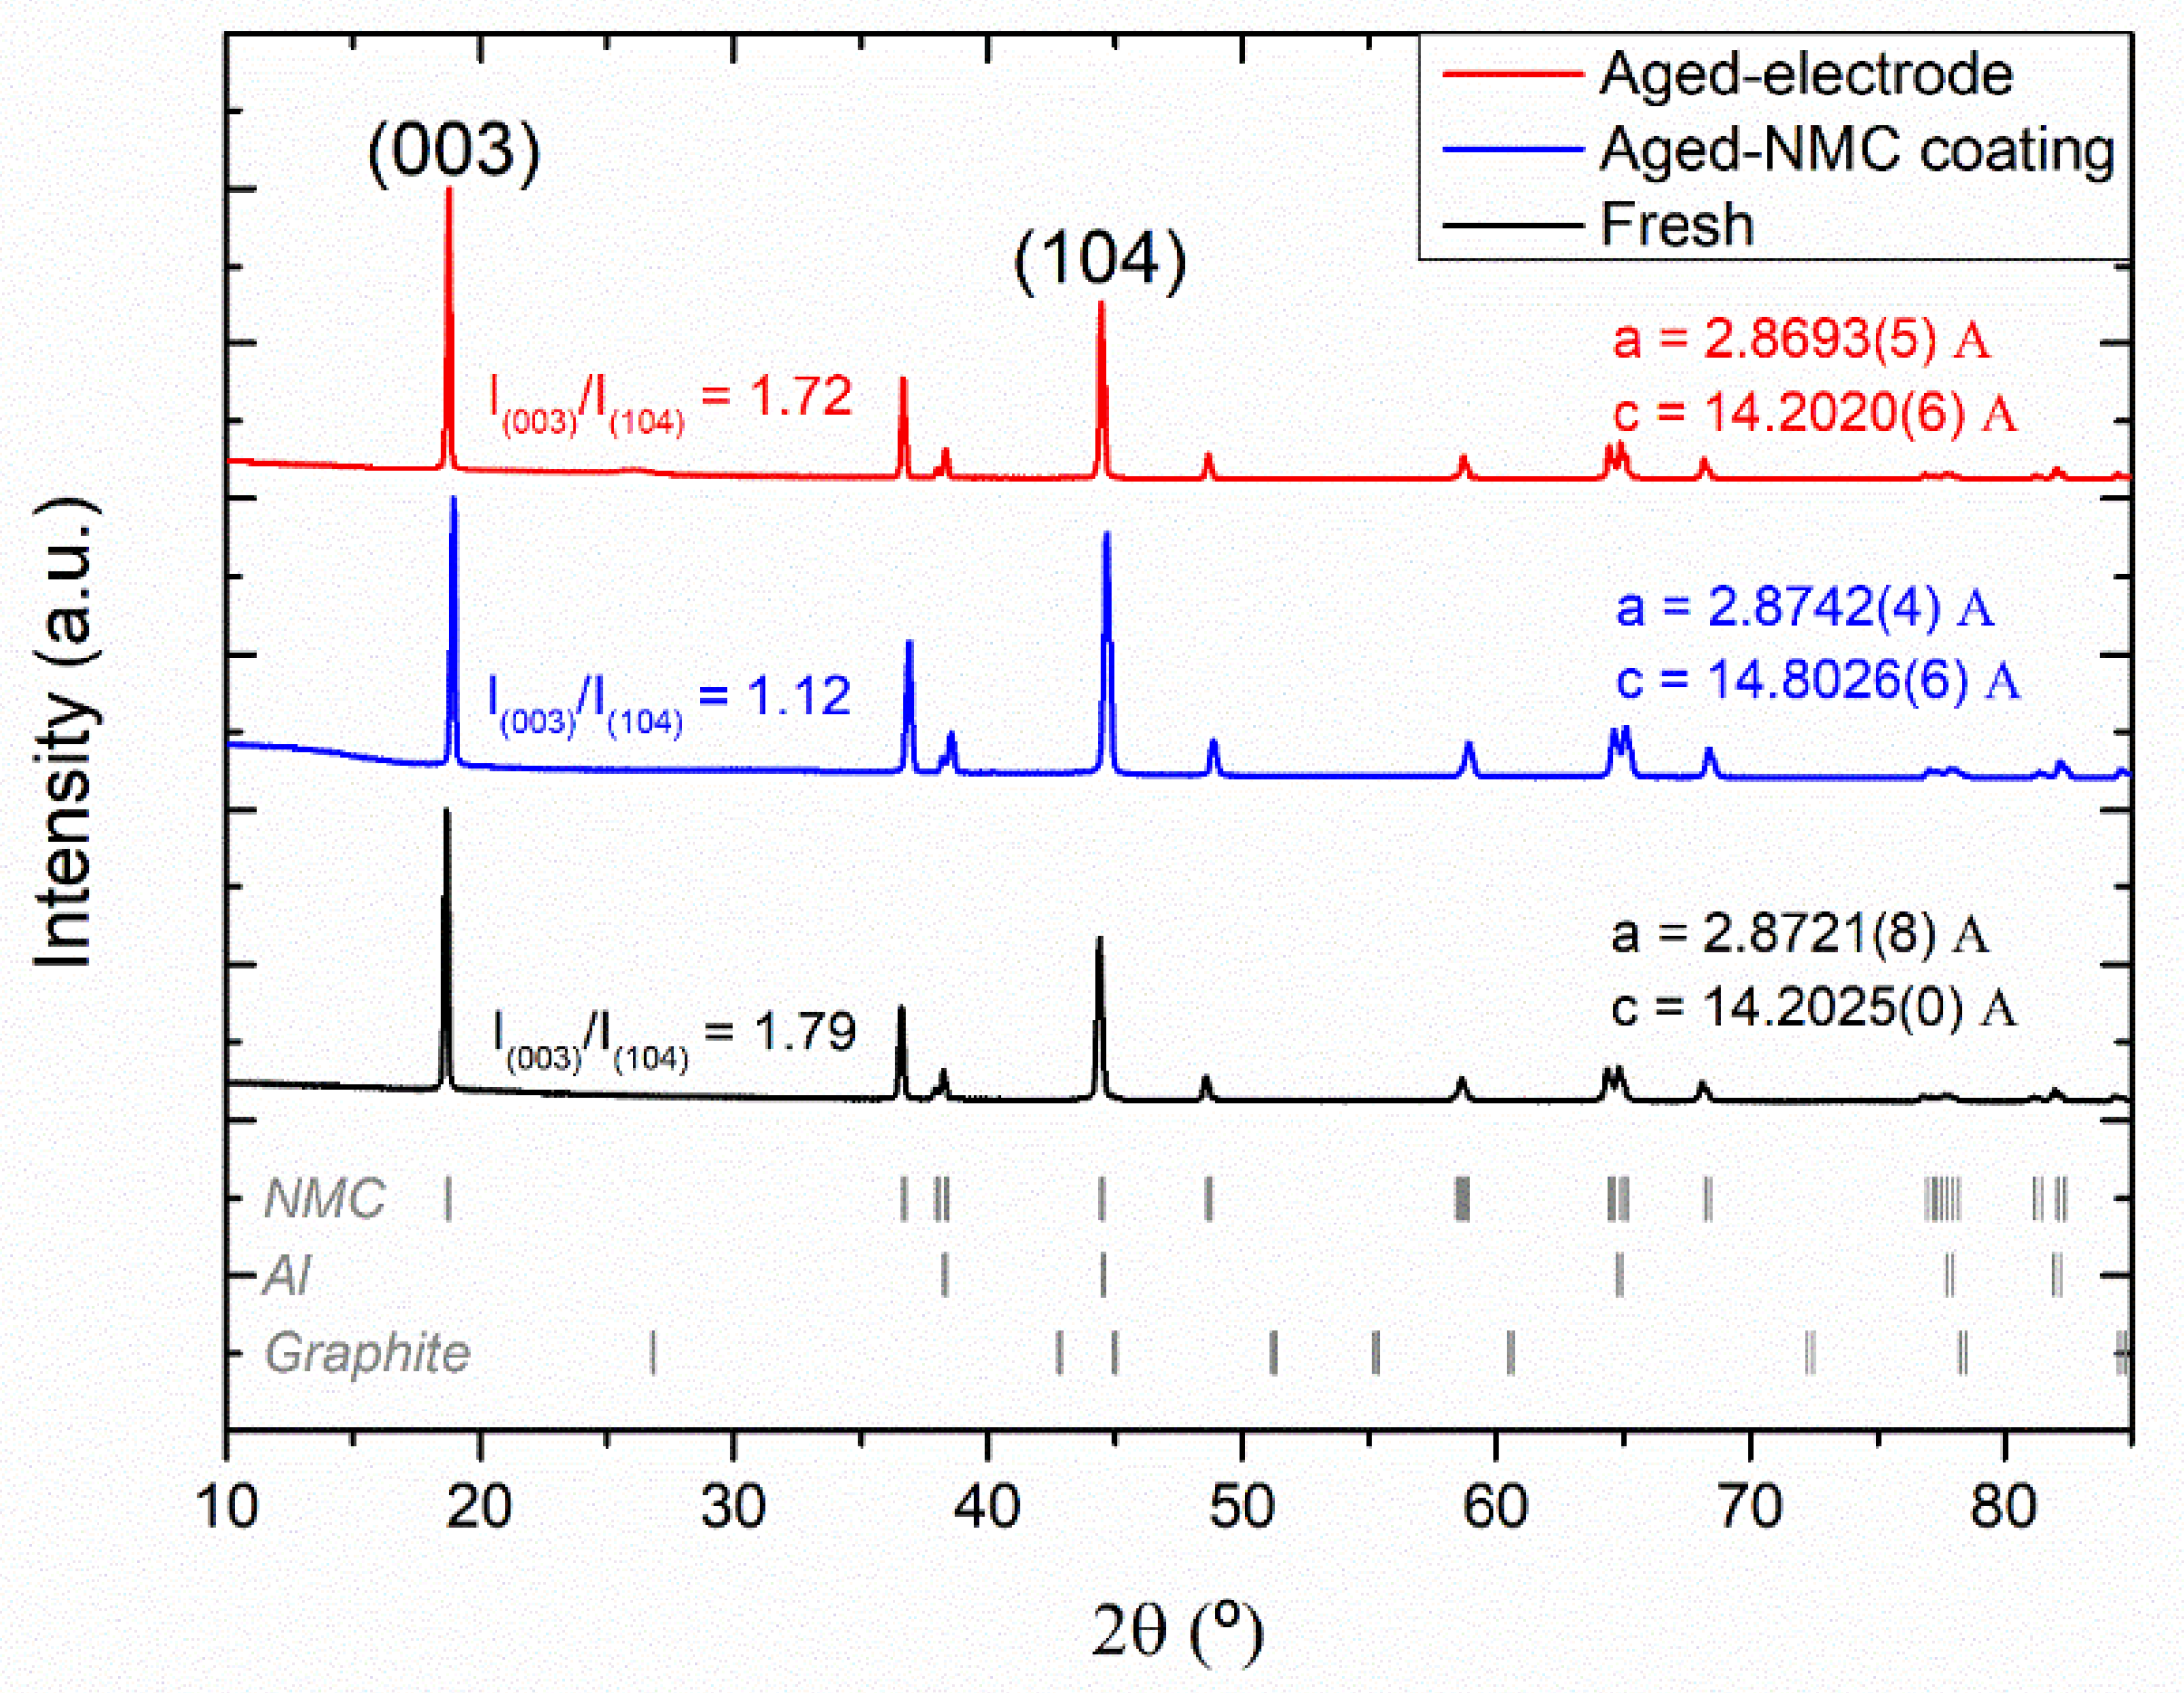
3.2.1. X-ray Diffraction

XRD analysis of the fresh and aged NMC was conducted to obtain information on the evolution of the crystal structure upon aging. The diffractograms of the fresh and aged NMC powders are shown in Figure S5. They were fitted with the R −3 m hexagonal space group (JCPDS No. 00-85-1968, Li0.89Ni1.01O2) [29]. Both a and c unit cell parameters were very similar before and after the ambient storage period (a = 2.8721(1) and c = 14.2082(8) Å for the fresh NMC and a = 2.8737(5) and c = 14.2063(8) Å for the aged NMC) evidencing that the aging procedure did not affect the crystal structure in the bulk of the NMC particles. XRD analyses were repeated on the electrodes after processing the aged and fresh NMC, and the diffractograms obtained are shown in Figure 6. The diffractogram of the aged-electrode is also included.
Aluminum from the current collector (Fm −3 m, cubic, JCPDS No. 03-65-2869) and graphite from the graphitic fraction in the carbon black (R −3 m, hexagonal, JCPDS No. 01-73-5918) were included in the fitting together with the NMC phase. The unit cell parameters obtained are shown in the inset in Figure 6. The a and c cell parameters of the NMC in the fresh and aged electrodes were similar, in good agreement with the results discussed for the NMC samples before processing. Regarding the electrodes processed with aged-NMC powder, a parameter was similar to those from the aged and fresh electrodes, but c was higher for the electrode prepared with aged-NMC. This means that the interlayer distance in the NMC crystal structure was enlarged when the aged-NMC was processed, which in literature is associated with cation mixing [30]. Furthermore, cation mixing is evidenced in the (003)/(104) peaks intensity ratio [31]. Fresh, aged-electrode and aged-NMC coatings subjected to XRD showed I003/I104 values of 1.79, 1.72 and 1.12, respectively. Values below 1.2, such as that of the aged-NMC electrode evidence cation mixing [29]. The increase of the interlayer distance is in good agreement with the lower impedance and higher initial discharge capacity observed for the cells with the electrodes made of aged NMC powder, as lithium ions should move more easily in the interlayer space. This characteristic could also allow a better response to high C-rates. Nevertheless, cation mixing is also associated with lower irreversibility towards crystal structure transitions, which ultimately leads to lower cycling performance [7]. As a result of the EOL of the cells, the crystal structure of the NMCs was not significantly different. The diffractograms of these samples are shown in Figure S6.

3.2.2. Field Emission Scanning Electron Microscopy and Energy-Dispersive X-ray Spectroscopy

The morphology and chemical composition of the NMCs and the electrodes subjected to different aging protocols, as well as the different electrodes after the C/3 cycling test, were analyzed by means of SEM and EDX. Even if these techniques are useful in other studies, they did not provide relevant information to the current one. The SEM images obtained are shown in Figure S7. In addition, electrodes did not show significant morphological differences either before or after their cycling life. However, it was interesting to observe that the carbon fraction was very similar for all samples (~30%). This evidences that even if a resistive layer, possibly made of carbonate [32], could be formed during the aging of the electrode, it is difficult to characterize it by means of this technique. For that aim, surface-characterization techniques, such as XPS, were used.

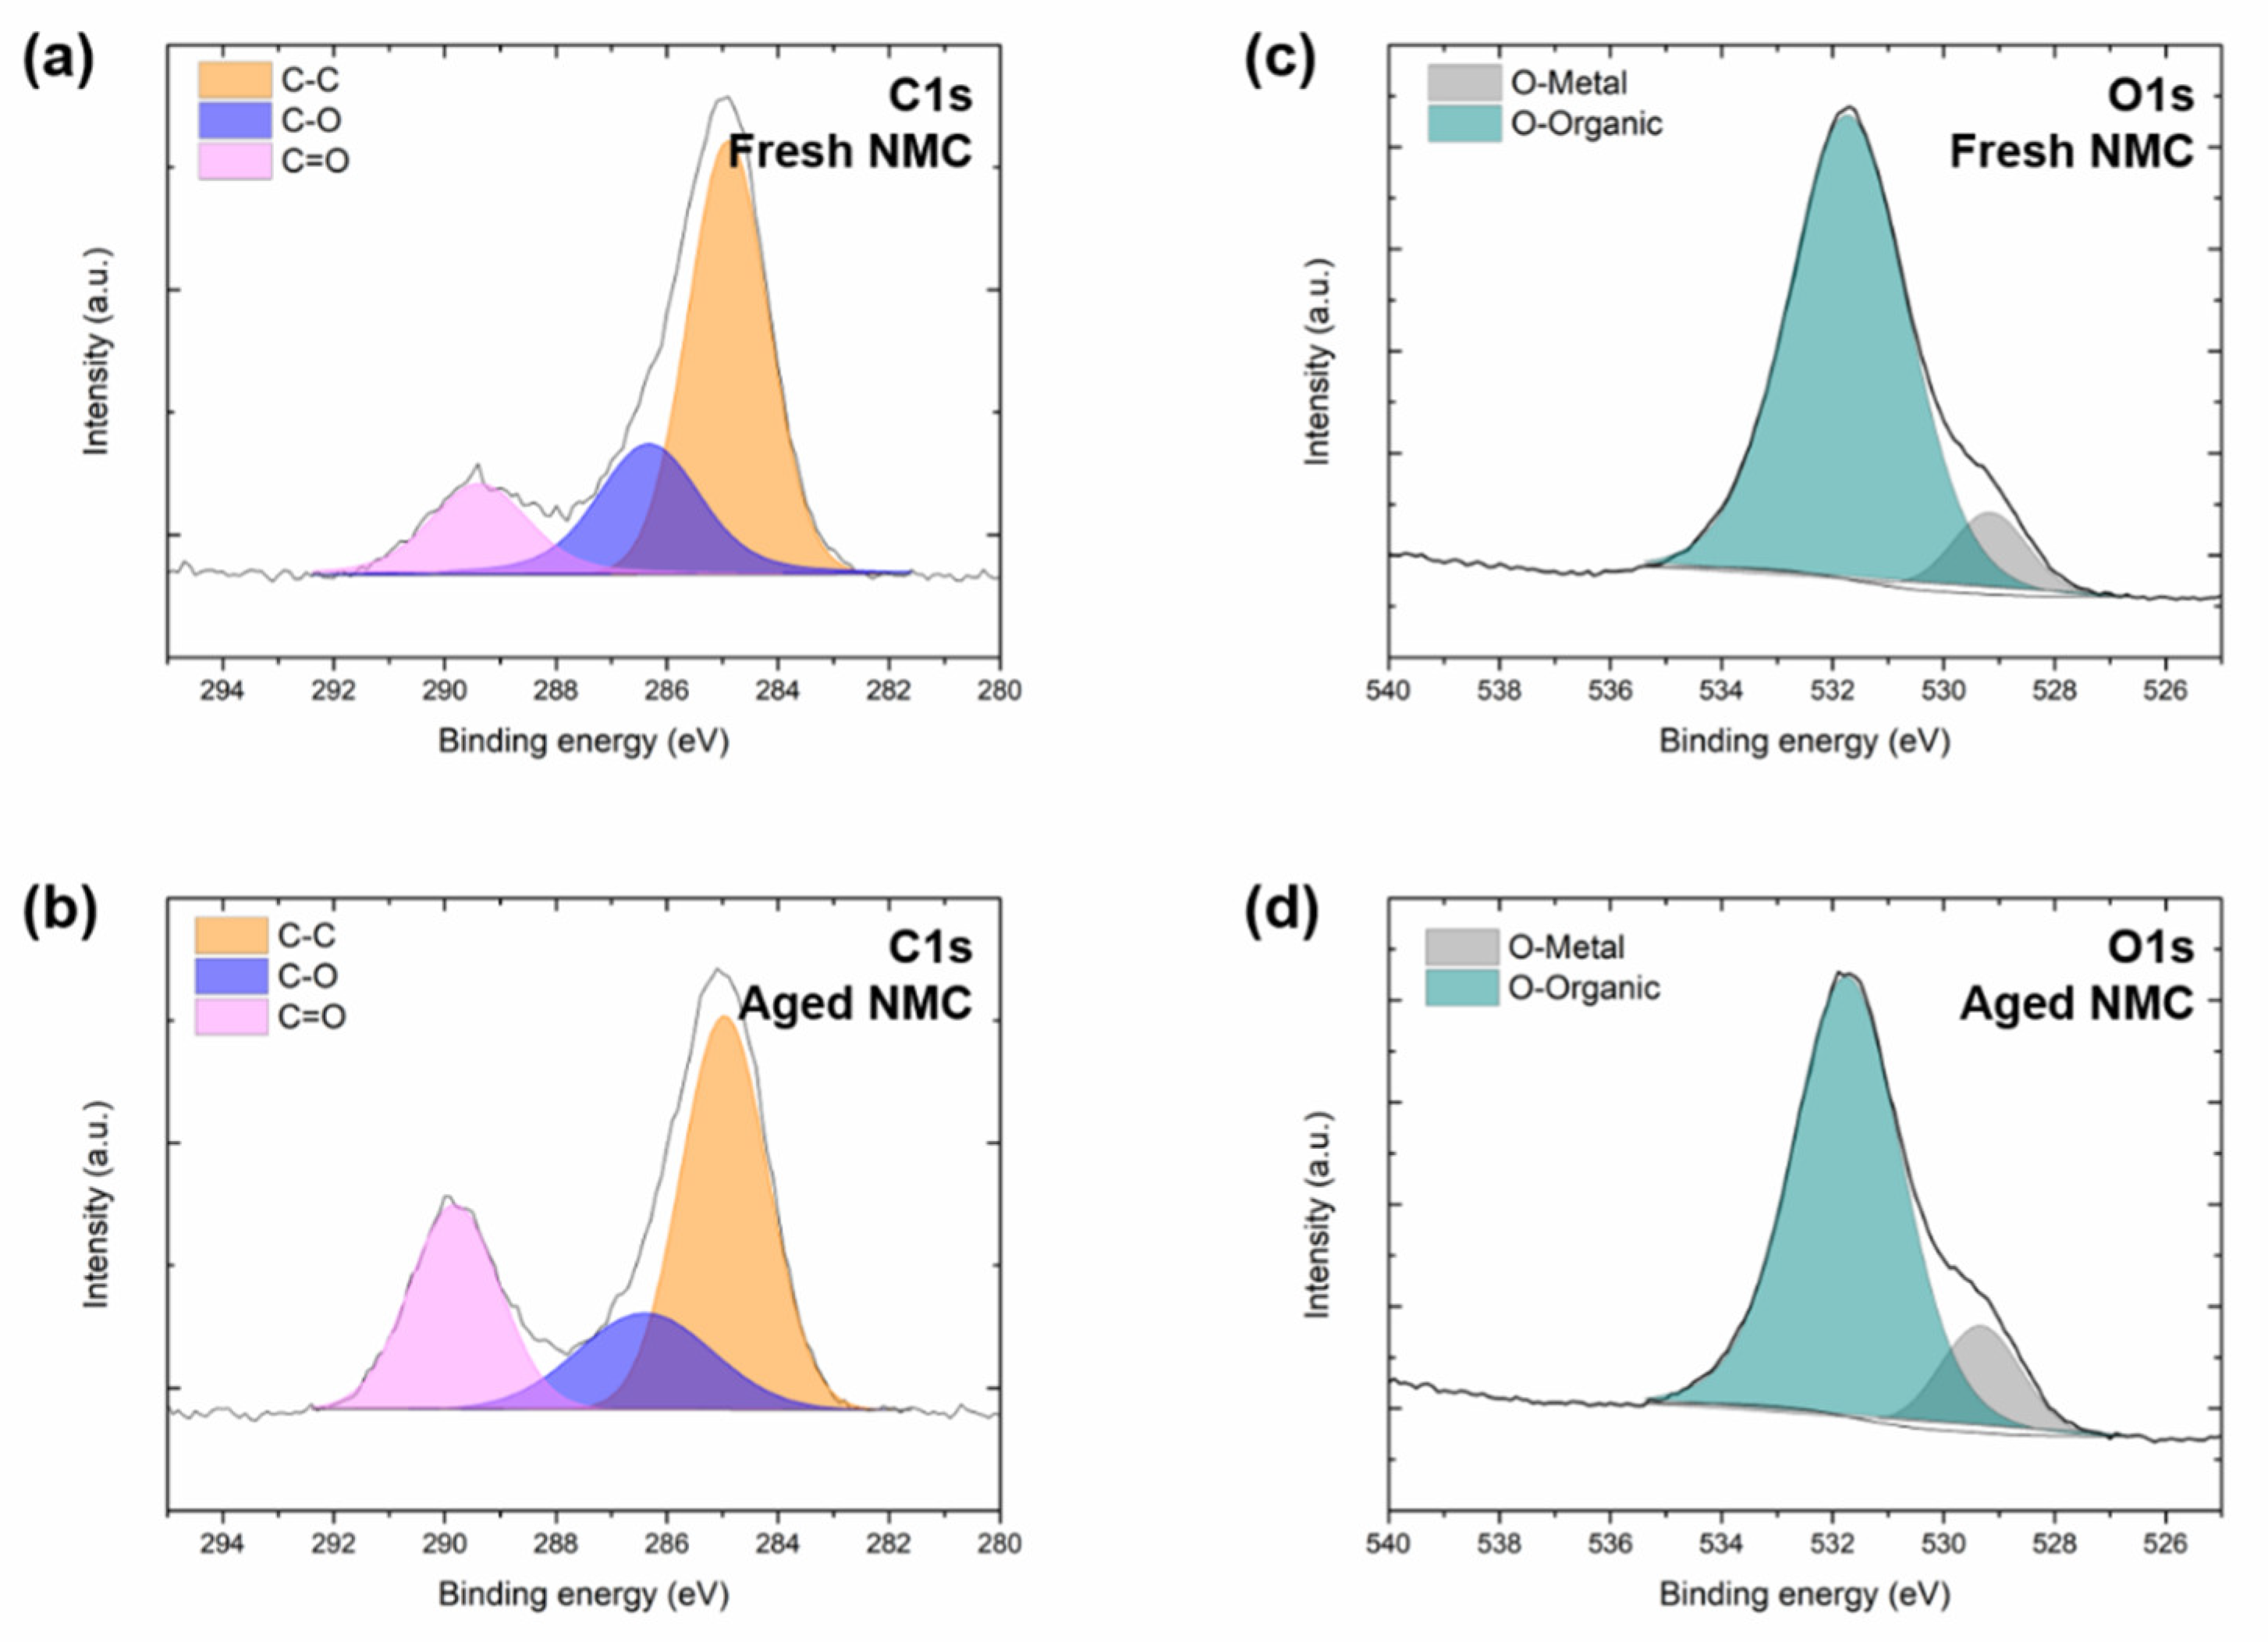
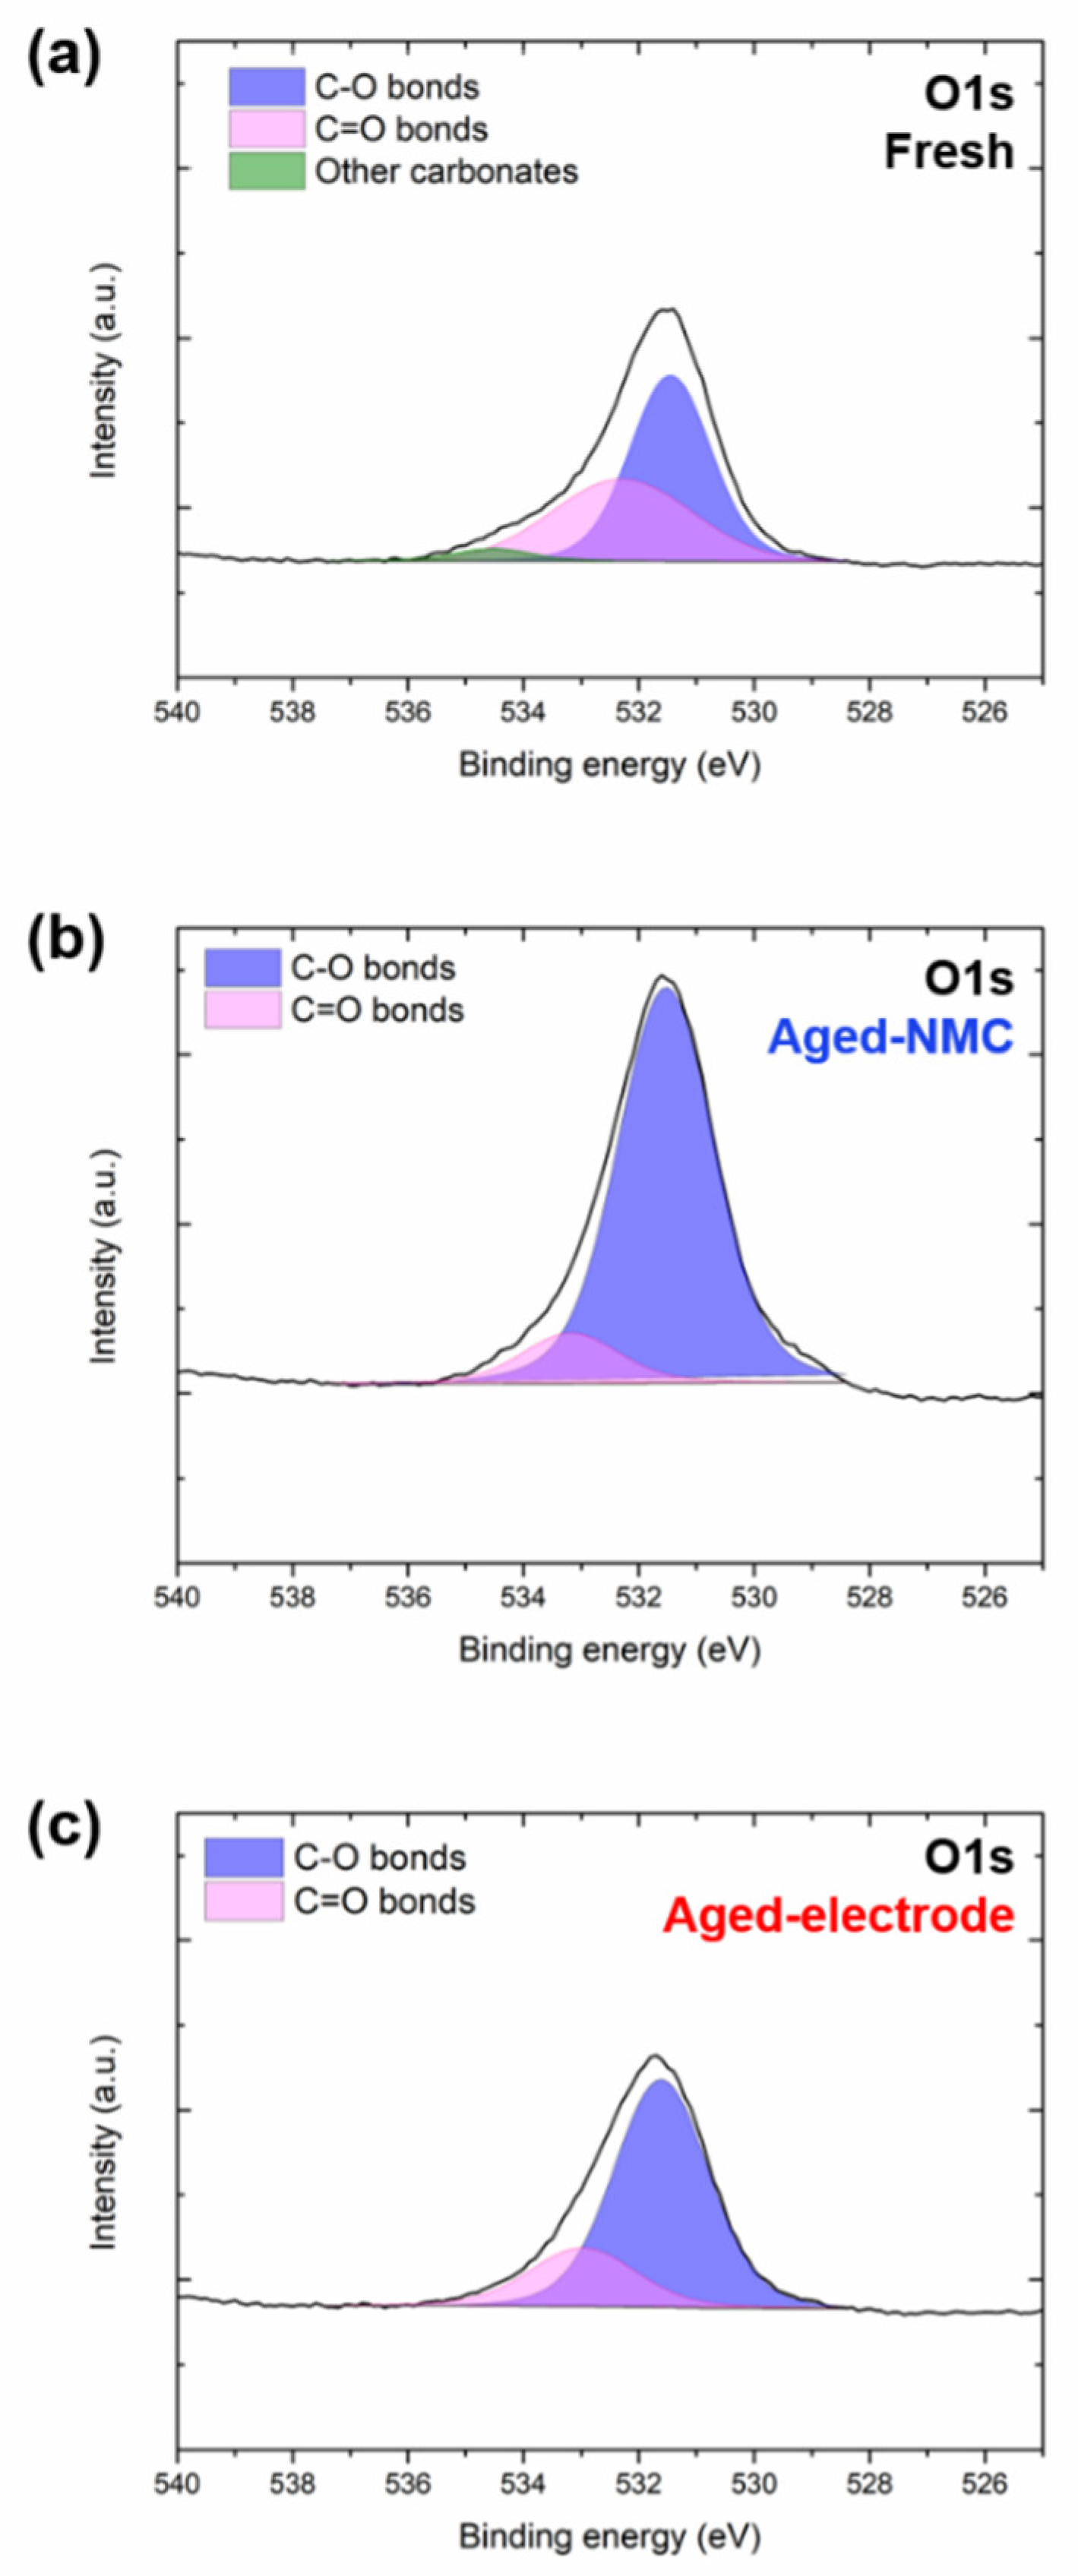
3.2.3. X-ray Photoelectron Spectroscopy (XPS)

The same samples previously subjected to XRD, SEM and EDX experiments were also analyzed by XPS. The C1s and O1s regions of the scan conducted on the fresh and aged NMC powder are shown in Figure 7. The peak area for the deconvoluted features is included in Table S2.
C1s regions could be deconvoluted into three different contributions, which were assigned to C-C (284.9 eV), C–OR (286.4 eV) and C=O (289.6 eV) bonds [33]. The presence of the former might be ascribed to the carbon coating layer that is usually added to enhance the conductive properties of the NMC. On the other hand, the other two features are associated with the presence of carbonate-like species. The area of these signals was higher for the aged NMC, suggesting that the exposition of NMC to ambient air resulted in the formation of carbonates on the surface of this material [12]. These carbonate-like species could not be found in the XRD analyses. There are two possibilities to explain this fact: (i) the carbonate layer was thin, and the total amount of this compound was negligible compared with the total NMC and (ii) this carbonate was amorphous and, therefore, not detectable by XRD. On the other hand, the O1s spectra could be deconvoluted into two different features with maximum values at 529.2 and 531.7 eV [22]. The latter is associated with O=C bonds, and the larger area of this signal for the aged NMC confirms the formation of a native carbonate layer at the NMC particle surface [34]. Regarding the signal at 529.2 eV, it is attributed to O-Metal bonds [22]. Again, the area of this feature is higher for the aged NMC. The interpretation of this fact is more challenging as the main contributor to this feature should be the metal-oxygen bond coming from the NMC itself. However, metal carbonates and single-metal oxides (NixOy, MnxOy, CoxOy) segregated from the active material NMC can contribute to this signal [35]. Given the fact that the Li/Ni ratio (calculated from the atomic ratio obtained in the fitting of the XPS spectra) was lower for the aged NMC (Li/Ni = 7 and Li/Ni = 5 for the fresh and the aged samples, respectively) and that the carbonates are mainly lithium carbonates, not contributing to the 529 eV component of the O1s, it can be speculated that aging leads to the segregation of metal oxides to the NMC surface. That would explain why the 529 eV component is stronger for the aged NMC.
Finally, Ni3+/Ni (Ni3+ fraction of the overall Ni, the latter calculated by the sum of Ni3+ and Ni2+) was determined for the two NMC powders following the methodology recently described elsewhere [21]. In good agreement with the former work, Ni3+/Ni was 0.48 and 0.40 for the fresh and aged NMC samples, respectively. Thus, some Ni3+ undergoes reduction to Ni2+ upon ambient storage. This is analyzed in detail below.
The O1s spectra of the electrodes under study in this work are displayed in Figure 8. Moreover, the same region of the scan is also shown for the postmortem cathodes in Figure S8. The information regarding the signals and the fitting of the spectra of the pristine and postmortem electrodes is compiled in Tables S2 and S3, respectively.
Opposite to the NMC powders, the O1s spectra of the surface of the processed electrodes did not evidence the presence of O-M. In addition, the feature ascribed to carbonate (C=O) with a maximum at 531.5 eV could be deconvoluted into two signals: the first one at 531.5 eV and the second at 532.5 eV, ascribed to C-O bonds. Interestingly, a small feature was also detected at 533.5 eV in the fresh sample. This is also associated with the presence of carbonate groups [33]. Thus, all of them will be quantified and discussed together in the following lines (hereafter referred to as carbonate-based compounds). Nevertheless, the presence of distinct carbonate-based compounds on the surface of the samples evidences the influence of the aging protocols on the chemical characteristics of the NMC coatings. This also explains the different double-layer resistances measured on the pristine cells by means of EIS. The area of the carbonate signal was increased in the following order: fresh ≈ aged-NMC < aged-electrode. Thus, the formation of carbonate-like species on the surface of the NMC powder upon ambient storage previously discussed is in good agreement with the results observed at the electrode scale for the fresh and aged-electrode samples. Interestingly, the signal was very similar for the fresh electrodes and the electrodes made of aged-NMC. The fitting of the C1s region also supports this, as the areas of the signals at 287.0 eV and 288.9 eV (ascribed to C-O and C=O bonds, respectively) were similar for the fresh and aged-NMC electrodes and slightly higher for the aged-electrode. In a recent study, Wood et al. [36] reported the removal of surface impurities of different NMCs in water solutions. It is likely that the same occurred when the aged-NMC was processed in NMP. In this context, the key question is what occurs with the carbonate dissolved in the NMP. Three facts should be considered. Firstly, the overall amount of carbonate generated in the aging of NMC was very low as its presence could not be determined by bulk characterization techniques such as XRD or EDX. Indeed, its concentration should be several orders of magnitude lower than other electronic insulating components of the electrode, i.e., the PVDF binder. Secondly, a fraction of the carbonate dissolved in NMP could be lost as CO2 facilitated by the vigorous stirring during the NMC electrode slurry processing. In fact, the native carbonate layer in NMC electrodes was reported to be removed and evolved as CO2 after cell assembly, just charging the cell to 3.9 V [34]. Additionally, thirdly, the rest of the carbonate could be homogeneously distributed throughout the electrode, minimizing its impact in the impedance of the NMC electrode.
Finally, the signals associated with the O-Metal bonds of the aged and the fresh electrodes could not be found at the electrode surface. In order to find this feature, the depth profile of the coatings was conducted on the three samples. The corresponding spectra, shown in Figure S9, show a similar O-M signal in the internal layers of the coatings, evidencing that the bulk composition was similar for the different samples. In parallel, Ni3+/Ni was calculated for the different samples in the depth profile analyses. The evolution of the Ni3+ with the depth for the three samples is shown in Figure S10. Interestingly, both the fresh and aged-electrode showed a marked difference between the surface coating and the first internal layer, evidencing that these aging conditions only affected the surface of the NMC particles (in good agreement with EIS results). Nevertheless, Ni3+/Ni increase in the aged-NMC electrode was gradual. This suggests that the processing of the aged NMC also affected the oxidation state of the internal layers of this transition metal oxide. This supports the hypothesis of the reduction of some Ni3+ to Ni2+ in the bulk of the material, which would facilitate the cation mixing determined by means of XRD fitting. Furthermore, the negative Ni3+/Ni value observed for the aged-NMC electrode suggests the presence of Ni-F bonds. The electrodes consisted of NMC811, PVDF and conductive C, and the sole chance for the origin of this negative value should be the interaction between the binder and the active material. Thus, it can be concluded that processing the electrodes with aged powder led to a stronger attachment between these two components.
In a recent study, Lin et al. [37] evidenced that the presence of a nickel valence gradient from the particle surface (Ni2+ rich) to the core (Ni2+ poor) enhances the thermal and cycling stability of NMC811. They evidenced that this gradient mitigated the formation of micro-cracks during the charge–discharge cycles, which cause a decrease in the electronic conductivity and contribute to the capacity decay. In our study, we have observed decreased DC and AC resistances with the aged-NMC electrodes, in which this nickel valence gradient has been detected. Nevertheless, the cycle life of these cells was found to be shorter than for those consisting of fresh electrodes. It must be mentioned that, in our case, this gradient was not obtained on purpose, and it was caused together with detrimental issues such as cation mixing. In any case, this gradient could be the reason behind the unexpectedly high electrochemical performance of the aged-NMC electrodes.
Finally, the signals in the O1s and C1s regions of the postmortem electrodes (Figure S8) evidenced the presence of similar amounts of carbonate for aged-NMC and fresh electrodes. The area of this feature was lower for the aged-electrode. This indicates that most of this carbonate was formed upon cycling, with a higher presence of this component for the electrodes with higher cycle life. In these samples, the O1s spectra could be deconvoluted in two main peaks: the first at ~531.5 eV and the second at ~533.4 eV. The area of these two contributions was similar (~1:1 ratio). Based on the above discussion, the abundance of C=O and C-O bonds was similar. In addition, the area of the signal at ~290 eV in the C1s region, attributed to C-F bonds, decreased in the following order: aged-electrode > aged-NMC > fresh. Furthermore, the area of the signal at 587.5 eV in the F1s spectra (Figure S8), associated with the F-C bonds, decreased following the same trend. The increase of these signals could be associated with the formation of a thicker cathode electrolyte interphase (CEI) that would lead to an increased double layer resistance (in good agreement with the EIS results). In fact, this would enhance the overpotential of the charge and discharge reactions, which was observed as one of the causes promoting the EOL of the cells.

4. Conclusions

As expected, the highest capacity retention was obtained with the fresh electrodes (379 cycles at SOH ≥ 80%). However, the capacity retention and power capability with the aged-NMC samples were well beyond the expectations: they achieved 313 cycles at SOH ≥ 80% and did not reach the cut-off voltage unless they were subjected to 10C pulses (the limit for fresh electrodes was 8C). Furthermore, the AC and DC resistances for the cells consisting of the latter cathodes were surprisingly low, and the capacity in the formation cycle was higher (189.9 ± 0.9 and 178.6 ± 0.6 mAh/g for cells with aged-NMC and fresh electrodes, respectively). XRD of the pristine electrodes revealed an increased interlayer distance and cation mixing after the processing of the aged NMC811. On the other hand, XPS analyses revealed: (i) the formation of a carbonate layer at the NMC particle surface, (ii) the redistribution of these carbonates upon the material processing, (iii) the stronger binder-NMC interactions after processing this aged NMC811 and (iv) the formation of a buffer region with higher Ni2+ fraction in these electrodes, in good agreement with the cation mixing evidenced by XRD. To the best of our knowledge, the latter three effects have not been previously discussed in the literature. It was determined that the storage of NMC811 electrodes might become a critical step in the production chain of battery manufacturers to avoid the formation of a resistive layer. On the other hand, storage-aging of NMC811 powder is not such a critical step; even though the material properties were affected, the electrochemical performance was in the same range as that obtained with fresh electrodes due to material washing during electrode manufacturing. The removal of the contaminants generated on the surface of the NMC particles might be advisable [23], but results in this work show that, during the electrode processing, their impact might be mitigated. This is a significant breakthrough, as most of the literature related to calendar aging of NMC811 points out the importance of avoiding the exposition of NMC811 to ambient air. In any case, lithium-ion cell manufacturers should thoroughly design their warehousing protocols to avoid the inconveniences described in this manuscript.

Supplementary Materials

The following supporting information can be downloaded at: https://www.mdpi.com/article/10.3390/batteries8080079/s1, Figure S1. Cross section SEM images obtained from (a–d) fresh and (e,f) aged-NMC coatings at different magnifications: ×1000 (a,e), ×1500 (b,f), ×3500 (c,g) and ×10,000 (d,h); Figure S2. Coulombic efficiency values obtained in the galvanostatic cycling experiments conducted at the C/3 current rate. Zoom-in of the first 10 cycles is provided in the inset figure; Figure S3. Bode diagrams recorded at the beginning- and end-of-life of a cell; Figure S4. DVA of the cells with the (a) fresh, (b) aged-NMC and (c) aged-electrode cathodes during all their cycle life; Figure S5. XRD patterns of the fresh (black line) and aged (blue line) NMC powders; Figure S6. XRD patterns of the postmortem fresh (black line) and aged-NMC (blue line) and aged-electrode cathodes; Figure S7. SEM images were obtained from (a) fresh and (b) aged NMC powder. Micrographs at 5K magnification of (c) fresh, (d) aged-NMC and (e) aged-electrode coatings. Micrographs at 20K magnification of (f) fresh, (g) aged-NMC and (h) aged-electrode coatings. Micrographs at 10K magnification of (i) fresh, (j) aged-NMC and (k) aged-electrode postmortem (PM) electrodes; Figure S8. XPS spectra of the postmortem electrodes. (a) O1s, (b) C1s, and (c) F1s regions of the postmortem fresh cathodes. (d) O1s, (e) C1s, and (f) F1s regions of the postmortem aged-NMC cathodes. (g) O1s, (h) C1s, and (i) F1s regions of the postmortem aged-electrode cathodes; Figure S9. Depth profile XPS spectra of the different coatings. O1s regions of the (a) fresh, (b) aged-NMC and (c) aged-electrode coatings; Figure S10. Ni3+/Ni total fraction with the depth of the sample obtained by the methodology described in reference [21] for the fresh (black squares), aged-electrode (red circles) and aged-NMC (blue triangles) coatings; Table S1. Resistance values obtained from the fitting of the impedance spectra of the cells consisting of fresh-electrode, aged-NMC and aged-electrode cathodes and graphite anodes at the beginning (BOL) and end of life (EOL); Table S2. Signals from the XPS spectra of the fresh and aged NMC powder and results from the fittings, beam energy (BE) of these signals, full width at half maximum (FWHM) of the fittings, area calculated from the fittings and atomic percentage calculated from this area; Table S3. Signals from the XPS spectra of the fresh and aged-NMC and aged-electrode coatings before electrochemical tests and results from the fittings, beam energy (BE) of these signals, full width at half maximum (FWHM) of the fittings, area calculates from the fittings and atomic percentage calculated from this area; Table S4. Signals from the XPS spectra of the fresh and aged-NMC and aged-electrode electrodes obtained from disassembled cells after electrochemical tests and results from the fittings, beam energy (BE) of these signals, full width at half maximum (FWHM) of the fittings, area calculates from the fittings and atomic percentage calculated from this area. References [38,39,40,41] are cited in the supplementary materials.

Author Contributions

I.d.M.: Conceptualization, Funding acquisition, Project administration, Supervision, Writing—review and editing. I.L.-M.: Conceptualization, Data curation, Formal analysis, Investigation, Writing—original draft. S.S.-I.: Conceptualization, Project administration, Supervision, Writing—review and editing. A.E.-B.: Conceptualization, Methodology, Supervision, Writing—review and editing. O.B.: Data curation, Formal analysis, Writing—review and editing. S.L.-P.: Methodology, Validation, Supervision. I.B.: Methodology, Validation, Supervision. V.P.: Supervision; Visualization; Writing—review and editing. T.R.: Supervision; Visualization; Writing—review and editing. H.-J.G.: Supervision; Writing—review and editing. I.U.: Funding acquisition, Resources, Supervision, Writing—review and editing. All authors have read and agreed to the published version of the manuscript.

Funding

This work was supported by European Union’s Horizon 2020 research and innovation programme [No. 814389 (SPIDER project)]; and the CDTI—Ministerio De Ciencia e Innovación’s ‘CERVERA Centros Tecnológicos’ program [CER-20191006 (ALMAGRID project)]. V.P. and T.R. also wish to thank the funding from Gobierno Vasco/Eusko Jaurlaritza (IT-1226-19).

Institutional Review Board Statement

Not applicable.

Informed Consent Statement

Not applicable.

Data Availability Statement

The data presented in this study are available on request from the corresponding author. The raw data are not publicly available due to confidentiality provisions in project consortium agreements.

Acknowledgments

Authors acknowledge Carmen Palacios for the SEM micrographs, Enara Bueses, Iñigo Arzac and Andoni Contreras for the electrode manufacturing at CIDETEC’s pilot plant and Lara Liébana for assembling the coin cells.

Conflicts of Interest

The authors declare no conflict of interest. The funders had no role in the design of the study; in the collection, analyses, or interpretation of data; in the writing of the manuscript, or in the decision to publish the results.

References

  1. Zhang, H.; Armand, M.; Rojo, T. Innovative Polymeric Materials for Better Rechargeable Batteries: Strategies from CIC Energigune. J. Electrochem. Soc. 2019, 166, A679–A686. [Google Scholar] [CrossRef]
  2. Winter, M.; Barnett, B.; Xu, K. Before Li Ion Batteries. Chem. Rev. 2018, 118, 11433–11456. [Google Scholar] [CrossRef] [PubMed]
  3. Chen, S.; Dai, F.; Cai, M. Opportunities and Challenges of High-Energy Lithium Metal Batteries for Electric Vehicle Applications. ACS Energy Lett. 2020, 5, 3140–3151. [Google Scholar] [CrossRef]
  4. Liu, Y.; Zhu, Y.; Cui, Y. Challenges and opportunities towards fast-charging battery materials. Nat. Energy 2019, 4, 540–550. [Google Scholar] [CrossRef]
  5. International Energy Agency. Global EV Outlook 2020: Entering the Decade of Electric Drive? OECD Publishing: Paris, France, 2020. [Google Scholar] [CrossRef]
  6. Chae, S.; Ko, M.; Kim, K.; Ahn, K.; Cho, J. Confronting Issues of the Practical Implementation of Si Anode in High-Energy Lithium-Ion Batteries. Joule 2017, 1, 47–60. [Google Scholar] [CrossRef] [Green Version]
  7. Li, M.; Lu, J.; Chen, Z.; Amine, K. 30 Years of Lithium-Ion Batteries. Adv. Mater. 2018, 30, 1800561. [Google Scholar] [CrossRef] [Green Version]
  8. Armand, M.; Axmann, P.; Bresser, D.; Copley, M.; Edström, K.; Ekberg, C.; Guyomard, D.; Lestriez, B.; Novák, P.; Petranikova, M.; et al. Lithium-ion batteries—Current state of the art and anticipated developments. J. Power Sources 2020, 479, 228708. [Google Scholar] [CrossRef]
  9. Wetjen, M.; Pritzl, D.; Jung, R.; Solchenbach, S.; Ghadimi, R.; Gasteiger, H.A. Differentiating the Degradation Phenomena in Silicon-Graphite Electrodes for Lithium-Ion Batteries. J. Electrochem. Soc. 2017, 164, A2840–A2852. [Google Scholar] [CrossRef]
  10. Liu, J.; Bao, Z.; Cui, Y.; Dufek, E.J.; Goodenough, J.B.; Khalifah, P.; Li, Q.; Liaw, B.Y.; Liu, P.; Manthiram, A.; et al. Pathways for practical high-energy long-cycling lithium metal batteries. Nat. Energy 2019, 4, 180–186. [Google Scholar] [CrossRef]
  11. Li, W.; Erickson, E.M.; Manthiram, A. High-nickel layered oxide cathodes for lithium-based automotive batteries. Nat. Energy 2020, 5, 26–34. [Google Scholar] [CrossRef]
  12. Busà, C.; Belekoukia, M.; Loveridge, M.J. The effects of ambient storage conditions on the structural and electrochemical properties of NMC-811 cathodes for Li-ion batteries. Electrochim. Acta 2021, 366, 137358. [Google Scholar] [CrossRef]
  13. Kasnatscheew, J.; Röser, S.; Börner, M.; Winter, M. Do Increased Ni Contents in LiNixMnyCozO2 (NMC) Electrodes Decrease Structural and Thermal Stability of Li Ion Batteries? A Thorough Look by Consideration of the Li+ Extraction Ratio. ACS Appl. Energy Mater. 2019, 2, 7733–7737. [Google Scholar] [CrossRef]
  14. Ryu, H.H.; Park, K.J.; Yoon, C.S.; Sun, Y.K. Capacity Fading of Ni-rich Li[NixCoyMn1−x−y]O2 (0.6 ≤ x ≤ 0.95) Cathodes for High-Energy-Density Lithium-Ion Batteries: Bulk or Surface Degradation? Chem. Mater. 2018, 30, 1155–1163. [Google Scholar] [CrossRef]
  15. Zhang, S.S. Problems and their origins of Ni-rich layered oxide cathode materials. Energy Storage Mater. 2020, 24, 247–254. [Google Scholar] [CrossRef]
  16. Jung, R.; Metzger, M.; Maglia, F.; Stinner, C.; Gasteiger, H.A. Oxygen release and its effect on the cycling stability of LiNixMnyCozO2(NMC) cathode materials for Li-ion batteries. J. Electrochem. Soc. 2017, 164, A1361–A1377. [Google Scholar] [CrossRef]
  17. Teichert, P.; Eshetu, G.G.; Jahnke, H.; Figgemeier, E. Degradation and aging routes of Ni-rich cathode based Li-ion batteries. Batteries 2020, 6, 8. [Google Scholar] [CrossRef] [Green Version]
  18. Ely, D.R.; García, R.E. Heterogeneous Nucleation and Growth of Lithium Electrodeposits on Negative Electrodes. J. Electrochem. Soc. 2013, 160, 662–668. [Google Scholar] [CrossRef]
  19. Wang, J.; Qiu, B.; Cao, H.; Xia, Y.; Liu, Z. Electrochemical properties of 0.6Li[Li1/3Mn2/3]O2-0.4LiNixMnyCo1−x−yO2 cathode materials for lithium-ion batteries. J. Power Sources 2012, 218, 128–133. [Google Scholar] [CrossRef]
  20. Ghatak, K.; Basu, S.; Das, T.; Sharma, V.; Kumar, H.; Datta, D. Effect of cobalt content on the electrochemical properties and structural stability of NCA type cathode materials. Phys. Chem. Chem. Phys. 2018, 20, 22805–22817. [Google Scholar] [CrossRef] [Green Version]
  21. Bondarchuk, O.; LaGrow, A.P.; Kvasha, A.; Thieu, T.; Ayerbe, E.; Urdampilleta, I. On the X-ray photoelectron spectroscopy analysis of LiNixMnyCozO2 material and electrodes. Appl. Surf. Sci. 2021, 535, 147699. [Google Scholar] [CrossRef]
  22. Jung, R.; Morasch, R.; Karayaylali, P.; Phillips, K.; Stinner, C.; Maglia, F.; Shao-Horn, Y.; Gasteiger, H.A. Effect of Ambient Storage on the Degradation of Ni-Rich Positive Electrode Materials (NMC811) for Li-Ion Batteries. J. Electrochem. Soc. 2018, 165, A132–A141. [Google Scholar] [CrossRef]
  23. Sicklinger, J.; Metzger, M.; Beyer, H.; Pritzl, D.; Gasteiger, H.A. Ambient Storage Derived Surface Contamination of NCM811 and NCM111: Performance Implications and Mitigation Strategies. J. Electrochem. Soc. 2019, 166, A2322–A2335. [Google Scholar] [CrossRef]
  24. Landa-Medrano, I.; Eguia-Barrio, A.; Sananes-Israel, S.; Lijó-Pando, S.; Boyano, I.; Alcaide, F.; Urdampilleta, I.; De Meatza, I. In Situ Analysis of NMC ∣ graphite Li-Ion Batteries by Means of Complementary Electrochemical Methods. J. Electrochem. Soc. 2020, 167, 090528. [Google Scholar] [CrossRef]
  25. Rodríguez-Carvajal, J. Recent advances in magnetic structure determination by neutron powder diffraction. Phys. B Phys. Condens. Matter 1993, 192, 55–69. [Google Scholar] [CrossRef]
  26. Plattard, T.; Barnel, N.; Assaud, L.; Franger, S.; Duffault, J.-M. Combining a Fatigue Model and an Incremental Capacity Analysis on a Commercial NMC/Graphite Cell under Constant Current Cycling with and without Calendar Aging. Batteries 2019, 5, 36. [Google Scholar] [CrossRef] [Green Version]
  27. Raj, T.; Wang, A.A.; Monroe, C.W.; Howey, D.A. Investigation of Path-Dependent Degradation in Lithium-Ion Batteries. Batter. Supercaps 2020, 3, 1377–1385. [Google Scholar] [CrossRef]
  28. Dose, W.M.; Xu, C.; Grey, C.P.; De Volder, M.F.L. Effect of Anode Slippage on Cathode Cutoff Potential and Degradation Mechanisms in Ni-Rich Li-Ion Batteries. Cell Reports Phys. Sci. 2020, 1, 100253. [Google Scholar] [CrossRef]
  29. Wang, Q.; Shen, C.H.; Shen, S.Y.; Xu, Y.F.; Shi, C.G.; Huang, L.; Li, J.T.; Sun, S.G. Origin of Structural Evolution in Capacity Degradation for Overcharged NMC622 via Operando Coupled Investigation. ACS Appl. Mater. Interfaces 2017, 9, 24731–24742. [Google Scholar] [CrossRef]
  30. Song, C.; Wang, W.; Peng, H.; Wang, Y.; Zhao, C.; Zhang, H.; Tang, Q.; Lv, J.; Du, X.; Dou, Y. Improving the electrochemical performance of LiNi0.80Co0.15Al0.05O2 in lithium ion batteries by LiAlO2 surface modification. Appl. Sci. 2018, 8, 378. [Google Scholar] [CrossRef] [Green Version]
  31. Xia, Y.; Zheng, J.; Wang, C.; Gu, M. Designing principle for Ni-rich cathode materials with high energy density for practical applications. Nano Energy 2018, 49, 434–452. [Google Scholar] [CrossRef]
  32. Lin, F.; Markus, I.M.; Nordlund, D.; Weng, T.C.; Asta, M.D.; Xin, H.L.; Doeff, M.M. Surface reconstruction and chemical evolution of stoichiometric layered cathode materials for lithium-ion batteries. Nat. Commun. 2014, 5, 3529. [Google Scholar] [CrossRef]
  33. Phillip, N.D.; Daniel, C.; Veith, G.M. Influence of Binder Coverage on Interfacial Chemistry of Thin Film LiNi0.6Mn0.2Co0.2O2 Cathodes. J. Electrochem. Soc. 2020, 167, 040521. [Google Scholar] [CrossRef]
  34. Renfrew, S.E.; McCloskey, B.D. Quantification of Surface Oxygen Depletion and Solid Carbonate Evolution on the First Cycle of LiNi0.6Mn0.2Co0.2O2 Electrodes. ACS Appl. Energy Mater. 2019, 2, 3762–3772. [Google Scholar] [CrossRef]
  35. Mao, Y.; Wang, X.; Xia, S.; Zhang, K.; Wei, C.; Bak, S.; Shadike, Z.; Liu, X.; Yang, Y.; Xu, R.; et al. High-Voltage Charging-Induced Strain, Heterogeneity, and Micro-Cracks in Secondary Particles of a Nickel-Rich Layered Cathode Material. Adv. Funct. Mater. 2019, 29, 1900247. [Google Scholar] [CrossRef]
  36. Wood, M.; Li, J.; Ruther, R.E.; Du, Z.; Self, E.C.; Meyer, H.M.; Daniel, C.; Belharouak, I.; Wood, D.L. Chemical stability and long-term cell performance of low-cobalt, Ni-Rich cathodes prepared by aqueous processing for high-energy Li-Ion batteries. Energy Storage Mater. 2020, 24, 188–197. [Google Scholar] [CrossRef]
  37. Lin, R.; Bak, S.M.; Shin, Y.; Zhang, R.; Wang, C.; Kisslinger, K.; Ge, M.; Huang, X.; Shadike, Z.; Pattammattel, A.; et al. Hierarchical nickel valence gradient stabilizes high-nickel content layered cathode materials. Nat. Commun. 2021, 12, 2350. [Google Scholar] [CrossRef] [PubMed]
  38. Li, X.; Colclasure, A.M.; Finegan, D.P.; Ren, D.; Shi, Y.; Feng, X.; Cao, L.; Yang, Y.; Smith, K. Degradation mechanisms of high capacity 18,650 cells containing Si-graphite anode and nickel-rich NMC cathode. Electrochim. Acta 2019, 297, 1109–1120. [Google Scholar] [CrossRef]
  39. Raccichini, R.; Amores, M.; Hinds, G. Critical review of the use of reference electrodes in Li-ion batteries: A diagnostic perspective. Batteries 2019, 5, 12. [Google Scholar] [CrossRef] [Green Version]
  40. Le, H.T.; Kalubarme, R.S.; Ngo, D.T.; Jang, S.Y.; Jung, K.N.; Shin, K.H.; Park, C.J. Citrate gel synthesis of aluminum-doped lithium lanthanum titanate solid electrolyte for application in organic-type lithium–oxygen batteries. J. Power Sources 2015, 274, 1188–1199. [Google Scholar] [CrossRef]
  41. Huang, L.H.; Chen, D.; Li, C.C.; Chang, Y.L.; Lee, J.T. Dispersion homogeneity and electrochemical performance of Si anodes with the addition of various water-based binders. J. Electrochem. Soc. 2018, 165, A2239–A2246. [Google Scholar] [CrossRef]
Figure 1. Galvanostatic cycling experiments conducted at C/3 current rate: (a) discharge capacity per gram of NMC and (b) capacity retention during the cycle life of the cells.
Batteries 08 00079 g001
Figure 2. Nyquist diagrams of a representative cell per type of positive electrode: fresh (black lines), aged-NMC (blue lines) and aged-electrode (red lines). Continuous and dashed lines are used for the spectra obtained at the beginning and the end of life, respectively. The equivalent circuits for the fitting of the spectra are also included.
Batteries 08 00079 g002
Figure 3. DC resistance evolution during the cycle life of the cells with different cathodes: fresh (black squares), aged-NMC (blue triangles) and aged-electrode (red circles). Error bars indicate the standard deviation between the different cells with the same cathodes.
Batteries 08 00079 g003
Figure 4. dQ/dV of the cells (a) at the beginning and (b) end of life performed at C/20 between 2.8 and 4.2 V at C/20. Included cells with fresh (black line), aged-NMC (blue line) and aged-electrode (red line) cathodes. Main features of the scan are labelled as c1, c2, c3, c4, d1, d2, d3 and d4. Dashed lines are included to evidence the overpotential generated for the main signals.
Batteries 08 00079 g004
Figure 5. Power tests conducted on the lithium-ion cells with the NMC811 electrodes subjected to different aging protocols.
Batteries 08 00079 g005
Figure 6. X-ray diffraction patterns of the fresh (black line), aged-NMC (blue line) and aged-electrode (red line) coatings. (003)/(104) peak intensity ratios, theoretical reflections for NMC, graphite and aluminum and unit cell parameters for the fitting of each diffractogram are included.
Batteries 08 00079 g006
Figure 7. XPS spectra of the NMC powders: C1s region of (a) fresh and (b) aged NMC powder, and O1s region (c) of the fresh and (d) aged NMC.
Batteries 08 00079 g007
Figure 8. XPS spectra of the NMC811 coatings: O1s region of the (a) fresh, (b) aged-NMC and (c) aged-electrode coatings.
Batteries 08 00079 g008
Publisher’s Note: MDPI stays neutral with regard to jurisdictional claims in published maps and institutional affiliations.

