
Electrochemical Open-Circuit Voltage and Pressure-Concentration-Temperature Isotherm Comparison for Metal Hydride Alloys


Abstract
:
1. Introduction
2. Experimental Section
3. Results and Discussion
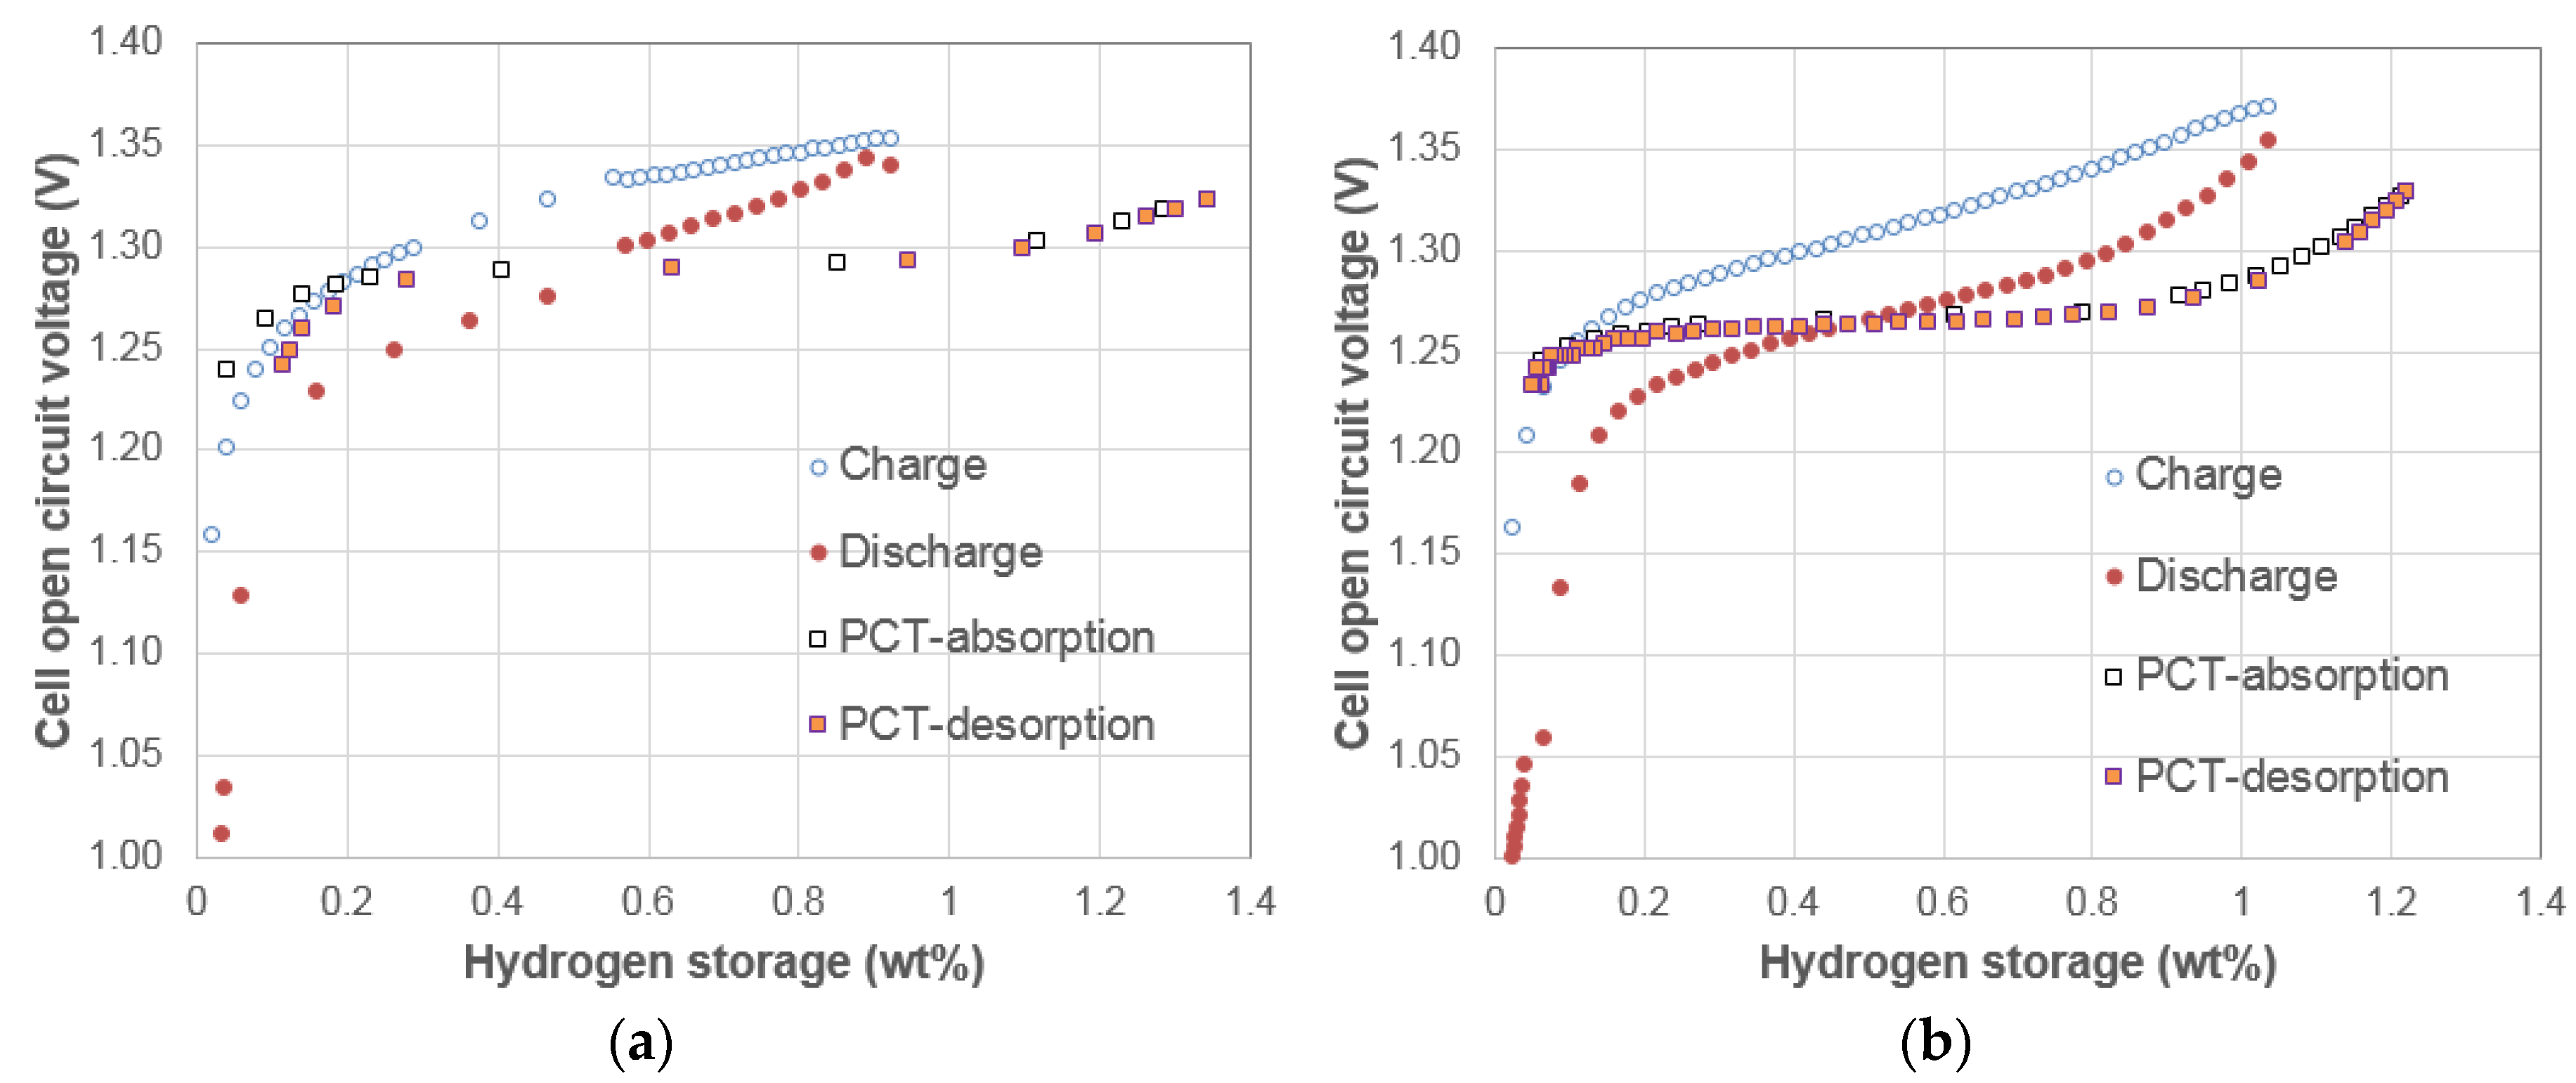
3.1. Electrochemical Pressure-Concentration-Temperature of AB2 Metal Hydride Alloy
- (1)
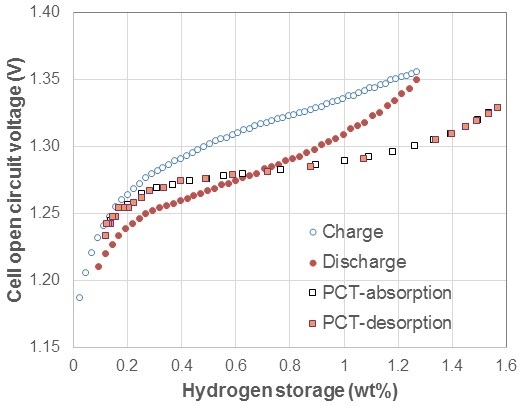
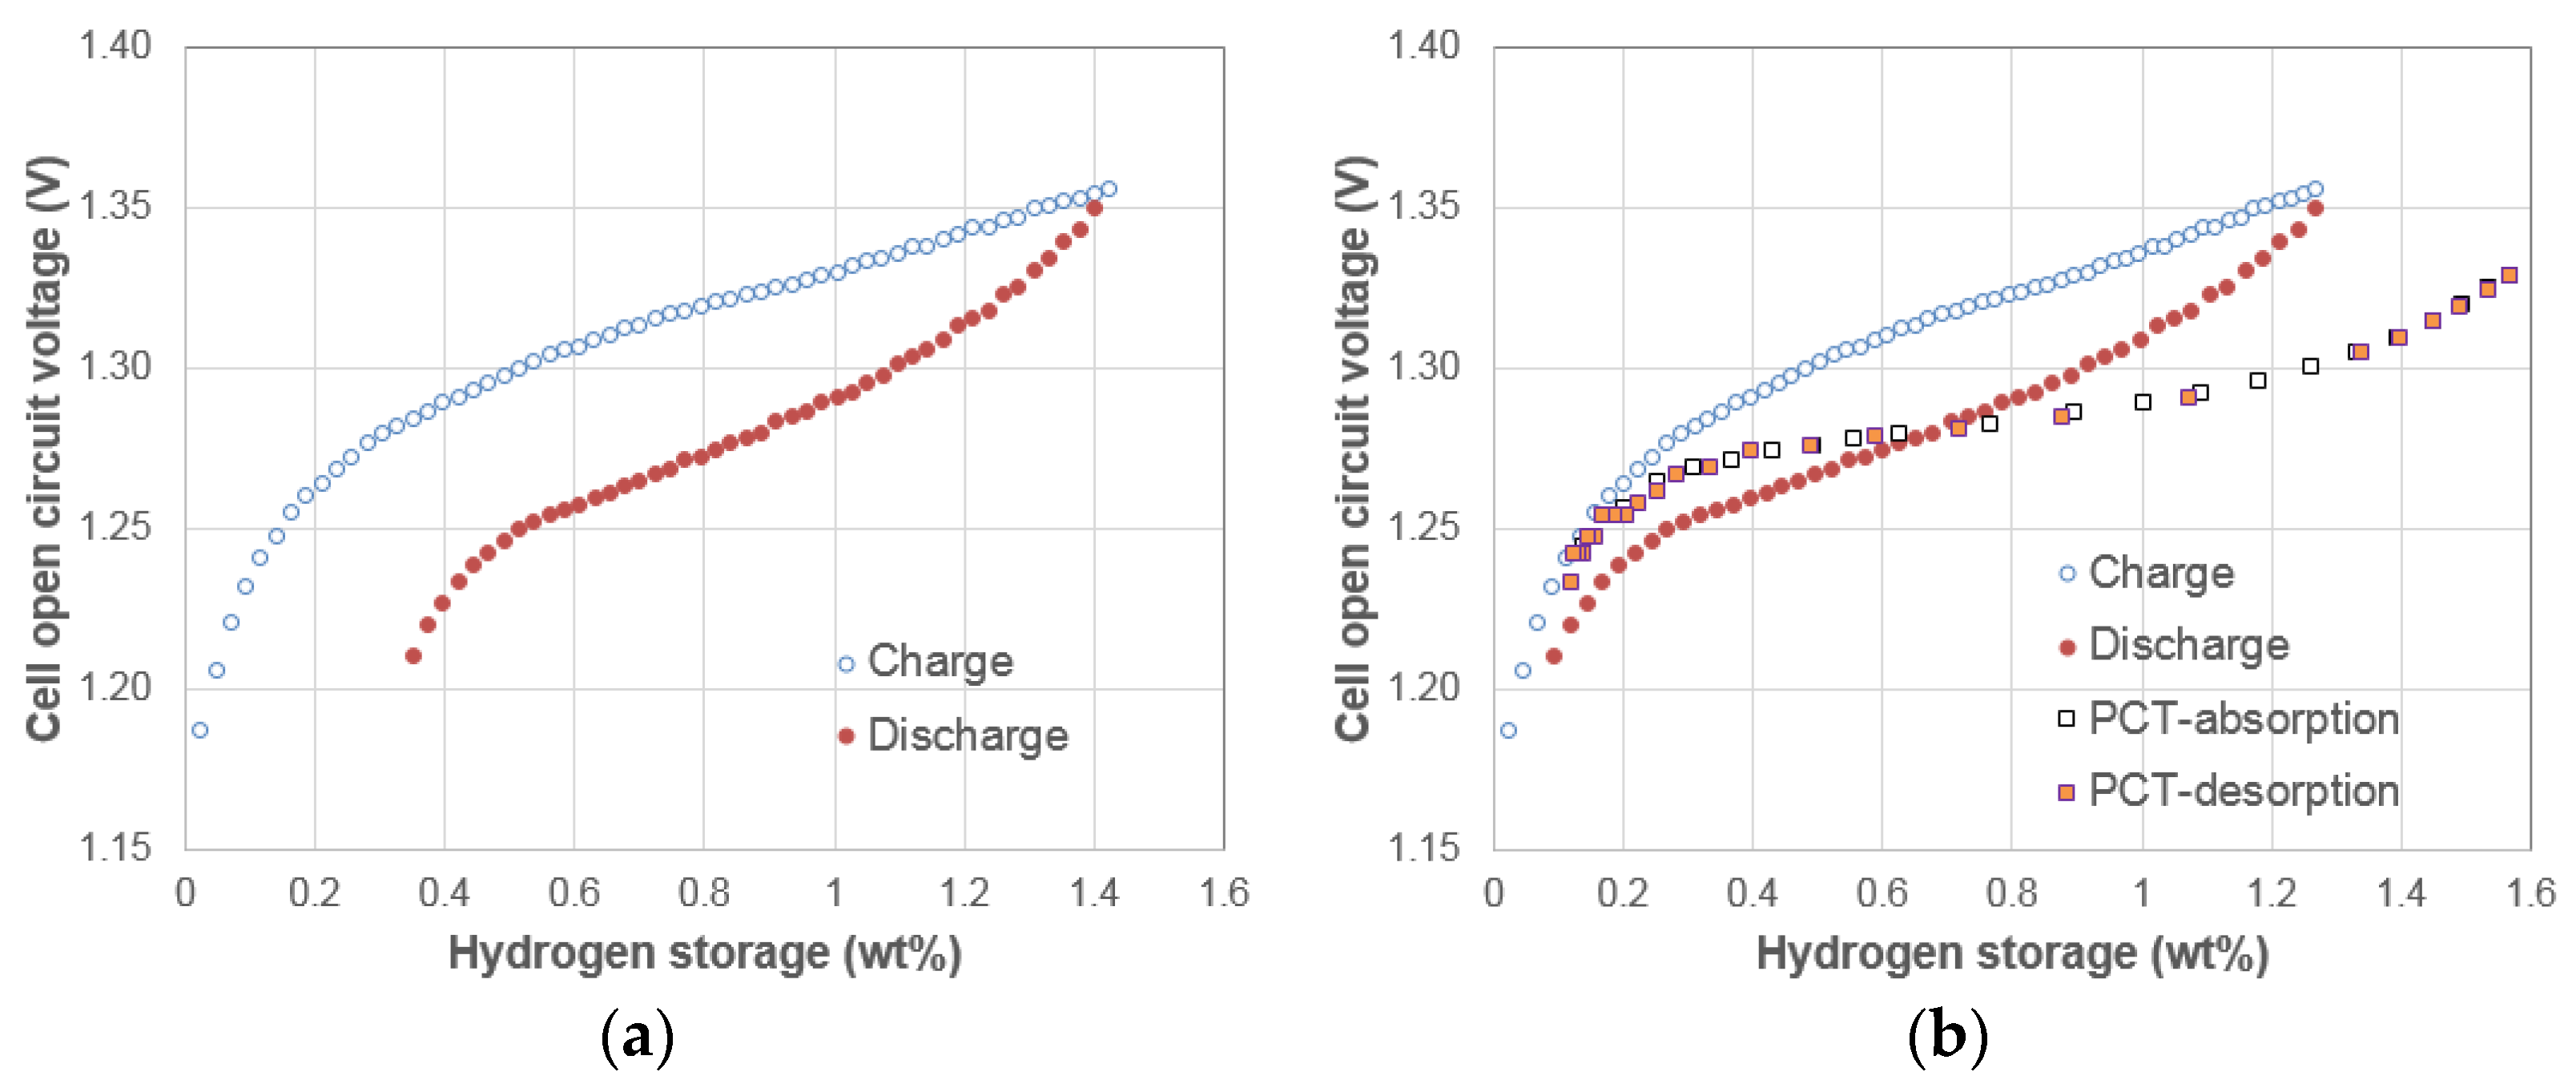
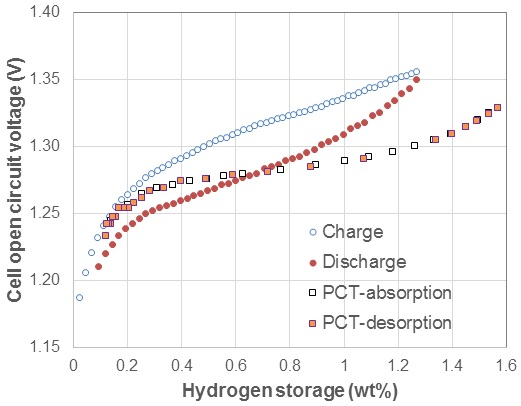
- The EPCT curve is much more slanted than the PCT curve.
- (2)
- The hysteresis of EPCT is much larger than that of PCT, which has been demonstrated previously by Wójcik and his coworkers [13].
- (3)
- The maximum capacity measured from EPCT is smaller than that from PCT, which has also been previously shown by Wójcik and his coworkers [13].
- (4)
- The PCT isotherm is closer to the EPCT charge curve when the hydrogen storage content is small, but as the hydrogen storage content increases, it then moves to the center between the EPCT charge and discharge curves and finally flattens out.
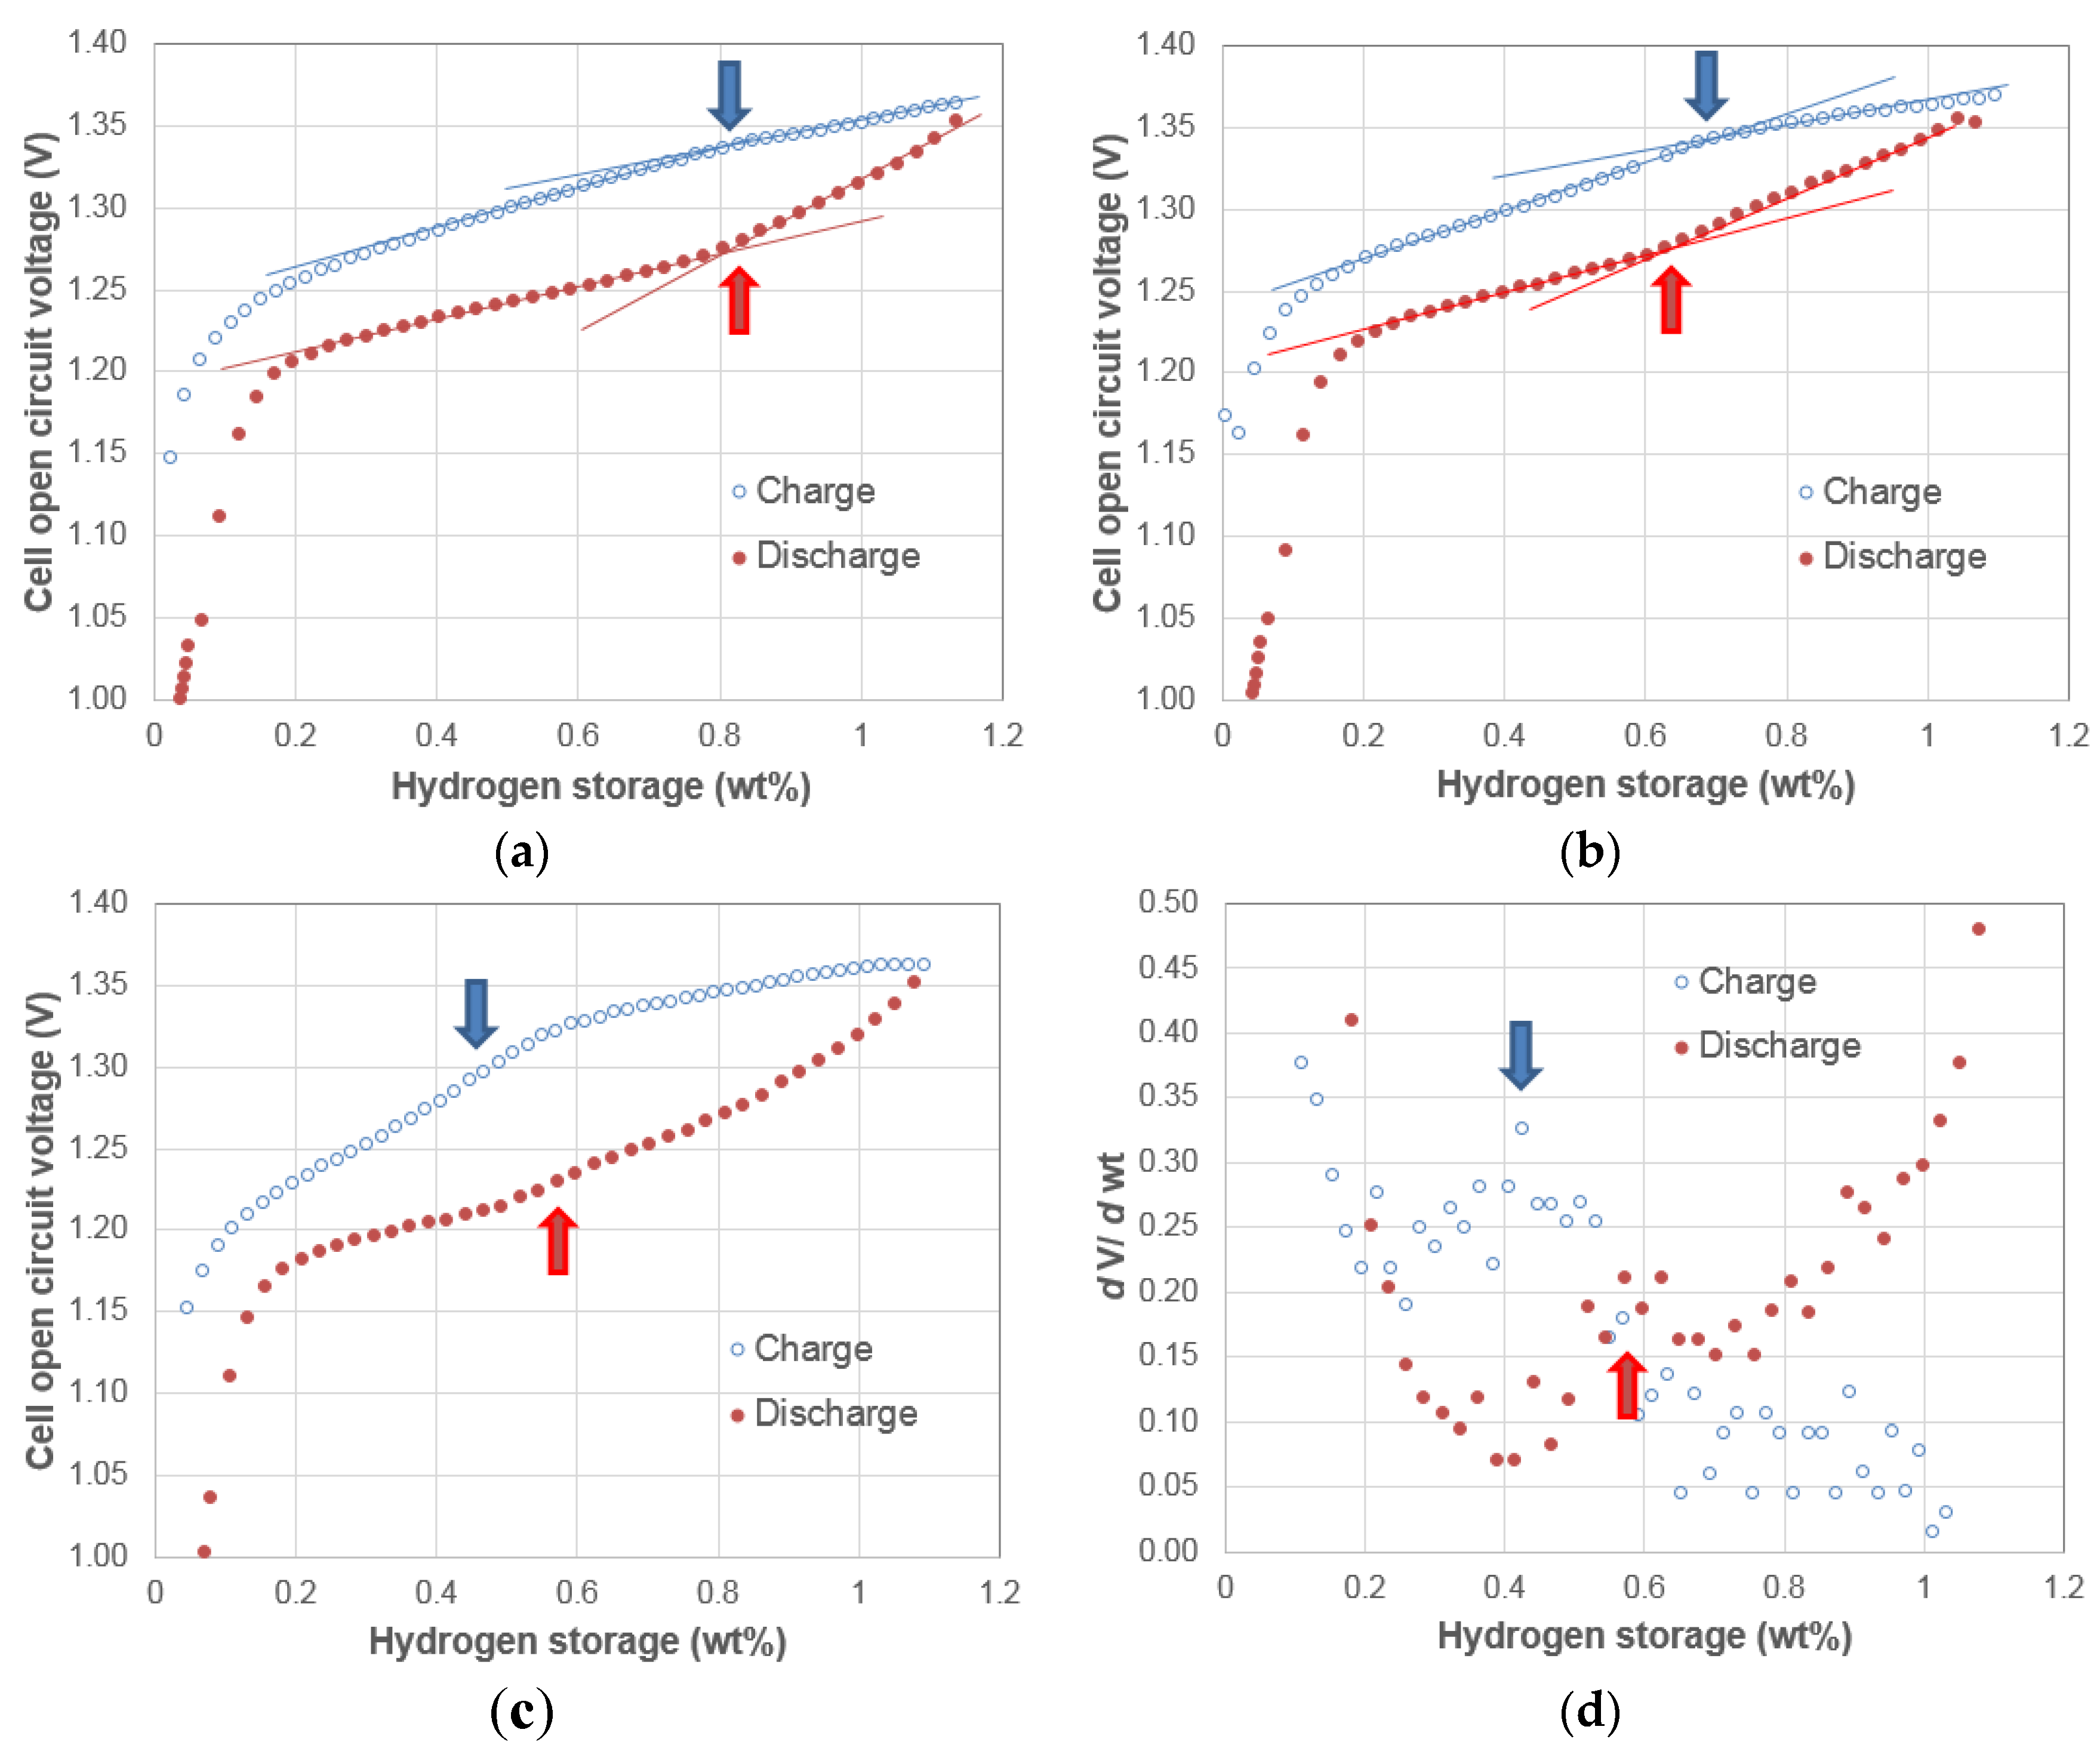
3.2. Electrochemical Pressure-Concentration-Temperatures of Two AB5 Metal Hydride Alloys
3.3. Electrochemical Pressure-Concentration-Temperatures of Mixtures of Two AB5 Metal Hydride Alloys
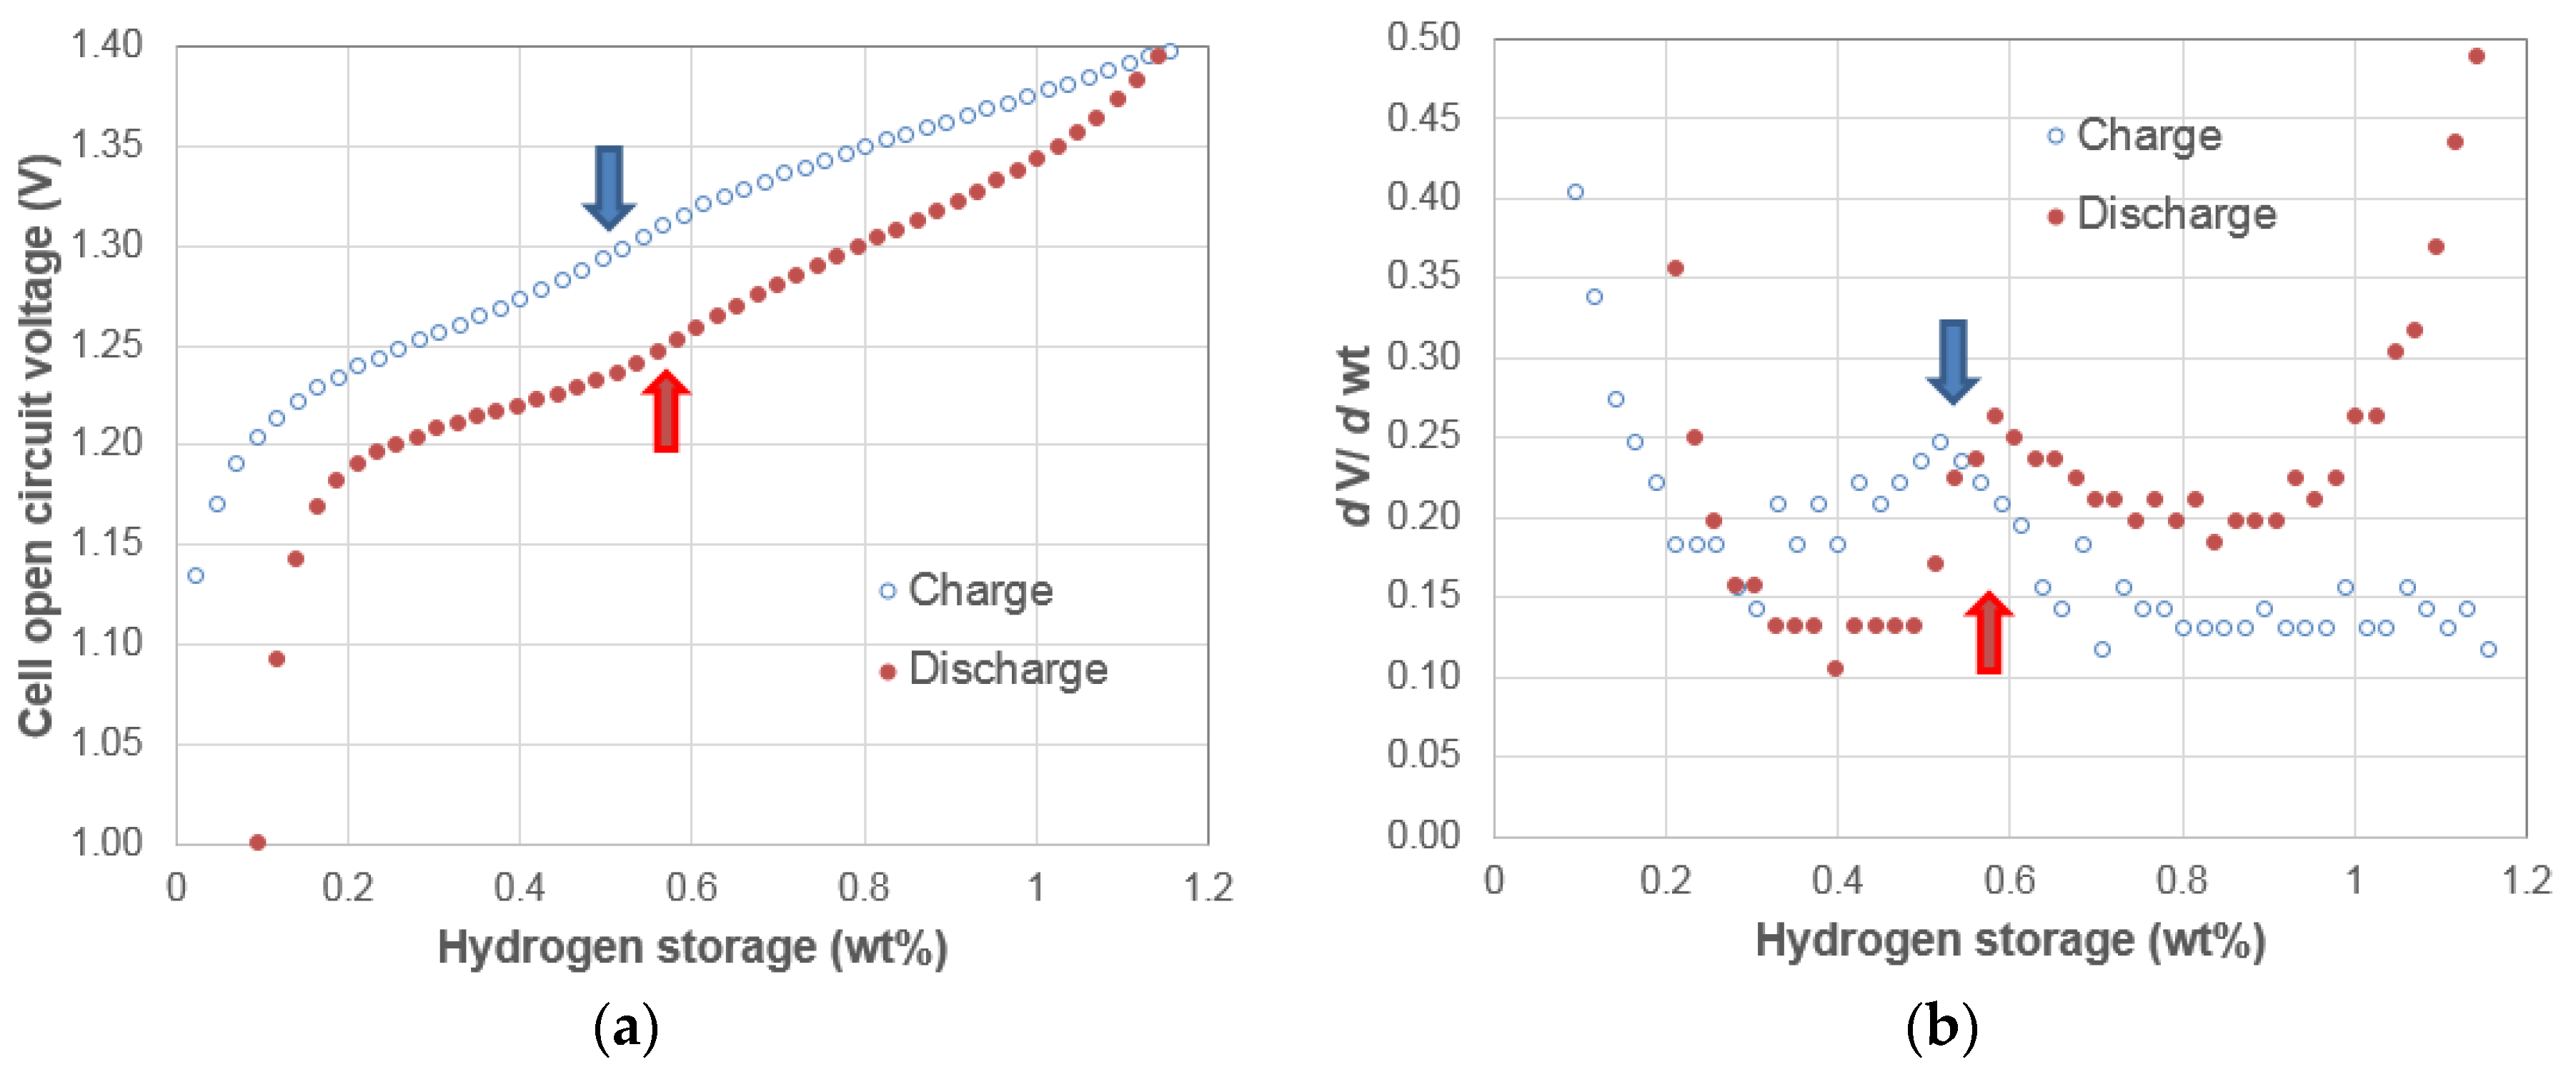
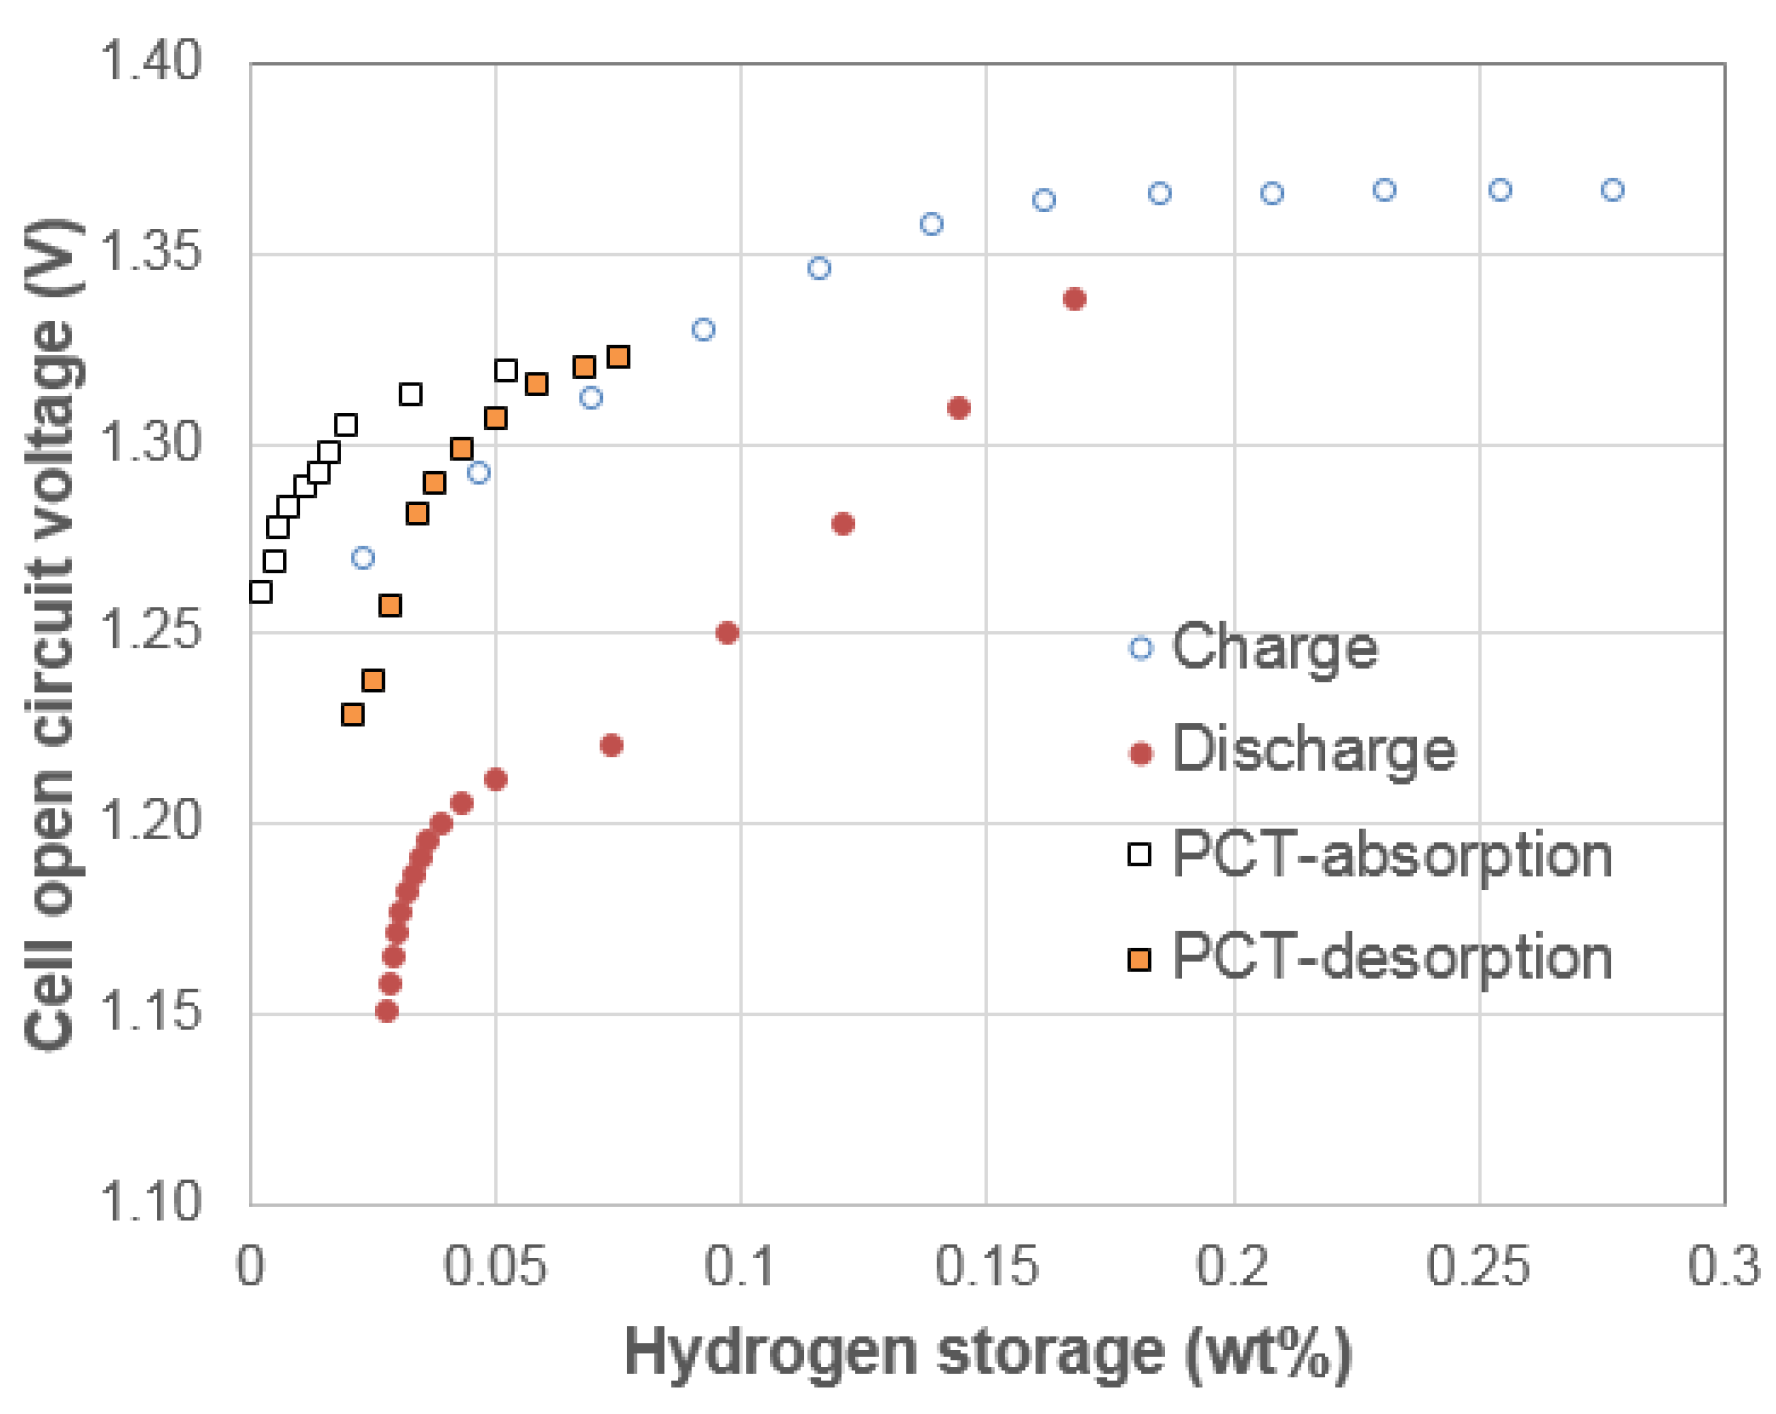
3.4. Electrochemical Pressure-Concentration-Temperature of ZrNi4.5 Metal Hydride Alloy
3.5. Discussion
4. Conclusions
Acknowledgments
Author Contributions
Conflicts of Interest
References
- Young, K. Metal Hydrides. In Reference Module in Chemistry, Molecular Sciences and Chemical Engineering; Reedijk, J., Ed.; Elsevier: Waltham, MA, USA, 2012. [Google Scholar] [CrossRef]
- Young, K.; Chao, B.; Liu, Y.; Nei, J. Microstructures of the oxides on the activated AB2 and AB5 metal hydride alloys surface. J. Alloy. Compd. 2014, 606, 97–104. [Google Scholar] [CrossRef]
- Young, K.; Wong, D.F.; Nei, J.; Reichman, B. Electrochemical properties of hypo-stoichiometric Y-doped AB2 metal hydride alloys at ultra-low temperature. J. Alloy. Compd. 2015, 643, 17–27. [Google Scholar] [CrossRef]
- Wong, D.F.; Young, K.; Nei, J.; Wang, L.; Ng, K.Y.S. Effects of Nd-addition on the structural, hydrogen storage, and electrochemical properties of C14 metal hydride alloys. J. Alloy. Compd. 2015, 647, 507–518. [Google Scholar] [CrossRef]
- Young, K.; Chang, S.; Chao, B.; Nei, J. Microstructures of the activated Si-containing AB2 metal hydride alloy surface by transmission electron microscope. Batteries 2016, 2. [Google Scholar] [CrossRef]
- Young, K.; Huang, B.; Regmi, R.K.; Lawes, G.; Liu, Y. Comparisons of metallic clusters imbedded in the surface of AB2, AB5, and A2B7 alloys. J. Alloy. Compd. 2010, 506, 831–840. [Google Scholar] [CrossRef]
- Song, J.; Meng, B.; Tan, X.; Liu, S. Surface-modified proton conducting perovskite hollow fibre membranes by Pd-coating for enhanced hydrogen permeation. Int. J. Hydrog. Energy 2015, 40, 6118–6127. [Google Scholar] [CrossRef]
- Bliznakov, S.; Lefterova, E.; Bozukov, L.; Popov, A.; Andreev, P. Techniques for Characterization of Hydrogen Absorption/Desorption in Metal Hydride Alloys. In Proceedings of the International Workshop Advanced Techniques for Energy Source Investigation and Testing, Sofia, Bulgaria, 4–9 September 2004; pp. 19-1–19-6.
- Raju, M.; Ananth, M.V.; Vijayaraghaven, L. Influence of temperature on the electrochemical characteristics of MmNi3.03Si0.85Co0.60Mn0.31Al0.08 hydrogen storage alloys. J. Power Sources 2008, 180, 830–835. [Google Scholar] [CrossRef]
- Feng, F.; Ping, X.; Zhou, Z.; Geng, M.; Han, J.; Northwood, D.O. The relationship between equilibrium potential during discharge and hydrogen concentration in a metal hydride electrode. Int. J. Hydrog. Energy 1998, 23, 599–602. [Google Scholar] [CrossRef]
- Bliznakov, S.; Lefterova, E.; Dimitrov, N. Electrochemical PCT isotherm study of hydrogen absorption/desorption in AB5 type intermetallic compounds. Int. J. Hydrog. Energy 2008, 33, 5789–5794. [Google Scholar] [CrossRef]
- Kopczyk, M.; Wójcik, G.; Mlynarek, G.; Sierczyńska, A.; Beĺtowska-Brzezinska, M. Electrochemical absoption-desoprtion of hydrogen on multicomponent Zr-Ti-V-Ni-Cr-Fe alloys in alkaline solution. J. Appl. Electrochem. 1996, 26, 639–645. [Google Scholar] [CrossRef]
- Wójcik, G.; Kopczyk, M.; Mlynarek, G.; Majchrzyckia, W.; Beĺtowska-Brzezinska, M. Electrochemical behavior of multicomponent Zr-Ti-V-Ni-Cr-Fe alloys in alkaline solution. J. Power Sources 1996, 58, 73–78. [Google Scholar] [CrossRef]
- Zhu, Y.F.; Pan, H.G.; Gao, M.X.; Ma, J.X.; Li, S.Q.; Wang, Q.D. The effect of Zr substitution for Ti on the microstructures and electrochemical properties of electrode alloys Ti1−xZrxV1.6Mn0.32Cr0.48Ni0.6. Int. J. Hydrog. Energy 2015, 40, 6118–6127. [Google Scholar] [CrossRef]
- Hou, C.; Zhao, M.; Li, J.; Huang, L.; Wang, Y.; Yue, M. Enthalpy change (ΔH°) and entropy (ΔS°) measurement of CeMn1−xAl1−xNi2x (x = 0.00, 0.25, 0.50 and 0.75) hydrides by electrochemical P-C-T curve. Int. J. Hydrog. Energy 2008, 33, 3762–3766. [Google Scholar] [CrossRef]
- Hu, F.; Zhang, Y.; Zhang, Y.; Hou, Z.; Dong, Z.; Deng, L. Microstructure and electrochemical hydrogen storage characteristics of CeMg12 + 100wt%Ni + Ywt%TiF3 (Y = 0, 3, 5) alloys prepared by ball milling (in Chinese). J. Inorg. Mater. 2013, 28, 217–223. [Google Scholar] [CrossRef]
- Kudo, H.; Unno, K.; Kamegawa, A.; Takamura, H.; Okada, M. Synthesis and protium absorption properties of vapor growth carbon nano-fibers grown by Fe-based catalyst. Mater. Trans. 2002, 42, 1127–1132. [Google Scholar] [CrossRef]
- Yang, H.; Zhang, H.; Mo, W.; Zhou, Z. Mg1.8La0.2Ni-xNi nanocomposites for electrochemical hydrogen storage. J. Phys. Chem. B 2006, 110, 25769–25774. [Google Scholar] [CrossRef] [PubMed]
- Kleperis, J.; Wójcik, G.; Czerwinski, A.; Showronski, J.; Kopczyk, M.; Beĺtowska-Brzezinska, M. Electrochemical behavior of metal hydride. J. Solid State Electrochem. 2001, 5, 229–249. [Google Scholar] [CrossRef]
- Watanabe, K.; Koseki, M.; Kumagai, N. Effect of cobalt addition to nickel hydroxide as a positive material for rechargeable alkaline batteries. J. Power Sources 1996, 58, 23–28. [Google Scholar] [CrossRef]
- Young, K.; Ouchi, T.; Huang, B.; Reichman, B.; Fetcenko, M.A. The structure, hydrogen storage, and electrochemical properties of Fe-doped C14-predominating AB2 metal hydride alloys. Int. J. Hydrog. Energy 2011, 36, 12296–12304. [Google Scholar] [CrossRef]
- Young, K.; Young, M.; Chang, S.; Huang, B. Synergetic effects in electrochemical properties of ZrVxNi4.5−x (x = 0.0, 0.1, 0.2, 0.3, 0.4, and 0.5) metal hydride alloys. J. Alloy. Compd. 2013, 560, 33–41. [Google Scholar] [CrossRef]
- Young, K.; Huang, B.; Ouchi, T. Studies of Co, Al, and Mn substitutions in NdNi5 metal hydride alloys. J. Alloy. Compd. 2012, 543, 90–98. [Google Scholar] [CrossRef]
- Sun, D.; Jiang, J.; Lei, Y.; Liu, W.; Wu, J.; Wang, Q. Effects of measurement factor on electrochemical capacity of some hydrogen storage alloys. Mater. Sci. Eng. B 1995, 30, 19–22. [Google Scholar] [CrossRef]
- Chang, S.; Young, K.; Ouchi, T.; Meng, T.; Nei, J.; Wu, X. Studies on incorporation of Mg in Ti-based AB2 metal hydride alloys. Batteries 2016, 2. submitted. [Google Scholar]
- Young, K.; Fetcenko, M.A.; Li, F.; Ouchi, T. Structural, thermodynamic, and electrochemical properties of TixZr1−x(VNiCrMnCoAl)2 C14 Laves phase alloys. J. Alloy. Compd. 2008, 464, 238–247. [Google Scholar] [CrossRef]
- Iba, H.; Akiba, E. Hydrogen absorption and modulated structure in Ti-V-Mn alloys. J. Alloy. Compd. 1997, 253–254, 21–24. [Google Scholar] [CrossRef]
- Young, K.; Ouchi, T.; Huang, B.; Reichman, B.; Blankenship, R. Improvement in −40 °C electrochemical properties of AB2 metal hydride alloy by silicon incorporation. J. Alloy. Compd. 2013, 575, 65–72. [Google Scholar] [CrossRef]
- Bundy, K.; Karlsson, M.; Lindbergh, G.; Landqvist, A. An electrochemical impedance spectroscopy method for prediction of the state of charge of a nickel-metal hydride battery at open circuit and during discharge. J. Power Sources 1998, 72, 118–125. [Google Scholar] [CrossRef]
- Slepski, P.; Darowicki, K.; Janicka, E.; Sierczynska, A. Application of electrochemical impedance spectroscopy to monitoring discharging process of nickel/metal hydride battery. J. Power Sources 2013, 241, 121–126. [Google Scholar] [CrossRef]
- Pop, V.; Bergveld, H.J.; Notten, P.H.L.; Reftien, P.P.L. State-of-the-art of battery state-of-charge determination. Meas. Sci. Technol. 2005, 16, R93–R110. [Google Scholar] [CrossRef]
- Williams, M.; Mackie, C.; Barbour, P.W. Method and Apparatus for Determining the State of Charge of a Battery. U.S. Patent 4,958,127, 18 September 1990. [Google Scholar]
- Galbraith, R.E.; Gisi, J.M.; Norgaard, S.P.; Reetz, D.D.; Ziebarth, D.J. Method and Apparatus for Estimating the Service Life of a Battery. U.S. Patent 6,191,556 B1, 20 February 2001. [Google Scholar]
- Lim, J.H.; Ji, S.; Han, S. Method for Measuring SOC of a Battery Management System and the Apparatus Thereof. U.S. Patent 8,548,761, 1 October 2013. [Google Scholar]
- Zhang, Y.; Du, X.; Salman, M.A.; Huang, S. Battery SOC Estimation with Automatic Correction. U.S. Patent 9,108,524, 18 August 2015. [Google Scholar]
- Young, M.; Chang, S.; Young, K.; Nei, J. Hydrogen storage properties of ZrVxNi3.5−x (x = 0.0–0.9) metal hydride alloys. J. Alloy. Compd. 2013, 580, S171–S174. [Google Scholar] [CrossRef]
- Young, K.; Ouchi, T.; Fetcenko, M.A. Pressure-composition-temperature hysteresis in C14 Laves phase alloys: Part 1. Simple ternary alloys. J. Alloy. Compd. 2009, 480, 428–433. [Google Scholar] [CrossRef]
- Young, K.; Chao, B.; Pawlik, D.; Shen, H.T. Transmission electron microscope studies in the surface oxide on the La-containing AB2 metal hydride alloy. J. Alloy. Compd. 2016. [Google Scholar] [CrossRef]
- Visintin, A.; Peretti, A.A.; Fruiz, F.; Corso, H.L.; Triaca, W.E. Effect of additional catalytic phases imposed by sintering on the hydrogen absorption behavior of AB2 type Zr-based alloys. J. Alloy. Compd. 2007, 428, 244–251. [Google Scholar] [CrossRef]
- Young, K.; Ouchi, T.; Meng, T. Studies in synergetic effects in multi-phase metal hydride alloys. Batteries 2016, 2. submitted. [Google Scholar]

| Difference in | Electrochemical Charging | Gaseous Phase Hydrogen Storage |
|---|---|---|
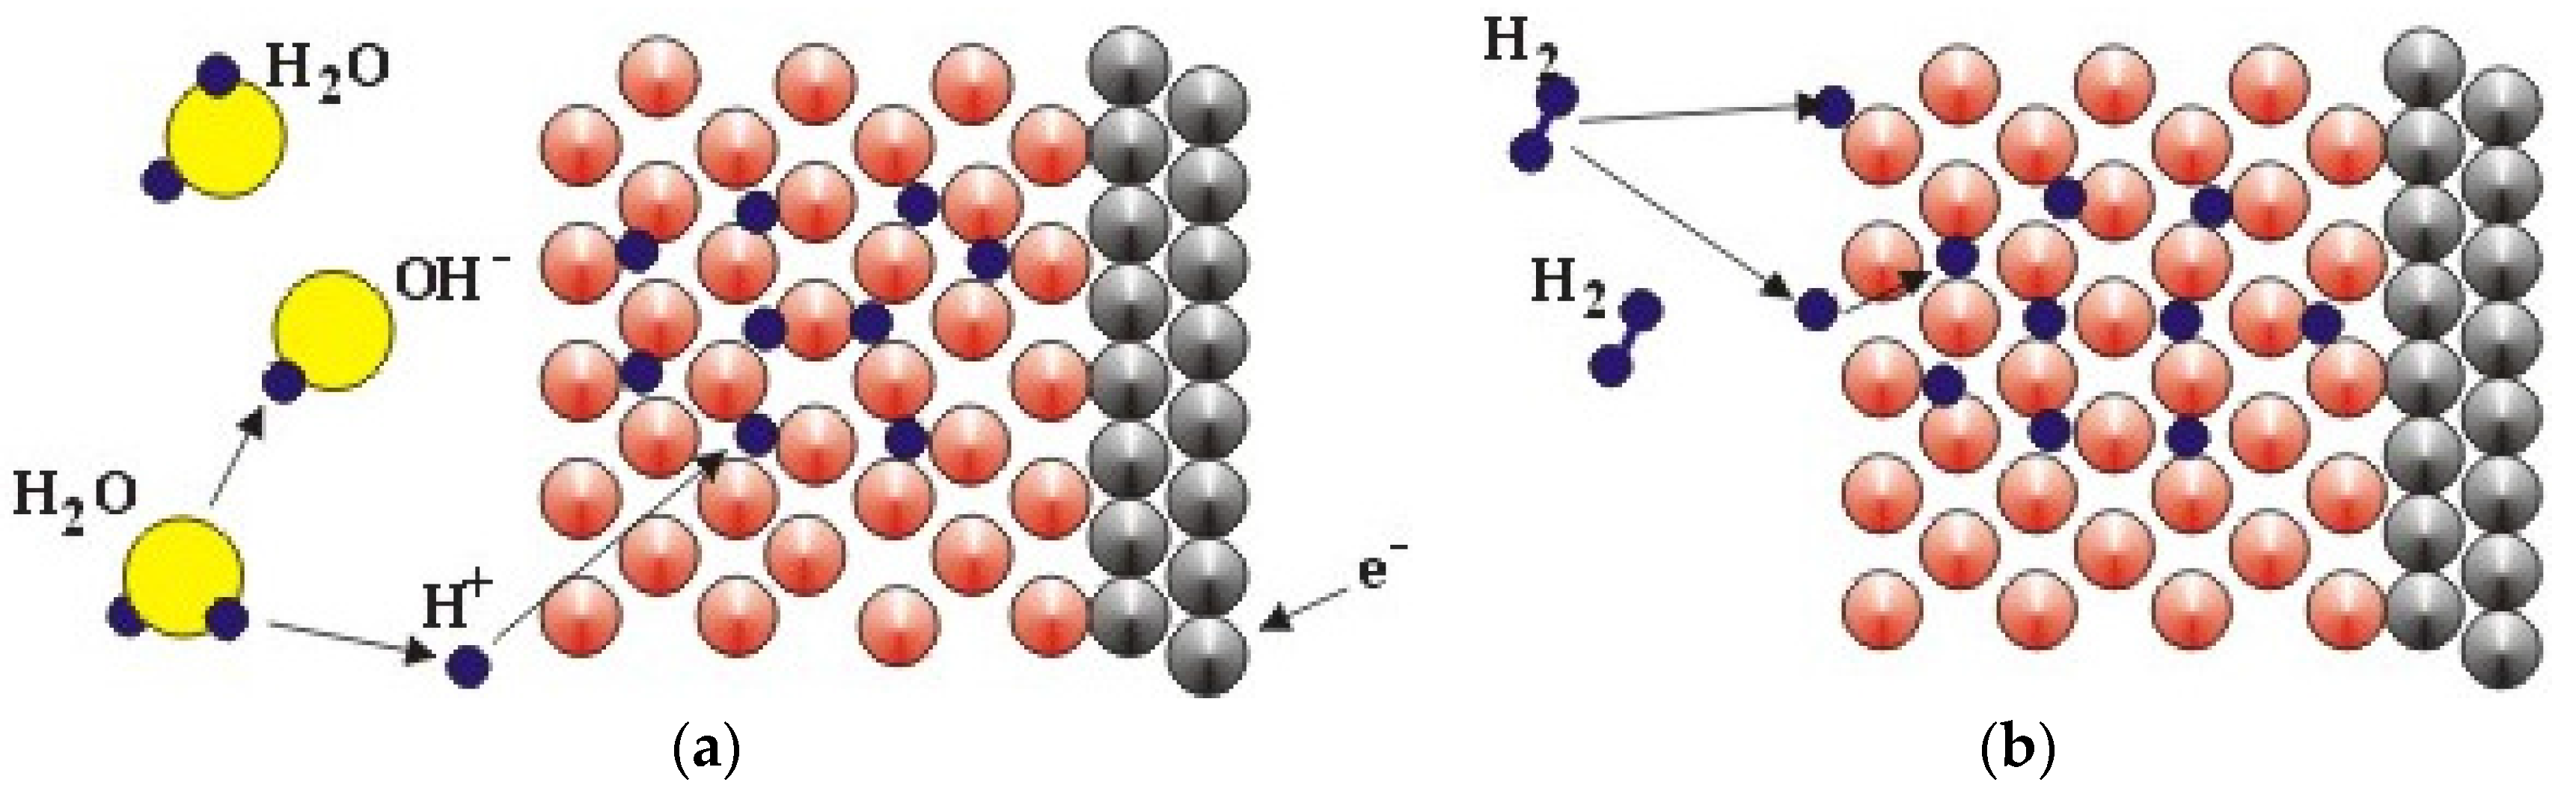
| Source of H | Splitting H2O molecule at the electrode/electrolyte interface | H2 dissociation at the surface |
| Environment | Alkaline oxidizing environment (KOH electrolyte) | H2 gas, very susceptible to oxygen poisoning |
| Kinetics | Hydrogen storage/release at room temperature | Hydrogen storage/release at temperature range of 20 –130 °C |
| Thermodynamics | ΔH from −30 kJ·mol·H2−1 to −35 kJ·mol·H2−1 | ΔH from −20 kJ·mol·H2−1 to −55 kJ·mol·H2−1 |
| Thermal conductivity | Not crucial | Very important |
| Electrical conductivity | Very important | Not crucial |
| Chemical reaction | M + H2O + e− ⇆ MH + OH− | H2 (g) ⇆ 2H |
| Surface requirement | A thin and porous oxide allowing electrolyte penetration | Free from oxide and other contaminations |
| Common catalyst | Metallic Ni embedded in surface oxide [6] | Noble metals like Pd and Pt [7] |
| Alloy | Family | Composition (in at%) | Maximum H-storage Capacity | Desorption Plateau Pressure | PCT Hysteresis |
|---|---|---|---|---|---|
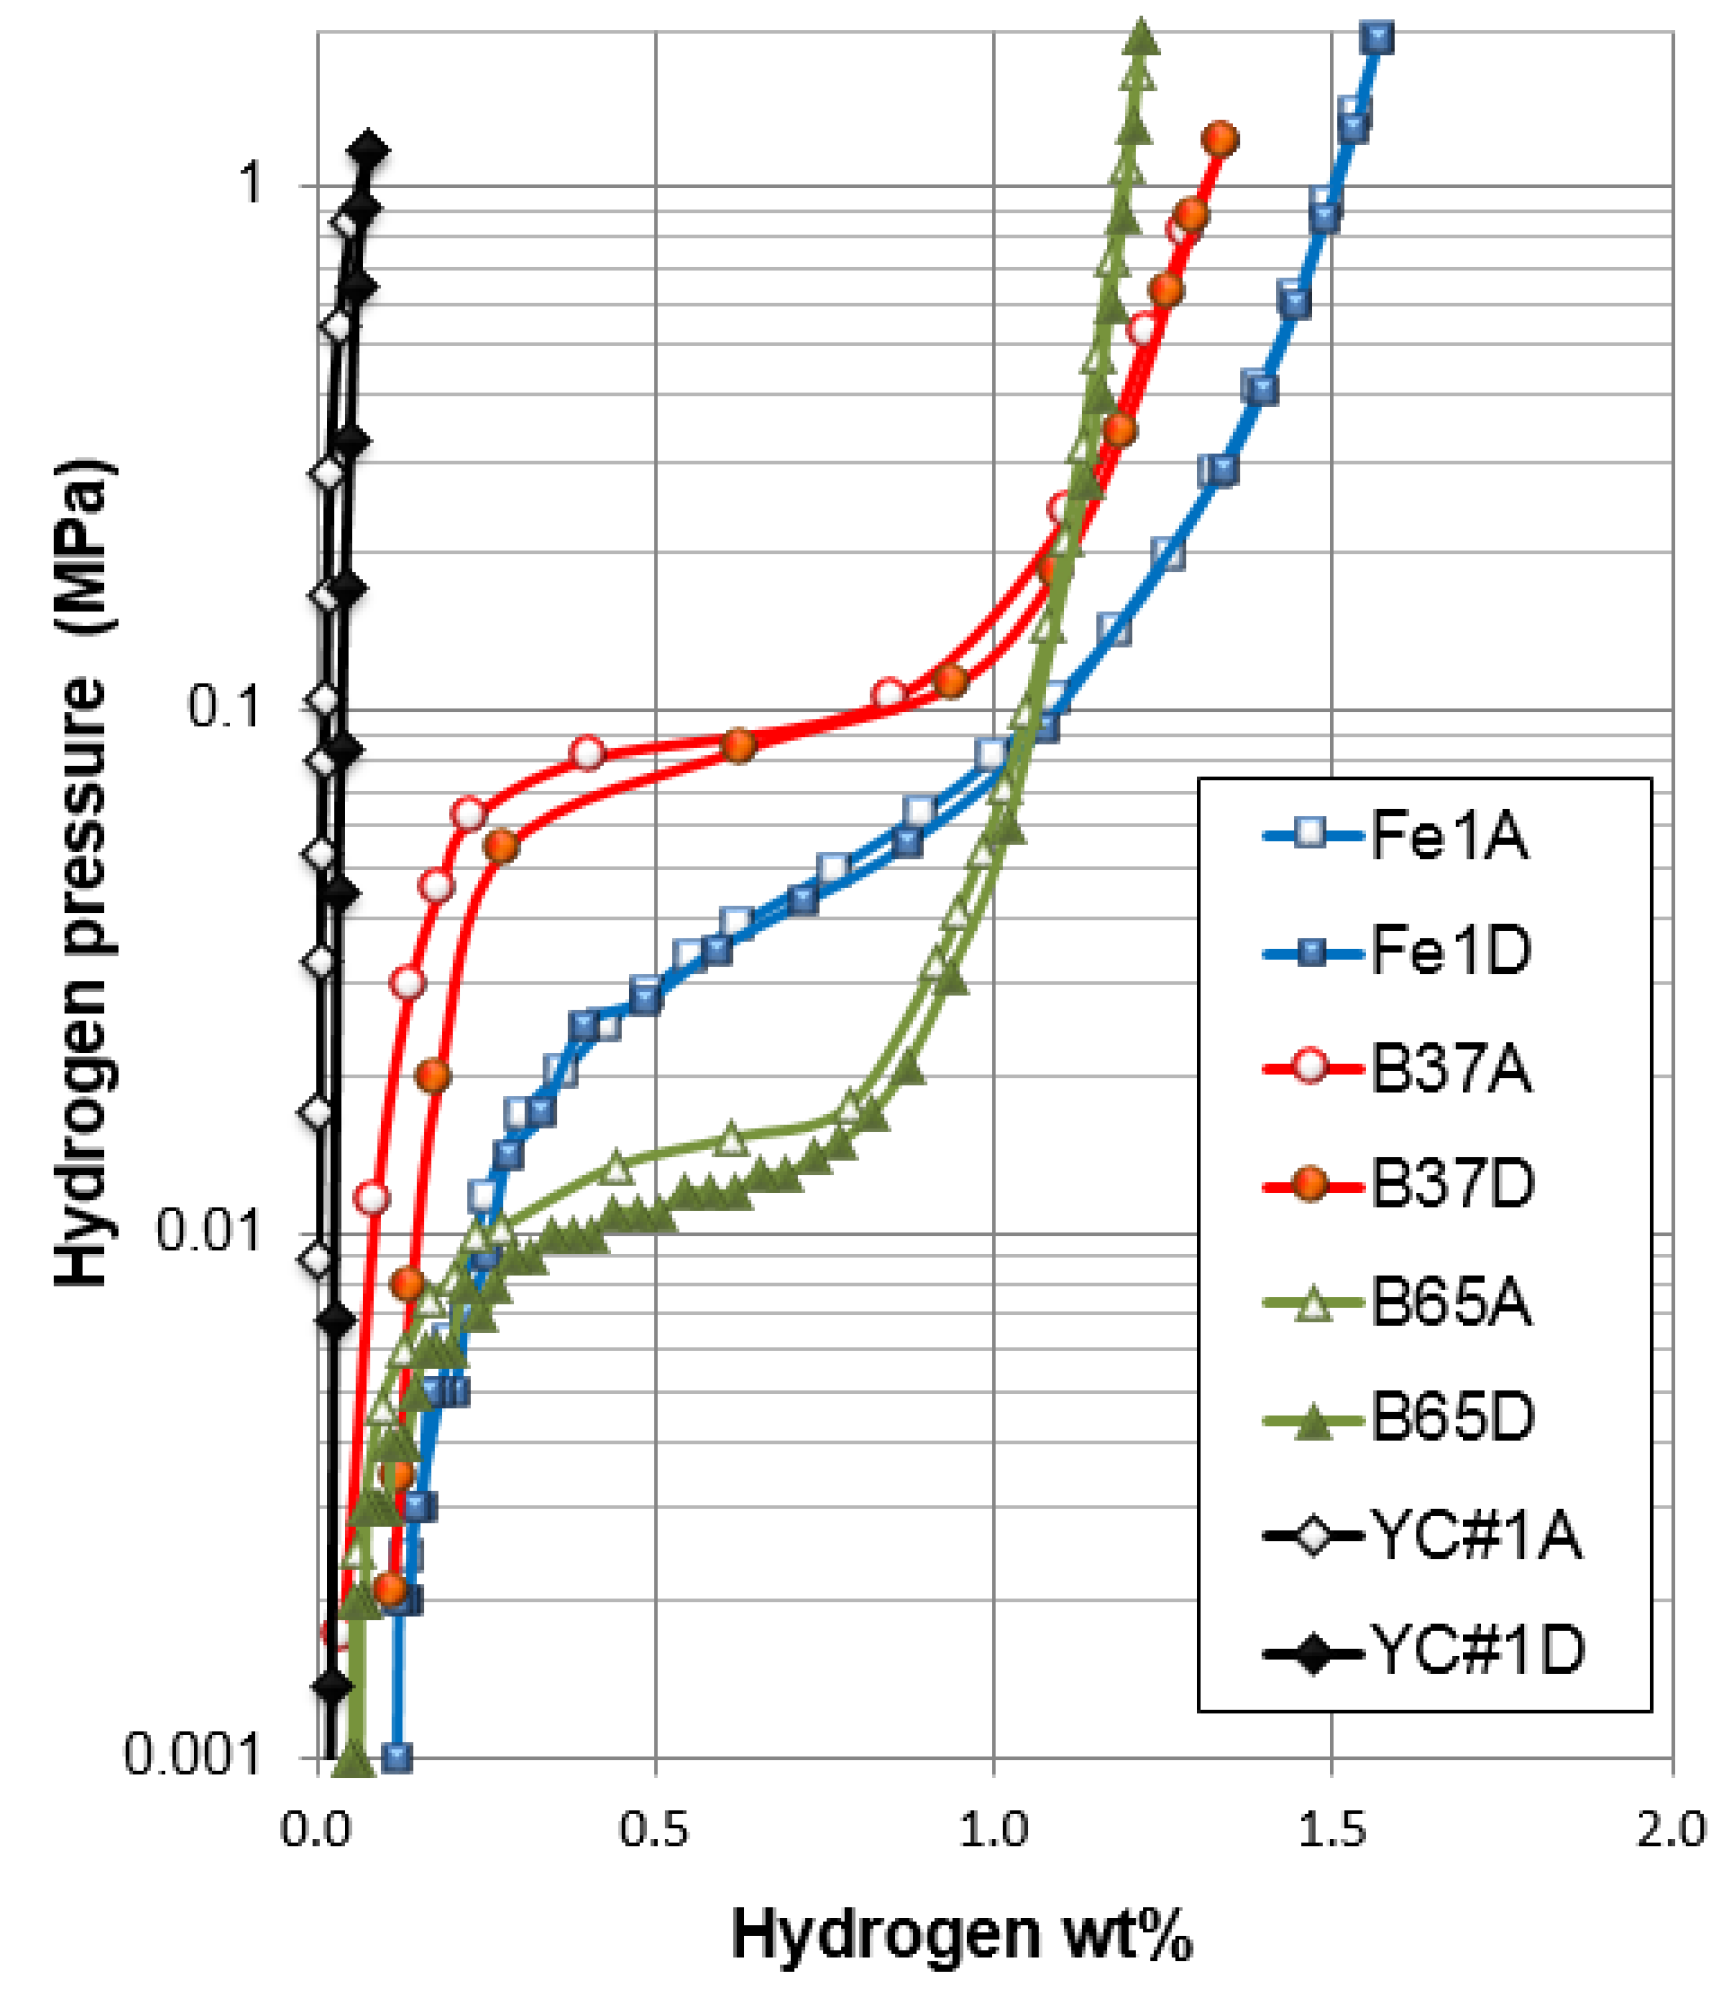
| Fe1 | AB2 | Ti12Zr21.5V10Cr7.5Mn8.1Fe1.0Co7.0Ni32.2Sn0.3Al0.4 | 1.51 wt% | 0.046 MPa | 0.05 |
| B37 | AB5 | La9.6Ce4.0Pr0.5Nd1.3Ni65.8Co4.6Mn4.2Al5.5Cu4.6 | 1.34 wt% | 0.088 MPa | 0.06 |
| B65 | AB5 | La10.5Ce4.3Pr0.5Nd1.4Ni62.3Co5.0Mn4.6Al6.0Cu3.2Zr0.2Mo2.0 | 1.21 wt% | 0.012 MPa | 0.28 |
| YC#1 | AB5 | Zr18.2Ni81.8 | 0.075 wt% | >1 MPa | 1.76 |
| Aspect | PCT | EPCT |
|---|---|---|
| Main application | Gaseous phase hydrogen storage | Electrochemistry |
| Set-up | Valve, pressure gauge, vacuum pump, and heater | Basic electrochemical station |
| Equipment cost | ~$20,000 USD per channel | ~$1000 USD per channel |
| Sample size | 0.5 g to 2 g | 100 mg to 100 g |
| Sample shape | Ingot | −200 mesh powder |
| Pre-condition | Fresh cleavage or acid etched | Hot alkaline bath or electrochemical cycling |
| Main safety concern | Hydrogen gas safety; powder after PCT measurement can be highly pyrophoric | Cycled electrode after drying can be pyrophoric |
| Temperature range | −20 °C to 200 °C | −40 °C to 50 °C |
| Equivalent pressure range | 0.0001 MPa to 10 MPa | Wider than 1 Pa to 1000 MPa |
| Synergetic effects in multiphase alloy | Determined mainly by the difference in metal-hydrogen bond strength | Determined by the difference in work function |
| Properties obtained | Storage capacity, metal-hydrogen bond strength, thermodynamic, hydride/dehydride hysteresis, and interaction among phases | Storage capacity up to 1 atm, contribution from the activated surface |
| Not suitable for | Alloys with very high or very low plateau pressure, alloys with poor surface catalytic abilities, alloys in the fine particle form | Alloys with low corrosion resistance in alkaline solution, alloys with high plateau pressure (>1 atm), alloys with very large hardness or ductility |
© 2016 by the authors; licensee MDPI, Basel, Switzerland. This article is an open access article distributed under the terms and conditions of the Creative Commons by Attribution (CC-BY) license (http://creativecommons.org/licenses/by/4.0/).
Share and Cite
Mosavati, N.; Young, K.-H.; Meng, T.; Ng, K.Y.S. Electrochemical Open-Circuit Voltage and Pressure-Concentration-Temperature Isotherm Comparison for Metal Hydride Alloys. Batteries 2016, 2, 6. https://doi.org/10.3390/batteries2020006
Mosavati N, Young K-H, Meng T, Ng KYS. Electrochemical Open-Circuit Voltage and Pressure-Concentration-Temperature Isotherm Comparison for Metal Hydride Alloys. Batteries. 2016; 2(2):6. https://doi.org/10.3390/batteries2020006
Chicago/Turabian StyleMosavati, Negar, Kwo-Hsiung Young, Tiejun Meng, and K. Y. Simon Ng. 2016. "Electrochemical Open-Circuit Voltage and Pressure-Concentration-Temperature Isotherm Comparison for Metal Hydride Alloys" Batteries 2, no. 2: 6. https://doi.org/10.3390/batteries2020006