Plant Water Status Indicators for Irrigation Scheduling Associated with Iso- and Anisohydric Behavior: Vine and Plum Trees


Abstract
:1. Introduction
2. Materials and Methods
2.1. Experimental Sites, Meteorological Conditions and Crop Characteristics
2.1.1. Experiment 1
2.1.2. Experiment 2
2.2. Measurements and Irrigation Treatments
2.2.1. Experiment 1
2.2.2. Experiment 2
2.3. Data Analysis and Statistics
3. Results
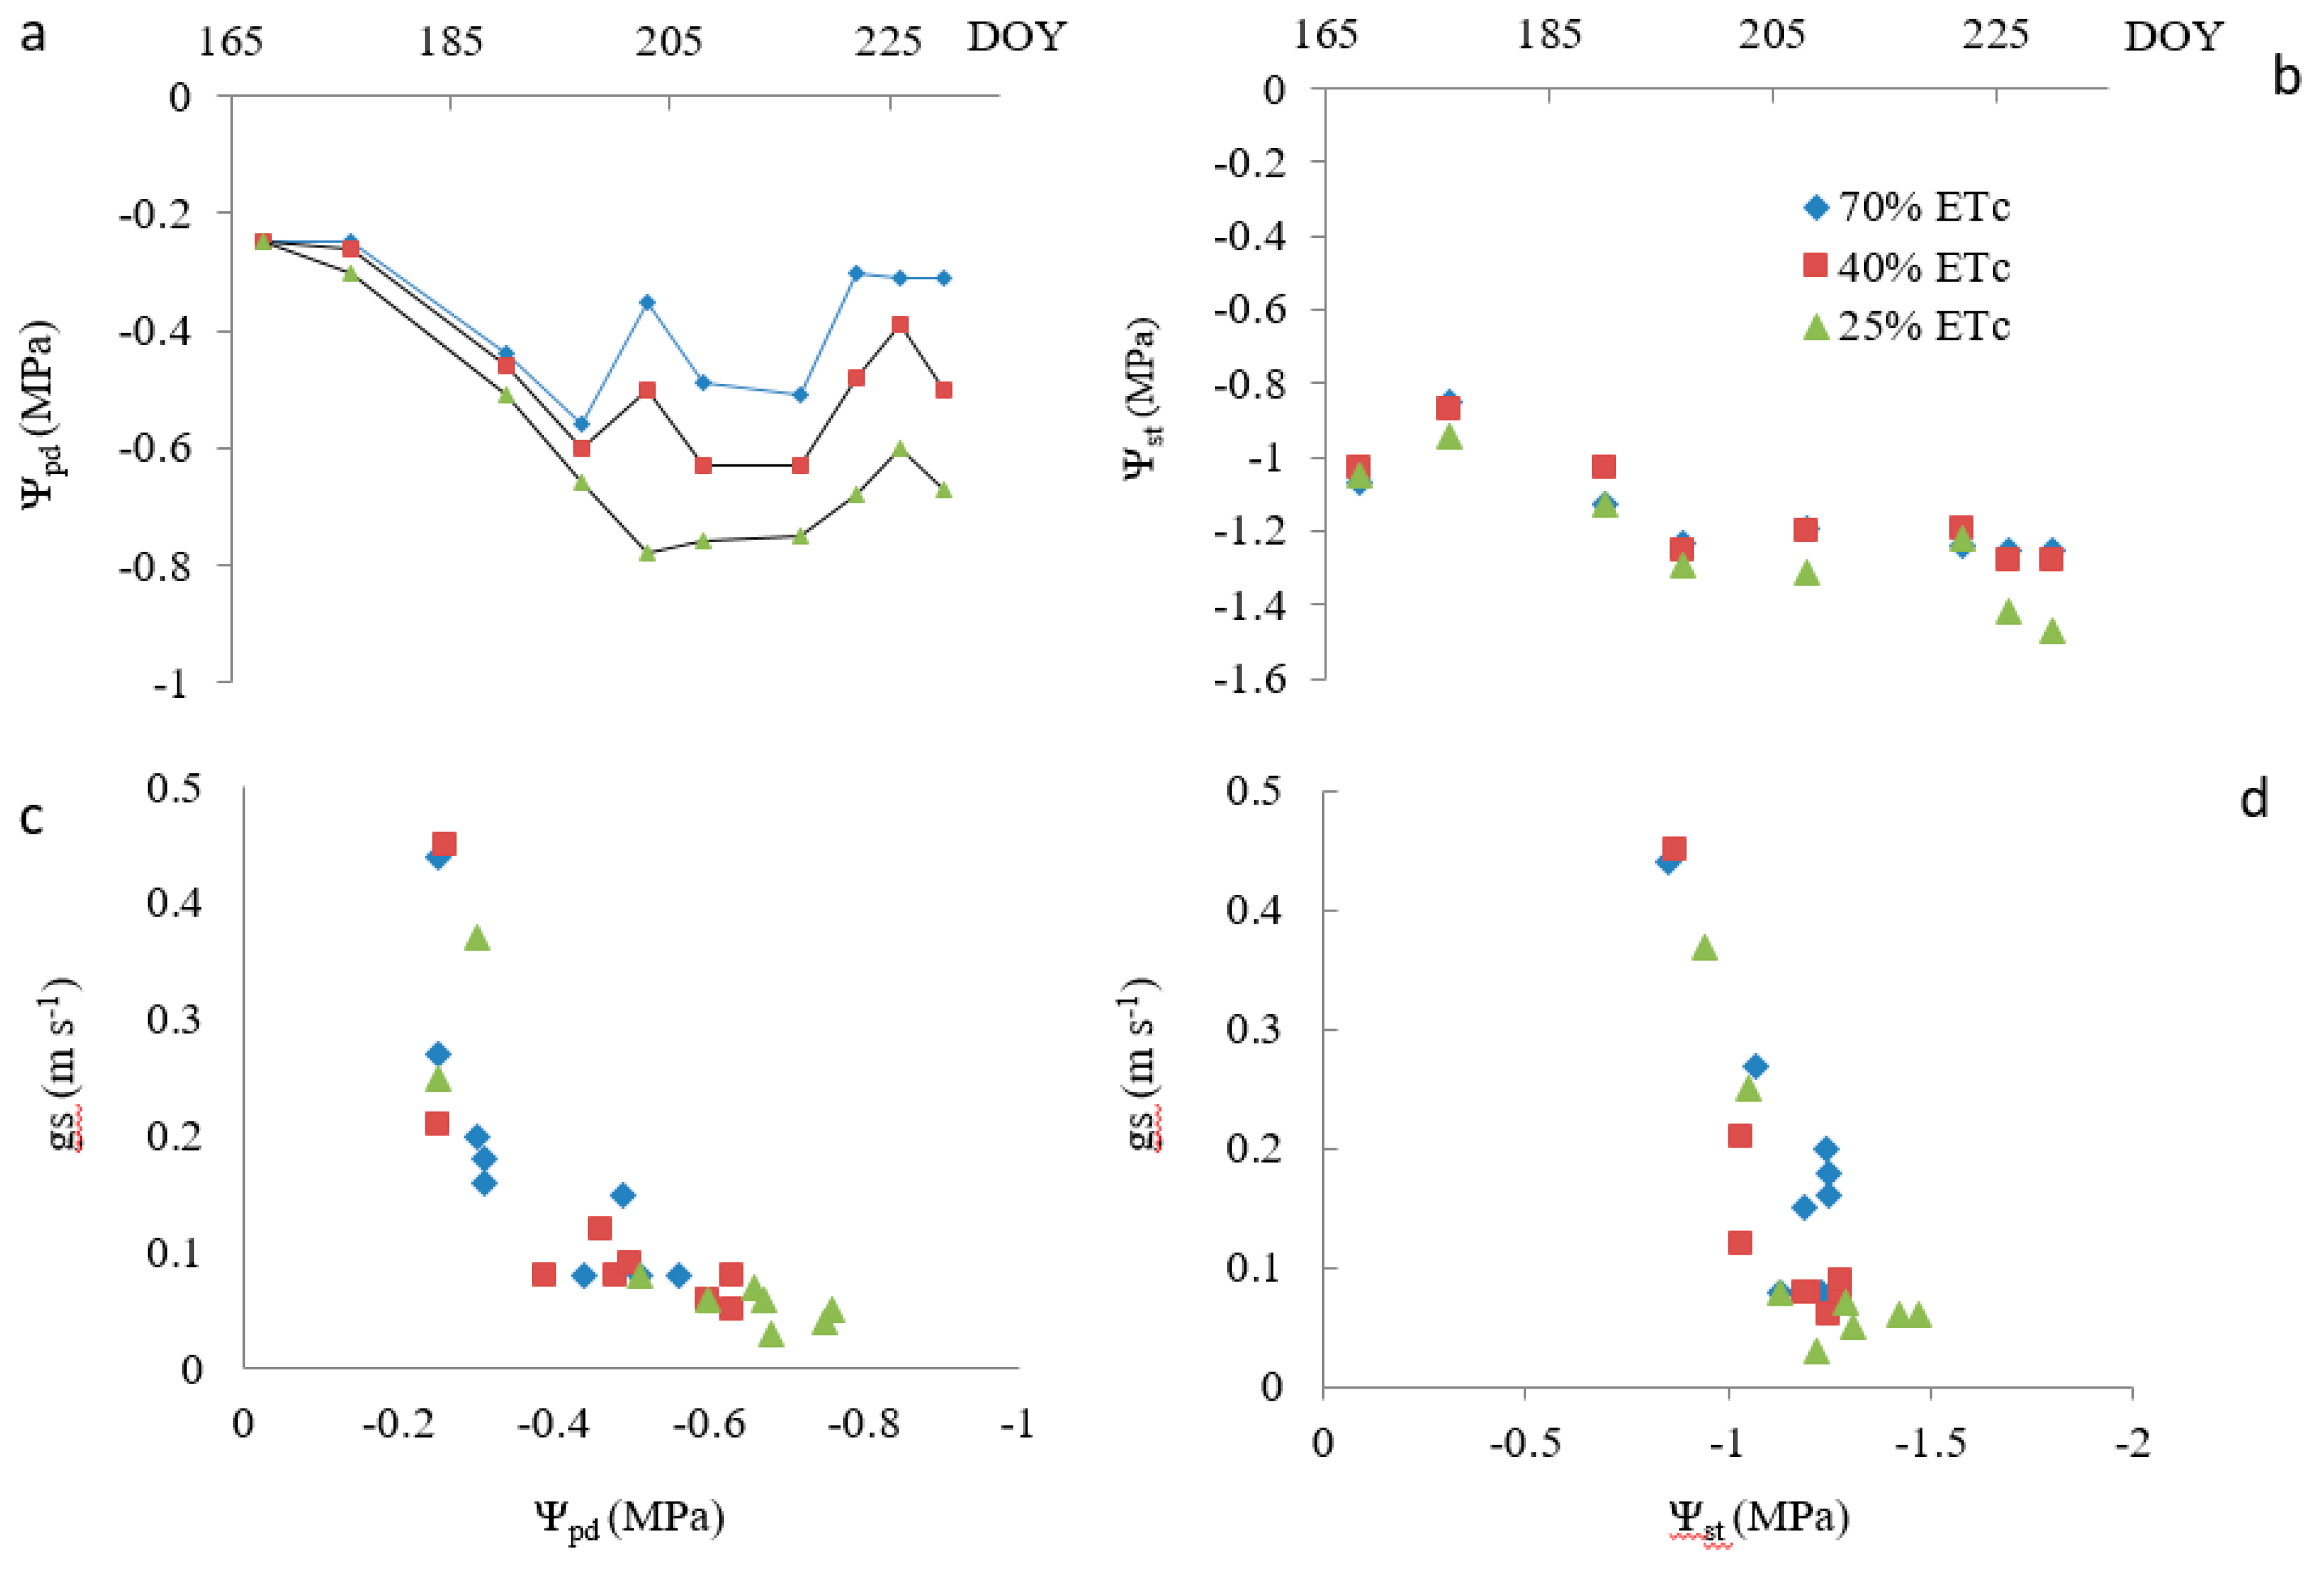
3.1. Experiment 1
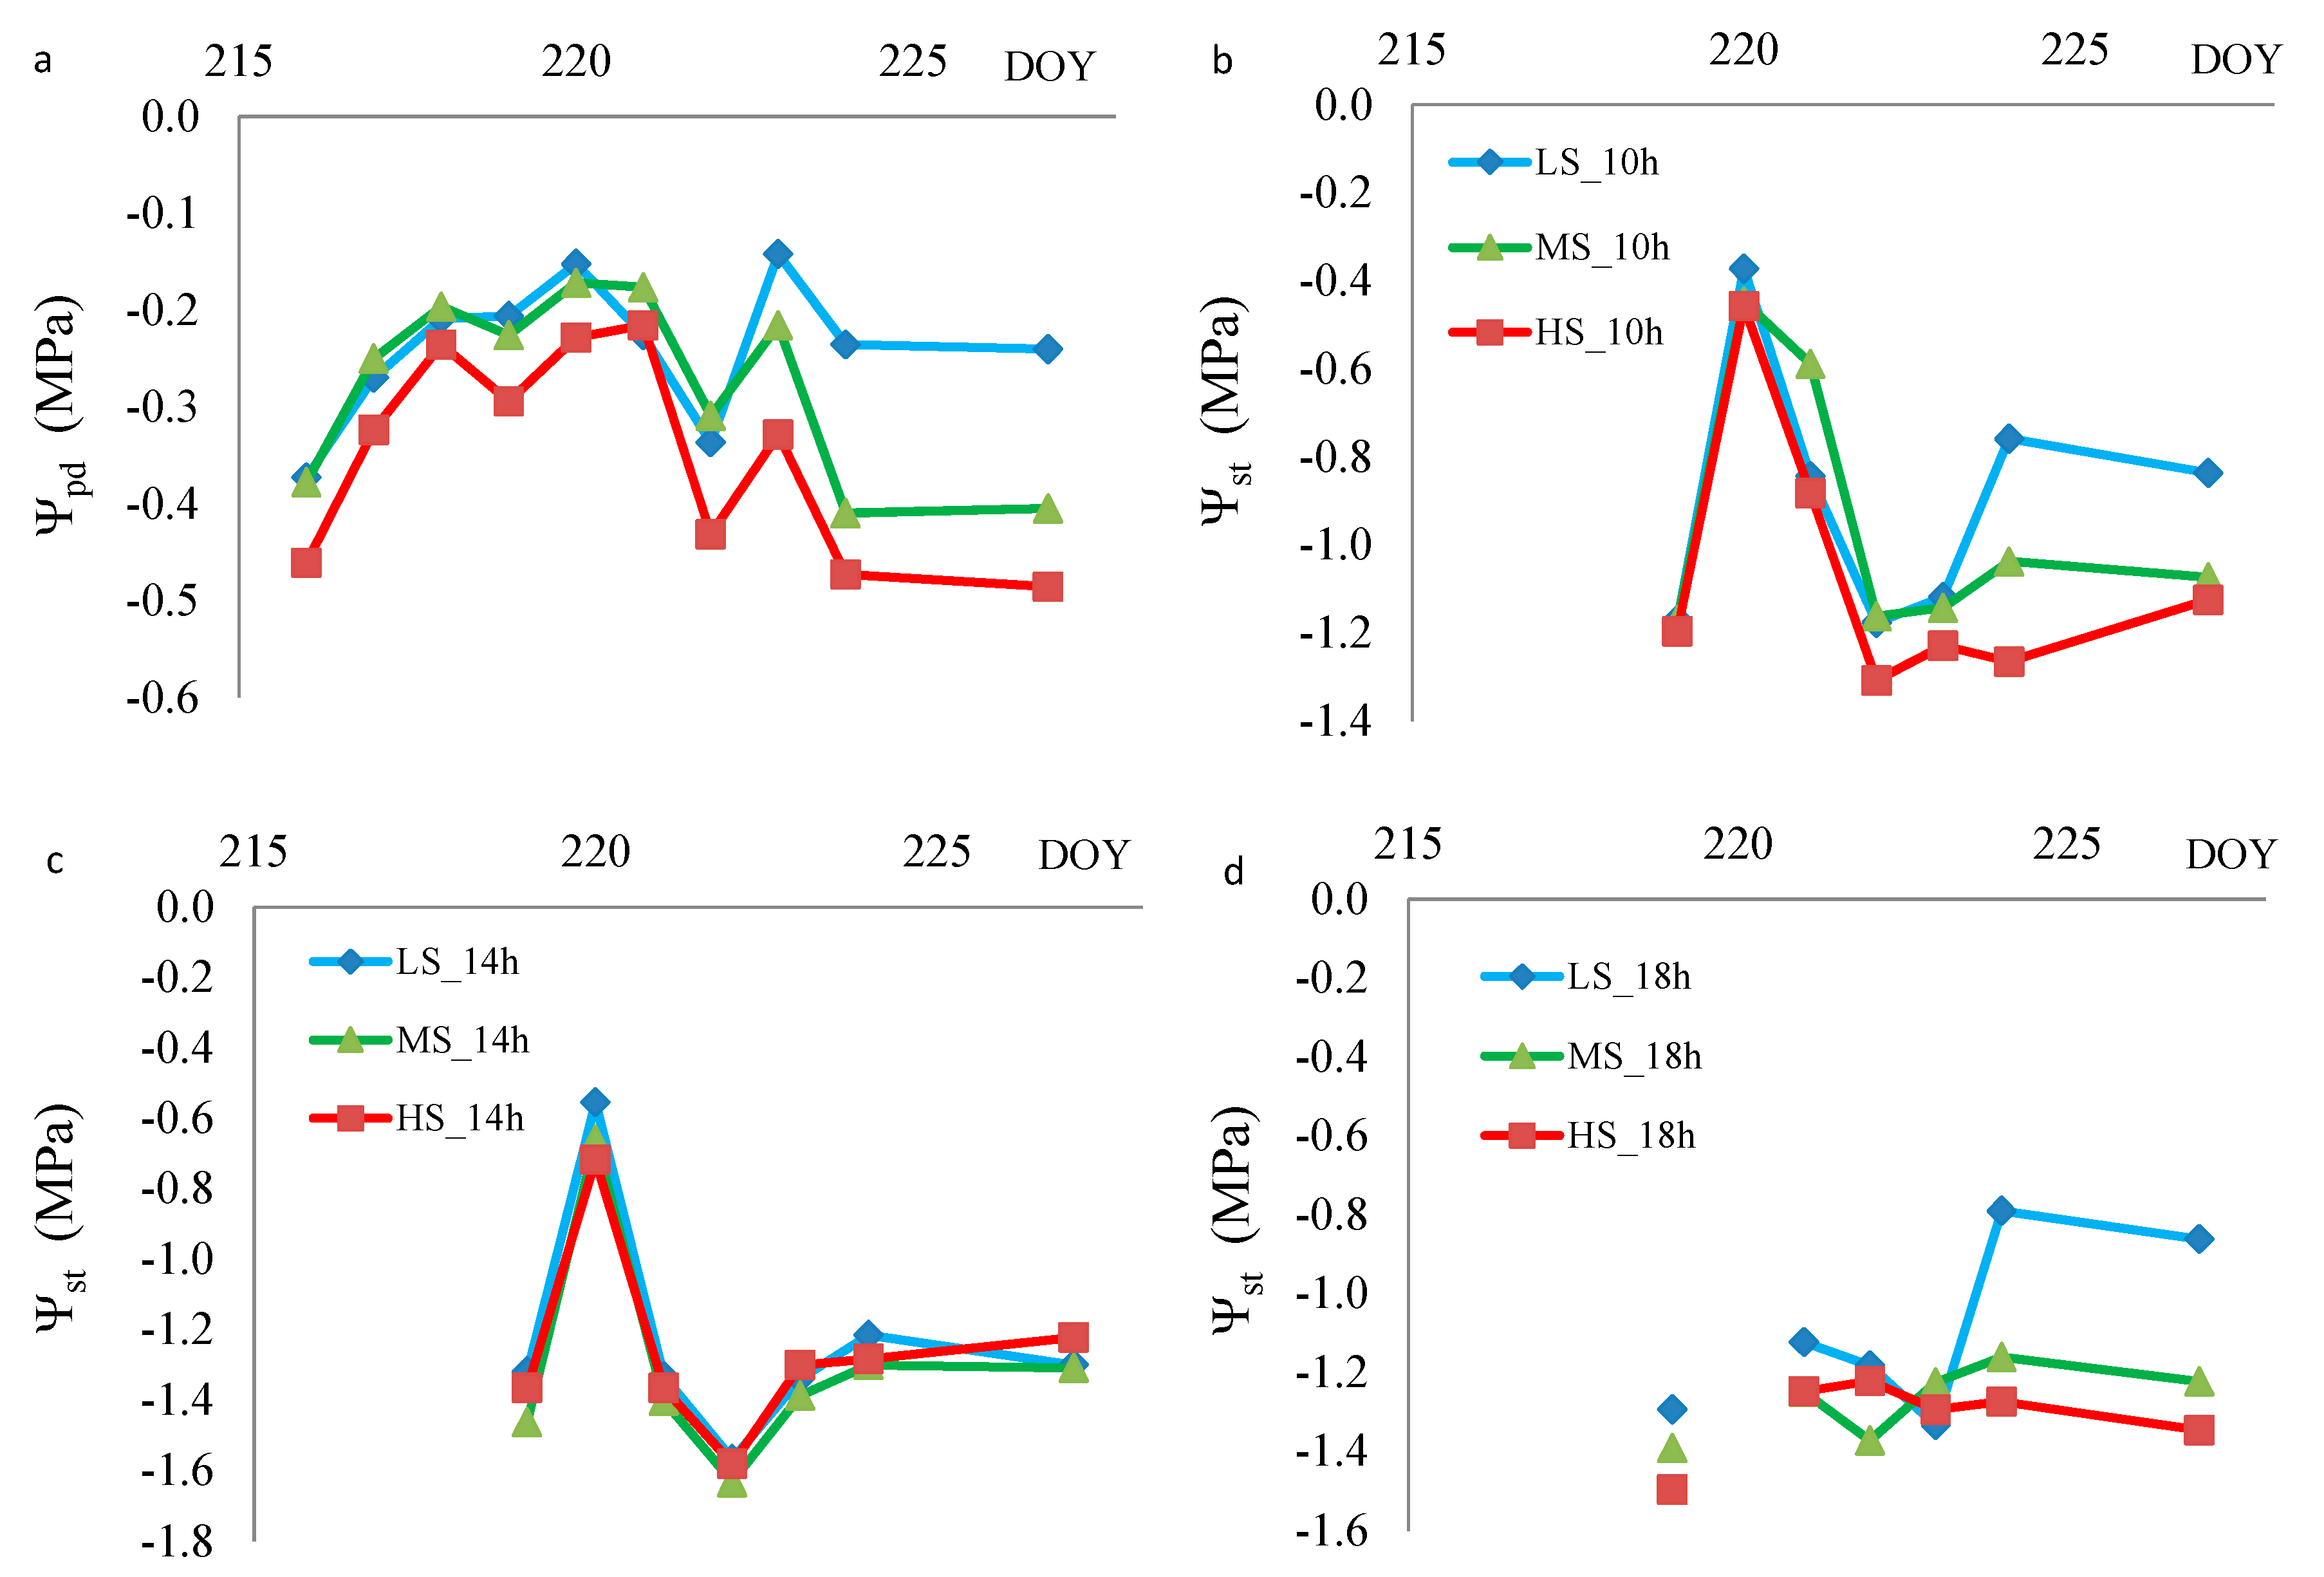
3.2. Experiment 2
4. Discussion
4.1. Plant Water Status Indicators Versus Water Stress
4.2. Use of Water Stress Indicators
4.3. When to Use Predawn or Noon Stem Water Potential
Acknowledgments
Author Contributions
Conflicts of Interest
References
- Ferreira, M.I. Stress Coefficients for Soil Water Balance Combined with Water Stress Indicators for Irrigation Scheduling of Woody Crops. Horticulturae 2017, 3, 38. [Google Scholar] [CrossRef]
- Katerji, N.; Hallaire, M. Les grandeurs de référence utilisables dans l’étude de l’alimentation en eau des cultures. Agronomie 1984, 4, 999–1008. [Google Scholar] [CrossRef]
- Chalmers, D.J.; Mitchell, P.D.; Vanheek, L. Control of peach tree growth and productivity by regulated water supply, tree density and summer pruning. J. Am. Soc. Hortic. Sci. 1981, 106, 307–312. [Google Scholar]
- Ortuño, M.F.; Conejero, W.; Moreno, F.; Moriana, A.; Intrigliolo, D.S.; Biel, C.; Mellisho, C.D.; Pérez-Pastor, A.; Domingo, R.; Ruiz-Sánchez, M.C.; et al. Could trunk diameter sensors be used in woody crops for irrigation scheduling? A review of current knowledge and future perspectives. Agric. Water Manag. 2010, 97, 1–11. [Google Scholar] [CrossRef]
- Goldhamer, D.A.; Fereres, E. Irrigation scheduling protocols using continuously recorded trunk diameter measurements. Irrig. Sci. 2001, 20, 115–125. [Google Scholar] [CrossRef]
- Goldhamer, D.A.; Fereres, E. Irrigation scheduling of almond trees with trunk diameter sensors. Irrig. Sci. 2004, 23, 11–19. [Google Scholar] [CrossRef]
- Jones, H.G. Irrigation scheduling: Advantages and pitfalls of plant-based methods. J. Exp. Bot. 2004, 55, 2427–2436. [Google Scholar] [CrossRef] [PubMed]
- Fernández, J.E. Plant-Based Methods for Irrigation Scheduling of Woody Crops. Horticulturae 2017, 3, 35. [Google Scholar] [CrossRef]
- Marsal, J.; Gelly, M.; Mata, M.; Arbonés, A.; Rufat, J.; Girona, J. Phenology and drought affects the relationship between daily trunk shrinkage and midday stem water potential of peach trees. J. Hortic. Sci. Biotechnol. 2002, 77, 411–417. [Google Scholar] [CrossRef]
- Badal, E.; Buesa, I.; Guerra, D.; Bonet, L.; Ferrer, P.; Intrigliolo, D.S. Maximum diurnal trunk shrinkage is a sensitive indicator of plant water, stress in Diospyros kaki (Persimmon) trees. Agric. Water Manag. 2010, 98, 143–147. [Google Scholar] [CrossRef]
- Conejero, W.; Mellisho, C.D.; Ortuño, M.F.; Moriana, A.; Moreno, F.; Torrecillas, A. Using trunk diameter sensors for regulated deficit irrigation scheduling in early maturing peach trees. Environ. Exp. Bot. 2011, 71, 409–415. [Google Scholar] [CrossRef]
- De Schepper, V.; van Dusschoten, D.; Copini, P.; Jahnke, S.; Steppe, K. MRI links stem water content to stem diameter variations in transpiring trees. J. Exp. Bot. 2012, 63, 2645–2653. [Google Scholar] [CrossRef] [PubMed]
- Fernández, J.E.; Cuevas, M.V. Irrigation scheduling from stem diameter variations: A review. Agric. For. Meteorol. 2010, 150, 135–151. [Google Scholar] [CrossRef]
- Stegman, E.C.; Schiele, L.H.; Bauer, A. Plant water stress criteria for irrigation scheduling. Trans. ASAE 1976, 19, 0850–0855. [Google Scholar] [CrossRef]
- Allen, R.G.; Pereira, L.S.; Raes, D.; Smith, M. Crop Evapotranspiration-Guidelines for Computing Crop Water Requirements-FAO Irrigation and Drainage Paper 56; FAO: Rome, Italy, 1998; Volume 300, p. D05109. [Google Scholar]
- Jarvis, P.G. The interpretation of the variations in leaf water potential and stomatal conductance found in canopies in the field. Philos. Trans. R. Soc. Lond. B Biol. Sci. 1976, 273, 593–610. [Google Scholar] [CrossRef]
- Hinckley, T.M.; Duhme, F.; Hinckley, A.R.; Richter, H. Water relations of drought hardy shrubs: Osmotic potential and stomatal reactivity. Plant Cell Environ. 1980, 3, 131–140. [Google Scholar]
- Hugalde, I.P.; Vila, H.F. Comportamiento isohídrico o anisohídrico en vides…:¿ Una controversia sin fin? RIA Rev. Investig. Agropecu. 2014, 40, 75–82. [Google Scholar]
- Jones, H.G. Physiological aspects of the control of water status in horticultural crops. HortScience 1990, 25, 19–26. [Google Scholar]
- Lovisolo, C.; Perrone, I.; Carra, A.; Ferrandino, A.; Flexas, J.; Medrano, H.; Schubert, A. Drought-induced changes in development and function of grapevine (Vitis spp.) organs and in their hydraulic and non-hydraulic interactions at the whole-plant level: A physiological and molecular update. Funct. Plant Biol. 2010, 37, 98–116. [Google Scholar]
- Chaves, M.M.; Zarrouk, O.; Francisco, R.; Costa, J.M.; Santos, T.; Regalado, A.P.; Lopes, C.M. Grapevine under deficit irrigation: Hints from physiological and molecular data. Ann. Bot. 2010, 105, 661–676. [Google Scholar] [CrossRef] [PubMed]
- Domec, J.C.; Johnson, D.M. Does homeostasis or disturbance of homeostasis in minimum leaf water potential explain the isohydric versus anisohydric behavior of Vitis vinifera L. cultivars? Tree Physiol. 2012, 32, 245–248. [Google Scholar] [CrossRef] [PubMed]
- Stocker, O. Die Abhängigkeit des transpiration von den unweltfaktoren. In Encyclopedia of Plant Physiology; Ruhland, W., Ed.; Springer-Verlag: Berlin, Germany, 1956; Volume 3. [Google Scholar]
- Konings, A.G.; Gentine, P. Global variations in ecosystem-scale isohydricity. Glob. Chang. Biol. 2017, 23, 891–905. [Google Scholar] [CrossRef] [PubMed]
- Schultz, H.R. Differences in hydraulic architecture account for near-isohydric and anisohydric behaviour of two field-grown Vitis vinifera L. cultivars during drought. Plant Cell Environ. 2003, 26, 1393–1405. [Google Scholar] [CrossRef]
- Rogiers, S.Y.; Greer, D.H.; Hutton, R.J.; Clarke, S.J. Transpiration efficiency of the grapevine cv. Semillon is tied to VPD in warm climates. Ann. Appl. Biol. 2011, 158, 106–114. [Google Scholar] [CrossRef]
- Domec, J.C.; Noormets, A.; King, J.S.; Sun, G.E.; McNulty, S.G.; Gavazzi, M.J.; Bloggs, J.L.; Treasure, E.A. Decoupling the influence of leaf and root hydraulic conductances on stomatal conductance and its sensitivity to vapour pressure deficit as soil dries in a drained loblolly pine plantation. Plant Cell Environ. 2009, 32, 980–991. [Google Scholar] [CrossRef] [PubMed]
- Lovisolo, C.; Hartung, W.; Schubert, A. Whole-plant hydraulic conductance and root-to-shoot flow of abscisic acid are independently affected by water stress in grapevines. Funct. Plant Biol. 2002, 29, 1349–1356. [Google Scholar] [CrossRef]
- Intrigliolo, D.S.; Castel, J.R. Usefulness of diurnal trunk shrinkage as a water stress indicator in plum trees. Tree Physiol. 2006, 26, 303–311. [Google Scholar] [CrossRef] [PubMed]
- Simonneau, T.; Habib, R.; Goutouly, J.P.; Huguet, J.G. Diurnal changes in stem diameter depend upon variations in water content: Direct evidence in peach trees. J. Exp. Bot. 1993, 44, 615–621. [Google Scholar] [CrossRef]
- Jarvis, P.G. Water transfer in plants. In Heat and Mass Transfer in the Plant Environment; De Vries, D., Afgan, N.H., Eds.; John Wiley & Sons Inc.: New York, NY, USA, 1975; Chapter 1; pp. 369–394. [Google Scholar]
- Scholz, F.C.; Bucci, S.J.; Goldstein, G.; Meinzer, F.C.; Franco, A.C.; Miralles-Wilhelm, F. Temporal dynamics of stem expansion and contraction in savanna trees: Withdrawal and recharge of stored water. Tree Physiol. 2008, 28, 469–480. [Google Scholar] [CrossRef] [PubMed]
- Meinzer, F.C.; Johnson, D.M.; Lachenbruch, B.; McCulloh, K.A.; Woodruff, D.R. Xylem hydraulic safety margins in woody plants: Coordination of stomatal control of xylem tension with hydraulic capacitance. Funct. Ecol. 2009, 23, 922–930. [Google Scholar] [CrossRef]
- Meinzer, F.C.; Woodruff, D.R.; Marias, D.E.; Mcculloh, K.A.; Sevanto, S. Dynamics of leaf water relations components in co-occurring iso- and anisohydric conifer species. Plant Cell Environ. 2014, 37, 2577–2586. [Google Scholar] [CrossRef] [PubMed]
- Meinzer, F.C.; Woodruff, D.R.; Marias, D.E.; Smith, D.D.; McCulloh, K.A.; Howard, A.R.; Magedman, A.L. Mapping ‘hydroscapes’ along the iso-to anisohydric continuum of stomatal regulation of plant water status. Ecol. Lett. 2016, 19, 1343–1352. [Google Scholar] [CrossRef] [PubMed]
- Garcia-Forner, N.; Adams, H.D.; Sevanto, S.; Collins, A.D.; Dickman, L.T.; Hudson, P.J.; Zeppel, M.J.B.; Jenkins, M.W.; Powers, H.; Martínez-Vilalta, J.; et al. Responses of two semiarid conifer tree species to reduced precipitation and warming reveal new perspectives for stomatal regulation. Plant Cell Environ. 2016, 39, 38–49. [Google Scholar] [CrossRef] [PubMed]
- Martínez-Vilalta, J.; Garcia-Forner, N. Water potential regulation, stomatal behaviour and hydraulic transport under drought: Deconstructing the isohydric and anisohydric concept. Plant Cell Environ. 2016, 40, 962–976. [Google Scholar] [CrossRef] [PubMed]
- Lavoie-Lamoureux, A.; Sacco, D.; Risse, P.A.; Lovisolo, C. Factors influencing stomatal conductance in response to water availability in grapevine: A meta-analysis. Physiol. Plant. 2017, 159, 468–482. [Google Scholar] [CrossRef] [PubMed]
- McDowell, N.; Pockman, W.T.; Allen, C.D.; Breshears, D.D.; Cobb, N.; Kolb, T.; Plaut, J.; Sperry, J.; West, A.; Williams, D.G.; et al. Mechanisms of plant survival and mortality during drought: Why do some plants survive while others succumb to drought? New Phytol. 2008, 178, 719–739. [Google Scholar] [CrossRef] [PubMed]
- Martínez-Vilalta, J.; Poyatos, R.; Aguadé, D.; Retana, J.; Mencuccini, M. A new look at water transport regulation in plants. New Phytol. 2014, 204, 105–115. [Google Scholar] [CrossRef] [PubMed]
- Roman, D.T.; Novick, K.A.; Brzostek, E.R.; Dragoni, D.; Rahman, F.; Phillips, R.P. The role of isohydric and anisohydric species in determining ecosystem-scale response to severe drought. Oecologia 2015, 179, 641–654. [Google Scholar] [CrossRef] [PubMed]
- Klein, T. The variability of stomatal sensitivity to leaf water potential across tree species indicates a continuum between isohydric and anisohydric behaviours. Funct. Ecol. 2014, 28, 1313–1320. [Google Scholar] [CrossRef]
- Choné, X.; Van Leeuwen, C.; Dubourdieu, D.; Gaudillère, J.-P. Stem water potential is a sensitive indicator of grapevine water status. Ann. Bot. 2001, 87, 477–483. [Google Scholar] [CrossRef]
- Riou, C.; Payan, J.C. Outils de gestion de l’eau en vignoble méditerranéen. Application du bilan hydrique au diagnostique du stress hydrique de la vigne. 12 Journ. GESCO, Journ. Prof. Gest. L’eau Dans Vign. 2001, 125–133. [Google Scholar]
- Shackel, K.A.; Ahmadi, H.; Biasi, A.W.; Buchner, R.; Goldhamer, D.; Gurusinghe, S.; Hasey, J.; Kester, D.B.; Krueger, B.; Lampinen, B.; et al. Plant water status as an index of irrigation need in deciduous fruit trees. Hort Technol. 1997, 7, 23–29. [Google Scholar]
- Testi, L.; Villalobos, F.J. New approach for measuring low sap velocities in trees. Agric. For. Meteorol. 2009, 149, 730–773. [Google Scholar] [CrossRef]
- Green, S.R.; Clothier, B.E. Water use of kiwifruit vines and apple trees by the heat-pulse technique. J. Exp. Bot. 1998, 39, 115–123. [Google Scholar] [CrossRef]
- Swanson, R.H.; Whitfield, D.W.A. A numerical analysis of heat pulse velocity theory and practice. J. Exp. Bot. 1981, 32, 221–239. [Google Scholar] [CrossRef]
- Ferreira, M.I.; Katerji, N. Is stomatal conductance in a tomato crop controlled by soil or atmosphere? Oecologia 1992, 92, 104–107. [Google Scholar] [CrossRef] [PubMed]
- Matheny, A.M.; Mirfenderesgi, G.; Bohrer, G. Trait-based representation of hydrological functional properties of plants in weather and ecosystem models. Plant Divers. 2017, 39, 1–12. [Google Scholar] [CrossRef]
- Patakas, A.; Noitsakis, B.; Chouzouri, A. Optimization of irrigation water use in grapevines using the relationship between transpiration and plant water status. Agric. Ecosyst. Environ. 2005, 106, 253–259. [Google Scholar] [CrossRef]
- Olivo, N.; Girona, J.; Marsal, J. Seasonal sensitivity of stem water potential to vapour pressure deficit in grapevine. Irrig. Sci. 2009, 27, 175–182. [Google Scholar] [CrossRef]
- Intrigliolo, D.S.; Castel, J.R. Evaluation of grapevine water status from trunk diameter variations. Irrig. Sci. 2007, 26, 49–59. [Google Scholar] [CrossRef]
- Myburgh, P.A. Response of Vitis vinifera L. cv. Merlot to low frequency drip irrigation and partial root zone drying in the Western Cape Coastal Region—Part I. Soil and plant water status. S. Afr. J. Enol. Vitic. 2011, 32, 89–103. [Google Scholar] [CrossRef]
- Williams, L.E.; Baeza, P. Relationships among ambient temperature and vapor pressure deficit and leaf and stem water potentials of fully irrigated, field-grown grapevines. Am. J. Enol. Vitic. 2007, 58, 173–181. [Google Scholar]
- Ferreira, M.I.; Silvestre, J.; Conceição, N.; Malheiro, C. Crop and stress coefficients in rainfed and deficit irrigation vineyards using sap flow techniques. Irrig. Sci. 2012, 30, 433–444. [Google Scholar] [CrossRef]
- Rodríguez, P.; Mellisho, C.D.; Conejero, W.; Cruz, Z.N.; Ortuno, M.F.; Galindo, A.; Torrecillas, A. Plant water relations of leaves of pomegranate trees under different irrigation conditions. Environ. Exp. Bot. 2012, 77, 19–24. [Google Scholar] [CrossRef]
- Girona, J.; Mata, M.; Goldhamer, D.A.; Johnson, R.S.; DeJong, T.M. Patterns of soil and tree water status and leaf functioning during regulated deficit irrigation scheduling in peach. J. Am. Soc. Hortic. Sci. 1993, 118, 580–586. [Google Scholar]
- Selles, G.; Berger, A. Physiological indicators of plant water status as criteria for irrigation scheduling. Acta Hortic. 1989, 278, 87–100. [Google Scholar] [CrossRef]
- McCutchan, H.; Shackel, K.A. Stem-water potential as a sensitive indicator of water stress in prune trees (Prunus domestica L. cv. French). J. Am. Soc. Hortic. Sci. 1992, 117, 607–611. [Google Scholar]
- Ferreira, M.I.; Valancogne, C.; Daudet, F.-A.; Ameglio, T.; Pacheco, C.A.; Michaelsen, J. Evapotranspiration and crop-water relations in a peach orchard. In Proceedings of the International Conference on “Evapotranspiration and Irrigation Scheduling”, San Antonio, TX, USA, 3–6 November 1996; pp. 61–69. [Google Scholar]
- Gucci, R.; Massai, R.; Xiloyannis, C.; Flore, J.A. The effect of drought and vapour pressure deficit on gas exchange of young kiwifruit (Actinidia deliciosa var. deliciosa) vines. Ann. Bot. 1996, 77, 605–613. [Google Scholar] [CrossRef]
- Goldhamer, D.A.; Fereres, E.; Mata, M.; Girona, J.; Cohen, M. Sensitivity of continuous and discrete plant and soil water status monitoring in peach trees subjected to deficit irrigation. J. Am Soc. Hortic. Sci. 1999, 124, 437–444. [Google Scholar]
- Silvestre, J.; Ferreira, M.I. Efects of irrigation on transpiration and water relations of vineyards, in the Teja Valley (central Portugal). Acta Hortic. 2000, 537, 305–312. [Google Scholar] [CrossRef]
- Naor, A.; Cohen, S. Sensitivity and variability of maximum trunk shrinkage, midday stem water potencial, and transpiration rate in response to withholding irrigation from field-grown apple trees. HortScience 2003, 38, 547–551. [Google Scholar]
- Malheiro, A.C.; Gonçalves, I.N.; Fernandes-Silva, A.A.; Silvestre, J.C.; Conceição, N.S.; Paço, T.A.; Ferreira, M.I. Relationships between relative transpiration of grapevines and plant and soil water status in Portugal's Douro wine region. Acta Hortic. 2011, 922, 261–267. [Google Scholar] [CrossRef]
- Intrigliolo, D.S.; Castel, J.R. Effects of regulated deficit irrigation on growth and yield of young Japanese plum trees. J. Hortic. Sci. Biotechnol. 2005, 80, 177–182. [Google Scholar] [CrossRef]
- Intrigliolo, D.S.; Puerto, H.; Bonet, L.; Alarcón, J.J.; Nicolas, E.; Bartual, J. Usefulness of trunk diameter variations as continuous water stress indicators of pomegranate (Punica granatum) trees. Agric. Water Manag. 2011, 98, 1462–1468. [Google Scholar] [CrossRef]
- Ferreira, M.I.; Conceição, N.; Pacheco, C.A.; Häusler, M. Análise de indicadores de desconforto hídrico durante ciclos de stress num olival intensivo no Alentejo. Atas Port. Hortic. 2012, 21, 217–226. [Google Scholar]
- Paço, T.; Ferreira, M.I.; Pacheco, C.A. Scheduling peach orchard irrigation in water stress conditions: Use of relative transpiration and predawn leaf water potential. Fruits 2013, 68, 147–158. [Google Scholar] [CrossRef]
- Silva, R.; Ferreira, M.I. A new microdendrometric index to quantify water status in kiwifruit. Acta Hortic. 2014, 1038, 43–50. [Google Scholar]
- Ennajeh, M.; Tounekti, T.; Vadel, A.M.; Khemira, H.; Cochard, H. Water relations and drought-induced embolism in olive (Olea europaea) varieties ‘Meski’ and ‘Chemlali’ during severe drought. Tree Physiol. 2008, 28, 971–976. [Google Scholar] [CrossRef] [PubMed]
- Fereres, E.; Goldhamer, D. Suitability of stem diameter variations and water potential as indicators for irrigation scheduling of almond trees. J. Hortic. Sci. Biotechnol. 2003, 78, 139–144. [Google Scholar] [CrossRef]
- Rieger, M.; Duemmel, M.J. Comparison of drought resistance among Prunus species from divergent habitats. Tree Physiol. 1992, 11, 369–380. [Google Scholar] [CrossRef] [PubMed]
- Lankes, C. Effect of water stress on transpiration and CO2 gas exchange of the apple leaf and fruit. Acta Hortic. 1985, 171, 305–314. [Google Scholar]
- Jorba, J.; Tapia, L.; Sant, D. Photosynthesis, leaf water potential, and stomatal conductance in Olea europaea under wet and drought conditions. Acta Hortic. 1984, 171, 237–246. [Google Scholar] [CrossRef]
- Tan, C.S.; Buttery, B.R. Response of stomatal conductance, transpiration, photosynthesis, and leaf water potential in peach seedlings to different watering regimes. HortScience 1982, 17, 222–223. [Google Scholar]
- Doltra, J.; Oncins, J.A.; Bonany, J.; Cohen, M. Evaluation of plant-based water status indicators in mature apple trees under field conditions. Irrig. Sci. 2007, 25, 351–359. [Google Scholar] [CrossRef]
- Velez, J.E.; Intrigliolo, D.S.; Castel, J.R. Scheduling deficit irrigation of citrus trees with maximum daily trunk shrinkage. Agric. Water Manag. 2007, 90, 197–204. [Google Scholar] [CrossRef]
- Huguet, J.G. Appréciation de l’état hydrique d’une plante à partir des variations micrométriques de la dimension des fruits ou des tiges au cours de la journée. Agronomie 1985, 5, 733–741. [Google Scholar] [CrossRef]
- Nortes, P.A.; Pérez-Pastor, A.; Egea, G.; Conejero, W.; Domingo, R. Comparison of changes in stem diameter and water potential values for detecting water stress in young almond trees. Agric. Water Manag. 2005, 77, 296–307. [Google Scholar] [CrossRef]
- Li, S.H.; Huguet, J.G.; Bussi, C. Irrigation scheduling in a mature peach orchard using tensiometers and dendrometers. Irrig. Drain. Syst. 1989, 3, 1–12. [Google Scholar] [CrossRef]
- Remorini, D.; Massai, R. Comparison of water status indicators for young peach trees. Irrig. Sci. 2003, 22, 39–46. [Google Scholar]


| Year | P (mm) | Taverage (°C) | HRmax (%) | HRmin (%) | ETo (mm) | |
|---|---|---|---|---|---|---|
| Experiment 1 Beja (Portugal) | 2009 | 418.0 | 17.66 | 93.33 | 40.53 | 1311.50 |
| 2010 | 734.6 | 17.08 | 94.01 | 45.44 | 1222.99 | |
| Experiment 2 Vegas Bajas (Spain) | 2010 | 738.7 | 16.31 | 88.04 | 40.56 | 1317.70 |
| 2014 | 506.7 | 16.33 | 95.74 | 42.72 | 1230.79 | |
| 2015 | 328.0 | 16.45 | 93.03 | 38.65 | 1310.50 | |
| 2016 | 546.0 | 16.35 | 99.25 | 42.96 | 1236.98 |
| Species/Cultivar | Behaviour | Plant Water Potential | SDV Derived Indexes | RTr | Other Indexes | Reference | |||||
|---|---|---|---|---|---|---|---|---|---|---|---|
| Iso | Aniso | Doubts | Ψpd | Ψst | MDS or RDTS | TGR | Other | ||||
| Prunus persica ‘Fire-Red’ | NC 2 | R | G | G | G | [59] | |||||
| Prunus persica ‘French’ | NC | B | G | gs 1 | [60] | ||||||
| Prunus persica ‘Cal Red’ | * | G | B | gs, LT 3 | [58] | ||||||
| Prunus persica ‘H30’ | * | G | RDTS | Tr, gs relat, θs | [61] | ||||||
| Actinidia deliciosa ‘Deliciosa’ | * | G | gs, A, Tr | [62] | |||||||
| Prunus persica ‘O’Henry’ | * | G | G | R | MXTD MNTD | θs 4 | [63] | ||||
| Vitis vinifera ‘Trincadeira’ | * | G | B | Tr, gs, | [64] | ||||||
| Prunus persica ‘Andros’ | * | G | G | G | G | [9] | |||||
| Malus domestica ‘Golden delicious’ | * | B | G | G | G | gs relat | [65] | ||||
| Vitis vinifera ‘Tempranillo’ | * | G | B | gs | [66] | ||||||
| Prunus salicina ‘Black Gold’ | NC | G | R 5 | [67] | |||||||
| Diospyros kaki. ‘Rojo Brillante’ | * | NC | R | R | gs | [10] | |||||
| Punica granatum ‘Mollar de Elche’ | * | G | R | B | [68] | ||||||
| Prunus persica ‘Flordastar’ | NC | B | G | [11] | |||||||
| Olea europea ‘Arbequina’ | * | G | B 8 | B 8 | DMXTD/MXTD | Tr, θs | [69] | ||||
| Punica granatum ‘Mollar de Elche’ | *,7 | G | B | gs | [57] | ||||||
| Prunus persica ‘Silver King’ | * | G | Tr | [70] | |||||||
| Actinidia deliciosa ‘Hayward’ | * | B | G | R | MDS (1-OGR) 6 | gs, θs | [71] | ||||
© 2017 by the authors. Licensee MDPI, Basel, Switzerland. This article is an open access article distributed under the terms and conditions of the Creative Commons Attribution (CC BY) license (http://creativecommons.org/licenses/by/4.0/).
Share and Cite
Blanco-Cipollone, F.; Lourenço, S.; Silvestre, J.; Conceição, N.; Moñino, M.J.; Vivas, A.; Ferreira, M.I. Plant Water Status Indicators for Irrigation Scheduling Associated with Iso- and Anisohydric Behavior: Vine and Plum Trees. Horticulturae 2017, 3, 47. https://doi.org/10.3390/horticulturae3030047
Blanco-Cipollone F, Lourenço S, Silvestre J, Conceição N, Moñino MJ, Vivas A, Ferreira MI. Plant Water Status Indicators for Irrigation Scheduling Associated with Iso- and Anisohydric Behavior: Vine and Plum Trees. Horticulturae. 2017; 3(3):47. https://doi.org/10.3390/horticulturae3030047
Chicago/Turabian StyleBlanco-Cipollone, Fernando, Sónia Lourenço, José Silvestre, Nuno Conceição, María José Moñino, Antonio Vivas, and Maria Isabel Ferreira. 2017. "Plant Water Status Indicators for Irrigation Scheduling Associated with Iso- and Anisohydric Behavior: Vine and Plum Trees" Horticulturae 3, no. 3: 47. https://doi.org/10.3390/horticulturae3030047