


Abstract
Water deficit can alter plant growth and stress-related biochemical and molecular responses. Four fungal isolates obtained from Pinus cembroides roots—Cadophora sp., Phialophora livistonae, Pochonia sp., and Pochonia chlamydosporia—were evaluated in vitro under increasing polyethylene glycol (PEG-6000) concentrations. Pochonia sp. and P. livistonae were subsequently selected for inoculation of tomato seedlings grown at 100, 75, 50, or 25% of substrate water-holding capacity. Seedling growth, root and leaf biochemical traits, antioxidant enzyme activities, and expression of five water-deficit-associated genes were evaluated using factorial analyses. Pochonia sp. maintained the greatest colony diameter across the PEG-6000 treatments, while Pochonia sp. and P. livistonae produced the highest fresh fungal biomass at 20% PEG-6000. Irrigation level significantly influenced most seedling growth traits. Fungal inoculation significantly affected root fresh and dry weights overall, but within level comparisons identified a higher root fresh weight with P. livistonae than in uninoculated seedlings only under mild water stress (75%). Under the same conditions, P. livistonae reduced root proline content relative to the uninoculated control and Pochonia sp. Root catalase activity showed a significant inoculation × irrigation inter-action, whereas total phenolic content and leaf antioxidant enzyme activities showed no significant treatment effects. Irrigation significantly affected Fe-SOD gene expression, but fungal inoculation had no significant effect on any evaluated gene; none of the planned inoculation contrasts remained significant after Holm adjustment. These findings indicate selective, mainly root-associated responses to fungal inoculation rather than consistent enhancement of tomato growth or water-deficit tolerance. Further work should verify fungal colonization and assess plant water status and performance under production conditions.
1. Introduction
Climate change represents a growing threat to agricultural production because of alterations in temperature and precipitation patterns [1]. Rising global temperatures affect the hydrological cycle by increasing evaporation and contributing to more frequent and intense drought periods in certain regions [2]. Reduced water availability causes physiological, biochemical, and molecular alterations in plants that can limit their growth and productivity [3]. Major effects include reductions in photosynthesis, stomatal conductance, and gas exchange, as well as increased accumulation of reactive oxygen species (ROS), which can cause oxidative damage when their production exceeds the antioxidant capacity of the plant [4].
Tomato (Solanum lycopersicum L.) is one of the most important horticultural crops worldwide; in 2024, production exceeded 188 million tons [5]. Its fruits are an important source of nutritional and antioxidant compounds, including polyphenols and carotenoids, which are associated with beneficial effects on human health [6]. However, water deficit can substantially affect crop growth and yield [7], because tomato requires an adequate water supply to maintain physiological and productive processes, and many commercial cultivars are sensitive to drought conditions [8]. Therefore, identifying biological strategies that improve tomato responses to limited water availability is highly relevant.
Endophytic fungi represent a potential strategy for modulating plant responses to adverse environmental conditions [9]. These microorganisms colonize the internal tissues of apparently healthy plants without causing visible disease symptoms [10]. Several studies have shown that plant–endophyte associations can help mitigate the effects of water deficit through mechanisms including modulation of phytohormones such as auxins, gibberellins, cytokinins, and abscisic acid; nutrient mobilization; and accumulation of compatible solutes such as proline. Endophytes can also modify plant water relations and activate antioxidant defense mechanisms, including enzymes such as catalase and superoxide dismutase, which participate in controlling reactive oxygen species generated during stress [11,12,13].
Beneficial effects of different endophytic fungi have been documented in horticultural species. Inoculation with Pochonia chlamydosporia has promoted growth in tomato and lettuce plants [14]; this species is also recognized for its nematicidal activity [15] and has been associated with increased root and leaf biomass in banana plants [16]. In addition, Cadophora sp. strains have shown activity against Fusarium oxysporum in melon plants, reducing pathogen colonization [17]. Likewise, inoculation of tomato with Phialophora mustea improved plant growth and tolerance under metal-stress conditions [18]. These findings demonstrate the potential of different endophytic fungi to modify plant responses to stress conditions.
Although Pinus cembroides and Solanum lycopersicum are phylogenetically distant plant species, the ability of fungal endophytes to interact with different hosts is not necessarily restricted by the taxonomic identity of their original host. Host specificity varies among fungal endophytes, and some fungi can establish associations with phylogenetically distinct plant species, although the outcome of these interactions depends on fungal identity, host characteristics, and environmental conditions [19,20]. Previous studies have demonstrated that fungal endophytes isolated from non-tomato hosts can colonize tomato roots and influence plant growth and nutrient acquisition [21]. These findings provide a rationale for investigating fungi isolated from P. cembroides as potential modulators of tomato seedling responses. Furthermore, the selection of these fungal isolates provided an opportunity to investigate their potential to modulate the morphological, biochemical, and molecular responses of tomato seedlings under different levels of water availability. Nevertheless, their original association with P. cembroides does not establish their capacity to colonize tomato or confer stress tolerance; rather, these possibilities require experimental evaluation.
Despite this evidence, limited information is available on the effects of Cadophora sp., Phialophora livistonae, and Pochonia species on the morphological, biochemical, antioxidant, and molecular responses of tomato plants subjected to different intensities of water deficit. Furthermore, the potential of endophytic fungi isolated from a phylogenetically distant host, such as Pinus cembroides, to modulate the water-deficit response of a horticultural species has been little explored. We hypothesized that inoculation with selected fungal isolates obtained from Pinus cembroides roots could modulate the morphological, biochemical, antioxidant, and molecular responses of tomato seedlings subjected to different levels of water availability, with responses depending on fungal identity and water-deficit intensity.
2. Materials and Methods
2.1. Sampling, Isolation, and Identification of Endophytic Fungi
Sampling was conducted between January and March 2023 in 10 Pinus cembroides plots located in the states of Coahuila and Nuevo León, Mexico. In Coahuila, sampling sites included Caballos in the municipality of Saltillo, and Cedritos, Compadres, La Herradura, El Recreo, Montebello, and Sierra Escondida in the municipality of Arteaga. In Nuevo León, La Rosita, San Juanito, and San Felipe in the municipality of Aramberri were included. At each site, a 1.0 ha sampling plot with little or no disturbance was established. Twenty trees separated by at least 8 m were randomly selected. Roots were collected by excavating approximately 1.5 m from the base of the trunk following the methodology described in [22]. Root tips collected from the 20 trees in each plot were combined into a composite sample, placed in resealable bags, and transported to the laboratory in a portable cooler. Sampling tools were disinfected between trees with Saniquat 10® quaternary ammonium salts (TECHMAN Ltda., Santiago de Chile, Chile).
At the Plant Physiology Laboratory of Universidad Autónoma Agraria Antonio Narro, roots were washed under running water using a sieve to remove soil residues and then cut into approximately 4 mm segments. Under laminar-flow conditions, the segments were surface-disinfected by sequential immersion in 0.05% Tween 20 (Thermo Fisher Scientific, Waltham, MA, USA) for 1 min, 3% H2O2 (Thermo Fisher Scientific, Waltham, MA, USA) for 5 min, 96% ethanol (Thermo Fisher Scientific, Waltham, MA, USA) for 1 min, and 6% NaClO (Thermo Fisher Scientific, Waltham, MA, USA) for 5 min. Between each step, the segments were rinsed with sterile distilled water, followed by two additional rinses at the end of the procedure. The segments were dried on sterile filter paper, placed in Petri dishes containing potato dextrose agar (PDA) (Thermo Fisher Scientific, Waltham, MA, USA), and incubated at 25 °C for one month. Fungi showing mycelial growth associated with root segments were successively transferred to fresh PDA plates until pure cultures were obtained. Because the effectiveness of surface disinfection was not independently verified by plating the final rinse water or performing tissue imprints, the possibility of recovering residual surface-associated fungi cannot be completely excluded.
For molecular identification, mycelium from each isolate was collected and ground in liquid nitrogen. A 300 mg aliquot of powdered material was used for genomic DNA extraction with the EZ-10 Spin Column Fungal Genomic DNA Miniprep Kit (Bio Basic, Amherst, NY, USA), following the manufacturer’s instructions. DNA concentration and purity were evaluated by spectrophotometry at 260 and 280 nm.
The ITS region was amplified using primers ITS1 (5′-TCCGTAGGTGAACCTGCGG-3′) and ITS4 (5′-TCCTCCGCTTATTGATATGC-3′) [23], following the methodology described by Assad et al. [24]. Polymerase chain reaction (PCR) was performed in a final volume of 50 µL containing 50 ng DNA, 25 µL MyTaq™ Mix (Bioline Reagents Ltd., London, UK), 1 µL ITS1 primer (20 µM), 1 µL ITS4 primer (20 µM), and molecular-biology-grade water to the final volume. Amplification conditions (StepOne™ Real-Time PCR System, Applied Biosystems (Thermo Fisher Scientific), Foster City, CA, USA) were initial denaturation at 95 °C for 10 min; 35 cycles of denaturation at 95 °C for 30 s, annealing at 54 °C for 30 s, and extension at 72 °C for 1 min; followed by a final extension at 72 °C for 10 min.
PCR products were verified by agarose gel electrophoresis. After amplification was confirmed, the PCR product was quantified by spectrophotometry (GENESYS™ 10S UV-Vis, Thermo Fisher Scientific, Madison, WI, USA) and adjusted to 1 ng µL−1. Samples were sent for sequencing to the National Laboratory of Agricultural, Medical, and Environmental Biotechnology (LANBAMA), San Luis Potosí, Mexico. The resulting sequences were compared with those available in the GenBank database of the National Center for Biotechnology Information (NCBI) using BLAST tool (National Center for Biotechnology Information, Bethesda, MD, USA; https://blast.ncbi.nlm.nih.gov/Blast.cgi, accessed on 30 October 2026) [25]. Taxonomic identification of the isolates was established based on sequence similarity to reference sequences available in GenBank.
2.2. In Vitro Evaluation of Endophytic Fungi
Two in vitro assays were conducted to evaluate the tolerance of endophytic fungi to osmotic stress induced by polyethylene glycol 6000 (PEG-6000) (Thermo Fisher Scientific, Waltham, MA, USA). Both assays were performed with three replicates per treatment.
In the first assay, fungi were grown on potato dextrose agar (PDA) (Thermo Fisher Scientific, Waltham, MA, USA) treated with PEG-6000 solutions. Ten milliliters of 10, 15, and 20% PEG-6000 solutions were applied to previously solidified medium, with nominal reference osmotic potentials of approximately −0.2, −0.4, and −0.6 MPa, respectively, based on the methodology described in [9]. These values were used as nominal references rather than experimentally verified osmotic potentials, as the effective osmotic potential of the PEG-treated solid medium was not measured. Distilled water was used for the control treatment. The solutions remained on the medium overnight; excess solution was then removed, and the Petri dishes were allowed to dry under laminar-flow conditions. An explant of each fungal isolate was placed in the center of each Petri dish, and cultures were incubated at 28 °C in darkness for 30 days. Radial colony growth was evaluated by measuring colony diameter after 30 days of incubation using a digital caliper (Mitutoyo Corporation, Kawasaki, Japan). Relative colony growth was calculated by expressing the mean colony diameter under each PEG-6000 concentration as a percentage of the corresponding control (0% PEG-6000) for each fungal isolate.
In the second assay, fungi were grown in 30 mL of liquid Czapek Dox medium (Thermo Fisher Scientific, Waltham, MA, USA) containing PEG-6000 at 5, 10, 15, and 20%, associated with nominal reference osmotic potentials of approximately −0.1, −0.2, −0.4, and −0.6 MPa, respectively, according to [9]. These values were not experimentally verified and should be considered nominal estimates rather than actual osmotic potentials of the culture medium. The medium was inoculated with a suspension of each fungal isolate adjusted to 2 × 10⁷ spores mL−1. Cultures were incubated for 7 days at 28 °C in darkness with constant agitation at 120 rpm. At the end of the incubation period, fungal biomass was recovered by filtration, washed to remove residual culture medium and PEG-6000, and subsequently weighed to determine fresh biomass.
2.3. Seedling Assay
The experiment was established as a 3 × 4 factorial design. Factor A corresponded to endophytic fungal inoculation and comprised three levels: uninoculated absolute control (AC), Phialophora livistonae (Pl), and Pochonia sp. (P). Factor B corresponded to water availability and comprised four levels: 100% (well-watered, WW), 75% (mild water stress, MWS), 50% (water stress, WS), and 25% (severe water stress, SWS) of substrate water-holding capacity. Combining both factors generated 12 treatments, with 20 plants per treatment and 240 plants in total.
To establish water-availability levels, substrate water-holding capacity was first determined gravimetrically. The 100% level was established from the weight of dry substrate plus the water retained after saturation and drainage. The 75, 50, and 25% levels were calculated from this value. Pots were weighed every four days to monitor changes in substrate water content and determine the amount of water required to restore the corresponding irrigation level. Additionally, one reference plant was maintained for each treatment and weighed to estimate the contribution of plant biomass to the total pot weight. This estimate was considered when calculating irrigation requirements to account for changes in plant biomass during the experimental period. Because irrigation adjustments were performed at four-day intervals, substrate moisture was not continuously maintained at the nominal target levels between irrigation events.
The experiment was conducted in a bioclimatic chamber under controlled conditions of 25 °C, 65% relative humidity, photosynthetically active radiation (PAR) of 95 µmol m−2 s−1, and a photoperiod of 10 h light/14 h dark. The 240 plants were randomly distributed within the chamber, with 120 plants in the upper section and 120 in the lower section. Plants were periodically rotated among positions throughout the experimental period to minimize potential positional effects associated with spatial variations in environmental conditions. However, individual plant positions were not systematically recorded; therefore, chamber position was not included as a blocking factor in the statistical analysis. Irrigation was applied every four days, and water-availability treatments were maintained for 25 days.
Saladette-type tomato seeds (Kristen Seed, Guadalajara, Mexico) were germinated in trays containing sterile Berger BM2 substrate (Berger Peat Moss, Saint-Modeste, QC, Canada). One month after sowing, seedlings were transplanted into 473 mL expanded-polystyrene containers filled with the same substrate. Selected strains were applied in two inoculations at 7 and 15 days after transplanting. At each inoculation, 10 mL of a fungal suspension adjusted to 2 × 10⁶ spores mL−1 was applied. Control plants received 10 mL of Czapek Dox medium, which was used to prepare the inoculum.
Water-availability treatments were initiated after the second inoculation and maintained for 25 days. Evaluations were performed 40 days after transplanting.
2.4. Growth and Biomass Variables
To evaluate treatment effects on tomato seedling growth, 8 plants per treatment were selected. Plant height and root length were measured using a graduated ruler and expressed in centimeters (cm). Stem diameter was measured using a digital caliper (Mitutoyo, Japan) and expressed in millimeters (mm). Shoot and root fresh weights were determined immediately after harvesting, whereas dry weights were recorded after oven-drying the samples to constant weight.
Plants were then separated into shoots (stems and leaves) and roots to determine fresh and dry biomass of each tissue. Immediately after separation, samples were weighed on a precision balance (OHAUS Corporation, Parsippany, NJ, USA) to determine fresh biomass. Samples were then placed in paper bags and oven-dried (BIOBASE Group, Jinan, Shandong, China) at 70 °C for 72 h. After drying, samples were weighed again to determine dry biomass.
2.5. Biochemical Determinations
Leaf and root samples were used for biochemical determinations. Three biological replicates were analyzed per treatment, each consisting of a composite tissue sample from three plants. Samples were frozen, ground in liquid nitrogen using a porcelain mortar, and stored at −80 °C until analysis (SANYO Electric Co., Ltd., Moriguchi, Osaka, Japan).
2.5.1. Total Phenolic Content
Total phenolic content was determined according to the methodology described in [26]. For extraction, 200 mg of tissue was mixed with 1 mL of water:acetone (1:1, v/v) (Thermo Fisher Scientific, Waltham, MA, USA). Samples were centrifuged at 10,000 rpm for 10 min at 4 °C. Subsequently, 15 µL of supernatant was mixed with 60 µL of 100% Folin–Ciocalteu reagent (Thermo Fisher Scientific, Waltham, MA, USA), 150 µL of Na2CO3 (at 20% w/v) (Thermo Fisher Scientific, Waltham, MA, USA), 300 µL of water:acetone (1:1, v/v), and 1475 µL of distilled water. The mixture was incubated at 45 °C for 30 min, and absorbance was measured at 750 nm using a spectrophotometer (GENESYS™ 10S UV-Vis, Thermo Fisher Scientific, Madison, WI, USA). For the blank, the supernatant was replaced with water:acetone (1:1, v/v). Quantification was performed using a 1–100 µg mL−1 gallic acid (Thermo Fisher Scientific, Waltham, MA, USA) calibration curve, and results were expressed as milligrams of gallic acid equivalents per gram fresh weight (mg GAE g−1 FW).
2.5.2. Proline Content
Proline content was determined according to the methodology described in [27]. For extraction, 100 mg of tissue was mixed with 2 mL of ethanol:water (70:30, v/v) (Thermo Fisher Scientific, Waltham, MA, USA) and kept at 4 °C overnight. Subsequently, 500 µL of extract was combined with 1000 µL of a reaction mixture containing 1% (w/v) ninhydrin (Thermo Fisher Scientific, Waltham, MA, USA), 60% (v/v) acetic acid (Thermo Fisher Scientific, Waltham, MA, USA), and 20% (v/v) ethanol. The mixture was vortexed and incubated at 95 °C for 20 min in a heating block. Samples were then centrifuged at 2500 rpm for 1 min, and absorbance was measured at 520 nm using a spectrophotometer (GENESYS™ 10S UV-Vis, Thermo Fisher Scientific, Madison, WI, USA). For the blank, the extract was replaced with ethanol:water (70:30, v/v). Quantification was performed using a 2–100 µg mL−1 proline (Thermo Fisher Scientific, Waltham, MA, USA) calibration curve, and results were expressed as mg proline g−1 fresh weight.
2.6. Enzymatic Determinations
Leaf and root samples were used for enzymatic determinations. Three biological replicates were analyzed per treatment, each consisting of a composite tissue sample from three plants. Samples were frozen, ground in liquid nitrogen, and stored at −80 °C until analysis (SANYO Electric Co., Ltd., Moriguchi, Osaka, Japan).
To obtain the protein extract, 200 mg of tissue was homogenized with 20 mg of polyvinylpyrrolidone (PVP) (Thermo Fisher Scientific, Waltham, MA, USA) and 1.5 mL of 0.1 M phosphate buffer (pH 7.0–7.2) (Thermo Fisher Scientific, Waltham, MA, USA). Samples were vortexed for 20 s, sonicated for 5 min, and then centrifuged at 12,500 rpm for 10 min at 4 °C. The supernatant was recovered and used for total protein quantification and determination of enzymatic activities.
2.6.1. Total Proteins
Total protein concentration was determined using the Bradford method [28]. Forty microliters of protein extract were mixed with 2 mL of Bradford reagent (Thermo Fisher Scientific, Waltham, MA, USA) prepared with 100 mg Coomassie Brilliant Blue, 50 mL of 95% ethanol, and 100 mL of 85% phosphoric acid, with the final volume adjusted to 1 L with distilled water. Samples were vortexed and incubated for 10 min in darkness. Absorbance was then measured at 595 nm using a spectrophotometer (GENESYS™ 10S UV-Vis, Thermo Fisher Scientific, Madison, WI, USA). Water was used instead of extract for the blank. Protein concentration was determined using a 10–1000 µg mL−1 bovine serum albumin (Thermo Fisher Scientific, Waltham, MA, USA) calibration curve, and results were expressed as mg g−1 fresh weight.
2.6.2. Catalase Activity
Catalase (CAT) activity was determined according to the methodology described in [29] by quantifying the H2O2 (Thermo Fisher Scientific, Waltham, MA, USA) remaining at two reaction times. At the initial time (t0), 100 µL of enzyme extract was mixed with 400 µL of 5% H2SO4 (Thermo Fisher Scientific, Waltham, MA, USA) and 1 mL of H2O2 (100 mM), and absorbance was measured immediately at 240 nm using a quartz cuvette. At the final time (t1), 100 µL of enzyme extract was mixed with 1 mL of H2O2 (100 mM), and the reaction was allowed to proceed for 1 min. Subsequently, 400 µL of 5% H2SO4 was added to stop the reaction, and absorbance was measured at 240 nm (GENESYS™ 10S UV-Vis, Thermo Fisher Scientific, Madison, WI, USA).
For the blank, the enzyme extract was replaced with 0.1 M phosphate buffer (pH 7.0–7.2). H2O2 concentration was determined using a 1–25 mM calibration curve. CAT activity was expressed as mM H2O2 consumed min−1 mg−1 protein.
2.6.3. Glutathione Peroxidase Activity
Glutathione peroxidase (GPX) activity was determined following the modified method described in [30] and adapted by [31], using H2O2 as substrate. Two hundred microliters of enzyme extract were mixed with 400 µL of reduced glutathione (GSH, 1 mM) (Thermo Fisher Scientific, Waltham, MA, USA) and 200 µL of Na2HPO4 (0.067 M) (Thermo Fisher Scientific, Waltham, MA, USA). The mixture was preincubated in a water bath at 25 °C for 5 min. Subsequently, 200 µL of H2O2 (1.3 mM) was added to initiate the reaction, which proceeded for 10 min. The reaction was stopped by adding 1 mL of 5% H2SO4 (Thermo Fisher Scientific, Waltham, MA, USA).
Samples were kept in an ice bath for 30 min and then centrifuged at 3000 rpm for 10 min at 4 °C. For quantification, 320 µL of supernatant was mixed with 1.466 mL of Na2HPO4 (0.32 M) and 213 µL of 5,5′-dithiobis-(2-nitrobenzoic acid) (DTNB, 1 mM) (Thermo Fisher Scientific, Waltham, MA, USA). Absorbance (GENESYS™ 10S UV-Vis, Thermo Fisher Scientific, Madison, WI, USA) was measured at 412 nm using a quartz cuvette. For the blank, the enzyme extract was replaced with 0.1 M phosphate buffer (pH 7.0–7.2). Quantification was performed using a glutathione (Thermo Fisher Scientific, Waltham, MA, USA) calibration curve, and GPX activity was expressed as mM glutathione consumed min−1 mg−1 protein.
2.7. Gene Expression Analysis by RT-qPCR
For gene expression analysis, leaf samples were collected, immediately placed in aluminum foil bags, frozen in liquid nitrogen, and stored at −80 °C (SANYO Electric Co., Ltd., Moriguchi, Osaka, Japan) until processing. Three independent biological replicates were evaluated per treatment (n = 3). Each biological replicate consisted of a pooled leaf sample collected from three individual tomato plants, resulting in nine plants sampled per treatment. Gene expression data were statistically analyzed using the individual values reported as relative expression (fold change) for each biological replicate. Samples were ground in liquid nitrogen, and 100 mg of tissue was used for total RNA extraction.
RNA was extracted using TRI Reagent (Molecular Research Center, Inc., Cincinnati, OH, USA). One milliliter of reagent was added to each sample and incubated for 5 min at room temperature. Subsequently, 200 µL of chloroform (Thermo Fisher Scientific, Waltham, MA, USA) was added, samples were vigorously shaken, and incubated for 15 min at room temperature. Samples were then centrifuged at 12,000 rpm for 15 min at 4 °C, and the aqueous phase was recovered. Five hundred microliters of cold isopropanol (Thermo Fisher Scientific, Waltham, MA, USA) were added, mixed, and incubated for 10 min at room temperature. Samples were centrifuged again at 12,000 rpm for 10 min at 4 °C, the supernatant was discarded, and the RNA pellet was washed with 500 µL of cold 70% ethanol (Thermo Fisher Scientific, Waltham, MA, USA). After removing the ethanol, the pellet was air-dried for 15 min at room temperature and resuspended in 50 µL of Formazol (Molecular Research Center, Inc., Cincinnati, OH, USA). RNA dissolved in Formazol was precipitated by adding NaCl (0.2 M final concentration) (Thermo Fisher Scientific, Waltham, MA, USA) and four volumes of absolute ethanol. The mixture was centrifuged at 10,000× g for 5 min to pellet the RNA, which was then washed with 75% ethanol, briefly air-dried, and resuspended in nuclease-free water. Subsequently, the RNA was treated with DNase I (Sigma-Aldrich, St. Louis, MO, USA) and stored at −20 °C until use.
RNA concentration and purity were evaluated by spectrophotometry at 260 and 280 nm using a spectrophotometer (GENESYS™ 10S UV-Vis, Thermo Fisher Scientific, Madison, WI, USA), and RNA integrity was verified by gel electrophoresis. Complementary DNA (cDNA) was synthesized using the SensiFAST™ kit (Bioline Reagents Ltd., London, UK). The reaction was performed in a final volume of 20 µL containing 2 µg RNA, 4 µL 5× TransAmp Buffer (Bioline Reagents Ltd., London, UK), 1 µL reverse transcriptase (RT) (Bioline Reagents Ltd., London, UK), and molecular-biology-grade water to the final volume. Synthesis was performed in an Axygen MaxyGene II thermal cycler (Corning Life Sciences, Tewksbury, MA, USA) under the following conditions: 25 °C for 10 min, 42 °C for 15 min, 48 °C for 15 min, and 85 °C for 5 min, followed by holding at 4 °C. The resulting cDNA was refrigerated until use.
Quantitative real-time PCR (qPCR) was performed using Forget-Me-Not™ EvaGreen® qPCR Master Mix (Biotium, Inc., Fremont, CA, USA). Each reaction contained 10 µL Master Mix, 0.13 µL forward primer (100 nM), 0.13 µL reverse primer (100 nM), 0.4 µL ROX, and molecular-biology-grade water to a final volume of 20 µL. Reactions were performed in a StepOne Real-Time PCR System (Applied Biosystems, Foster City, CA, USA) under the following conditions: 95 °C for 10 min, followed by 40 cycles of 95 °C for 15 s and 60 °C for 1 min. The uninoculated, well-watered treatment (AC + WW; 100% substrate water-holding capacity) was used as the calibrator, and expression levels were reported as fold changes relative to this treatment.
Expression of NCED1 (9-cis-epoxycarotenoid dioxygenase 1), PIP2 (aquaporin), ERD15 (Early Responsive to Dehydration 15), PAL5-3 (phenylalanine ammonia-lyase), and Fe-SOD (iron superoxide dismutase) was evaluated. ACT (actin) was used as the reference gene for normalization. Relative gene expression was calculated using the 2−ΔΔCt method, with ACT used to normalize Ct values. Primer sequences are shown in Table 1.
Table 1.
Primer sequences.
2.8. Statistical Analysis
Statistical analyses were performed using R software version 4.4.1 (R Core Team) through RStudio version 2025.09.2 (Posit Software, PBC, Boston, MA, USA) [32].
In vitro assays were analyzed using two-way analysis of variance (ANOVA), considering fungal isolate and PEG-6000 concentration as fixed factors. When significant effects were detected, means were compared using Tukey’s test at p < 0.05. Relative colony growth was calculated for descriptive comparison with the corresponding control of each fungal isolate (Supplementary Material). Results were expressed as mean ± standard error. Graphical representations were prepared using GraphPad Prism version 11.
3. Results
3.1. Molecular Identification of Endophytic Fungi
Analysis of ITS-region sequences identified four endophytic fungi isolated from Pinus cembroides roots: Pochonia sp. (SJ10504), Cadophora sp. (CA2-1602), Phialophora livistonae (CO8-1402), and Pochonia chlamydosporia (M2-2804) (Table 2). Sequence identity with GenBank entries ranged from 98 to 99.65%, whereas sequence coverage ranged from 79 to 98%.
Table 2.
Identification results for strains isolated from Pinus cembroides.
3.2. In Vitro Tolerance to Osmotic Stress
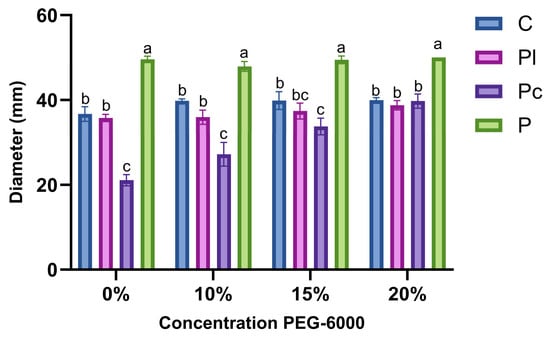
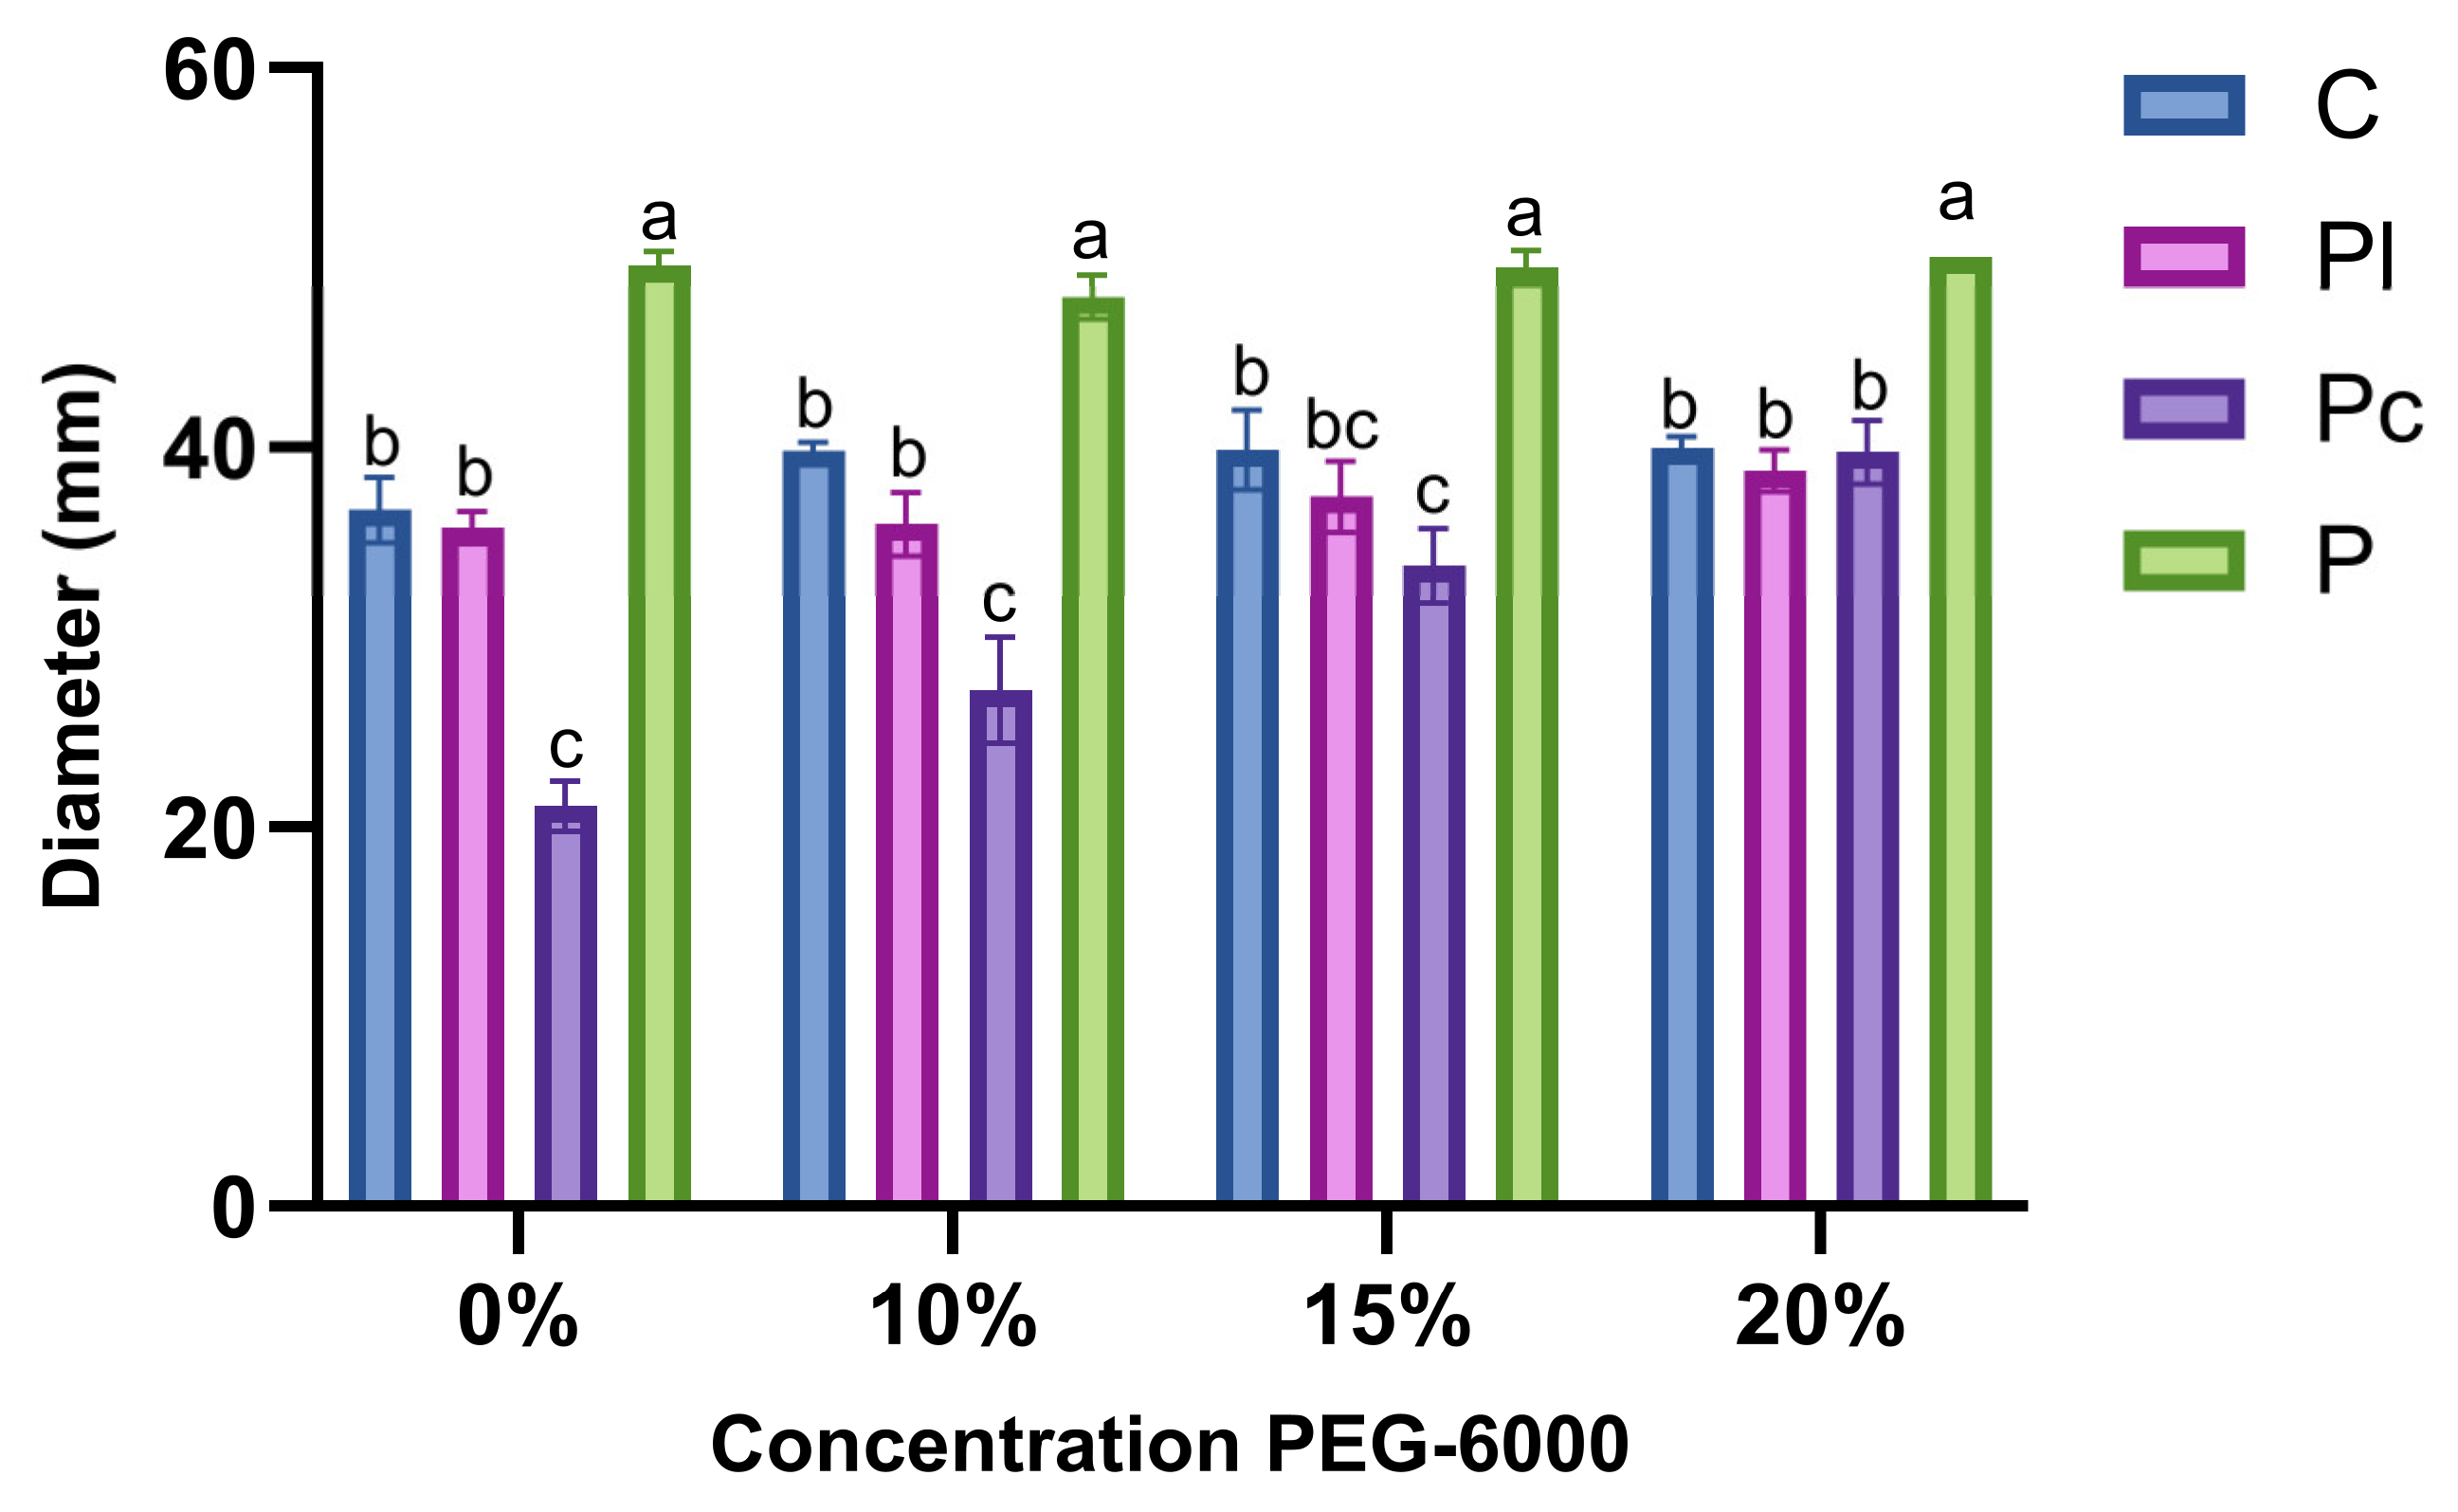
In the solid-medium assay, colony diameter differed among fungal isolates and PEG-6000 concentrations (Figure 1). After 30 days of incubation, Pochonia sp. consistently exhibited the greatest colony diameter at all evaluated PEG-6000 concentrations. In the absence of PEG-6000 and at 10%, Pochonia chlamydosporia showed significantly lower colony diameters than the other fungal isolates. At 15% PEG-6000, P. chlamydosporia exhibited a significantly smaller colony diameter than Cadophora sp. and Pochonia sp., whereas its growth did not differ significantly from that of Phialophora livistonae. At the highest PEG-6000 concentration (20%), Cadophora sp., P. livistonae, and P. chlamydosporia showed statistically similar colony diameters, all significantly lower than that of Pochonia sp.
Figure 1.
Colony diameter of four fungal isolates (Cadophora sp., Phialophora livistonae, Pochonia chlamydosporia, and Pochonia sp.) after 30 days of incubation under different PEG-6000 concentrations. Bars represent means ± standard error (n = 3). Different letters indicate significant differences among fungal isolates within each PEG-6000 concentration according to Tukey’s HSD test (p < 0.05).
The relative colony growth analysis revealed distinct responses among fungal isolates exposed to PEG-6000 (Table S1). Pochonia sp. maintained relatively stable colony growth across all concentrations, with values ranging from 96.7% to 100.9% of its control. Similarly, Cadophora sp. and Phialophora livistonae maintained relative colony diameters ranging from 108.5% to 108.9% and from 100.5% to 108.5%, respectively, under PEG-6000 treatments. In contrast, P. chlamydosporia exhibited an increase in relative colony diameter, reaching 188.2% at 20% PEG-6000. However, this response should be interpreted cautiously because the PEG-6000 overlay procedure may have influenced fungal growth independently of osmotic stress tolerance.
Two-way ANOVA revealed a significant interaction between fungal isolate and PEG-6000 concentration (F (9,32) = 18.02, p < 0.001), indicating that the effect of PEG-6000 on colony diameter depended on the fungal isolate. Tukey’s HSD test was subsequently used to compare fungal isolates within each PEG-6000 concentration (Figure 1).
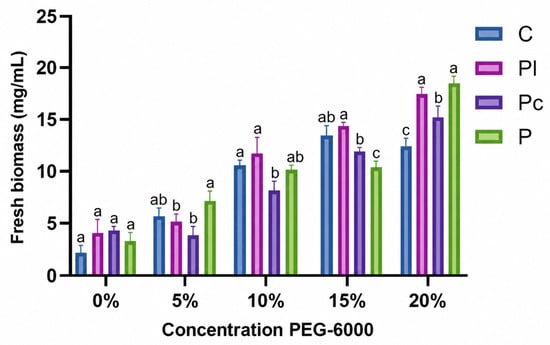
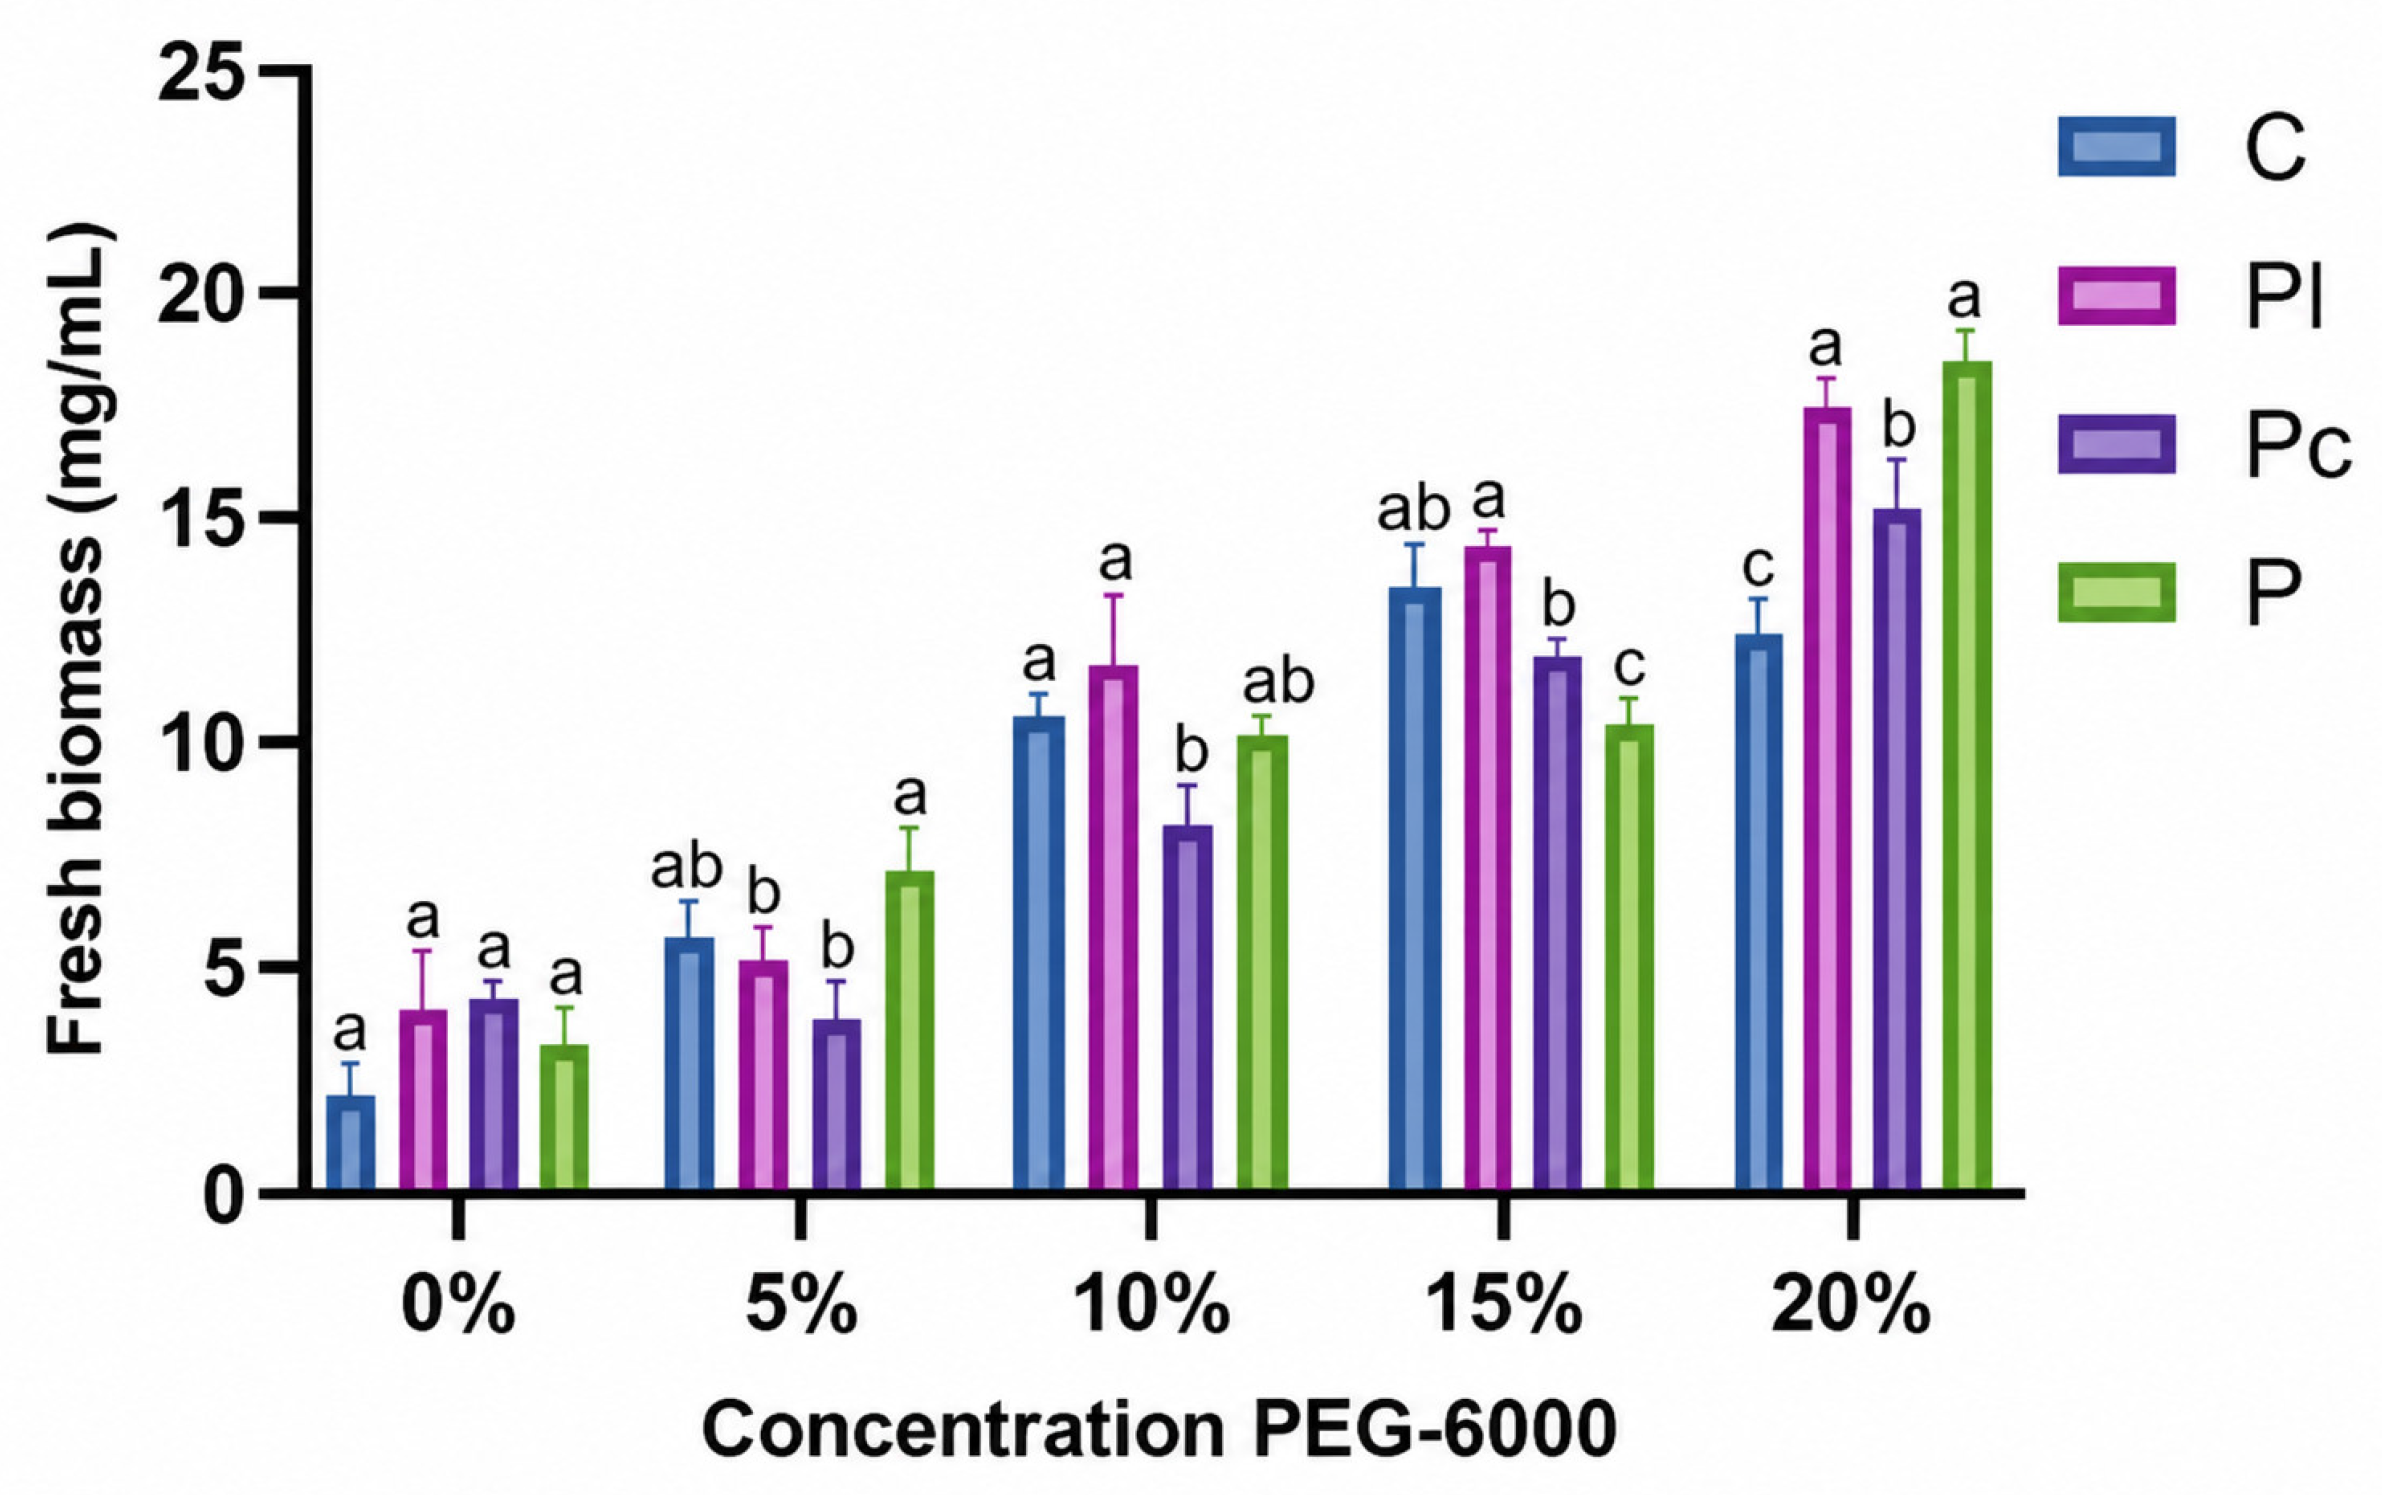
In liquid medium, fresh fungal biomass production varied among isolates depending on PEG-6000 concentration (Figure 2). In the absence of PEG-6000, no significant differences in biomass production were observed among the four fungal isolates. At 5% PEG-6000, Pochonia sp. produced significantly greater biomass than Phialophora livistonae and Pochonia chlamydosporia, whereas its biomass did not differ significantly from that of Cadophora sp. At 10% PEG-6000, P. livistonae and Cadophora sp. produced significantly greater biomass than P. chlamydosporia, whereas Pochonia sp. exhibited an intermediate value that did not differ significantly from the other isolates. At 15% PEG-6000, P. livistonae produced significantly greater biomass than P. chlamydosporia and Pochonia sp., whereas Cadophora sp. exhibited an intermediate response, with no significant differences from P. livistonae or P. chlamydosporia. At the highest PEG-6000 concentration (20%), P. livistonae and Pochonia sp. produced the greatest biomass, with no significant differences between them, followed by P. chlamydosporia, whereas Cadophora sp. exhibited the lowest biomass production.
Figure 2.
Biomass of the different strains at different PEG-6000 concentrations after 7 days of incubation. C: Cadophora sp.; Pl: Phialophora livistonae; Pc: Pochonia chlamydosporia; P: Pochonia sp. Bars represent means ± standard error (n = 3). Different letters indicate significant differences among fungal isolates within each PEG-6000 concentration according to Tukey’s HSD test (p < 0.05).
3.3. Effects of Endophytic Fungi and Water Availability on Tomato Seedling Growth and Biomass
Water availability significantly affected several growth and biomass parameters of tomato seedlings, whereas the effects of fungal inoculation varied depending on the evaluated variable (Table 3; Supplementary Table S2). Two-way ANOVA revealed significant effects of irrigation level on stem diameter (p < 0.0001), plant height (p < 0.0001), number of leaves (p = 0.0014), root length (p < 0.0001), fresh root weight (p = 0.0246), fresh shoot weight (p < 0.0001), and dry shoot weight (p < 0.0001). In contrast, irrigation level did not significantly affect root dry weight (p = 0.0543). Fungal inoculation had significant main effects on fresh root weight (p = 0.0065) and root dry weight (p = 0.0214), while significant inoculation × irrigation interactions were detected for stem diameter (p = 0.0436) and root length (p = 0.0486).
Table 3.
Effects of endophytic fungal inoculation and water availability on growth and biomass variables of tomato seedlings. Different lowercase letters indicate significant differences among inoculation treatments within the same irrigation level according to Tukey’s honestly significant difference (HSD) test (p < 0.05), where indicated. The effects of fungal inoculation, irrigation level, and their interaction were evaluated using two-way analysis of variance (ANOVA), with the corresponding F- and p-values presented in Supplementary Table S2.
Tukey’s HSD comparisons among inoculation treatments within each irrigation level revealed no significant differences in stem diameter, plant height, number of leaves, root length, root dry weight, fresh shoot weight, or dry shoot weight (Table 3). Under well-watered conditions (WW), none of the evaluated growth and biomass variables differed significantly among inoculation treatments.
Under mild water stress (MWS), seedlings inoculated with Phialophora livistonae exhibited significantly greater fresh root weight than uninoculated seedlings, whereas Pochonia sp. showed an intermediate response that did not differ significantly from either treatment. Under water stress (WS), no significant differences among inoculation treatments were detected for any of the evaluated variables. Although seedlings inoculated with P. livistonae and Pochonia sp. showed numerically higher shoot dry weight than uninoculated plants, these differences were not statistically significant.
Under severe water stress (SWS), P. livistonae-inoculated seedlings exhibited significantly greater fresh root weight than seedlings inoculated with Pochonia sp., while the uninoculated control showed an intermediate value without significant differences from either treatment. No significant differences among inoculation treatments were observed for the remaining growth and biomass variables.
Overall, reduced water availability was associated with lower growth and biomass values, particularly under severe water stress. However, the effects of fungal inoculation were variable-specific, and no consistent improvement in seedling growth or biomass accumulation was demonstrated across the evaluated water-availability levels.
3.4. Effects of Endophytic Fungi and Water Availability on Proline and Total Phenolic Contents
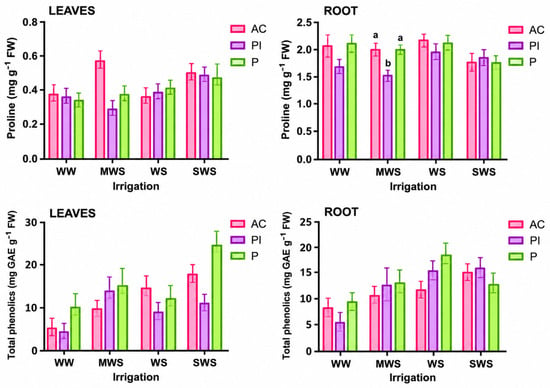
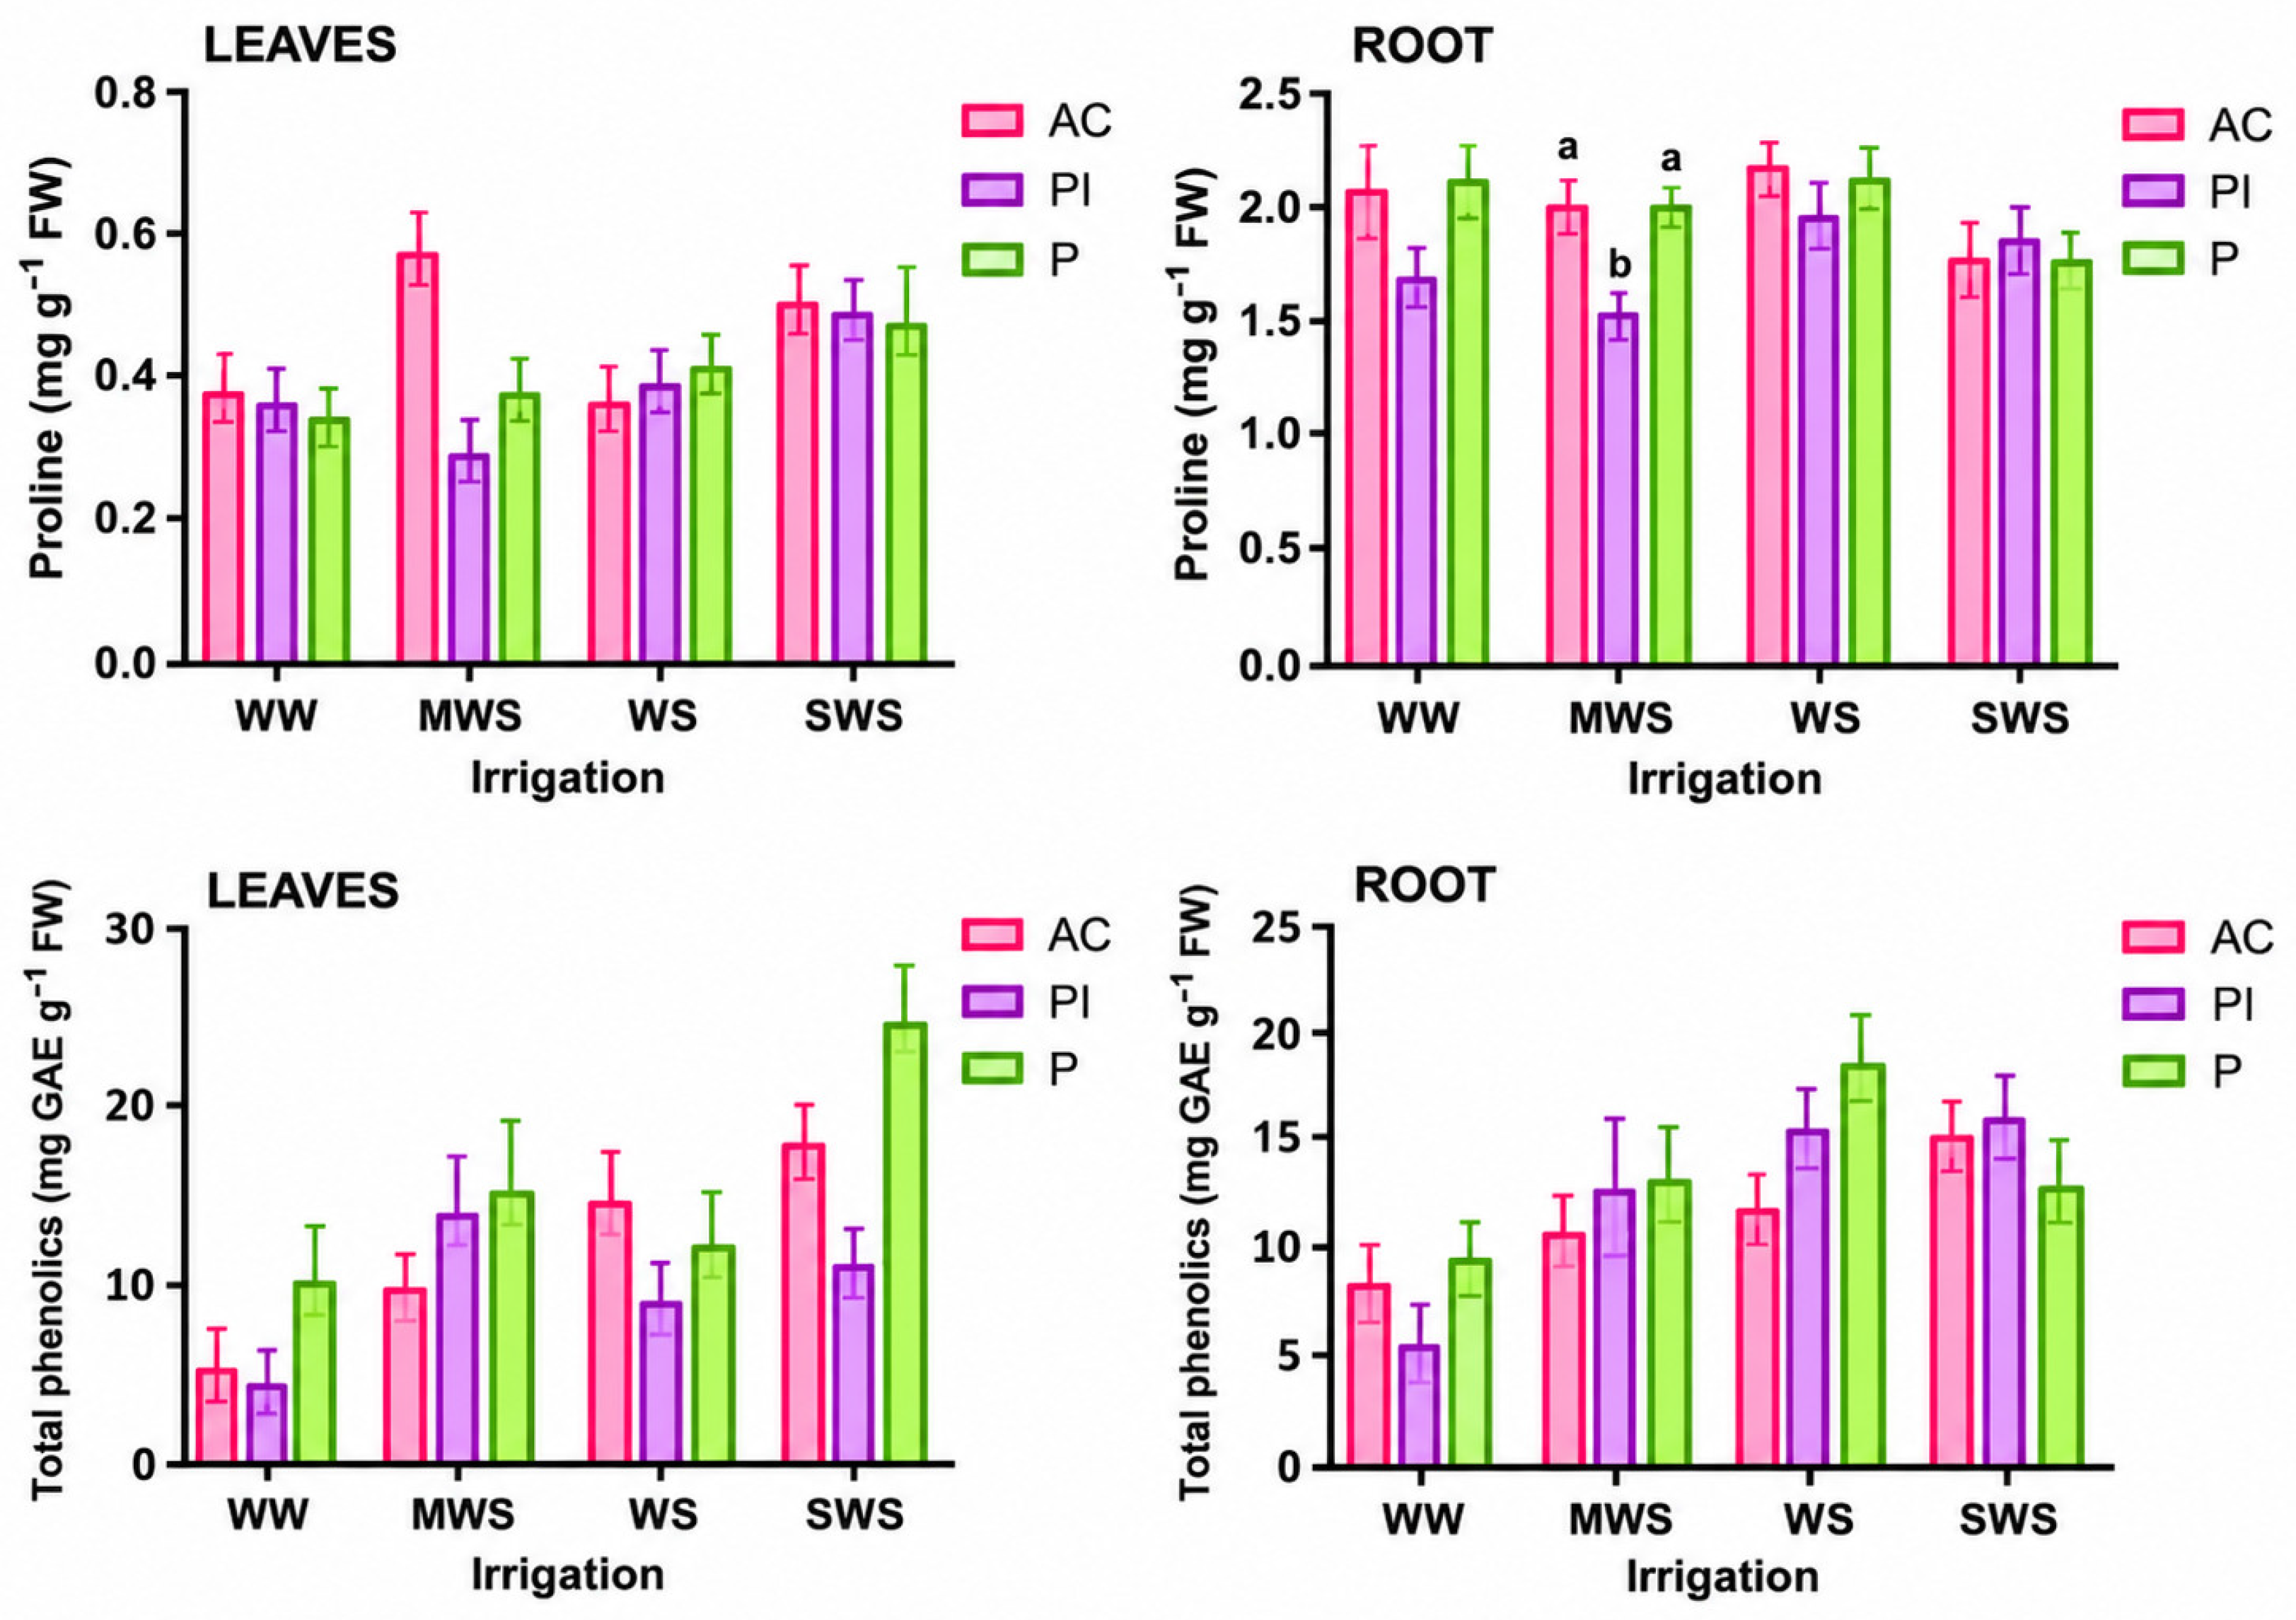
Proline accumulation and total phenolic content in tomato leaves and roots were evaluated under different levels of water availability and fungal inoculation (Figure 3; Supplementary Table S3). Two-way ANOVA revealed a significant main effect of fungal inoculation on leaf proline content (p = 0.0367), whereas irrigation level (p = 0.1386) and the inoculation × irrigation interaction (p = 0.4523) were not significant. However, Tukey’s HSD comparisons among inoculation treatments within each irrigation level revealed no significant differences in leaf proline content (Figure 3).
Figure 3.
Effects of fungal inoculation and water availability on proline content and total phenolic content in leaves (left column) and roots (right column) of tomato seedlings. Values represent means ± standard error (n = 3). Different lowercase letters indicate significant differences among inoculation treatments within the same irrigation level according to Tukey’s honestly significant difference (HSD) test (p < 0.05), where indicated. The effects of fungal inoculation, irrigation level, and their interaction were evaluated using two-way analysis of variance (ANOVA), with the corresponding F- and p-values presented in Supplementary Table S3. AC: absolute control; Pl: Phialophora livistonae; P: Pochonia sp.; WW: well-watered (100%); MWS: mild water stress (75%); WS: water stress (50%); SWS: severe water stress (25%) of substrate water-holding capacity.
In roots, proline content was significantly affected by fungal inoculation (p = 0.0013), irrigation level (p = 0.0179), and their interaction (p = 0.0038). Under mild water stress (MWS), seedlings inoculated with Phialophora livistonae exhibited significantly lower root proline content than uninoculated seedlings and those inoculated with Pochonia sp. In contrast, no significant differences among inoculation treatments were detected under well-watered conditions (WW), water stress (WS), or severe water stress (SWS).
For total phenolic content, two-way ANOVA revealed no significant effects of fungal inoculation, irrigation level, or their interaction in either leaves or roots (p > 0.05). Although numerical variations in phenolic content were observed among treatments, particularly in leaves under severe water stress, these differences were not statistically significant.
Overall, fungal inoculation significantly influenced proline accumulation, with a strain-dependent response in roots under mild water stress. In contrast, total phenolic content did not exhibit statistically significant changes attributable to fungal inoculation or water availability under the evaluated experimental conditions.
3.5. Effects of Endophytic Fungi and Water Availability on Total Protein Content and Antioxidant Enzyme Activity
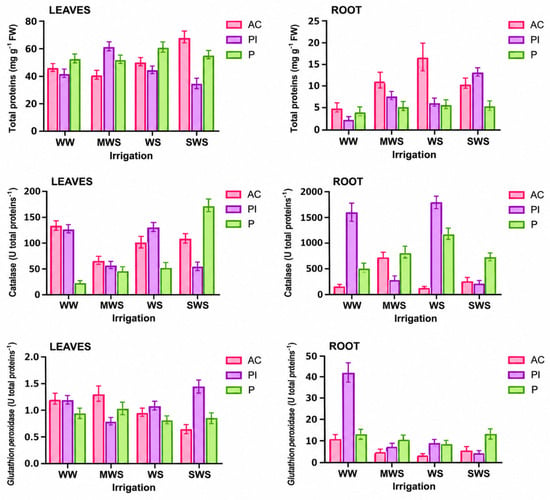
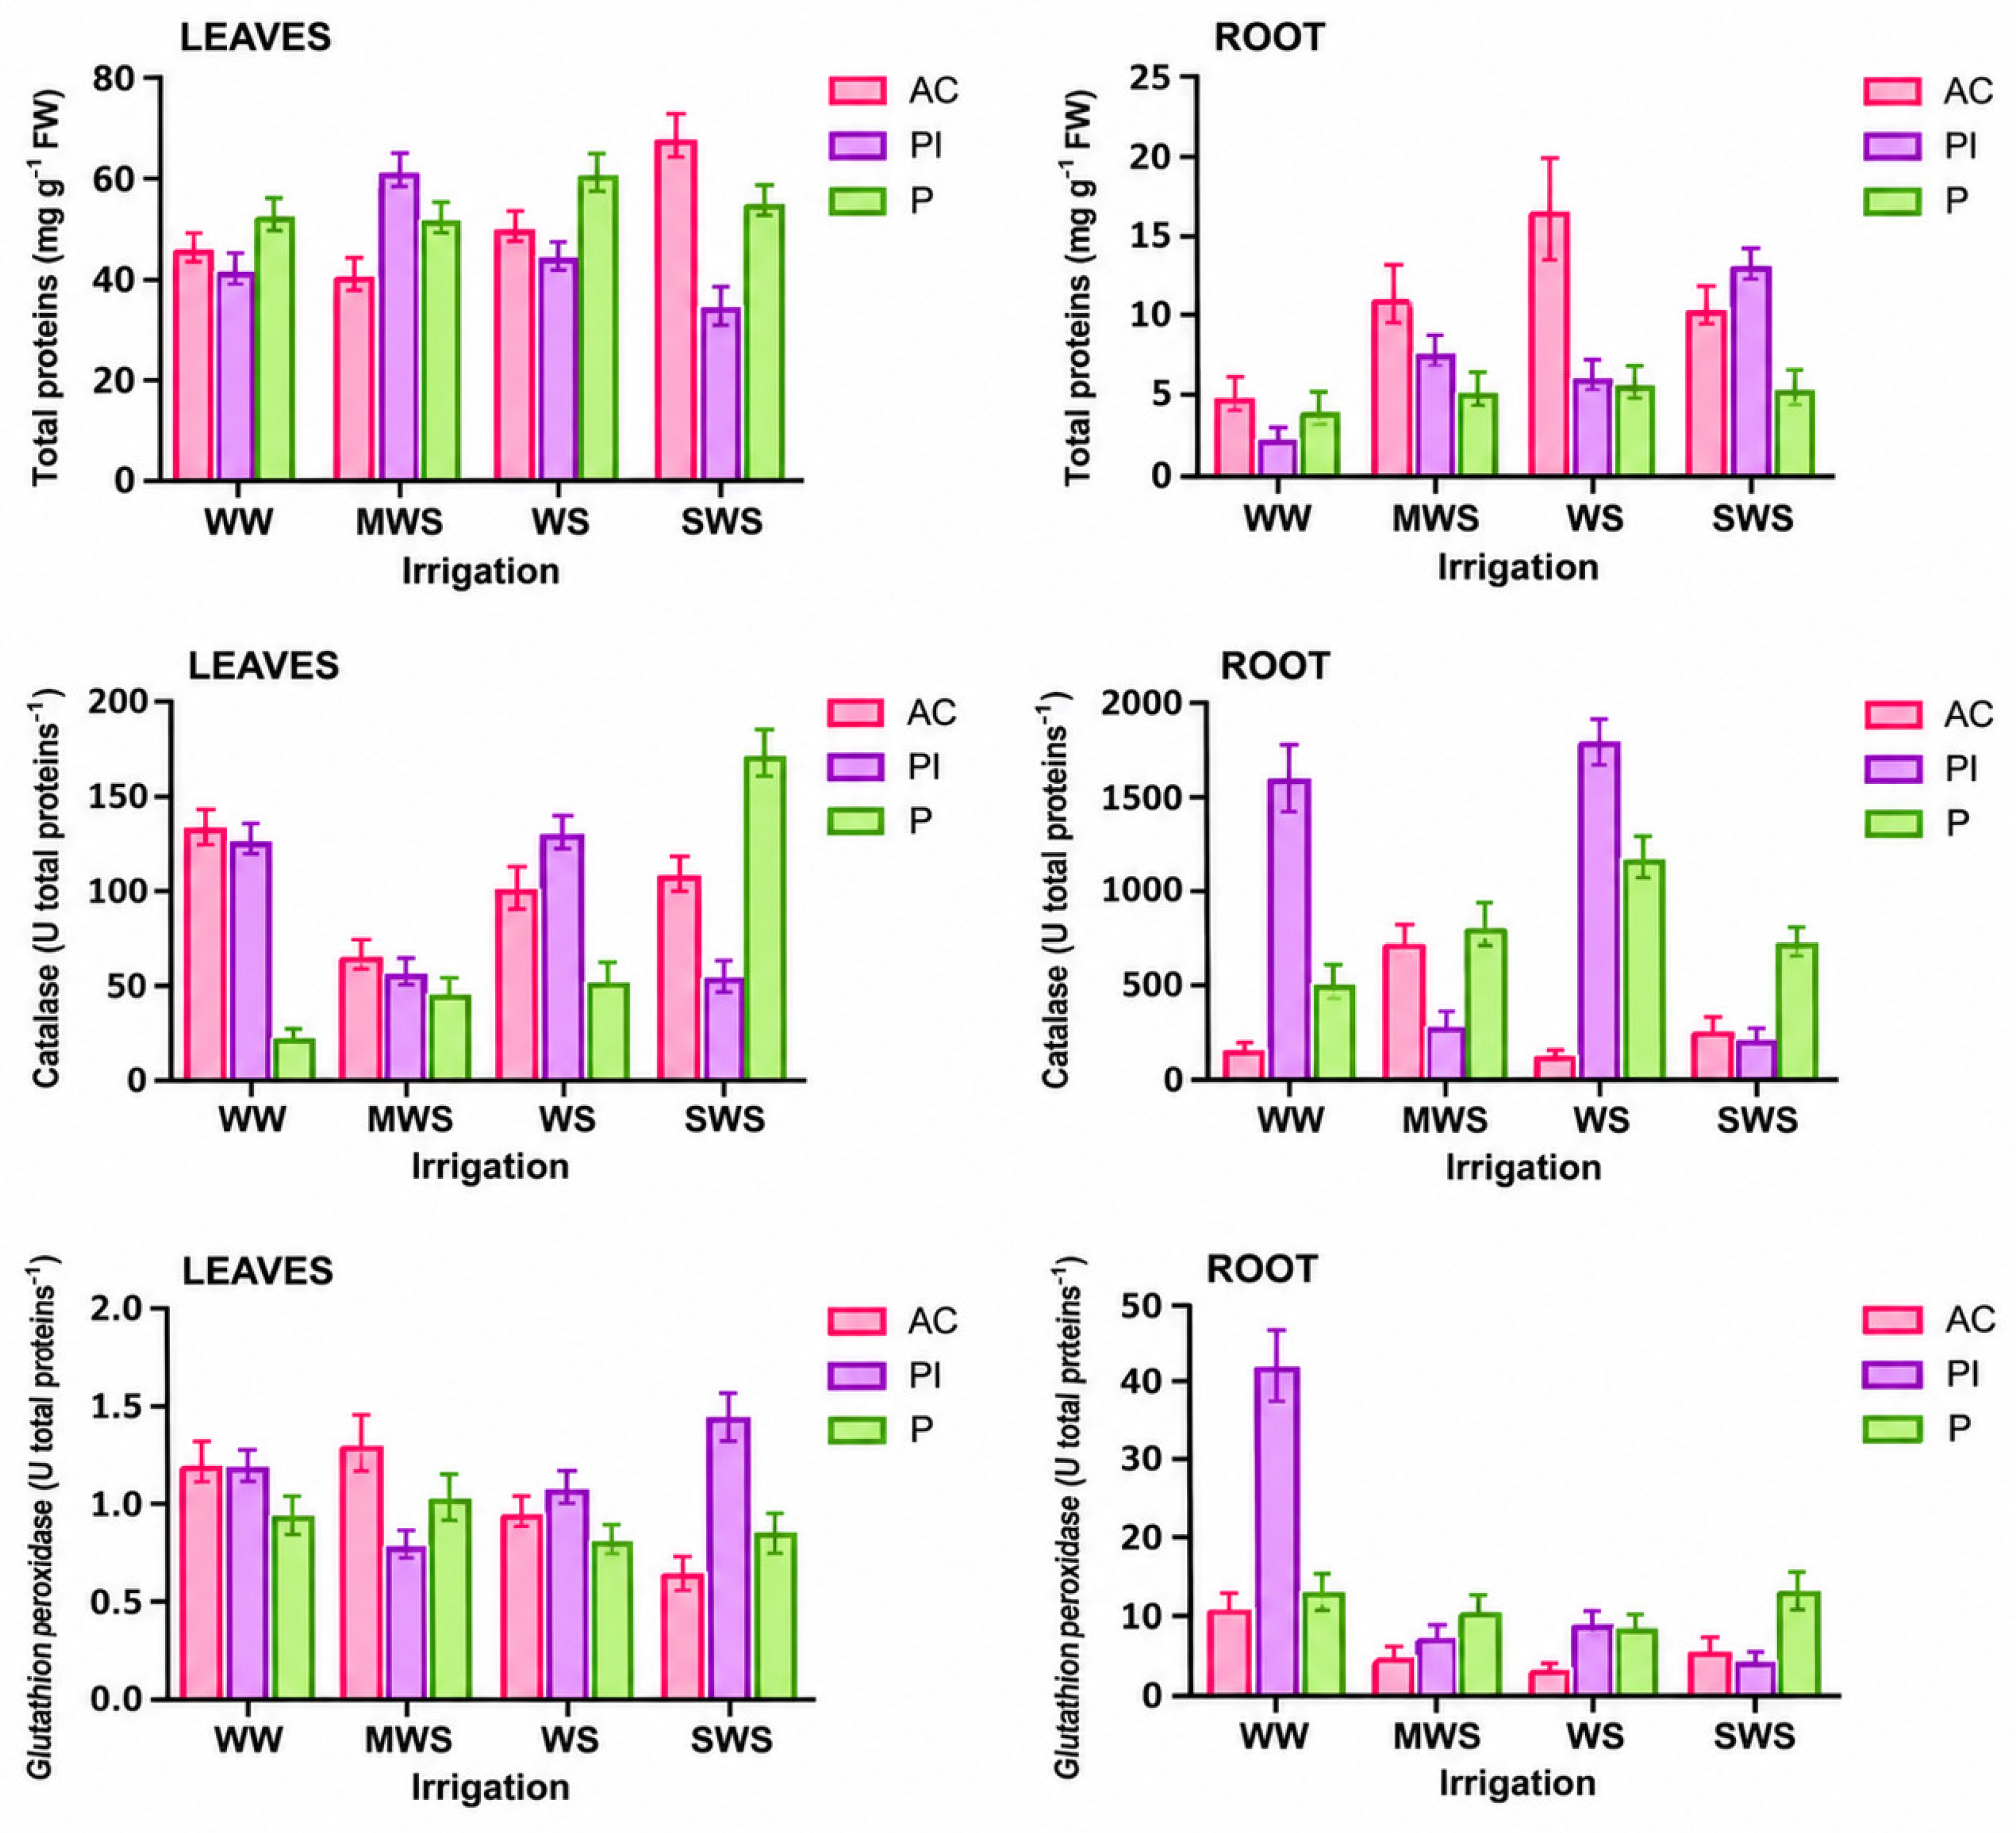
Total protein content and the activities of catalase (CAT) and glutathione peroxidase (GPX) were evaluated in tomato leaves and roots under different levels of water availability and fungal inoculation (Figure 4; Supplementary Table S3). Two-way ANOVA revealed no significant effects of fungal inoculation, irrigation level, or their interaction on leaf total protein content (p > 0.05). In contrast, root total protein content was significantly affected by irrigation level (p = 0.0106), whereas fungal inoculation (p = 0.1297) and the inoculation × irrigation interaction (p = 0.3183) were not significant. Although numerical differences in protein content were observed among treatments, these variations did not provide evidence of a significant inoculation effect.
Figure 4.
Effects of fungal inoculation and water availability on total protein content, catalase (CAT) activity, and glutathione peroxidase (GPX) activity in leaves (left column) and roots (right column) of tomato seedlings. Bars represent means ± standard error (n = 3). The effects of fungal inoculation, irrigation level, and their interaction were evaluated using two-way analysis of variance (ANOVA), with the corresponding F- and p-values presented in Supplementary Table S3. AC: absolute control; Pl: Phialophora livistonae; P: Pochonia sp.; WW: well-watered (100%); MWS: mild water stress (75%); WS: water stress (50%); SWS: severe water stress (25%) of substrate water-holding capacity.
For CAT activity, no significant main effects of fungal inoculation (p = 0.9352), irrigation level (p = 0.5648), or their interaction (p = 0.6185) were detected in leaves. In roots, however, CAT activity was significantly affected by irrigation level (p = 0.0059) and the inoculation × irrigation interaction (p = 0.0027), whereas the main effect of fungal inoculation was not significant (p = 0.1097). The interaction indicates that the response of root CAT activity to fungal inoculation depended on water availability. Numerically, seedlings inoculated with Phialophora livistonae exhibited higher root CAT activity under well-watered conditions (WW) and water stress (WS), whereas Pochonia sp. showed higher values under severe water stress (SWS). However, these differences should be interpreted cautiously because the corresponding pairwise comparisons were not indicated in the figure.
Regarding GPX activity, no significant effects of fungal inoculation, irrigation level, or their interaction were observed in leaves (p > 0.05). In roots, irrigation level significantly affected GPX activity (p = 0.0054), whereas fungal inoculation (p = 0.8140) and the inoculation × irrigation interaction (p = 0.1880) were not significant. Although numerical differences among treatments were observed, particularly under well-watered conditions, these variations did not demonstrate a significant inoculation effect.
Overall, the results indicate that water availability influenced root protein content and antioxidant enzyme activities, while the effect of fungal inoculation on CAT activity in roots depended on irrigation level. In contrast, no statistically significant responses to the evaluated factors were detected for total protein content or CAT and GPX activities in leaves.
3.6. Effects of Endophytic Fungi and Water Availability on the Expression of Stress-Response-Associated Genes
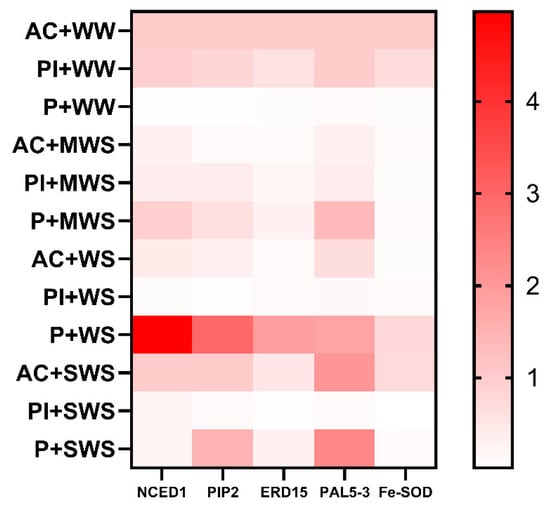
The relative expression of five stress-response-associated genes (NCED, PIP2, ERD1, PAL53, and FE-SOD) was evaluated in tomato leaves under different levels of water availability and fungal inoculation (Figure 5). Gene expression data were analyzed using a two-way ANOVA after log2 transformation of relative expression values, considering fungal inoculation, irrigation level, and their interaction as experimental factors.
Figure 5.
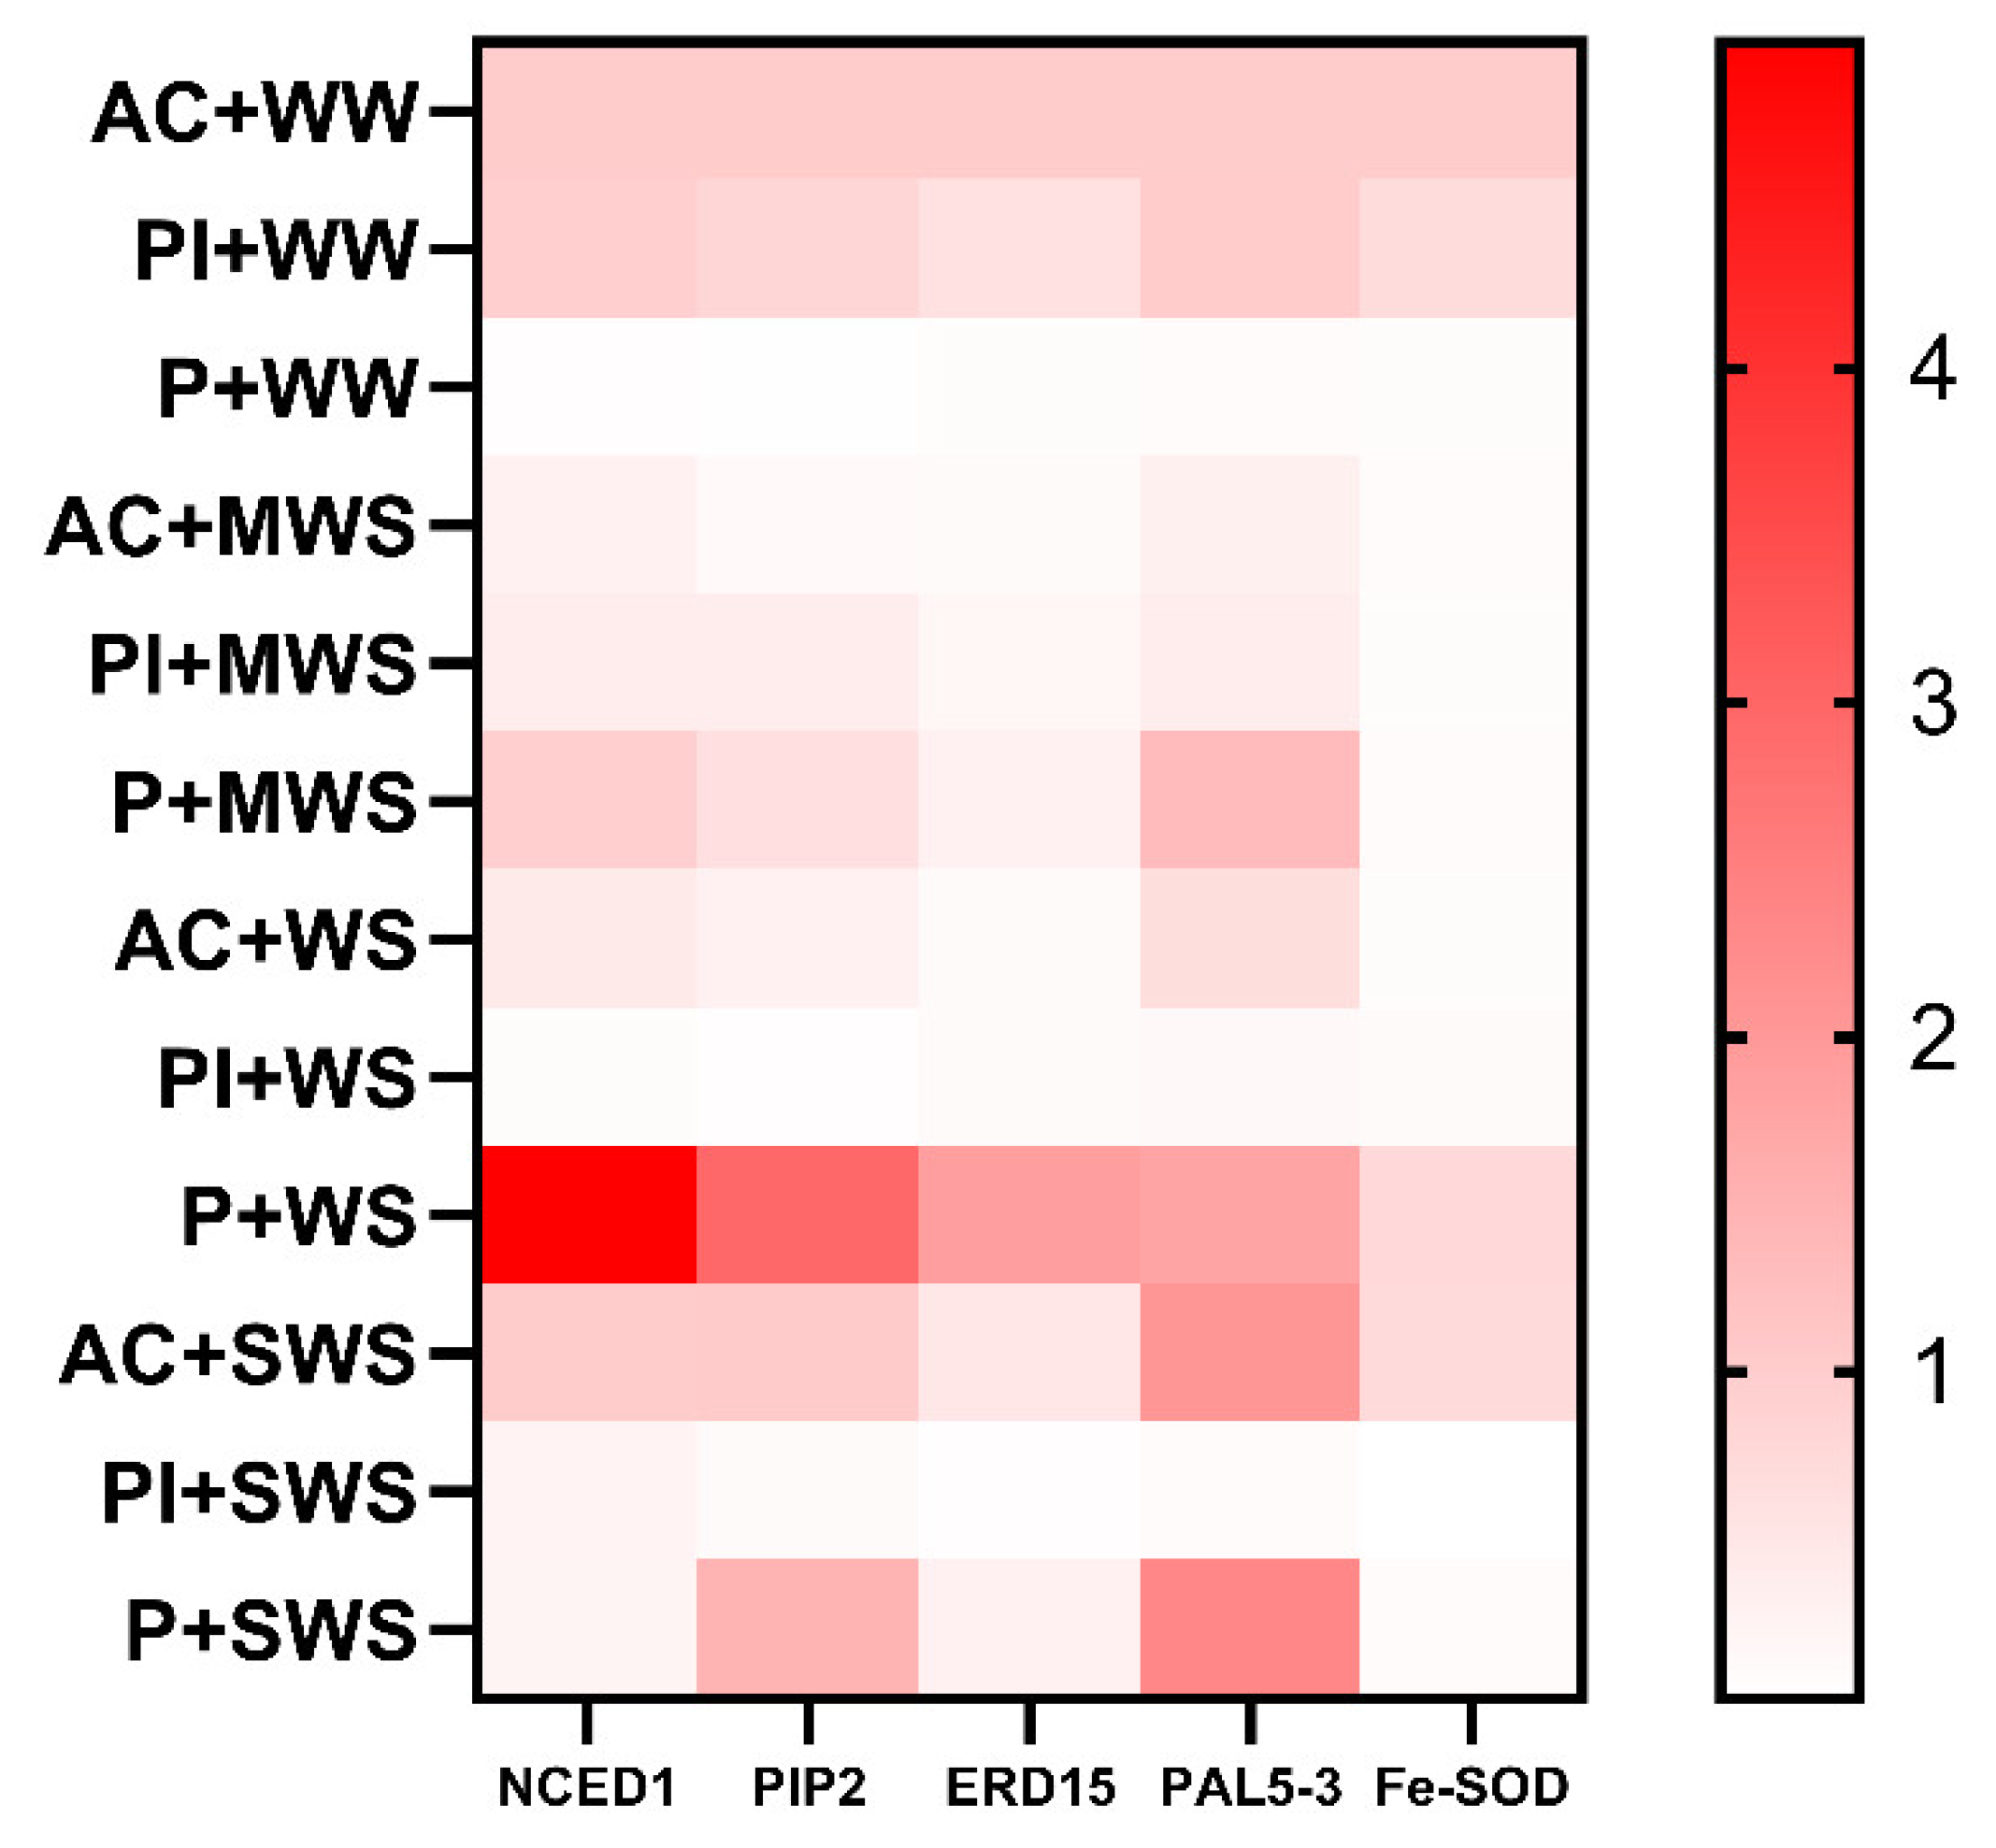
Heatmap of the relative expression of NCED1, PIP2, ERD15, PAL5-3, and Fe-SOD in leaves of tomato seedlings subjected to different water-availability levels and inoculated with endophytic fungi. Relative expression was calculated using the 2−ΔΔCt method with ACT as the reference gene. The color gradient represents relative gene expression levels, with white or pale pink indicating lower expression and progressively darker shades of red indicating higher expression. The color scale corresponds to the relative expression values shown in the color bar. AC: absolute control; Pl: Phialophora livistonae; P: Pochonia sp.; WW: well-watered; MWS: mild water stress; WS: water stress; SWS: severe water stress.
The analysis revealed no significant main effects of fungal inoculation on the expression of any of the five evaluated genes (p > 0.05). Similarly, the interaction between fungal inoculation and irrigation level was not statistically significant for any gene (p > 0.05), indicating that the analysis did not detect a significant inoculation-dependent response across irrigation conditions.
Regarding water availability, irrigation level significantly affected FE-SOD expression (p = 0.0356). In contrast, no significant irrigation effects were detected for NCED (p = 0.7314), PIP2 (p = 0.5827), ERD1 (p = 0.2109), or PAL53 (p = 0.6118). These findings suggest that FE-SOD expression was responsive to changes in water availability, independently of the overall effect of fungal inoculation.
To further examine potential strain-specific responses, planned contrasts were performed to compare seedlings inoculated with Phialophora livistonae or Pochonia sp. against uninoculated seedlings within each irrigation level. Although several numerical differences in relative gene expression were observed, none of the 40 planned comparisons remained statistically significant after Holm’s adjustment for multiple testing (adjusted p > 0.05).
Among the largest numerical differences, Pochonia sp. inoculation under severe water stress (SWS; 25% water availability) was associated with lower relative expression of PAL53 and FE-SOD compared with the corresponding uninoculated controls. However, these contrasts did not reach statistical significance after adjustment for multiple comparisons (PAL53: adjusted p = 0.1149; FE-SOD: adjusted p = 0.3363).
Overall, water availability significantly influenced FE-SOD expression, whereas fungal inoculation did not produce statistically detectable effects on the expression of the evaluated genes. Although strain- and irrigation-dependent numerical variations were observed, these responses should be interpreted cautiously given the biological variability among replicates and the absence of significant inoculation effects or interactions.
4. Discussion
The present study revealed differences among fungal isolates in their growth responses to PEG-6000 and showed that fungal inoculation and water availability were associated with selected morphological and biochemical responses in tomato seedlings. However, the statistical analyses do not support a generalized enhancement of growth, antioxidant protection, or stress-responsive gene expression by the inoculated fungi. Instead, the detectable inoculation-related effects were restricted to particular root traits and proline responses, while irrigation level explained much of the variation in plant growth and several root biochemical variables. These findings refine the original hypothesis by indicating that fungal responses are trait-specific and do not necessarily translate into broad improvements in water-deficit tolerance [12,33].
In the solid-medium assay, Pochonia sp. exhibited the greatest colony diameter at all evaluated PEG-6000 concentrations, and the significant isolate × PEG-6000 interaction indicates that colony-growth responses depended on fungal identity. Relative growth was comparatively stable for Pochonia sp., whereas P. chlamydosporia showed a marked increase relative to its untreated control. In liquid medium, Pochonia sp. and Phialophora livistonae had the highest fresh biomass at 20% PEG-6000. Previous studies have documented isolate-dependent responses of P. chlamydosporia to reduced osmotic or matric potential. Nevertheless, these assays should not be interpreted as proof of tolerance to defined water potentials: osmotic potentials were nominal rather than measured, the PEG overlay may have affected solid-medium properties, and fresh biomass reflects tissue water content as well as fungal growth. Thus, the results support the selection of the two isolates for further testing, but not a prediction of their efficacy in planta [34,35]. Importantly, the experimental design did not establish a direct relationship between fungal tolerance to PEG-induced osmotic stress in vitro and the ability of these isolates to improve water-deficit tolerance in tomato seedlings. Therefore, fungal performance under PEG-6000 exposure should be considered a preliminary screening criterion rather than evidence of enhanced plant drought tolerance.
Water availability was the predominant determinant of tomato seedling growth. Irrigation significantly affected stem diameter, height, leaf number, root length, fresh root weight, and shoot fresh and dry weights, with particularly low growth and biomass under severe water restriction. Inoculation had significant overall effects on root fresh and dry weights, while inoculation × irrigation interactions were detected for stem diameter and root length. However, post hoc comparisons within irrigation levels identified a clear inoculation-related difference only for fresh root weight: under mild water stress, P. livistonae-inoculated seedlings had greater fresh root weight than uninoculated controls; under severe water stress, their fresh root weight exceeded that of Pochonia sp.-inoculated seedlings, but not that of uninoculated controls. These findings suggest a selective effect on root fresh biomass rather than consistent stimulation of whole-plant growth. Because fresh weight can also reflect tissue hydration, it cannot alone establish greater root structural biomass or improved water acquisition [33,36].
Beneficial effects of root-associated fungi on plant growth have been reported and may involve phytohormone regulation, nutrient mobilization, or changes in plant–microbe signaling. In the present experiment, however, shoot dry weight under moderate water restriction was only numerically higher in inoculated seedlings, without statistically significant differences from uninoculated controls. Likewise, no significant within-irrigation differences were detected for height, leaf number, shoot biomass, or root length. The significant interaction terms for stem diameter and root length should therefore be interpreted in the context of the absence of detectable pairwise differences at individual irrigation levels. In vitro fungal performance and the potential mechanisms described in other host systems cannot substitute for direct evidence of growth promotion or drought tolerance in tomato [14,33].
Proline accumulation showed a more specific response. Fungal inoculation had a significant main effect on leaf proline, although comparisons among inoculation treatments within individual irrigation levels were not significant. In roots, proline was affected by inoculation, irrigation, and their interaction; notably, P. livistonae-inoculated seedlings accumulated less root proline than uninoculated and Pochonia sp.-inoculated seedlings under mild water stress. Proline participates in osmotic adjustment and cellular stress responses, but its concentration also reflects synthesis, turnover, and metabolic use. Consequently, reduced root proline in this treatment cannot be equated with either improved tolerance or greater stress susceptibility. Measurements of plant water status and proline metabolism would be needed to distinguish these possibilities [3,37]. The gene-expression results also require a more restrained interpretation than the original discussion.
Contrary to the interpretation suggested by the earlier descriptive patterns, total phenolic content was not significantly affected by inoculation, irrigation, or their interaction in either leaves or roots. Although phenolic metabolites can contribute to antioxidant and defense processes, and microbial inoculation has been associated with changes in phenolic metabolism in other systems, the present results do not demonstrate fungal induction of total phenolic accumulation. Numerical differences in Figure 3 should therefore be regarded as descriptive variability rather than evidence for activation of the phenylpropanoid pathway [38,39].
The antioxidant measurements further emphasize tissue-specific responses. Leaf total protein content and CAT and GPX activities showed no significant effects of inoculation, irrigation, or their interaction. In roots, irrigation significantly affected total protein content and GPX activity, but neither variable showed a significant inoculation effect or interaction. Root CAT activity, in contrast, exhibited significant effects of irrigation and the inoculation × irrigation interaction, indicating that its response to inoculation varied with water availability. However, the current results do not establish which fungal treatment differed significantly from the corresponding uninoculated control within each irrigation level. It would therefore be premature to conclude that either isolate consistently increased CAT activity or improved antioxidant protection. Although CAT and GPX participate in reactive oxygen species metabolism, neither ROS accumulation nor oxidative injury was measured directly, precluding claims of reduced oxidative damage [40,41].
The gene-expression results also require a more restrained interpretation than the original discussion. The evaluated genes cover several aspects of plant responses to water limitation, including water transport and phenylpropanoid metabolism. Nevertheless, two-way ANOVA of log2-transformed relative expression detected no significant main effect of fungal inoculation and no inoculation × irrigation interaction for any of the five genes. Therefore, the numerical expression patterns observed in Figure 5 cannot be presented as statistically demonstrated induction or repression by Pochonia sp. or P. livistonae. This distinction is particularly important for NCED1, PIP2, ERD15, and PAL5-3, for which the irrigation main effect was also nonsignificant [42,43].
Irrigation level significantly affected Fe-SOD expression, suggesting that this component of the antioxidant-response network was sensitive to the imposed water-availability regimes. However, the significant overall irrigation effect does not establish a monotonic response to increasing water restriction, nor does it implicate fungal inoculation. Planned contrasts comparing each fungal treatment with the un-inoculated control within each irrigation level did not remain significant after Holm adjustment. Some contrasts showed large numerical fold changes, including PAL5-3 and Fe-SOD under severe water restriction, but these estimates were accompanied by substantial variability and should not be treated as confirmed treatment effects. Expression was measured at a single sampling time; transient transcriptional responses may have been missed. Furthermore, transcript abundance alone cannot establish the activity of the corresponding physiological or biochemical pathways [44,45].
Taken together, the morphological, biochemical, and molecular datasets indicate that responses to reduced irrigation were more consistent than responses to fungal inoculation. The clearest inoculation-associated observations were the increase in fresh root weight with P. livistonae under mild water stress, the reduction in root proline under the same condition, and the significant interaction affecting root CAT activity. These findings may motivate further investigation of root-localized responses, but they do not demonstrate a coordinated mechanism of improved drought tolerance. In particular, neither enhanced shoot biomass nor increased phenolic accumulation or stress-gene expression was statistically established across the water-availability treatments [33,36].
Several methodological limitations qualify these interpretations. First, although the isolates were obtained from surface-disinfected P. cembroides root segments, the effectiveness of disinfection was not independently verified using final-rinse plating or root imprints; their endophytic origin therefore remains to be conclusively established. Second, colonization of tomato roots after inoculation was not confirmed by microscopy, re-isolation, or molecular detection, so the observed associations cannot be attributed definitively to established endophytic colonization. Third, irrigation regimes represented nominal fractions of substrate water-holding capacity, with adjustment every four days and possible moisture fluctuations between events. Leaf water potential, relative water content, gas exchange, and other direct physiological indicators were not measured. Finally, the biochemical and gene-expression analyses used three independent pooled biological replicates per treatment, limiting power to resolve variable molecular responses. Future studies should verify colonization, directly quantify plant water status, increase biological replication, and sample multiple time points before proposing specific molecular mechanisms or agronomic benefits [19,46].
5. Conclusions
The four fungal isolates differed in their in vitro responses to PEG-6000, with Pochonia sp. showing the greatest colony diameter across the evaluated concentrations and both Pochonia sp. and Phialophora livistonae producing comparatively high fresh biomass at 20% PEG-6000. In tomato seedlings, water availability exerted more consistent effects on growth and biochemical responses than fungal inoculation. Although inoculation significantly affected root fresh and dry weights overall, its clearest within-irrigation effect was an increase in root fresh weight with P. livistonae relative to the uninoculated control under mild water stress. This treatment also showed lower root proline content, while root catalase activity exhibited a significant inoculation × irrigation interaction. No consistent inoculation-related increases in shoot biomass, total phenolic content, or antioxidant enzyme activities were established. Irrigation significantly influenced Fe-SOD gene expression, but fungal inoculation did not significantly affect the expression of the five evaluated genes, and no planned inoculation contrast remained significant after adjustment for multiple comparisons. Therefore, the results support selective, strain- and trait-dependent responses but do not demonstrate improved water-deficit tolerance or a defined molecular mechanism. Future studies should verify fungal colonization, measure plant water status directly, and evaluate these responses with greater biological replication and under longer-term or production conditions.
Supplementary Materials
The following supporting information can be downloaded at: https://www.mdpi.com/article/10.3390/horticulturae12111380/s1. Table S1: Relative colony growth of four fungal isolates under different PEG-6000 concentrations after 30 days of incubation; Table S2: Two-way analysis of variance (ANOVA) for the effects of fungal inoculation, irrigation level, and their interaction on morphological and growth parameters of tomato seedlings; Table S3: Two-way analysis of variance (ANOVA) for the effects of fungal inoculation, irrigation level, and their interaction on biochemical parameters in leaves and roots of tomato seedlings; Table S4. Two-way ANOVA of log2-transformed relative expression (fold change); Table S5. Planned comparisons of fungal inoculation versus uninoculated controls at each irrigation level.
Author Contributions
Conceptualization, S.G.-M. and R.C.-V.; methodology, S.G.-M. and R.C.-V.; software, M.G.V.-C.; formal analysis, F.P.-L., M.C.-D.-L.F. and C.M.-M.; investigation, M.G.V.-C. and C.M.-M.; data curation, M.G.V.-C. and J.R.V.-G.; writing—original draft preparation, M.G.V.-C.; writing—review and editing, M.G.V.-C., S.G.-M., A.B.-M., A.S.-R., R.C.-V., F.P.-L., M.C.-D.-L.F., C.M.-M. and J.R.V.-G.; All authors have read and agreed to the published version of the manuscript.
Funding
This research received no external funding.
Data Availability Statement
The original contributions presented in this study are included in the article/Supplementary Material. Further inquiries can be directed to the corresponding author.
Acknowledgments
M.G.V.-C. gratefully acknowledges the Secretaría de Ciencia, Humanidades, Tecnología e Innovación (SECIHTI) for the scholarship awarded during her Master’s studies.
Conflicts of Interest
The authors declare no conflicts of interest.
Abbreviations
The following abbreviations are used in this manuscript:
| C | Cadophora sp. |
| Pl | Phialophora livistonae |
| P | Pochonia sp. |
| Pc | Pochonia chlamydosporia |
| AC | Absolute control |
| WW | Well-watered |
| MWS | Mild water stress |
| WS | Water stress |
| SWS | Severe water stress |
| PEG | Polyethylene glycol |
| CAT | Catalase |
| GPX | Glutathione peroxidase |
| ACT | Actin |
| NCED1 | 9-cis-epoxycarotenoid dioxygenase 1 |
| PIP2 | Plasma membrane intrinsic protein 2 (aquaporin) |
| ERD15 | Early Responsive to Dehydration 15 |
| PAL5-3 | Phenylalanine ammonia-lyase |
| Fe-SOD | Iron-dependent superoxide dismutase |
References
- Rawat, A.; Kumar, D.; Khati, B.S. A Review on Climate Change Impacts, Models, and Its Consequences on Different Sectors: A Systematic Approach. J. Water Clim. Change 2023, 15, 104–126. [Google Scholar] [CrossRef] [Scilit]
- Asif, Z.; Chen, Z.; Sadiq, R.; Zhu, Y. Climate Change Impacts on Water Resources and Sustainable Water Management Strategies in North America. Water Resour. Manag. 2023, 37, 2771–2786. [Google Scholar] [CrossRef] [Scilit]
- Haghpanah, M.; Hashemipetroudi, S.; Arzani, A.; Araniti, F. Drought Tolerance in Plants: Physiological and Molecular Responses. Plants 2024, 13, 2962. [Google Scholar] [CrossRef] [Scilit] [PubMed]
- Song, F.; Yang, Q.; Huang, J.; Guo, Z.; Li, Y.; Deng, W. Plant Drought Stress: Physiological, Biochemical and Molecular Mechanisms. Plant Stress 2026, 19, 101153. [Google Scholar] [CrossRef] [Scilit]
- Food and Agriculture Organization of the United Nations (FAO). FAOSTAT: Crops and Livestock Products; FAO: Rome, Italy, 2025; Available online: https://www.fao.org/faostat/en/#data/QCL (accessed on 20 November 2025).
- Li, J.; Liu, F.; Wu, Y.; Tang, Z.; Zhang, D.; Lyu, J.; Khan, K.S.; Xiao, X.; Yu, J. Evaluation of Nutritional Composition, Biochemical, and Quality Attributes of Different Varieties of Tomato (Solanum lycopersicum L.). J. Food Compos. Anal. 2024, 132, 106384. [Google Scholar] [CrossRef] [Scilit]
- Xie, G.; Xu, R.; Chong, L.; Zhu, Y. Understanding Drought Stress Response Mechanisms in Tomato. Veg. Res. 2023, 4, e001. [Google Scholar] [CrossRef] [Scilit]
- Petrović, I.; Savić, S.; Gricourt, J.; Causse, M.; Jovanović, Z.; Stikić, R. Effect of Long-Term Drought on Tomato Leaves: The Impact on Metabolic and Antioxidative Response. Physiol. Mol. Biol. Plants 2021, 27, 2805–2817. [Google Scholar] [CrossRef] [Scilit] [PubMed]
- Lü, Z.-W.; Liu, H.-Y.; Wang, C.-L.; Chen, X.; Huang, Y.-X.; Zhang, M.-M.; Huang, Q.-L.; Zhang, G.-F. Isolation of Endophytic Fungi from Cotoneaster multiflorus and Screening of Drought-Tolerant Fungi and Evaluation of Their Growth-Promoting Effects. Front. Microbiol. 2023, 14, 1267404. [Google Scholar] [CrossRef] [Scilit] [PubMed]
- Malarvizhi, K.; Murali, T.S.; Kumaresan, V. Fungal Endophytes of Crop Plants: Diversity, Stress Tolerance and Biocontrol Potential. Egypt. J. Biol. Pest Control 2023, 33, 67. [Google Scholar] [CrossRef] [Scilit]
- Omomowo, I.O.; Amao, J.A.; Abubakar, A.; Ogundola, A.F.; Ezediuno, L.O.; Bamigboye, C.O. A Review on the Trends of Endophytic Fungi Bioactivities. Sci. Afr. 2023, 20, e01594. [Google Scholar] [CrossRef] [Scilit]
- Nombamba, A.; Fadiji, A.; Babalola, O. Exploring the Role of Endophytic Fungi in the Amelioration of Drought Stress in Plants. Plant Prot. Sci. 2024, 60, 213–228. [Google Scholar] [CrossRef] [Scilit]
- Morales-Vargas, A.T.; López-Ramírez, V.; Álvarez-Mejía, C.; Vázquez-Martínez, J. Endophytic Fungi for Crops Adaptation to Abiotic Stresses. Microorganisms 2024, 12, 1357. [Google Scholar] [CrossRef] [Scilit] [PubMed]
- Dallemole-Giaretta, R.; de Freitas, L.G.; Lopes, E.A.; da Silva, M.D.C.S.; Kasuya, M.C.M.; Ferraz, S. Pochonia chlamydosporia Promotes the Growth of Tomato and Lettuce Plants. Acta Sci. Agron. 2015, 37, 417–423. [Google Scholar] [CrossRef] [Scilit]
- Jiménez-Pérez, O.; Espinosa-Palomeque, B.; Gil Ceballos-Ceballos, A.; Castillo-Reyes, F.; Gallegos-Morales, G. Pochonia chlamydosporia Var. Chlamydosporia Sobre Huevos de Meloidogyne Incognita de Escuinapa, Sinaloa. Rev. Mex. Fitopatol. 2026, 44, 99. [Google Scholar] [CrossRef] [Scilit]
- Hernández Socorro, M.A.; Arévalo Ortega, J.; Marrero Roque, D.; Hidalgo Diaz, L. Short Communication Effect of Klamic® on Growth Stimulation of Plantains and Bananas Vitroplants. Cultiv. Trop. 2016, 27, 168–172. [Google Scholar] [CrossRef]
- Khastini, R.O.; Ogawara, T.; Sato, Y.; Narisawa, K. Control of Fusarium Wilt in Melon by the Fungal Endophyte, Cadophora sp. Eur. J. Plant Pathol. 2014, 139, 339–348. [Google Scholar] [CrossRef] [Scilit]
- Berthelot, C.; Leyval, C.; Foulon, J.; Chalot, M.; Blaudez, D. Plant Growth Promotion, Metabolite Production and Metal Tolerance of Dark Septate Endophytes Isolated from Metal-Polluted Poplar Phytomanagement Sites. FEMS Microbiol. Ecol. 2016, 92, fiw144. [Google Scholar] [CrossRef] [Scilit]
- Liao, C.; Doilom, M.; Jeewon, R.; Hyde, K.D.; Manawasinghe, I.S.; Chethana, K.T.; Balasuriya, A.; Thakshila, S.A.D.; Luo, M.; Mapook, A.; et al. Challenges and Update on Fungal Endophytes: Classification, Definition, Diversity, Ecology, Evolution and Functions. Fungal Divers. 2025, 131, 301–367. [Google Scholar] [CrossRef] [Scilit]
- Christian, N.; Perlin, M.H. Plant-Endophyte Communication: Scaling from Molecular Mechanisms to Ecological Outcomes. Mycologia 2024, 116, 227–250. [Google Scholar] [CrossRef] [Scilit] [PubMed]
- Vergara, C.; Araujo, K.E.C.; Urquiaga, S.; Schultz, N.; Balieiro, F.D.C.; Medeiros, P.S.; Santos, L.A.; Xavier, G.R.; Zilli, J.E. Dark Septate Endophytic Fungi Help Tomato to Acquire Nutrients from Ground Plant Material. Front. Microbiol. 2017, 8, 2437. [Google Scholar] [CrossRef] [Scilit] [PubMed]
- Tedersoo, L.; Mikryukov, V.; Anslan, S.; Bahram, M.; Khalid, A.N.; Corrales, A.; Agan, A.; Vasco-Palacios, A.-M.; Saitta, A.; Antonelli, A.; et al. The Global Soil Mycobiome Consortium Dataset for Boosting Fungal Diversity Research. Fungal Divers. 2021, 111, 573–588. [Google Scholar] [CrossRef] [Scilit]
- White, T.J.; Bruns, T.D.; Lee, S.B.; Taylor, J.W. Amplification and direct sequencing of fungal ribosomal RNA genes for phylogenetics. In PCR Protocols: A Guide to Methods and Applications; Innis, M.A., Gelfand, D.H., Sninsky, J.J., White, T.J., Eds.; Academic Press: San Diego, CA, USA, 1990; pp. 315–322. [Google Scholar]
- Assad, R.; Reshi, Z.-A.; Rashid, I. Root-associated ectomycorrhizal mycobionts as forest biofertilizers: Standardized molecular methods for characterization of ectomycorrhizal wood wide web. In Microbiota and Biofertilizers: A Sustainable Continuum for Plant and Soil Health; Springer International Publishing: Cham, Switzerland, 2020; pp. 165–180. [Google Scholar]
- Sayers, E.W.; Cavanaugh, M.; Clark, K.; Ostell, J.; Pruitt, K.D.; Karsch-Mizrachi, I. GenBank. Nucleic Acids Res. 2020, 48, D84–D86. [Google Scholar] [CrossRef] [Scilit] [PubMed]
- Singleton, V.L.; Orthofer, R.; Lamuela-Raventós, R.M. [14] Analysis of Total Phenols and Other Oxidation Substrates and Antioxidants by Means of Folin-Ciocalteu Reagent. Methods Enzymol. 1999, 299, 152–178. [Google Scholar] [CrossRef] [Scilit]
- Carillo, P.; Gibon, Y. PROTOCOL: Extraction and Determination of Proline. PrometheusWiki 2011, 2011, 1–5. [Google Scholar]
- Kruger, N.J. The Bradford Method For Protein Quantitation. In The Protein Protocols Handbook; Walker, J.M., Ed.; Humana Press: Totowa, NJ, USA, 2009; pp. 17–24. [Google Scholar] [CrossRef] [Scilit]
- Dhindsa, R.S.; Plumb-Dhindsa, P.; Thorpe, T.A. Leaf Senescence: Correlated with Increased Levels of Membrane Permeability and Lipid Peroxidation, and Decreased Levels of Superoxide Dismutase and Catalase. J. Exp. Bot. 1981, 32, 93–101. [Google Scholar] [CrossRef] [Scilit]
- Flohé, L.; Günzler, W.A. [12] Assays of Glutathione Peroxidase. Methods Enzymol. 1984, 105, 114–120. [Google Scholar] [CrossRef] [Scilit] [PubMed]
- Xue, T.; Hartikainen, H.; Piironen, V. Antioxidative and Growth-Promoting Effect of Selenium on Senescing Lettuce. Plant Soil 2001, 237, 55–61. [Google Scholar] [CrossRef] [Scilit]
- R Core Team. R: A Language and Environment for Statistical Computing; R Foundation for Statistical Computing: Vienna, Austria, 2026. [Google Scholar] [CrossRef] [Scilit]
- Miranda, V.; Silva-Castro, G.A.; Ruiz-Lozano, J.M.; Fracchia, S.; García-Romera, I. Fungal Endophytes Enhance Wheat and Tomato Drought Tolerance in Terms of Plant Growth and Biochemical Parameters. J. Fungi 2023, 9, 384. [Google Scholar] [CrossRef] [Scilit] [PubMed]
- Esteves, I.; Peteira, B.; Powers, S.; Magan, N.; Kerry, B.R. Effects of Osmotic and Matric Potential on Radial Growth and Accumulation of Endogenous Reserves in Three Isolates of Pochonia chlamydosporia. Biocontrol Sci. Technol. 2009, 19, 185–199. [Google Scholar] [CrossRef] [Scilit]
- Vieira dos Santos, M.C.; Esteves, I.; Abrantes, I. In Vitro Water Stress Bioassays with the Nematophagous Fungus Pochonia chlamydosporia: Effects on Growth and Parasitism. Biol. Control 2012, 63, 310–319. [Google Scholar] [CrossRef] [Scilit]
- González-Teuber, M.; Urzúa, A.; Plaza, P.; Bascuñán-Godoy, L. Effects of Root Endophytic Fungi on Response of Chenopodium quinoa to Drought Stress. Plant Ecol. 2018, 219, 231–240. [Google Scholar] [CrossRef] [Scilit]
- Liang, S.; Zou, Y.; Shu, B.; Wu, Q. Arbuscular Mycorrhizal Fungi and Endophytic Fungi Differentially Modulate Polyamines or Proline of Peach in Response to Soil Flooding. Pedosphere 2024, 34, 460–472, Erratum in Pedosphere 2024, in press. [Google Scholar] [CrossRef] [Scilit]
- Wagay, N.A.; Rafiq, S.; Khan, A.; Kaloo, Z.A.; Malik, A.R.; Pulate, P. V Impact of Phenolics on Drought Stress and Expression of Phenylpropanoid Pathway Genes. In Plant Phenolics in Abiotic Stress Management; Lone, R., Khan, S., Mohammed Al-Sadi, A., Eds.; Springer Nature: Singapore, 2023; pp. 265–285. [Google Scholar] [CrossRef] [Scilit]
- Jia, Y.; Xie, Q.; Tao, J.; Chen, Y.; Qi, Y.; Zhu, H.; Bu, T.; Zhang, X.; Xiao, Y.; Chen, Z.; et al. Endophytic Fungi Enhance Drought Tolerance in Fagopyrum tataricum: Insights into Flavonoid Biosynthesis and Photosynthetic Pathways. Agric. Water Manag. 2025, 313, 109496. [Google Scholar] [CrossRef] [Scilit]
- Seema, N.; Hamayun, M.; Hussain, A.; Shah, M.; Irshad, M.; Qadir, M.; Iqbal, A.; Alrefaei, A.F.; Ali, S. Endophytic Fusarium proliferatum Reprogrammed Phytohormone Production and Antioxidant System of Oryza sativa under Drought Stress. Agronomy 2023, 13, 873. [Google Scholar] [CrossRef] [Scilit]
- Cao, J.-L.; He, W.-X.; Zou, Y.-N.; Wu, Q.-S. An Endophytic Fungus, Piriformospora indica, Enhances Drought Tolerance of Trifoliate orange by Modulating the Antioxidant Defense System and Composition of Fatty Acids. Tree Physiol. 2023, 43, 452–466. [Google Scholar] [CrossRef] [Scilit] [PubMed]
- Paluch-Lubawa, E.; Polcyn, W. Tissue-Specific Accumulation of PIP Aquaporins of a Particular Heteromeric Composition Is Part of the Maize Response to Mycorrhiza and Drought. Sci. Rep. 2024, 14, 21712. [Google Scholar] [CrossRef] [Scilit] [PubMed]
- Warpeha, K.M. Recent Advances in Seedling Research: Phenylalanine and Phenylalanine Ammonia-Lyase (PAL). In Progress in Botany Vol. 85; Lüttge, U., Cánovas, F.M., Risueño Almeida, M.C., Leuschner, C., Pretzsch, H., Eds.; Springer Nature: Cham, Switzerland, 2024; pp. 139–166. [Google Scholar] [CrossRef] [Scilit]
- Feka, M.; Chousein, B.; Tsiouri, O.; Papadopoulou, K.K. ABA and Ethylene Mediates Tomato Root Development Modulation During Endophytic Fungal Interaction. J. Fungi 2025, 11, 707. [Google Scholar] [CrossRef] [Scilit] [PubMed]
- Li, R.; Lin, S.; Yan, Y.; Chen, Y.; Wang, L.; Zhou, Y.; Tang, S.; Liu, N. Genome-Wide Identification of Superoxide Dismutase (SOD) Gene Family in Cymbidium Species and Functional Analysis of CsSODs Under Salt Stress in Cymbidium Sinense. Horticulturae 2025, 11, 95. [Google Scholar] [CrossRef] [Scilit]
- Cui, J.; Nie, F.; Zhao, Y.; Zhang, D.; Zhou, D.; Wu, J.; Qu, L.; Xiao, L.; Liu, L. A Review on Plant Endophytes in Response to Abiotic Stress. Environ. Pollut. Bioavailab. 2024, 36, 2323123. [Google Scholar] [CrossRef] [Scilit]

Disclaimer/Publisher’s Note: The statements, opinions and data contained in all publications are solely those of the individual author(s) and contributor(s) and not of MDPI and/or the editor(s). MDPI and/or the editor(s) disclaim responsibility for any injury to people or property resulting from any ideas, methods, instructions or products referred to in the content. |
© 2026 by the authors. Licensee MDPI, Basel, Switzerland. This article is an open access article distributed under the terms and conditions of the Creative Commons Attribution (CC BY) license.