
Effect of Water Content and Pectin on the Viscoelastic Improvement of Water-in-Canola Oil Emulsions


1
Department of Food and Bioproduct Sciences, College of Agriculture and Bioresources, University of Saskatchewan, Saskatoon, SK S7N 5A8, Canada
2
Escuela Superior Politécnica del Litoral, ESPOL, Facultad de Ingeniería en Mecánica y Ciencias de la Producción, Campus Gustavo Galindo, Km. 30.5 Vía Perimetral, Guayaquil 09-01-5863, Ecuador
*
Author to whom correspondence should be addressed.
Fluids 2021, 6(6), 228; https://doi.org/10.3390/fluids6060228
Submission received: 26 March 2021
/
Revised: 5 June 2021
/
Accepted: 7 June 2021
/
Published: 18 June 2021
(This article belongs to the Special Issue Fluid Mechanics of Suspensions and Emulsions)
Abstract
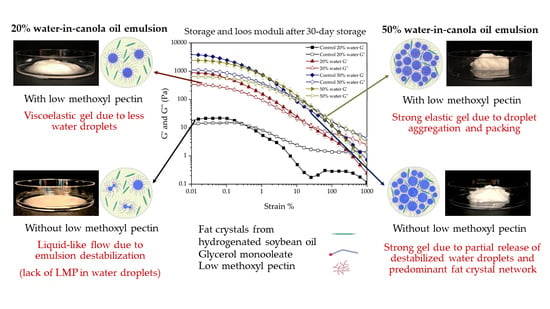
:This study aimed to investigate gelation in glycerol monooleate (GMO)-stabilized water-in-canola oil (W/CO) emulsions by increasing water content (20–50 wt.%) and the addition of low methoxyl pectin (LMP) in the aqueous phase. A constant ratio of GMO to water was used to keep a similar droplet size in all emulsions. Hydrogenated soybean oil (7 wt.%) was used to provide network stabilization in the continuous phase. All fresh emulsions with LMP in the aqueous phase formed a stable and self-supported matrix with higher viscosity and gel strength than emulsions without LMP. Emulsion viscosity and gel strength increased with an increase in water content. All emulsions showed gel-like properties (storage moduli (G’) > loss moduli (G’’)) related to the presence of LMP in the aqueous phase and increased water content. Freeze/thaw analysis using a differential scanning calorimeter showed improved stability of the water droplets in the presence of LMP in the aqueous phase. This study demonstrated the presence of LMP in the aqueous phase, its interaction with GMO at the interface, and fat crystals in the continuous phase that could support the water droplets’ aggregation to obtain stable elastic W/CO emulsions that could be used as low-fat table spreads.
1. Introduction
Products containing water-in-oil (W/O) emulsions are widely used in the pharmaceutical, cosmetic, and food industries. In the cosmetic industry, W/O emulsions have been used to deliver moisture in lipsticks due to the high rigidity provided by the excess waxes and pigments [1]. In food, butter and margarine are W/O emulsions where water droplets are dispersed in a continuous fat phase made of semi-solid dairy or vegetable fats, respectively. Recently, interest has shifted to develop stable food-grade W/O emulsions with lower fat contents, structured with high-quality lipids (rich in polyunsaturated fatty acids), and with the addition of health-beneficial functional molecules in the aqueous phase [2]. A network of fat or wax crystals or Pickering particles around the water droplets are some of the mechanisms that have been studied to stabilize these emulsions [3]. The oils have a low dielectric constant; thus, their stability cannot be explained purely with the DLVO theory [4]. Hence, stabilization due to electrostatic repulsion would be insignificant in W/O emulsions. The emulsifiers most commonly used to emulsify water in a continuous oil phase are non-ionic emulsifiers, due to their low hydrophilic–lipophilic balance (HLB) or surface-active Pickering particles [5]. Although emulsifiers are essential, most water-in-vegetable oil (W/VO) emulsions are stabilized via fat crystallization, acting as Pickering (surface-active) or 3D network (surface-inactive) stabilization [3]. It has been shown that in W/O emulsions, post-crystallization of fats after emulsification provided more stability than pre-crystallization of fats before emulsification, reducing droplet coalescence and preventing sedimentation [6].
Due to solid fat, the texture of most W/VO emulsions (e.g., margarine) is solid or semi-solid, which also provides the desired spreadability or plasticity of the product [7]). Lately, the water-dispersed phase has been considered to be an active filler inside a matrix of oil and fat crystals, where water droplets have been shown to increase the whole product’s viscosity and viscoelasticity [2]. For instance, Haj-shafiei, Ghosh, and Rousseau [8] developed water-in-mineral-oil (W/MO) emulsions stabilized by 5 wt.% wax and 0.025–0.125 wt.% glycerol monooleate (GMO) in the oil phase, as a function of the increase in water content from 10 to 50 wt.%. The researchers reported an increase in viscosity and viscoelasticity of the emulsion at 30–50% water content only after 4 weeks of storage, due to wax crystal growth and associated enmeshing with a large number of water droplets. Iqbal, Hameed, Baloch, and McClements [9] also investigated the increase in water content from 10 to 40 wt.% in W/O emulsions stabilized by polyglycerol polyricinoleate (PGPR). In this case, emulsion stability was further improved by gelling the water droplets via thermal denaturation of whey protein isolate in the aqueous phase. The viscoelasticity increased significantly with 30 and 40 wt.% water, due to the rise in droplet concentration and aqueous phase gelation. The authors concluded that the proteins presented in water droplets could promote interdroplet interactions leading to the formation of a stable droplet network.
With a rise in consumer demand towards low-fat margarine-based table spreads, it is critical to investigate W/VO emulsions with higher water contents that could provide improved rheology and structure formation. However, stable W/VO emulsions with high water droplet volume fractions and improved viscoelasticity are challenging systems to develop. Vegetable oils are made of triacylglycerols, containing polar carbonyl and hydroxyl groups that interact with surface-active molecules at the interface and pull them out of the water droplet surface, leading to emulsion destabilization [10]. It was found that the only emulsifier that could provide high stability to a liquid W/VO emulsion is the polymeric PGPR, which itself provides a strong anchoring at the water–VO interface, thereby preventing its desorption from the water droplet surface [7]. Conversely, mineral oils, which are made of alkanes, have less complicated hydrocarbon chain structures, and do not interact with the emulsifier molecule at the water droplet surface. Hence, many non-polar emulsifiers (e.g., monoacylglycerols and sorbitan esters) can be used to stabilize liquid W/MO emulsions. However, in order to stabilize W/VO emulsions with food-grade glycerol monoesters, it is necessary to have fat crystallization at the water droplet surface and in the continuous oil phase. The Pickering crystallization at the water droplet surface could prevent emulsifier desorption to the bulk phase from the water droplet surface [10]. The fat crystal network in the continuous oil phase could also partially immobilize the water droplets, thereby providing stability to the W/VO emulsion. However, how increasing the water droplet volume fraction could enhance the viscoelasticity of the W/VO emulsion has not been studied in detail. Rising health concerns over the use of PGPR have also led to a challenge in developing stable W/VO emulsions without the use of PGPR. Therefore, in the present research, our objective was to investigate water content’s influence on the structure formation and rheology of monoacylglycerol-stabilized W/VO emulsions. Structuring of W/O emulsions using water droplets could be essential to reducing the content of saturated fats and calories in table spreads, coatings, baked goods, or ganache.
The W/VO emulsions with 20–50 wt.% water were developed with GMO as an emulsifier. To prevent GMO’s desorption from the water droplet surface, low-methoxyl pectin (LMP) was added to the aqueous phase. To provide margarine-like solidity to the emulsions, fully hydrogenated soybean oil (HSO), with a high melting point (~50 °C) and a high concentration (~85%) of stearic acid (C18:0), was used as a continuous phase network stabilizer. Fully hydrogenated oils have been used to provide a fat crystal network in the oil phase due to their non-trans fatty acids’ nature, so that fat products with a healthy balance can be provided [11]. This study aimed to determine the interaction between water content, the presence of LMP in the aqueous phase, and HSO in the continuous oil phase in order to develop the viscoelastic properties of a W/VO emulsion with improved gel strength. This study significantly advances the knowledge on the incorporation of hydroxyl group donating agents (such as LMP) in the aqueous phase in combination with an increase in water content to strengthen the gelation behavior of W/CO emulsions.
2. Materials and Methods
2.1. Materials
Canola oil (CO) was purchased from a local grocery store and stored at 4 °C. Distilled monoglyceride DMG 0298 (90–95% monoglycerides, 75–91% oleic, 2–17% linoleic, 3–6% stearic, 3–5% palmitic, 0.5–1.6% behenic, 0.1–0.5% eicosenoic, 0.2–0.5% arachidic, 0–0.3% linolenic, <0.5% myristic, <0.5% palmitoleic) was donated by Palsgaard® (Palsgaard, Juelsminde, Denmark). Hydrochloric acid (HCl) solution (1N) was purchased from Fisher Scientific (Thermo Fisher Scientific, Toronto, ON, Canada). Amidated low-methoxyl pectin (LMP) (Genu® pectin type LM-101 AS, degree of esterification (DE): 36%, and degree of amidation: 14%) was granted by CP Kelco (CP Kelco ApS, Lille Skensved, Denmark). Fully hydrogenated soybean oil (HSO) flakes were provided by ADM (James R. Randall Research Center, Decatur, IL, USA). Deionized water by Milli-QTM (Millipore Corporation, Burlington, MA, USA) was used for the dispersed phase.
2.2. Preparation of Aqueous and Oil Phases
The aqueous phases were prepared with 1.5 wt.% LMP in water and stirred at 400 rpm at 90 ± 0.5 °C. All solutions were kept on the hot plate for 30 min until complete LMP dissolution. In all solutions, the pH was adjusted at 3.0 ± 0.2 with 1N HCl. These solutions were made on the same day as the emulsion preparation. Bulk oil phases were prepared with HSO and GMO in CO, as shown in Table 1. According to preliminary research, a minimum GMO-to-aqueous-phase ratio of 0.065 was required in order to stabilize 20 wt.% W/CO emulsions. This composition was used as the basis for all emulsions with 20–50 wt.% water, where the water-to-GMO ratio was kept constant. We also tried to make emulsions with 60 wt.% water. However, due to an extreme increase in viscosity, it was impossible to homogenize these emulsions properly; hence, it was no longer prepared. It was found that a minimum 7 wt.% HSO in the emulsion was required in order to maintain the water droplets’ stability. All oil solutions were kept under stirring (400 rpm) at 80 ± 0.5 °C for 20 min until complete melting of HSO and GMO. These solutions were prepared on the same day as the emulsions.
2.3. Preparation of W/O Emulsions
The aqueous and oil solutions were kept warm at 75 ± 0.5 °C in order to keep all of the components molten. The oil phase was weighed in a glass beaker and stirred at 400 rpm with a magnetic stirrer (VWR International, Edmonton, AB, Canada). The aqueous phase was weighted in a separate glass beaker and added dropwise to the hot oil solutions while stirring. Final emulsions were developed in two steps: First, coarse emulsification was performed with a rotor–stator blender (Polytron, Brinkman, ON, Canada) at level 10 for 1 min. The blender was preheated with hot CO at 50 ± 2 °C. Secondly, the hot coarse emulsions were further homogenized in a high-pressure homogenizer (Emulsiflex C3, Avestin Inc., Ottawa, ON, Canada) at 5000 psi for 3 cycles. The homogenizer was preheated by passing CO (50 ± 2 °C) at 5000 psi. The final emulsions at around 50 °C were collected in 250 mL beakers and cooled down at room temperature for 20 min with a magnetic stirrer. Each sample weight was then divided into 2 beakers (40 mL) and stored in a refrigerator at 4 °C.
2.4. Emulsion Storage Stability
Fresh emulsions (15 mL) were transferred into clear glass vials (40 mL) with top caps (VWR International, Edmonton, AB, Canada) and stored at 4 °C. On day 30, the tubes were flipped 90 degrees parallel with the table, and the photos were captured. On day 1, a single scoop of W/O emulsion was also placed in a plastic Petri dish (VWR International, Edmonton, AB, Canada) in order to record flow behavior, and covered with aluminum foil for undisturbed storage for 30 days at 4 °C. The images of the samples were taken with an iPhone 8’s camera (12 MP).
2.5. Microstructure Analysis
The fat crystal network and water droplet network were analyzed with bright-field and polarized light microscopy. All emulsions were examined with a polarized light microscope on day 1 and day 30 with a (Motic BA380 Pol microscope, Richmond, BC, Canada) and a Nikon DS-Fi1 camera (Nikon Corporation, Tokyo, Japan) using a 100× oil immersion objective lens. A small drop of the emulsion was placed over a glass slide (VWR, Edmonton, AB, Canada) and a coverslip was positioned above the sample. Nis-Elements F3.0 software (Nikon Canada Inc., Mississauga, ON, Canada) was utilized to record the images. Image analysis software (ImageJ, v1.5 2i–Fiji project) was employed in order to enhance the images’ quality with the brightness and contrast of the 8-bit images [12].
2.6. Rheology of W/O Emulsions
Rheology analyses were performed using an AR-G2 rheometer (TA Instruments, Montreal, QC, Canada), temperature set at 25 °C, with a steel crosshatched plate (40 mm diameter, 992478). Two types of rheology analyses were performed. For viscosity measurement in the rotational mode, a shear rate from 0.01 to 100 s−1 was used, with a loading gap of 1000 μm. The oscillatory mode was operated at a constant frequency of 1 Hz (6.18 rad/s), with oscillation strain from 0.01 to 1000% to measure storage (G’) and loss moduli (G”).
2.7. Thermal Analysis of Emulsions
Fresh (day 1) and stored (day 30) samples (<10 mg) were sealed in aluminum Tzero hermetic lids and pans (TA Instruments, New Castle, DE, USA) and temperature-cycled in a differential scanning calorimeter (DSC) Q2000 (TA Instruments, Montreal, QC, Canada). An empty Tzero pan was utilized as a reference. The samples were heated from 25 °C to 70 °C, then cooled to −70 °C, followed by reheating to 70 °C at 5 °C/min. A temperature hold of 1 min was kept between the thermal cycles. The presence of bulk water crystallization peaks during the first and third cooling cycles was used as an indicator of emulsion instability. Universal Analysis 2000 software (TA Instruments, New Castle, DE, USA) was used to integrate the peaks in order to obtain crystallization and melting temperatures (°C), along with the enthalpy of phase transition (J/g).
2.8. Determination of Solid Fat Content
Mixtures of CO with 3–8 wt.% HSO were prepared in order to develop a calibration curve for HSO melting using the DSC. The oil phases were completely melted at 70 °C. Then, a sample was placed in the pan to be hermetically sealed. The samples were cooled down from 25 °C to −70 °C, and then reheated to 70 °C at 5 °C/min. The melting peak enthalpies were analyzed and plotted against the amount of HSO. A linear trendline was identified with R2 = 0.9972. The refrigerated emulsions (4 °C) were thermally analyzed on day 1 and day 30 by heating to 70 °C at 5 °C/min, in order to predict the percentage of solid HSO in the emulsion after the homogenization and storage process using the enthalpy calibration curve.
2.9. Statistics
All of the emulsions were prepared in triplicate with the respective analyses on day 1 and day 30. The three means were used to analyze variance with one-way analysis of variance (ANOVA), and the p-value was set with the α value of 0.05%, using the IBM SPSS Statistics 20 software (IBM, Armonk, NY, USA) for this purpose.
3. Results
3.1. Emulsion Appearance and Storage Stability
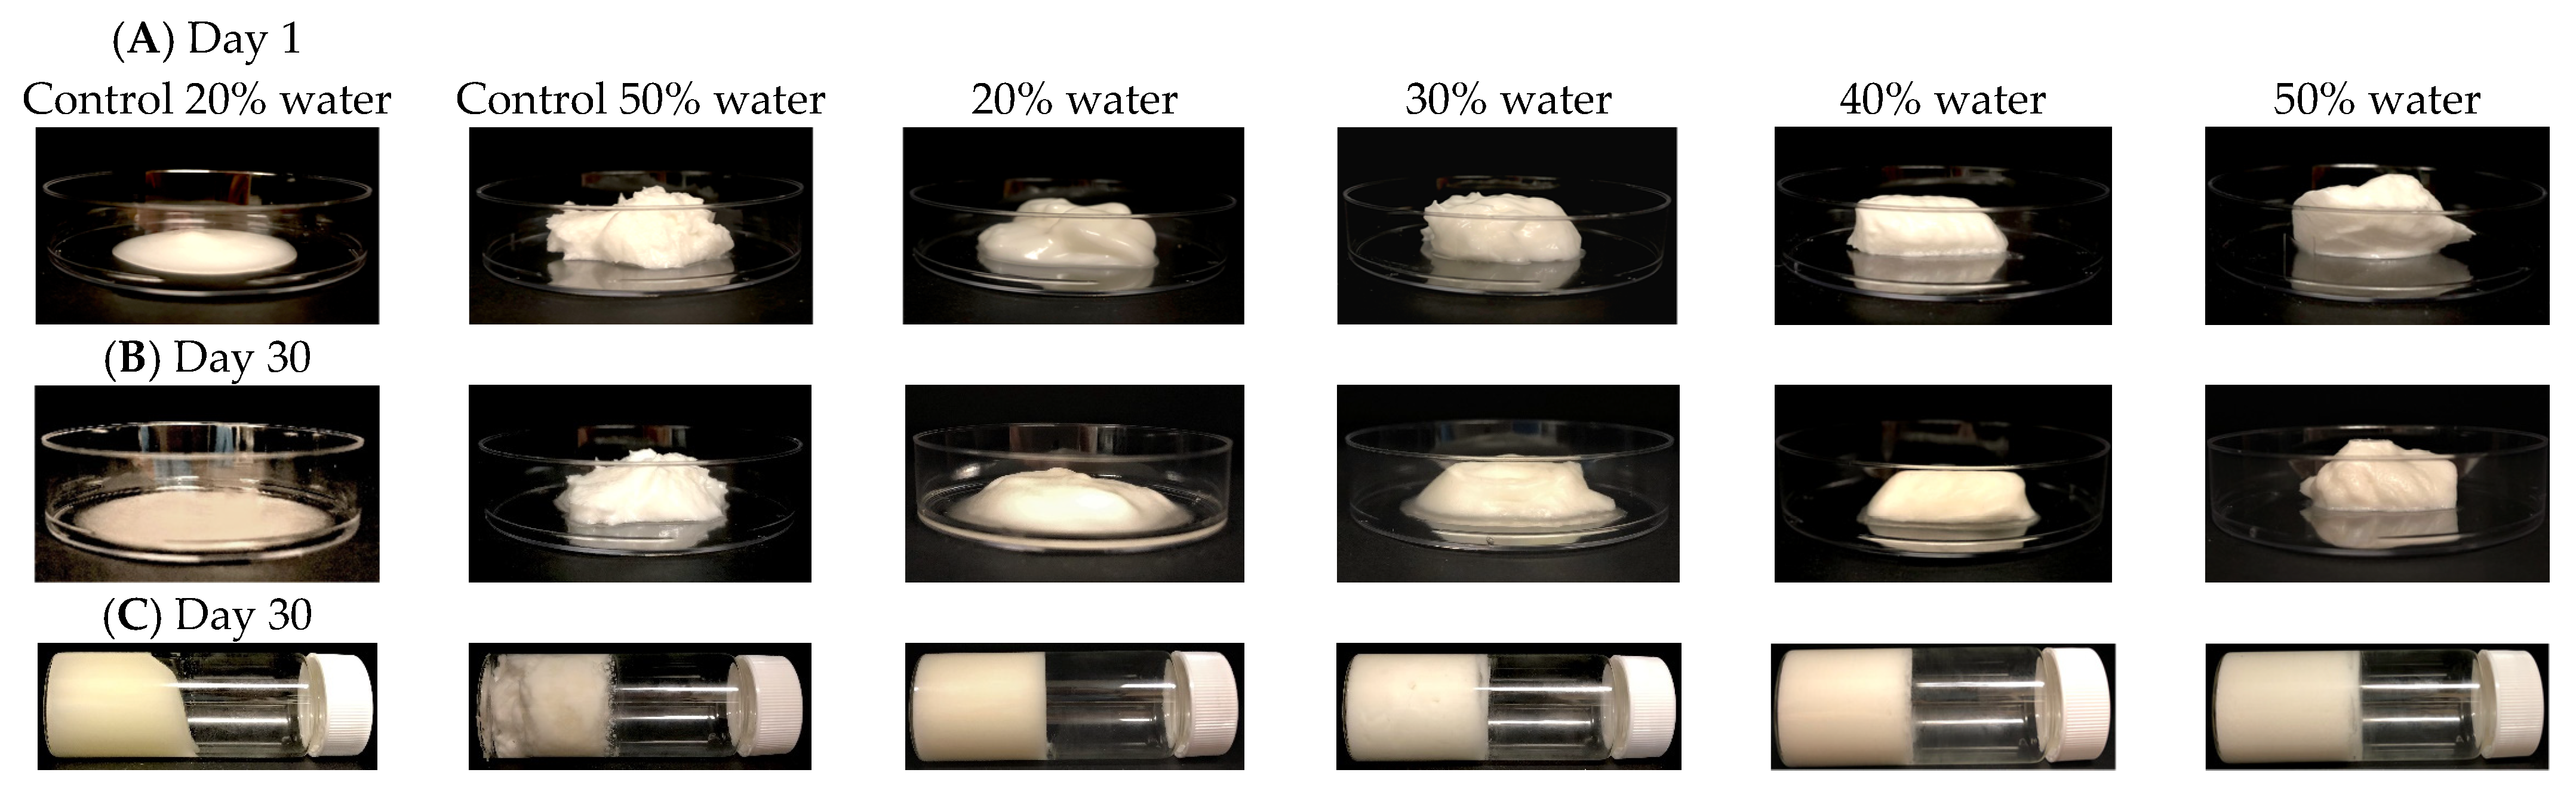
The Petri dish test showed visual observation of emulsion flow behavior during storage on day 1 and day 30 (Figure 1A,B). Almost all of the W/O emulsions were highly viscous liquids without any flow, except for the control emulsion (without LMP) with 20 wt.% water, which visually flowed on day 1 (Figure 1A). However, the control emulsion with 50 wt.% water showed no flow due to close packing of excess water droplets, although its surface looked unsmooth and without any gloss (Figure 1A). Emulsions with aqueous phase LMP and 20, 30, 40, and 50 wt.% water self-retained their shape on day 1. On day 30, the control emulsions with 20 wt.% water spread over the Petri dish, indicating a change in the emulsions’ structure (Figure 1B). However, the control emulsions with 50 wt.% water showed a similar emulsion shape on day 30 as on day 1. LMP emulsions with 20 wt.% water showed a certain degree of spreading compared to day 1, although lower than that of the control emulsions. LMP emulsions with 30 wt.% water demonstrated some spreading, but it was less than that of the 20 wt.% water emulsion. The LMP emulsions with 40 and 50 wt.% water retained their form without any spreading on day 30, comparable to day 1. Recently, Rafanan and Rousseau (2019) reported that W/VO emulsions with 20 wt.% water with HSO and PGPR phase separated after 14 days; however, monoacylglycerol-stabilized emulsions exhibited soft, paste-like solids retaining their shape without separation after 28 days of storage. In the present work, shape retention was observed with more water content and at lower GMO and HSO concentrations. Perhaps the presence of LMP in the aqueous phase provided improved stability to the water droplets, leading to improved structure retention.
The flipped glass tubes were also used to detect emulsion stability and gelation after 30 days of storage (Figure 1C). Control emulsions with 20 wt.% water content showed a partial flow. A similar emulsion with no separation evidence was also found after 28 days of storage with 14.4 wt.% HSO and 1.6 wt.% GMO by Rafanan and Rousseau [13]. Though control emulsions with 50 wt.% water exhibited no flow, aqueous phase separation was observed at the bottom of the glass tube, indicating some emulsion destabilization. All LMP emulsions reported no phase separation or flow on day 30, suggesting that the emulsions were self-supporting, and a strong gel structure was developed. Similarly, Rafanan and Rousseau [14] described considerable textural variations with water increment in GMO emulsions. From 5 to 10 wt.% water, the emulsions were liquid, and from 15 to 20 wt.% water, self-supporting soft solid emulsions were observed for 7 days in storage.
3.2. Emulsion Viscosity
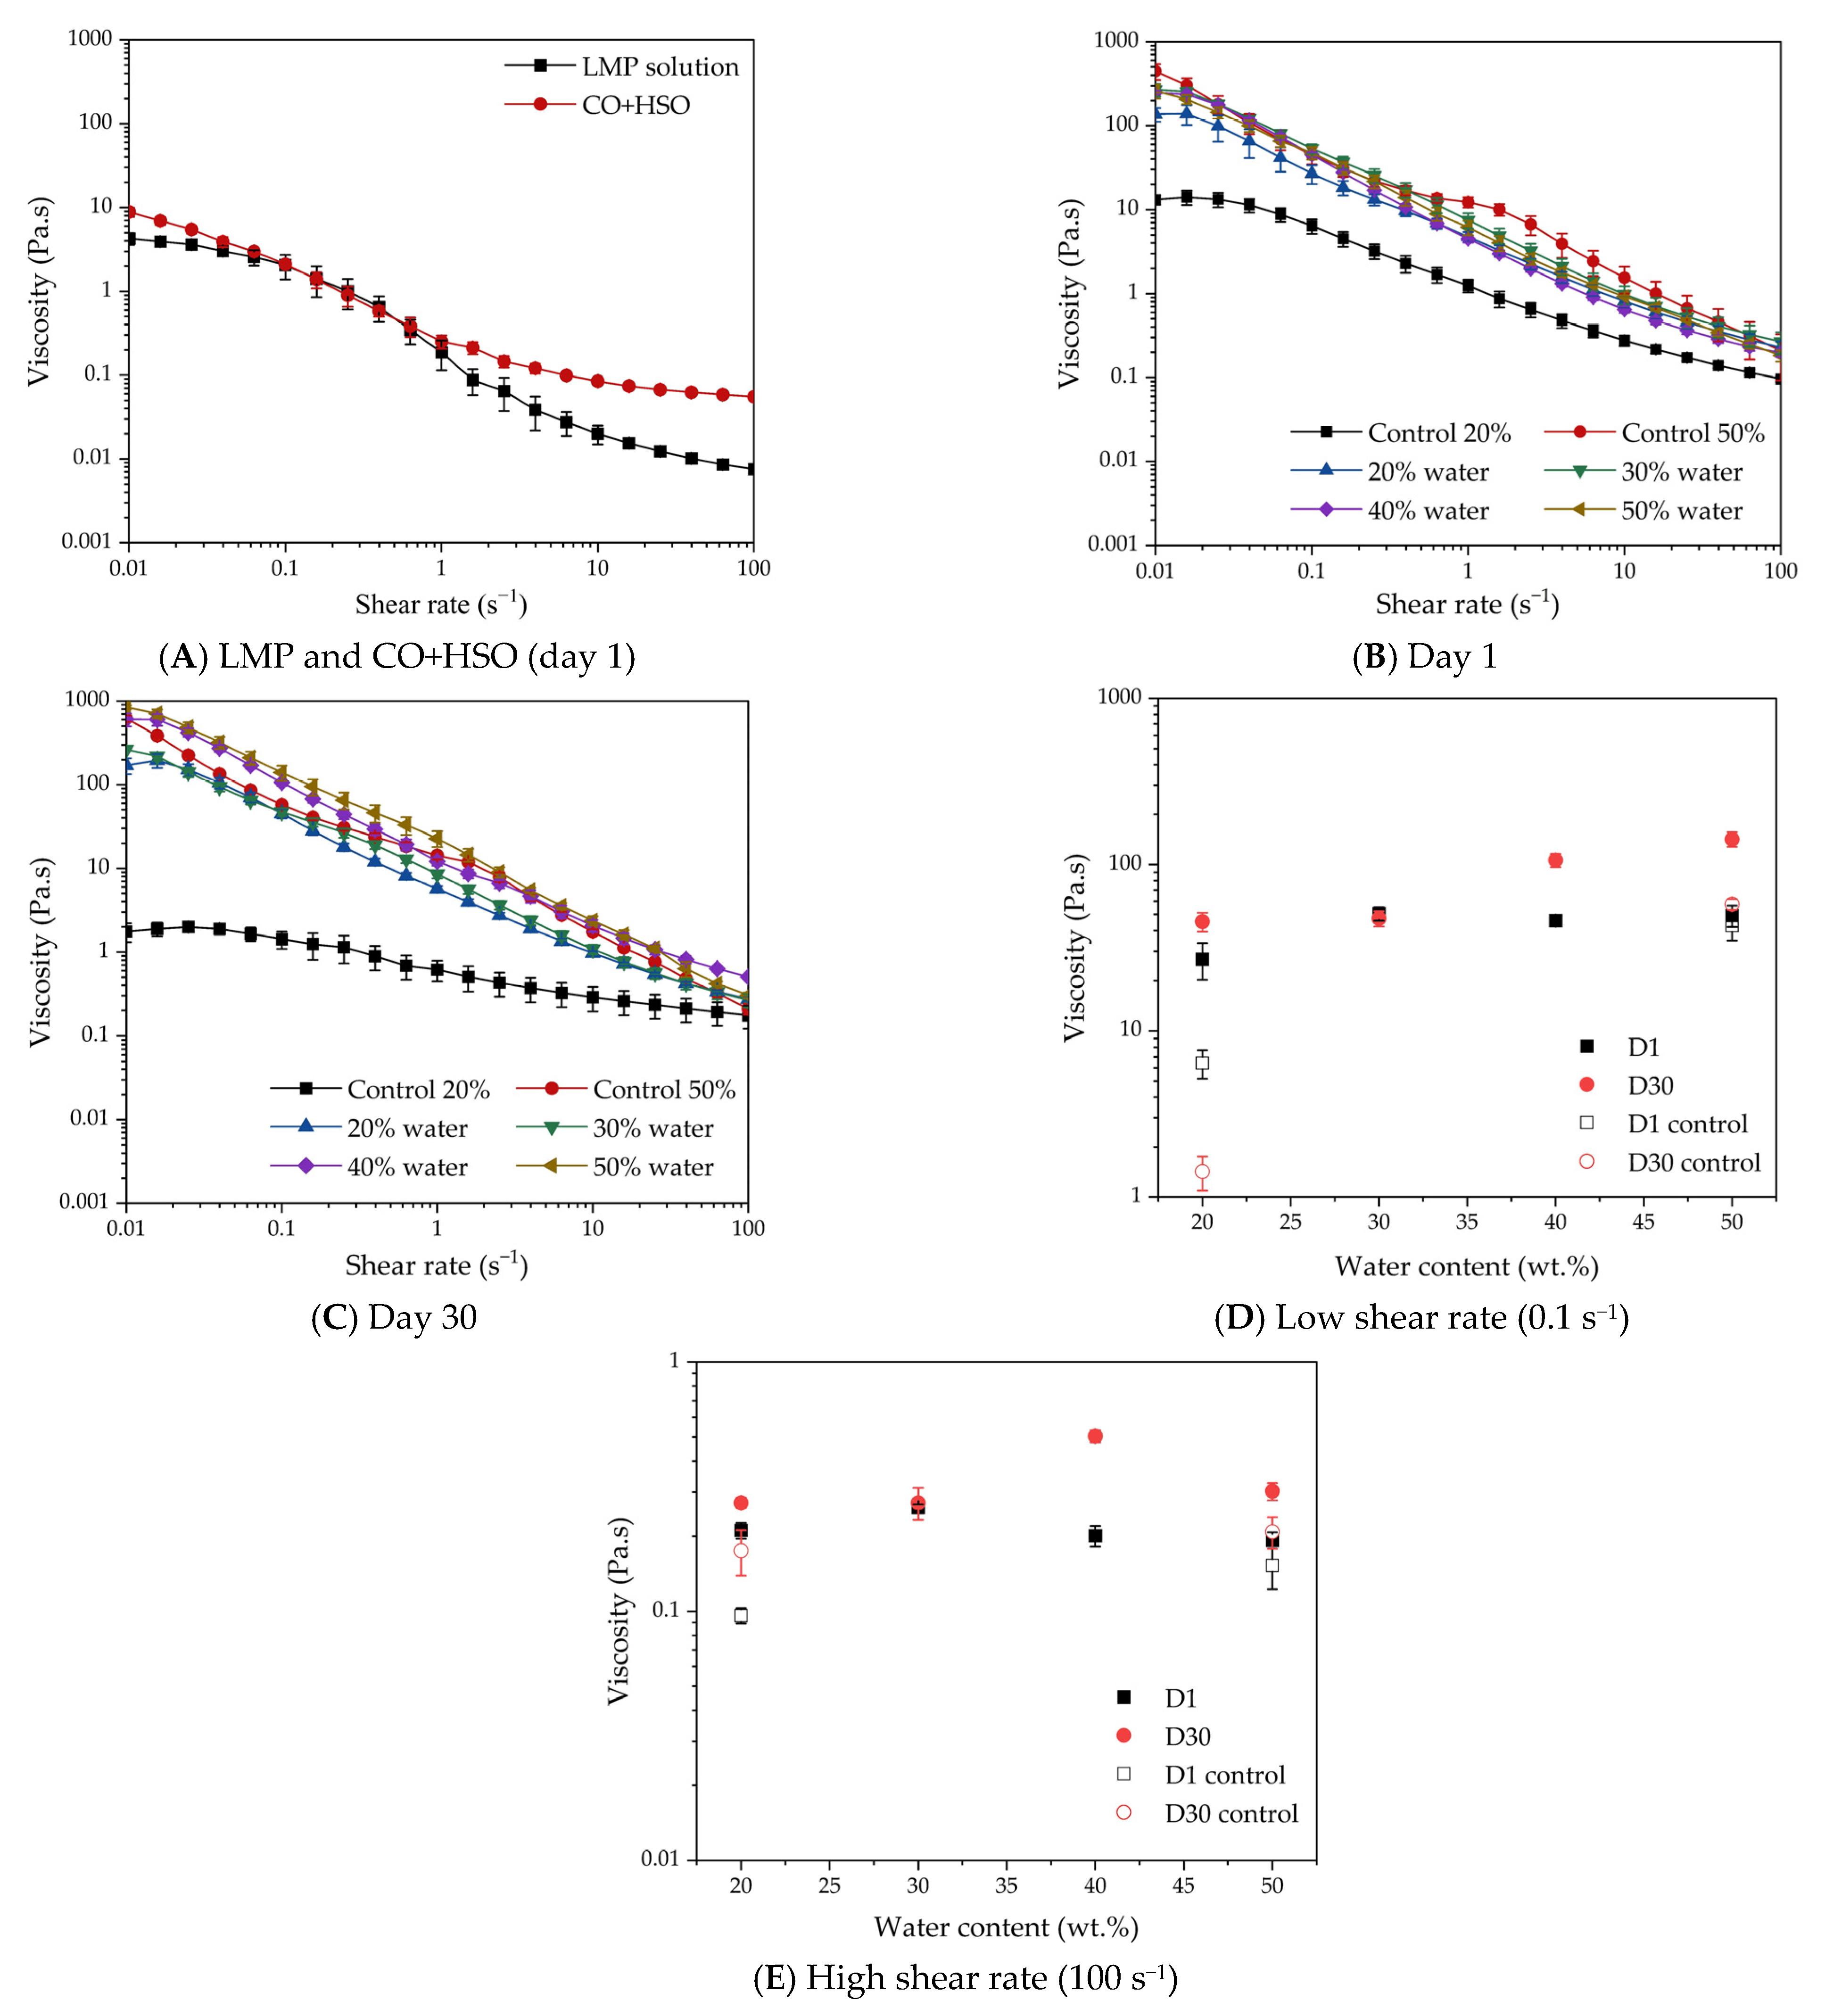
The viscosity graphs exhibited a decreasing trend with the increase in shear rate (Figure 2A). The solution of 1.5 wt.% LMP began with 4.3 ± 0.7 Pa·s at 0.01 s−1, and after that, the viscosity decreased due to the LMP molecules’ detangling, and more flow was dominant in the system. The mixture of 7 wt.% HSO in CO showed an apparent viscosity of 8.8 ± 1.1 Pa·s at 0.01 s−1, which also decreased with an increase in shear rate due to the rupture of the fat crystal network, and nearly reached a plateau beyond 20 s−1 (evidence of liquid-like Newtonian flow behavior).
All emulsions showed a shear-thinning behavior where viscosity decreased with an increase in shear rate on day 1 and day 30 (Figure 2B,C). Control emulsions with 20 wt.% water showed the lowest viscosity trend with shear, which began with a low-shear plateau at 13.2 ± 1.7 Pa·s at 0.01 s−1 and decreased to at 0.1 ± 0.01 Pa·s at the end of the run at 100 s−1 (Figure 2B). However, control emulsions with 50 wt.% water showed an initial viscosity higher than all emulsions at 0.01 s−1, which showed a slightly irregular viscosity curve as a function of shear than all other emulsions. Such behavior could be related to their uneven texture observed in the Petri dish (Figure 1A). LMP emulsions with 20 wt.% water exhibited an initial viscosity significantly higher (137.05 ± 25.02 Pa·s) compared to control 20 wt.% water emulsions. There was not much difference in the viscosity trend of other LMP emulsions. In contrast to control emulsions with 50 wt.% water, all of the LMP emulsions showed a brief low-shear viscosity plateau, which indicates their Newtonian fluid-like behavior at a very low shear rate.
After aging, control emulsions with 20 wt.% water exhibited a significant viscosity drop (Figure 2C), which was expected based on the visual observation of its flow behavior (Figure 1B). Control emulsions with 50 wt.% water had a similar irregular viscosity curve, but in lesser magnitude than on day 1. For all LMP emulsions, the viscosity curves shifted to higher values after 30 days of storage. The viscosity profiles of LMP emulsions with 50 and 40 wt.% water were even higher than the 50 wt.% water control emulsion after 30 days of storage. Similarly, emulsions with 50 wt.% water content reported substantially higher viscosity than 40, 30, and 20 wt.% water for W/MO emulsions stabilized with wax and GMO after 28 days of storage [8].
3.2.1. Apparent Viscosity at a Low Shear Rate
For direct comparison, the emulsions’ apparent viscosities at two different shear rates were plotted in Figure 2D,E. Apparent viscosity at a 0.1 s−1 shear rate (Figure 2D) would represent emulsion viscosity when the structure was not completely broken down due to shear, while apparent viscosity at a 100 s−1 shear rate (Figure 2E) would be an indication of free-flowing emulsion where the original structures were largely broken down. On day 1, at a 0.1 s−1 shear rate, the control emulsions with 20 wt.% water showed the lowest viscosity (6.4 ± 1.3 Pa·s), which increased to 42.9 ± 8.0 Pa·s for the control emulsions with 50 wt.% water. Such an increase in viscosity is related to the rise in the amount of dispersed water droplets in the emulsion (Figure 2D). LMP emulsions with 20 wt.% water reported a significant rise in viscosity (27 ± 6.7 Pa·s) compared to the control emulsions with 20 wt.% water (p < 0.05), which must be related to the improved stability of the water droplets in the presence of LMP in the aqueous phase. Upon increasing the water content, a significant increase in LMP emulsion viscosity at 0.1 s−1 was observed at 30 wt.% water, which did not change with further increase in water content to 50 wt.% (on average, 48.5 Pa·s) (p > 0.05). In contrast, Haj-shafiei et al. [8] showed that the apparent viscosity of fresh W/MO emulsion stabilized with paraffin wax and GMO at a 10 s−1 shear rate increased proportionally to the increment of the water content (20–50 wt.%). In the present case, perhaps the emulsions’ structure was broken even at a 0.1 s−1 shear rate, and a proper indication of their gelation behavior could be obtained from small-deformation oscillatory rheological measurement (discussed below). The low-shear viscosity of 50 wt.% water control emulsions was not significantly different compared to 50 wt.% LMP emulsions (p > 0.05), which indicates that under fresh conditions the predominant interaction influencing the viscosity of concentrated emulsions was the active filler property of the water droplets.
On day 30, control emulsions with 20 wt.% water demonstrated a decrease in viscosity (1.4 ± 0.3 Pa·s) from day 1 (Figure 2D), which could be associated with the visual observation of their flow behavior under the quiescent conditions shown in Figure 1B. Nevertheless, control emulsions with 50 wt.% water content revealed a viscosity increase after storage (57.5 ± 4.2 Pa·s.), related to further HSO crystallization in the continuous emulsion phase. A slight increase in viscosity was also observed after 30 days for 20 wt.% water emulsions with LMP, which did not change for 30 wt.% water (p > 0.05). Nevertheless, a significant viscosity rise (~2x) was observed for aged LMP emulsions with 40 and 50 wt.% water (106 ± 9.8 and 142 ± 14.2 Pa·s, respectively), suggesting the synergistic effect of HSO crystallization along with water droplet packing during storage. On day 30, the viscosity of the LMP emulsions was significantly higher than the control emulsions, which could be due to the improved stability of the aged droplet network in the presence of LMP in the aqueous phase.
3.2.2. Apparent Viscosity at a High Shear Rate
The apparent viscosity decreased for all emulsions at a high shear rate (100 s−1) due to the breakdown of fat crystal networks and water droplet packing. On day 1, control emulsions reported a viscosity range of 0.1–0.15 Pa·s, while the LMP emulsions showed a range from 0.2 to 0.26 Pa·s (Figure 2E). This indicates that, even at a higher shear rate, the LMP’s presence in the water droplets was better against the shear force than its absence. Interestingly, on day 1, high shear viscosity decreased for 40 and 50 wt.% water emulsions, compared to 20 and 30 wt.% water, which could be associated with the water droplets’ destabilization from tight packing under high shear force.
After aging, all emulsions reported an increase in apparent viscosity even at a higher shear rate, which could be due to HSO crystallization, as discussed above. Control emulsions with only water showed a viscosity of 0.18 ± 0.04 and 0.21 ± 0.03 for 20 and 50 wt.% water, respectively. LMP emulsions presented higher viscosity compared to control emulsions. Emulsions with 20 and 30 wt.% water exhibited an average viscosity of 0.27 Pa·s (p > 0.05). However, the highest viscosity was reported by 40 wt.% water content followed by 50 wt.% water content. The decrease in high-shear viscosity of 50 wt.% water LMP emulsions after storage could be due to higher droplet destabilization under high shear force when they were closely packed. An increase in viscosity from 10 to 40 wt.% water followed the trends observed by Iqbal et al. [9] for PGPR-stabilized water-in-soybean-oil emulsions containing whey protein isolate (WPI) and NaCl in the aqueous phase. Heating the emulsions to denature the WPI in the aqueous phase, and subsequent cooling, led to a steep increase in apparent viscosity at 10 s−1 for 30 and 40 wt.% water (~38 and 54 Pa·s, respectively) compared to 10 and 20 wt.% water [9]. The authors reported that the viscosity increase was due to the 3D network of the highly aggregated water droplets containing protein networks after heating—leading to an increase in effective dispersed phase volume fraction—and due to the shift in their shape from spherical to non-spherical under shear.
3.2.3. Modeling Emulsion Viscosity
Pal [15] proposed a new generalized viscosity model for concentrated suspensions and emulsions, which considered shear-induced droplet aggregation as an advancement over the Mooney and Krieger–Dougherty models. Pal proposed that the effective volume fraction of aggregated particles (ϕeff) could be calculated by multiplying droplet actual volume fraction (ϕ) with an aggregation coefficient, k. The aggregation coefficient (k) was, in turn, calculated from the boundary condition of maximum packing volume fraction (ϕm). Using these two parameters, the relative viscosity (ηr, ratio of suspension to continuous phase viscosity) of a concentrated hard-sphere suspension was expressed as [16]:
In order to use this model for emulsions, a correction factor for ηr must be considered for the viscosity ratio (λ) of droplets to the continuous phase. When emulsions are sheared, the fluid inside the droplets circulates, which reduces the alteration of the flow behavior of the continuous phase, leading to a lowering of viscosity compared to a hard-sphere suspension. Pal proposed that the relationship between emulsion relative viscosity with its droplet volume fraction can be calculated by replacing ηr with ηr ((2ηr + 5λ)/(2 + 5λ))3/2 [17]. By applying this correction to ηr, the new generalized viscosity model for concentration emulsions became [15]:
In the present case, Equation (2) was unable to predict our emulsion viscosity using ϕm as a fitting parameter. The calculated relative viscosities with the correction factor became several orders of magnitude higher than the model-predicted values. This could be due to several factors. First, in the present emulsions, the continuous phase was structured due to the presence of HSO fat crystal networks. Second, it has been proposed that when HSO crystallizes in the continuous phase containing GMO-stabilized water droplets, crystallization initiates at the water droplet surface, where GMO could act as a favorable site for nucleation [3]. This could lead to a combination of crystal network and Pickering stabilization of water droplets [10]. The crystal-coated Pickering water droplets could essentially act as hard spheres. Therefore, the water droplets are not only aggregated in the present case, but they are also connected to the continuous phase structure, acting as active fillers [2]. Third, the water droplets could additionally take various irregular shapes due to fat crystallization at the surface, which was not considered in the model. Fourth, LMP can also interact at the interface not only with GMO, but also with LMP molecules at the surface of other water droplets. Therefore, the Pal equation (Equation (2)) was not able to model the complex structure of our emulsion.
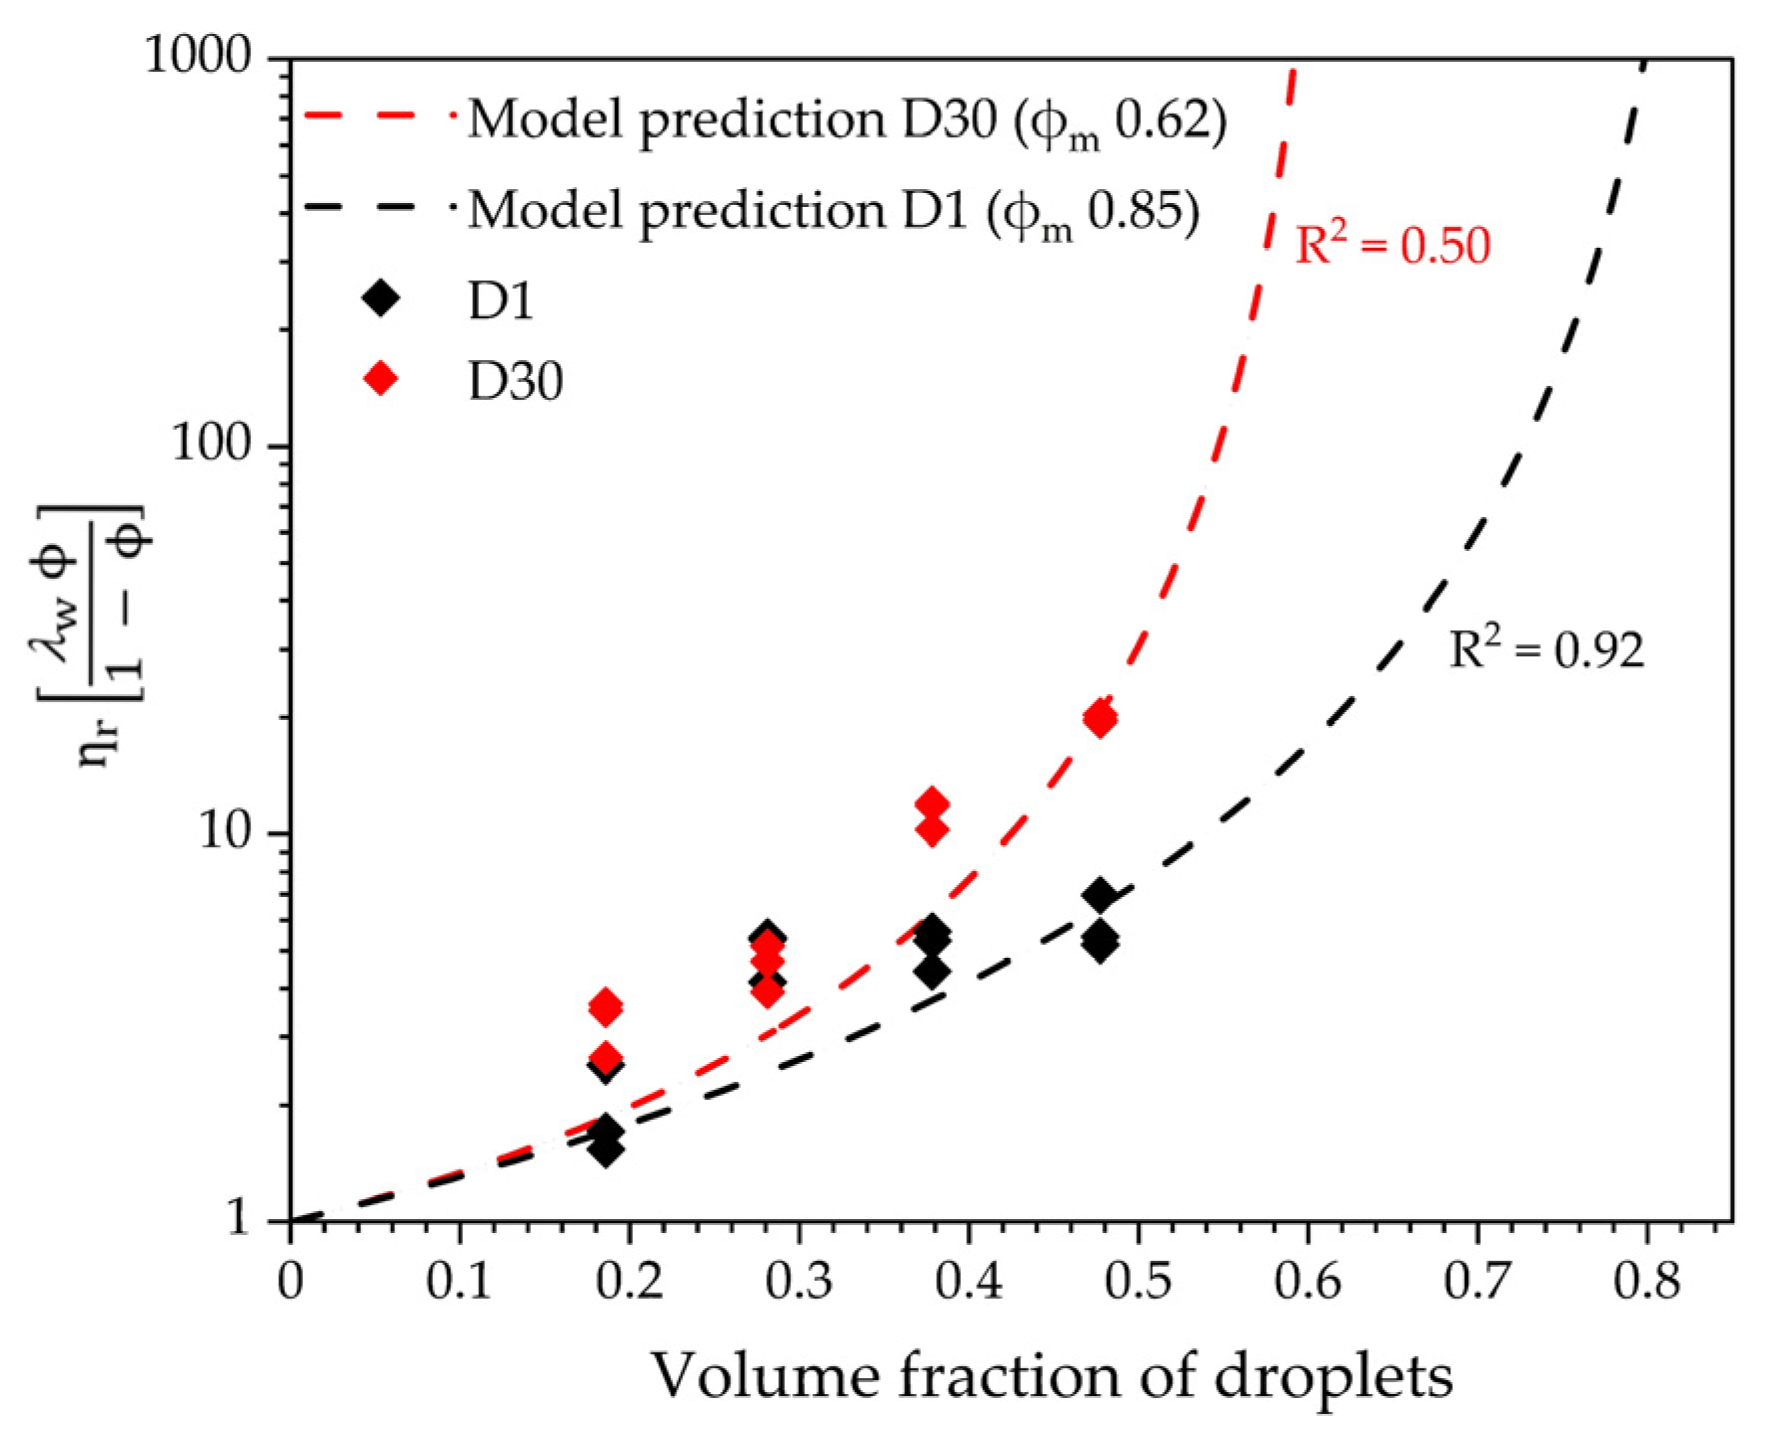
We found that a weighted viscosity ratio (λw) of dispersed (ηd) to continuous phase (ηc) could be more successfully used as a correction to the hard-sphere model proposed in Equation (1). The λw can be defined as the ratio ηd ϕ/ηc (1–ϕ). The proposed equation becomes:
Figure 3 shows the model fitting of Equation (3) to the corrected relative viscosity values of the W/CO emulsions from the present work, using ϕm as a fitting parameter. For λw, a viscosity of 1.5 wt.% LMP and 7 wt.% HSO in CO at a 0.1 s−1 shear rate were used for the dispersed and continuous phase values, respectively. For day 1 emulsion viscosities, the model fitting was poor (R2 = 0.50), which could be associated with the high viscosity for 30 wt.% W/CO emulsions. The fitting parameter—maximum packing volume fraction—was 0.85, which is unusually high and indicates that crystal-coated droplet surfaces would no longer be spherical, and the droplets could be severely compressed at this stage. Clearly, more research is needed in order to further understand the highly compressed state of such Pickering and network-stabilized emulsions. Interestingly, on day 30, W/CO emulsions reported a decrease in ϕm to 0.62 with an R2 = 0.92 (Figure 3). Even then, the model was not able to predict higher viscosities of the emulsions at lower water volume fractions. Lowering of the ϕm after storage could be associated with fat crystals’ growth over time, which filled up the space leaving less space for the droplets to pack.
3.3. Emulsion Viscoelasticity
3.3.1. Strain Sweep Viscoelasticity
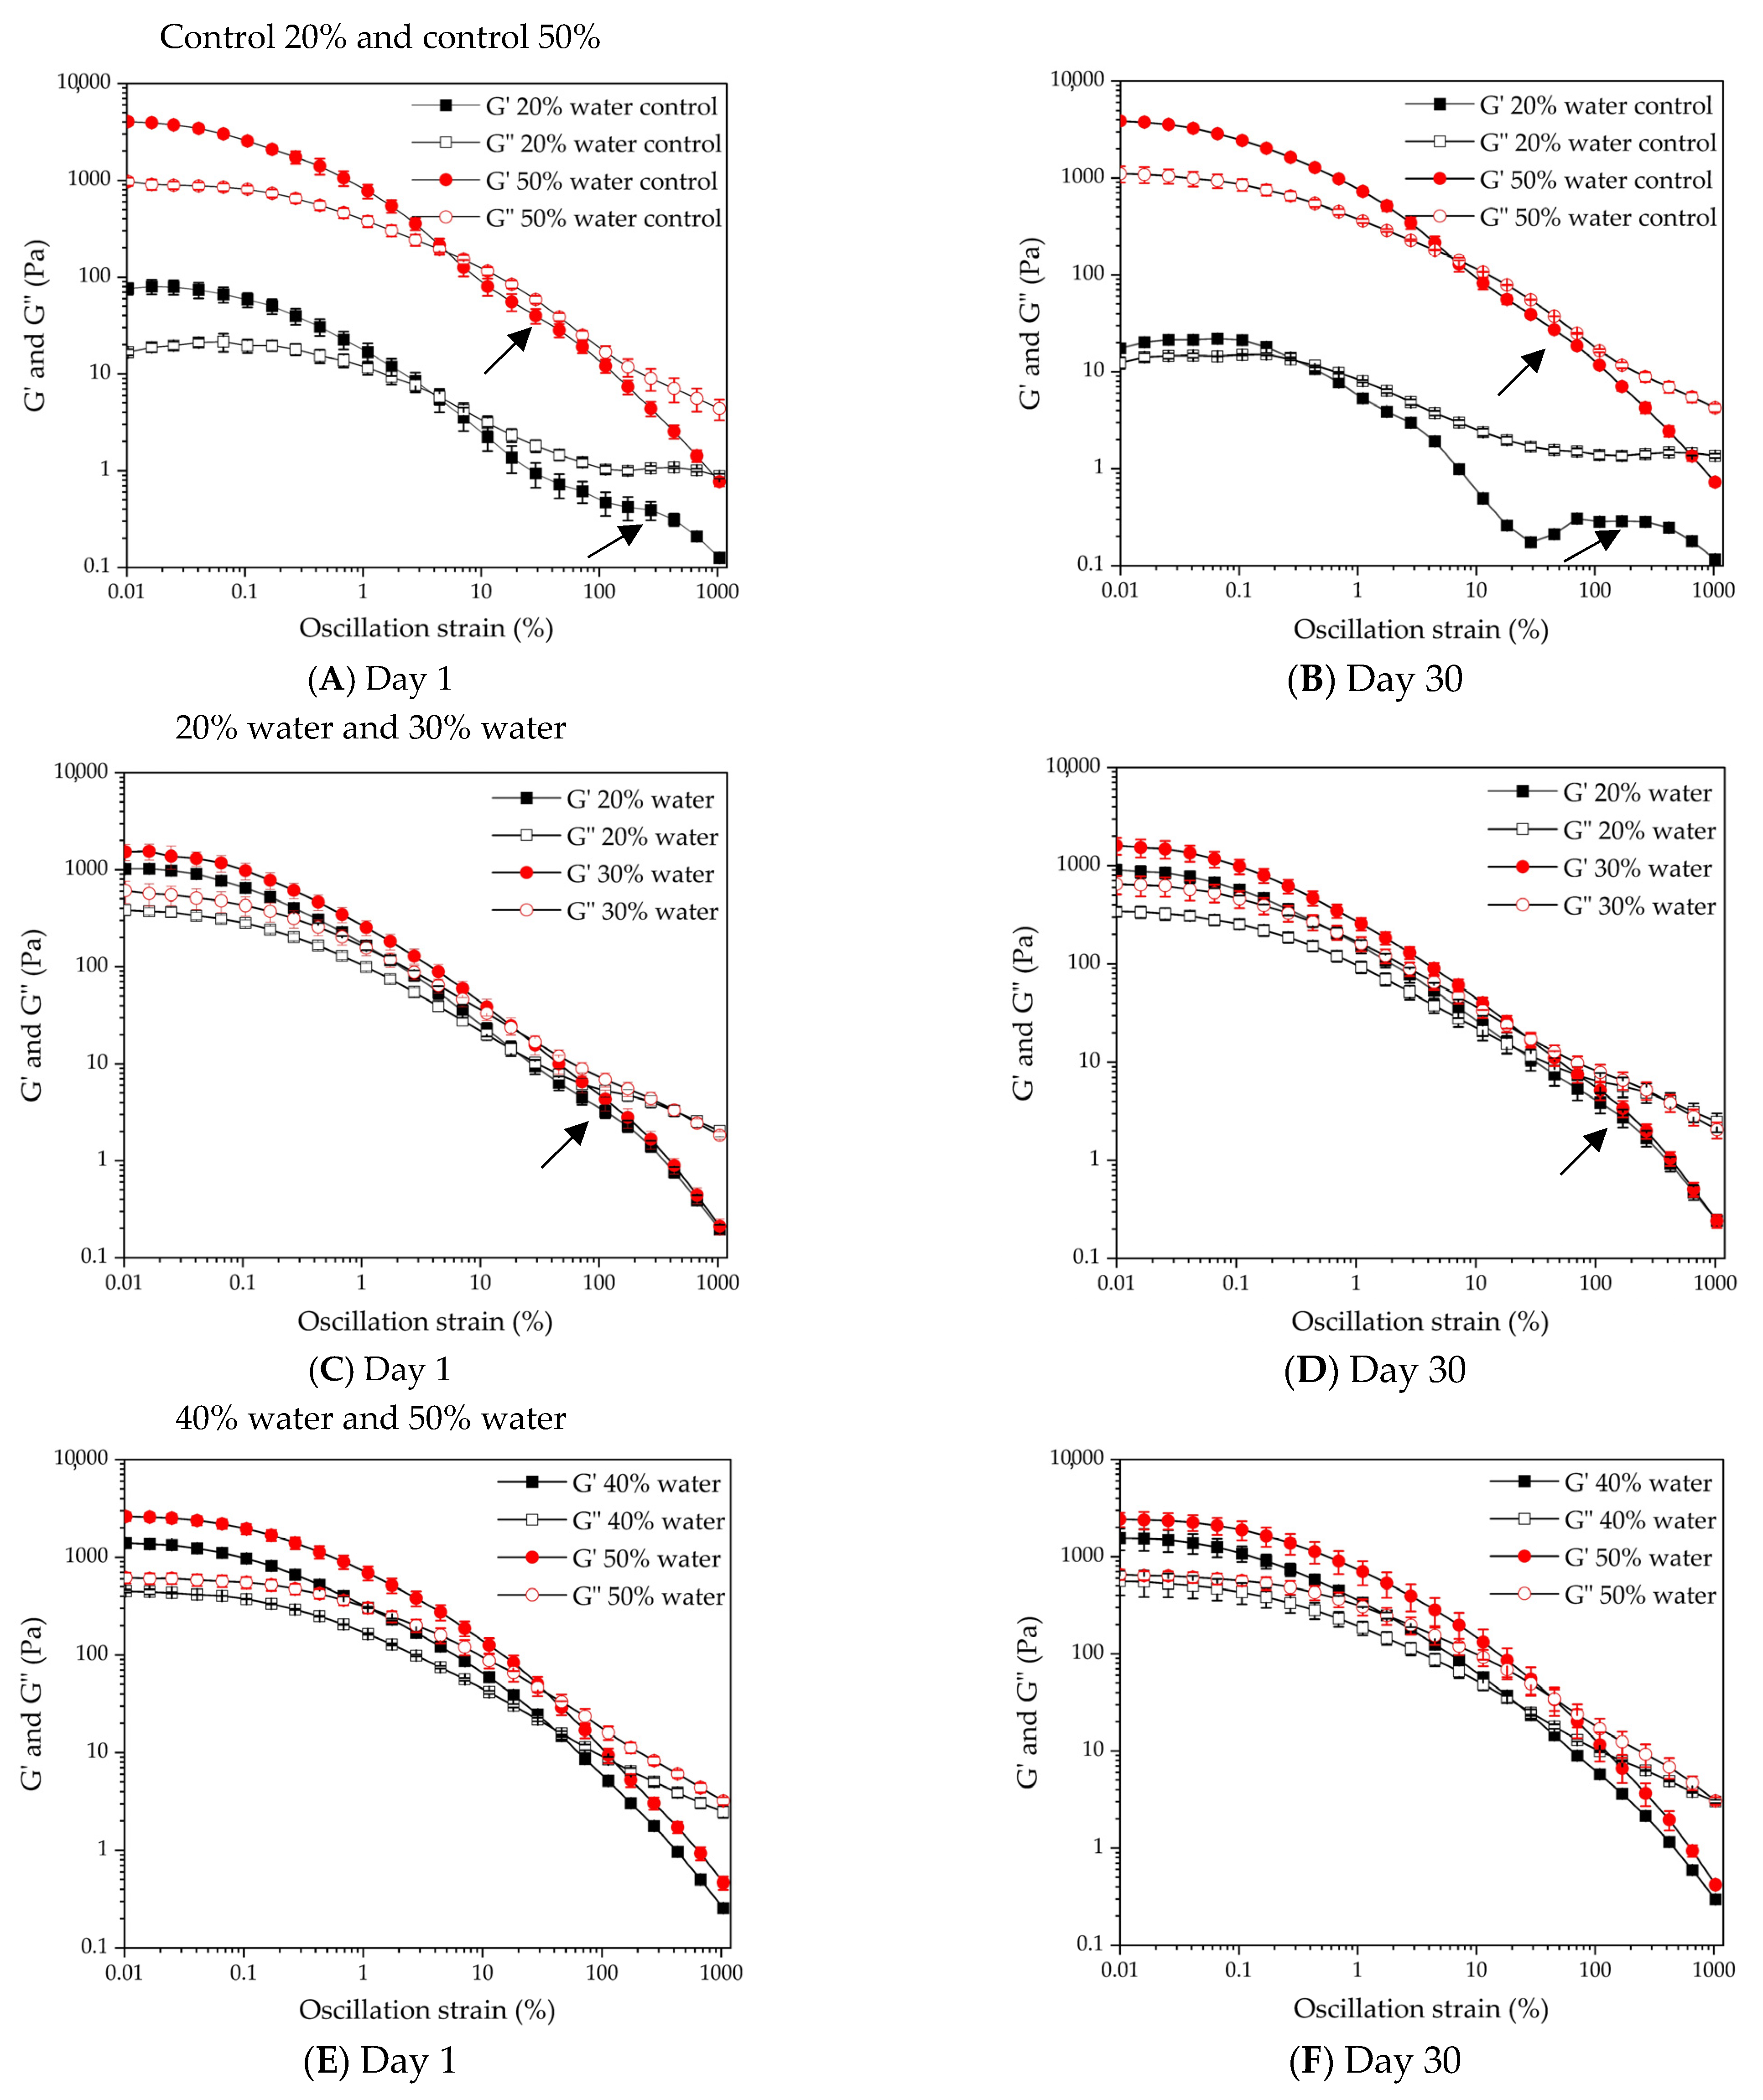
As a function of oscillatory strain, all emulsions showed higher storage (G’) than loss moduli (G’’) in the low-strain regime before crossover of G’ and G’’ (Figure 4). Interestingly, a very brief linear viscoelastic region (LVR) was observed below 0.1% strain, and G’ dropped almost continuously as a function of strain. On day 1, for the control emulsions (without LMP in the water droplets) with 20 wt.% water, two distinct inflection points in G’ and G’’ were observed—one during the initial yielding and another at a higher strain (arrow in Figure 4A)—indicating a two-step yielding behavior. After 30 days (Figure 4B), the control 20 wt.% water emulsions exhibited a significant lowering of G’ and G’’, with more than an order of magnitude lowering in the crossover strain; however, the second peak in G’ at high strain (arrow in Figure 4B) became much more prominent than in the 1-day-old emulsion. Two-step yielding in emulsion rheology is a well-known phenomenon; however, its origin and the associated structural transformation are still unclear [18]. It is commonly believed that the first yielding is associated with network rupture, while the second yielding is due to a breakdown of clusters. Using this theory, Vargas et al. [19] proposed that the two-step yielding in their water-in-waxy-crude-oil emulsions could be due to the breakdown of the wax crystal network, followed by the rupture of attractive water droplet clusters. In the present case, it can be proposed that the first yielding of the emulsion could be due to the breakdown of the HSO crystal network, which was followed by a second yielding due to the rupture of the water droplet aggregates. Previously it has been shown that the presence of GMO at the water droplet interface promotes a shift in the surface activity of HSO crystals, leading to the formation of Pickering crystals on individual droplets and crystal bridges between the droplets [3,10]. Such crystal bridges could lead to water droplet aggregates and, hence, a two-step yielding. After 30 days, the sharp drop in the first yielding and a prominent peak in the second for 20 wt.% water control emulsions could be associated with destabilization of water droplets, leading to a release of free water during cluster rupture.
The control 50 wt.% water emulsions showed a significant increase in both G’ and G’’ (Figure 4A) compared to the control 20 wt.% water emulsions; however, the two-step yielding behavior was almost absent. Although a faint peak could be observed in the G’ of the control 50 wt.% water emulsions at a lower strain than the 20 wt.% emulsions (shown by arrows in Figure 4A), this did not change after 30 days (Figure 4B). The disappearance of two-step yielding upon the increase in gel strength in dense suspension was also reported by Kramb and Zukoski [20] for hard-sphere suspensions, and by Tang and Ghosh [21] for oil-in-water emulsions. It was proposed that if a gel is too hard due to attractive interactions among the droplets, it may break apart in a single step. In the present case, the interaction of 50 wt.% water and fat crystals created a close-pack structure, forming a highly concentrated system vulnerable to shear force and breaking the crystal network and associated water droplet aggregates.
All emulsions with LMP in the water droplets showed similar viscoelastic behavior (Figure 4C–F), where G’ was higher than G” in the low-strain regime, and both of the moduli dropped with an increase in strain with a narrow LVR below 0.1% strain. For 20 and 30 wt.% water emulsions (Figure 4C,D), a small peak in G’ and G” was observed just above 100% strain; however, for 40 and 50 wt.% water emulsions, no peak in G’ and G” beyond crossover was observed, indicating a stronger droplet–crystal interaction, which broke down in one step. The most striking difference in viscoelastic behavior was observed for 20 wt.% water emulsions with or without LMP in the aqueous phase, which can be related to more mobility of droplets and a weaker network, or less aggregated water droplets without LMP in the aqueous phase. The incorporation of LMP significantly increased the gel strength of the emulsions; however, the two-step yielding behavior was significantly reduced, suggesting that LMP promotes better or firmer water droplet packing, strengthening the 3D network.
3.3.2. Comparison of Emulsion G’ Values
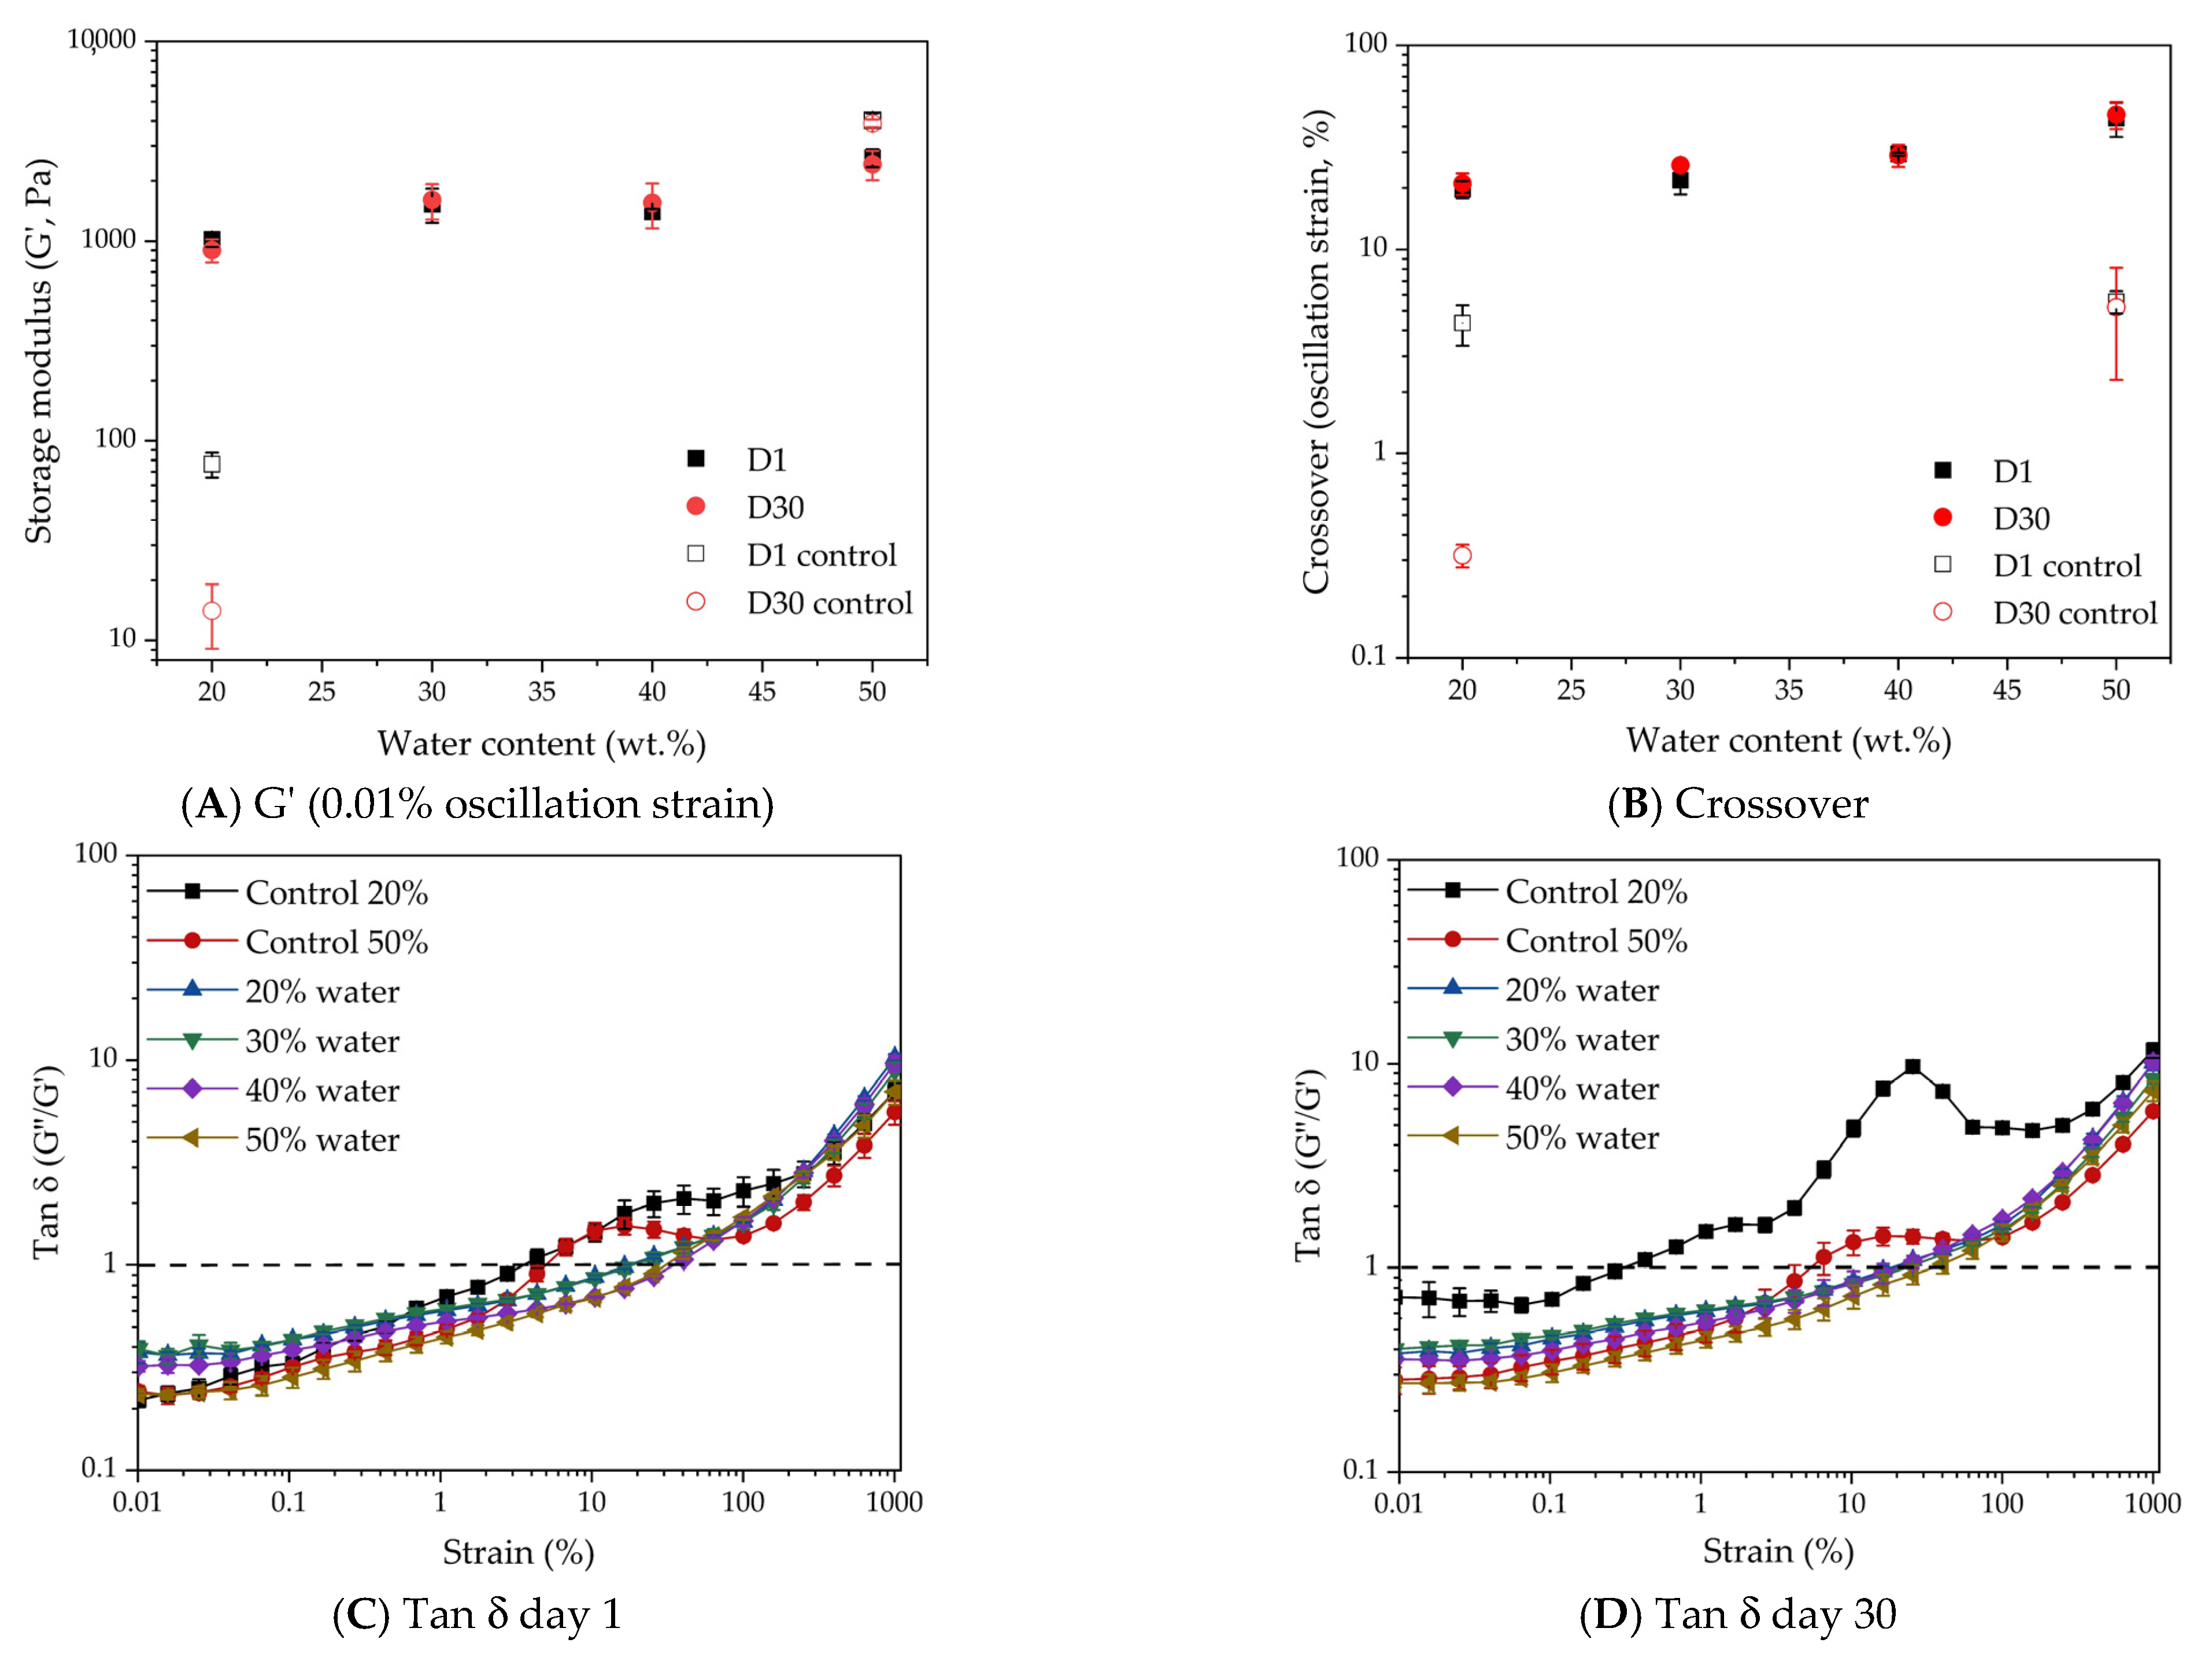
Although oscillatory rheology did not show a strong LVR, to compare the gel strength of the various emulsions, their G’ at 0.01% strain was replotted as a function of water content and LMP’s addition to the water droplets on day 1 and day 30 (Figure 5A). On day 1, the lowest G’ was identified in control emulsions with 20 wt.% water, which could be related to partial water droplet destabilization without LMP and lower water content (Figure 5A). Water droplet destabilization was also responsible for a significant gel strength drop for control 20 wt.% water emulsions after 30 days. Control emulsions with 50 wt.% water showed the highest G’, associated with the highest water content and packing of water droplets and fat crystals, which remained similar on day 1 and after storage (p > 0.05). This may be associated with the phase separation in the sample (Figure 1C), presenting a strongly aggregated fat phase with high gel strength.
All emulsions with LMP demonstrated a progressive increase in G’ (1023–1404 Pa) with the rise of water content from 20 to 40 wt.%, although no significant change was observed for 30 and 40 wt.% water (p > 0.05), which could be related to reaching a steady state in the water droplet structure. However, 50 wt.% water emulsions showed a significant increase in G’ (2619.2 ± 271.4 Pa) compared to the other emulsions (p < 0.05). Close packing of LMP-added water droplets and their aggregation could be related to the increase in gel strength. The water droplets essentially acted as an active filler in the continuous fat crystal network [14]. At 50 wt.% water, the aggregated water droplets formed a near close-packing structure in the fat crystal network, leading to a superior gel strength to that of all other water contents. Emulsion gel strength did not change much after storage. Iqbal et al. [9] reported an increase in the gel strength of W/O emulsions with a rise in water content from 10 to 30 wt.%, implying that gels become more rigid with greater droplet concentration, as would be projected for a network of aggregated droplets. Based on the theoretical rheological analysis of gels, the shear modulus is proportional to the dispersed phase volume fraction (ϕ), droplet diameter, and the attractive forces among the droplets, relying on the strength and the number of the bonds between the droplets. However, similar to our observations, from 30 to 40 wt.% water, the gel strength remained the same, which was not fully explained by the authors. They also observed an increase in gel strength after heating the emulsions containing WPI in the aqueous phase. As WPI undergoes heat-induced denaturation and subsequent aggregation, the authors suggested that droplet–droplet interactions were promoted by gelation of the internal aqueous phase, where proteins from one droplet interact with proteins in the other water droplets.
3.3.3. Comparison of Emulsion Crossover Strains
The crossover strain in rheology is defined as the strain required for gel breakdown, where G’ = G’’ (Figure 5B). Control emulsions with 20 and 50 wt.% water showed the lowest crossover on day 1 (p > 0.05), which could be due to the absence of LMP, leading to droplet destabilization. After 30 days, the crossover of 20 wt.% water control emulsions further decreased, while no change was observed for 50 wt.% water. Such drop in crossover strain for control 20 wt.% water emulsions could be due to water droplet destabilization-induced flow (visual observation in Figure 1B,C). LMP emulsions’ crossover strain increased with an increase in water content and was higher than the control emulsions’ crossover strain. Higher water content led to more droplet aggregation and packing, which in turn required higher force in order to break down the gel structure. The presence of LMP also led to LMP–GMO interaction at the interface, which further enhanced the droplet–droplet interaction and, hence, the force required to break the gel structure. After 30 days, no significant change in crossover strain was observed, indicating an unchanged emulsion structure.
3.3.4. Emulsion Tan δ as a Function of Strain
The tan δ (G’’/G’) values as a function of strain at a constant frequency on day 1 and day 30 are shown in Figure 5C,D. When tan δ < 1, the emulsion showed an elastic behavior. Tan δ = 1 reveals a gel breakdown point under strain, whereas higher than 1 indicates a viscous behavior. On day 1, all emulsions showed tan δ < 1 below 1% strain, indicating dominant elastic behavior. Control emulsions with 20 and 50 wt.% water exhibited a tan δ = 1 at a lower strain (~3%) compared to the LMP emulsions, indicating an early transformation into more viscous behavior under the applied strain (Figure 5C). LMP emulsions with 20 and 30 wt.% water exhibited a transition from elastic to viscous at ~18%. In contrast, for the emulsions with 40 and 50 wt.% water, this transition was observed at ~35%, indicating stronger gels that break down at higher stress. After aging, the gel transition point moved to a lower strain (Figure 5D). Control emulsions with 20 wt.% water showed the largest drop (10 times) in strain required for gel breakdown (tan δ = 1), at ~0.3%. Control emulsions with 50 wt.% water reported a slight rise in tan δ = 1 at 5% strain compared to day 1, indicating possible gel hardening. LMP emulsions with 20 wt.% showed no significant change with the strain-induced transition from elastic into viscous behavior. An increase in the strain required for the transition was exhibited with 30 wt.% water (~28% strain). In contrast, a slight decrease was observed for 40 wt.% water, with the transition at ~29% strain, and for 50 wt.% water at ~32 % strain. Overall, upon storage, LMP emulsions exhibited more elastic behavior than the control emulsions under higher strain.
3.4. Microstructure of Emulsions
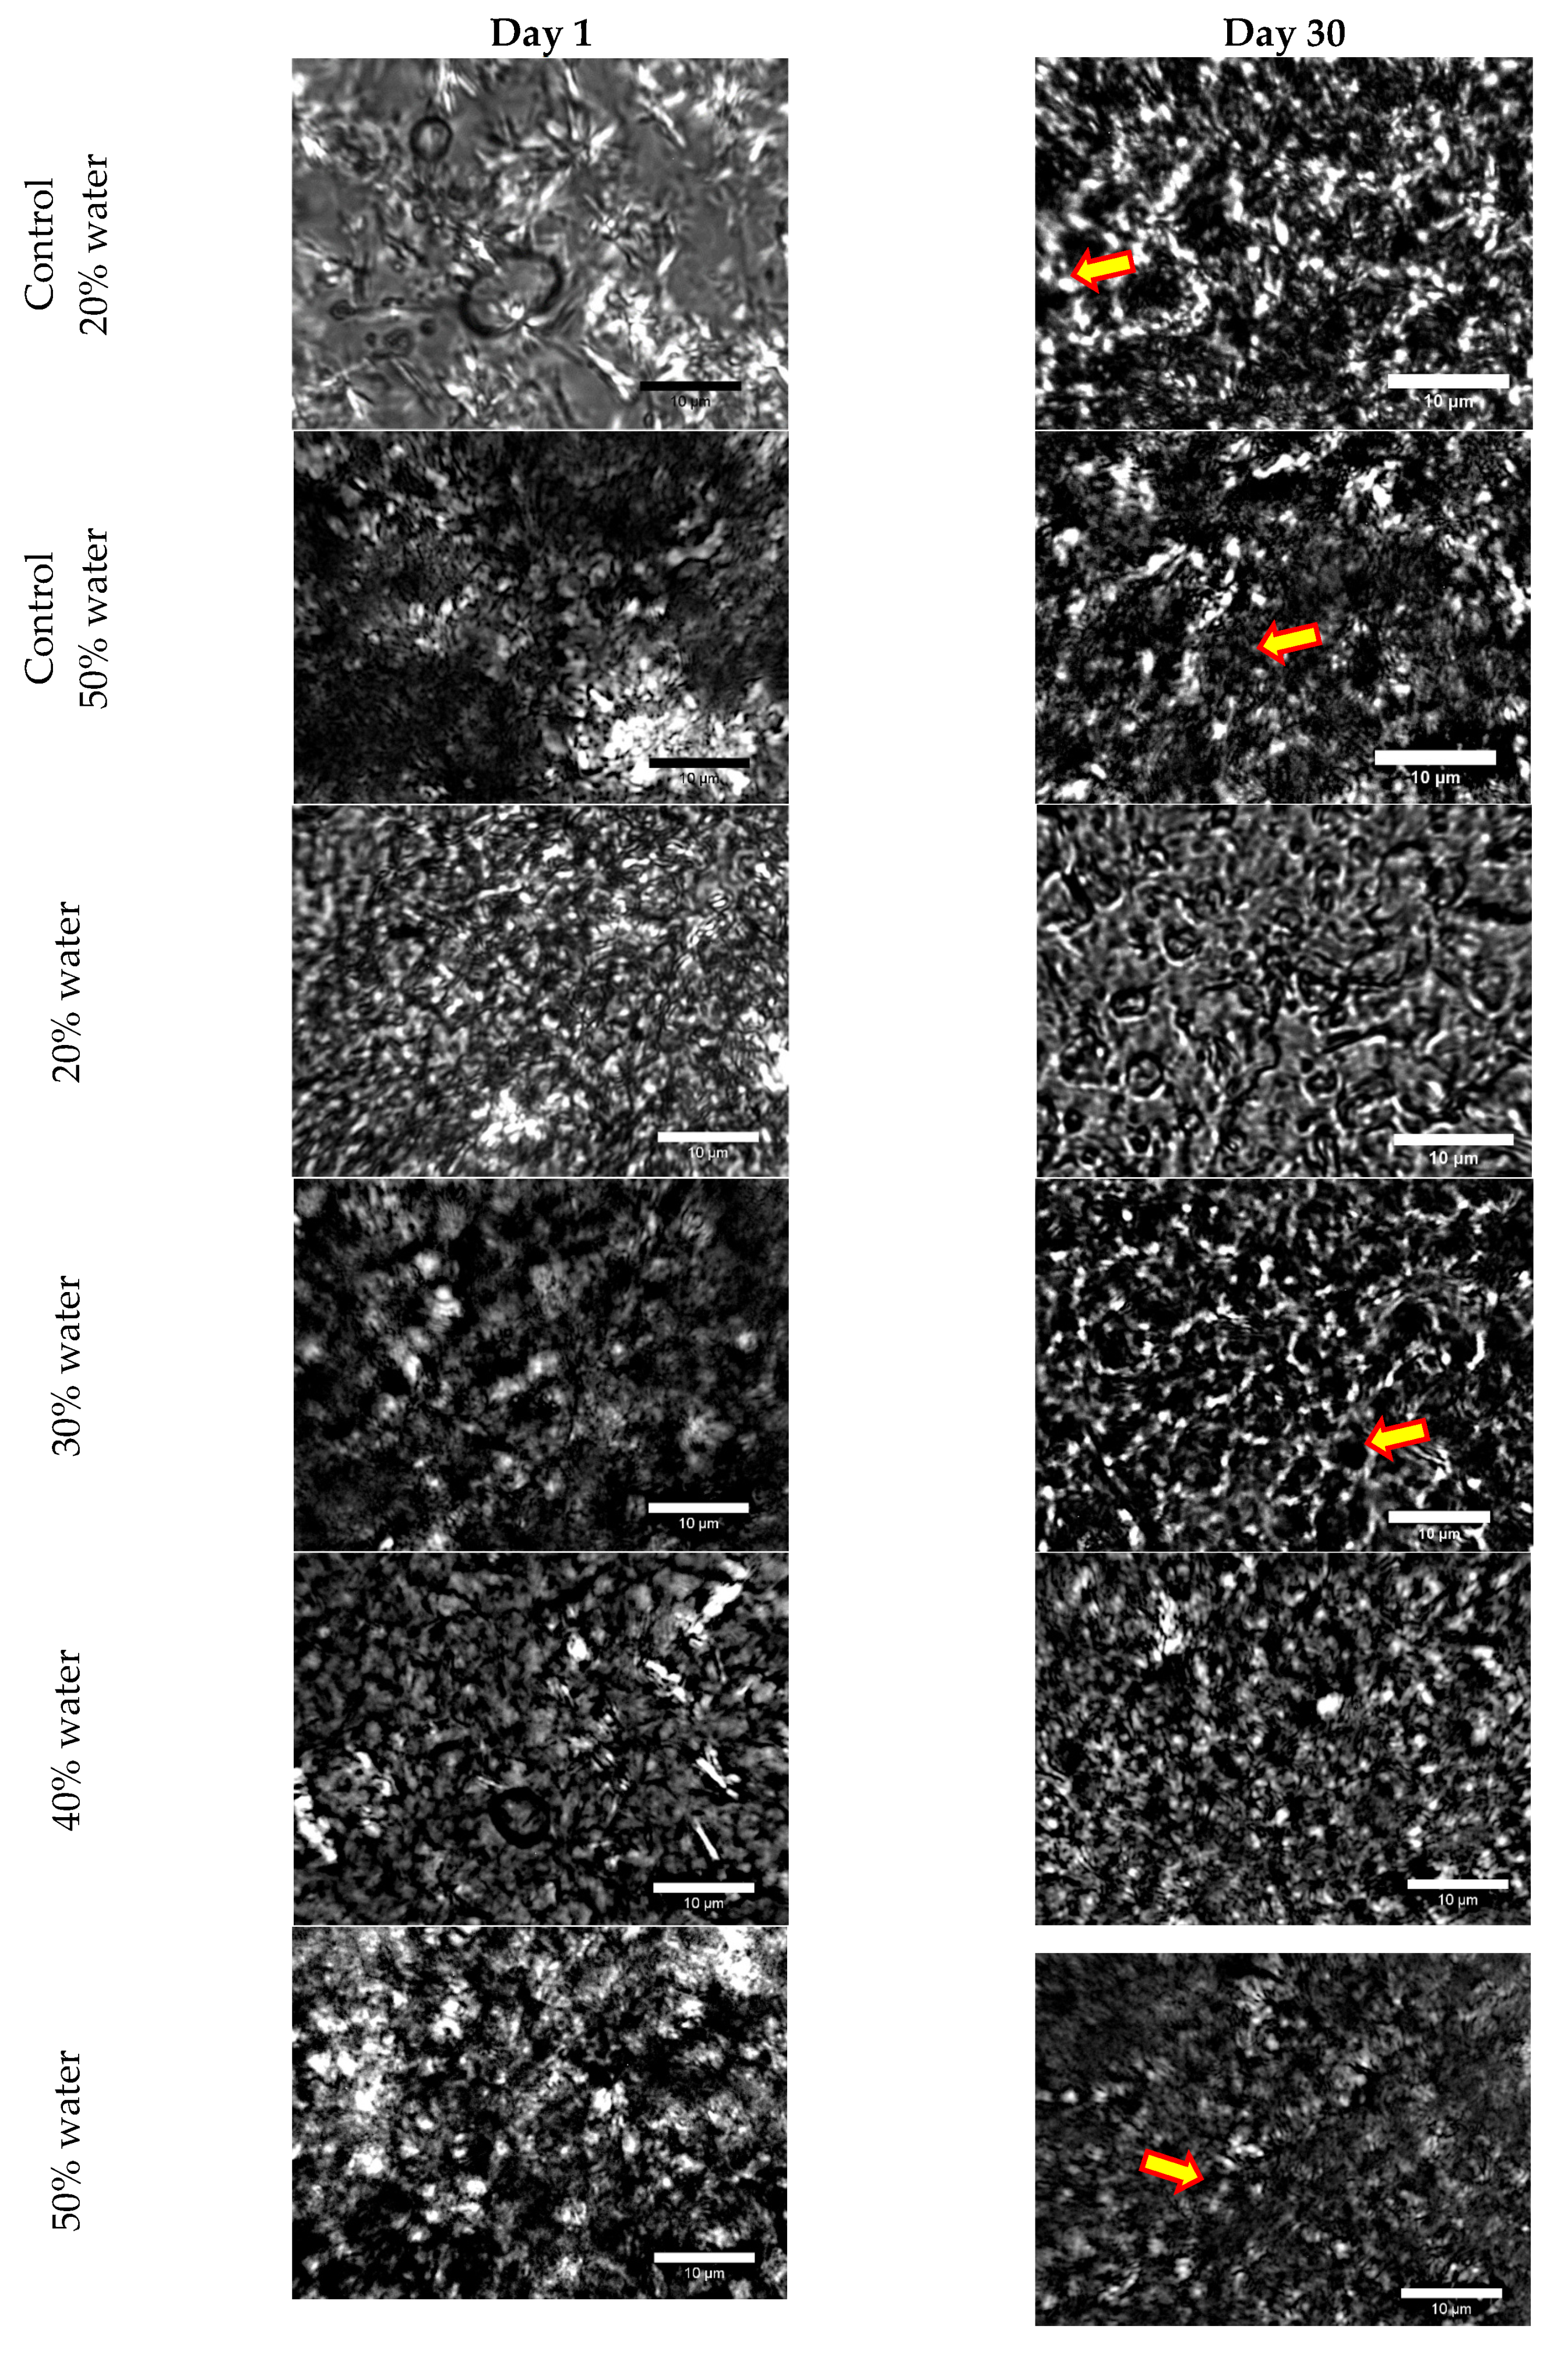
All of the emulsion microstructures are illustrated in Figure 6. All of the images show HSO fat crystals absorbed at the oil–water interface via the Pickering stabilization mechanism, which is observed as small crystals covering the droplets (arrows in Figure 6). Moreover, accumulated crystal structures of different sizes can be observed in the continuous phase. Rousseau’s group also found similar observations in 15 and 20 wt.% W/O emulsions using 10 wt.% HSO, noticing water droplets aggregated or covered with fat crystals as shells [14]. They also reported that 14.4 wt.% HSO in 20 wt.% W/O emulsions exhibited large crystal aggregates measuring from 10 to 40 μm without any change over time [13]. The images of control emulsions with 20 wt.% water revealed both aggregated and free water droplets in the continuous phase, and a few evidence of coalescence-induced large droplets. The water droplets’ shape was deformed in a few positions at the interface in all emulsion images as a sign of crystallization at the interface. The increase in water content (30, 40, and 50 wt.%) in all emulsions led to more packing and compactness of water droplets, which could be related to increased viscosity and viscoelasticity as a function of water content. Not much change in emulsion microstructure can be observed on day 30, except a sign of a brighter crystal network related to crystal growth during storage.
3.5. Emulsion Stability Analysis from Their Thermal Behaviour
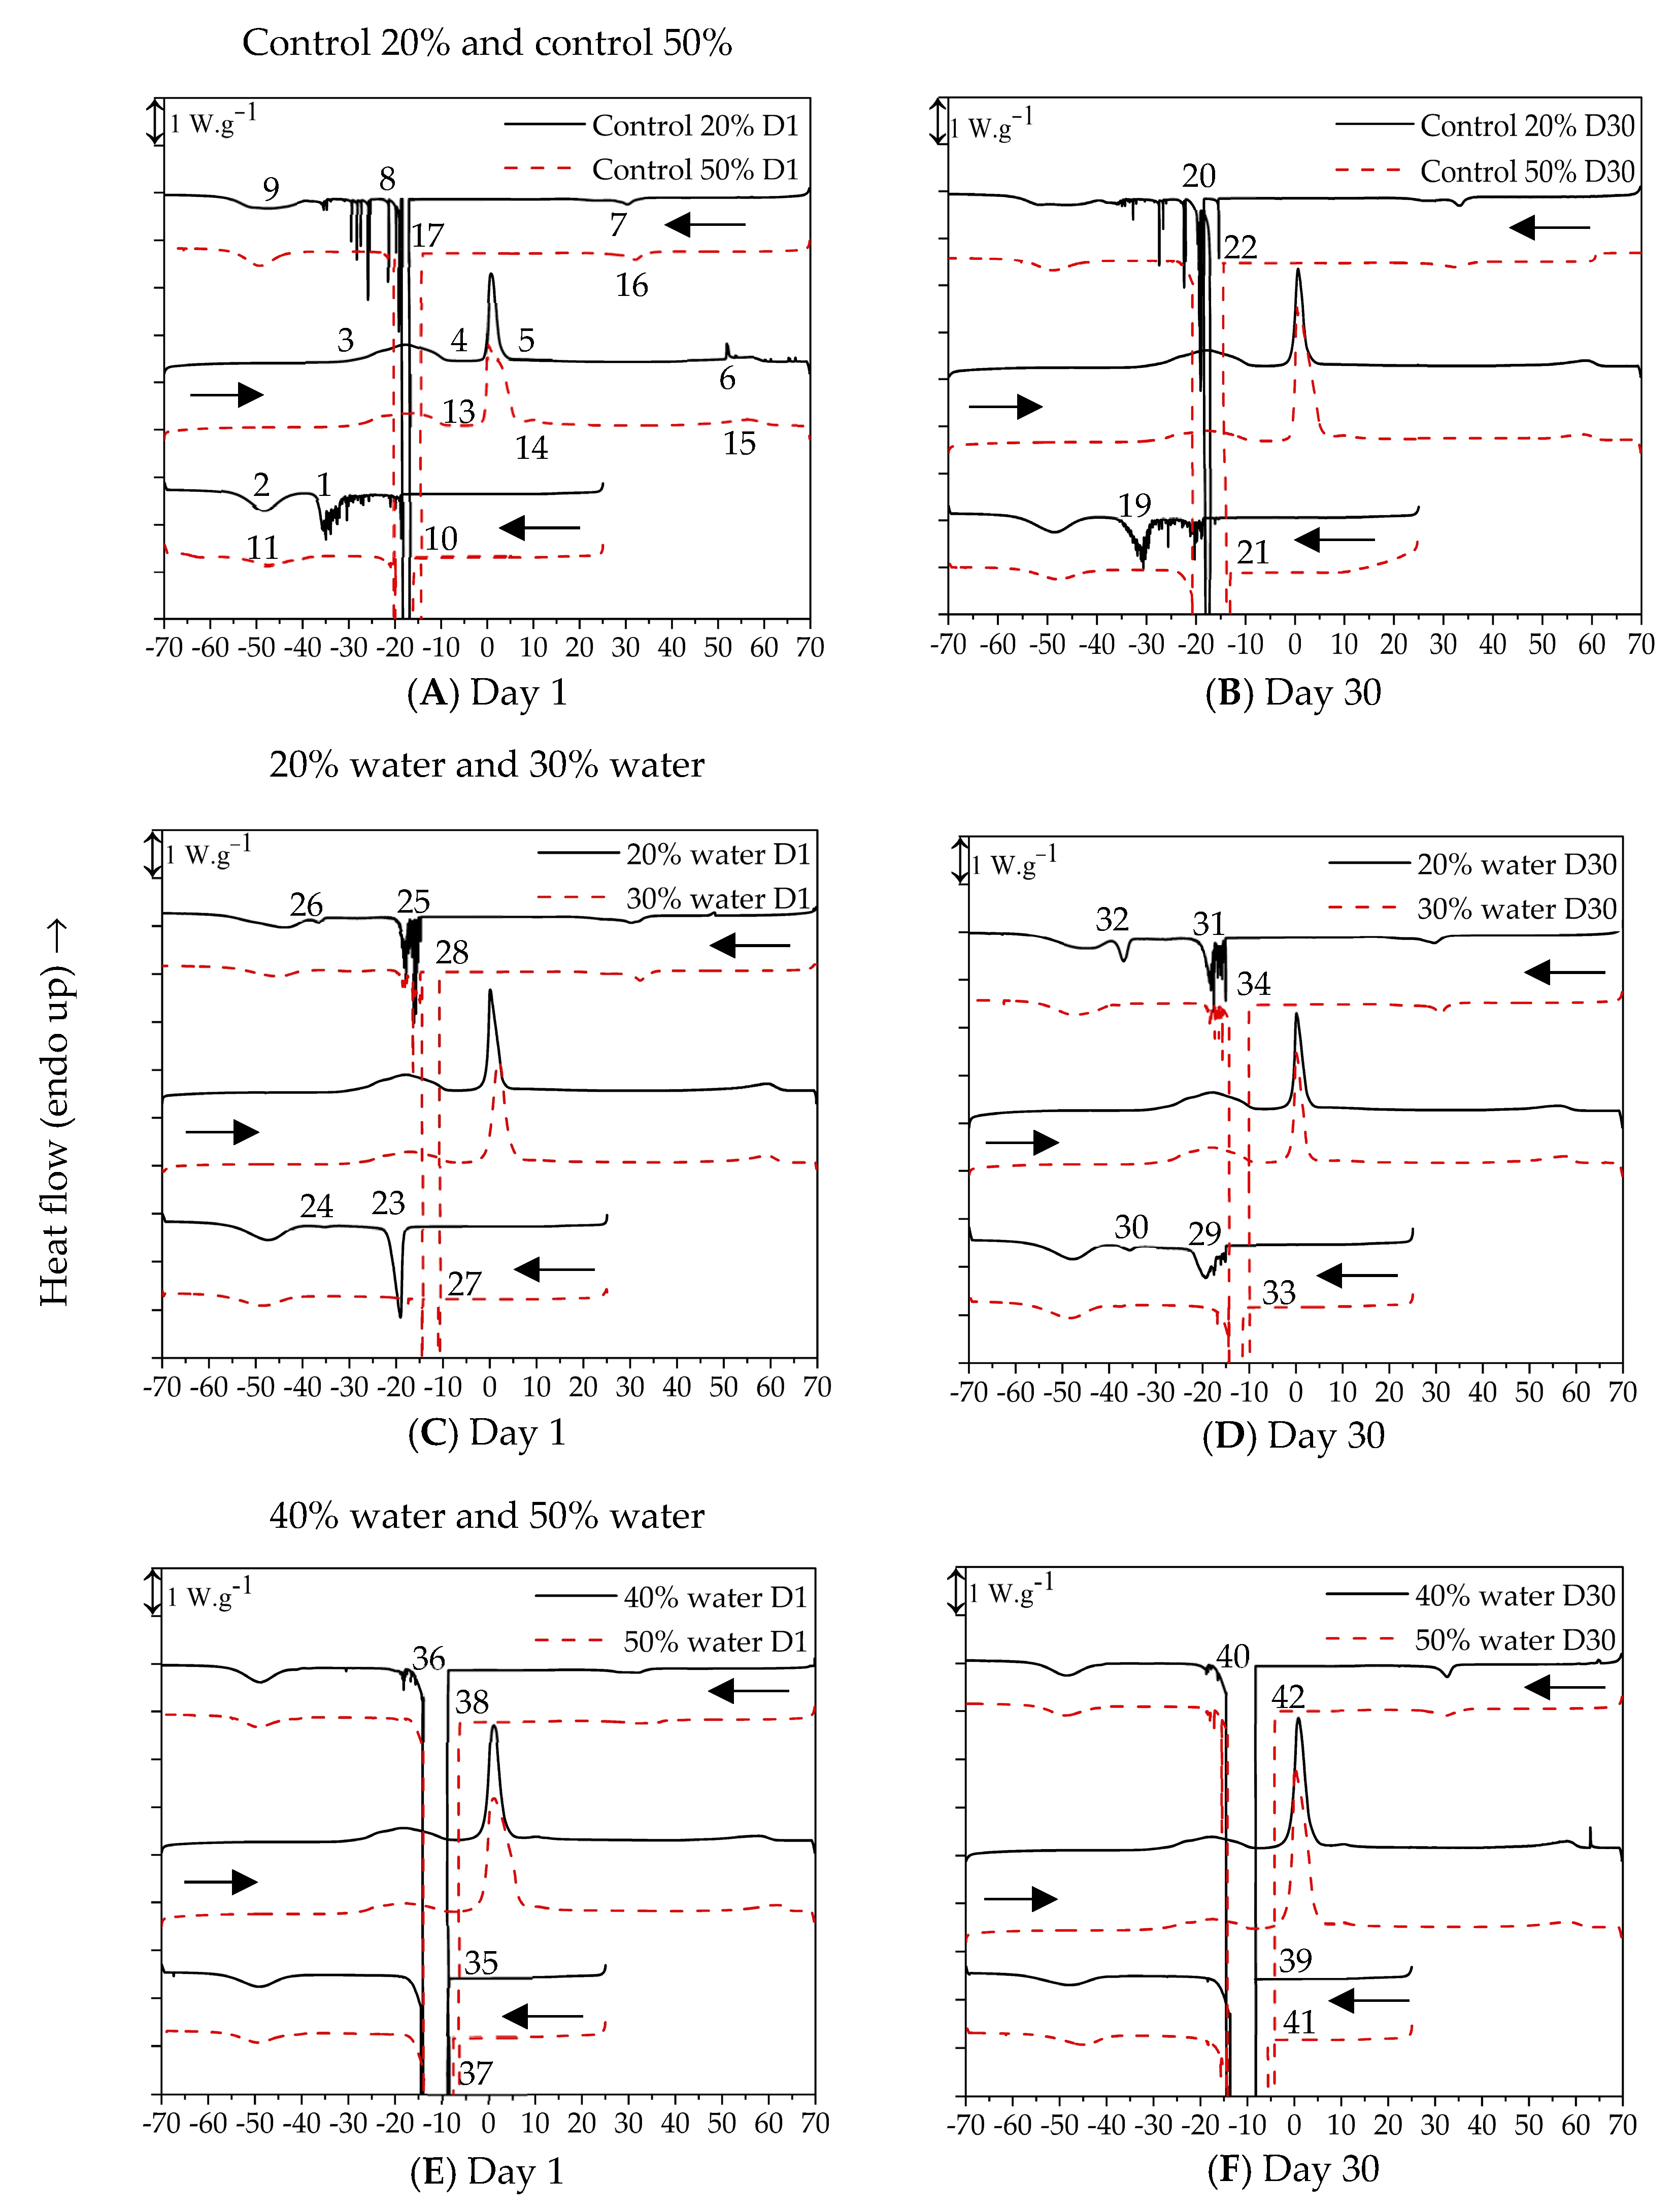
All emulsions were subjected to freeze/thaw cycles in DSC to understand their dispersed phase stability better. Thermal cycles included a cooling from 25 °C to −70 °C, heating to 70 °C, and a second cooling to −70 °C at 5 °C/min (Figure 6). On day 1, control emulsions with 20 wt.% water (Figure 7A) showed small peaks at around −18 °C due to partially destabilized large water droplets, and again between −27 and −37 °C (peak 1), attributed to the crystallization of smaller water droplets, indicating stable emulsion. After the dispersed phase crystallization, the continuous phase CO crystallized at −50 °C (peak 2). During heating, CO melted between −35 and −8 °C (peak 3), the ice melted between −2 and 5 °C (peak 4), GMO melted between 10 and 16 °C (peak 5), and HSO melted between 50 and 60 °C (peak 6). The second cooling scan exhibited HSO crystallization at 30 °C (peak 7). A large water bulk crystallization peak and several small, dispersed water droplet crystallization peaks between −16 and −36 °C (peak 8) were related to a partial emulsion destabilization. The dispersed droplets’ crystallization peaks appeared at a higher temperature in the second cooling cycle than the first cooling cycle due to the increase in water droplet size due to the melting of stabilizing HSO crystals. The second cooling cycle also showed CO crystallization at −50 °C (peak 9). Control emulsions with 50 wt.% water (Figure 7A) demonstrated a large water crystallization peak from −15 to −20 °C in the first cooling cycle (peak 10), responsible for destabilized bulk water crystallization, followed by CO crystallization (peak 11). During the heating cycle, CO melted at peak 12, followed by ice melting (peak 13), GMO melting (peak 14), and HSO melting (peak 15). The ice melting peak for the control 50 wt.% water emulsions (peak 13) was more significant than that for the control 20 wt.% water emulsions (peak 4), due to the presence of more water in the former. The second cooling scan showed HSO crystallization at 30 °C (peak 16), followed by a large bulk water crystallization peak ranging from −13 to −20 °C (peak 17), which was even larger than the first cooling water crystallization peak (peak 10), indicating extensive water droplet instability, followed by CO crystallization in peak 18.
From the above discussion of DSC freeze/thaw cycles, emulsion stability can be predicted from water crystallization peak analysis. The appearance of multiple emulsified-water droplet crystallization peaks in the first cooling cycle could be ascribed to homogeneous nucleation of water where the impurities are divided among the numerous water droplets, indicating emulsion stability [22]. In contrast, the appearance of a bulk water crystallization peak in the first cooling cycle around −20 °C is a sign of extensive water droplet coalescence and emulsion destabilization. The effect of water droplet size on water crystallization temperature has been studied by Clausse et al. [23,24] via thermogranulometry, where the authors showed that the crystallization temperature increased with an increase in droplet size. Therefore, a water droplet crystallization peak at a higher temperature indicates larger coalesced water droplets. Using a similar DSC methodology, Ghosh, Tran and Rousseau [10] reported a full water droplet destabilization upon heating a 20 wt.% W/O emulsion (4 wt.% GMO and 10 wt.% hydrogenated canola oil), showing a large bulk water crystallization peak during the second cooling cycle at −19 °C. Suppose that a stable emulsion, with droplet crystallization at between −30 and −40 °C, shows a bulk water crystallization peak (at around −20 °C) in the second cooling cycle. In that case, it indicates that the melting of fat crystals during the heating cycle was the emulsion’s main stabilization mechanism. On the other hand, if an emulsion shows stable water droplet crystallization in the second cooling cycle, its stabilization mechanism must be dependent not on fat crystals, but on the emulsifier’s interfacial stability. Such insights from using DSC freeze/thaw cycles make them a powerful technique for predicting the emulsion stabilization mechanism.
For the rest of the DSC thermograms, only the water droplet crystallization peak was identified as being key to understanding emulsion stability. Aged control emulsions (Figure 7B) with 20 wt.% water showed similar water crystallization peaks (peak 19) in the first cooling cycle as in the fresh emulsions, indicating unchanged stability. The second cooling also exhibited a large bulk water peak surrounded by a few smaller peaks (peak 20), indicating partial destabilization related to the day 1 emulsions. Aged control emulsions with 50 wt.% water showed similar large bulk water crystallization peaks in the first and second cooling cycles (peaks 21 and 22, respectively) to the day 1 emulsions, which illustrated extensive emulsion destabilization. Therefore, between the two controls, 20 wt.% water emulsions showed better stability than the 50 wt.% water emulsions.
The thermograms of day 1 and day 30 LMP emulsions are shown in Figure 7C–F. On day 1, LMP emulsions with 20 wt.% water showed water crystallization in a small peak (peak 23) at −18 °C during the first cooling due to crystallization of large water droplets, and a tiny peak at −35 °C (peak 24) due to very small water droplets, indicating stable emulsions (Figure 7C). The second cooling scan illustrated water crystallization at −14 °C (peak 25) with multiple tiny peaks, related to water droplets, followed by another small stable water droplet crystallization peak at −35 °C (peak 26), indicating that the emulsion was able to prevent complete destabilization even by complete melting of the stabilizing HSO crystals. Khudyakov et al. [25] found that pectins can modify the ice morphology during the transition of liquid water to ice. Even a small pectin concentration (0.2 and 0.4 wt.%) exhibited cryoprotective properties in frozen cells’ integrity. In the present case, utilizing water droplet crystallization enthalpy, we calculated that LMP emulsions with 20 wt.% water presented a 65% reduction in the crystallization enthalpy of water droplets in the second cooling cycle (Figure 7A), indicating 65% destabilization due to freeze/thaw, which was much lower than the 93% destabilization for 20 wt.% control emulsions (Figure 7C). This indicates a similar cryoprotective effect associated with LMP incorporation in the emulsion.
LMP emulsions with 30 wt.% water illustrated a large bulk water crystallization peak at −10 °C (peak 27), followed by two small spikes at around −19 °C during the first cooling cycle. The second cooling exhibited destabilized bulk water crystallization at −10 °C, with a large peak and subsequent small peaks until −20 °C (peak 28). This indicates that most water droplets were unstable, but the emulsions did not completely destabilize, even after melting the stabilizing HSO crystals. Aged LMP emulsions with 20 and 30 wt.% water (Figure 7D) showed similar peaks to those observed on day 1 (peaks 29–34), which indicates that the emulsion stability remained unchanged after 30 days of storage.
LMP emulsions with 40 wt.% water (Figure 7E) exhibited water crystallization at around −10 °C during the first cooling scan on day 1 (peak 35). In the second cooling, water crystallized with a similar large peak at around −10 °C, followed by a few tiny peaks related to some very large water droplets (peak 36). LMP emulsions with 50 wt.% water (day 1, Figure 7E) also illustrated a long sharp peak of water crystallization at −10 °C during the first cooling (peak 37), and a similar peak during the second cooling (peak 38), which suggested entirely unstable water droplets. Aged emulsions with 40 wt.% water (Figure 7F) reported similar water crystallization peaks (peak 39) as on day 1, showing that some droplets were still present in the second cooling (peak 40). Moreover, LMP emulsions with 50 wt.% water reported similar water crystallization peaks as on day 1, but with few spikes and peaks that followed the large peaks (peaks 41 and 42), indicating only a few stable water droplets. From the DSC freeze/thaw cycles of emulsions, it is clear that as the water content increased, more water crystallized at a higher temperature, similar to bulk water instead of emulsified water droplets. In highly concentrated emulsions, impurities would be distributed in many droplets, leading to faster heterogeneous nucleation in many droplets. Moreover, as the water droplets were closely packed, crystallization in one droplet could lead to ice crystals rupturing other surrounding droplets’ membranes, leading to interdroplet heterogeneous nucleation and crystallization of all droplets at a higher temperature [22]. Upon melting, the ice crystal bridge between the droplets would lead to collision-mediated coalescence and destabilization of emulsions. Therefore, the ability of the DSC to predict emulsion stability is not quite applicable to concentrated emulsions.
Similar freeze/thaw-induced emulsion destabilization via ice-crystal-induced water droplet collision was also observed by Lin et al. [26]. Aronson and Petko [27] also reported freeze/thaw experiments of 92 wt.% water-in-paraffin-oil emulsion (10 wt.% GMO in the oil phase and magnesium sulfate in the aqueous phase). The emulsion without the salt in the aqueous phase consisted of 90% ice when frozen and could not resist destabilization via the freeze/thaw cycle. During freezing, the water droplets progressively distorted to create ice blocks, breaking the interdroplet oil film and puncturing other water droplets. During thawing, the ice melted, leading to the coalescence of water droplets and emulsion destabilization. In the emulsion with magnesium sulfate in the aqueous phase, 83% ice was formed, while 9% water remained liquid due to salt-induced depression of the freezing point. This emulsion was stable to the freeze/thaw cycle. The authors proposed that the presence of liquid water wetted the ice crystals and provided protection against fusion among the ice crystals from adjacent water droplets.
3.6. Solid Fat Content of Emulsions
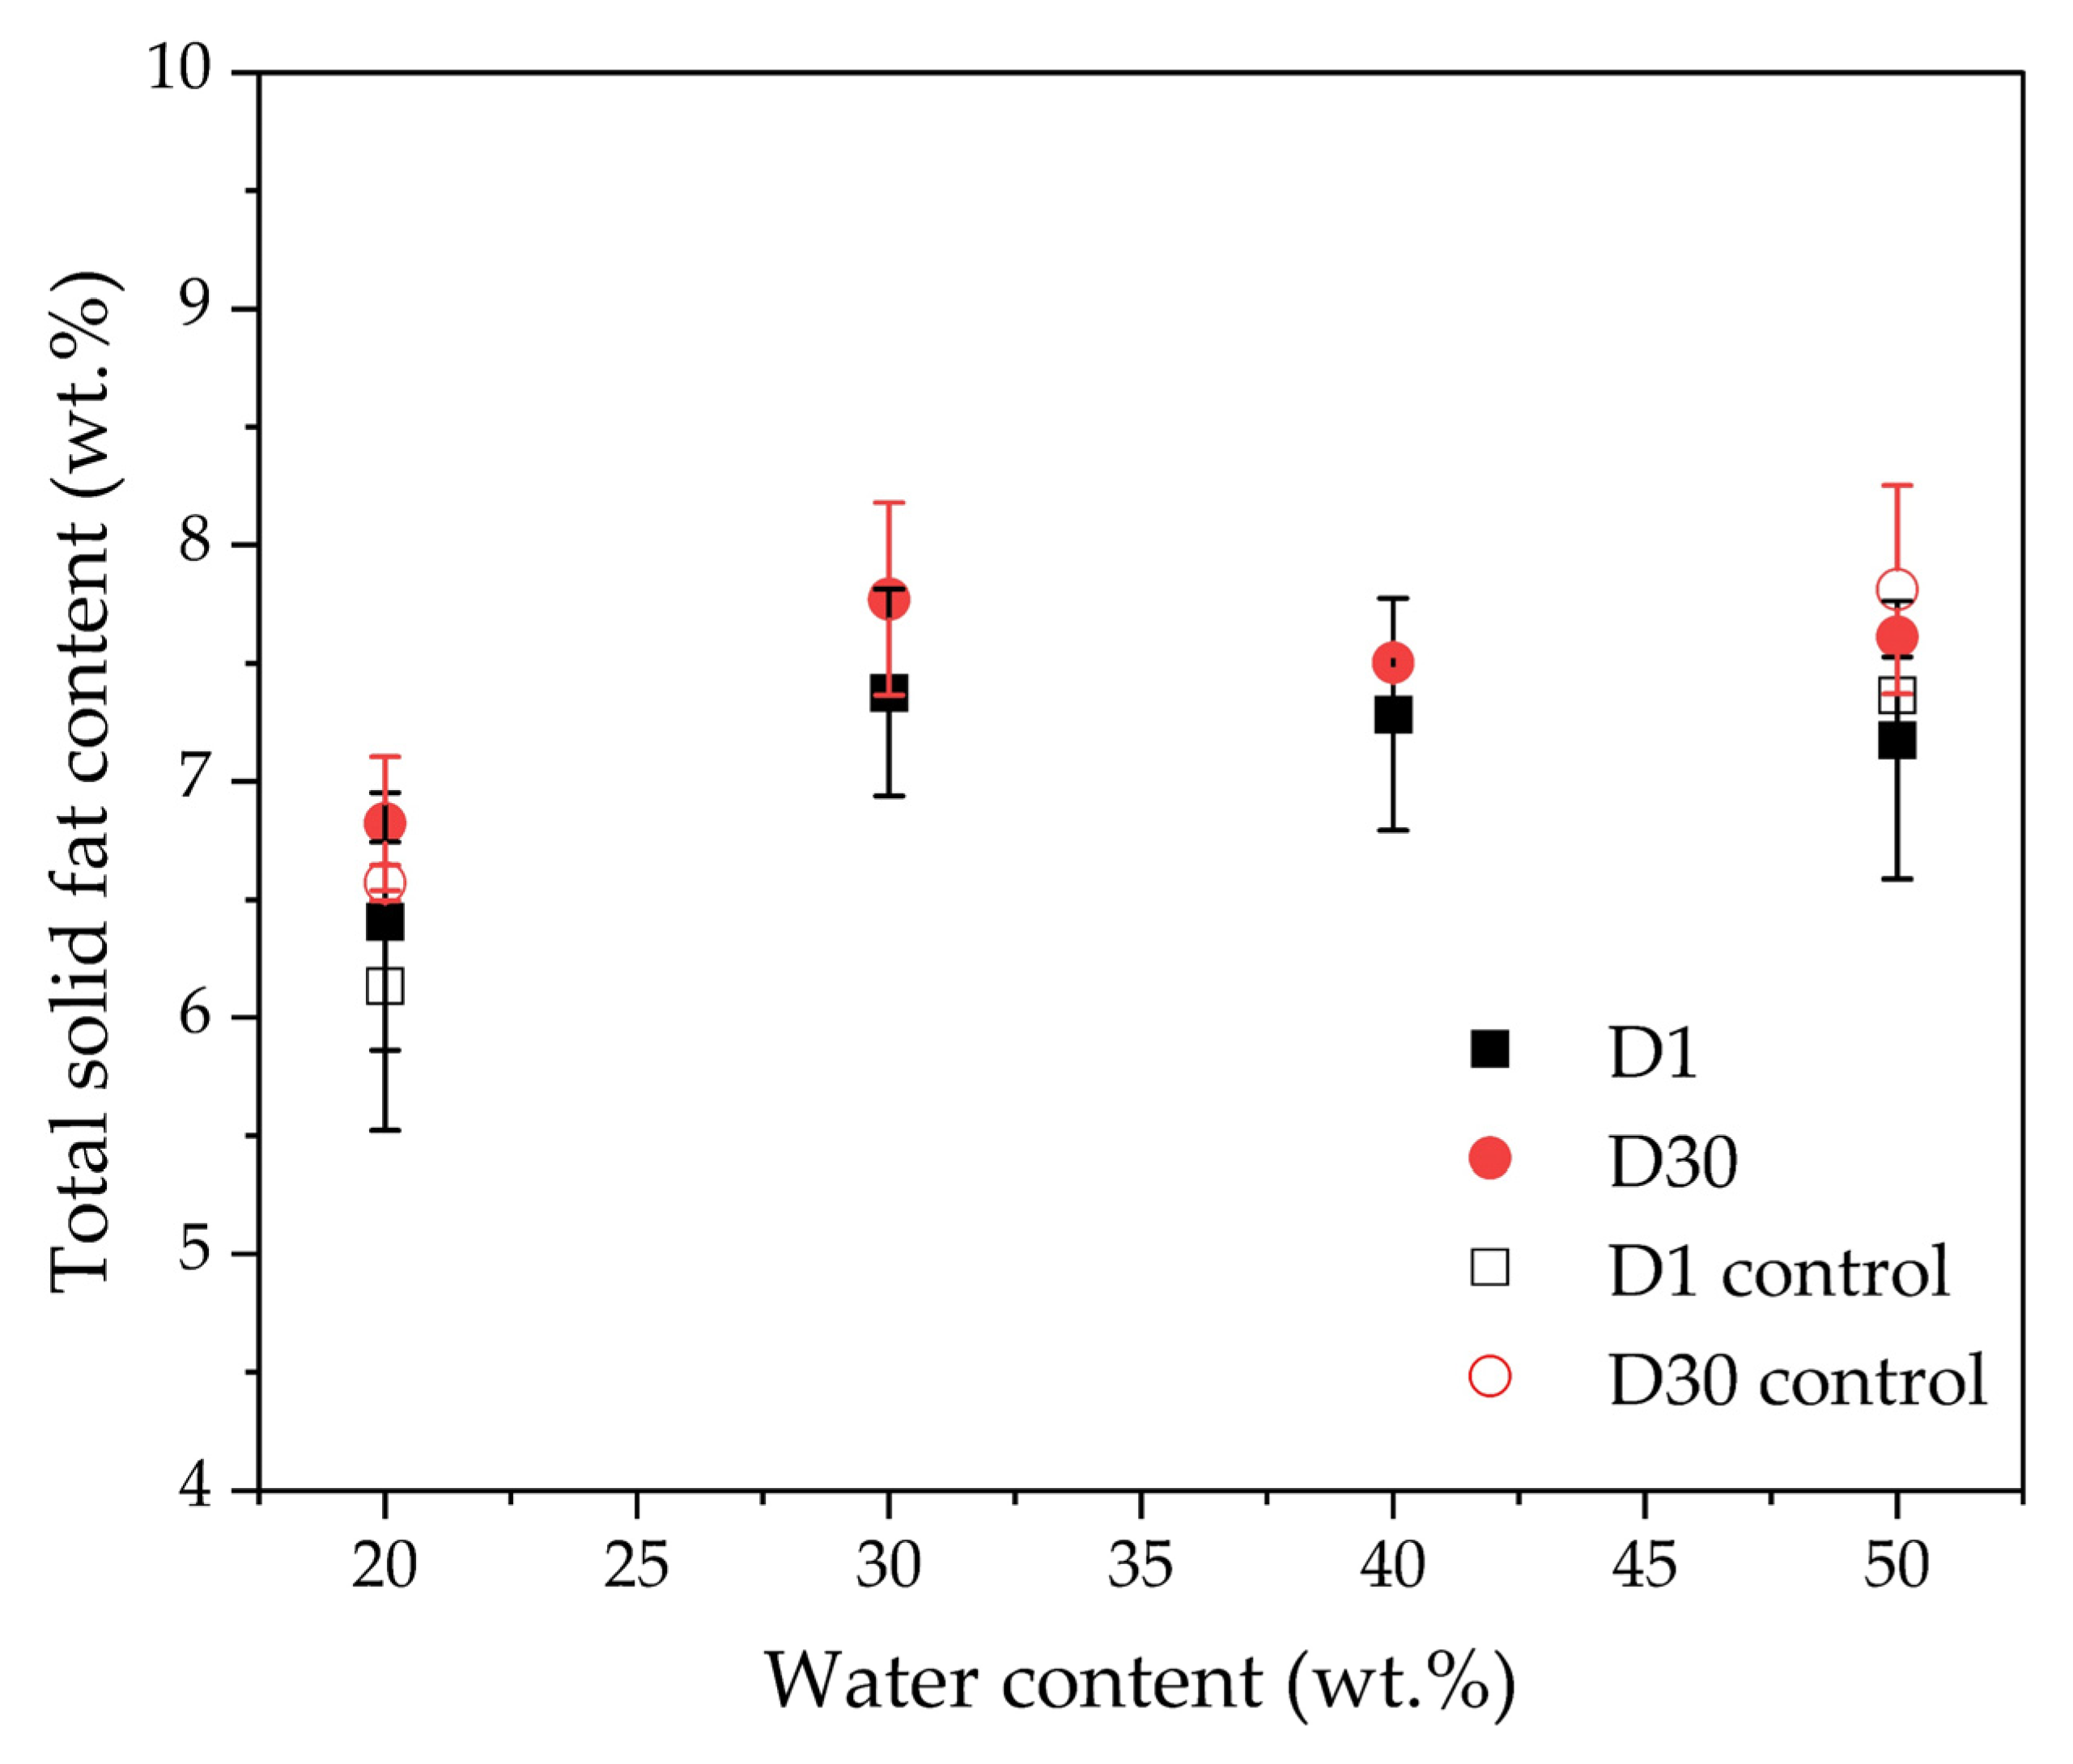
The viscoelastic properties of the W/O emulsions originate from the presence of water droplets and the fat crystal network in the continuous phase and around the water droplets. To investigate the effect of water content on emulsion viscoelasticity, we kept the amount of HSO constant in all of the emulsions (7 wt.%). However, depending on the water content, the amount of GMO varied. The amount of total solid fat in the emulsions at 4 °C also varied based on the solubility of HSO in CO [10]. Therefore, the emulsions’ solid fat content at 4 °C was determined by measuring the solid fat enthalpies using a DSC (Figure 8). On day 1, all emulsions showed solid fat content ranging from 6.4 ± 0.5 wt.% to 7.4 ± 0.4 wt.% (p > 0.05). After 30 days, solid fat content increased in all emulsions (6.8 ± 0.3 wt.% to 7.8 ± 0.4 wt.%), although it was not significant (p > 0.05). Such an increase over time could be due to crystal growth. Similar results have been reported by Ghosh and Rousseau [28] using hydrogenated canola oil with an initial solid fat content of ~ 6 wt.% in fresh emulsions. After 4 weeks, the solid fat content increased to 7 wt.%. The authors implied that in fresh emulsions, GMO’s presence might hinder the packing of saturated fatty acids into crystal lattices [28]. In this study, the increase in solid fat content of more than 7 wt.% could be due to partial GMO crystallization at the water droplet surface. The DSC thermograms of all emulsions showed a GMO melting peak at around 10 °C; we also observed GMO crystallization at around 13 °C from CO in the bulk oil phase (data not shown). The minor increase in solid fat content could also be due to water evaporation during storage. Emulsions slowly destabilize over time due to water droplet coalescence, and the free water is more accessible to evaporate during storage leading to a slight increase in solid fat content. However, such a minor increase in solid fat content would not significantly influence emulsion viscoelasticity for various emulsions; therefore, the change in the water volume fraction is the most important factor for the variation in emulsions’ viscoelasticity.
4. Discussion
It should be mentioned that the presence of continuous phase fat crystal network is critical for W/O emulsion elasticity, as the emulsions made without HSO in the oil phase were liquid and destabilized with extensive water droplet sedimentation (data not shown). However, in the present system, rather than the fat crystal network in the continuous phase (the amount of HSO was constant in all emulsions), the amount of water and the water droplets’ stability were more critical in providing a stable elastic system that did not flow under gravity. Such a highly concentrated water-in-vegetable-oil emulsion stabilized with GMO, with high stability and gel strength at a lower saturated fat concentration, is a difficult system to stabilize. The role of aqueous phase LMP in stabilizing the GMO-coated water droplets was one of the most critical aspects in developing such systems with close-packed water droplets, which could be used in the development of low-fat table spreads.
5. Conclusions
GMO-stabilized water-in-canola-oil emulsions with self-supporting structures and highly elastic properties were developed with water content increments from 20 to 50 wt.%, LMP addition in the aqueous phase, and the presence of a minimum amount of saturated fat crystals (HSO) in the continuous phase. The appearance of fresh and 30-day-aged emulsions showed no spreading on Petri dishes, and complete stability without any flow or phase separation in glass vials. The emulsions’ apparent viscosity at a low shear rate (0.1 s−1) increased with water content, which was modelled with a modified Pal equation. Emulsion gel strength and crossover strain for gel breakdown also increased with water content. Control emulsions without LMP in the water droplets showed lower gel strength than the LMP emulsions at 20 wt.% water, though their gel strength was comparable at 50 wt.% water. However, both of the control emulsions’ crossover strain was significantly lower than that of the LMP-added emulsions, indicating that the less stable control emulsion gels could break down at a lower strain. The DSC freeze/thaw cycle was used for an improved understanding of water droplet stability. The control emulsions were stable on day 1, but water droplet destabilization increased significantly during aging. LMP emulsions with 20 wt.% water showed stable water droplets during freeze/thaw cycles even after melting HSO, indicating lesser role of fat crystals in providing emulsion stability at a lower water content when the water droplets were stabilized by LMP. However, with the increase in water, DSC showed partial destabilization of water droplets in LMP emulsions, although the emulsions were stable, indicating that the DSC method was not suitable at high water contents. Overall, it was possible to develop GMO-stabilized, non-flowable, elastic W/VO emulsions with high gel strength using a close-packed structure of water droplets, where the LMP in the aqueous phase acted as an essential interfacial stabilizing agent of GMO. Such elastic W/VO emulsions could be utilized to reduce the fat content in margarine-type tablespreads.
Author Contributions
Conceptualization, S.G.; methodology, M.R.-P. and S.G.; software, M.R.-P.; validation, M.R.-P. and S.G.; formal analysis, M.R.-P.; investigation, M.R.-P.; resources, S.G.; data curation, M.R.-P.; writing—original draft preparation, M.R.-P.; writing—review and editing, S.G.; visualization, S.G.; supervision, S.G.; project administration, S.G.; funding acquisition, S.G. All authors have read and agreed to the published version of the manuscript.
Funding
This research was funded by NSERC Discovery Grant.
Data Availability Statement
Data can be made available upon request.
Conflicts of Interest
The authors declare no conflict of interest. The funders had no role in the design of the study, in the collection, analyses, or interpretation of data, in the writing of the manuscript, or in the decision to publish the results.
References
- Beri, A.; Norton, J.; Norton, I. Effect of emulsifier type and concentration, aqueous phase volume and wax ratio on physical, material and mechanical properties of water in oil lipsticks. Int. J. Cosmet. Sci. 2013, 35, 613–621. [Google Scholar] [CrossRef] [PubMed]
- Rousseau, D. Aqueous droplets as active fillers in oil-continuous emulsions. Curr. Opin. Food Sci. 2020, 22, 173–186. [Google Scholar] [CrossRef]
- Ghosh, S.; Rousseau, D. Fat crystals and water-in-oil emulsion stability. Curr. Opin. Colloid Interface Sci. 2011, 16, 421–431. [Google Scholar] [CrossRef]
- Scherze, I.; Knoth, A.; Muschiolik, G. Effect of Emulsification Method on the Properties of Lecithin- and PGPR-Stabilized Water-in-Oil-Emulsions. J. Dispers. Sci. Technol. 2006, 27, 427–434. [Google Scholar] [CrossRef]
- McClements, D.J. Food Emulsions: Principles, Practices, and Techniques; CRC Press: Boca Raton, FL, USA, 2015. [Google Scholar]
- Hodge, S.; Rousseau, D. Flocculation and coalescence in water-in-oil emulsions stabilized by paraffin wax crystals. Food Res. Int. 2003, 36, 695–702. [Google Scholar] [CrossRef]
- Ushikubo, F.Y.; Cunha, R.L. Stability mechanisms of liquid water-in-oil emulsions. Food Hydrocoll. 2014, 34, 145–153. [Google Scholar] [CrossRef]
- Haj-shafiei, S.; Ghosh, S.; Rousseau, D. Kinetic stability and rheology of wax-stabilized water-in-oil emulsions at different water cuts. J. Colloid Interface Sci. 2013, 410, 11–20. [Google Scholar] [CrossRef]
- Iqbal, S.; Hameed, G.; Baloch, M.K.; McClements, D.J. Formation of semi-solid lipid phases by aggregation of protein microspheres in water-in-oil emulsions. Food Res. Int. 2012, 48, 544–550. [Google Scholar] [CrossRef]
- Ghosh, S.; Tran, T.; Rousseau, D. Comparison of Pickering and Network Stabilization in Water-in-Oil Emulsions. Langmuir 2011, 27, 6589–6597. [Google Scholar] [CrossRef]
- Acevedo, N.C.; Marangoni, A.G. Functionalization of non-interesterified mixtures of fully hydrogenated fats using shear processing. Food Bioprocess. Technol. 2014, 7, 575–587. [Google Scholar] [CrossRef]
- Schindelin, J.; Arganda-Carreras, I.; Frise, E.; Kaynig, V.; Longair, M.; Pietzsch, T.; Cardona, A. Fiji: An open-source platform for biological-image analysis. Nat. Methods 2012, 9, 676–682. [Google Scholar] [CrossRef] [Green Version]
- Rafanan, R.; Rousseau, D. Dispersed droplets as tunable fillers in water-in-oil emulsions stabilized with fat crystals. J. Food Eng. 2019, 244, 192–201. [Google Scholar] [CrossRef]
- Rafanan, R.; Rousseau, D. Dispersed droplets as active fillers in fat-crystal network-stabilized water-in-oil emulsions. Food Res. Int. 2017, 99, 355–362. [Google Scholar] [CrossRef] [PubMed]
- Pal, R. New Generalized Viscosity Model for Non-Colloidal Suspensions and Emulsions. Fluids 2020, 5, 150. [Google Scholar] [CrossRef]
- Pal, R. New models for the viscosity of nanofluids. J. Nanofluids 2014, 3, 260–266. [Google Scholar] [CrossRef]
- Pal, R. Novel viscosity equations for emulsions of two immiscible liquids. J. Rheol. 2001, 45, 509–520. [Google Scholar] [CrossRef]
- Ahuja, A.; Potanin, A.; Joshi, Y.M. Two step yielding in soft materials. Adv. Colloid Interface Sci. 2020, 282, 1021799. [Google Scholar] [CrossRef] [PubMed]
- Vargas, G.G.; Soares, E.J.; Thompson, R.L.; Sandoval, G.A.B.; Andrade, R.M.; Campos, F.B.; Teixeira, A. Emulsion effects on the yield stress of gelled waxy crude oils. Fuel 2018, 222, 444–456. [Google Scholar] [CrossRef]
- Kramb, R.C.; Zukoski, C.F. Yielding in dense suspensions: Cage, bond, and rotational confinements. J. Phys. Condens. Matter 2010, 23, 035102. [Google Scholar] [CrossRef] [PubMed]
- Tang, Y.R.; Ghosh, S. Stability and rheology of canola protein isolate-stabilized concentrated oil-in-water emulsions. Food Hydrocoll. 2021, 113, 106399. [Google Scholar] [CrossRef]
- Ghosh, S.; Rousseau, D. Freeze–thaw stability of water-in-oil emulsions. J. Colloid Interface Sci. 2009, 339, 91–102. [Google Scholar] [CrossRef] [PubMed]
- Clausse, D.; Gomez, F.; Dalmazzone, C.; Noik, C. A method for the characterization of emulsions, thermogranulometry: Application to water-in-crude oil emulsion. J. Colloid Interface Sci. 2005, 287, 694–703. [Google Scholar] [CrossRef]
- Clausse, D.; Gomez, F.; Pezron, I.; Komunjer, L.; Dalmazzone, C. Morphology characterization of emulsions by differential scanning calorimetry. Adv. Colloid Interface Sci. 2005, 117, 59–74. [Google Scholar] [CrossRef]
- Khudyakov, A.N.; Kuleshova, L.G.; Zaitseva, O.O.; Sergushkina, M.I.; Vetoshkin, K.A.; Polezhaeva, T.V. Effect of Pectins on Water Crystallization Pattern and Integrity of Cells during Freezing. Biopreserv. Biobank. 2019, 17, 52–57. [Google Scholar] [CrossRef]
- Lin, C.; He, G.; Dong, C.; Liu, H.; Xiao, G.; Liu, Y. Effect of oil phase transition on freeze/thaw-induced demulsification of water-in-oil emulsions. Langmuir 2008, 24, 5291–5298. [Google Scholar] [CrossRef]
- Aronson, M.P.; Petko, M.F. Highly concentrated water-in-oil emulsions: Influence of electrolyte on their properties and stability. J. Colloid Interface Sci. 1993, 159, 134–149. [Google Scholar] [CrossRef]
- Ghosh, S.; Rousseau, D. Triacylglycerol interfacial crystallization and shear structuring in water-in-oil emulsions. Cryst. Growth Des. 2012, 12, 4944–4954. [Google Scholar] [CrossRef]
Figure 1.
Stability of water-in-oil emulsions with different water volume fractions (20, 30, 40, and 50 wt.%) prepared with 1.5 wt.% LMP or without LMP for control emulsions, GMO, and 7 wt.% HSO. Petri dish on day 1 (A) and day 30 (B). Glass tube test flipped 90 degrees in parallel with the plane surface on day 30 (C).

Figure 2.
Apparent viscosity of 1.5 wt.% LMP solution and 7 wt.% HSO in canola oil on day 1 (A). Viscosity as a function of shear rate for water-in-oil emulsions with different water contents of 20, 30, 40, and 50 wt.%, prepared with and without LMP, GMO, and HSO on day 1 (B) and day 30 (C). Apparent viscosity of water-in-oil emulsions with different water contents of 20, 30, 40, and 50 wt.%, prepared with and without LMP, GMO, and HSO on day 1 and day 30, at low (0.1 s−1) shear rate (D) and at high (100 s−1) shear rate (E). Note the difference in y-axis scales due to the variation in shear rates.

Figure 3.
Modelling the relative viscosity of LMP emulsions containing 20–50 wt.% water and 7 wt.% HSO using the modified Pal model (Equation (3)) for day 1 (ϕm = 0.85) and day 30 (ϕm = 0.62).
Figure 3.
Modelling the relative viscosity of LMP emulsions containing 20–50 wt.% water and 7 wt.% HSO using the modified Pal model (Equation (3)) for day 1 (ϕm = 0.85) and day 30 (ϕm = 0.62).

Figure 4.
Storage (G′) and loss moduli (G′′) as a function of oscillation strain for water-in-oil emulsions with water contents from 20 to 50 wt.% and 1.5 wt.% LMP in the aqueous phase. Control emulsions were made without LMP in the aqueous phase. Data collected on day 1 (A,C,E) and day 30 (B,D,F) are shown for control emulsions (A,B), 20 and 30 wt.% water emulsions (C,D), and 40 and 50 wt.% water emulsions (E,F). The arrows in some figures indicate peaks in G′.

Figure 5.
Storage modulus (G′) at 10% of oscillation strain (A), crossover (% strain) (B), and the values of tan δ on day 1 and day 30 (C,D, respectively) of water-in-oil emulsions as a function of oscillation strain with different water volume fractions prepared with LMP, GMO, and HSO on day 1 (D1) and day 30 (D30). Note the difference in y-axis scales due to the variation of analysis.

Figure 6.
Polarized light with bright-field micrographs of water-in-canola-oil emulsions on day 1 and day 30 for control emulsions without LMP with 20 and 50 wt.% water and for LMP emulsions with 20 to 50 wt.% water. Scale bar 10 μm. Arrows indicate interfacial fat crystals around the water droplets.

Figure 7.
DSC freeze/thaw thermograms of water-in-oil emulsions under aging (on day 1 and day 30) for control emulsions with 20 and 50 wt.% water without LMP (A,B) and 20, 30, (C,D) 40, and 50 wt.% (E,F) water emulsions with LMP. Samples were cooled from 25 °C to −70 °C, and then heated to 70 °C, followed by a second cooling to −70 °C, at a rate of 5 °C/min. Arrows indicate the direction of the temperature cycle. Important peaks are identified with numbers and are discussed in the text.

Figure 8.
The solid fat content of water-in-oil emulsions on day 1 (D1) and day 30 (D30). Control emulsions were prepared without any LMP in the aqueous phase.
Figure 8.
The solid fat content of water-in-oil emulsions on day 1 (D1) and day 30 (D30). Control emulsions were prepared without any LMP in the aqueous phase.


Table 1.
W/O emulsion composition for all water contents in 100 g. The last two rows show the composition of control W/O emulsions without LMP in the aqueous phase. LMP: low methoxyl pectin; CO: canola oil; HSO: fully hydrogenated soybean oil; GMO: glycerol monooleate.
Table 1.
W/O emulsion composition for all water contents in 100 g. The last two rows show the composition of control W/O emulsions without LMP in the aqueous phase. LMP: low methoxyl pectin; CO: canola oil; HSO: fully hydrogenated soybean oil; GMO: glycerol monooleate.
| Water (g) | LMP in Water (g) | CO (g) | HSO in CO (g) | GMO in CO (g) | GMO: Aqueous Phase Ratio |
|---|---|---|---|---|---|
| 20 | 0.30 | 71.40 | 7.0 | 1.30 | 0.065 |
| 30 | 0.45 | 60.60 | 7.0 | 1.95 | 0.065 |
| 40 | 0.60 | 49.80 | 7.0 | 2.60 | 0.065 |
| 50 | 0.75 | 39.00 | 7.0 | 3.25 | 0.065 |
| 20 | 0 | 71.70 | 7.0 | 1.30 | 0.065 |
| 50 | 0 | 39.75 | 7.0 | 3.25 | 0.065 |
Publisher’s Note: MDPI stays neutral with regard to jurisdictional claims in published maps and institutional affiliations. |
© 2021 by the authors. Licensee MDPI, Basel, Switzerland. This article is an open access article distributed under the terms and conditions of the Creative Commons Attribution (CC BY) license (https://creativecommons.org/licenses/by/4.0/).
Share and Cite
MDPI and ACS Style
Romero-Peña, M.; Ghosh, S. Effect of Water Content and Pectin on the Viscoelastic Improvement of Water-in-Canola Oil Emulsions. Fluids 2021, 6, 228. https://doi.org/10.3390/fluids6060228
AMA Style
Romero-Peña M, Ghosh S. Effect of Water Content and Pectin on the Viscoelastic Improvement of Water-in-Canola Oil Emulsions. Fluids. 2021; 6(6):228. https://doi.org/10.3390/fluids6060228
Chicago/Turabian StyleRomero-Peña, Maria, and Supratim Ghosh. 2021. "Effect of Water Content and Pectin on the Viscoelastic Improvement of Water-in-Canola Oil Emulsions" Fluids 6, no. 6: 228. https://doi.org/10.3390/fluids6060228