Advancing Chemical Risk Assessment through Human Physiology-Based Biochemical Process Modeling


1
HERACLES Research Center on the Exposome and Health, Center for Interdisciplinary Research and Innovation, Balkan Center, Bldg. B, 10th km Thessaloniki-Thermi Road, 57001 Thermi, Greece
2
Environmental Engineering Laboratory, Department of Chemical Engineering, Aristotle University of Thessaloniki, University Campus, 54124 Thessaloniki, Greece
3
Environmental Health Engineering, Department of Science, Technology and Society, University School for Advanced Study (IUSS), Piazza della Vittoria 15, 27100 Pavia, Italy
*
Author to whom correspondence should be addressed.
Fluids 2019, 4(1), 4; https://doi.org/10.3390/fluids4010004
Submission received: 30 September 2018
/
Revised: 22 December 2018
/
Accepted: 27 December 2018
/
Published: 4 January 2019
(This article belongs to the Special Issue Experimental and Numerical Studies in Biomedical Engineering)
Abstract
:Physiology-Based BioKinetic (PBBK) models are of increasing interest in modern risk assessment, providing quantitative information regarding the absorption, metabolism, distribution, and excretion (ADME). They focus on the estimation of the effective dose at target sites, aiming at the identification of xenobiotic levels that are able to result in perturbations to the biological pathway that are potentially associated with adverse outcomes. The current study aims at the development of a lifetime PBBK model that covers a large chemical space, coupled with a framework for human biomonitoring (HBM) data assimilation. The methodology developed herein was demonstrated in the case of bisphenol A (BPA), where exposure analysis was based on European HBM data. Based on our calculations, it was found that current exposure levels in Europe are below the temporary Tolerable Daily Intake (t-TDI) of 4 μg/kg_bw/day proposed by the European Food Safety Authority (EFSA). Taking into account age-dependent bioavailability differences, internal exposure was estimated and compared with the biologically effective dose (BED) resulting from translating the EFSA temporary total daily intake (t-TDI) into equivalent internal dose and an alternative internal exposure reference value, namely biological pathway altering dose (BPAD); the use of such a refined exposure metric, showed that environmentally relevant exposure levels are below the concentrations associated with the activation of biological pathways relevant to toxicity based on High Throughput Screening (HTS) in vitro studies.
1. Introduction
One of the main applications of internal dosimetry is the integration of exposure and human biomonitoring (HBM) data. More in detail, internal dosimetry aims at (i) deriving the time course of the toxicants in human tissues, with a particular focus on susceptible developmental stages; (ii) providing a comprehensive interpretation of the HBM data related to the cohorts, for quantifying individual exposome; and (iii) deriving Biologically Effective Dose (BED) values for associating them with adverse outcomes. Towards these aims, a lifetime generic Physiology-Based BioKinetic (PBBK) model [1] has been developed, that includes the interaction of chemical mixtures [2], and a set of exposure reconstruction algorithms, starting from HBM data [3]. To expand the chemical space that is covered by the generic PBBK model, advanced quantitative structure–activity relationship (QSARs) models have been introduced for its parameterization regarding data-poor chemicals. For reconstructing exposure based on HBM data [4], a multiple tier methodology has been developed, that accounts for the availability of data (meaning the number of samples collected for capturing intra-individual variability), as well as the needs of the exposure assessment (e.g., the daily intake estimation of exposure peaks during the day). Thus, several methods are available, including the Exposure Conversion Factors (ECFs) [5] and the Markov Chain Monte Carlo analysis. PBBK models are also applicable in the estimation of xenobiotics levels in target tissues, relevant to the activation of toxicity pathways [6], possibly associated with adverse outcomes. The advent of -omics technologies and their link to BED could highlight the early identification of disease onset. Moreover, BED could be used for the quantification of the effect of extracellular perturbations on metabolic states, coupling the PBBK model with metabolic regulatory networks and defining the feedback loop that connects clearance and metabolite production rates to metabolism regulation [7] via dynamic flux balance analysis (FBA) [8].
The need for developing generic PBBK models is of great importance in modern risk assessment, especially for compounds where toxicokinetics play a particular role in their overall adverse effects in humans. Among this compounds, Bisphenol A (BPA), is a commonly used plasticizer of increased scientific and regulatory interest. BPA is used in the manufacture of polycarbonate plastics and epoxy resins, which were extensively used in baby bottles (its use is now banned) as protective coatings on food containers, as well as in dentistry; other applications of BPA include thermal paper and polyvinyl chloride industries [9]. BPA is has been characterized as an endocrine-disrupting chemical (EDC). It has been suggested that in utero exposure to BPA may disrupts early life development. Many in vitro and in vivo (animal) studies demonstrated that adverse health effects due to BPA exposure can occur also at environmentally relevant doses [10]. However, it has to be noted that these results are highly controversial, since numerous high-quality attempts to replicate these in vivo at “environmentally relevant doses” have not succeeded [11,12,13,14]. BPA is one of the compounds with the highest controversy regarding its toxicokinetics; although BPA glucuronidation (which is the major elimination pathway) is very rapid at early developmental stages, internal exposure is higher as a result of the immature detoxification process [15,16].
Given all the above, this study aims at providing some answers on the risks associated with BPA exposure of the European population, starting from HBM data. Towards this aim, (a) a lifetime PBBK model has been developed, that accounts for the early developmental stages (including in utero exposure), and at the same time covers a large chemical space and (b) HBM data are assimilated with an exposure reconstruction mathematical framework, coupled with the PBBK model. It has also to be noted, that the PBBK model incorporates the key routes of exposure namely inhalation, oral and dermal), and includes multiple compartments, as well as binding to plasma proteins and red blood cell binding. At the same time, the model is able to simulate the levels of the parent compounds and their metabolites in the various tissues and biological fluids (including maternal milk). It also has to be noted that the assessment of internal dosimetry using PBBK models allows for the calculation of the xenobiotics internal doses, above the thresholds associated with biological pathway alterations that might be relevant to adverse outcomes. The so-called biological pathway altering dose (BPAD) provides additional advantages compared to existing risk metrics, since it combines dose—response data with the analysis of uncertainty and population variability, so as to derive exposure limits and can be derived by high-throughput screening (HTS) in vitro data. The overall applicability of the developed PBBK model in advancing the risk assessment concepts, is demonstrated in the case of BPA.
2. Materials and Methods
2.1. Development of the Generic Lifetime PBPK Model
The physiology-based biokinetic model developed and outlined in this work is designed to take into account the evolution of enzymatic activity and availability, as well as a change in organ volumes and blood flow characteristics during human life. These attributes determine the overall ADME properties of the human body, allowing the model to cover a large chemical space, if appropriately parameterised. The mathematical formulation adopted describes ADME processes for a wide spectrum of xenobiotics and for their metabolites, reaching all the way down to three metabolic stages [17]. The model concept is shown in Figure 1.
A key problem with generic PBBK models is the need to quantitatively estimate the values of a large number of physiochemical (e.g., the octanol–water partition coefficient, kow), and biochemical (e.g., Vmax and Km) parameters corresponding to a large number of physiological and anatomic compartments and biological fluid fluxes. Conventionally, a prohibitively large amount of experiments in vivo and, possibly, in vitro would be required to perform the proper model parameterization, while inter-species extrapolation in the values of these parameters introduces a significant source of uncertainty in the model set-up and, ultimately, its results. Our work has shown that it is feasible to use quantitative structure–activity relationships (QSARs) to estimate model parameters to ensure that the model performs well for a wide array of chemicals. Abraham’s solvation equation was used to estimate such biological/biochemical properties. This QSAR formulation takes into account molecular attributes such as:
- -
- excess molar refraction; a property that can be determined if the compound refractive index is known,
- -
- compound dipolarity/polarizability,
- -
- solute effective or summation hydrogen-bond acidity,
- -
- solute effective or summation hydrogen-bond basicity, and
- -
- McGowan characteristic volume that can be calculated based on the molecular structure of the solute.
Coupling Abraham’s solvation equation with machine learning algorithms such as feed backward artificial neural networks gives excellent results in terms of predicting chemical-specific biological/biochemical properties such as blood-tissue partition coefficients, maximal velocity (Vmax) and the Michaelis—Menten constant. In fact the predictive capacity of the QSAR regarding the Michaelis—Menten constant moved from rather poor (R2 up to 0.35) to an R2 of 0.88 for 85 chemical substances [18], while the predictive capacity of the model partition coefficients and vmax was very high (R2 above 0.9) [18,19]. QSAR predictions of these fundamental parameters are given for all major organs, as well as for arterial, venous, and portal blood. Metabolically active tissues link up xenobiotic compounds and their metabolites. Such tissues include mainly the liver, but also other sites of metabolism such as the intestine, the brain, the skin, or the placenta based on the presence or not of the respective enzymes that catalyze the metabolism of the specific chemical substance. Mass balance in each body compartment describes all relevant processes to absorption, metabolism, elimination, and protein binding. In each tissue, three mass balance equations are written, for (a) red blood cells, (b) plasma and interstitial tissue, and (c) cells. Thus, the model is readily applicable to both flow- and membrane-limited chemicals. Specific organs are further divided in sub-compartments to account for inhomogeneity in enzymatic activity (e.g., the liver is divided in five zones to describe the spatial distribution of enzymes), and permeability differences (e.g., the brain is divided in four sub-compartments, i.e., main brain, globus palidus, cerebellum and pituitary gland).
Our model captures in utero exposure by describing the interactions between the pregnant mother and her fetus by way of modelling the intra-placental properties that determine chemical transfer from the mother to the fetus during the different phases of growth of the latter in utero. Anthropometric parameters used in the model depend on age, so as to support the estimation of internal dose over the lifecourse, and to capture the continuously changing physiology of both the mother and the developing embryo. Diffusion is the main process governing flow from uterus to the placenta and vice-versa during pregnancy [20]. Excretion via lactation is described as an output from mammary tissue through a partitioning process between mammary tissue and milk, and milk withdrawal by suckling. The mathematical formulation describing lactation is based on the one described for PCBs in rats [21], which was adopted for humans [22]. The three main exposure routes are explicitly distinguished in the model set up. Inhalation takes into account absorption of gases and deposition of particles size fractions across the human respiratory tract. Absorption through the oral route is governed by the absorption rates of the stomach and the gut. To better describe dermal absorption, the skin was modelled as a multi-layer structure, including a brick-and-mortar model of the stratum corneum [23] and viable epidermis (also accounting for metabolism), where the geometry of all layer microstructures was explicitly described [24]. Details on the model mathematical framework are given in the Supplementary Materials.
2.2. BPA Toxicokinetic Considerations
In this study, the comprehensive PBBK model developed by Sarigiannis et al. [1,25] for BPA was used. The model describes in detail the ADME processes related to BPA and its conjugated metabolite, BPA-Glu. The latter was considered in particular, because the main detoxification pathway of BPA is phase II glucuronidation. The original model was scaled for children using the physiologically-based approach proposed by Edginton et al. [26], and data about ontogeny of enzymes (glycotransferases) involved in BPA detoxification [27,28]. Following a method similar to Edginton and Ritter [29], plasma clearance (CLH) from adults was converted to intrinsic clearance (Clint) using the well-stirred reactor model, physiological data regarding liver blood flow (QH; mL/min) and the unbound fraction of BPA in the plasma (fu). Elimination through urine (in the form of BPA-Glu) is the only mechanism of elimination. We optimized plasma CLBPA-Glu_kidney during the development of the adult coupled model and compared this with values derived from Volkel et al. [29]. It has to be noted, that this parameterization of our model, resulted in similar levels of plasma BPA and urinary BPA-Glu to the ones derived by Thayer et al. [30] and Teeguarden et al. [31]; to our knowledge, these are the only studies where BPA has been administered to volunteers and data useful for PBPK modeling have been derived; however, it has to be noticed that in order to fit in the optimal way the measured serum concentrations, an adjustment of the oral uptake constant is required, as explicitly described by Yang et al. [32]. Tissue:blood partition coefficients were obtained from Edginton and Ritter [15]. Other age- and gender-specific data on parameters, such as urinary volumes and creatinine excretion rate were obtained from the International Commission on Radiological Protection [33]. Global sensitivity analysis was performed by changing the input parameters by 1%, while observing the relative change in the outcome. Results showed that the rapid metabolism and elimination of BPA, as well as its strong binding to plasma proteins, were the parameters affecting the most model performance.
2.3. Exposure Reconstruction Starting from Human Biomonitoring (HBM) Data
Reverse modeling algorithms applied on the PBBK model allowed us to reconstruct exposure from human biomonitoring (HBM) data. The comprehensive interpretation of human biomonitoring data and their back-calculation into exposure distributions comprises a typical computational inversion problem. The aim is to estimate input distributions that explain the measured biomonitored data, and at the same time to minimize the residual error. Towards this aim, ancillary exposure information is needed, related to environmental contamination, and human activities (including diet and consumer products use) [34]. An iterative computational methodology was developed based on Bayesian Markov Chain Monte Carlo (MCMC), combined with the generic PBBK model aiming at performing accurate exposure reconstruction. Differential Evolution (DE) and MCMC algorithms have been combined to solve this problem for the first time. The PBBK model has been combined with the Bayesian MCMC [35,36] and differential evolution Monte Carlo (DEMC) [37] techniques in order to simulate and calculate the exposure value that fits best the observed HBM data.
2.4. Exposure Assessment
The most effective way to estimate exposure and intake is the use of human biomonitoring data. For the assessment of BPA exposure, HBM data were collected from the available literature. Urinary BPA concentrations reflect differences in consumer exposure that are related to food packaging material (canned food, milk formula, use of plastic baby bottles). The restriction of BPA use in baby bottles in the European Union Member States in 2011, and increasing public awareness regarding the potential adverse health outcomes related to BPA exposure resulted in a decline of measured BPA levels in the European population over the last eight years. In the most recent studies, urinary BPA (in the form of the glucuronidated metabolite) measured levels are about 2 μg/L. BPA urinary concentrations measured in Germany (German Environmental Survey—GerES) depend on child age: they were 3.5, 2.8, 2.1 and 2.6 μg/L for children aged 3–5, 6–8, 9–11 and 12–14 years old respectively. Similar levels (2.5 μg/L) were recorded in France [38] for pregnant women. According to the German ESB [39] urinary concentrations of BPA declined from 2 μg/L in 1995 to 1.3 μg/L in 2009. The multi-center study DEMOCOPHES [40] provided results for urinary BPA levels in Belgium (2.6 μg/L), Denmark (2.2 μg/L), Luxembourg (1.9 μg/L), Slovenia (2.1 μg/L), Spain (2.1 μg/L) and Sweden (1.4 μg/L) [41]. The results of the urinary BPA levels in various countries are summarized in Table 1.
2.5. Risk Assessment
A risk characterization of BPA was carried out, employing several tools related to external and internal exposure assessment. To start with the value set as tolerable daily intake (t-TDI) by European Food Safety Authority (EFSA) temporarily 4 μg/kg_bw/day was used [49]. The options for evaluating exposure levels included:
- Direct comparison of exposure reconstruction intake estimates to EFSA t-TDI of 4 μg/kg_bw/day.
- Use of a biomonitoring equivalent (BE) value for urinary data. An original BE for BPA has been derived by Krishnan et al. [50] equal to 2000 μg/L, on the basis of the old EFSA TDI (equal to 50 μg/kg_bw/day), following the original BE concept initially proposed by Hays et al. [51] and further expanded by Aylward [52]. The reference dose for deriving the BE value was the EFSA t-TDI of 4 μg/kg_bw/day. It was assumed that this dose is given orally to an adult of 70 kg body weight at a constant rate during the day. After that, this intake was fed to the PBBK model resulting to urinary BPA-Glu concentration of 280 μg/L.
- Given the limitations of exposure back-calculation based on urinary BPA-Glu levels, the use of another exposure metric more relevant to where the xenobiotics exert their toxicity has to be considered. Towards this aim, free plasma BPA was selected as a descriptive metric linked to the biologically effective dose (BED). The use of this internal exposure metric, allows us to further differentiate internal and external exposure as a result of bioavailability differences related to developmental stage, point of entrance and eventually genetics. As a result, the calculated area under the curve (AUC) for 24 h, equals 0.312 μg 24 h/L (for one hour time interval) [25].
3. Results
3.1. Exposure Reconstruction based on HBM Data
The use of the PBBK model coupled to the algorithm for exposure reconstruction resulted in the estimation of daily intake starting from HBM data. In turn, the intake estimates were used as an input in the PBBK model for calculating the internal dose. To estimate the daily intake, some assumptions were done relevant to the exposure scenario, including (a) the average urinary BPA-Glu concentration for each age group of the various countries, and (b) the development of a basic daily schedule of diet that includes three different meals: (a) breakfast at 7:00 a.m. (dose 1), (b) lunch at 2:00 p.m. (dose 2) and (c) dinner at 7:00 p.m. (dose 3). Overall daily intake was considered to be equally distributed among these meals.
The exposure reconstruction algorithm converged to the available biomonitoring data after 1000 iterations and the average intake estimates were 0.05 μg/kg_bw/day, which is far below the EFSA t-TDI (Figure 2). The same occurs for the population exposed to the higher levels of BPA (4.4 μg/L for the 20–40 years old Italian adults, as indicated in Table 1), were the maximum intake levels were found equal to 0.77 Italy μg/kg_bw/day.
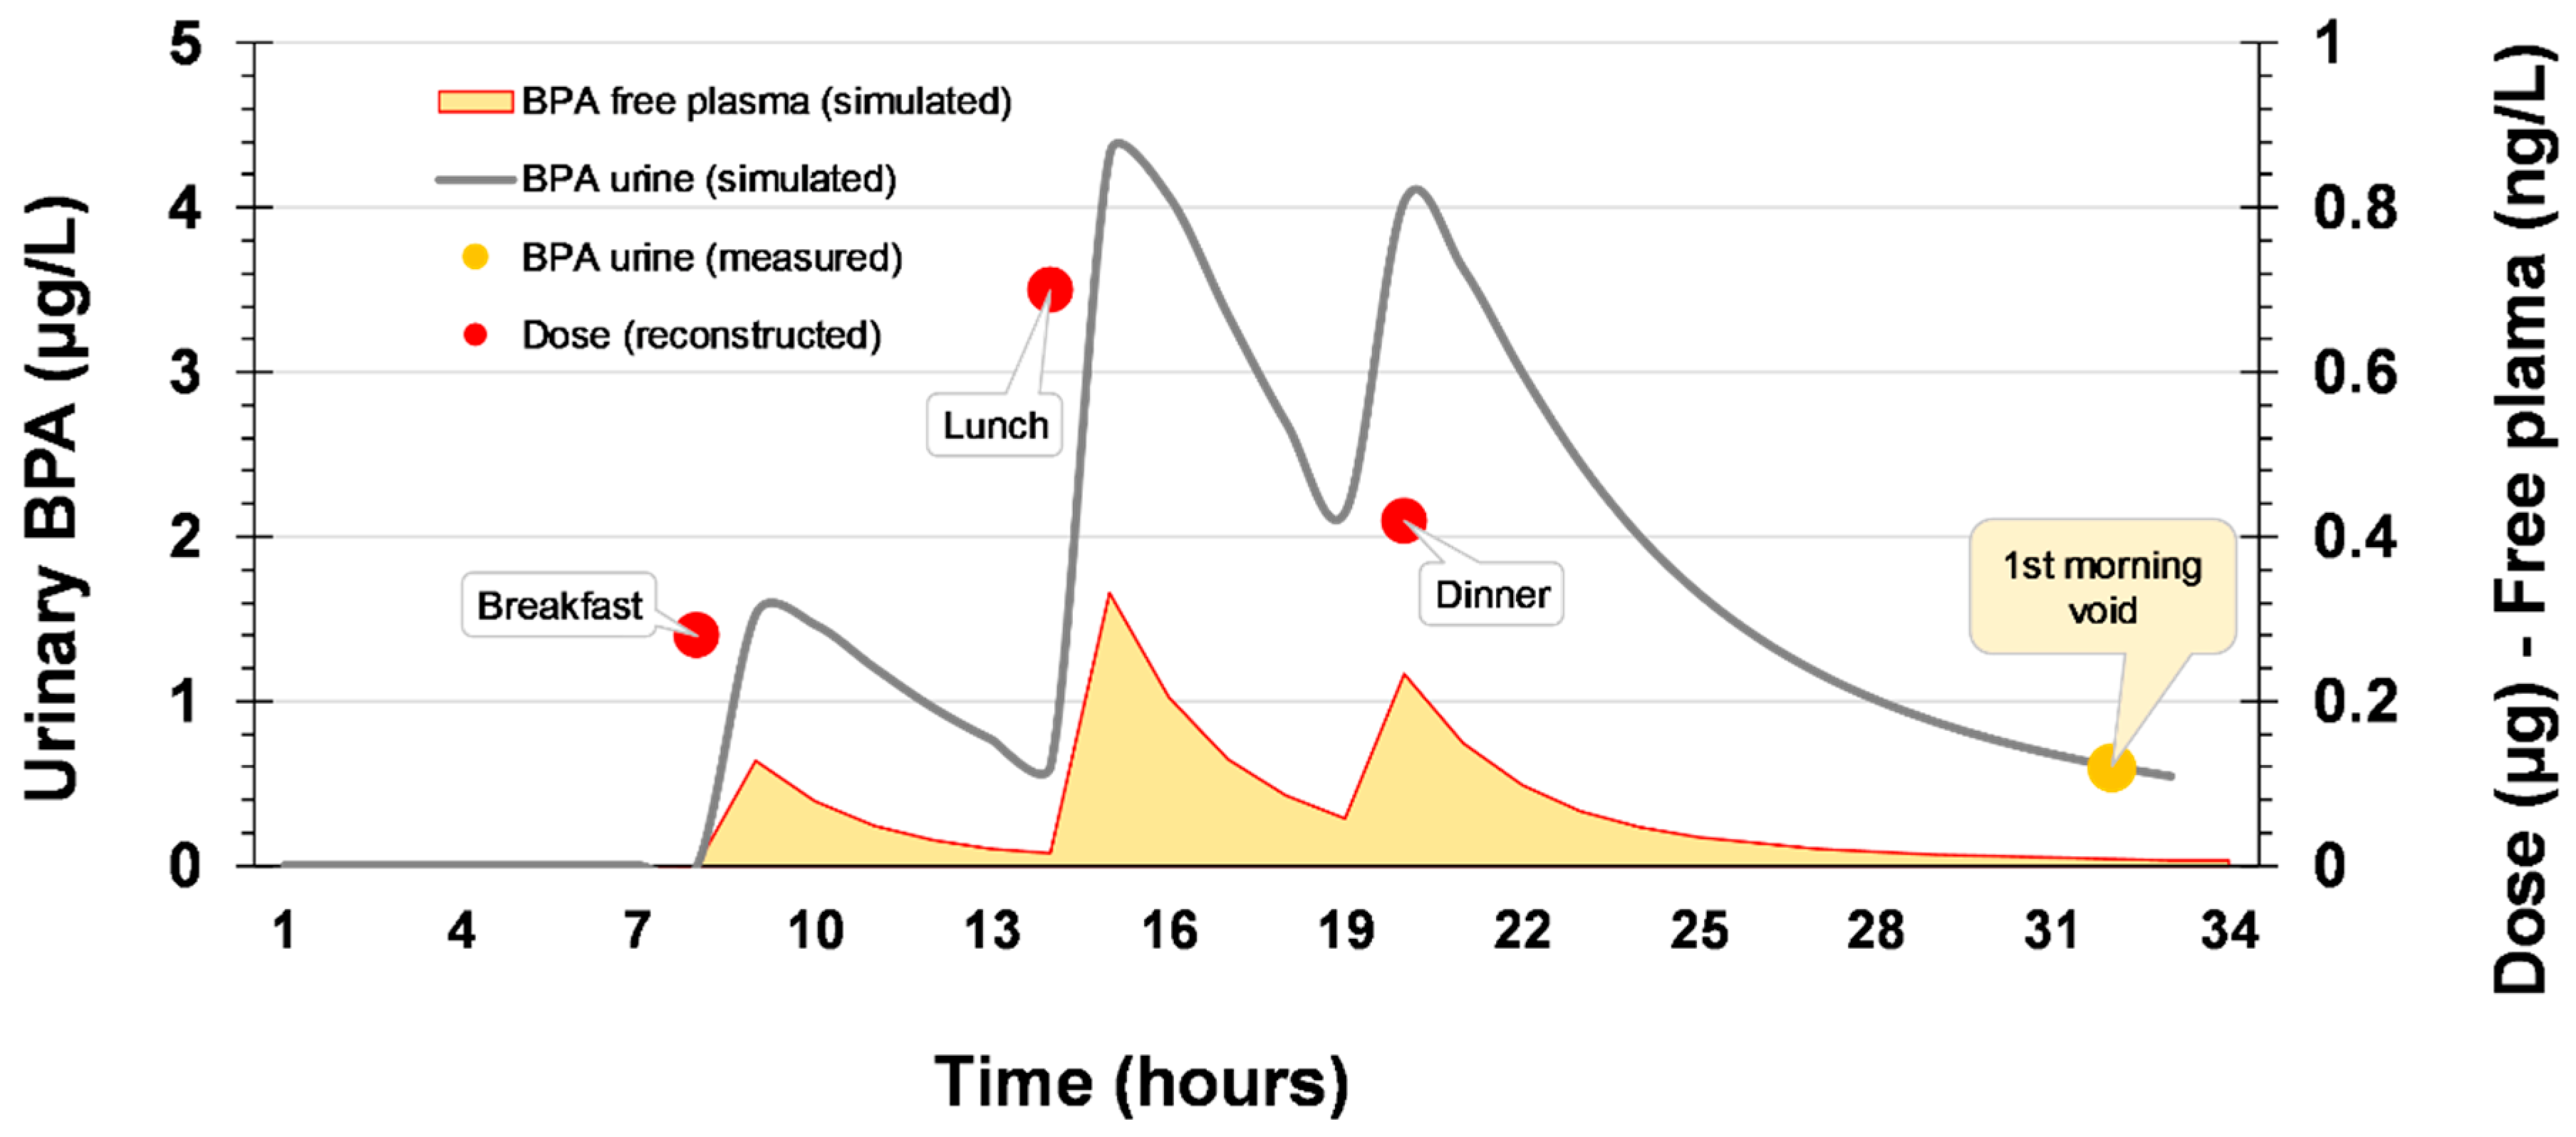
It has to be noted, that the methodology applied herein, accounts for the urinary metabolites time course. This is a major advantage for reconstructing exposure, because the actual kinetics and the time course of both parent compounds in blood, and of the urinary biomarker measured in urine are captured and described. Thus, using the calculated uptake levels, internal dose is estimated by running forward the model. This is typically represented by the free plasma BPA. The time course of internal exposure, optimally described by area under the curve (AUC) and urinary BPA levels under a typical daily exposure scenario for an average child (a daily uptake of 0.035 μg/kg_bw/day) are graphically illustrated in Figure 3. Internal dose remains low, in the range of ng/L, while the respective AUC (indicated as the shades area under the red line) is in the range of 1.5 ng 24 h/L, which is significantly lower than the one of 0.312 μg 24 h/L, corresponding to a daily intake that is equal to the t-TDI proposed by EFSA.
3.2. Risk Characterization
Based on the external and internal exposure estimates described above, as well as on the biomonitoring data itself, risk characterization ratios (RCR) were derived for the different age groups. Independently of the RCR method, the median risk for the European population is low (RCR of about 0.01), as illustrated in Figure 4.
For all individuals (including the ones in the upper part of the distribution), RCR < 1, independently of the employed method. It has to be noted that had RCR been estimated solely based on the urinary concentrations, the estimated risks would be lower. In practice, this is an artifact of the comparison between (a) a steady-state calculated urinary concentration, with (b) a urinary concentration that is estimated dynamically in time, accounting for the continuously declining levels of urine eliminated during the night, and collected in the first morning void (Figure 2). On the other hand, the use of internal dose metrics, did not differentiate the RCR results significantly compared to the external intake results. This is somehow expected, because the former, has been calculated based on intake estimates from individual biomonitoring data, which have already accounted for the individual physiology parameters that are needed for the PBBK model. By using the BPAD as a reference value for the internal dose, it was found that even in the worst case scenario, current exposure levels are more than 10 times lower than the BPADL99, indicating that that there is no reason for concern regarding BPA exposure.
4. Discussion
The study herein deals with the assessment of risks associated with European population with exposure to BPA. In order to estimate the daily intake, an exposure reconstruction scheme has been followed, starting from HBM data. Towards this aim, BPA HBM data has been collated, to fed into a validated PBBK model. After that, the intake estimates were used as an input for the PBBK model for estimating the internal dose (free plasma concentration). In addition, in order to further exploit the opportunities for of internal dosimetry for deriving refined exposure estimates, as well as to better associate urinary data with exposure. Towards this aim, the EFSA t-TDI was translated into a) an equivalent urinary concentration, as well as b) an equivalent internal dose (free plasma concentration).
Based on the urinary levels of morning void and using the exposure reconstruction framework described above, daily intake was estimated. Median intake levels are in the range of 0.05 μg/kg_bw/day, in accordance with recent studies for BPA daily intake that used bottom-up approaches. Daily intake from main dietary sources such as canned food have been estimated at levels of 0.015 μg/kg_bw/day in Belgium [53], while intake from commonly food items and beverages for Norway was 0.005 μg/kg_bw/day [54]. Intake estimates for adults by aggregating the contribution from multiple food items was estimated equal to 0.030 μg/kg_bw/day for Europe [55], while similar results have also been reported for Canada [56] and USA [57].
Beyond these bottom-up approaches, several studies have approximated BPA daily intake, using urinary BPA levels. Considering the very rapid metabolism of BPA, it is assumed that a 24 h urine sample approximates the BPA intake from the previous 24 h [58]. Based on the above assumption, the median daily BPA intake for the US population was estimated at 0.025 μg/kg_bw/day [59]. However, intake estimates based on BPA daily mass balance are representative, only when the whole-day urine is collected. When this is applied in spot samples, the overall intake might be seriously misinterpreted. On the contrary, the use of an exposure reconstruction algorithm, allows the correct interpretation of a spot sample, since exposure and elimination time dynamics are properly described (as already shown in Figure 3).
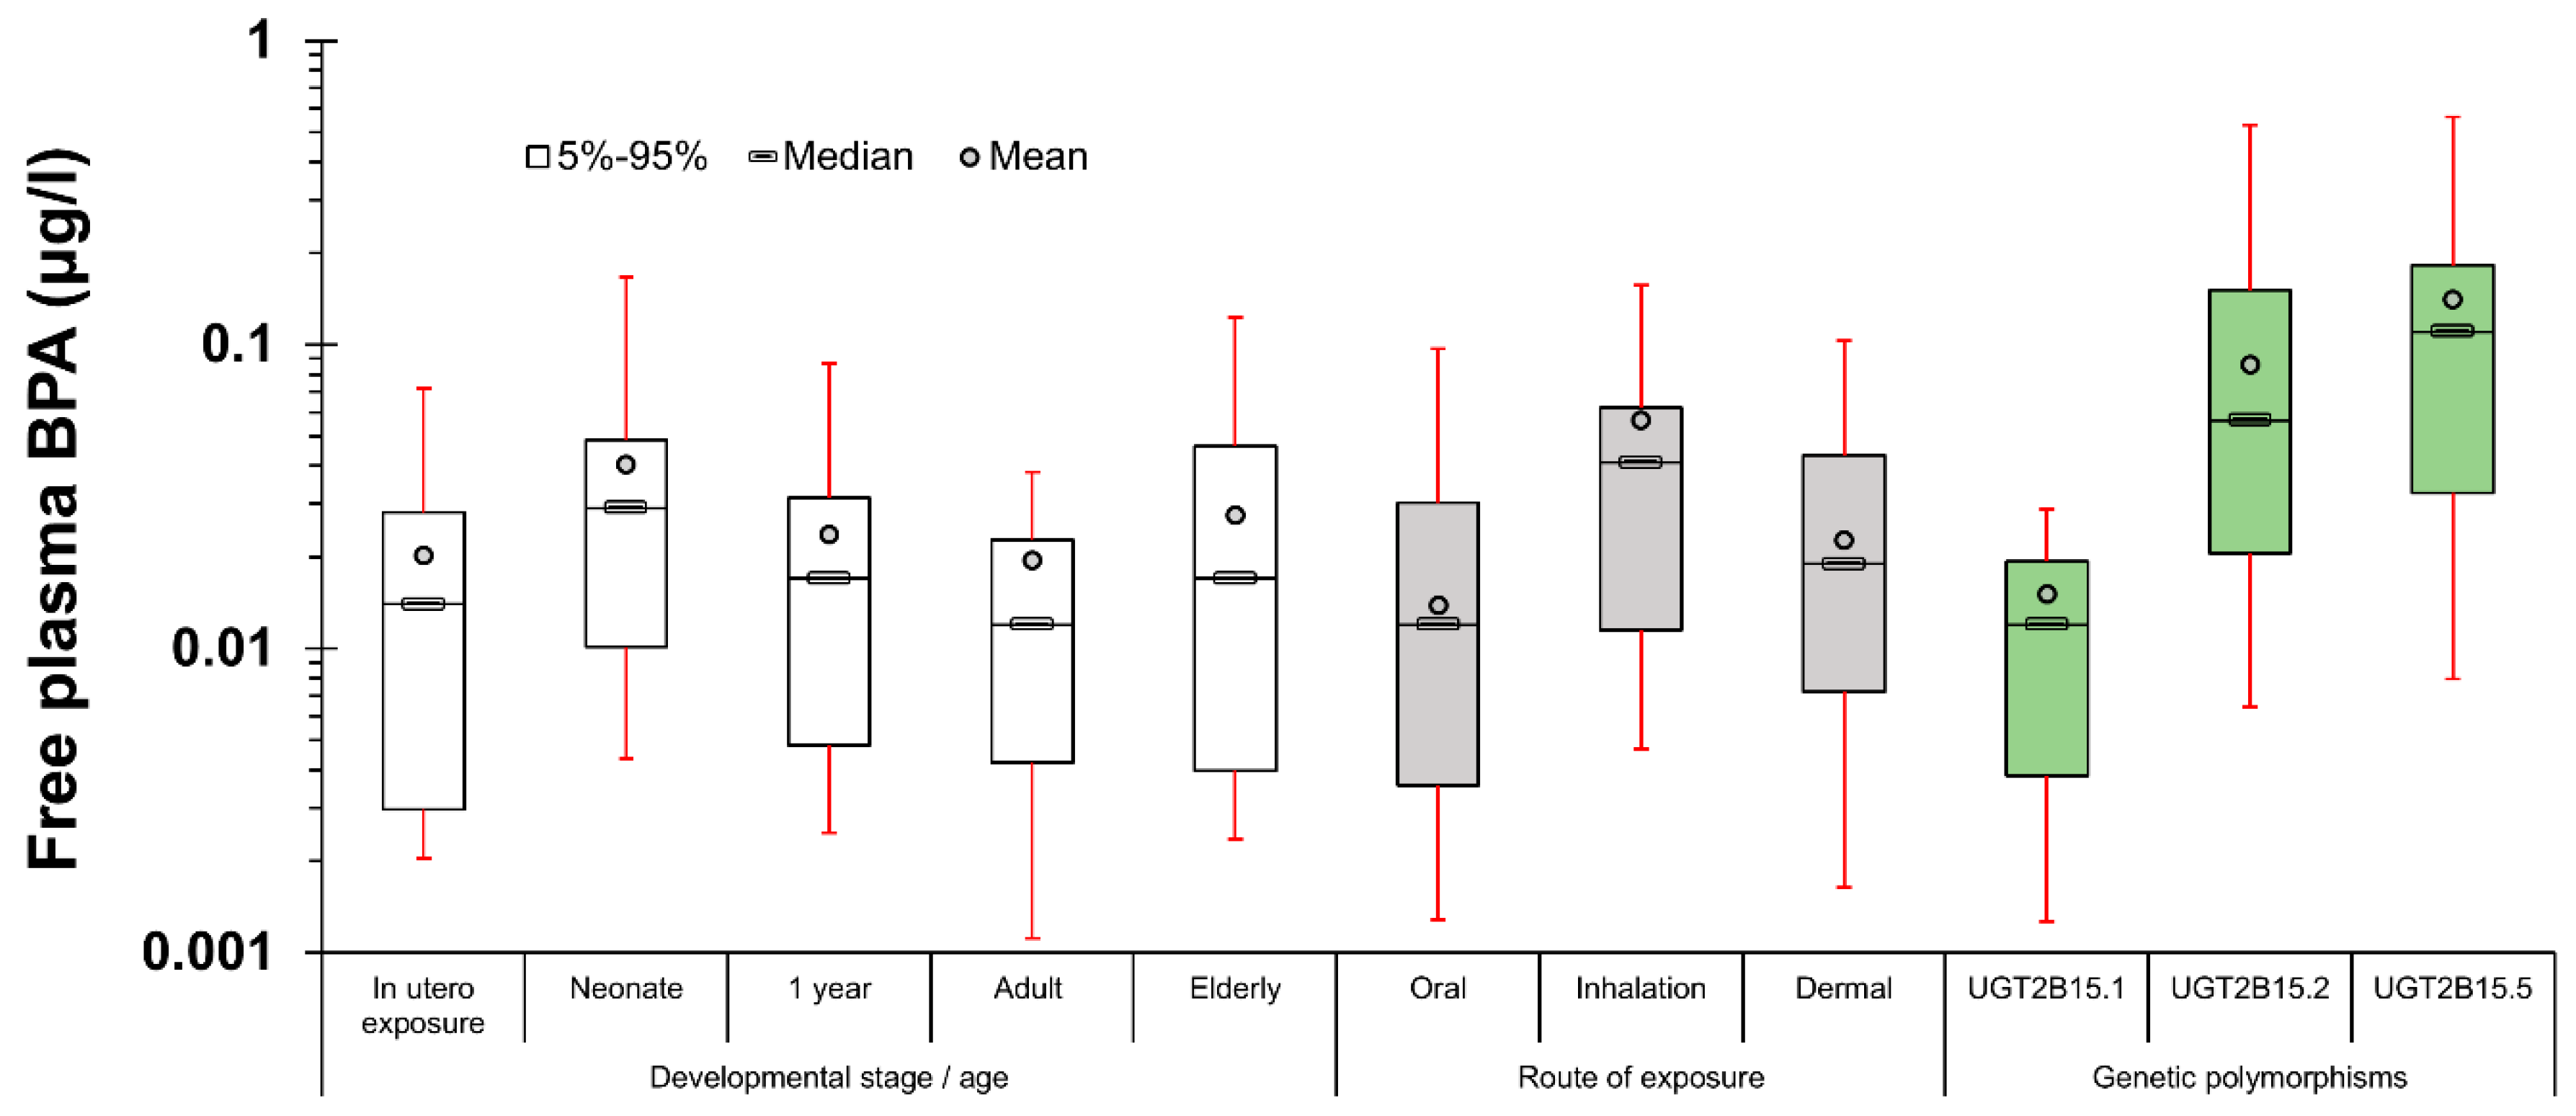
Another major advantage of exposure reconstruction, is the capability to re-run forward the PBBK model, accounting for all potential parameters that induce bioavailability differences. In a nutshell, these include age, the route of exposure, and genetic variability. Age is affecting the ADME process by differentiating (a) parameters related to human physiology, such as the composition of the various tissues, the blood flows, as well as the inhalation rate, and (b) the maturity of the detoxification pathways. Scaling clearance for children [26] and accounting for the enzymes ontogeny relevant to BPA glucuronidation [27,28,60], an age-dependent bioavailability difference factor of 2 to 3.5 is calculated between neonates and adults. Moreover, significant route-dependent bioavailability differences have been calculated; in the case of inhalation, BPA enters directly in the systemic circulation from the alveoli and the lack of first pass metabolism results in bioavailability differences up to six times, while in the case of dermal exposure, the lack of first-pass metabolism is somehow decompensated by slower absorption. Finally, one of the key factors affecting bioavailability and that is related to inter-individual variability is the existence of genetic variants of key enzymes that are involved in BPA glucuronidation; in vitro kinetic studies have identified that D85Y substitution in UGT2B15 decreases enzymatic function [61], and that the polymorphic alleles of UGT2B15 are translated in variations in the metabolism of BPA [62]. To make these more explicit, the bioavailability differences in free plasma BPA related to developmental stage, point of entrance in human body and genetic polymorphisms of enzymes relevant to metabolism under a daily intake of 4 μg/kg_bw/day are presented in Figure 5. From the above, it is easily concluded that individual variability could be greatly enhanced by the co-existence of factors that predispose for larger bioavailability differences such as early infancy and the presence of the polymorphic alleles of UGT2B15 related to slower metabolism. Should this additional information had been detailed in all the cohorts, larger differences in the internal dose, and also among the RCR assessment would be reported. Thus, it is expected that future cohort studies that properly account for differences in BED (and not only for differences in the biomonitored data), would provide more robust associations between BPA exposure levels and potential health effects.
It has also to be noted, that at the moment, due to the serious analytical limitations, free plasma BPA has been measured only in a very limited number of studies [63,64,65]. However, it is very encouraging that the estimates of the free plasma concentration of our model (in the range of 0.18 to 1 ng/L), are very much in accordance to the biomonitored doses (in the range of 0.23 to 1.3 ng/L) by Teeguarden et al. [63] for similar urinary BPA-Glu levels (0.9 μg/L) to the ones included in our study (1 to 2 μg/L).
Despite the advantages of using a comprehensive PBBK model, coupled with exposure reconstruction algorithms to properly interpret the biomonitoring spot urine samples, additional steps are needed towards a comprehensive understanding of the potential adverse effects of BPA. Firstly, we need to always keep in mind that BPA is one of the most rapidly metabolized industrial compounds; thus, to better identify the potential exposure sources, more than one measurements in urine samples per day are required. These are essential for a more accurate description of the time-dependent profile of internal dose and the respective AUC calculation. Moreover, it would be of particular importance to understand how the different exposure regimes and internal exposure profiles induce early biological responses; metabolomics analysis of the respective urine samples and the subsequent pathway analysis using big data analytics and advanced bioinformatics [66] could shed additional light in the potential homeostasis perturbation in relation to BPA exposure. This is the direction of our future work, where the various daily intake estimates will be further associated with responses of molecular targets. Overall, answering the question of whether BPA at current exposure levels eventually results in adverse health outcomes, requires the integration of environmental and molecular epidemiology and toxicology, with detailed exposure-related data (e.g., food questionnaires), multiple daily urine samples collection, internal dose analysis, -omics pathway analysis, and the evaluation of both in vitro and in vivo data. In this content, the capability offered by the PBBK models to estimate BED is expected to provide more accurate exposure metrics for environment-wide association studies, as well as for linking real-life exposure with biologically effective doses in in vitro models [6].
5. Conclusions
Starting from HBM data collection and using a human physiology-based biokinetic model coupled with an exposure reconstruction algorithm, exposure to BPA in the European population was estimated to be almost two orders of magnitude lower than the respective EFSA t-TDI of 4 μg/kg_bw/day. Among the investigated population groups, higher mean intake levels were estimated for children. On the other hand, the similar maximum exposure estimates (close to 0.8 μg/kg_bw/day) for all age groups, indicates that significant exposure sources still occur for both adults and children. On the other hand, these exposure levels might result in a daily AUC that is similar to the one derived by t-TDI, depending on the presence of alleles associated with a slower metabolism of the individuals. Our forthcoming work will focus on BPA substitutes, BPS and BPF, the toxicities of which are yet to be determined, due to uncertainties with their biokinetic and biochemical behaviors especially when treating interactions with specific protein receptors associated with endocrine disruption and the impairment of reproductive capacity.
The multi-faceted method presented herein, provide more accurate daily intake estimates compared to the method based on urinary concentrations mass balance, since the use of physiology-based biokinetic modeling allows the comprehensive description of exposure and elimination time dynamics. This highlights the importance for using PBBK modelling-based exposure reconstruction schemes for rapidly metabolized and excreted compounds, such as BPA. In addition, translating biomonitoring data into internal dose estimates and accounting for the parameters that induce interindividual variability, will provide more accurate exposure metrics for future associations towards a better assessment of potential adverse health effects.
Supplementary Materials
The following are available online at https://www.mdpi.com/2311-5521/4/1/4/s1, Table S1: Regression coefficients for lifetime scaling (from conception to adulthood), Table S2: Gestation parameters (from conception to birth), Table S3: Partition coefficients (organ/blood), Table S4: Model parameters for MCMC analysis.
Author Contributions
D.S. was responsible for the main concept development; the methodology presented, its software implementation, and validation and formal analysis of the results were jointly developed by D.S. and S.K.; the manuscript was jointly prepared by D.S. and S.K.; D.S. further reviewed and edited the final version before submission; finally, S.K. was responsible for all visualizations included in the text.
Funding
This research was funded by the LIFE + Program, grant number LIFE12 ENV/GR/001040 (CROME), and by the 7th RTD Framework Programme, grant agreement No: 603946 (HEALS) and CEFIC LRI, through the DOREMI project.
Conflicts of Interest
The authors declare no conflict of interest.
References
- Sarigiannis, D.A.; Karakitsios, S.P. A dynamic physiology based pharmacokinetic model for assessing lifelong internal dose. In Proceedings of the AIChE 2012, Pittsburgh, PA, USA, 28 October–2 November 2012. [Google Scholar]
- Sarigiannis, D.A.; Gotti, A. Biology-based dose-response models for health risk assessment of chemical mixtures. Fres. Environ. Bull. 2008, 17, 1439–1451. [Google Scholar]
- Georgopoulos, P.G.; Sasso, A.F.; Isukapalli, S.S.; Lioy, P.J.; Vallero, D.A.; Okino, M.; Reiter, L. Reconstructing population exposures to environmental chemicals from biomarkers: Challenges and opportunities. J. Expo. Sci. Envion. Epidemiol. 2008, 19, 149–171. [Google Scholar] [CrossRef] [PubMed] [Green Version]
- Andra, S.S.; Charisiadis, P.; Karakitsios, S.; Sarigiannis, D.A.; Makris, K.C. Passive exposures of children to volatile trihalomethanes during domestic cleaning activities of their parents. Environ. Res. 2015, 136, 187–195. [Google Scholar] [CrossRef] [PubMed]
- Tan, Y.M.; Liao, K.; Conolly, R.; Blount, B.; Mason, A.; Clewell, H. Use of a physiologically based pharmacokinetic model to identify exposures consistent with human biomonitoring data for chloroform. J. Toxicol. Environ. Health Part A: Curr. Issues 2006, 69, 1727–1756. [Google Scholar] [CrossRef] [PubMed]
- Judson, R.S.; Kavlock, R.J.; Setzer, R.W.; Cohen Hubal, E.A.; Martin, M.T.; Knudsen, T.B.; Houck, K.A.; Thomas, R.S.; Wetmore, B.A.; Dix, D.J. Estimating toxicity-related biological pathway altering doses for high-throughput chemical risk assessment. Chem. Res. Toxicol. 2011, 24, 451–462. [Google Scholar] [CrossRef] [PubMed]
- Eissing, T.; Kuepfer, L.; Becker, C.; Block, M.; Coboeken, K.; Gaub, T.; Goerlitz, L.; Jaeger, J.; Loosen, R.; Ludewig, B.; et al. A computational systems biology software platform for multiscale modeling and simulation: Integrating whole-body physiology, disease biology, and molecular reaction networks. Front. Phys. 2011, 2, 1–10. [Google Scholar] [CrossRef] [PubMed]
- Krauss, M.; Schaller, S.; Borchers, S.; Findeisen, R.; Lippert, J.; Kuepfer, L. Integrating Cellular Metabolism into a Multiscale Whole-Body Model. PLoS Comp. Biol. 2012, 8, e1002750. [Google Scholar] [CrossRef]
- Morck, T. Chapter 3G Bisphenol A. In Biomarkers and Human Biomonitoring; The Royal Society of Chemistry: London, UK, 2012; Volume 1, pp. 360–380. [Google Scholar]
- Rochester, J.R. Bisphenol A and human health: A review of the literature. Reprod. Toxicol. 2013, 42, 132–155. [Google Scholar] [CrossRef]
- Tyl, R.W.; Myers, C.B.; Marr, M.C.; Thomas, B.F.; Keimowitz, A.R.; Brine, D.R.; Veselica, M.M.; Fail, P.A.; Chang, T.Y.; Seely, J.C.; et al. Three-generation reproductive toxicity study of dietary bisphenol A in CD Sprague-Dawley rats. Toxicol. Sci. 2002, 68, 121–146. [Google Scholar] [CrossRef]
- Tyl, R.W.; Myers, C.B.; Marr, M.C.; Sloan, C.S.; Castillo, N.P.; Veselica, M.M.; Seely, J.C.; Dimond, S.S.; Van Miller, J.P.; Shiotsuka, R.N.; et al. Two-generation reproductive toxicity study of dietary bisphenol A in CD-1 (swiss) mice. Toxicol. Sci. 2008, 104, 362–384. [Google Scholar] [CrossRef]
- Ferguson, S.A.; Law, C.D., Jr.; Abshire, J.S. Developmental treatment with bisphenol A or ethinyl estradiol causes few alterations on early preweaning measures. Toxicol. Sci. 2011, 124, 149–160. [Google Scholar] [CrossRef] [PubMed]
- Delclos, K.B.; Camacho, L.; Lewis, S.M.; Vanlandingham, M.M.; Latendresse, J.R.; Olson, G.R.; Davis, K.J.; Patton, R.E.; Gamboa da Costa, G.; Woodling, K.A.; et al. Toxicity evaluation of bisphenol A administered by gavage to Sprague Dawley rats from gestation day 6 through postnatal day 90. Toxicol. Sci. 2014, 139, 174–197. [Google Scholar] [CrossRef]
- Edginton, A.N.; Ritter, L. Predicting plasma concentrations of bisphenol A in children younger than 2 years of age after typical feeding schedules, using a physiologically based toxicokinetic model. Environ. Health Perspect. 2009, 117, 645–652. [Google Scholar] [CrossRef] [PubMed]
- Ginsberg, G.; Rice, D.C. Does rapid metabolism ensure negligible risk from bisphenol A? Environ. Health Perspect. 2009, 117, 1639–1643. [Google Scholar] [CrossRef] [PubMed]
- Sarigiannis, D.; Karakitsios, S.; Gotti, A.; Loizou, G.; Cherrie, J.; Smolders, R.; De Brouwere, K.; Galea, K.; Jones, K.; Handakas, E.; et al. Integra: From global scale contamination to tissue dose. In Proceedings of the 7th International Congress on Environmental Modelling and Software: Bold Visions for Environmental Modeling, San Diego, CA, USA, 15–19 June 2014; pp. 1001–1008. [Google Scholar]
- Sarigiannis, D.A.; Papadaki, K.; Kontoroupis, P.; Karakitsios, S.P. Development of QSARs for parameterizing Physiology Based ToxicoKinetic models. Food Chem. Toxicol. 2017, 106, 114–124. [Google Scholar] [CrossRef]
- Papadaki, K.C.; Karakitsios, S.P.; Sarigiannis, D.A. Modeling of adipose/blood partition coefficient for environmental chemicals. Food Chem. Toxicol. 2017, 110, 274–285. [Google Scholar] [CrossRef]
- Beaudouin, R.; Micallef, S.; Brochot, C. A stochastic whole-body physiologically based pharmacokinetic model to assess the impact of inter-individual variability on tissue dosimetry over the human lifespan. Regul. Toxicol. Pharmacol. 2010, 57, 103–116. [Google Scholar] [CrossRef]
- Lee, S.K.; Ou, Y.C.; Andersen, M.E.; Yang, R.S.H. A physiologically based pharmacokinetic model for lactational transfer of PCB 153 with or without PCB 126 in mice. Arch. Toxicol. 2007, 81, 101–111. [Google Scholar] [CrossRef]
- Verner, M.A.; Charbonneau, M.; Lopez-Carrillo, L.; Haddad, S. Physiologically based pharmacokinetic modeling of persistent organic pollutants for lifetime exposure assessment: A new tool in breast cancer epidemiologic studies. Environ. Health Perspect. 2008, 116, 886–892. [Google Scholar] [CrossRef]
- Touitou, E. Drug delivery across the skin. Expert Opin. Biol. Ther. 2002, 2, 723–733. [Google Scholar] [CrossRef]
- Mitragotri, S.; Anissimov, Y.G.; Bunge, A.L.; Frasch, H.F.; Guy, R.H.; Hadgraft, J.; Kasting, G.B.; Lane, M.E.; Roberts, M.S. Mathematical models of skin permeability: An overview. Int. J. Pharm. 2011, 418, 115–129. [Google Scholar] [CrossRef] [PubMed] [Green Version]
- Sarigiannis, D.; Karakitsios, S.; Handakas, E.; Simou, K.; Solomou, E.; Gotti, A. Integrated exposure and risk characterization of bisphenol-A in Europe. Food Chem. Toxicol. 2016, 98, 134–147. [Google Scholar] [CrossRef] [PubMed]
- Edginton, A.N.; Schmitt, W.; Voith, B.; Willmann, S. A mechanistic approach for the scaling of clearance in children. Clin. Pharmacokinet. 2006, 45, 683–704. [Google Scholar] [CrossRef] [PubMed]
- Leeder, J.S. Developmental pharmacogenetics: A general paradigm for application to neonatal pharmacology and toxicology. Clin. Pharmacol. Ther. 2009, 86, 678–682. [Google Scholar] [CrossRef]
- Court, M.H.; Zhang, X.; Ding, X.; Yee, K.K.; Hesse, L.M.; Finel, M. Quantitative distribution of mRNAs encoding the 19 human UDP-glucuronosyltransferase enzymes in 26 adult and 3 fetal tissues. Xenobiotica 2012, 42, 266–277. [Google Scholar] [CrossRef] [PubMed]
- Völkel, W.; Colnot, T.; Csanády, G.A.; Filser, J.G.; Dekant, W. Metabolism and kinetics of bisphenol a in humans at low doses following oral administration. Chem. Res. Toxicol. 2002, 15, 1281–1287. [Google Scholar]
- Thayer, K.A.; Doerge, D.R.; Hunt, D.; Schurman, S.H.; Twaddle, N.C.; Churchwell, M.I.; Garantziotis, S.; Kissling, G.E.; Easterling, M.R.; Bucher, J.R.; et al. Pharmacokinetics of bisphenol A in humans following a single oral administration. Environ. Int. 2015, 83, 107–115. [Google Scholar] [CrossRef] [Green Version]
- Teeguarden, J.G.; Twaddle, N.C.; Churchwell, M.I.; Yang, X.; Fisher, J.W.; Seryak, L.M.; Doerge, D.R. 24-hour human urine and serum profiles of bisphenol A: Evidence against sublingual absorption following ingestion in soup. Toxicol. Appl. Pharmacol. 2015, 288, 131–142. [Google Scholar] [CrossRef]
- Yang, X.; Doerge, D.R.; Teeguarden, J.G.; Fisher, J.W. Development of a physiologically based pharmacokinetic model for assessment of human exposure to bisphenol A. Toxicol. Appl. Pharmacol. 2015, 289, 442–456. [Google Scholar] [CrossRef]
- International Commission on Radiological Protection (ICRP). Basic Anatomical and Physiological Data for Use in Radiological Protection: Reference Values; ICRP: Ottawa, ON, Canada, 2002. [Google Scholar]
- Sarigiannis, D.; Karakitsios, S.; Gotti, A.; Handakas, E. Life cycle-based health risk assessment of plastic waste. In Proceedings of the 5th International Conference on Sustainable Solid Waste Manage, Athens, Greece, 21–24 June 2017. [Google Scholar]
- Gilks, W.R.; Roberts, G.O. Strategies for improving MCMC. In Markov Chain Monte Carlo in Practice; Springer: Berlin, Germany, 1996; pp. 89–114. [Google Scholar] [CrossRef]
- Haario, H.; Laine, M.; Mira, A.; Saksman, E. DRAM: Efficient adaptive MCMC. Stat. Comp. 2006, 16, 339–354. [Google Scholar] [CrossRef] [Green Version]
- Ter Braak, C.J. A Markov Chain Monte Carlo version of the genetic algorithm Differential Evolution: Easy Bayesian computing for real parameter spaces. Stat. Comp. 2006, 16, 239–249. [Google Scholar] [CrossRef]
- Vandentorren, S.; Zeman, F.; Morin, L.; Sarter, H.; Bidondo, M.L.; Oleko, A.; Leridon, H. Bisphenol-A and phthalates contamination of urine samples by catheters in the Elfe pilot study: Implications for large-scale biomonitoring studies. Environ. Res. 2011, 111, 761–764. [Google Scholar] [CrossRef] [PubMed]
- Federal Environment Agency (UBA). The German Environment Specimen Bank. Available online: http://www.umweltprobenbank.de (accessed on 17 April 2017).
- DEMOCOPHES. DEMOCOPHES Layman’s Report—Human Biomonitoring on a European Scale. Available online: http://www.eu-hbm.info/euresult/layman-report (accessed on 17 April 2017).
- Covaci, A.; Hond, E.D.; Geens, T.; Govarts, E.; Koppen, G.; Frederiksen, H.; Knudsen, L.E.; Mørck, T.A.; Gutleb, A.C.; Guignard, C.; et al. Urinary BPA measurements in children and mothers from six European member states: Overall results and determinants of exposure. Environ. Res. 2015, 141, 77–85. [Google Scholar] [CrossRef] [PubMed]
- Frederiksen, H.; Jensen, T.K.; Jørgensen, N.; Kyhl, H.B.; Husby, S.; Skakkebæk, N.E.; Main, K.M.; Juul, A.; Andersson, A. Human urinary excretion of non-persistent environmental chemicals: An overview of Danish data collected between 2006 and 2012. Reproduction 2014, 147, 555–565. [Google Scholar] [CrossRef]
- Becker, K.; Göen, T.; Seiwert, M.; Conrad, A.; Pick-Fuß, H.; Müller, J.; Wittassek, M.; Schulz, C.; Kolossa-Gehring, M. GerES IV: Phthalate metabolites and bisphenol A in urine of German children. Int. J. Hyg. Environ. Health 2009, 212, 685–692. [Google Scholar] [CrossRef] [PubMed]
- Galloway, T.; Cipelli, R.; Guralnik, J.; Ferrucci, L.; Bandinelli, S.; Corsi, A.M.; Money, C.; McCormack, P.; Melzer, D. Daily bisphenol a excretion and associations with sex hormone concentrations: Results from the InCHIANTI adult population study. Environ. Health Perspect. 2010, 118, 1603–1608. [Google Scholar] [CrossRef] [PubMed]
- Ye, X.; Pierik, F.H.; Hauser, R.; Duty, S.; Angerer, J.; Park, M.M.; Burdorf, A.; Hofman, A.; Jaddoe, V.W.V.; Mackenbach, J.P.; et al. Urinary metabolite concentrations of organophosphorous pesticides, bisphenol A, and phthalates among pregnant women in Rotterdam, the Netherlands: The Generation R study. Environ. Res. 2008, 108, 260–267. [Google Scholar] [CrossRef] [PubMed] [Green Version]
- Casas, L.; Fernandez, M.F.; Llop, S.; Guxens, M.; Ballester, F.; Olea, N.; Irurzun, M.B.; Rodriguez, L.S.; Riano, I.; Tardon, A.; et al. Urinary concentrations of phthalates and phenols in a population of Spanish pregnant women and children. Environ. Int. 2011, 37, 858–866. [Google Scholar] [CrossRef]
- Dereumeaux, C.; Fillol, C.; Charles, M.-A.; Denys, S. The French human biomonitoring program: First lessons from the perinatal component and future needs. Int. J. Hyg. Environ. Health 2017, 220, 64–70. [Google Scholar] [CrossRef]
- Myridakis, A.; Fthenou, E.; Balaska, E.; Vakinti, M.; Kogevinas, M.; Stephanou, E.G. Phthalate esters, parabens and bisphenol-A exposure among mothers and their children in Greece (Rhea cohort). Environ. Int. 2015, 83, 1–10. [Google Scholar] [CrossRef]
- EFSA. Scientific Opinion on the risks to public health related to the presence of bisphenol A (BPA) in foodstuffs. EFSA J. 2015, 13, 3978. [Google Scholar] [CrossRef]
- Krishnan, K.; Gagné, M.; Nong, A.; Aylward, L.L.; Hays, S.M. Biomonitoring Equivalents for bisphenol A (BPA). Regul. Toxicol. Pharmacol. 2010, 58, 18–24. [Google Scholar] [CrossRef] [PubMed]
- Hays, S.M.; Becker, R.A.; Leung, H.W.; Aylward, L.L.; Pyatt, D.W. Biomonitoring equivalents: A screening approach for interpreting biomonitoring results from a public health risk perspective. Regul. Toxicol. Pharmacol. 2007, 47, 96–109. [Google Scholar] [CrossRef] [PubMed] [Green Version]
- Aylward, L.L. Integration of biomonitoring data into risk assessment. Curr. Opin. Toxicol. 2018, 9, 14–20. [Google Scholar] [CrossRef]
- Geens, T.; Apelbaum, T.Z.; Goeyens, L.; Neels, H.; Covaci, A. Intake of bisphenol A from canned beverages and foods on the Belgian market. Food Addit. Contam.: Part A 2010, 27, 1627–1637. [Google Scholar] [CrossRef]
- Sakhi, A.K.; Lillegaard, I.T.; Voorspoels, S.; Carlsen, M.H.; Loken, E.B.; Brantsaeter, A.L.; Haugen, M.; Meltzer, H.M.; Thomsen, C. Concentrations of phthalates and bisphenol A in Norwegian foods and beverages and estimated dietary exposure in adults. Environ. Int. 2014, 73, 259–269. [Google Scholar] [CrossRef]
- von Goetz, N.; Wormuth, M.; Scheringer, M.; Hungerbuhler, K. Bisphenol A: How the most relevant exposure sources contribute to total consumer exposure. Risk Anal. Int. J. 2010, 30, 473–487. [Google Scholar] [CrossRef]
- Cao, X.L.; Perez-Locas, C.; Dufresne, G.; Clement, G.; Popovic, S.; Beraldin, F.; Dabeka, R.W.; Feeley, M. Concentrations of bisphenol A in the composite food samples from the 2008 Canadian total diet study in Quebec City and dietary intake estimates. Food Addit. Contam. 2011, 28, 791–798. [Google Scholar] [CrossRef] [Green Version]
- Lorber, M.; Schecter, A.; Paepke, O.; Shropshire, W.; Christensen, K.; Birnbaum, L. Exposure assessment of adult intake of bisphenol A (BPA) with emphasis on canned food dietary exposures. Environ. Int. 2015, 77, 55–62. [Google Scholar] [CrossRef] [Green Version]
- LaKind, J.S.; Naiman, D.Q. Bisphenol A (BPA) daily intakes in the United States: Estimates from the 2003–2004 NHANES urinary BPA data. J. Expo. Sci. Environ. Epidemiol. 2008, 18, 608–615. [Google Scholar] [CrossRef] [Green Version]
- LaKind, J.S.; Naiman, D.Q. Temporal trends in bisphenol A exposure in the United States from 2003–2012 and factors associated with BPA exposure: Spot samples and urine dilution complicate data interpretation. Environ. Res. 2015, 142, 84–95. [Google Scholar] [CrossRef] [PubMed] [Green Version]
- Fisher, J.W.; Twaddle, N.C.; Vanlandingham, M.; Doerge, D.R. Pharmacokinetic modeling: Prediction and evaluation of route dependent dosimetry of bisphenol A in monkeys with extrapolation to humans. Toxicol. Appl. Pharmacol. 2011, 257, 122–136. [Google Scholar] [CrossRef] [PubMed]
- Hanioka, N.; Oka, H.; Nagaoka, K.; Ikushiro, S.; Narimatsu, S. Effect of UDP-glucuronosyltransferase 2B15 polymorphism on bisphenol A glucuronidation. Arch. Toxicol. 2011, 85, 1373–1381. [Google Scholar] [CrossRef] [PubMed]
- Partosch, F.; Mielke, H.; Gundert-Remy, U. Functional UDP-glucuronyltransferase 2B15 polymorphism and bisphenol A concentrations in blood: Results from physiologically based kinetic modelling. Arch. Toxicol. 2013, 87, 1–8. [Google Scholar] [CrossRef] [PubMed]
- Teeguarden, J.; Hanson-Drury, S.; Fisher, J.W.; Doerge, D.R. Are typical human serum BPA concentrations measurable and sufficient to be estrogenic in the general population? Food Chem. Toxicol. 2013, 62, 949–963. [Google Scholar] [CrossRef] [PubMed]
- Teeguarden, J.G.; Calafat, A.M.; Ye, X.; Doerge, D.R.; Churchwell, M.I.; Gunawan, R.; Graham, M.K. Twenty-four hour human urine and serum profiles of bisphenol a during high-dietary exposure. Toxicol. Sci. 2011, 123, 48–57. [Google Scholar] [CrossRef] [PubMed]
- Teeguarden, J.G.; Twaddle, N.C.; Churchwell, M.I.; Doerge, D.R. Urine and serum biomonitoring of exposure to environmental estrogens I: Bisphenol A in pregnant women. Food Chem. Toxicol. 2016, 92, 129–142. [Google Scholar] [CrossRef]
- Manrai, A.K.; Cui, Y.; Bushel, P.R.; Hall, M.; Karakitsios, S.; Mattingly, C.; Ritchie, M.; Schmitt, C.; Sarigiannis, D.A.; Thomas, D.C.; et al. Informatics and Data Analytics to Support Exposome-Based Discovery for Public Health. Ann. Rev. Public Health 2016. [Google Scholar] [CrossRef]
Figure 1.
Conceptual representation of the generic Physiology-Based BioKinetic (PBBK) model.
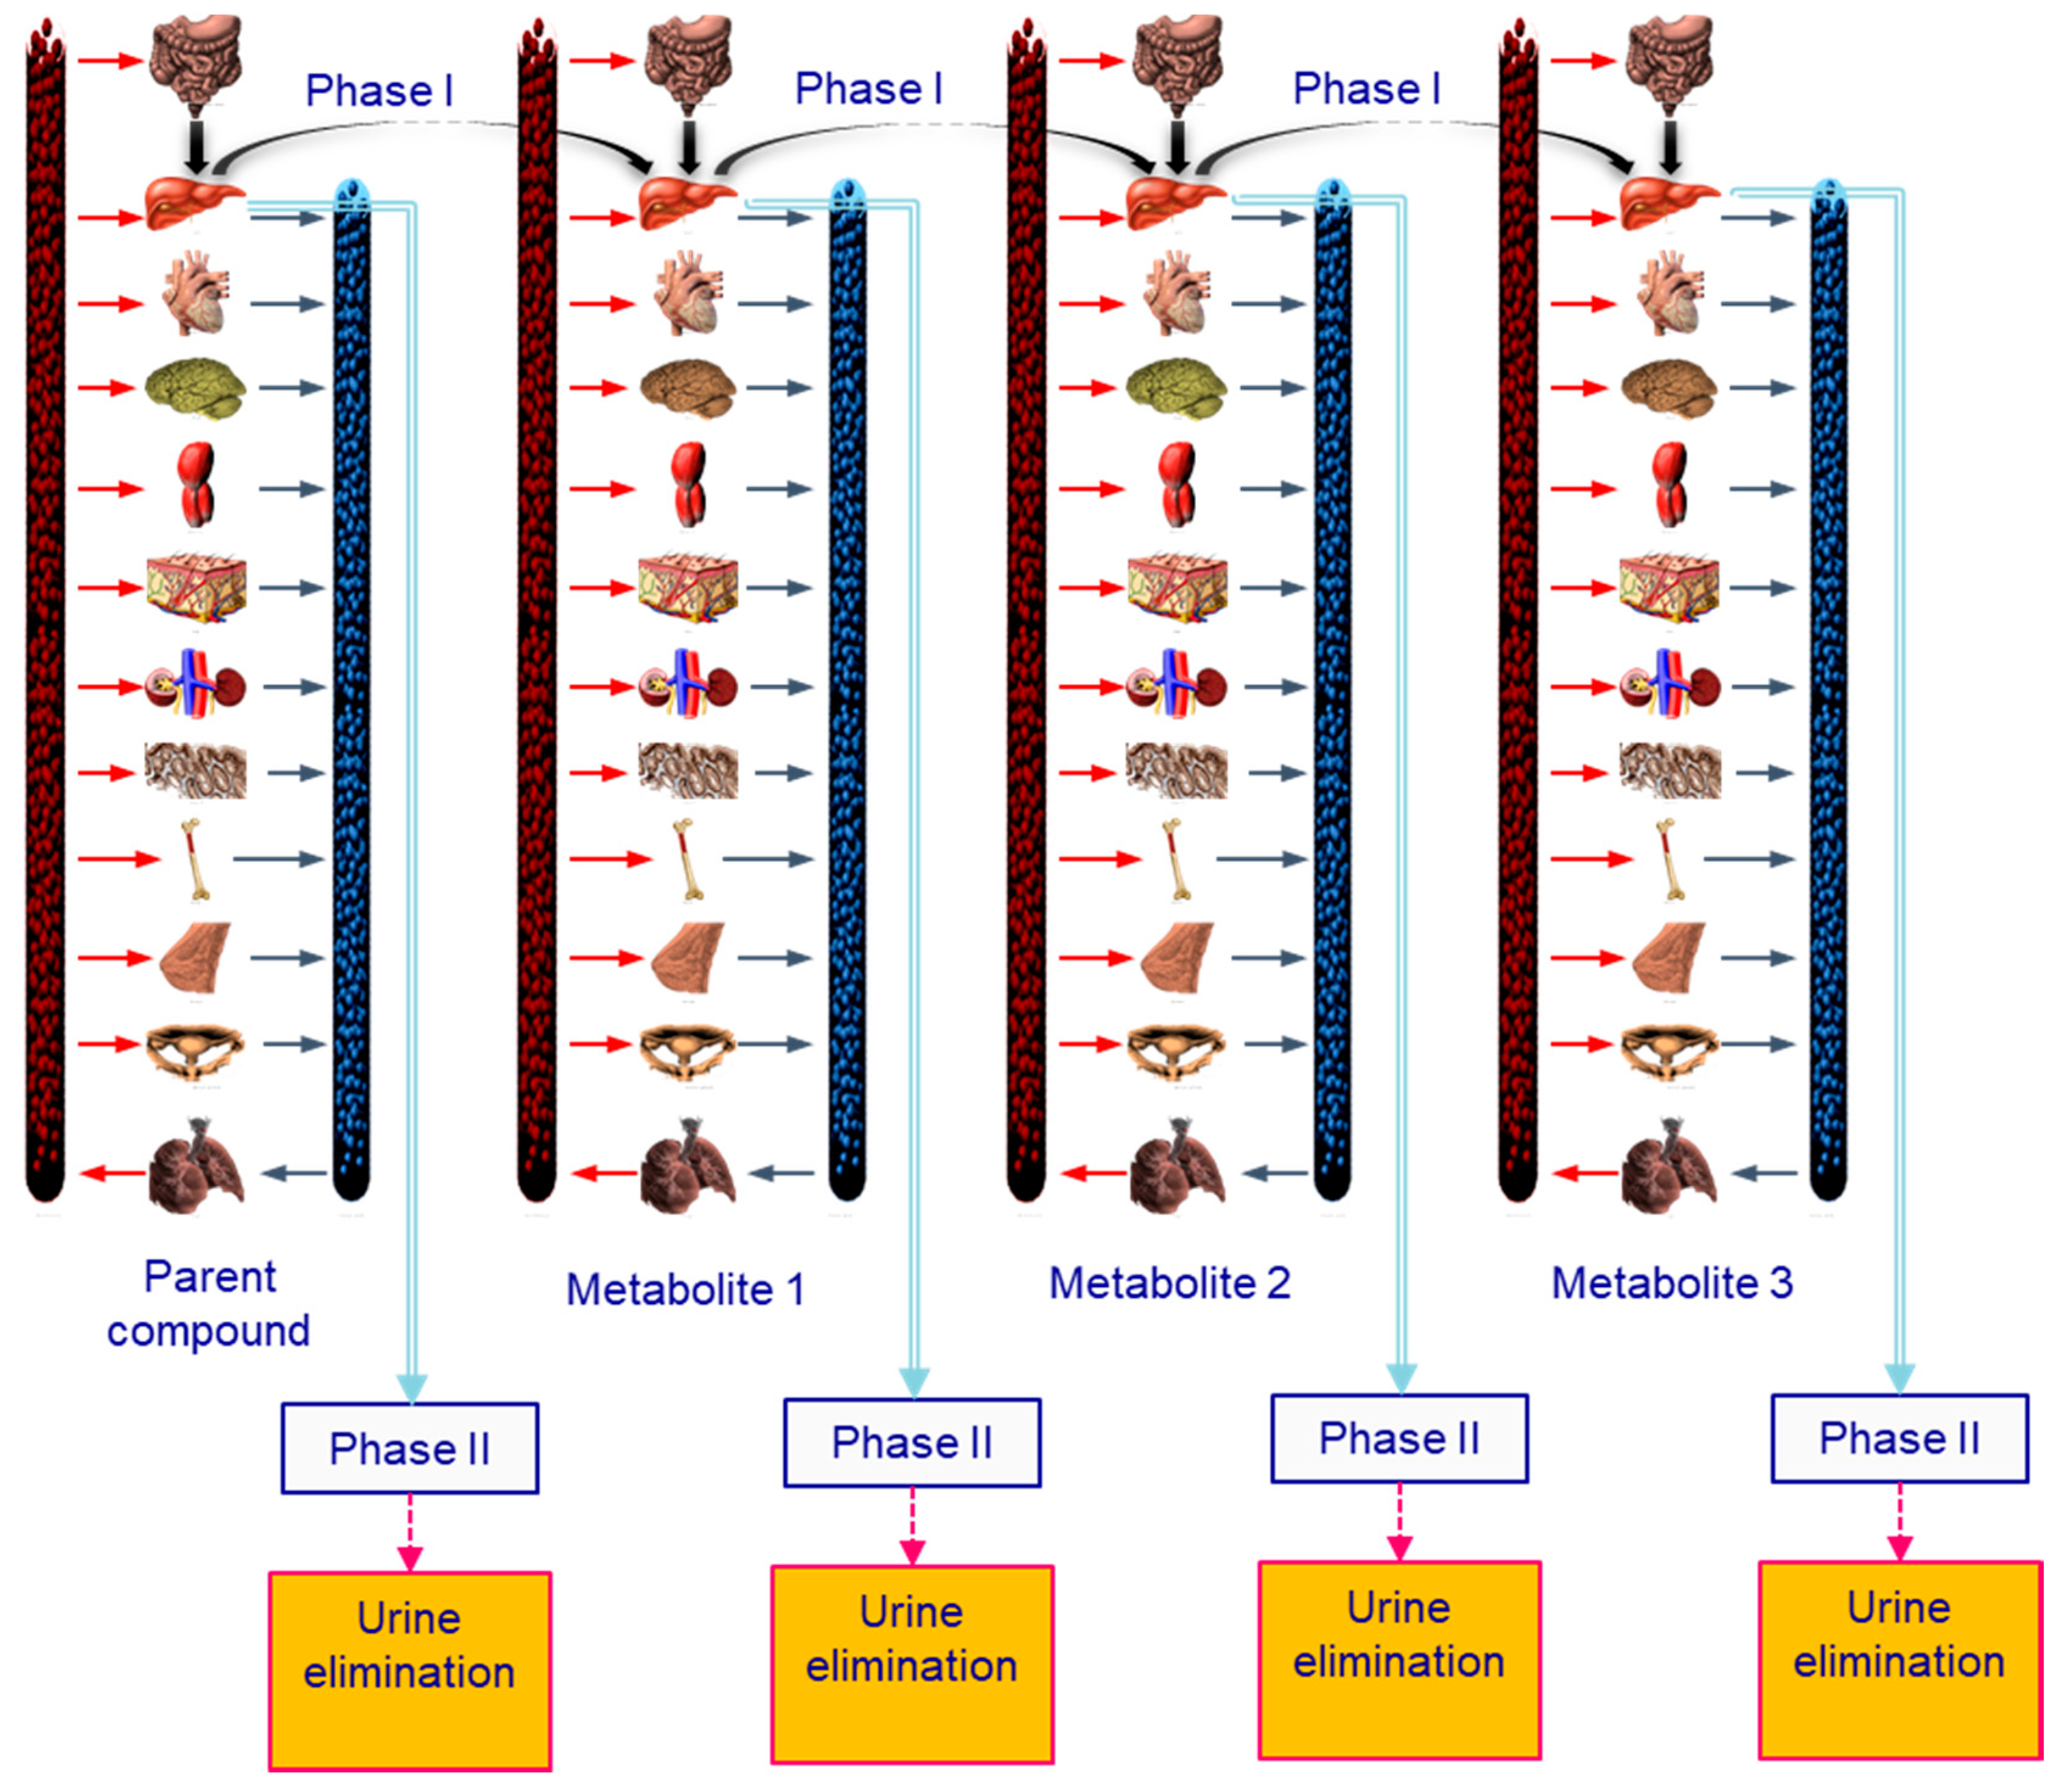
Figure 2.
Exposure reconstruction levels.
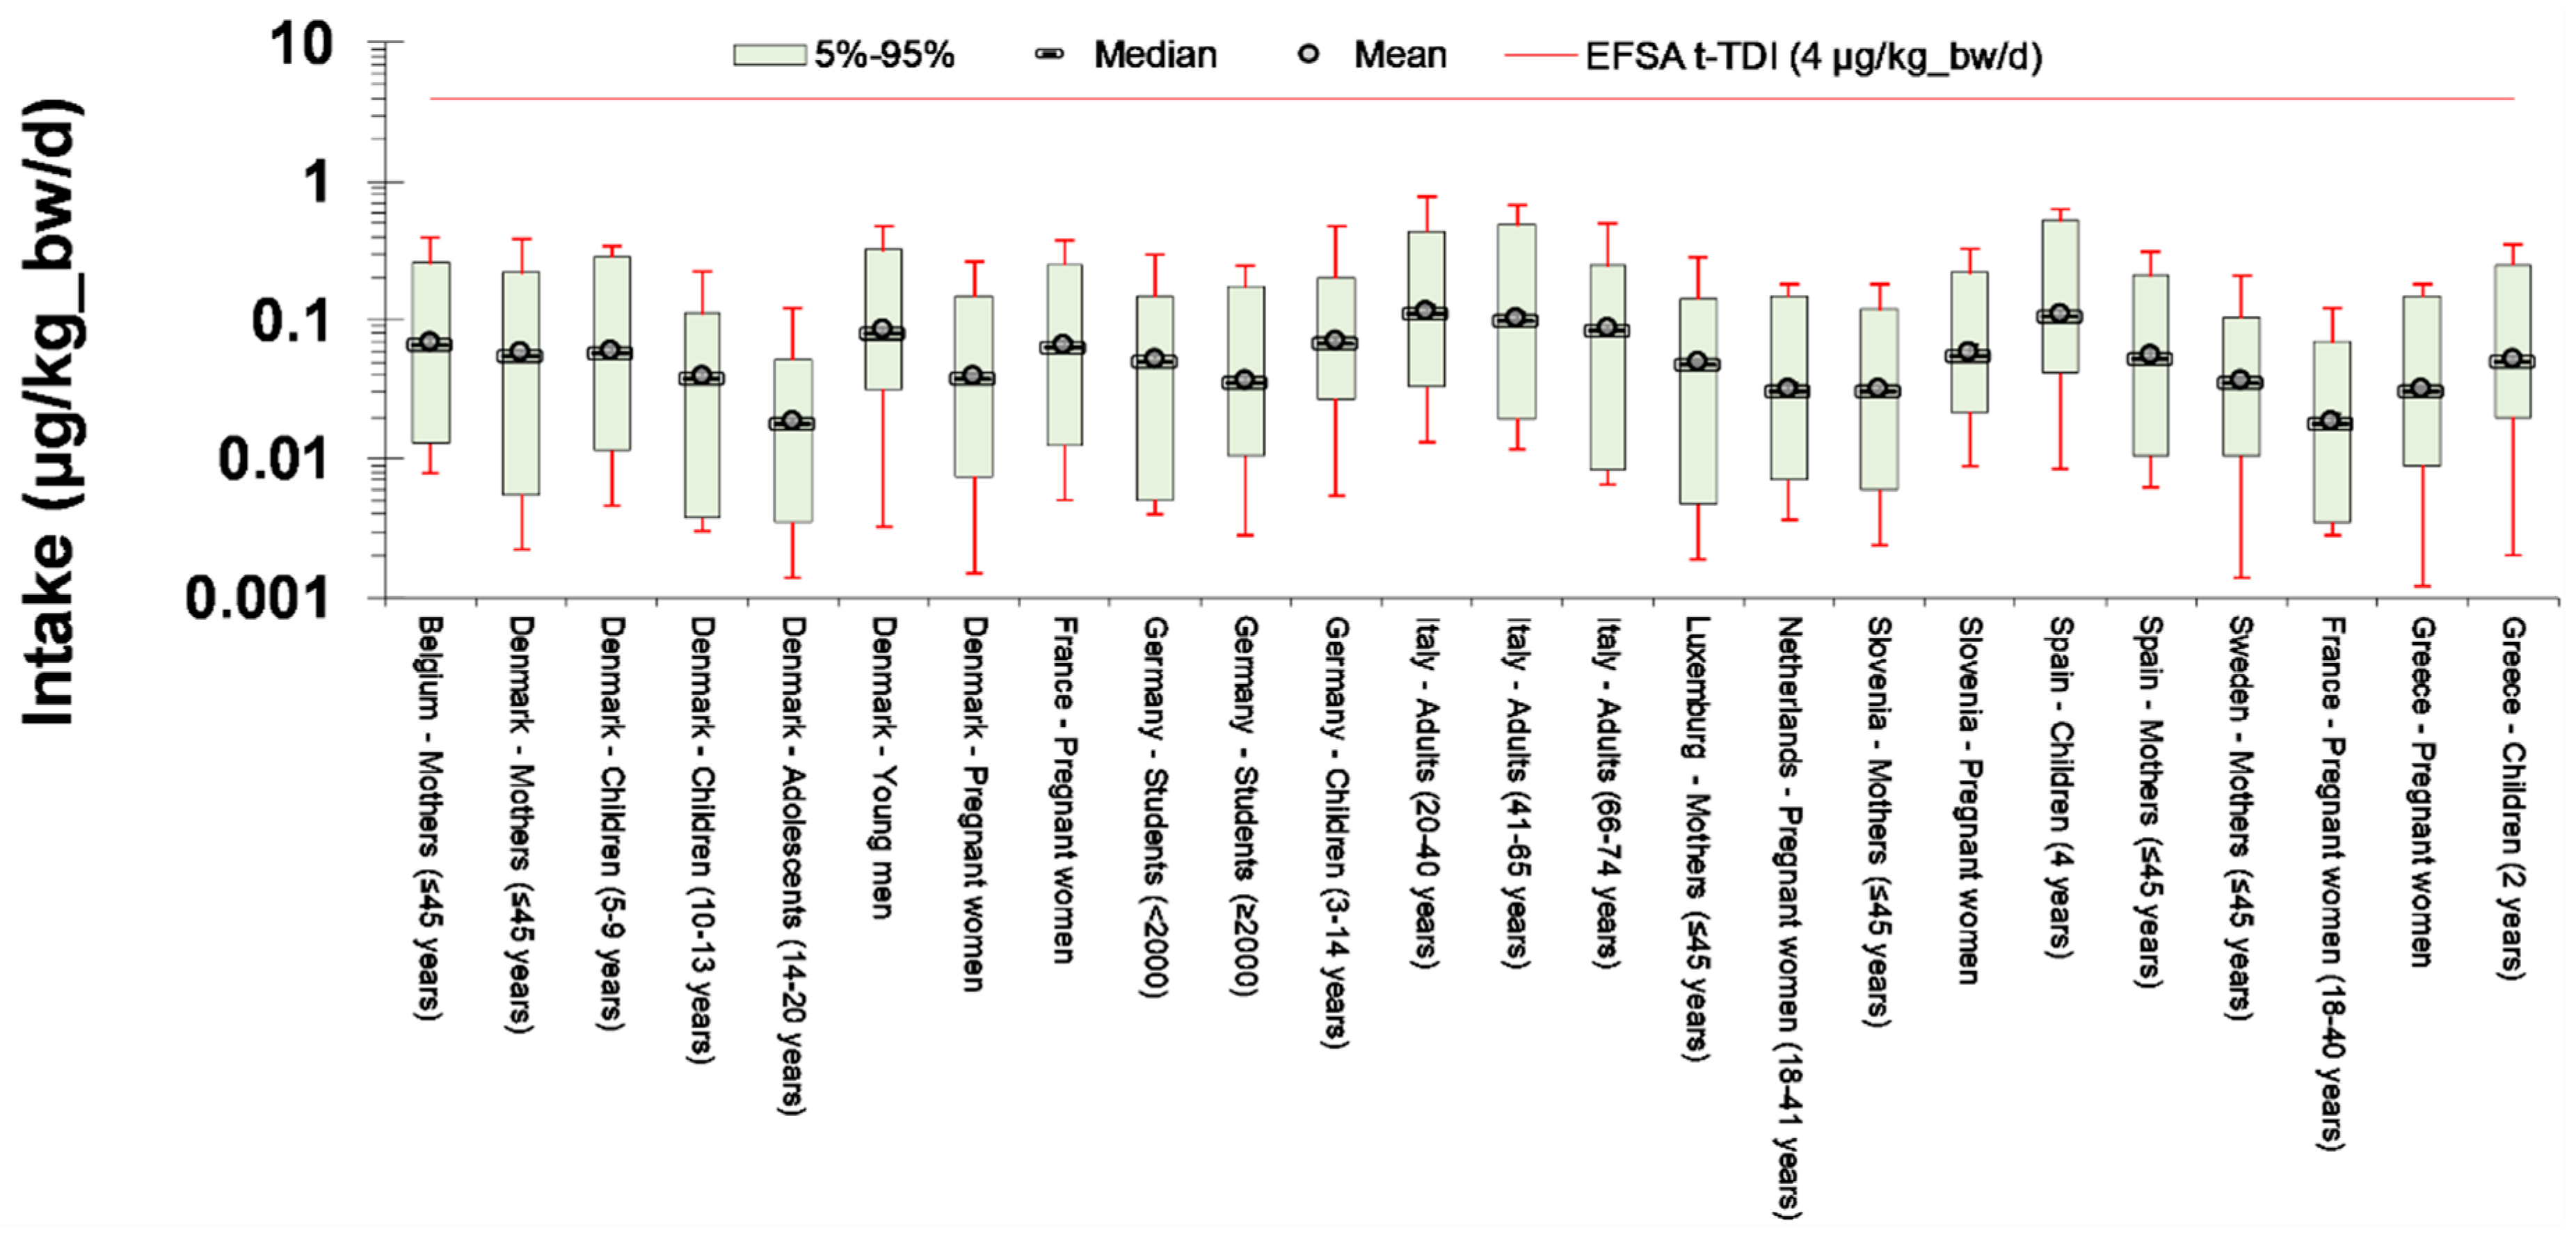
Figure 3.
External exposure, internal exposure (area under the curve, AUC), and urinary BPA levels per a typical 24 h exposure scenario. AUC is denoted as the shaded area included between the red line and the x-axis.
Figure 3.
External exposure, internal exposure (area under the curve, AUC), and urinary BPA levels per a typical 24 h exposure scenario. AUC is denoted as the shaded area included between the red line and the x-axis.

Figure 4.
Free plasma BPA for the population included in the included HBM studies (refined internal exposure analysis).
Figure 4.
Free plasma BPA for the population included in the included HBM studies (refined internal exposure analysis).
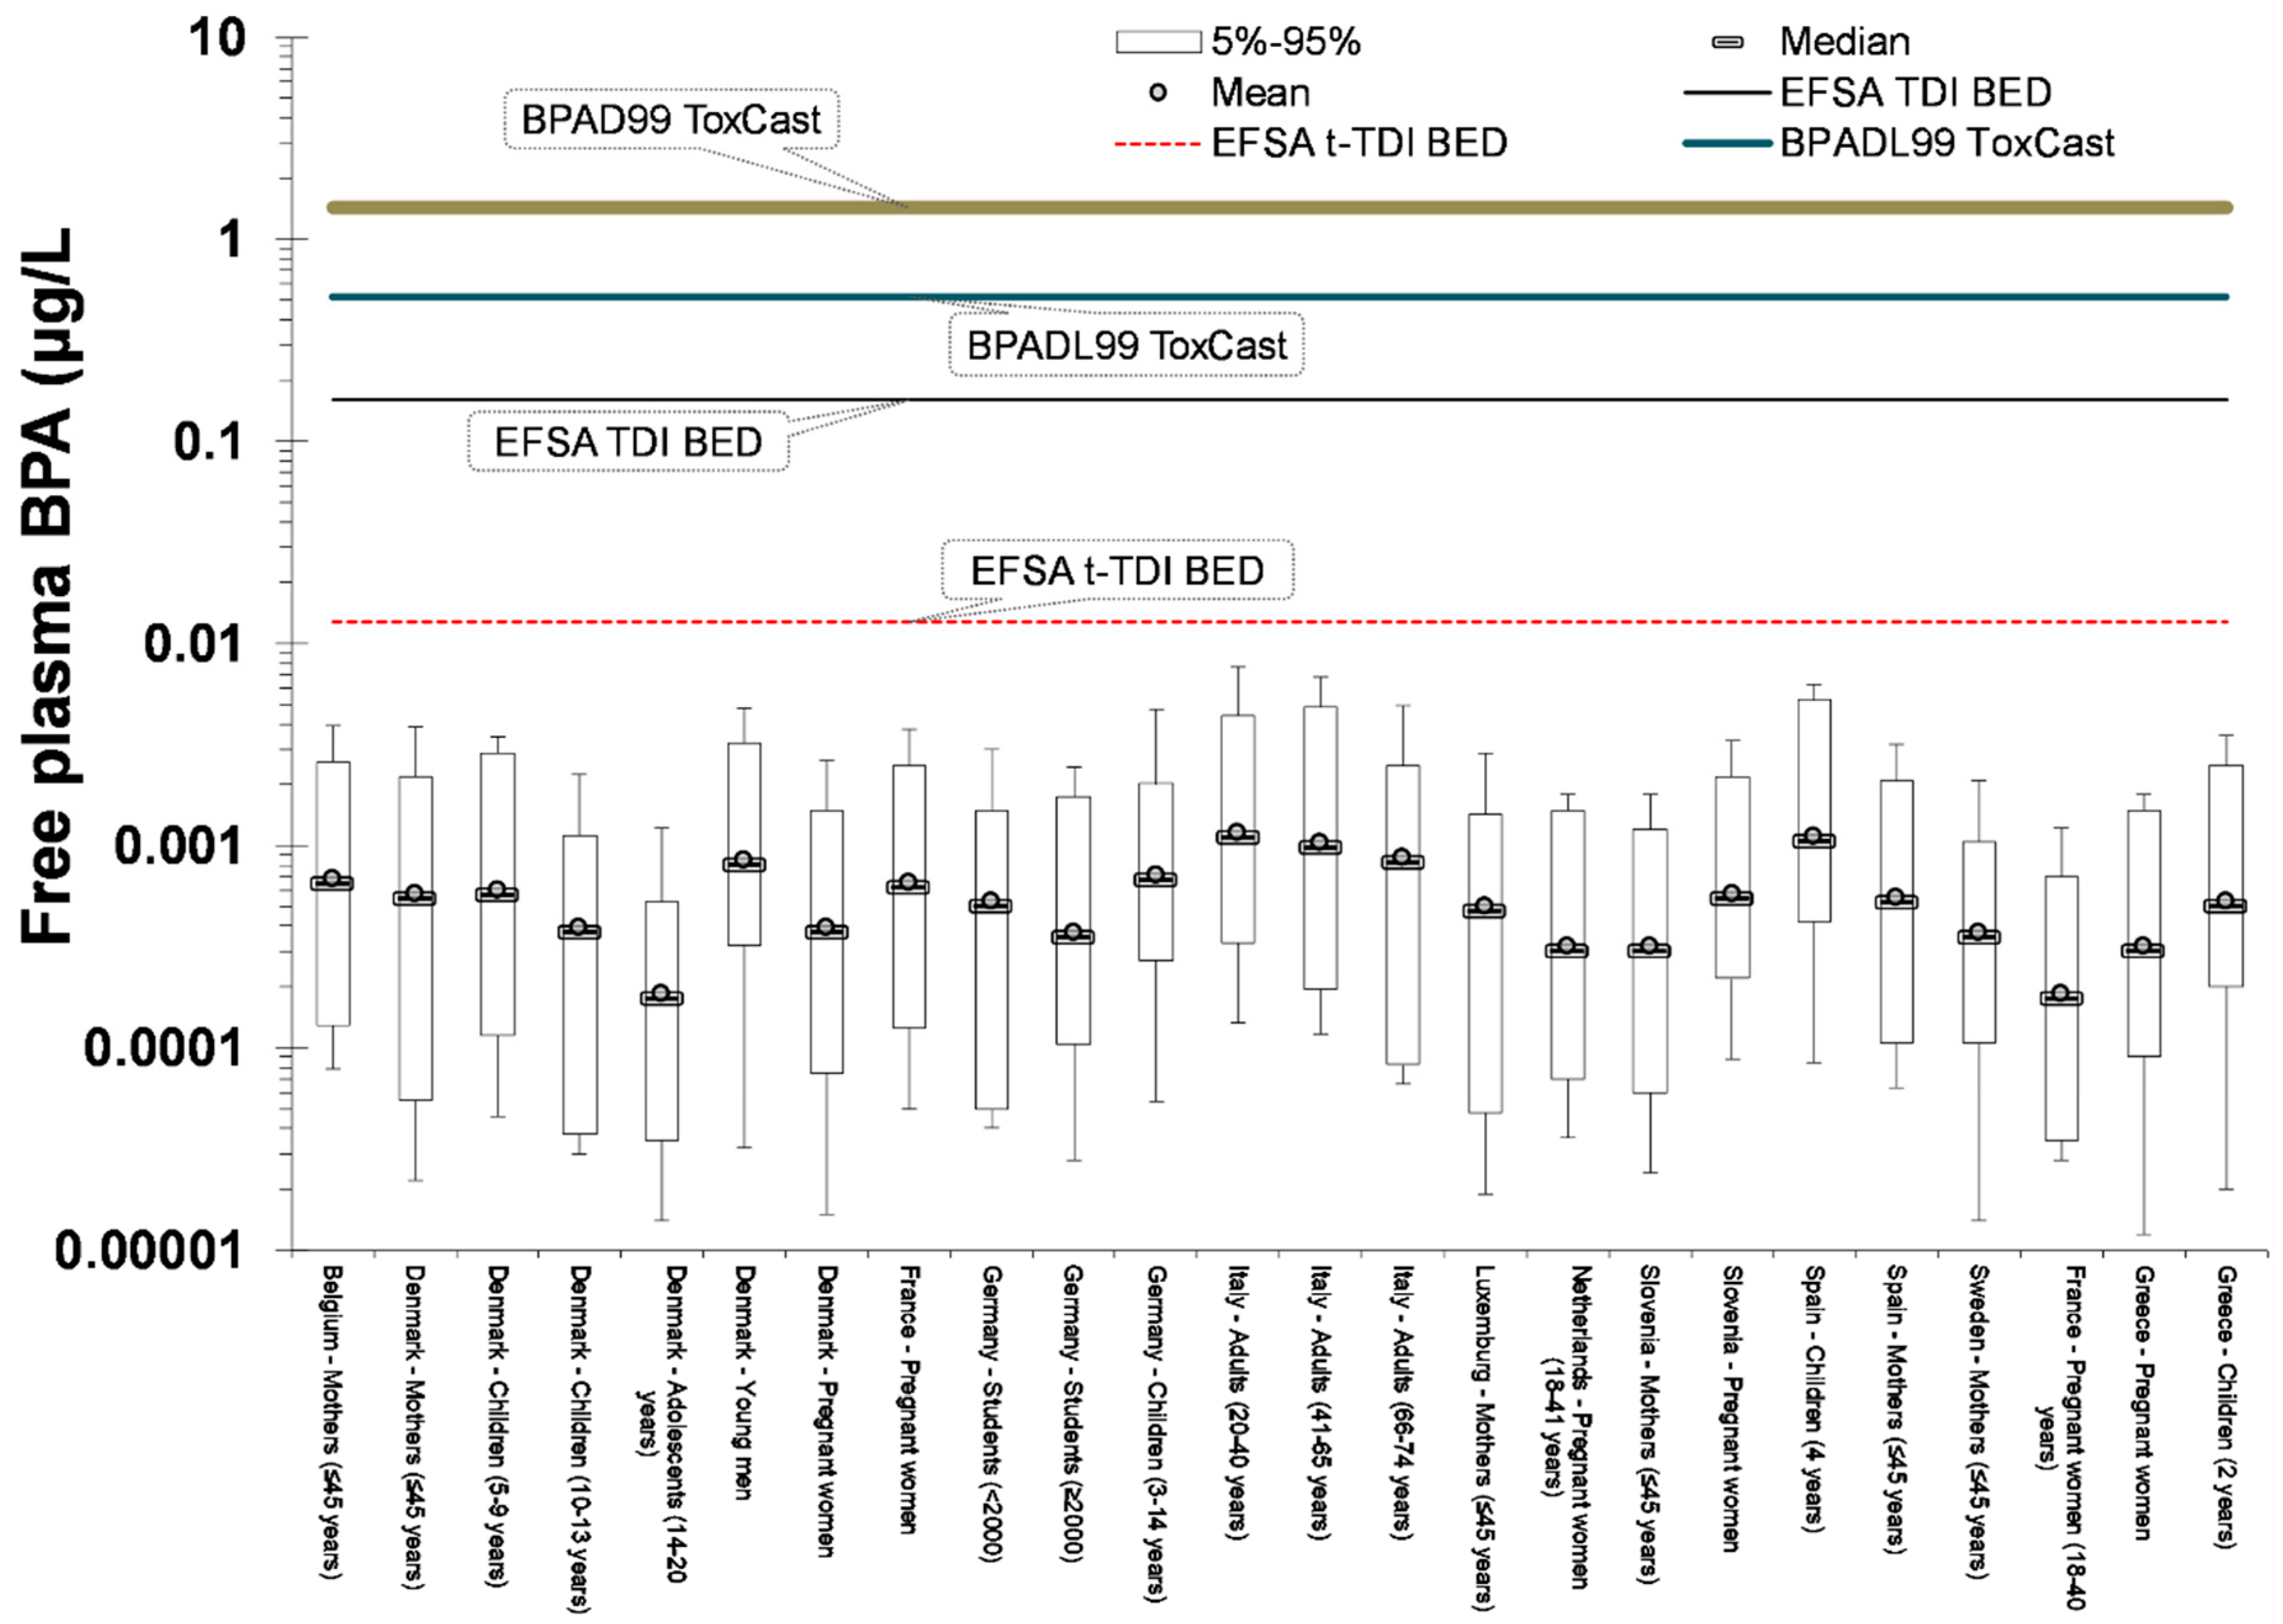
Figure 5.
Understanding the major parameters inducing bioavailability differences.

Table 1.
Urinary bisphenol A (BPA)-Glu levels from European human biomonitoring studies.
| Country—Study Name | Population Group | Mean | Median | Reference |
|---|---|---|---|---|
| Belgium—Democophes | Mothers (≤45 years) | 2.6 | [41] | |
| Denmark—Democophes | Mothers (≤45 years) | 2.2 | ||
| Denmark—Copenhagen Puberty Study | Children and adolescents (5–9 years) | 2.3 | [42] | |
| Children and adolescents (10–13 years) | 1.5 | |||
| Children and adolescents (14–20 years) | 0.7 | |||
| Denmark—Copenhagen Study on Male Reproductive Health | Young men | 3.2 | ||
| Denmark—Odense Child Cohort | Pregnant women | 1.5 | ||
| France—ELFE | Pregnant women | 2.5 | 2 | [38] |
| Germany—ESB | Students (<2000)—Münster | 2.0 | [39] | |
| Students (≥2000)—Münster | 1.4 | |||
| Germany—GerES | 3–14 years | 2.7 | 2.7 | [43] |
| 3–5 years | 3.5 | 3.6 | ||
| 6–8 years | 2.8 | 2.7 | ||
| 9–11 years | 2.1 | 2.2 | ||
| 12–14 years | 2.6 | 2.4 | ||
| Italy—InCHIANTI | 20–40 years | 4.4 | 4.3 | [44] |
| 41–65 years | 3.9 | 3.7 | ||
| 66–74 years | 3.3 | 3.2 | ||
| Luxembourg—Democophes | Mothers (≤45 years) | 1.9 | [41] | |
| Netherlands—Generation R | Pregnant women (18–41 years) | 1.2 | 1.1 | [45] |
| Slovenia—Democophes | Mothers (≤45 years) | 1.2 | [41] | |
| Spain—INMA | Pregnant women | 2.2 | [46] | |
| Spain—INMA | Children (4 years) | 4.2 | ||
| Spain—Democophes | Mothers (≤45 years) | 2.1 | [41] | |
| Sweden—Democophes | Mothers (≤45 years) | 1.4 | ||
| France—ELFE | Pregnant women (18–40 years) | 0.7 | [47] | |
| Greece—Rhea | Pregnant women | 1.2 | 1.2 | [48] |
| Children (2 years) | 2.0 | 2.1 |
© 2019 by the authors. Licensee MDPI, Basel, Switzerland. This article is an open access article distributed under the terms and conditions of the Creative Commons Attribution (CC BY) license (http://creativecommons.org/licenses/by/4.0/).
Share and Cite
MDPI and ACS Style
Sarigiannis, D.; Karakitsios, S. Advancing Chemical Risk Assessment through Human Physiology-Based Biochemical Process Modeling. Fluids 2019, 4, 4. https://doi.org/10.3390/fluids4010004
AMA Style
Sarigiannis D, Karakitsios S. Advancing Chemical Risk Assessment through Human Physiology-Based Biochemical Process Modeling. Fluids. 2019; 4(1):4. https://doi.org/10.3390/fluids4010004
Chicago/Turabian StyleSarigiannis, Dimosthenis, and Spyros Karakitsios. 2019. "Advancing Chemical Risk Assessment through Human Physiology-Based Biochemical Process Modeling" Fluids 4, no. 1: 4. https://doi.org/10.3390/fluids4010004