Abstract
Coal mine gas with methane concentrations below 8% cannot sustain stable self-combustion, posing significant challenges for safe utilization and greenhouse gas mitigation. To address this limitation, we developed a large-scale industrial square rotary regenerative thermal oxidizer (RTO) capable of high-efficiency oxidation under ultra-low methane conditions. This work integrates multi-scale computational fluid dynamics (CFD) modeling, laboratory and pilot-scale physical experiments, and multi-physics coupled simulations to capture the complex interactions of fluid flow, species transport, and thermal response in regenerative ceramics. Compared with conventional circular or three-bed RTOs, the proposed square rotating design achieves 13% higher heat storage utilization, 15% smaller floor area, and enhanced spatial uniformity of the temperature field. Multi-scale simulations reveal that increasing methane molar fraction (CH4) from 0.012 to 0.017 raises the peak temperature from 1280 K to 1350 K, reduces the burnout height from 1.18 m to 1.15 m, and, under constant oxygen supply, extends the high-temperature zone to 1450 K with a stabilized burnout position at 1.06 ± 0.01 m. Incorporating a 15° conical expansion combustion chamber increases local turbulent kinetic energy by 17.4%, accelerating oxidation while maintaining methane removal rates > 98% within an optimized bottom blowing time of 30–90 s. This study not only provides validated design thresholds for ultra-low concentration methane oxidation—such as temperature windows, buffer zones, and switching cycles—but also offers an engineering framework for scaling RTO systems to industrial coal mine applications. This advances both energy recovery efficiency and methane emission control, demonstrating clear advantages over existing RTO configurations.
1. Introduction
With ongoing advances in science and engineering and the tightening of environmental regulations, the control of industrial off-gases is undergoing rapid innovation [,]. Particular attention has shifted to diluting combustible streams that combine low pollutant concentrations with large volumetric flow rates and pronounced temporal fluctuations. Although medium-concentration gases (approximately 8–30% by volume) can be valorized for power generation via internal combustion deflagration, sub-8% streams remain difficult to treat because their heating value and flame stability are insufficient for direct utilization, and their concentrations vary widely in practice [,,]. Consequently, direct combustion technologies for such streams remain largely at the industrial trial stage; fluctuations in underground gas extraction further undermine process stability, limiting large-scale adoption. The result is a utilization rate of only ~45% and the annual venting of about 8 billion m3 of coal mine gas []. This inefficiency not only wastes a valuable energy resource but also heightens environmental risk, underscoring the urgent need for robust, energy-efficient oxidation solutions tailored to low-concentration gases [,,,].
Available treatment strategies for diluting industrial gases can be grouped into recovery and destructive pathways [,]. Recovery methods—adsorption, absorption, and condensation—rely on physical separation and are effective when gas compositions are relatively simple; however, for low-concentration, multi-component, high-throughput streams, single recovery technologies rarely meet emission standards and often require coupling with downstream oxidation. Destructive methods convert pollutants to CO2 and H2O via thermal oxidation, catalytic oxidation, non-thermal plasma, photocatalytic oxidation, or bio-oxidation [,]. Despite significant progress, non-thermal plasma, photocatalysis, and biological systems face challenges in operational stability, tolerance to humidity and poisons, and stringent case-specific requirements, which constrain their scalability and general applicability []. By contrast, thermal oxidation offers high reliability, rapid response to load fluctuations, and mature engineering practice, making it one of the most practical options under China’s industrial conditions.
Within thermal oxidation, regenerative thermal oxidation (RTO) integrates complete oxidation with ceramic heat recovery, achieving high removal efficiencies (>96%), low secondary pollution, and substantial reductions in auxiliary fuel consumption—industrial demonstrations report energy savings exceeding 70% relative to conventional direct oxidation [,,]. As a result, the regenerative thermal oxidizer has been extensively studied and widely implemented across industries. Building on this foundation, the present study addresses the persistent challenge of ultra-low-concentration gas abatement by examining a rotary RTO architecture in which the conventional circular rotating regenerator is reconfigured into a square geometry [,]. This geometric redesign is intended to improve flow distribution and enhance heat storage uniformity under fluctuating inlet conditions. By elucidating the thermal performance and abatement efficiency of the square regenerator rotary RTO for low-concentration gas treatment, this work highlights the necessity of a pathway toward stable, scalable, and energy-efficient industrial deployment.
2. Model Overview and Working Principle of Square Rotary RTO
The square rotary RTO offers distinct advantages over traditional circular rotary RTO systems. First, its effective regenerator utilization rate is 13% higher than that of circular designs. By adopting a square configuration for both the regenerator and combustion chamber, the system fully exploits the geometry of square regenerative honeycomb ceramic materials, eliminating irregular or wasted spaces. In contrast, circular rotary RTOs typically partition their chambers into 9–12 fan-shaped sectors (e.g., 12 sectors in Figure 1), resulting in a circular central rotating valve and non-functional triangular or semicircular regenerative zones. These areas are often filled with high-temperature insulation material, as illustrated by the white outer layer in Figure 1.
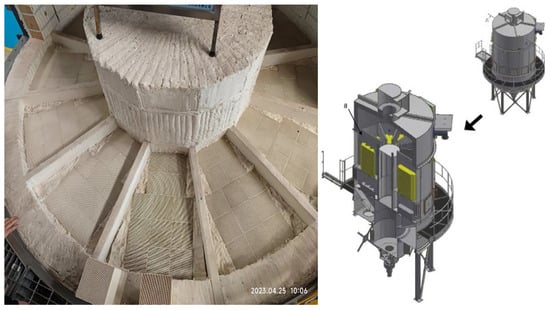
Figure 1.
Three-dimensional structure display of circular RTO.
Additionally, for systems processing equivalent air volumes, the square RTO reduces the footprint by 15% compared to circular counterparts (Figure 1 and Figure 2). Traditional experimental methods face limitations in observing internal flow fields, combustion dynamics, and heat transfer within RTOs due to their high-temperature sealed environments []. Furthermore, the scarcity of research on square rotary RTOs forces technicians to rely on empirical trial and error for parameter optimization, lacking robust theoretical guidance. Operational challenges include imprecise control of regenerator height, unclear impacts of gas residence time on combustion efficiency, and insufficient understanding of the ventilation time’s effect on regenerator temperature. These issues contribute to temperature instability and incomplete gas oxidation in exhaust streams.
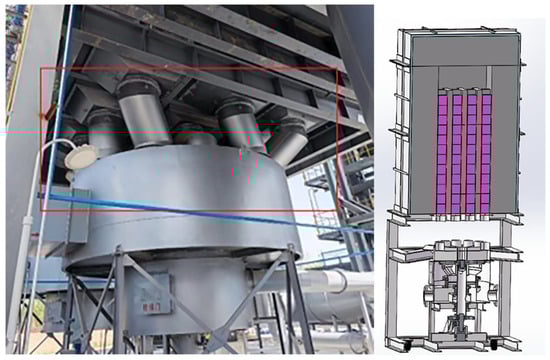
Figure 2.
Three-dimensional structure display of square RTO.
The red area represents the import/export switching equipment and the rotating equipment of the RTO. The red area indicates where the tank equipment is burning. The lower part of the red area is for the motor control equipment, which controls the switching/rotation of the red area. The overall model is shown in the above figure. The model used for the simulation will be mentioned later.
To address these gaps, this study combines experimental and numerical simulation methods to optimize regenerator geometry, identify ideal ventilation times, and validate results experimentally, ultimately achieving efficient gas purification [,,].
2.1. Model Overview of Square Rotary RTO
The square rotary regenerative thermal oxidizer (RTO), also referred to as a 12-chamber rotary RTO, consists of a combustion chamber, 12 independent ceramic regenerator chambers, and a continuously rotating diverter valve [], shown in Figure 3a. The rotary diverter valve alters the gas flow direction across different regions of the ceramic regenerative beds, enabling continuous preheating of the waste gas. After oxidation and combustion in the combustion chamber, the treated gas is discharged. Compared to conventional valve-switching RTOs, the rotary architecture contains only one moving part—the rotary diverter valve—resulting in improved operational reliability and reduced maintenance requirements [].
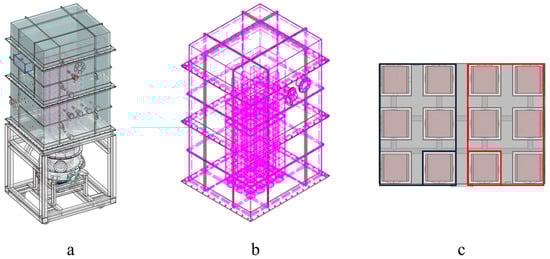
Figure 3.
(a) Model of square experimental RTO furnace (b) Square experimental RTO furnace perspective view (c) Schematic diagram of gas inlet and outlet of square experimental RTO furnace.
The furnace body adopts a modular square layout (Figure 3), with an effective volume of 2.48 m3. Structurally, the layers are arranged from inside to outside as follows:
- Honeycomb ceramic regenerative layer;
- Refractory layer;
- Thermal insulation layer.
The 12 chambers are divided into two modules (Figure 3c):
In the red area, five have the same import speed, while the remaining one separate area is a purging area with a slightly lower speed. Similarly, in the black area, five are outlets, and the remaining one is an isolated closed area. During operation, the rotary diverter valve—driven by a motor—rotates continuously and uniformly, ensuring gradual switching of waste gas among the chambers.
Equipment dimensions: 1252 mm (L) × 1084 mm (W) × 1830 mm (H). Laboratory operating parameters (Table 1):

Table 1.
Parameters of the experimental device RTO.
2.1.1. Regenerator Design and Modeling
The regenerator—critical to RTO performance—utilizes honeycomb ceramic packing with regular hexagonal channel structures due to its high thermal efficiency, low pressure drop, and excellent thermal shock resistance []. Each honeycomb brick measures 100 mm × 100 mm × 100 mm, with multiple parallel channels aligned in stacked placement (Figure 4).
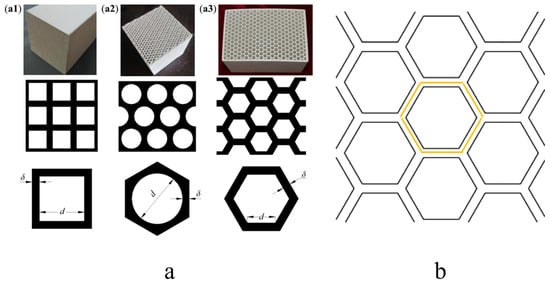
Figure 4.
(a) Regenerative brick model: (a1) Square brick, (a2) round brick, (a3) honeycomb brick (b) Regenerative brick 2D model.
For numerical simulation, a single-channel model was employed to study longitudinal temperature distribution, where
d: inner channel diameter;
δ: half wall thickness of the channel;
l: channel length.
The simulation results from the single-channel model, combined with experimental data, were mapped to the full-scale regenerator model for system-level analysis [].
2.1.2. Combustion Chamber Configurations
Two combustion chamber geometries were compared (Figure 5):
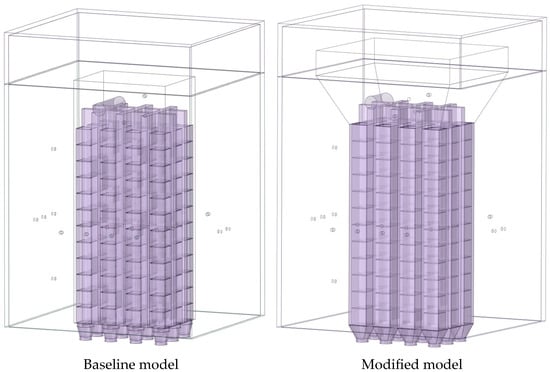
Figure 5.
Geometric variation of the models.
Baseline model—cuboid structure, volume 0.0812 m3 (cost-effective design for baseline performance verification);
Optimized design—tapered frustum shape with a divergence angle of 15°, volume 0.2275 m3, representing a 2.8-fold increase in volume compared to the baseline. The optimized configuration forms a variable cross-section flow channel, promoting improved gas mixing [,,] and aiming for higher combustion efficiency, reduced pollutant emissions, and greater system reliability.
2.2. Experimental Setup and Conditions
The experiments were performed using a Special Rotating R-RTO Regenerative Oxidizer for Ultra-Low Concentration Coal Mine Gas. Key subsystems include the following:
- Air supply—gas mixer for feed preparation;
- Transportation—fans, pipelines, fittings;
- Distribution/regulation—pneumatic control valves, pneumatic switching valves;
- Monitoring—thermocouples, pressure gauges, flow meters, gas analyzers;
- Control—PLC intelligent control cabinet and automatic data acquisition center.
a: Assembly and Commissioning
The system was assembled and tested in stages:
- Fabrication of the rotary valve and square combustion chamber;
- Airtightness testing of both components;
- Procurement of auxiliary equipment, valves, instruments, and control systems;
- Pipeline fabrication, installation, and leakage inspection;
- Valve, instrument, and pipeline integration;
- Cable laying and control cabinet assembly;
- Overall system commissioning.
b: Gas Supply
Experimental gases included methane, clean air, and compressed air, prepared to meet required concentrations.
c: Temperature Measurement
Thermocouples were installed at key points on the RTO body and pipelines, transmitting data remotely to the control system.
d: Gas Composition Measurement
Gas composition was monitored in real time via the following:
- Online analyzers (Gasboard-3500 CH4/O2, DS-200Ex CH4 infrared);
- Portable detectors (ADKS-1(Ex), JCB4 catalytic methane analyzer).
e: Reproducibility Assurance
- Continuous online data recording with centralized analysis;
- Standardized operation procedures and complete experiment logs;
- Control and multi-condition experiments to verify stability.
2.3. Establishment of Mathematical Model
The whole process includes several physical, and the corresponding mathematical models are established according to the references: (1) The basic mass and heat conservation model, which is generally used in the flow and heat transfer process. (2) The finite-rate/eddy dissipation model is selected in calculating the combustion process, and previous studies have shown the model has high accuracy in simulating a similar process [,,]. (3) The porous media model is selected to simplify the ceramic honeycomb regenerator zone []. This model is widely used in simulating gas flowing in a pipe bundle or particles. It can give acceptable flow parameter distribution in the porous media zone with low computing resource.
2.3.1. Governing Equation
Based on the above assumptions, the governing equations for the gas within the channel are as follows:
Mass conservation equation:
Momentum conservation equation:
Energy conservation equation coupled with radiative heat transfer model:
2.3.2. The Turbulent Flow Models
Mixture fraction transport equation:
Mixture fraction variance transport equation:
where the symbols in the equations represent the following meanings: ρ: density, kg/m3; : velocity vector, m/s; p: pressure, Pa; μ: dynamic viscosity, Pa·s; μt: turbulent viscosity, Pa·s; k: turbulent kinetic energy, m2/s2; ε: turbulent kinetic energy dissipation rate, m2/s3; σk: Prandtl number of turbulent kinetic energy, and the value is 1.0; σε: Prandtl number of turbulent kinetic energy dissipation rate, and the value is 1.3; Pk: generation rate of turbulent kinetic energy, W/m3; h: enthalpy, J/kg; T: temperature, K; : effective thermal conductivity, W/(m·K); Qr: heat source, W/m3; f: mixture fraction; σt: turbulent diffusion Prandtl constant; : mean square value of the mixture fraction; C1: model coefficient; C2, σk, and σε: model constants.
2.3.3. Combustion Model
The global single-step mechanism (the combustion simulation adopts a simplified mechanism for “macroscopic combustion behavior”) is selected, assuming that reactants directly generate products in one step, and ignoring the intermediate free radical reactions. The governing equations are as follows:
The symbols in the equations represent the following parameters: v′i and v′j are the stoichiometric coefficients of reactants i and j, respectively; v″i and v″j are the stoichiometric coefficients of products i and j, respectively; Cj is the molar concentration of reactant or product j (mol/L); ηj is the forward reaction rate index of reactant or product j; kf is the chemical reaction rate constant (L/(mol·s)); Ri is the decomposition rate of reactant i (mol/(L·s)); A is the pre-exponential factor of the reaction; E is the activation energy of the reaction (kJ/mol); R is the molar gas constant (J/(mol·K)); T is the absolute temperature (K); β is the temperature index; Mi and Mj are the relative molecular masses of substances i and j, respectively; Yr and Yp are the mass fractions of reactants and products, respectively; v′R is the stoichiometric coefficient of the reactant; MR is the relative molecular mass of the reactant; p is the system pressure (Pa); and a and b are empirical constants, where a = 4.0 and b = 0.5.
2.3.4. Porous Media Model
Porous Media Momentum Equation: Compared to the governing equations for standard fluid flows, the momentum equation incorporates an additional source term that accounts for the presence of porous media. This source term comprises two components, which are the viscous loss term and the inertial loss term:
where Si is the source term in the momentum equation for the corresponding coordinate direction (x, y, z); D and C are coefficients that must be specified prior to numerical simulation, typically determined through empirical formulas. The term represents the viscous loss, represents the inertial effects. μ is the dynamic viscosity and vi is the velocity component in the i-direction (m/s).
Within the porous flow domain, a pressure gradient exists, and the fluid velocity is proportional to the pressure drop, which generates a source term in the porous media. The fundamental principle of the porous media model involves adding an additional momentum source term to the standard momentum equation. Since the porous flow domain exhibits uniform distribution, the relationship can be expressed as follows:
where is the velocity in the corresponding coordinate direction, is the viscous resistance coefficient, and is the inertial resistance coefficient.
Equation (15) is the formula for calculating the cross-sectional area of the holes in the checker bricks. Equation (16) is the formula for calculating the porosity of the porous media.
where is the area of a single channel, is the number of holes, and is the total area of a single brick. Each heat storage chamber has 625 holes, with a single area of 9.6 square millimeters and an overall area of 0.01 square meters. It can be calculated that the porosity is 0.6.
2.4. Computational Methods and Boundary Conditions
The governing equations, including the continuity equation, momentum equation, and energy equation, are solved numerically. For the single-channel model, a laminar flow model is employed, while the overall model adopts the realizable k-ε turbulence model. The methane combustion process utilizes the eddy dissipation/finite rate model within the species transport framework. The Discrete Ordinates (DO) model serves as the radiation model, and the porous media model simulates airflow through the ceramic regenerator in the overall model. Since the airflow direction in the RTO requires periodic switching during actual operation, transient calculations are more appropriate. The Pressure-Implicit with Splitting of Operators (PISO) algorithm is selected for pressure/velocity coupling, with the first-order upwind scheme applied to convective terms [,]. The specific settings are shown in Appendix A.
Grid Independence Verification
The single-channel model employs a mesh combining tetrahedral and hexahedral elements, as illustrated in Figure 6. Mesh quality directly correlates with calculation accuracy. While reasonably increasing the number of mesh elements can effectively improve calculation accuracy, excessive mesh density increases computation time and reduces efficiency. Therefore, three mesh configurations with different element counts are selected for grid independence verification in the single-channel calculation: 260,000, 750,000, and 1.22 million elements in Figure 7.
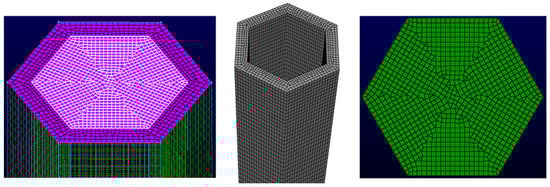
Figure 6.
Single-channel model mesh.
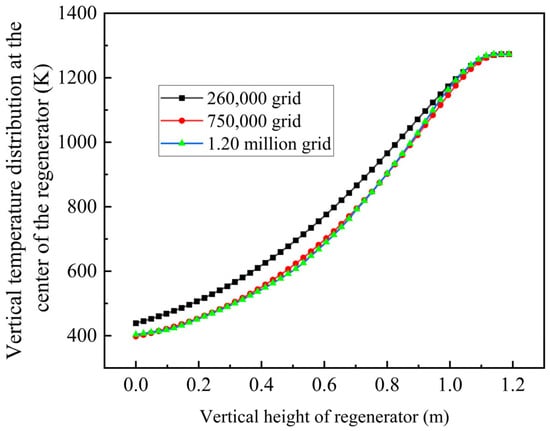
Figure 7.
Grid independence verification.
Using identical boundary conditions and calculation methods, numerical simulations are conducted with airflow direction switching every 30 s over a 330 s duration []. The temperature distribution at the channel center serves as the error criterion. The simulation results demonstrate that the 260,000-element mesh produces temperature distributions that deviate from other calculations, potentially introducing errors. Considering both experimental requirements and computational efficiency, the 750,000-element mesh configuration is selected for subsequent calculations, as this approach provides sufficient mesh accuracy to meet calculation requirements.
3. Results and Analysis
3.1. Simulation Results of the Single Channel
Prior to operation of the gas thermal reverse-flow oxidation device, the ceramic bed requires preheating with hot air to achieve the initial temperature necessary for methane oxidation. To investigate the temperature distribution within the regenerator more precisely, a single-channel model is employed. The preheating air parameters are configured as follows: hot air temperature at the top outlet is 1273 K with a velocity of 3 m/s; cold air temperature at the bottom inlet is 379 K with a velocity of 1.39 m/s; and the blowing duration for each cycle is 30 s. Following repeated purging and preheating cycles, the temperature variation within a single heat storage channel is monitored. Heating ceases when the temperature at the regenerator top reaches the operational range of 950–1050 °C specified for this device, after which gas introduction commences. The preheating simulation results are presented as follows.
Figure 8 shows the inlet and outlet at opposite ends, which are continuously interchanged when the flow direction reverses. The specific dimensions are shown in the figure. The hexagon region with 0.53 mm wall thickness in the middle section represents a single channel within the regenerator. The channel is 1200 mm long and the inner diameter is 3.4 mm. All physical property parameters, including temperature and species, are collected along the middle red line, which is convenient for subsequent data analysis.
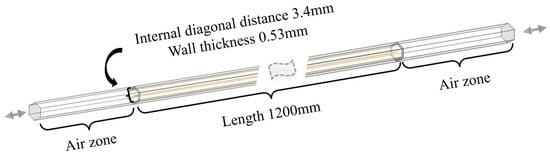
Figure 8.
Schematic diagram of the single-channel model.
Through simulation analysis, the temperature within the channel exhibits a sigmoidal distribution following repeated purging cycles, as illustrated in Figure 9. The temperature at the top reaches 1271 K (998 °C) and the temperature at the bottom is 345 K (72 °C), which satisfies the specified temperature requirements.
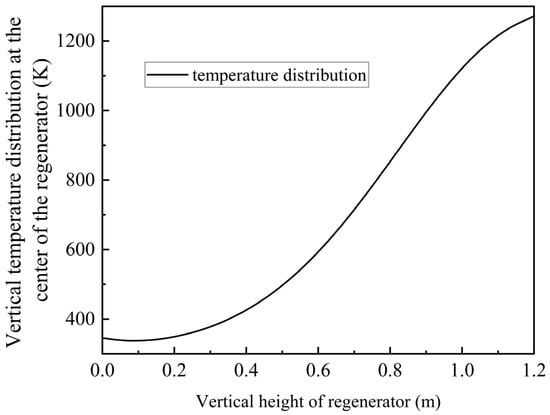
Figure 9.
Preheating temperature distribution at the middle position of the single channel.
To investigate whether the gas residence time within the channel meets the operational requirements, the transit time of gas through the channel is analyzed. Based on the single-channel model, the gas combustion flow characteristics are examined through numerical calculation. The chemical reaction equations are shown in Table 2, The flue gas composition is specified in Table 3.
Table 2.
Chemical reaction hierarchy.
Table 3.
Flue Gas Parameter Constraints.
Figure 10 demonstrates that the gas completely traverses the 1.2-m-long regenerator channel within 0.4 s. Based on the color distribution and statistical data, the gas undergoes nearly complete oxidation at the outlet. The methane oxidation rate at the regenerator outlet reaches 90%, indicating that the regenerator significantly enhances methane combustion and oxidation. The small quantity of unoxidized methane continues to combust in the combustion chamber, with the generated heat accumulating in the combustion chamber and heating the regenerator, thereby ensuring continuous methane oxidation within the regenerator channel.
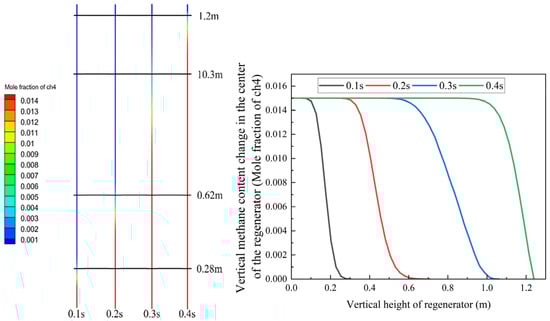
Figure 10.
The simulation results of methane distribution within the single channel with the conditions in Table 3.
Based on the experimental configuration, the gas oxidation time during the entire intake process in the regenerator is predicted. At 1050 K, the theoretical time required for complete oxidation is 0.33 s, which corresponds well with the simulation results. Additionally, beyond the 0.26 s residence time in the regenerator, the flue gas remains in the combustion chamber for 0.41 s. The total residence time reaches 0.67 s, substantially exceeding the time required for complete methane oxidation.
Since the inlet air temperature is typically low, prolonged introduction of low-temperature gas gradually cools the regenerator, potentially affecting gas oxidation behavior. To ensure complete combustion of methane within the regenerator, we investigated the influence of bottom blowing time on methane combustion efficiency, as illustrated in Figure 11.
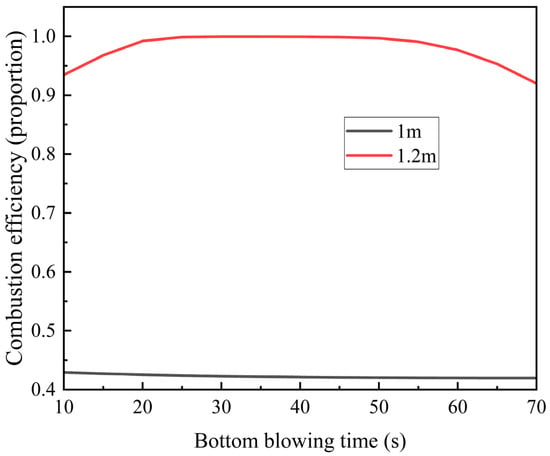
Figure 11.
Variation trends of methane combustion efficiency at the positions of 1 m and 1.2 m in the regenerator with the bottom blowing time.
At the 1 m position, methane combustion efficiency remains below 45% and decreases further with extended bottom blowing time. This decline occurs because the low-temperature gas absorbs heat from the regenerator, lowering the ambient temperature and impairing methane combustion.
In contrast, at the 1.2 m position, methane combustion efficiency reaches 95%, initially increasing before decreasing with longer bottom blowing time. The peak efficiency (~100%) occurs at 30–50 s. Here, methane oxidation not only benefits from the regenerator’s heat but also contributes additional heat, enhancing overall combustion efficiency. However, as bottom-blowing continues, the regenerator’s temperature steadily drops. Eventually, the heat released by methane combustion becomes insufficient to compensate for this cooling, leading to a gradual decline in efficiency.
To deeply investigate the nonlinear relationship between the regenerator’s oxidation characteristics and bottom blowing time, numerical simulations were conducted for bottom blowing durations ranging from 10 to 70 s under the boundary conditions specified in Table 3 (Figure 12). The results reveal an S-shaped growth trend in the methane oxidation conversion rate as regenerator height increases.
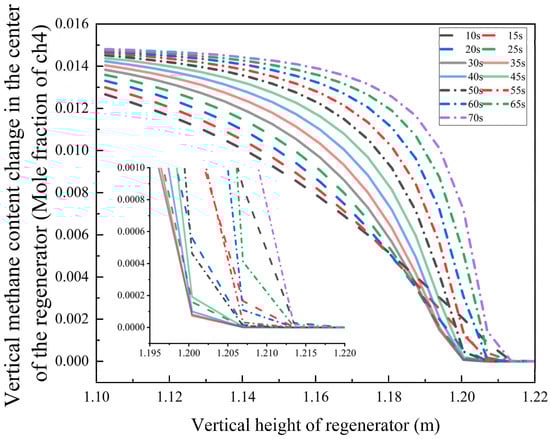
Figure 12.
The variation law of methane mole fraction in the gas with the regenerator’s height and the bottom blowing duration.
Within the 10–25 s bottom blowing interval, the methane mole fraction falls below the detection limit at a height of 1.20 m. When the duration is extended to 30–35 s, the complete burnout position shifts downward to 1.20 m. However, for bottom blowing times exceeding 40 s, the burnout height begins to rise—under the 70 s condition, the methane oxidation completion point moves upward to 1.215 m.
This behavior stems from a two-stage coupling mechanism:
- Optimal Range (30–35 s): The synergy between turbulence intensity and residence time enables an oxygen diffusion depth of 0.95 m, achieving an ideal gas mixture ratio for complete combustion. Oxygen is completely consumed at the position of 0.95 m.
- Excessive Duration (>40 s): Elevated airflow velocity reduces oxygen penetration depth, leading to incomplete fuel combustion due to insufficient mixing.
These findings offer a theoretical foundation for optimizing operational parameters in industrial combustion systems.
In industrial combustion systems, oxygen concentration is a critical thermodynamic parameter that significantly affects combustion reaction kinetics and pollutant formation characteristics. To elucidate this influence mechanism, we performed numerical simulations for a typical operating condition with an oxygen volume fraction of 5.186%, generating contour maps of flue gas composition distribution (Figure 13) and boundary conditions specified (Table 4) to systematically evaluate gas oxidation behavior under varying conditions.
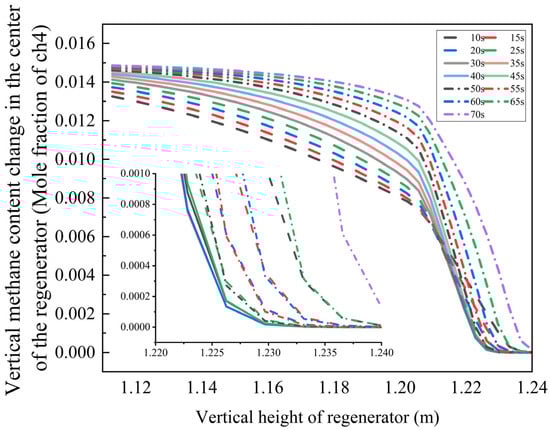
Figure 13.
Variation law of methane mole fraction in gas with regenerator height and bottom blowing time.
Table 4.
Flue gas parameter conditions.
The results demonstrate that in a low-oxygen environment, the methane mole fraction decays exponentially along the regenerator height. When the bottom blowing time is 10–25 s, the methane concentration falls below the detection limit at 1.235 m. Extending the bottom blowing time to 30–35 s shifts the complete burnout position downward to 1.230 m. However, with further extension to 70 s, the burnout height increases to 1.240 m.
This phenomenon arises from the coupling between oxygen diffusion rate and chemical reaction kinetics:
- Moderate bottom blowing (30–35 s): Enhanced turbulent mixing efficiency reduces the reaction induction period, promoting complete combustion.
- Excessive bottom blowing (70 s): High airflow velocity limits oxygen penetration depth, leading to incomplete fuel combustion.
Additionally, reduced oxygen concentration elevates the combustion reaction’s activation energy barrier, increasing the average methane burnout height by 0.005 m. These findings offer valuable insights for optimizing oxygen content regulation in industrial combustion systems.
The simulation results clearly demonstrate that gas composition significantly influences methane oxidation behavior. To systematically evaluate these effects, we examined methane burnout characteristics under different gas compositions using a fixed 30 s bottom blowing duration (operating parameters detailed in Table 5). Figure 14 shows the methane mole fraction and temperature profiles along the regenerator height for various methane/oxygen concentrations.
Table 5.
Case parameters.
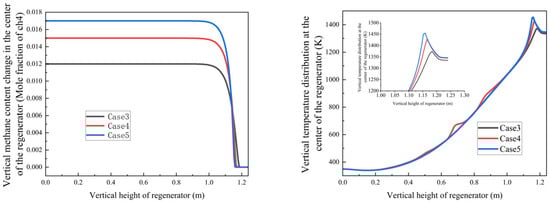
Figure 14.
Variation trends of methane mole fraction and temperature with regenerator height under different methane concentrations and air/fuel ratios.
Key findings from Cases 3–5 (air/fuel ratios φ = 2.67, 2.40, and 2.29, respectively):
- Counter-intuitive Burnout Behavior: Despite having the highest air/fuel ratio (φ = 2.67), Case 3 showed a higher burnout height (1.21 m) than Case 5 (φ = 2.29, 1.18 m). This occurs for the following reasons:
- Case 3’s lower methane concentration generates insufficient combustion heat (peak temperature: 1280 K);
- Case 5’s richer methane mixture creates a self-sustaining high-temperature zone (1350 K) that enhances oxidation.
- 2.
- Flow Velocity Optimization:
- Cases 1,2: 1.39 m/s inlet velocity;
- Cases 3–5: reduced to 0.89 m/s to balance residence time and turbulence intensity, maintaining mixing efficiency while minimizing pressure losses;
- The thermal feedback mechanism plays a crucial regulatory role in these combustion characteristics. These findings provide essential design guidelines for industrial regenerative oxidation systems, particularly regarding the following:
- The importance of maintaining adequate methane concentrations for thermal self-sustainment;
- The need for velocity adjustments to optimize reaction conditions;
- The value of redundant regenerator designs for handling variable gas compositions.
- Temperature profile enhancement:
- Increasing methane mole fraction leads to a steeper axial temperature gradient in the regenerator in Figure 15;
- Peak temperature region intensifies from 1330 K to 1450 K with higher methane concentrations, because with the methane flow rate increasing, the combustion heat increased, which led to a higher temperature.
- 2.
- Oxidation stability:
- Despite methane concentration gradients, complete oxidation consistently occurs at 1.06 ± 0.01 m;
- This stability demonstrates the system’s robust adaptability to fuel concentration variations under current design parameters;
- These findings corroborate the trends observed in Figure 14 and highlight two key system characteristics:
- The strong coupling between methane concentration and thermal field development;
- The design’s inherent capability to maintain stable oxidation performance across a range of fuel concentrations.

Figure 15.
Variation trends of methane mole fraction and temperature with regenerator height under different methane concentrations in an open-circuit environment.
Building on these results, we further investigated regenerative oxidation cases with fixed methane concentration but varying oxygen and carbon dioxide concentrations to simulate exhaust gas recirculation conditions (Figure 16).
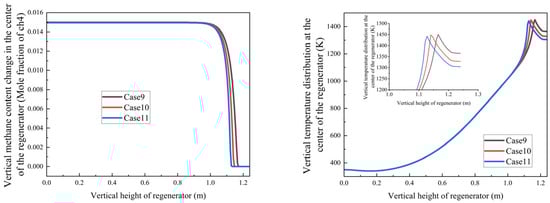
Figure 16.
Variation trends of methane mole fraction and temperature with regenerator height under different exhaust gas recirculation ratios.
Figure 16 demonstrates that under constant methane concentration conditions, increasing the exhaust gas recirculation ratio (corresponding to decreasing oxygen concentration) leads to the following:
- A progressive increase in methane burnout height from 1.1 m to 1.15 m;
- An upward shift in the position of maximum temperature along the regenerator height.
By integrating these simulation results with our experimental platform configuration, we predicted the optimal gas switching time for the regenerator’s air intake cycle. The red dotted line represents the top of the heat storage chamber. From this point on, the temperature distribution of the heat storage chamber at different times can be analyzed. As illustrated in Figure 17, the analysis indicates an appropriate switching time range of 30–90 s.
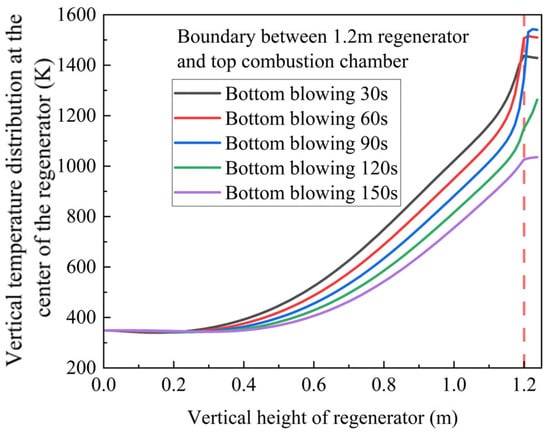
Figure 17.
Temperature distribution prediction under different switching times.
3.2. Overall Model Simulation Results
The revised model incorporates the following key assumptions:
- Thermal boundary conditions:
- The external furnace body is treated as adiabatic;
- External thermal insulation components are excluded from the simulation.
- Chamber configuration:
- The lower inlet region partitions the furnace into twelve functional chambers:
- Five inlet chambers;
- Five outlet chambers;
- One cleaning chamber;
- One isolation chamber.
- Operational configurations in Figure 18:
(A) Baseline Model (First Operating Cycle)
- Inlet chambers: 1, 8, 12, 7, 11;
- Cleaning chamber: 2;
- Isolation chamber: 3;
- Outlet chambers: 4, 5, 6, 9, 10.
(B) Modified Model (First Operating Cycle)
- Inlet chambers: 1, 2, 3, 4, 5;
- Cleaning chamber: 12;
- Isolation chamber: 11;
- Outlet chambers: 6, 7, 8, 9, 10.
- 4.
- Cycle operation:
- Chamber functions switch according to predefined protocols after each combustion cycle;
- Special focus on the first post-preheating cycle due to the following:
- Significant parameter fluctuations;
- Critical importance for understanding dynamic response mechanisms.

Figure 18.
Arrangement of 12 chambers for two models.
This systematic analysis of the initial operational cycle provides fundamental insights into the device’s transient behavior and establishes a basis for subsequent performance evaluation. The content shown in the figure is only a state of a certain period of time.
Following model simplification, Figure 19a presents the schematic representation of the baseline model, while Figure 19b displays the corresponding computational grid. This simplified configuration maintains the essential physical characteristics while improving computational efficiency for the numerical simulations. Figure 20a presents the schematic representation of the modified model, while Figure 20b displays the corresponding computational grid. This simplified configuration maintains the essential physical characteristics while improving computational efficiency for the numerical simulations.The number of grids in Figure 20b is 3,092,870, and the average grid size is 1.2283 × 10⁻⁷ m. The value of yplus is approximately 30, and the height of the first layer of the grid is set to 0.001 m.
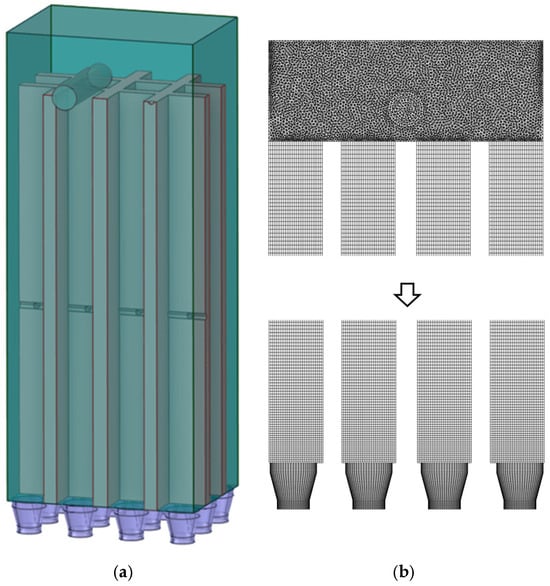
Figure 19.
(a) Baseline model (b) Computational grid.
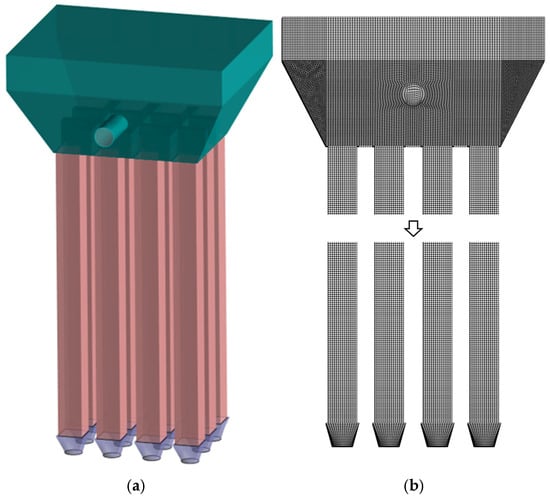
Figure 20.
(a) Modified model (b) Computational grid.
Combustion Chamber Performance and Model Validation
- Combustion Chamber Dynamics
The combustion chamber serves two primary functions: (1) oxidation of organic substances and (2) decomposition of methane. Turbulent flow within the chamber significantly enhances combustion efficiency by promoting complete methane consumption, particularly for unburned gases entering from the regenerator chamber [,,].
Turbulent kinetic energy analysis reveals the following:
- Model A: 0.0298 m2/s2;
- Model B: 0.0307 m2/s2 (modified design).
Comparison of flow characteristics in Figure 21:
- Baseline model (A):
- Left-to-right flow pattern;
- Limited turbulence development due to confined chamber geometry.
- Modified model (B):
- Right-to-left flow with vortex formation;
- Enhanced turbulent mixing from directional changes.

Figure 21.
Streamline diagrams of the two models.
Based on this analysis, Model B was selected for the RTO laboratory implementation.
- 2.
- Experimental Validation
The simulation model was validated against experimental data using Case 4 parameters (Table 6). Temperature distribution in Chamber 1 (along the red reference line in Figure 22) was compared at t = 50 s using four measurement points. The key findings are set out below:
- Excellent agreement between the experimental and simulation results;
- Consistent trends in temperature distribution;
- Comparable magnitude values.
Table 6.
Turbulence enhancement. Turbulent kinetic energy shows concentration-dependent growth.
Table 6.
Turbulence enhancement. Turbulent kinetic energy shows concentration-dependent growth.
| Case | Methane Concentration | Turbulent Kinetic Energy (m2/s2) |
|---|---|---|
| 3 | Low | 0.03032 |
| 4 | Medium | 0.03065 |
| 5 | High | 0.03086 |

Figure 22.
Comparison of temperature distributions in regenerator chamber between simulation and experimental results.
This validation confirms the model’s reliability for engineering applications, demonstrating the following:
- Accurate prediction of thermal behavior;
- Representative simulation of flow dynamics;
- Practical utility for system optimization.
4. Numerical Simulation Results and Analysis
4.1. Temperature Field Characteristics
Numerical simulations of Cases 3–5 were performed using the validated model, with temperature field distributions analyzed at the characteristic cross-section shown in Figure 23. In Case 3, the velocity in the inlet is 0.89 m/s both in the experiment and in the simulation, while the average velocity in the outlet in the experiment and the simulation is 0.98 m/s and 0.975 m/s, respectively, which matched well. Key observations are set out below:
- Methane concentration effect:
- The regenerator chamber shows a stratified increase in temperature as the methane volume fraction increases, and the high-temperature region gradually enlarges in Figure 24;
- Below 1.2 m: inter-case temperature differences ≤ 2 °C;
- At 1.3 m: temperature difference amplifies to ~10 °C.

Figure 23.
Temperature distributions in the regenerator chamber under different cases.

Figure 24.
Temperature distributions under different cases.
4.2. Combustion Dynamics Analysis
Figure 25 (methane mole fraction contours) reveals the following:
- Fuel distribution:
- Bimodal concentration profile due to dual-inlet configuration;
- Complete methane oxidation achieved in combustion chamber core.
- Thermal regeneration:
- Regenerative ceramics store 1200–1500 K sensible heat during switching cycles;
- Regeneration provides stable thermal energy for sustained combustion.
- Reaction intensity:
- Overall, 85% total methane consumption occurs at 0.9–1.2 m height;
- High methane concentration expands high-temperature zone coverage by
- Enhancing turbulent mixing (peak k = 0.03086 m2/s2 in Case 5);
- Reducing fuel residence time to 82% of baseline;
- Accelerating oxidation kinetics.

Figure 25.
Methane mole fraction distributions under different cases.
5. Conclusions
This study established a 3D physical model of the square rotating regenerative thermal oxidizer (RTO) and a coupled model of unsteady flow, heat transfer, and chemical reaction. It analyzed the effects of switching time, heat storage body height, and inlet flow rate on purification efficiency, heat recovery, and outlet temperature. As an innovative structural modification to traditional RTOs (e.g., circular RTO, three-bed TRTO), the square RTO offers 13% higher heat storage utilization and 15% smaller floor area, with methane combustion efficiency >98%. The core conclusions and engineering insights are as follows.
5.1. Oxidation Mechanism and Temperature Thresholds
Oxidation of ultra-low concentration combustibles follows “dual-scale synergy”: millimeter-scale micro-combustion in heat storage body microchannels enhances mixing, while macroscopic rapid oxidation is completed in the upstream combustion chamber.
At a stable furnace temperature of 950–1050 °C, convection + radiation contribute > 40% to total heat transfer, enabling the heat storage body to preheat intake air to 550–600 °C (above the gas ignition temperature). For complex mixed gases, the combustion chamber temperature must be ≥800 °C to ensure complete oxidation.
5.2. Structural Optimization and Operational Stability
Adopting a 15° conical expansion combustion chamber increases local turbulent kinetic energy to 0.03086 m2/s2, extends residence time in the high-temperature zone, and improves temperature field uniformity.
A 760–800 °C temperature buffer zone effectively absorbs fluctuations in inlet gas concentration and oxygen supply, enhancing temperature stability and purification robustness during switching.
5.3. Key Factors Influencing Performance
Higher methane volume fraction raises peak temperature. Regenerative ceramics exhibit significant sensible heat storage capacity at 1200–1500 K, supporting stable preheating.
Switching time must match the thermal inertia of the heat storage body. Increasing heat storage body height yields diminishing returns on heat recovery, while inlet flow rate requires balancing convective heat transfer, residence time, and pressure drop/energy consumption.
5.4. Engineering Applicability and Core Recommendations
The square rotating RTO demonstrates excellent energy efficiency and operational stability under ultra-low concentration conditions (0.3–0.8% CH4), verified through pilot tests and industrial condition comparisons.
Core design and operation recommendations: Control the combustion chamber temperature at 950–1050 °C; prioritize the 15° conical expansion combustion chamber and 760–800 °C temperature buffer zone; ensure intake air preheating >550–600 °C; optimize switching time via full-cycle simulation, balance heat storage body height with pressure drop, and control inlet flow rate to meet residence time and complete oxidation requirements.
5.5. Future Prospects
Introduce detailed chemical reaction mechanisms to analyze pollutant distribution and improve the simulation accuracy of complex combustion processes. Conduct industrial pilot-scale experiments to verify long-term stability and optimize parameters to adapt to fluctuations in actual gas composition.
Author Contributions
Methodology, Z.M.; Investigation, J.Z.; Resources, Z.W. and J.Y.; Writing—original draft, D.W.; Writing—review & editing, C.C. and K.N.; Project administration, S.L. and S.J. All authors have read and agreed to the published version of the manuscript.
Funding
This work was supported by the Natural Science Foundation of Shandong Province (ZR2022MF229).
Institutional Review Board Statement
Not applicable.
Informed Consent Statement
Not applicable.
Data Availability Statement
The original contributions presented in this study are included in the article. Further inquiries can be directed to the corresponding authors.
Conflicts of Interest
Authors Jida Zhang, Zhongkuan Wei, Junhui Yang and Zhongcheng Ma were employed by the companies China Coal (Tianjin) Underground Engineering Intelligent Research Institute Co., Ltd. and China Coal Tianjin Design & Engineering Co., Ltd. The remaining authors declare that the research was conducted in the absence of any commercial or financial relationships that could be construed as a potential conflict of interest.
Appendix A
| Parameter Category | Specific Parameter | Single-Channel Model | Full-Scale Model |
|---|---|---|---|
| Transient Settings | Time step size | 0.1 s | |
| Total simulation time | According to the calculation requirements, it takes 60 to 330 s | ||
| Steady Settings | 5000 | ||
| Convergence Criteria | 1 × 10⁻⁴ | 1 × 10⁻⁴ | |
| Algorithm | PISO | SIMPLE | |
| Discretization | Momentum/First-Order Upwind Other/Second-Order Upwind | Momentum/First-Order Upwind Other/Second-Order Upwind | |
| Radiation Model (DO) | Spectral assumption | Grey (emissivity = 0.9 for ceramic) | Grey (emissivity = 0.9 for ceramic) |
| Species Transport | Solver type | Finite volume method | Finite volume method |
| Reaction model | Eddy dissipation concept (EDC) | Eddy dissipation concept (EDC) | |
| Methane oxidation mechanism | 1-step global reaction | 1-step global reaction | |
| Under-Relaxation Factors | Pressure | 0.3 | 0.3 |
| Momentum | 0.7 | 0.7 | |
| Density | 1 | 1 | |
| Energy | 1 | 1 | |
| Body forces | 0.7 | 0.7 | |
| Turbulent kinetic energy | 0.8 | 0.8 | |
| Turbulent dissipation rate | 0.8 | 0.8 | |
| Turbulent viscosity | 1 | 1 | |
| Species mass fractions | 1 | 1 |
References
- Wu, R.; Bo, Y.; Li, J.; Li, L.; Li, Y.; Xie, S. Method to establish the emission inventory of anthropogenic volatile organic compounds in China and its application in the period 2008–2012. Atmos. Environ. 2016, 127, 244–254. [Google Scholar] [CrossRef]
- Liu, S.; Xu, H.; Chen, X. Does environmental regulation pressure induce the green innovation of enterprises? Quasi-natural experiment of China’s air pollution prevention and control action plan. Heliyon 2024, 10, 4471–4486. [Google Scholar] [CrossRef]
- Hamawand, I.; Yusaf, T.; Hamawand, S.G. Coal seam gas and associated water: A review paper. Renew. Sustain. Energy Rev. 2013, 22, 550–560. [Google Scholar] [CrossRef]
- Ma, H.; Wang, L.; Jia, H.; Chang, J.; Li, Y.; Zhang, X.; Yin, Z.; Hu, Z. Experimental study on desorption characteristics of coalbed methane under variable loading and temperature in deep and high geothermal mine. Adv. Civ. Eng. 2020, 2020, 8878125. [Google Scholar] [CrossRef]
- Wang, J.J. Research on heating technology of regenerative oxidation used low concentration CBM in small coal mine. In Proceedings of the E3S Web of Conferences, Sanya, China, 28–29 August 2021; EDP Sciences: Les Ulis, France, 2021; Volume 267, p. 02070. [Google Scholar]
- National Bureau of Statistics. China Energy Statistical Yearbook 2023; China Statistics Press: Beijing, China, 2023.
- Xiao, L. Study on comprehensive utilization technology of low concentration coal bed methane. In Proceedings of the E3S Web of Conferences, Sanya, China, 28–29 August 2021; EDP Sciences: Les Ulis, France, 2021; Volume 290, p. 03010. [Google Scholar]
- Pu, H.; Zhang, L.; Dong, X.; Jing, T.; Junce, X. Simulation of the Extraction Efficiency of Coalbed Methane under Water Injection: A Gas-Liquid-Solid Coupling Model. Geofluids 2020, 2020, 1475316. [Google Scholar] [CrossRef]
- Gao, P. Design and economic evaluation of low concentration methane (CMM) regenerative thermal oxidation heating system. IOP Conf. Ser. Earth Environ. Sci. 2019, 242, 22058. [Google Scholar]
- Cheng, Y.-P.; Dong, J.; Jin, K.; Zhang, H.; Liu, Q.; Jiang, J.; Hu, B. Effect of negative pressure on coalbed methane extraction and application in the utilization of methane resource. J. China Coal Soc. 2017, 6, 70–81. [Google Scholar]
- Yang, X.Z. Treatment technology for volatile organic waste gas. Environ. Sci. Manag. 2016, 96–100. [Google Scholar]
- Buss, W.; Ma, O. High-VOC biochar—Effectiveness of post-treatment measures and potential health risks related to handling and storage. Environ. Sci. Pollut. Res. 2016, 23, 19580–19589. [Google Scholar] [CrossRef] [PubMed]
- Baek, S.W.; Kim, J.R.; Ihm, S.K. Design of dual functional adsorbent/catalyst system for the control of voc’s by using metal-loaded hydrophobic y-zeolites. Catal. Today 2004, 93, 575–581. [Google Scholar] [CrossRef]
- Dammak, N.; Fakhfakh, N.; Fourmentin, S.; Benzina, M. Treatment of gas containing hydrophobic vocs by adsorption process on raw and intercalated clays. Res. Chem. Intermed. 2015, 41, 5475–5493. [Google Scholar] [CrossRef]
- Wang, F.; Lei, X.; Hao, X. Key factors in the volatile organic compounds treatment by regenerative thermal oxidizer. J. Air Waste Manag. Assoc. 2020, 70, 557–567. [Google Scholar] [CrossRef] [PubMed]
- Park, H.M.; Jung, H.M.; Lee, D.H.; Park, H.N.; Lim, T.Y.; Yoon, J.H.; Yoon, D.-H. Implementation of an improved 100 CMM regenerative thermal oxidizer to reduce VOCs gas. Processes 2024, 12, 2814. [Google Scholar] [CrossRef]
- Cannon, B.J. Dual-chamber RTO oxidizers provide cost-effective VOC compliance for metal finishers and coaters. Met. Finish. 2003, 101, 53–56. [Google Scholar] [CrossRef]
- Kvist, T.; Aryal, N. Methane loss from commercially operating biogas upgrading plants. Waste Manag. 2019, 87, 295–300. [Google Scholar] [CrossRef]
- Liu, J. A Study of Advanced RTO (Regenerative Thermal Oxidizer) Technology by Optimised Combustor Integration and Carbon-Free Fuel for Non-Carbon Emissions. Ph.D. Thesis, University of Bedfordshire, Luton, UK, 2024. [Google Scholar]
- Ren, K.; Zhang, Z.; Qin, H.; Tan, J.; Hao, X. Velocity and Temperature Simulation for a Cylindrical Regenerative Thermal Oxidizer. ACS Omega 2024, 9, 15893–15903. [Google Scholar] [CrossRef]
- Yoon, D.H. Implementation of an Improved 100 CMM Regenerative Thermal Oxidizer to Reduce VOCs Gas. Control Syst. Eng. 2024. [Google Scholar] [CrossRef]
- Salvador, S.; Kara, Y.; Crussol, J.M. Improving VOC recuperative incinerators performances by increasing turbulence levels inside the combustion chamber—Experimental results. Appl. Therm. Eng. 2005, 25, 1871–1881. [Google Scholar] [CrossRef]
- Sun, B.; Zhao, T.; Li, L.; Wang, Z.; Sun, P.; Peng, C. Optimization of regenerator operating parameters and thermal insulation construction for rotary regenerative thermal oxidizer (r-RTO) based on thermal-fluid coupling method and quadratic regression model. Case Stud. Therm. Eng. 2022, 37, 102314. [Google Scholar] [CrossRef]
- Pu, G.; Li, X.; Yuan, F. Numerical study on heat transfer efficiency of regenerative thermal oxidizers with three canisters. Processes 2021, 9, 1621. [Google Scholar] [CrossRef]
- Wei, L.I. Numeric research on heat transfer in honeycomb regenerator. J. Eng. Thermophys. 2001, 5, 657–660. [Google Scholar]
- You, Y.; Huang, H.; Shao, G.; Hu, J.; Xu, X.; Luo, X. A three-dimensional numerical model of unsteady flow and heat transfer in ceramic honeycomb regenerator. Appl. Therm. Eng. 2016, 108, 1243–1250. [Google Scholar] [CrossRef]
- Yuan, F.; Wang, H.; Zhou, P.; Xu, A.; He, D. Heat transfer performances of honeycomb regenerators with square or hexagon cell opening. Appl. Therm. Eng. 2017, 125, 790–798. [Google Scholar] [CrossRef]
- Chen, W.; Lu, Z.; Qu, X.; Xu, Z.; Chen, H.; Wei, Z. Numerical simulation of plate-type ceramic regenerator based on thermal-solid coupling. J. Phys. Conf. Ser. 2025, 3084, 012050. [Google Scholar] [CrossRef]
- Liu, J.; Peng, Z. Experimental and Numerical Investigations into Temperature Distributions and VOC Conversion Rate of RTO. IOP Conf. Ser. Earth Environ. Sci. 2021, 943, 012014. [Google Scholar] [CrossRef]
- Varma, A.R.; Ahmed, U.; Klein, M.; Chakraborty, N. Effects of turbulent length scale on the bending effect of turbulent burning velocity in premixed turbulent combustion. Combust. Flame 2021, 233, 111569. [Google Scholar] [CrossRef]
- Lieuwen, T.C. Unsteady Combustor Physics; Cambridge University Press: Cambridge, UK, 2021. [Google Scholar]
- Luo, J.; Gao, W.; Zhang, K.; Huang, Z.; Jiang, H.; Li, G.; Jin, S.; Si, R.; Wen, G. CFD simulation with detailed chemical reaction mechanism of ultra-lean methane explosion at elevated temperatures. Int. J. Therm. Sci. 2025, 215, 109977. [Google Scholar] [CrossRef]
- Christo, F.C.; Levy, Y.; Costa, M.; Balelang, G.A.F. Effect of jet momentum flux and heat density on NOx emission in a flameless gas turbine combustor. Aerosp. Sci. Technol. 2021, 119, 107137. [Google Scholar] [CrossRef]
- Chyou, Y.T.L.Y.P.; Wang, T. Numerical Analysis of Gasification Performance via Finite-Rate Model in a Cross-Type Two-Stage Gasifier. Int. J. Heat Mass Transf. 2013, 57, 558–566. [Google Scholar]
- Krishnamurthy, A.; Adebayo, B.; Gelles, T.; Rownaghi, A.; Rezaei, F. Abatement of Gaseous Volatile Organic Compounds: A Process Perspective. Catal. Today 2019, 350, 100–119. [Google Scholar] [CrossRef]
- Zhou, Y.; Shi, Y.; Liu, Y.; Sun, P.; Mao, M. Experimental and simulation research on heat extraction characteristics from a pilot-scale reverse flow reactor for low-grade energy. Appl. Therm. Eng. Des. Process. Equip. Econ. 2023, 220, 119761. [Google Scholar] [CrossRef]
- Sun, S.; Mao, M.; Zhu, F.; He, F.; Shi, J.; Liu, Y.; Zhou, D.; Ma, X.; Song, M. Effect of coupled heat transfer on temperature distribution of a packed bed with rotary intake and exhaust. Appl. Therm. Eng. 2025, 266, 125723. [Google Scholar] [CrossRef]
- Ling, Z.; Lu, L.; Zeng, X.; Kuang, M.; Ling, B.; Gao, C.; Zhou, C. Ethylene Combustion Performance with Varying the N2 Content in a Porous Burner. Soc. Sci. Electron. Publ. 2025, 262, 125321. [Google Scholar]
- Mao, M.; Gao, M.; Shi, J. Experimental and numerical study of flame stability in a rotary flow reversal reactor with ultra-lean toluene/air mixture. Chem. Eng. Process. 2023, 192, 109484. [Google Scholar] [CrossRef]
Disclaimer/Publisher’s Note: The statements, opinions and data contained in all publications are solely those of the individual author(s) and contributor(s) and not of MDPI and/or the editor(s). MDPI and/or the editor(s) disclaim responsibility for any injury to people or property resulting from any ideas, methods, instructions or products referred to in the content. |
© 2025 by the authors. Licensee MDPI, Basel, Switzerland. This article is an open access article distributed under the terms and conditions of the Creative Commons Attribution (CC BY) license (https://creativecommons.org/licenses/by/4.0/).