Article

The Consumption of Two or Three Meals per Day with Adequate Protein Content Is Associated with Lower Risk of Physical Disability in Mexican Adults Aged 60 Years and Older

by
Alejandro Gaytán-González
1,2,*,
María de Jesús Ocampo-Alfaro
3,
Francisco Torres-Naranjo
1,4,
Maritza Arroniz-Rivera
3,
Roberto Gabriel González-Mendoza
1,
Martha Gil-Barreiro
3 and
Juan Ricardo López-Taylor
1
1
Institute of Applied Sciences for Physical Activity and Sport, Department of Human Movement Sciences, Education, Sport, Recreation, and Dance, University Health Sciences Center, University of Guadalajara, Guadalajara 44430, Jalisco, Mexico
2
Department of Human Reproduction, Infantile Growth, and Development, University Health Sciences Center, University of Guadalajara, Guadalajara 44280, Jalisco, Mexico
3
Geriatrics Department, Western General Hospital, Zapopan 45170, Jalisco, Mexico
4
Center of Body Composition and Bone Research, Guadalajara 44600, Jalisco, Mexico
*
Author to whom correspondence should be addressed.
Geriatrics 2020, 5(1), 1; https://doi.org/10.3390/geriatrics5010001
Submission received: 9 November 2019 / Revised: 11 December 2019 / Accepted: 13 December 2019 / Published: 6 January 2020
(This article belongs to the Section Geriatric Nutrition)

Abstract

:
Adequate protein intake per day has been associated with a lower risk of physical disability; however, if adequate protein intake per meal is also associated is unknown. The purpose of this study was to analyze the association between adequate protein intake per meal and physical disability in daily living activities in Mexican adults aged ≥60 years. We assessed the number of meals per day with an adequate protein content (24 h dietary recall), the presence of physical disability in daily living activities (two validated questionnaires), and their association in 187 participants through logistic regression. Consuming two or three meals per day with ≥30 g each was associated with lower risk of physical disability on Transportation (OR [95% CI]: 0.06 [0.01–0.50], p = 0.01), Shopping (0.05 [0.01–0.40], p = 0.004), Feeding (0.06 [0.01–0.74], p = 0.028), and Transfer (0.09 [0.01–0.98], p = 0.048). On the other hand, consuming two or three meals per day with ≥0.4 g/kg each was associated with lower risk of physical disability on Shopping (0.21 [0.05–0.89], p = 0.034) and Transportation (0.12 [0.03–0.48], p = 0.003). The consumption of two or three meals per day with adequate protein content is associated with lower risk of physical disability in Mexican adults aged 60 years and older.

1. Introduction

The age-related decrease in muscle mass in humans begins in the fifth decade of life [1,2,3]. This muscle mass loss often coexists with low muscle strength [4,5], functionality [6,7], and higher disability [8,9], which in turn are related with lower quality of life [10,11], and higher healthcare expenses [12], and mortality [13,14,15]. Current evidence suggests that lifestyle factors are significantly associated with functionality and physical disability. For instance, physically active older adults and those engaged in exercise programs show higher functionality and lower physical disability than their less physically active counterparts [16,17,18,19,20,21]. Additionally, dietary factors, such as low dietary protein intake, are also associated with these outcomes, whereas older adults who consume higher amounts of protein have been reported to have higher muscle mass [22,23], better functionality [24,25] and lower disability [26,27] in some studies.
Currently, it is considered that older adults should consume more protein than their younger counterparts [28,29]. Indeed, the PROT-AGE study group recommended that older adults should consume at least 1.0 to 1.2 g protein /kg body mass/day to maintain or gain muscle mass and function [28]. Similarly, 30 g protein or 0.4 g protein/kg body mass per meal (deemed adequate) are recommended to stimulate the muscle protein synthesis optimally [29,30], leading to protein accrual if it overcomes the muscle protein breakdown [31]. These recommendations for older adults are higher than for younger adults due to several age-related factors that decrease the anabolic response to amino acids in the elderly (i.e., anabolic resistance), reducing the stimulation of muscle protein synthesis and hampering the positive protein net balance [32,33]. Therefore, a higher protein intake would be needed to overcome the anabolic resistance.
In addition to daily protein intake, protein distribution, and per meal content have gained interest as other factors to consider [34,35]. Some studies have investigated if protein intake per meal at certain doses is related to muscle mass and functionality in older adults [36,37,38]. They found that the consumption of two or more meals with ≥30 g of protein each is significantly associated with higher leg muscle mass and leg strength [36], and <30 g of protein at specific meals is associated with lower functionality [37]. Nonetheless, these results have not been consistent [38].
While muscle mass, muscle strength, and functionality are strong predictors of physical disability [7,9,39], to the best of our knowledge, the approach to the association between per-meal protein intake and physical disability have not been studied in older adults. Therefore, the purpose of this study was to analyze the association between adequate protein intake per meal and physical disability on daily living activities in Mexican adults aged 60 years or older.

2. Materials and Methods

2.1. Participants

This was a cross-sectional study carried out in the Western General Hospital (Hospital General de Occidente) in Zapopan, Jalisco, Mexico. It is part of a series of articles from the same project [37]. We evaluated Mexican older adults that attended the Geriatrics Department as part of their routine medical screening or for their initial assessment from January to July 2017. Participants were eligible if: (1) they were aged 60 years or older; (2) they were able to answer to questionnaires (caregivers’ help was allowed if needed), and (3) they were able to stand up and walk unassisted (canes were permitted).
Data for analyses were excluded if participants were unable to provide detailed dietary information or if data was incomplete. This non-probabilistic sample was initially composed of 659 possible participants. However, 3 were younger than 60 years, 191 did not meet the last two inclusion criteria, 258 did not provide detailed dietary information, and 20 were discarded for missing data, leading to a final sample of 187 participants (140 women, 47 men) whose ages ranged from 60 to 97 years.
All participants gave their written informed consent before any procedure was performed. The Institutional Review Board from the University Health Sciences Center, University of Guadalajara, approved this study (CI-05518).

2.2. General Data

We obtained participants’ clinical information as sex, age, height (to nearest 1 cm), weight (to nearest 0.5 kg), BMI, and the number of diagnosed diseases. BMI was categorized as recommended (23–31 kg/m2), below (<23), and above (>31) the recommended for older adults [40].

2.3. Physical Disability Assessment

One researcher administrated two questionnaires to evaluate the presence of physical disability in instrumental activities of daily living (IADL) [41] and activities of daily living (ADL) [42]. Physical disability was considered as the inability or difficulty to perform daily living activities [7,9] according to the authors’ scales [41,42]. We evaluated five out of eight IADL items (those applicable for both sexes) and all ten ADL items (Table A1 in Appendix A). These two questionnaires showed good internal consistency (Cronbach’s alpha 0.94 and 0.82 for IADL and ADL questionnaires, respectively) [43,44].

2.4. Dietary Protein Intake Assessment

Dietary information was obtained with one 24 h dietary recall. One trained dietitian followed the USDA multistep methodology to administrate the 24 h dietary recall [45]. One external researcher calculated the total, plant, animal (all in g/day), and per meal (g at breakfast, lunch, dinner) protein intake with specialized software (Nutrickal® VO v1.1, Ogali-COSINFO SC, Mexico). This external researcher has a test-retest error for estimating protein from foods ≤3.3% for all meals and total protein intake. Then, we calculated the relative protein intake per day, and per meal (g/kg/d, g/kg/meal). Next, the number of meals with a protein content ≥30 g or ≥0.4 g/kg (considered adequate [29,36]) were counted, and participants were allocated into one of three groups according to the number of meals reaching these thresholds (zero meals [0M], one meal [1M], two or three meals [+2M]). Relative protein intake per day was considered as inadequate (IPI) if <1.2 g/kg/d [28].
Finally, the coefficient of variation of protein distribution (CV) was calculated as described previously with the following equation [46]:
CV = SDP/MP
where SDP is the standard deviation of the three main meals, and MP is the mean protein intake for the three main meals. The higher the CV, the more uneven the protein distribution [46].

2.5. Statistical Analysis

Data were assessed for normal distribution employing the Shapiro–Wilk test. If outliers were detected [47], they were excluded from that variable and analyzed again. When normal distribution was observed, we reported data as mean ± standard deviation. Otherwise, median (25th–75th percentiles) were reported. For qualitative variables, we reported them as frequencies and percentage.
We compared demographic data between included and non-included participants with χ2 test of independence for qualitative variables; for quantitative variables, we used t-test and Mann–Whitney U test for parametric and non-parametric distributions, respectively.
To compare quantitative variables between groups of meals with adequate protein intake, we used one-way ANOVA with Tukey post hoc if variables showed normal distribution and homogeneity of variances (Levene’s test). If normal distribution was observed but not homogeneity of variances, we used Welch correction and Games–Howell test as post hoc. Finally, if normal distribution and homogeneity of variances were not met, we used the Kruskal–Wallis test with Dunn’s as post hoc. For qualitative variables, we compared frequencies between groups employing the χ2 test of independence.
To analyze the association between the number of meals with adequate protein content and physical disability, we employed binomial logistic regression analysis, setting disability on each item as the dependent variable and the number of meals with adequate protein content as the predictive variable. The 0M group was established as the reference, and the analysis was adjusted for age (years, continuous), sex (man/woman), inadequate protein intake per day (yes/no), BMI categories, and number of diagnosed diseases (grouped as zero, one, and two or more; after reviewing their medical files looking for any physician-diagnosed disease). Data were expressed as odds ratios and 95% confidence intervals.
Additionally, we calculated the Nagelkerke pseudo R2 for those associations reaching statistical significance. To quantify the contribution of meals and age to the full model, we excluded one of these two variables at the time, and the pseudo R2 was reported. All analyses were deemed significant at a p-value ≤ 0.05 and were performed in SPSS® v.24 (IBM Corp., Armonk, NY, USA) for Windows®. Graphs were elaborated with GraphPad® Prism v7.05 (GraphPad Software Inc., La Jolla, CA, USA) for Windows®.

3. Results

3.1. Comparison between Included vs. Non-Included Participants

Non-included participants showed similar demographic characteristics and prevalence of physical disability to those observed in the included participants. None of the comparisons reached statistical significance (Table 1).

3.2. General and Dietary Protein Intake Characteristics (≥30 g/Meal Criterion)

When participants were classified according to the number of meals with ≥30 g of protein, 61.0% of them reported consuming zero meals, 34.2% one meal, and the remaining 4.8% two or three meals (Table 2). There were no significant differences in sex distribution, age, height, weight, BMI, BMI categories, nor the number of diagnosed diseases between these groups (Table 2). The distribution of participants by decade was as follows: 24 were aged 60–69, 81 for 70–79, 66 for 80–89, and 16 for ≥90. There were no significant differences between groups of number of meals (p = 0.71, data not shown).
When protein intake was assessed, IPI was significantly different between groups (Table 3). Both absolute (g/d) and relative (g/kg/d) protein intake were significantly higher for the +2M group in comparison with the other two. There were significant differences between groups for plant and animal protein intake. The CV was only different between 0 M and 1M groups (Table 3). For absolute protein intake per meal (g/meal), participants on the +2M group showed significantly higher protein intake than the other two groups for breakfast, and these differences were significant at lunch and dinner when compared with 0M group only (Table 3). For relative protein intake per meal (g/kg/meal), a similar pattern was observed (Table 3).

3.3. General and Dietary Protein Intake Characteristics (≥0.4 g/kg/Meal Criterion)

When participants were classified according to the number of meals with ≥0.4 g protein/kg, 41.2% of them reported consuming zero meals, 39.0% one meal, and the remaining 19.8% two or three meals (Table 4). There were no significant differences in sex distribution, age, height, nor the number of diagnosed diseases between groups. However, weight, BMI, and BMI categories differed significantly between groups (Table 4). The distribution of participants by decade showed no significant differences between groups of number of meals (p = 0.80, data not shown).
When protein intake was assessed, IPI was different between groups. The absolute and relative protein intake were significantly higher for +2M group, and CV only differed between 0M and 1M groups (Table 5). There were significant differences between groups for plant and animal protein intake. For protein intake per meal, absolute intake at dinner was not different between groups, but all other meals (both absolute and relative intake) showed significant differences (Table 5).

3.4. Overall Physical Disabilities

About 20% of the sample reported no physical disabilities for IADL and ADL (Table 6). On the other hand, the proportion of participants reporting physical disability for all items was closer to 12% and 5% for IADL and ADL, respectively (Table 6). For IADL, the highest participants’ proportion was observed in four physical disabilities and the lowest in five, without statistical significance (p = 0.06). For ADL, zero physical disabilities were the most prevalent, and presenting five was less common (p < 0.001) (Table 6).

3.5. Physical Disabilities by Group

When participants were categorized according to the number of meals with ≥30 g of protein, the most common IADL disability was observed in Shopping for 0M and 1M groups. For +2M group, Medication was the most common physical disability. There were significant differences between groups for Shopping and Transportation (Table 7). For ADL, the most commonly reported physical disability was Stairs for 0M and 1M groups. For +2M group, the most reported physical disability was on Mobility, Stairs, Dressing, and Bladder. There were significant differences between groups for Stairs only (Table 7).
When participants were categorized according to the number of meals with ≥0.4 g protein/kg, Shopping was the most common IADL disability for all groups. The proportion of participants with physical disability in Transportation and Finances differed significantly between groups (Table 8). For ADL, the most common physical disability was Stairs for all groups. There were significant differences between groups in the proportion of subjects with Stairs and Dressing disabilities (Table 8).

3.6. Number of Meals with ≥30 g Protein and Physical Disability

For IADL, consuming 1M or +2M with ≥30 g of protein was significantly associated with lower risk of disability on Transportation (1M, p = 0.012; +2M, p = 0.01; full model R2 = 0.384; model excluding meals only R2 = 0.328; model excluding age only R2 = 0.167). Consuming +2M, but not 1M, was significantly associated with lower risk of disability on Shopping (p = 0.004; full model R2 = 0.315; model excluding meals only R2 = 0.253; model excluding age only R2 = 0.156). Conversely, the number of meals was not significantly associated with disability risk on Telephone, Medication, nor Finances (Figure 1a).
For ADL, consuming +2M, but not 1M, was significantly associated with lower risk of disability on Feeding (p = 0.028; full model R2 = 0.240; model excluding meals only R2 = 0.196; model excluding age only R2 = 0.143) and Transfer (p = 0.048; full model R2 = 0.287; model excluding meals only R2 = 0.256; model excluding age only R2 = 0.099). The number of meals was not significantly associated with disability risk on the other items (Figure 1b).

3.7. Number of Meals with ≥0.4 g Protein/kg and Physical Disability

For IADL, consuming 1M or +2M with ≥0.4 g of protein/kg was significantly associated with lower risk of disability on Shopping (1M, p = 0.03; +2M, p = 0.034; full model R2 = 0.293; model excluding meals only R2 = 0.253; model excluding age only R2 = 0.117) and on Transportation (1M, p = 0.001; +2M, p = 0.003; full model R2 = 0.400; model excluding meals only R2 = 0.328; model excluding age only R2 = 0.161). The number of meals was not significantly associated with disability risk on Telephone, Medication, nor Finances (Figure 2a).
For ADL, consuming 1M, but not +2M, was significantly associated with a lower disability risk on Dressing (p = 0.048; full model R2 = 0.400; model excluding meals only R2 = 0.363; model excluding age only R2 = 0.120). On the other hand, consuming +2M, but not 1M, was significantly associated with higher disability risk on Mobility (p = 0.041; full model R2 = 0.258; model excluding meals only R2 = 0.222; model excluding age only R2 = 0.081). The number of meals was not significantly associated with disability risk on the other items (Figure 2b).

4. Discussion

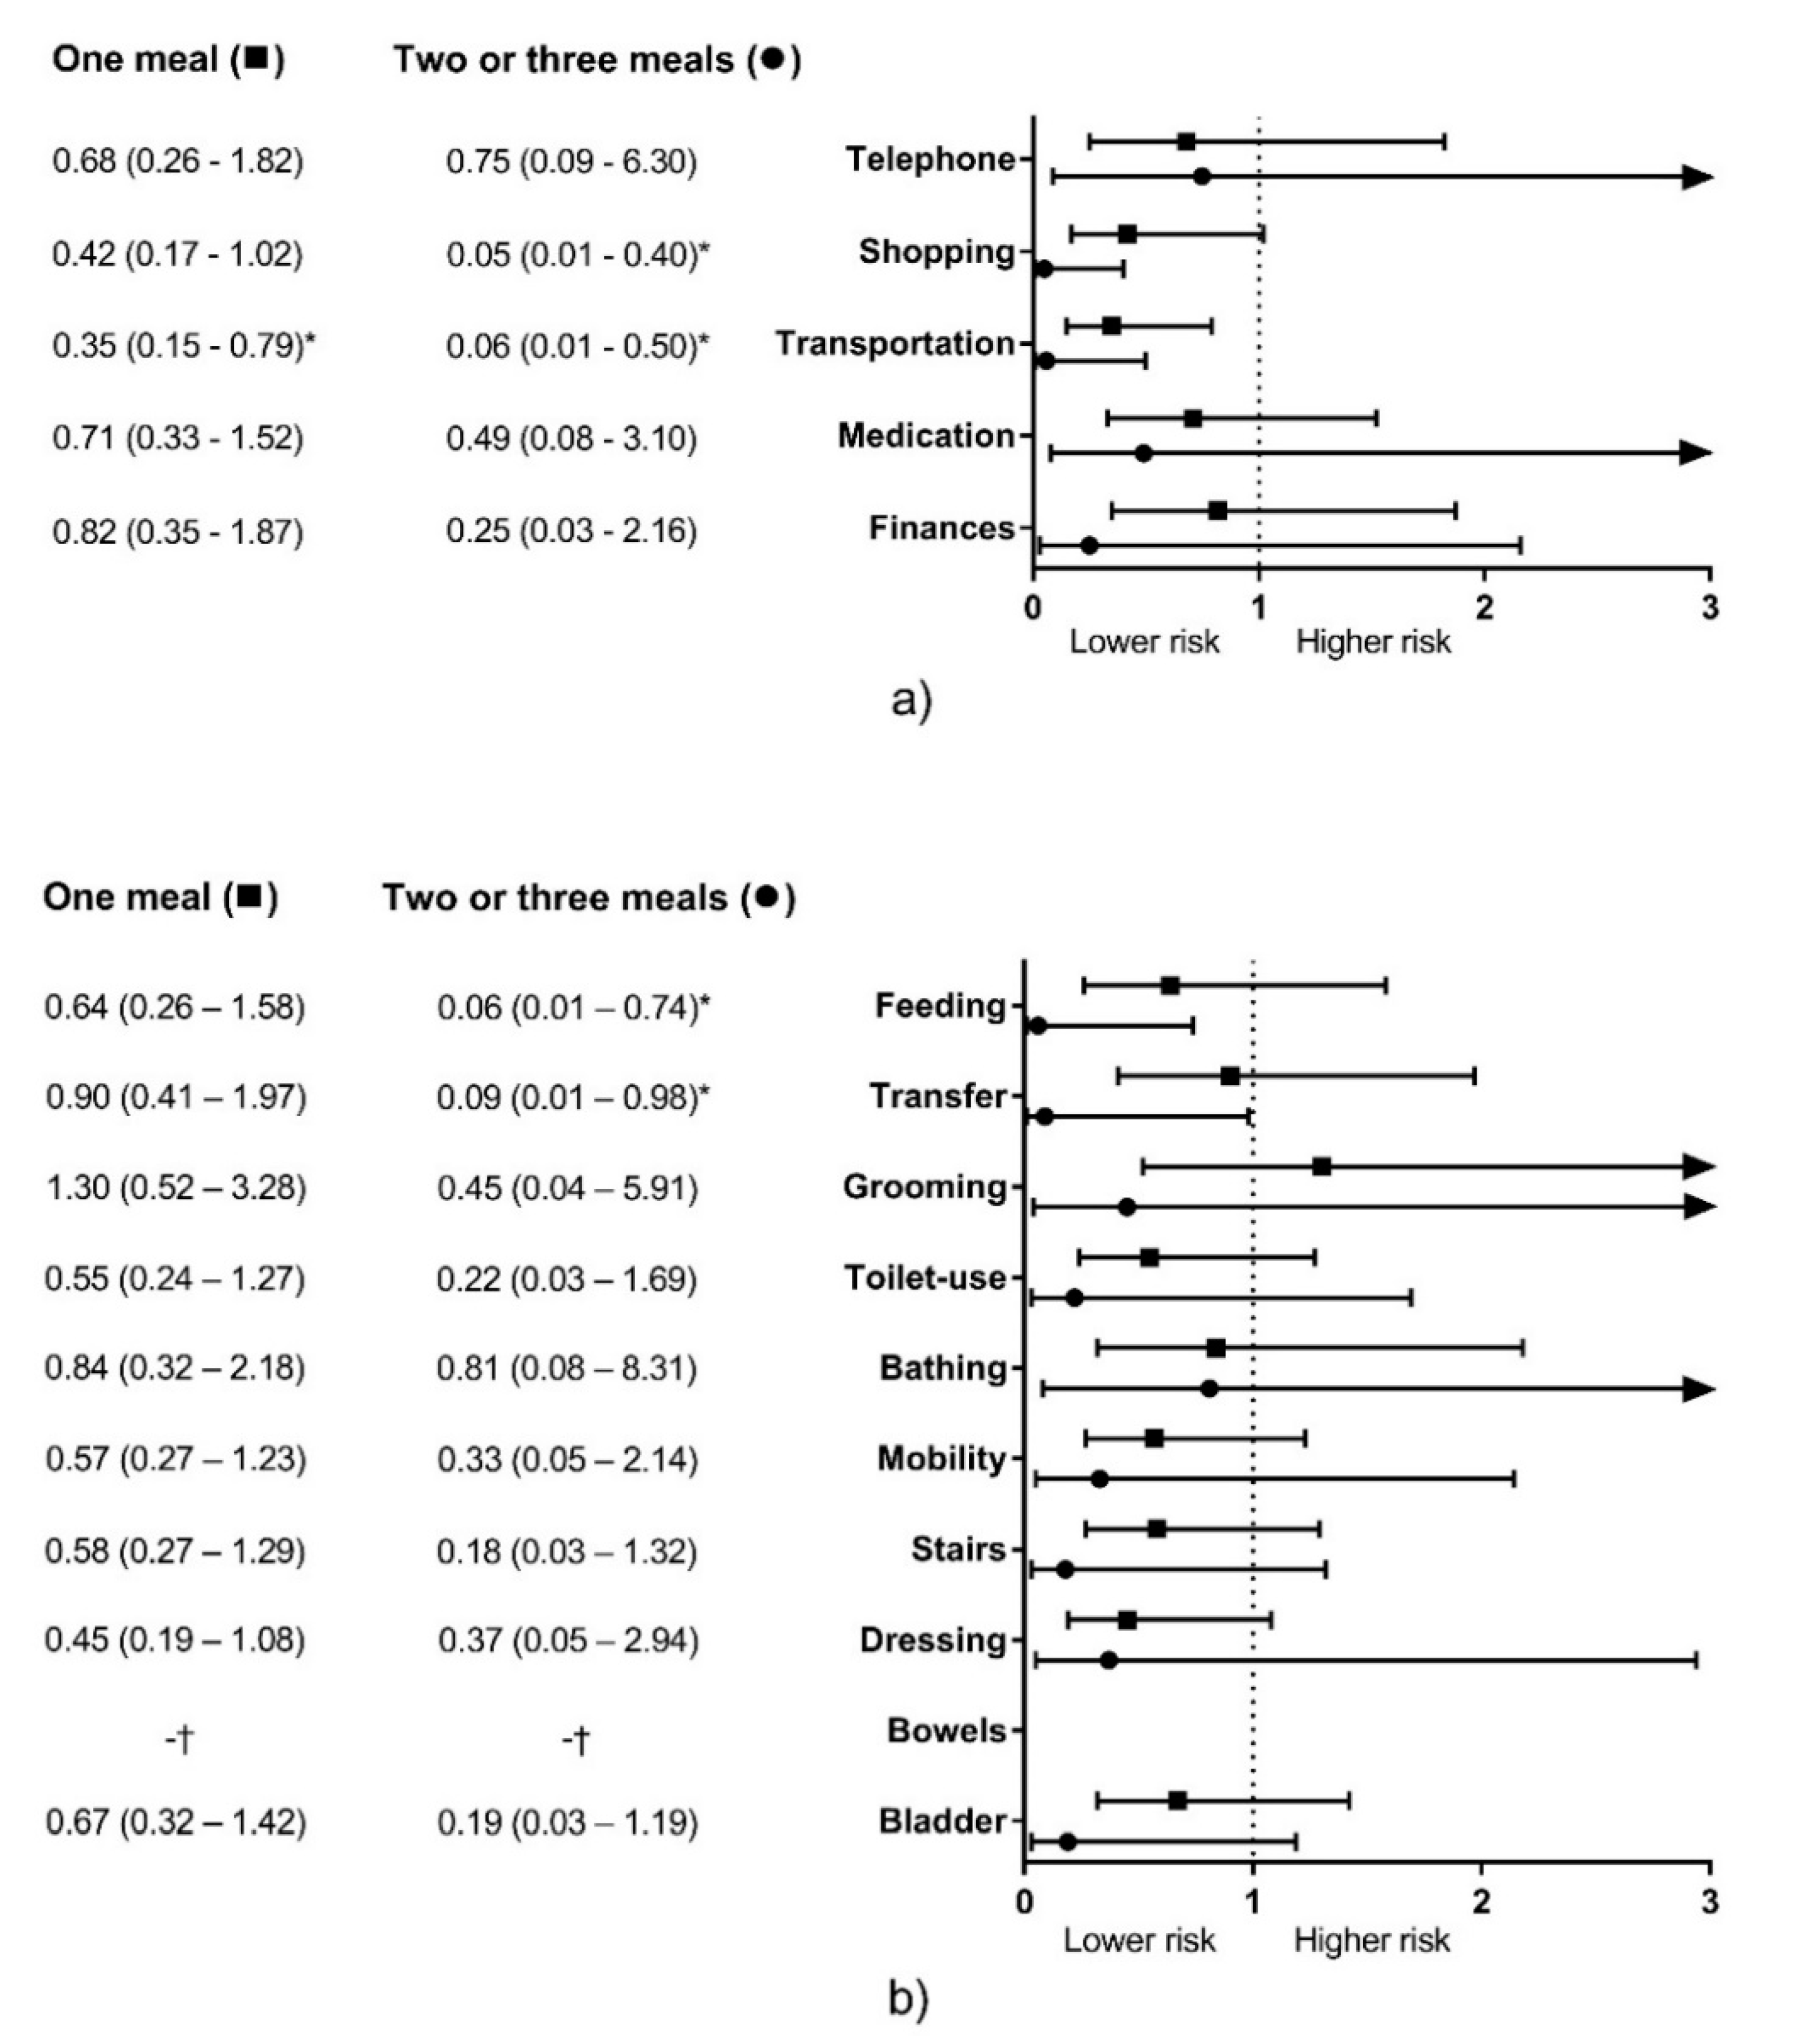
In this study, we observed that consuming two or three meals per day with ≥30 g protein each was significantly associated with lower physical disability risk for two IADL items and two ADL items. Conversely, eating one meal with this protein content was associated with one IADL item only (Figure 1).
To our knowledge, no previous studies have analyzed the association between per-meal protein intake for a certain amount and physical disability. However, there are other studies with a similar approach [36,38]. In this regard, Loenneke et al. [36] reported that older adults consuming two or more meals with ≥30 g protein showed higher leg lean mass and leg strength than those consuming one or zero meals with this criterion. We believe that consuming two or three meals with this protein content was associated with a lower risk of physical disability for more items than consuming one meal because the benefit over muscle mass and strength is bigger for two or more meals with this protein dose than with one meal [36]. Therefore, it is possible that the benefits of muscle mass and strength observed with consuming one meal are not enough to decrease the risk of disability, as happened with two or three meals.
Additionally, high protein intake is associated with a lower age-related decrease in muscle mass and muscle strength [24,48,49], and consuming more meals above this threshold is associated with higher total protein intake (Table 3). Therefore, eating two or more meals with ≥30 g of protein each might be helpful to decrease the age-related decline on lean mass and functionality to a higher level than one meal [35,50], which could lead to a lower risk of physical disability [26].
On the other hand, Gingrich et al. [38] reported that consuming two or more meals with ≥0.4 g protein/kg was not significantly associated with muscle mass, muscle strength, nor muscle power in older adults. The results of Gingrich et al. may differ from previous studies and ours because they evaluated a sample of healthier older adults (subjects with >10 points in the short physical performance battery, <5% unintended weight loss the last three months, ≈96% of the sample was well-nourished, and diabetes and impaired glucose regulation as the only clinical concerns). Indeed, the authors suggested that this kind of protein recommendation would be necessary for older adults with poorer health status.
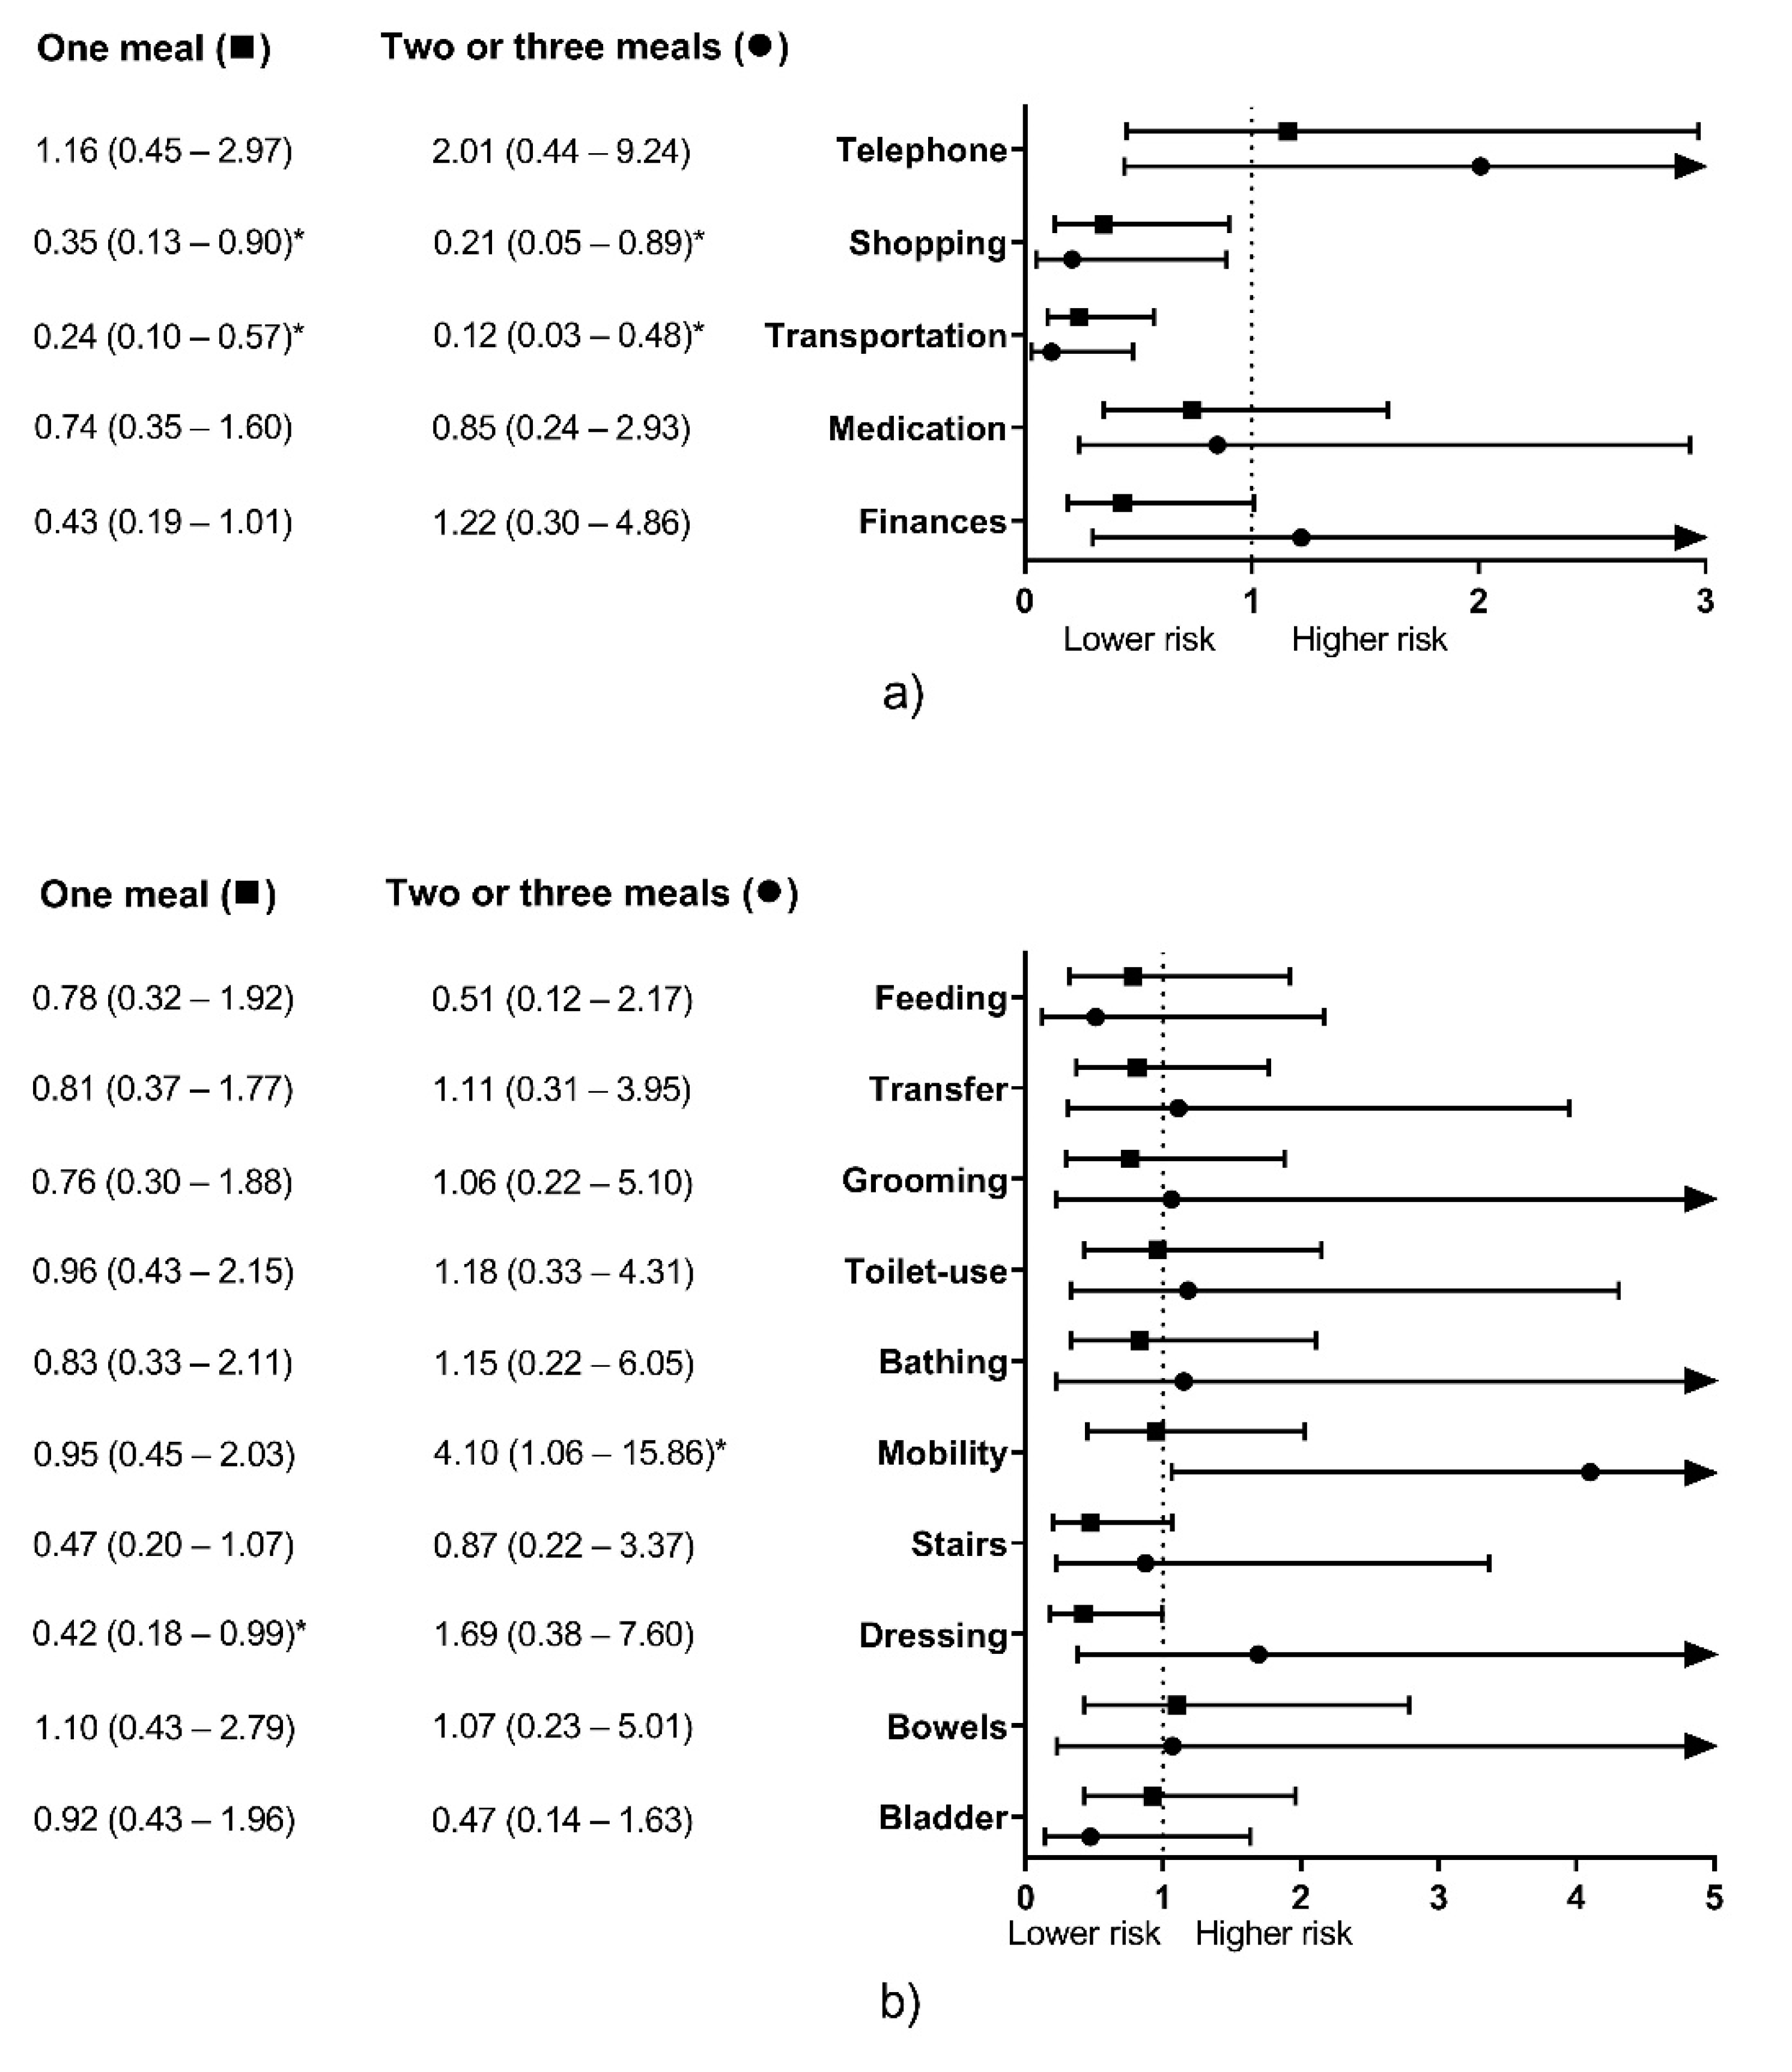
When meals were evaluated with the ≥0.4 g protein/kg threshold, there were conflicting results. Consuming 1M and +2M containing ≥0.4 g protein/kg were significantly associated with lower physical disability risk for two IADL items, Shopping, and Transportation (Figure 2a). Conversely, consuming 1M was associated with lower physical disability risk for one ADL item (Dressing), and eating +2M was associated with higher physical disability risk for one ADL item (Mobility) (Figure 2b). Other studies also reported conflicting results with protein intake and other disability-associated variables (e.g., low skeletal muscle mass). Gregorio et al. [25] and Beasley et al. [51] reported that older adults consuming >0.8 g protein/kg/d showed lower skeletal muscle mass than those consuming protein below this threshold, and Isanejad et al. [24] reported that sarcopenic women ate more relative protein (g/kg/d) than their non-sarcopenic counterparts. It is possible that higher relative protein intake is observed in sarcopenic or disabled people because of their lower body weight [52]. However, their relative protein intake would still not be enough to stimulate muscle protein synthesis optimally. It is recommended that older people with undernutrition or another chronic illness eat more protein (1.2 to 1.5 g/kg/d) to overcome the possible anabolic resistance derived from their condition [28]. We believe that the same could happen for per-meal protein intake. Due to chronic illness may lead to inactivity and inflammation, higher protein dosage per meal could be needed to overcome the anabolic resistance and contribute to the higher daily protein intake [53].
Therefore, the amount of 30 g protein/meal could be more useful for predicting physical disability than the 0.4 g protein/kg/meal criterion in a cross-sectional design. The former significantly predicted physical disability in two items for both IADL and ADL each (Figure 1), while the latter significantly predicted disability for two IADL items, and showed conflicting results for two ADL items (Figure 2).
However, experimental studies have demonstrated that both protein dosages (i.e., 30 g/meal; 0.4 g/kg/meal) optimally stimulate muscle protein synthesis in older adults [29,30]. When muscle protein synthesis overcomes muscle protein breakdown, it leads to positive muscle protein balance, and therefore, protein accretion [31], which translates into muscle mass maintenance or increase if resistance exercise is performed [54]. Due to low muscle mass is significantly associated with weakness [5] and reduced lower limb functionality [55], the association of adequate protein intake per meal with physical disability may be mediated by its role over muscle mass [36]. Therefore, prospective studies should investigate if consuming protein above these thresholds are linked with the incidence of physical disability and its association with muscle mass.
The association between protein intake and lower physical disability risk may also be mediated by its role in decreasing body fat [26,51,56]. As we get older, there is an increase in body fat and fat infiltration into the muscle [57], which leads to decreased muscle quality, strength, and functionality [6,24,58,59]. Additionally, the lower body fat showed with high protein intake in comparison with lower protein intake [26,51], would lead to lessening the pro-inflammatory state observed in subjects with high body fat [60], which also has been reported to mediate the association between muscle strength decline and protein intake in older adults [61]. However, we did not evaluate body composition in this study. Further research should address the interaction between protein intake per meal and body composition and their association with physical disability.
These results could be helpful for the assessment of protein intake per meal in older adults, looking for those who eat less than two meals with ≥30 g or ≥0.4 g/kg as a risk factor before physical disability occurs. However, the interaction of protein intake doses with other variables, as total protein intake [23,24,25,26], physical activity level [16,17,18,19], and participation in exercise programs [19,20,21] should also be monitored in the clinical practice as risk factors.
Even though the number of meals with an adequate protein intake was a significant risk factor for physical disability (Figure 1 and Figure 2), its contribution to the model was low (3.1% to 6.9%), which could be attributable to other dietary and non-dietary factors associated with muscle mass, strength, and functionality in older adults [62,63]. Therefore, it should be considered as a significant but complementary factor when assessing proper functionality in this population. Conversely, age was the most important predictor for physical disability in this study (8% to 29.3%) in accordance with previous studies that describe the age-related decrease in muscle mass, strength, and functionality [4,10,64,65]. Hence, the role of proper dietary protein intake in older adults is, apparently, to mitigate these age-related declines [48,49,50].
It is interesting to note that adequate protein intake per meal was associated with physical disability for ambulatory items (i.e., Shopping and Transportation) in IADL, while it did not predict disability for other more cognitive-related items (Figure 1a and Figure 2a). Possibly because the role of protein over cognition is weaker than with muscle mass and physical functioning [66]. However, for ADL, Transfer was the only ambulatory item associated with adequate protein intake, and Feeding (a more cognitive-related item) was also significantly associated with adequate protein intake (Figure 1b). These differences might be attributable to how disability was considered for each questionnaire, where IADL accepts some degree of difficulty in performing daily living activities and still considers the subject is functional [41], but for ADL, the subject has to report no difficulty to be deemed functional [42].
When we analyzed the dietary protein intake, we observed that most of the protein was ingested at lunch, independently of the group or the adequate protein intake criteria (Table 3 and Table 5) which is similar to previous studies in older adults from Mexico [67], Germany [38], and France [68]. However, reports in other countries suggest that most of the daily protein is consumed at dinner [36,50,69,70,71]. Despite these country-specific differences, it is unlikely that these differences in the timing of protein intake modulate the association between the number of meals with adequate protein intake and disability. For example, Loenneke et al. [36] reported the number of meals with adequate protein intake was significantly related with strength and lean mass in American older adults (higher protein intake at dinner), while a similar result was observed here in Mexican population (higher protein intake at lunch). Nonetheless, Loenneke et al. [36] reported that 32.3% of their sample did not reach the recommended 30 g protein for any meal, and 51.8% did it for only one. In this study, we reported that 61.0% of our sample did not reach this threshold at any meal, and 34.2% did it for one only. These data let us believe that Mexican older adults would be at higher risk of presenting lower lean mass, muscle strength, and a higher risk of physical disability than that observed in American population.
There is evidence suggesting an even protein distribution throughout the day is beneficial to stimulate muscle protein synthesis optimally [72], and the protein CV has been proposed as an indicator for evaluating protein intake evenness, the lower the CV, the evener the distribution [46]. However, we observed that the CV reported in 0M and +2M groups was similar, and a higher IPI was detected in the former group for both criteria (Table 3 and Table 5). Therefore, we believe this indicator should not be used alone, as there could be an even protein distribution, but daily and per-meal protein intake might not be adequate.
We previously published data about subjects participating in the same project [37]. However, it is essential to highlight the differences between our earlier published work and the current study. While we formerly analyzed the association of timing of inadequate protein intake and functionality, we here reported that the accumulated inadequate protein intake per meal, independently of the timing, is also associated with physical disability (Figure 1 and Figure 2). Similarly, this study expands our knowledge about protein intake in Mexican older adults as we reported the dietary protein intake patterns depending on the number of meals with an adequate protein content (Table 3 and Table 5).
Although this study provides important information for the literature, some limitations must be acknowledged. Firstly, the cross-sectional design allows us to infer association between the variables, but not causality. Secondly, our data were collected by participants self-reporting over a 24 h period only and with questionnaires, which is known to lead to inaccurate data [45,73,74]. However, we followed standardized protocols and administrated validated tools to decrease this issue as possible [41,42,45]. Further efforts should be addressed to corroborate our results using more reliable and objective assessment methods.
Thirdly, our sample size was small, especially for the +2M group with the ≥30 g protein/meal criterion, where only nine participants composed this group (Table 2). This small number of participants poorly represented a portion of this population and affected the statistical analysis, which is reflected in very low odds ratios and wide confidence intervals from the logistic regression (Figure 1 and Figure 2). However, it is possible that the low proportion of participants eating adequate amounts of protein (≥30 g) for two or more meals would be similar in other samples of Mexican older adults (≈5%). Therefore, a bigger sample size must be warranted to overcome this limitation. Similarly, there were a higher number of women than men; therefore, despite the models were adjusted by sex, these results might not be representative of men. Also, our sample was recruited from a clinical setting (a regional hospital) from the west of Mexico, and might not be representative of Mexican older adults that do not attend to a medical service (due to healthier status, or inaccessibility to public healthcare) and from other geographical regions. Thus, caution must be considered when translating these results to other populations.
It is also important to highlight that despite non-included and included participants showed similar demographic characteristics (Table 1), the information about the physical disability of those unable to answer to questionnaires is lacking. Similarly, we do not know if the cognitive status could explain the inability of non-included participants to provide detailed dietary information and to answer questionnaires, as we did not measure it. Further studies should evaluate the cognitive status and use objective measures of functionality to overcome these limitations. Finally, the covariables used to adjust the models were not as varied as reported in other studies with “fully adjusted” models. However, we adjusted for basic covariables observed in most studies [23,36,48,49,51,52].

5. Conclusions

In our sample of Mexican adults aged 60 years and older, the consumption of two or three meals per day with ≥30 g of protein each was significantly associated with lower physical disability risk for some IADL (Shopping and Transportation) and ADL items (Feeding and Transfer). While consuming two or three meals with ≥0.4 g protein/kg was significantly associated with lower physical disability risk for two IADL items (Shopping and Transportation) only. Further research is needed to determine if these results persist in larger samples with prospective study designs.

Author Contributions

Conceptualization, A.G.-G., M.d.J.O.-A., F.T.-N. and J.R.L.-T.; methodology, A.G.-G., M.d.J.O.-A., F.T.-N., M.A.-R. and M.G.-B.; formal analysis, A.G.-G. and R.G.G.-M.; investigation, M.d.J.O.-A., M.A.-R. and M.G.-B.; resources, M.d.J.O.-A. and J.R.L.-T.; data curation, A.G.-G. and R.G.G.-M.; writing—original draft preparation, A.G.-G.; writing—review and editing, M.d.J.O.-A., F.T.-N., M.A.-R., R.G.G.-M., M.G.-B. and J.R.L.-T.; visualization, A.G.-G.; project administration, A.G.-G. and J.R.L.-T. All authors have read and agreed to the published version of the manuscript.

Funding

This research received no external funding.

Acknowledgments

The authors would like to thank all the participants involved in this study and their caregivers for their patience and compromise for participating in this research. They also would like to thank Tanya Holloway and Chris McGlory for their valuable review and critical comments on the manuscript. Finally, they would like to acknowledge L.N. Sayra Muñóz Rodríguez, for her assistance with dietary analysis.

Conflicts of Interest

The authors declare no conflict of interest.

Appendix A

Table A1. Items’ definitions for instrumental activities of daily living (IADL) and activities of daily living (ADL).
ScaleItemDefinition a
IADLTelephoneThe ability to use the telephone independently (dialing and/or answering).
ShoppingThe ability to go shopping independently.
TransportationThe ability to drive his or her own car, using public transportation, or a taxi independently.
MedicationThe ability to take its own medicine in proper doses and moments independently.
FinancesThe ability to handle daily living purchases and budgets independently.
ADLFeedingThe ability of proper self-eating, including cutting foods.
TransferThe ability to stand-up from a chair and moving to the bed independently.
GroomingThe ability to handle personal hygiene.
Toilet-useThe ability to reach the toilet, undressing properly, wiping, dressing, and leaving independently.
BathingThe ability of proper self-care while taking a shower.
MobilityThe ability to move or walking independently (sticks or canes are allowed).
StairsThe ability to ascend and descend stairs.
DressingThe ability to select and put on clothes independently.
BowelsThe ability to control the bowels.
BladderThe ability to control the bladder.
a Definitions were modified from the authors’ original redaction. For a more in-depth explanation, see [41,42].

References

  1. Chen, L.; Nelson, D.R.; Zhao, Y.; Cui, Z.; Johnston, J.A. Relationship between Muscle Mass and Muscle Strength, and the Impact of Comorbidities: A Population-Based, Cross-Sectional Study of Older Adults in the United States. BMC Geriatr. 2013, 13, 74. [Google Scholar] [CrossRef] [PubMed] [Green Version]
  2. Gallagher, D.; Visser, M.; De Meersman, R.E.; Sepúlveda, D.; Baumgartner, R.N.; Pierson, R.N.; Harris, T.B.; Heymsfield, S.B. Appendicular Skeletal Muscle Mass: Effects of Age, Gender, and Ethnicity. J. Appl. Physiol. 1997, 83, 229–239. [Google Scholar] [CrossRef]
  3. Mitchell, W.K.; Williams, J.; Atherton, P.; Larvin, M.; Lund, J.; Narici, M. Sarcopenia, Dynapenia, and the Impact of Advancing Age on Human Skeletal Muscle Size and Strength; a Quantitative Review. Front. Physiol. 2012, 3, 260. [Google Scholar] [CrossRef] [Green Version]
  4. Goodpaster, B.H.; Park, S.W.; Harris, T.B.; Kristchevsky, S.B.; Nevitt, M.; Schwartz, A.V.; Simonsick, E.M.; Tylavsky, F.A.; Visser, M.; Newman, A.B. The Loss of Skeletal Muscle Strength, Mass, and Quality in Older Adults: The Health, Aging and Body Composition Study. J. Gerontol. A Biol. Sci. Med. Sci. 2006, 61, 1059–1064. [Google Scholar] [CrossRef] [PubMed]
  5. Cawthon, P.M.; Peters, K.W.; Shardell, M.D.; McLean, R.R.; Dam, T.T.L.; Kenny, A.M.; Fragala, M.S.; Harris, T.B.; Kiel, D.P.; Guralnik, J.M.; et al. Cutpoints for Low Appendicular Lean Mass That Identify Older Adults with Clinically Significant Weakness. J. Gerontol. A Biol. Sci. Med. Sci. 2014, 69, 567–575. [Google Scholar] [CrossRef] [PubMed] [Green Version]
  6. Bea, J.W.; Going, S.B.; Wertheim, B.C.; Bassford, T.L.; LaCroix, A.Z.; Wright, N.C.; Nicholas, J.S.; Heymsfield, S.B.; Chen, Z. Body Composition and Physical Function in the Women’s Health Initiative Observational Study. Prev. Med. Rep. 2018, 11, 15–22. [Google Scholar] [CrossRef]
  7. Janssen, I.; Heymsfield, S.B.; Ross, R. Low Relative Skeletal Muscle Mass (Sarcopenia) in Older Persons Is Associated with Functional Impairment and Physical Disability. J. Am. Geriatr. Soc. 2002, 50, 889–896. [Google Scholar] [CrossRef] [PubMed] [Green Version]
  8. Velázquez Alva, M.D.C.; Irigoyen Camacho, M.E.; Delgadillo Velázquez, J.; Lazarevich, I. The Relationship between Sarcopenia, Undernutrition, Physical Mobility and Basic Activities of Daily Living in a Group of Elderly Women of Mexico City. Nutr. Hosp. 2013, 28, 514–521. [Google Scholar] [CrossRef]
  9. Janssen, I.; Baumgartner, R.N.; Ross, R.; Rosenberg, I.H.; Roubenoff, R. Skeletal Muscle Cutpoints Associated with Elevated Physical Disability Risk in Older Men and Women. Am. J. Epidemiol. 2004, 159, 413–421. [Google Scholar] [CrossRef] [PubMed]
  10. Trombetti, A.; Reid, K.F.; Hars, M.; Herrmann, F.R.; Pasha, E.; Phillips, E.M.; Fielding, R.A. Age-Associated Declines in Muscle Mass, Strength, Power, and Physical Performance: Impact on Fear of Falling and Quality of Life. Osteoporos. Int. 2016, 27, 463–471. [Google Scholar] [CrossRef] [PubMed] [Green Version]
  11. Manrique-Espinoza, B.; Salinas-Rodríguez, A.; Rosas-Carrasco, O.; Gutiérrez-Robledo, L.M.; Avila-Funes, J.A. Sarcopenia Is Associated with Physical and Mental Components of Health-Related Quality of Life in Older Adults. J. Am. Med. Dir. Assoc. 2017, 18, 636.e1–636.e5. [Google Scholar] [CrossRef] [PubMed]
  12. Janssen, I.; Shepard, D.S.; Katzmarzyk, P.T.; Roubenoff, R. The Healthcare Costs of Sarcopenia in the United States. J. Am. Geriatr. Soc. 2004, 52, 80–85. [Google Scholar] [CrossRef] [PubMed]
  13. Arango-Lopera, V.E.; Arroyo, P.; Gutiérrez-Robledo, L.M.; Perez-Zepeda, M.U.; Cesari, M. Mortality as an Adverse Outcome of Sarcopenia. J. Nutr. Health Aging 2013, 17, 259–262. [Google Scholar] [CrossRef] [PubMed]
  14. Liu, P.; Hao, Q.; Hai, S.; Wang, H.; Cao, L.; Dong, B. Sarcopenia as a Predictor of All-Cause Mortality among Community-Dwelling Older People: A Systematic Review and Meta-Analysis. Maturitas 2017, 103, 16–22. [Google Scholar] [CrossRef]
  15. Newman, A.B.; Kupelian, V.; Visser, M.; Simonsick, E.M.; Goodpaster, B.H.; Kritchevsky, S.B.; Tylavsky, F.A.; Rubin, S.M.; Harris, T.B. Strength, but Not Muscle Mass, Is Associated with Mortality in the Health, Aging and Body Composition Study Cohort. J. Gerontol. A Biol. Sci. Med. Sci. 2006, 61, 72–77. [Google Scholar] [CrossRef]
  16. Visser, M.; Simonsick, E.M.; Colbert, L.H.; Brach, J.; Rubin, S.M.; Kritchevsky, S.B.; Newman, A.B.; Harris, T.B. Type and Intensity of Activity and Risk of Mobility Limitation: The Mediating Role of Muscle Parameters. J. Am. Geriatr. Soc. 2005, 53, 762–770. [Google Scholar] [CrossRef]
  17. Trudelle-Jackson, E.; Jackson, A.W. Do Older Adults Who Meet 2008 Physical Activity Guidelines Have Better Physical Performance than Those Who Do Not Meet? J. Geriatr. Phys. Ther. 2018, 41, 180–185. [Google Scholar] [CrossRef]
  18. Kim, J.; Im, J.S.; Choi, Y.H. Objectively Measured Sedentary Behavior and Moderate-to-Vigorous Physical Activity on the Health-Related Quality of Life in US Adults: The National Health and Nutrition Examination Survey 2003–2006. Qual. Life Res. 2017, 26, 1315–1326. [Google Scholar] [CrossRef]
  19. Brach, J.S.; Simonsick, E.M.; Kritchevsky, S.; Yaffe, K.; Newman, A.B. The Association between Physical Function and Lifestyle Activity and Exercise in the Health, Aging and Body Composition Study. J. Am. Geriatr. Soc. 2004, 52, 502–509. [Google Scholar] [CrossRef]
  20. Copeland, J.L.; Good, J.; Dogra, S. Strength Training Is Associated with Better Functional Fitness and Perceived Healthy Aging among Physically Active Older Adults: A Cross-Sectional Analysis of the Canadian Longitudinal Study on Aging. Aging Clin. Exp. Res. 2018. [Google Scholar] [CrossRef]
  21. Kraschnewski, J.L.; Sciamanna, C.N.; Ciccolo, J.T.; Rovniak, L.S.; Lehman, E.B.; Candotti, C.; Ballentine, N.H. Is Exercise Used as Medicine? Association of Meeting Strength Training Guidelines and Functional Limitations among Older US Adults. Prev. Med. 2014, 66, 1–5. [Google Scholar] [CrossRef] [PubMed] [Green Version]
  22. Geirsdottir, O.G.; Arnarson, A.; Ramel, A.; Jonsson, P.V.; Thorsdottir, I. Dietary Protein Intake Is Associated with Lean Body Mass in Community-Dwelling Older Adults. Nutr. Res. 2013, 33, 608–612. [Google Scholar] [CrossRef] [PubMed]
  23. Mangano, K.M.; Sahni, S.; Kiel, D.P.; Tucker, K.L.; Dufour, A.B.; Hannan, M.T. Dietary Protein Is Associated with Musculoskeletal Health Independently of Dietary Pattern: The Framingham Third Generation Study. Am. J. Clin. Nutr. 2017, 105, 714–722. [Google Scholar] [CrossRef] [Green Version]
  24. Isanejad, M.; Mursu, J.; Sirola, J.; Kröger, H.; Rikkonen, T.; Tuppurainen, M.; Erkkilä, A.T. Dietary Protein Intake Is Associated with Better Physical Function and Muscle Strength among Elderly Women. Br. J. Nutr. 2016, 115, 1281–1291. [Google Scholar] [CrossRef] [PubMed] [Green Version]
  25. Gregorio, L.; Brindisi, J.; Kleppinger, A.; Sullivan, R.; Mangano, K.M.; Bihuniak, J.D.; Kenny, A.M.; Kerstetter, J.E.; Insogna, K.L. Adequate Dietary Protein Ís Associated with Better Physical Performance among Post-Menopausal Women 60–90 Years. J. Nutr. Health Aging 2014, 18, 155–160. [Google Scholar] [CrossRef] [Green Version]
  26. Houston, D.K.; Tooze, J.A.; Garcia, K.; Visser, M.; Rubin, S.; Harris, T.B.; Newman, A.B.; Kritchevsky, S.B. Protein Intake and Mobility Limitation in Community-Dwelling Older Adults: The Health ABC Study. J. Am. Geriatr. Soc. 2017, 65, 1705–1711. [Google Scholar] [CrossRef]
  27. Nilsson, A.; Rojas, D.M.; Kadi, F. Impact of Meeting Different Guidelines for Protein Intake on Muscle Mass and Physical Function in Physically Active Older Women. Nutrients 2018, 10, 1156. [Google Scholar] [CrossRef] [Green Version]
  28. Bauer, J.; Biolo, G.; Cederholm, T.; Cesari, M.; Cruz-Jentoft, A.J.; Morley, J.E.; Phillips, S.; Sieber, C.; Stehle, P.; Teta, D.; et al. Evidence-Based Recommendations for Optimal Dietary Protein Intake in Older People: A Position Paper from the PROT-AGE Study Group. J. Am. Med. Dir. Assoc. 2013, 14, 542–559. [Google Scholar] [CrossRef]
  29. Moore, D.R.; Churchward-Venne, T.A.; Witard, O.; Breen, L.; Burd, N.A.; Tipton, K.D.; Phillips, S.M. Protein Ingestion to Stimulate Myofibrillar Protein Synthesis Requires Greater Relative Protein Intakes in Healthy Older versus Younger Men. J. Gerontol. A Biol. Sci. Med. Sci. 2015, 70, 57–62. [Google Scholar] [CrossRef] [Green Version]
  30. Symons, T.B.; Sheffield-Moore, M.; Wolfe, R.R.; Paddon-Jones, D. A Moderate Serving of High-Quality Protein Maximally Stimulates Skeletal Muscle Protein Synthesis in Young and Elderly Subjects. J. Am. Diet. Assoc. 2009, 109, 1582–1586. [Google Scholar] [CrossRef] [Green Version]
  31. Fujita, S.; Dreyer, H.C.; Drummond, M.J.; Glynn, E.L.; Cadenas, J.G.; Yoshizawa, F.; Volpi, E.; Rasmussen, B.B. Nutrient Signalling in the Regulation of Human Muscle Protein Synthesis. J. Physiol. 2007, 582, 813–823. [Google Scholar] [CrossRef]
  32. Morton, R.W.; Traylor, D.A.; Weijs, P.J.M.; Phillips, S.M. Defining Anabolic Resistance: Implications for Delivery of Clinical Care Nutrition. Curr. Opin. Crit. Care 2018, 24, 124–130. [Google Scholar] [CrossRef]
  33. Burd, N.A.; Gorissen, S.H.M.; van Loon, L.J.C. Anabolic Resistance of Muscle Protein Synthesis with Aging. Exerc. Sport Sci. Rev. 2013, 41, 169–173. [Google Scholar] [CrossRef]
  34. Mamerow, M.M.; Mettler, J.A.; English, K.L.; Casperson, S.L.; Arentson-Lantz, E.; Sheffield-Moore, M.; Layman, D.K.; Paddon-Jones, D. Dietary Protein Distribution Positively Influences 24-h Muscle Protein Synthesis in Healthy Adults. J. Nutr. 2014, 144, 876–880. [Google Scholar] [CrossRef] [Green Version]
  35. Farsijani, S.; Morais, J.A.; Payette, H.; Gaudreau, P.; Shatenstein, B.; Gray-Donald, K.; Chevalier, S. Relation between Mealtime Distribution of Protein Intake and Lean Mass Loss in Free-Living Older Adults of the NuAge Study. Am. J. Clin. Nutr. 2016, 104, 694–703. [Google Scholar] [CrossRef]
  36. Loenneke, J.P.; Loprinzi, P.D.; Murphy, C.H.; Phillips, S.M. Per Meal Dose and Frequency of Protein Consumption Is Associated with Lean Mass and Muscle Performance. Clin. Nutr. 2016, 35, 1506–1511. [Google Scholar] [CrossRef]
  37. Gaytán-González, A.; Ocampo-Alfaro, M.D.; Arroniz-Rivera, M.; Torres-Naranjo, F.; González-Mendoza, R.G.; Gil-Barreiro, M.; López-Taylor, J.R. Inadequate Protein Intake at Specific Meals Is Associated with Higher Risk of Impaired Functionality in Middle to Older Aged Mexican Adults. J. Aging Res. 2019, 2019, 6597617. [Google Scholar] [CrossRef] [Green Version]
  38. Gingrich, A.; Spiegel, A.; Kob, R.; Schoene, D.; Skurk, T.; Hauner, H.; Siebe, C.C.; Volkert, D.; Kiesswetter, E. Amount, Distribution, and Quality of Protein Intake Are Not Associated with Muscle Mass, Strength, and Power in Healthy Older Adults without Functional Limitations—An Enable Study. Nutrients 2017, 9, 1358. [Google Scholar] [CrossRef] [Green Version]
  39. Den Ouden, M.E.M.; Schuurmans, M.J.; Arts, I.E.M.A.; Van Der Schouw, Y.T. Physical Performance Characteristics Related to Disability in Older Persons: A Systematic Review. Maturitas 2011, 69, 208–219. [Google Scholar] [CrossRef]
  40. Winter, J.E.; MacInnis, R.J.; Wattanapenpaiboon, N.; Nowson, C.A. BMI and All-Cause Mortality in Older Adults: A Meta-Analysis. Am. J. Clin. Nutr. 2014, 99, 875–890. [Google Scholar] [CrossRef] [Green Version]
  41. Lawton, M.P. The Functional Assessment of Elderly People. J. Am. Geriatr. Soc. 1971, 19, 465–481. [Google Scholar] [CrossRef]
  42. Collin, C.; Wade, D.T.; Davies, S.; Horne, V. The Barthel ADL Index: A Reliability Study. Int. Disabil. Stud. 1988, 10, 61–63. [Google Scholar] [CrossRef]
  43. Vergara, I.; Bilbao, A.; Orive, M.; Garcia-Gutierrez, S.; Navarro, G.; Quintana, J. Validation of the Spanish Version of the Lawton IADL Scale for Its Application in Elderly People. Health Qual. Life Outcomes 2012, 10, 130. [Google Scholar] [CrossRef] [Green Version]
  44. Hopman-Rock, M.; van Hirtum, H.; de Vreede, P.; Freiberger, E. Activities of Daily Living in Older Community-Dwelling Persons: A Systematic Review of Psychometric Properties of Instruments. Aging Clin. Exp. Res. 2019, 31, 917–935. [Google Scholar] [CrossRef] [Green Version]
  45. Shamah-Levy, T.; Rodríguez-Ramirez, S.; Gaona-Pineda, E.B.; Cuevas-Nasu, L.; Carriquiry, A.L.; Rivera, J.A. Three 24-Hour Recalls in Comparison with One Improve the Estimates of Energy and Nutrient Intakes in an Urban Mexican Population. J. Nutr. 2016, 146, 1043–1050. [Google Scholar] [CrossRef] [Green Version]
  46. Bollwein, J.; Diekmann, R.; Kaiser, M.J.; Bauer, J.M.; Uter, W.; Sieber, C.C.; Volkert, D. Distribution but Not Amount of Protein Intake Is Associated with Frailty: A Cross-Sectional Investigation in the Region of Nürnberg. Nutr. J. 2013, 12, 109. [Google Scholar] [CrossRef] [Green Version]
  47. Hoaglin, D.C.; Iglewicz, B. Fine-Tuning Some Resistant Rules for Outlier Labeling. J. Am. Stat. Assoc. 1987, 82, 1147–1149. [Google Scholar] [CrossRef]
  48. McLean, R.R.; Mangano, K.M.; Hannan, M.T.; Kiel, D.P.; Sahni, S. Dietary Protein Intake Is Protective against Loss of Grip Strength among Older Adults in the Framingham Offspring Cohort. J. Gerontol. A Biol. Sci. Med. Sci. 2016, 71, 356–361. [Google Scholar] [CrossRef] [Green Version]
  49. Houston, D.K.; Nicklas, B.J.; Ding, J.; Harris, T.B.; Tylavsky, F.A.; Newman, A.B.; Lee, J.S.; Sahyoun, N.R.; Visser, M.; Kritchevsky, S.B. Dietary Protein Intake Is Associated with Lean Mass Change in Older, Community-Dwelling Adults: The Health, Aging, and Body Composition (Health ABC) Study. Am. J. Clin. Nutr. 2008, 87, 150–155. [Google Scholar] [CrossRef] [Green Version]
  50. Farsijani, S.; Payette, H.; Morais, J.A.; Shatenstein, B.; Gaudreau, P.; Chevalier, S. Even Mealtime Distribution of Protein Intake Is Associated with Greater Muscle Strength, but Not with 3-y Physical Function Decline, in Free-Living Older Adults: The Quebec Longitudinal Study on Nutrition as a Determinant of Successful Aging (NuAge Study). Am. J. Clin. Nutr. 2017, 106, 113–124. [Google Scholar] [CrossRef]
  51. Beasley, J.M.; Deierlein, A.L.; Morland, K.B.; Granieri, E.C.; Spark, A. Is Meeting the Recommended Dietary Allowance (RDA) for Protein Related to Body Composition among Older Adults?: Results from the Cardiovascular Health of Seniors and Built Environment Study. J. Nutr. Heal. Aging 2016, 20, 790–796. [Google Scholar] [CrossRef] [Green Version]
  52. Ten Haaf, D.S.M.; Van Dongen, E.J.I.; Nuijten, M.A.H.; Eijsvogels, T.M.H.; De Groot, L.C.P.G.M.; Hopman, M.T.E. Protein Intake and Distribution in Relation to Physical Functioning and Quality of Life in Community-Dwelling Elderly People: Acknowledging the Role of Physical Activity. Nutrients 2018, 10, 506. [Google Scholar] [CrossRef] [Green Version]
  53. Gordon, B.S.; Kelleher, A.R.; Kimball, S.R. Regulation of Muscle Protein Synthesis and the Effects of Catabolic States. Int. J. Biochem. Cell Biol. 2013, 45, 2147–2157. [Google Scholar] [CrossRef] [Green Version]
  54. Morton, R.W.; McGlory, C.; Phillips, S.M. Nutritional Interventions to Augment Resistance Training-Induced Skeletal Muscle Hypertrophy. Front. Physiol. 2015, 6, 245. [Google Scholar] [CrossRef] [Green Version]
  55. Newman, A.B.; Kupelian, V.; Visser, M.; Simonsick, E.; Goodpaster, B.; Nevitt, M.; Kritchevsky, S.B.; Tylavsky, F.A.; Rubin, S.M.; Harris, T.B. Sarcopenia: Alternative Definitions and Associations with Lower Extremity Function. J. Am. Geriatr. Soc. 2003, 51, 1602–1609. [Google Scholar] [CrossRef] [Green Version]
  56. Arciero, P.J.; Ormsbee, M.J.; Gentile, C.L.; Nindl, B.C.; Brestoff, J.R.; Ruby, M. Increased Protein Intake and Meal Frequency Reduces Abdominal Fat during Energy Balance and Energy Deficit. Obesity 2013, 21, 1357–1366. [Google Scholar] [CrossRef]
  57. JafariNasabian, P.; Inglis, J.E.; Reilly, W.; Kelly, O.J.; Ilich, J.Z. Aging Human Body: Changes in Bone, Muscle and Body Fat with Consequent Changes in Nutrient Intake. J. Endocrinol. 2017, 234, R37–R51. [Google Scholar] [CrossRef] [Green Version]
  58. Sternfeld, B.; Ngo, L.; Satariano, W.A.; Tager, I.B. Associations of Body Composition with Physical Performance and Self-Reported Functional Limitation in Elderly Men and Women. Am. J. Epidemiol. 2002, 156, 110–121. [Google Scholar] [CrossRef] [Green Version]
  59. Visser, M.; Goodpaster, B.H.; Kritchevsky, S.B.; Newman, A.B.; Nevitt, M.; Rubin, S.M.; Simonsick, E.M.; Harris, T.B. Muscle Mass, Muscle Strength, and Muscle Fat Infiltration as Predictors of Incident Mobility Limitations in Well-Functioning Older Persons. J. Gerontol. A Biol. Sci. Med. Sci. 2005, 60, 324–333. [Google Scholar] [CrossRef]
  60. Reilly, S.M.; Saltiel, A.R. Adapting to Obesity with Adipose Tissue Inflammation. Nat. Rev. Endocrinol. 2017, 13, 633–643. [Google Scholar] [CrossRef]
  61. Bartali, B.; Frongillo, E.A.; Stipanuk, M.H.; Bandinelli, S.; Salvini, S.; Palli, D.; Morais, J.A.; Volpato, S.; Guralnik, J.M.; Ferrucci, L. Protein Intake and Muscle Strength in Older Persons: Does Inflammation Matter? J. Am. Geriatr. Soc. 2012, 60, 480–484. [Google Scholar] [CrossRef] [PubMed] [Green Version]
  62. Liguori, I.; Russo, G.; Aran, L.; Bulli, G.; Curcio, F.; Della-Morte, D.; Gargiulo, G.; Testa, G.; Cacciatore, F.; Bonaduce, D.; et al. Sarcopenia: Assessment of Disease Burden and Strategies to Improve Outcomes. Clin. Interv. Aging 2018, 13, 913–927. [Google Scholar] [CrossRef] [PubMed] [Green Version]
  63. Tieland, M.; Trouwborst, I.; Clark, B.C. Skeletal Muscle Performance and Ageing. J. Cachexia. Sarcopenia Muscle 2018, 9, 3–19. [Google Scholar] [CrossRef] [PubMed]
  64. Benjumea, A.-M.; Curcio, C.-L.; Duque, G.; Gomez, F.; Gomez, F. Dynapenia and Sarcopenia as a Risk Factor for Disability in a Falls and Fractures Clinic in Older Persons. Open Access Maced. J. Med. Sci. 2018, 6, 344–349. [Google Scholar] [CrossRef] [Green Version]
  65. Baumgartner, R.N.; Waters, D.L.; Gallagher, D.; Morley, J.E.; Garry, P.J. Predictors of Skeletal Muscle Mass in Elderly Men and Women. Mech. Ageing Dev. 1999, 107, 123–136. [Google Scholar] [CrossRef]
  66. Glenn, J.M.; Madero, E.N.; Bott, N.T. Dietary Protein and Amino Acid Intake: Links to the Maintenance of Cognitive Health. Nutrients 2019, 11, 1315. [Google Scholar] [CrossRef] [Green Version]
  67. Ruiz Valenzuela, R.E.; Ponce, J.A.; Morales-Figueroa, G.G.; Aguilar Muro, K.; Ramírez Carreón, V.; Alemán-Mateo, H. Insufficient Amounts and Inadequate Distribution of Dietary Protein Intake in Apparently Healthy Older Adults in a Developing Country: Implications for Dietary Strategies to Prevent Sarcopenia. Clin. Interv. Aging 2013, 8, 1143–1148. [Google Scholar] [CrossRef] [Green Version]
  68. Rousset, S.; Mirand, P.P.; Brandolini, M.; Martin, J.-F.; Boirie, Y. Daily Protein Intakes and Eating Patterns in Young and Elderly French. Br. J. Nutr. 2003, 90, 1107–1115. [Google Scholar] [CrossRef] [Green Version]
  69. Cardon-Thomas, D.K.; Riviere, T.; Tieges, Z.; Greig, C.A. Dietary Protein in Older Adults: Adequate Daily Intake but Potential for Improved Distribution. Nutrients 2017, 9, 184. [Google Scholar] [CrossRef]
  70. Tieland, M.; Borgonjen-Van den Berg, K.J.; van Loon, L.J.C.; de Groot, L.C.P.G.M. Dietary Protein Intake in Dutch Elderly People: A Focus on Protein Sources. Nutrients 2015, 7, 9697–9706. [Google Scholar] [CrossRef]
  71. Berner, L.A.; Becker, G.; Wise, M.; Doi, J. Characterization of Dietary Protein among Older Adults in the United States: Amount, Animal Sources, and Meal Patterns. J. Acad. Nutr. Diet. 2013, 113, 809–815. [Google Scholar] [CrossRef] [PubMed]
  72. Murphy, C.H.; Oikawa, S.Y.; Phillips, S.M. Dietary Protein to Maintain Muscle Mass in Aging: A Case for per-Meal Protein Recommendations. J. Frailty Aging 2016, 5, 49–58. [Google Scholar] [CrossRef] [PubMed]
  73. Ma, Y.; Olendzki, B.C.; Pagoto, S.L.; Hurley, T.G.; Magner, R.P.; Ockene, I.S.; Schneider, K.L.; Merriam, P.A.; Hébert, J.R. Number of 24-Hour Diet Recalls Needed to Estimate Energy Intake. Ann. Epidemiol. 2009, 19, 553–559. [Google Scholar] [CrossRef] [PubMed] [Green Version]
  74. Katz, P.P. Measures of Adult General Functional Status: The Barthel Index, Katz Index of Activities of Daily Living, Health Assessment Questionnaire (HAQ), MACTAR Patient Preference Disability Questionnaire, and Modified Health Assessment Questionnaire (MHAQ). Arthritis Rheum. 2003, 49, S15–S27. [Google Scholar] [CrossRef]
Figure 1. Physical disability risk on instrumental activities of daily living (a) and activities of daily living (b) depending on the number of meals per day with ≥30 g protein. Data expressed as odds ratios (95% confidence intervals), Zero meals was the reference group. The associations were adjusted for sex, age, inadequate protein intake per day, BMI categories, and number of diagnosed diseases. * Significant association (p ≤ 0.05). † Not calculated due to small sample size. Arrows denote 95% CI continues out of the graph scale.
Geriatrics 05 00001 g001
Figure 2. Physical disability risk on instrumental activities of daily living (a) and activities of daily living (b) depending on the number of meals per day with ≥0.4 g protein/kg. Data expressed as odds ratios (95% confidence intervals), Zero meals was the reference group. The associations were adjusted for sex, age, inadequate protein intake per day, BMI categories, and number of diagnosed diseases. * Significant association (p ≤ 0.05). Arrows denote 95% CI continues out of the graph scale.
Geriatrics 05 00001 g002
Table 1. Comparison of demographic characteristics and prevalence of physical disabilities between included and non-included participants.
Included #Non-Includedn p
Women 140(74.9%)339(71.8%)4720.50
Age (y) 78.5±7.778.4±9.04650.92
Height (cm) §153(148–160)153(147–160)4190.97
Weight (kg)62(53–69)63(52–73)4290.72
BMI (kg/m2)26.3(22.8–29.6)26.3(22.8–30.5)4160.95
BMI category
Below49(26.2%)110(26.4%)
Recommended104(55.6%)208(50.0%)4160.29
Above34(18.2%)98(23.6%)
Number of diagnosed diseases
037(19.8%)77(16.3%)
177(41.2%)182(38.6%)4710.33
≥273(39.0%)212(45.0%)
IADL physical disability
Telephone37(19.8%)82(23.8%)3440.33
Shopping141(75.4%)236(68.6%)3440.11
Transportation108(57.8%)211(61.3%)3440.46
Medication105(56.1%)191(55.5%)3440.93
Finances68(36.4%)140(40.7%)3440.35
ADL physical disability
Feeding47(25.1%)102(29.9%)3410.27
Transfer81(43.3%)152(44.6%)3410.78
Grooming42(22.5%)77(22.6%)3411.00
Toilet-use63(33.7%)113(33.1%)3410.92
Bathing44(23.5%)84(24.6%)3410.83
Mobility90(48.1%)172(50.4%)3410.65
Stairs117(62.6%)203(59.5%)3410.52
Dressing74(39.6%)137(40.2%)3410.93
Bowels36(19.3%)65(19.1%)3411.00
Bladder94(50.3%)147(43.1%)3410.12
# n = 187. Due to missing data, the sample size is reported for each variable for non-included participants. Data expressed as frequencies (percentage). Data expressed as mean ± standard deviation. § Data expressed as median (25th–75th percentile). ADL: Activities of daily living; BMI: Body mass index; IADL: Instrumental activities of daily living.
Table 2. Participants’ demographic characteristics according to the number of meals with an adequate amount of protein (≥30 g) (n = 187).
Zero MealsOne MealTwo or Three Mealsp
n114649
Women 88(77.2%)48(75.0%)4(44.4%)0.09
Age (y) 79.1±7.477.4±8.077.4±9.40.33
Height (cm)152.9±8.7154.0±9.4158.8±10.40.16
Weight (kg) §61.8(52.8–70.3)63.5(54.3–69.6)62.0(55.5–66.5)0.81
BMI (kg/m2)26.9(22.6–29.8)25.8(23.5–28.5)24.2(21.3–27.0)0.25
BMI category
Below33(28.9%)13(20.3%)3(33.3%)0.29
Recommended58(50.9%)41(64.1%)6(66.7%)
Above23(20.2%)10(15.6%)0(0%)
Number of diagnosed diseases
024(21.1%)11(17.2%)2(22.2%)0.43
144(38.6%)27(42.2%)6(66.7%)
≥246(40.4%)26(40.6%)1(11.1%)
Data expressed as frequencies (percentage). Data expressed as mean ± standard deviation. § Data expressed as median (25th–75th percentile). BMI: Body mass index.
Table 3. Participants’ dietary characteristics according to the number of meals with an adequate amount of protein (≥30 g) (n = 187).
Zero MealsOne MealTwo or Three Mealsp
n114649
IPI (<1.2 g/kg/d) 103(90.4%)38(59.4%)0(0%)<0.001
Protein (g/d) 45.5±13.5 a68.0±11.7 b101.7±19.3 c<0.001
Protein (g/kg/d)0.77±0.29 a1.11±0.30 b1.68±0.31 c<0.001
Plant protein (g/d) §16.0(12.0–27.1) a19.8(16.0–25.0) ab26.7(17.0–32.6) b0.037
Animal protein (g/d)28.1(17.2–37.1) a47.4(38.5–57.3) b74.7(55.8–96.4) b<0.001
Animal protein (%)62.4(43.0–74.0) a71.3(61.7–78.0) b72.5(67.5–83.1) b<0.001
CV0.45(0.31–0.62) a0.65(0.47–0.83) b0.48(0.35–0.61) ab<0.001
Protein per meal (g)
Breakfast15.4±6.7 a18.7±8.6 b31.4±9.5 c<0.001
Lunch20.4(12.4–25.2) a35.4(31.1–39.2) b43.6(34.3–50.1) b<0.001
Dinner10.4(6.9–14.8) a12.5(7.9–16.7) ab34.2(8.5–43.6) b0.017
Protein per meal (g/kg)
Breakfast0.24(0.16–0.34) a0.32(0.16–0.42) a0.47(0.39–0.67) b<0.001
Lunch0.31(0.19–0.41) a0.58(0.48–0.63) b0.74(0.55–0.78) b<0.001
Dinner0.16(0.11–0.25) a0.21(0.11–0.30) ab0.52(0.14–0.77) b0.015
Data expressed as frequencies (percentage). Data expressed as mean ± standard deviation. § Data expressed as median (25th–75th percentile). Different letters denote significant differences between groups within variables (p ≤ 0.05). CV: Coefficient of variation of protein distribution; IPI: Inadequate protein intake per day.
Table 4. Participants’ demographic characteristics according to the number of meals with an adequate amount of protein (≥0.4 g/kg) (n = 187).
Zero MealsOne MealTwo or Three Mealsp
n777337
Women 59(76.6%)54(74.0%)27(73.0%)0.89
Age (y) 78.6±7.777.8±7.379.5±8.60.54
Height (cm) §152(147–158)154(148–161)151(149–156)0.29
Weight (kg)69.1±14.2 a61.6±10.6 b53.8±8.4 c<0.001
BMI (kg/m2)28.7(26.2–31.8) a25.7(22.6–27.6) b22.8(20.8–24.8) c<0.001
BMI category
Below9(11.7%)21(28.7%)19(51.4%)<0.001
Recommended45(58.4%)44(60.3%)16(43.2%)
Above23(29.9%)8(11.0%)2(5.4%)
Number of diagnosed diseases
017(22.1%)13(17.8%)7(18.9%)0.60
130(39.0%)28(38.4%)19(51.4%)
≥230(39.0%)32(43.8%)11(29.7%)
Data expressed as frequencies (percentage). Data expressed as mean ± standard deviation. § Data expressed as median (25th–75th percentile). Different letters denote significant differences between groups within variables (p ≤ 0.05). BMI: Body mass index.
Table 5. Participants’ dietary characteristics according to the number of meals with an adequate amount of protein (≥0.4 g/kg) (n = 187).
Zero MealsOne MealTwo or Three Mealsp
n777337
IPI (<1.2 g/kg/d) 77(100%)57(78.1%)7(18.9%)<0.001
Protein (g/d) 42.5±13.9 a61.1±11.7 b76.7±19.8 c<0.001
Protein (g/kg/d)0.62±0.18 a1.01±0.21 b1.43±0.30 c<0.001
Plant protein (g/d) §16.0(12.0–23.8) a18.0(14.0–25.0) a24.2(18.0–31.0) b0.001
Animal protein (g/d)23.0(14.4–35.9) a42.1(31.5–48.3) b52.2(37.2–59.5) b<0.001
Animal protein (%)63.2(41.0–74.2) a70.5(60.6–77.6) b70.3(55.4–74.2) ab0.019
CV §0.45(0.32–0.63) a0.59(0.41–0.82) b0.52(0.36–0.66) ab0.006
Protein per meal (g)
Breakfast14.0±6.4 a16.4±7.3 a25.9±7.7 b<0.001
Lunch16.0±8.3 a30.7±10.5 b32.6±10.7 b<0.001
Dinner10.1(6.7–14.1)13.5(7.9–16.1)12.4(6.2–22.4)0.087
Protein per meal (g/kg)
Breakfast0.18(0.14–0.30) a0.27(0.17–0.36) b0.47(0.41–0.54) c<0.001
Lunch0.25(0.13–0.33) a0.50(0.41–0.59) b0.61(0.48–0.74) b<0.001
Dinner0.15(0.10–0.19) a0.21(0.12–0.29) b0.28(0.12–0.44) b<0.001
Data expressed as frequencies (percentage). Data expressed as mean ± standard deviation. § Data expressed as median (25th–75th percentile). Different letters denote significant differences between groups within variables (p ≤ 0.05). CV: Coefficient of variation of protein distribution; IPI: Inadequate protein intake.
Table 6. Participants’ distribution depending on the number of physical disabilities reported in activities of daily living (ADL) or instrumental activities of daily living (IADL) (n = 187).
Number of DisabilitiesIADLADL a
n(%)n(%)
036(19.2)38(20.3)
130(16.0)27(14.5)
225(13.4)23(12.3)
328(15.0)18(9.6)
445(24.1)16(8.6)
523(12.3)6(3.2)
6-15(8.0)
7-8(4.3)
8-12(6.4)
9-15(8.0)
10-9(4.8)
a Distributions significantly different within ADL (p ≤ 0.05). Calculated with χ2 goodness of fit.
Table 7. Frequency and percentage of participants with physical disability depending on the daily living activity and number of meals with adequate protein intake (≥30 g).
Zero Meals (n = 114)One Meal (n = 64)Two or Three Meals (n = 9)p *
n(%)n(%)n(%)
IADL
Telephone25(21.9)10(15.6)2(22.2)0.59
Shopping95(83.3)43(67.2)3(33.3)0.001
Transportation75(65.8)30(46.9)3(33.3)0.016
Medication67(58.8)33(51.6)5(55.6)0.65
Finances45(39.5)21(32.8)2(22.2)0.45
ADL
Feeding29(25.4)17(26.6)1(11.1)0.60
Transfer53(46.5)27(42.2)1(11.1)0.12
Grooming27(23.7)14(21.9)1(11.1)0.68
Toilet-use43(37.7)18(28.1)2(22.2)0.33
Bathing29(25.4)13(20.3)2(22.2)0.74
Mobility62(54.4)25(39.1)3(33.3)0.10
Stairs80(70.2)34(53.1)3(33.3)0.014
Dressing51(44.7)20(31.3)3(33.3)0.20
Bowels24(21.1)12(18.8)0(0)0.30
Bladder62(54.4)29(45.3)3(33.3)0.30
ADL: Activities of daily living; IADL: Instrumental activities of daily living. * p-value obtained from χ2test of independence.
Table 8. Frequency and percentage of participants with physical disability depending on the daily living activity and number of meals with adequate protein intake (≥0.4 g/kg).
Zero Meals (n = 77)One Meal (n = 73)Two or Three Meals (n = 37)p *
n(%)n(%)n(%)
IADL
Telephone14(18.2)13(17.8)10(27.0)0.47
Shopping64(83.1)51(69.9)26(70.3)0.12
Transportation53(68.8)35(47.9)20(54.1)0.031
Medication44(57.1)37(50.7)24(64.9)0.36
Finances32(41.6)18(24.7)18(48.6)0.022
ADL
Feeding17(22.1)17(23.3)13(35.1)0.29
Transfer33(42.9)29(39.7)19(51.4)0.51
Grooming19(24.7)14(19.2)9(24.3)0.69
Toilet-use24(31.2)23(31.5)16(43.2)0.39
Bathing19(24.7)15(20.5)10(27.0)0.72
Mobility37(48.1)30(41.1)23(62.2)0.11
Stairs55(71.4)38(52.1)24(64.9)0.047
Dressing34(44.2)20(27.4)20(54.1)0.015
Bowels14(18.2)14(19.2)8(21.6)0.91
Bladder39(50.6)36(49.3)19(51.4)0.98
ADL: Activities of daily living; IADL: Instrumental activities of daily living. * p-value obtained from χ2 test of independence.

