The Eminence of Co-Expressed Ties in Schizophrenia Network Communities
by

Amulyashree Sridhar
1,*, 
Sharvani GS
1,
AH Manjunatha Reddy
2,
Biplab Bhattacharjee
3 and
Kalyan Nagaraj
1 1
Department of Computer Science and Engineering, RV College of Engineering, Bangalore 560059, India
2
Department of Biotechnology, RV College of Engineering, Bangalore 560059, India
3
Department of Management, Amrita Vishwa Vidyapeetham, Amritapuri, Kollam 690525, India
*
Author to whom correspondence should be addressed.
Data 2019, 4(4), 149; https://doi.org/10.3390/data4040149
Submission received: 11 September 2019
/
Revised: 6 November 2019
/
Accepted: 27 November 2019
/
Published: 29 November 2019
(This article belongs to the Special Issue Data-Driven Healthcare Tasks: Tools, Frameworks, and Techniques)
Abstract
:Exploring gene networks is crucial for identifying significant biological interactions occurring in a disease condition. These interactions can be acknowledged by modeling the tie structure of networks. Such tie orientations are often detected within embedded community structures. However, most of the prevailing community detection modules are intended to capture information from nodes and its attributes, usually ignoring the ties. In this study, a modularity maximization algorithm is proposed based on nonlinear representation of local tangent space alignment (LTSA). Initially, the tangent coordinates are computed locally to identify k-nearest neighbors across the genes. These local neighbors are further optimized by generating a nonlinear network embedding function for detecting gene communities based on eigenvector decomposition. Experimental results suggest that this algorithm detects gene modules with a better modularity index of 0.9256, compared to other traditional community detection algorithms. Furthermore, co-expressed genes across these communities are identified by discovering the characteristic tie structures. These detected ties are known to have substantial biological influence in the progression of schizophrenia, thereby signifying the influence of tie patterns in biological networks. This technique can be extended logically on other diseases networks for detecting substantial gene “hotspots”.
1. Introduction
Schizophrenia is a multifaceted disorder characterized as a dysfunctional psychiatric illness. This condition occurs across 1.5% of world population prominently leading to cognitive impairment and thought delusions [1]. Having a manifold of neurochemical symptoms makes it further demanding to devise advanced treatments for eradicating this disorder. Furthermore, studies have highlighted the correlations between aberrant brain interactions and occurrence of the first episode of schizophrenia [2]. While imaging and spectroscopic techniques reveal structural abnormalities associated with the disorder, their impact on the brain function is yet unknown, to a certain extent [3,4]. Thereby, several studies in past have failed to identify the fundamental phenomenon responsible for a dysfunctional brain [5]. In this context, comparative analysis of numerous psychiatric conditions including schizophrenia, depressive, bipolar and treatment resistant schizophrenia (TRS) revealed that this subtype of schizophrenia, TRS, is associated with severe cognitive and psychopathological impairments requiring specialized treatment measures [6]. Henceforth, treatment of the illness requires treatments specific to different variants of schizophrenia. Currently, antipsychotic drugs are widely used for treatment of schizophrenia. However, safety and efficacy of these medications remain questionable [7,8]. Henceforth, alternative mechanisms are been uncovered currently for discovering the pathological, etiological and physiological impacts of this illness. In this direction, computational methods are seen as better alternatives. These techniques have paved the way for recognizing the functioning of brain at diverse orientations [9,10,11].
Centered on this idea, modeling schizophrenia as a computational network has received widespread attention in recent years due to its prognostic proficiencies as compared to other conventional techniques like magnetic spectroscopy and imaging techniques [12,13,14]. Computational approaches are capable of associating genomic information across neural circuits to identify functional phenotypes expressed in the disorder. Such network-based approaches further analyze topological features of a disease, oriented as a modular unit. The so-derived biological modules characterize patterns of interactions across several psychopathological, cognitive and psychological factors responsible for schizophrenia [15].
Numerous computational techniques have been adopted in previous studies for identifying the functional network modules from biological entities [16,17]. Some of the popular ones include greedy algorithms, network propagation techniques and co-clustering methodologies [18]. Apart from these techniques, biological modules are also discovered using community detection. Community detection techniques are preferred in the case of biological networks due to their commendable influence in distinguishing the functional components within networks [19]. Communities obtained from such networks are usually oriented with dense interconnections across internal nodes when compared with other nodes. These communities are further essential to identifying the dynamics and topological features of the entire network. The assorted connections identified across communities will eventually help in exploring the interrelationships across nodes and their influences on other nodes. For instance, analysis of communities in biological networks identifies the connotations across multiple genetic factors responsible for epidemics of a disease.
Furthermore, the tie arrangement spanned across a network can be analyzed taking into account the community structure. These ties are oriented as strong or weak based on the strength of interactions across the nodes [20]. Identifying such ties reveals the integrity of networks across its neighboring nodes [21].
Taking into account the benefits of community structures, this study is intended to ascertain the impact of the tie structure in schizophrenia gene network. Especially, the work identifies some relevant research questions in this direction:
Question 1: What is the influence of community structure in gene networks?
Question 2: How does the tie structure influence the orientation of gene modules in schizophrenia?
Question 3: Specifically, what tie category influences the functioning of schizophrenia gene network?
2. Related Work
This section highlights significant contributions over the years pertaining to the application of network approaches towards knowledge discovery from biological information.
2.1. Network Approach for Disease Modeling
Modelling diseases as a network has helped in understanding the dynamic interactions across biological entities. Some of the popular biological networks include protein-protein interaction networks, gene regulatory networks, parasite and pathogen networks to name a few [22]. These networks are oriented as nodes and edges representing multitude biological entities and their interactions [23]. Comparable to other diseases, schizophrenia is modelled as a network in various studies. Some of the significant studies are enlisted in Table 1.
2.2. Prominence of Community Detection in Biological Networks
Community detection is a mechanism for visualization of connections across different modules in a network [19]. Community detection is widely used in biological networks for detection of functional components. In this context, many algorithms have been devised for community detection. Some of the prominent ones are discussed in Table 2.
2.3. Tie Structure Analysis
Tie structure detection is performed to detect macro and micro-level interactions in networks. A tie is a structure that captures relevant information from a network. The definition of these ties varies across each network. Coming to biological networks, a tie represents significant biological details in form of genes, proteins, enzymes, drugs etc. Such ties are oriented as two types namely, strong and weak ties. A strong tie captures associations across two closely held biological entities while weak ties are spread across the entire network to discover prominent connotations. These weak ties are also called bridges as they maintain the global connectivity of the entire network. Both ties are significant in detecting topological and functional features of a network. Hence, capturing information from tie structures reveals deeper insights about the dynamics of the underlying network. Some of the prominent tie detection studies are shown in Table 3.
Based on these studies it is concluded that tie structure identification is substantial for analyzing network orientations. Currently, no study has focused on the direction of tie structure analysis in schizophrenia gene network. Hence, this study focuses on recognizing relevant gene connections across the disease network.
3. Methods
This section highlights the methodology adopted for elucidating relevant gene entities from schizophrenia network.
3.1. Collecting Gene Data
Schizophrenia gene data is gathered from multiple biological repositories including DisGeNET [44], SZDB [45] and SZGR2.0 [46]. Such an integrated dataset includes all the essential genes expressed in pathology of schizophrenia. This dataset is further validated by linking the genes with the schizophrenia pathway information mined from the Kyoto Encyclopedia of Genes and Genomes (KEGG) database [47].
3.2. Identifying Functional Modules and Creating the Gene Network
From thousands of genes collected in the previous step, functional modules are identified based on the biological processes expressed in schizophrenia. Biological processes are identified by Gene Ontology (GO) search [48] and literature analysis [49,50,51,52,53,54]. Centered on these essential processes in schizophrenia, the genes are spanned across different modules. These modules are further employed for constructing the schizophrenia gene network. This network is undirected, as there are no paths between each gene modules.
3.3. Categorizing the Gene Components
Gene modules within the schizophrenia network are classified based on the biological processes they belong to. It is observed that a gene can be part of more than one biological process. Gene modules are pigeonholed based on joint modelling of genes and their biological processes using topic modelling strategies. Topics are pre-defined as labeled attributes using biological processes. Supervised topic modeling is suitable for such tasks as a response variable for each term exists in the data. Out of numerous algorithms available for supervised modelling, supervised Latent Dirichlet Allocation (sLDA) algorithm [55] is appropriate for the dataset, resulting in enriched topic specific gene associations. These associations are derived by estimating the maximum likelihood of gene modules within the network.
3.4. Modularity Based Community Detection
Following module classification, community structure is to be identified from the gene dataset. Out of several standard metrics available for computing the quality and strength of communities, modularity index is chosen. Modularity is known to perform better for biological networks when there are multiple interactions across genetic networks [56,57]. Modularity compares the edge density of the clusters in a given graph G along with the edge clusters in any random graph G’. The larger the differences among these edge densities, better the communities are clustered. Mathematically, the modularity function is represented as Q, defined by:
Here, represents the edges between vertex i and vertex j, kikj/2m denotes the edges among vertex i and vertex j, when they are randomly placed. The elements within modularity function are indicated using the matrix, M. It is defined as M = [mij], here mij is denoted as:
When G is undirected. By substituting the value of mij, the modularity function Q becomes,
Here, s = (s1, …, sn)T is the vector indicating the community membership in quadratic form.
Initially, gene communities are detected using this modularity metric. However, it resulted in poorly identified clusters with no relevant interactions. Hence, this metric is to be optimized for deriving better partitioned gene communities.
3.5. Optimizing Modularity Using Nonlinear Embedding
Of several optimizations available for modularity metric, non-linear embedding is preferred for preserving the inherent patterns, when compared to linear methods [58]. Nonlinear embedding maps the manifold in low dimension to high dimensional embedding by representing the data instances with their nearest neighbors. Such dimensional adaptations in tangent space are known to preserve the data points with minimal reconstruction errors.
Local tangent space alignment (LTSA) algorithm is a type of nonlinear embedding deduced in tangent space by examining the overlapping substructures within the local coordinates [59]. Based on these local embeddings, global coordinates are aligned across the network. Such an embedding is suitable for community detection as it retains the intrinsic network alignment by unraveling the inter communities and interweaving the intra community nodes [60]. Unweighted variant of LTSA function is considered for deriving the communities, as the gene network is undirected in this case.
3.6. Implementing LTSACom for Community Detection
Employing the LTSA function for gene community detection generates an implementation LTSACom. This algorithm attempts to represent the local structure of gene communities in tangent space to explore possible gene interactions [61].
Consider a nonlinear x-dimensional manifold B with an underlying modularity matrix M = [m1, m2…, mn], such that mi € ℝm. The manifold is to be embedded in y-dimensional space such that x < y. Initially, the modularity matrix, M is to be sampled from an m-dimensional orientation to s dimension with local embedding. The fixed data point in M is denoted by a, while the tangent space attached to “a” is denoted by T1A. The algorithm includes three basic steps:
Step 1: Extracting Local Coordinates
The first step is performed to identify local coordinates in modularity function based on their orientation in the manifold. Any function representing a manifold can be expressed using the Taylor series of first order expansion. The expansion of manifold is denoted as:
Here, denotes the s-dimensional data point such that € ℝs. The tangent vector is employed at this point to provide the representation of ‘a’ in tangent space with minimal error. This is followed by computing the local orthogonal basis of modularity matrix. This orthogonality is significant for deriving mutually orthogonal vectors QM, based on the Jacobian function Jf.
The next objective is to identify the local transformation metric L for global space coordinate such that it minimizes the local mapping function. It is defined as:
Step 2: Alignment-Based Feature Extraction
For the gene data instances xi, computing optimal approximation in s-dimensional subspace is achieved by Principal Component Analysis (PCA) at local orientation. PCA reduces dimensions of m orthonormal attributes in M into s dimensional space (such that m < s). It is followed by computing the covariance matrix, C. This matrix C includes the covariance metrics of the matrix M for all the data attributes. Furthermore, performing eigenvalue decomposition for the matrix C results in a list of eigenvectors and their respective eigenvalues. These eigenvectors indicate the components present in the diminished subspace s sorted based on their eigenvalues. Based on this decomposition, r vectors having maximal variance is derived for the k neighbors in low dimension. The metric defined for selecting local coordinates is denoted as:
Here, M includes “n” orthonormal attributes, with defining the average of all the Xi values. Ӫ is given by . Q in the Ӫ function denotes the matrices of r singular vectors corresponding to the largest n singular instances derived from PCA.
Outcomes from PCA are reflected in the alignment matrix constructed from the local coordinates. It is important to derive this alignment matrix by maintaining the reconstruction error to be as minimal as possible. The alignment matrix so constructed includes all the coordinates in low dimension.
Step 3: Global Alignment of Coordinates
Based on the eigenvector computed in the previous step, the matrixes with the smallest n + 1 eigenvectors are selected. This selection includes spanning the coordinates from the second eigenvector matrix till the smallest n + 1 eigenvector. This assortment identifies the global coordinates of matrix M, such that the overall reconstruction error is minimal. The characteristic equation for error analysis is given by:
Here denotes the inverse of .
Grounded on these three principles, LTSACom algorithm is designed for analyzing the schizophrenia gene communities.
3.7. Validation of Gene Communities
It is important to validate the underlying community structure obtained in the previous step to affirm its structural orientation. In this context, a random number of edges are removed from each community to examine the structural variations. The network obtained after removing random edges is subjected to community detection using LTSACom algorithm. The modularity function is recomputed to compare the observations before and after removing the edges. The performance of LTSACom is further evaluated using the mixing parameter (µ) which is an influential metric for evaluation of community structure. It is defined as follows:
Here, the external and total degrees are estimated for every node in the network denoted as and respectively [62]. The external degree for a node is denoted as the sum of links connecting itself to every other vertex in other communities. Several studies have reported that network communities are well depicted when the range is between 0 and 1, while a value of 0.5 depicts well connected structures. Based on the computed values of mixing parameter, performance of the algorithm in detecting gene communities is adjudicated.
3.8. Discovering the Tie Structure from Communities
Corresponding genes across the network communities are identified based on their associations. Furthermore, these connotations divulge the inherent tie structure (i.e., strong and weak ties) within these communities. Strong ties are formed within gene communities, while weak ties are formed across different gene communities. Weak ties act as coexpressive ties in case of biological networks due to multiple interactions between any two vertices. The genes spread across such ties are further examined to validate their biological relevance in the progression of the disorder.
3.9. Multiple Correspondence Analysis
The relationship between gene communities and their embedded genes is discovered using multiple correspondence analysis (MCA). MCA is a multivariate technique which is the generalized extension of principal component analysis (PCA) for detecting the associations among multiple categorical variables [63]. This technique identifies the correlations among gene modules across the network based on their orientation.
4. Results
This section highlights the observations for schizophrenia gene dataset based on community detection and tie analysis. The dataset utilized for this study is shown as Supplementary file.
4.1. Description of the Gene Dataset
Annotated schizophrenia gene dataset is categorized based on the substantial biological processes identified from GO and literature analysis. Six prominent processes are identified for schizophrenia disorder, namely inflammation, immune response, genetic factors, neurotransmitters, metabolism and stress inducers. Based on these categories, the genes are pigeonholed into six different modules. The genes spread across each category are as presented in Table 4.
Orientation of these genes at different phases is reflected in Figure 1.
4.2. Supervised LDA for Topic Modeling
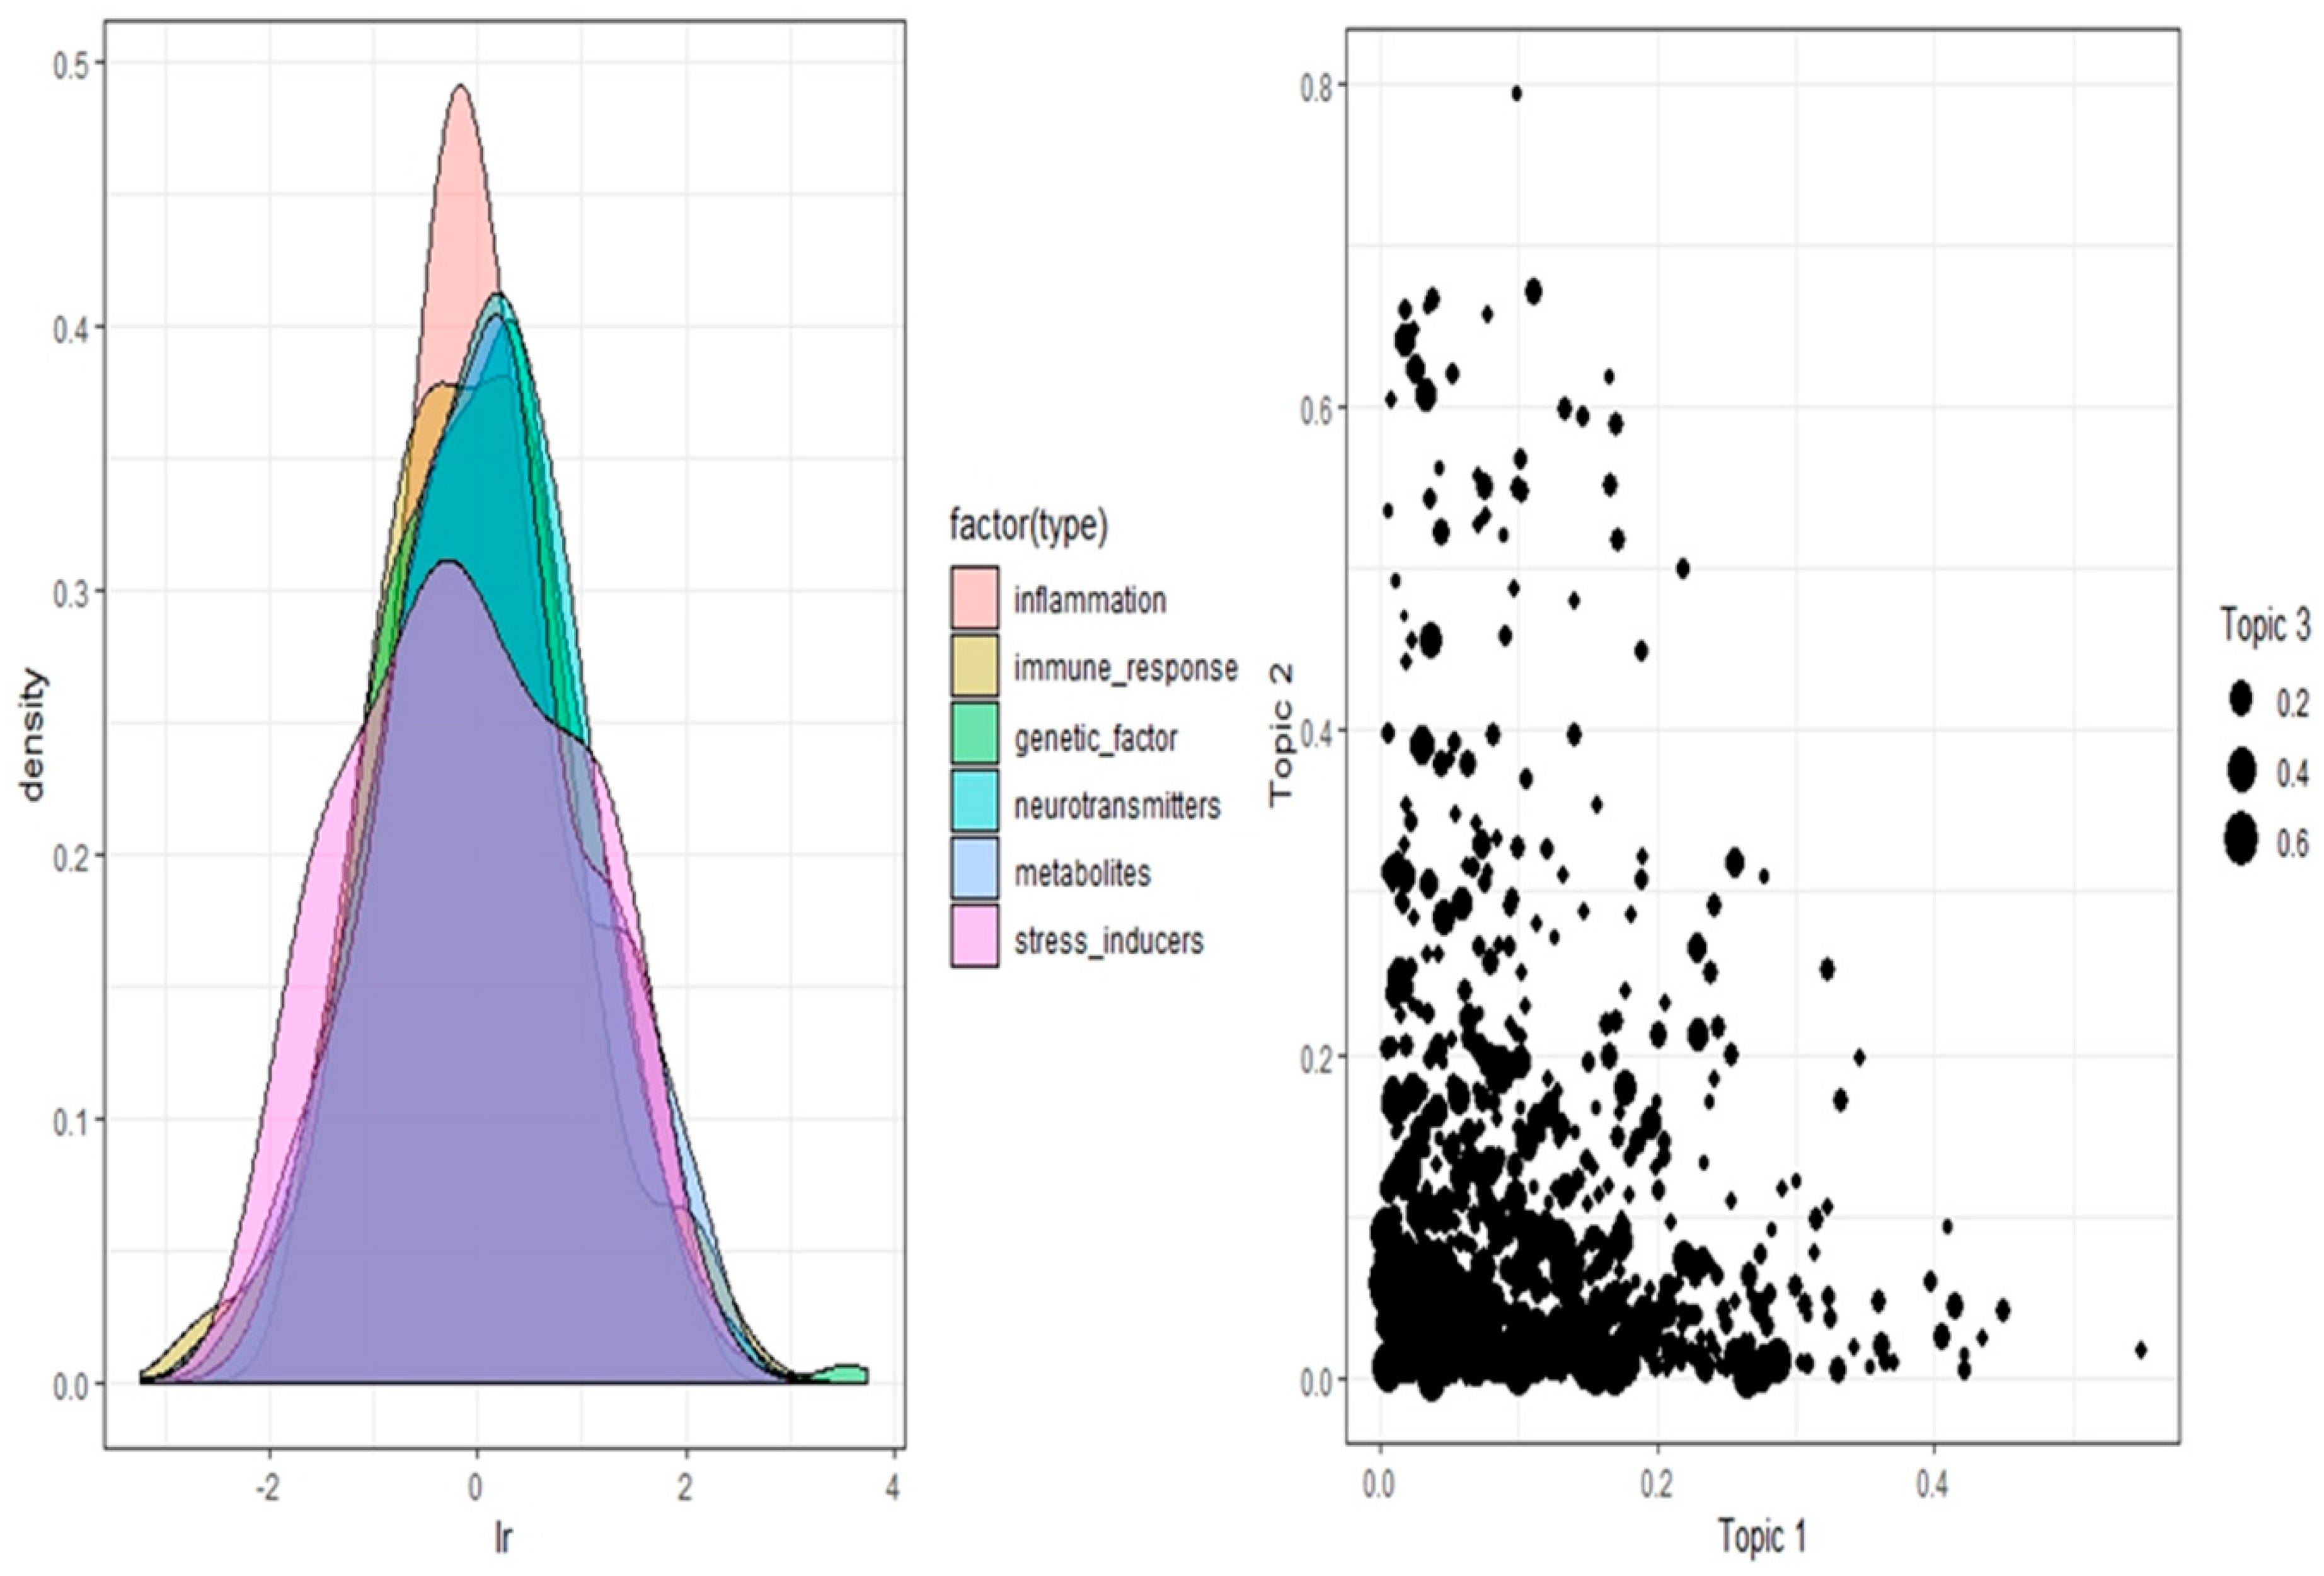
Six modules identified in the previous step are subjected to topic modeling process for accessing the nature of association among genes. Supervised topic modeling is to be implemented owing to the labeled gene dataset. The supervised Latent Dirichlet Allocation (sLDA) algorithm is tested on this dataset using its functionality available in R programming language [64]. Gibbs sampling is performed initially using the sLDA function by taking the gene data as input. The latent parameters alpha, eta and variance are set to 1.0, 0.5 and 0.3 respectively after trial and error analysis for defining their values. The computed model results in topic matrix for each gene category predicting their connotations. This step is iterated ten times, to cross validate the outcome from the model resulting in a tenfold cross validation. This model reveals stronger connections between modules 1, 2 and 3 which are inflammatory, immune and genetic factors respectively. These associations are calculated based on the connectivity score ranged between 0 and 1. The stronger the association, the higher is this score. Relations captured within these modules are used to identify mutual genes across these schizophrenia gene categories. The pictorial representation in Figure 2 highlights gene modules along with associations between three significant gene modules for a smaller data instance.
4.3. Modularity-Based Community Detection
Underlying the association between genes and their categories, communities are to be detected. Initially, traditional modularity metric is applied on these genes to detect communities. The algorithm however, resulted in two communities with a low modularity index of 0.239. To further discover enhanced communities, maximization of the modularity function Q is performed using non-linear embedding of LTSA algorithm. This algorithm, LTSACom comprises of three steps for community detection:
Step 1: The modularity matrix, M is given as input for the algorithm. It is followed by extracting local information from gene modules based on their nearest k neighbors. For each of the six modules, the nearest neighbors are computed.
Step 2: The alignment matrix A is constructed based on the largest eigenvector computed using PCA in low dimensional subspace. The local coordinates obtained from these vector matrices are further summated.
Step 3: Computing all the minimum (d + 1) eigenvectors for the modularity metric is done by observing the inherent tie structure in the network. These eigenvector matrices conforming to the 2nd value up to the smallest (d + 1) eigenvalues are selected to detect the global coordinates of M.
The algorithm of LTSACom is represented as Algorithm 1.
| Algorithm 1 LTSACom for community detection | |
| Input | Input the modularity matrix M derived from schizophrenia gene dataset for detection of gene communities |
| Step 1 | Compute the nearest neighbors using the local information among genes in tangent space |
| Step 2 | Construct the unweighted alignment matrix A based on the embedded vectors in the matrix M |
| Step 3 | Global optimization of A based on local tangents using eigenvector decomposition |
| Output | Compute the modularity index for the dataset to identify gene communities |
Performing these steps in nonlinear embedding generates network structure for the schizophrenia gene dataset, resulting in six diverse communities. The modularity index for these communities is found to be 0.9256, which is considerably superior compared to the initial value of 0.239.
4.4. Validating the Community Structure
The gene communities detected by LTSACom need to be authenticated to ensure that the modules are not formed by a random chance. For this purpose, mixing parameter is computed by altering the link structure in the network. It is observed that as the value of µ elevates, the modularity function decreases gradually. When µ is found to be 0.56, the algorithm detects relevant gene communities with six diverse clusters representing the six classes of genes. This value reflects the stronger interconnections across the gene communities.
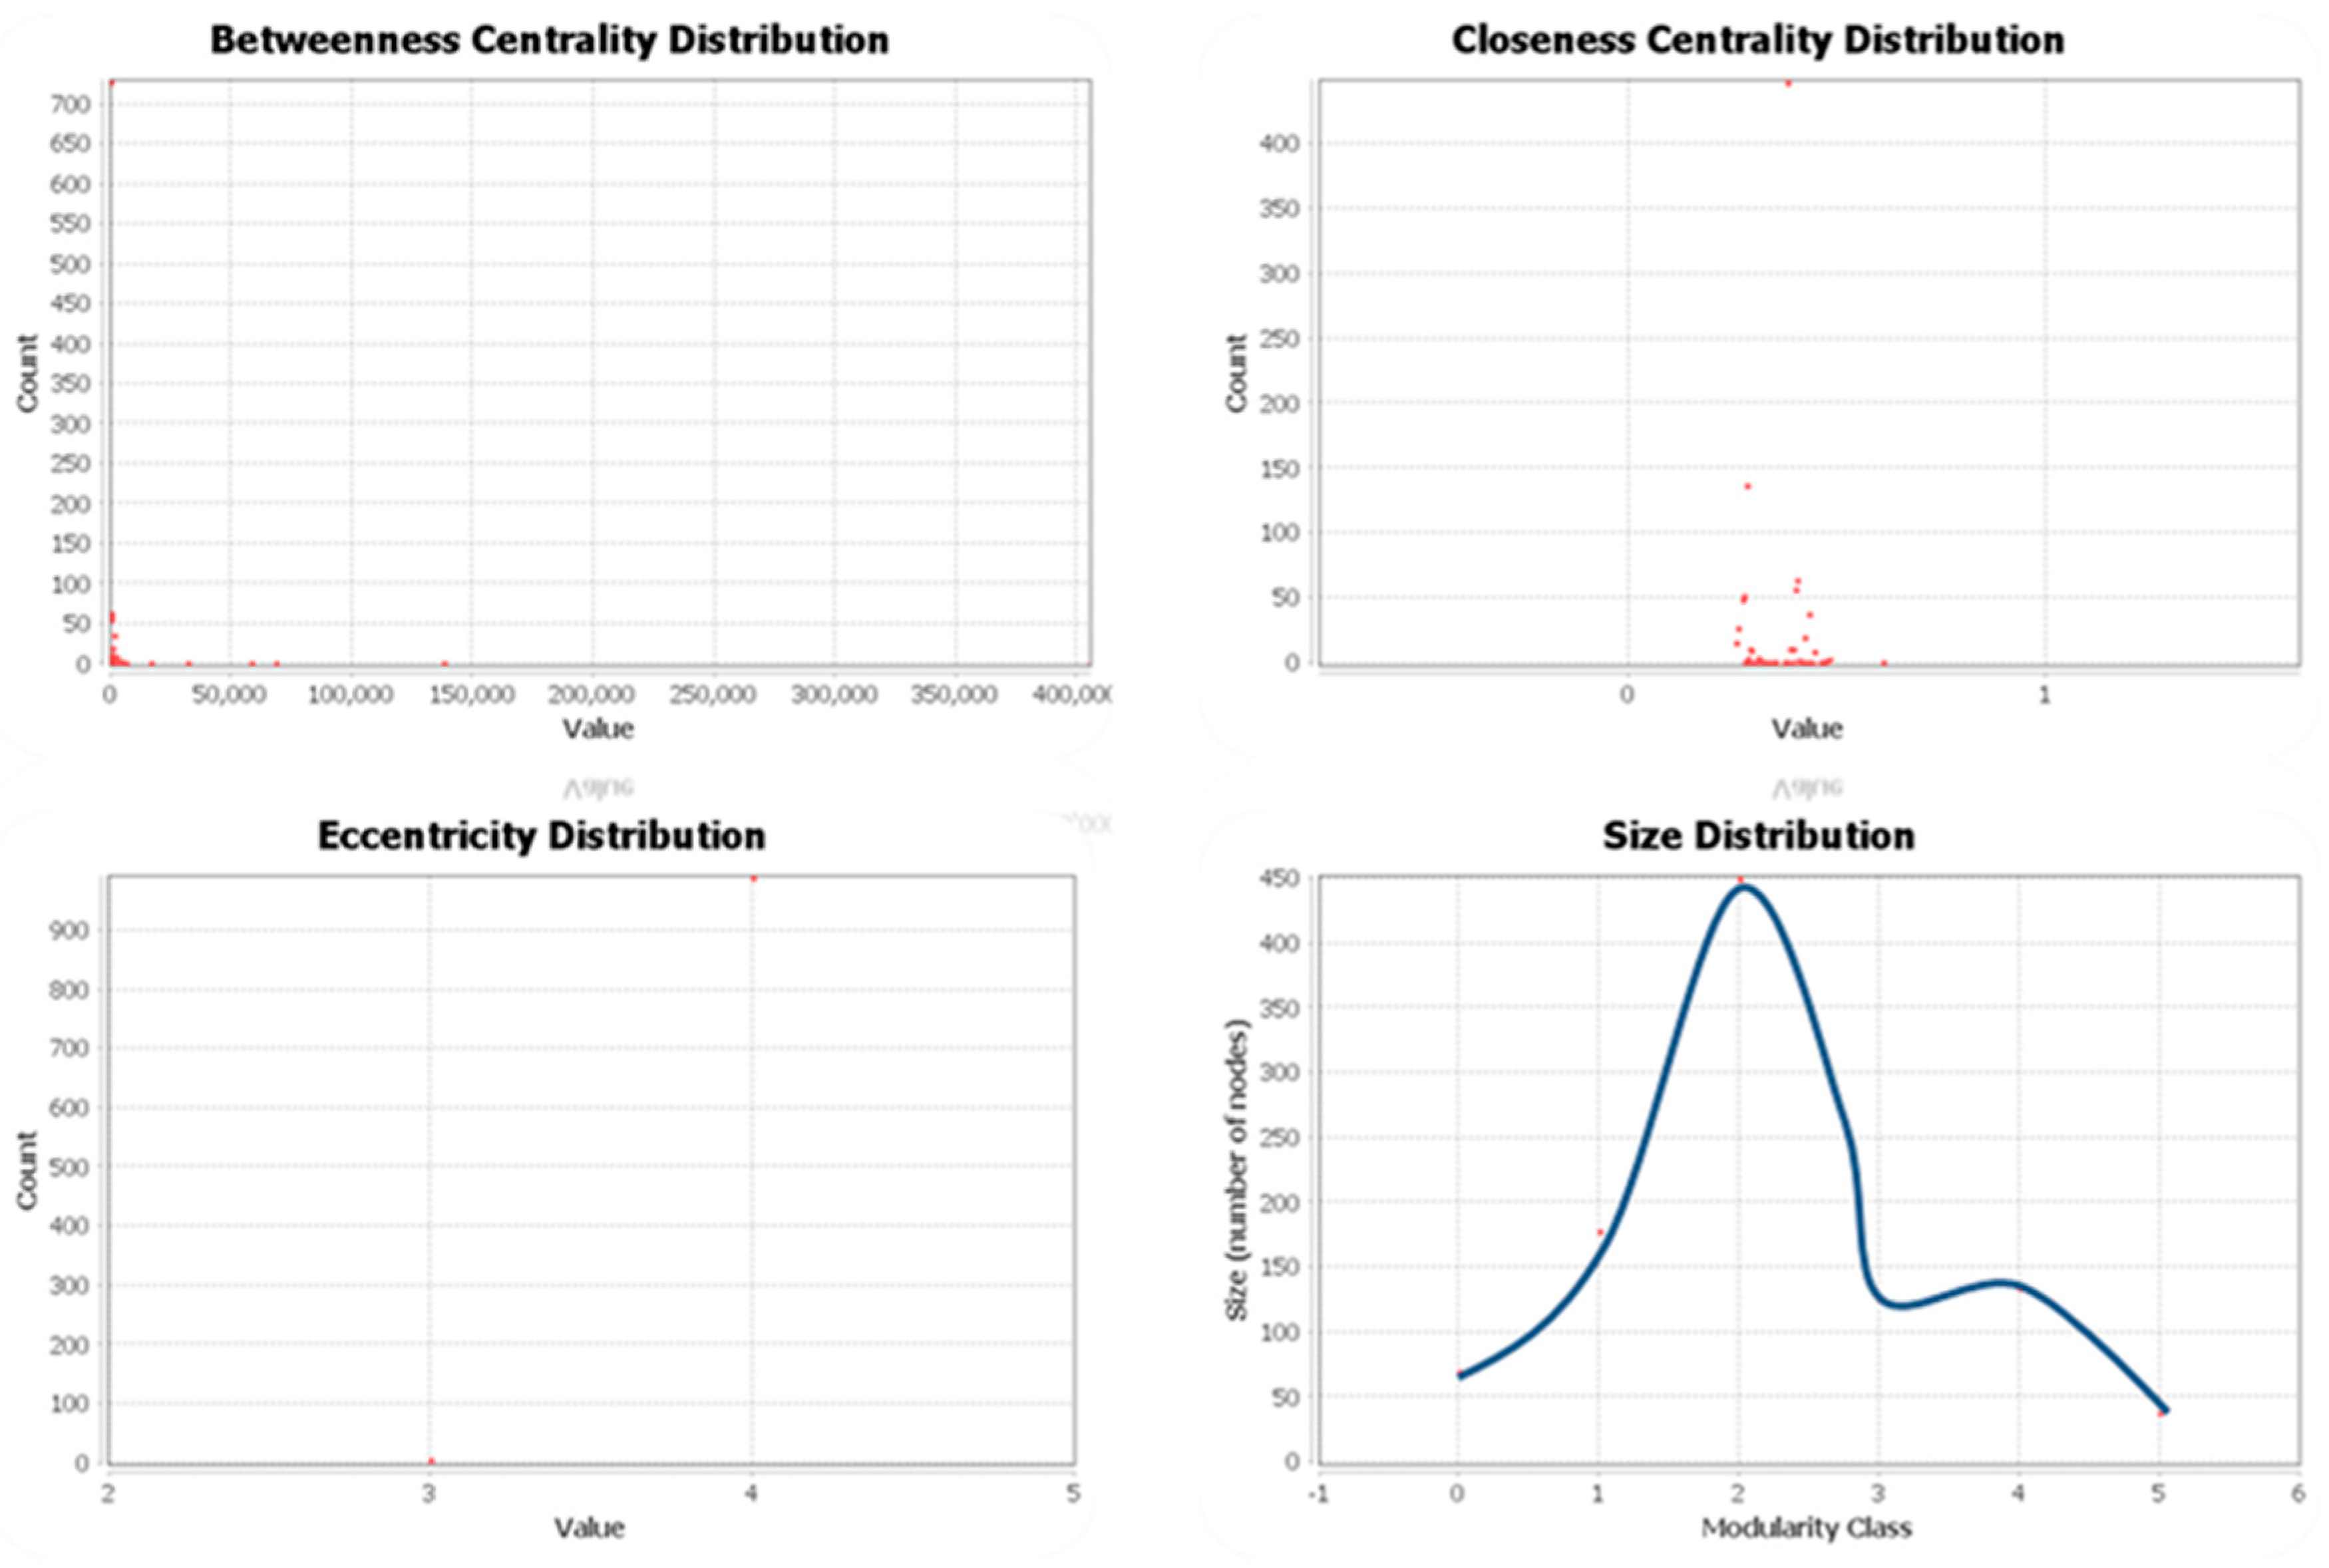
For each of these communities, some of the centrality metrics are also computed and represented pictorially as distributions in Figure 3. As observed in the figure, betweenness centrality and closeness centrality highlight the importance of certain nodes within a network. These nodes act as influential connections across the network based on the centrality index. Furthermore, distribution plots for eccentricity and modularity are calculated using eccentricity distribution and size distribution plots respectively. Eccentricity distribution is used to identify the distances across any two genes of interest in a network. Furthermore, distribution of communities based on their modularity index is displayed in the size distribution plot. All these distributions are derived from the network visualization software, Gephi 0.9.2 [65].
4.5. Performance Analysis of LTSACom
The performance of LTSACom algorithm is further examined based on comparative analysis with other state of art modularity maximization algorithms. Some of the algorithms used for this purpose include spectral algorithm (SP) [66], Fast-Newman (FN) algorithm [67], Finding and Extracting a Community (FEC) algorithm [68], Fast Unfolding Algorithm (FUA) [69], Multi-layer Ant Based Algorithm (MABA) [70] and InfoMap algorithm [71].
These algorithms are tested on schizophrenia gene dataset for 200 iterations and the modularity index is calculated at each trial. Computations revealed that LTSACom algorithm maintains a better modularity index with increasing trials as compared to other algorithms. Observations from this computation are seen in Table 5, clearly indicating better performance of LTSACom in detecting gene communities for schizophrenia data.
4.6. Identifying Tie Structure from Gene Communities
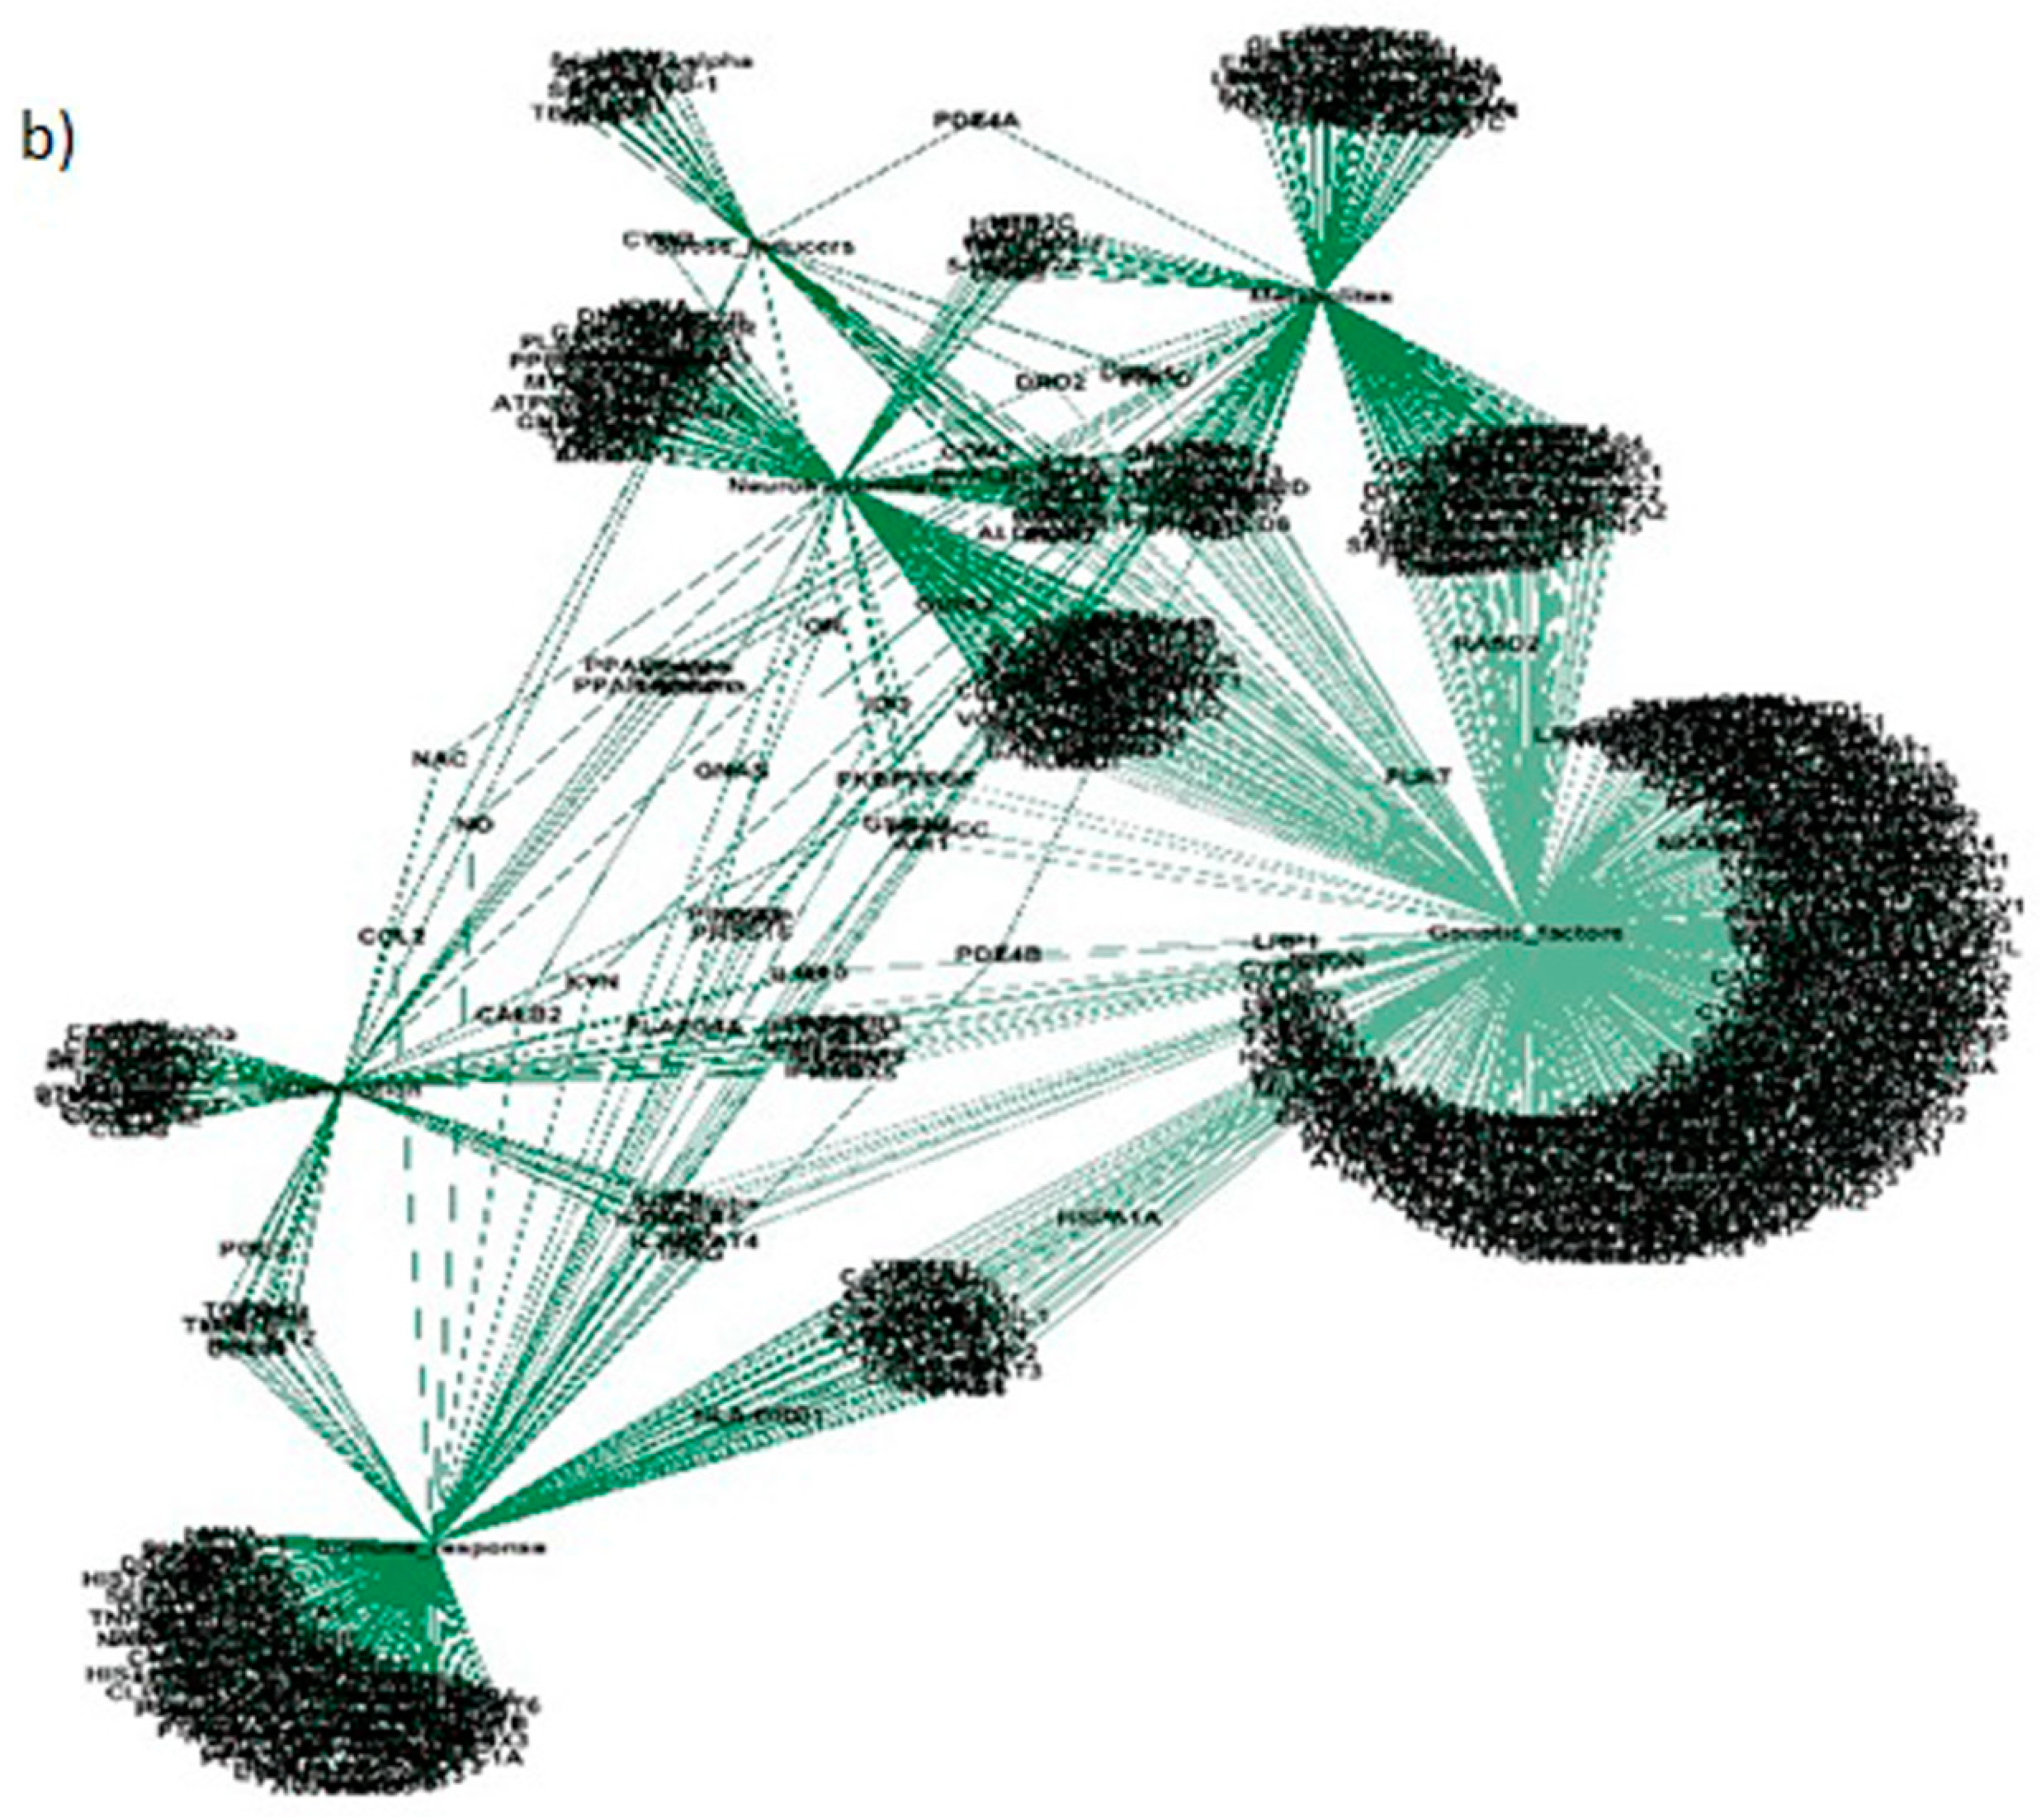
Interconnected tie structure is scrutinized from the network communities to ascertain persuasive genes in schizophrenia. For the six gene communities, several ties are detected which co-occur across different modules. These spanned ties across the communities tend to have fragile connections within the network, forming weak ties. Furthermore, the relevance of these ties in schizophrenia is evaluated using literature analysis. Based on this analysis, substantial gene ties are identified and highlighted in Table 6. The tie structure spanning the entire network for different communities is shown in Figure 6 at different stages. This figure highlights the influence of intrinsic genes and ties based on the network size. Initially, the network comprises of genes and their categories oriented among each other. These genes represent the core connections which persist to exist in the network irrespective of its size. By increasing the network size, further genes get added to the network, highlighting the communities and tie structure.
4.7. Multiple Correspondence Analysis
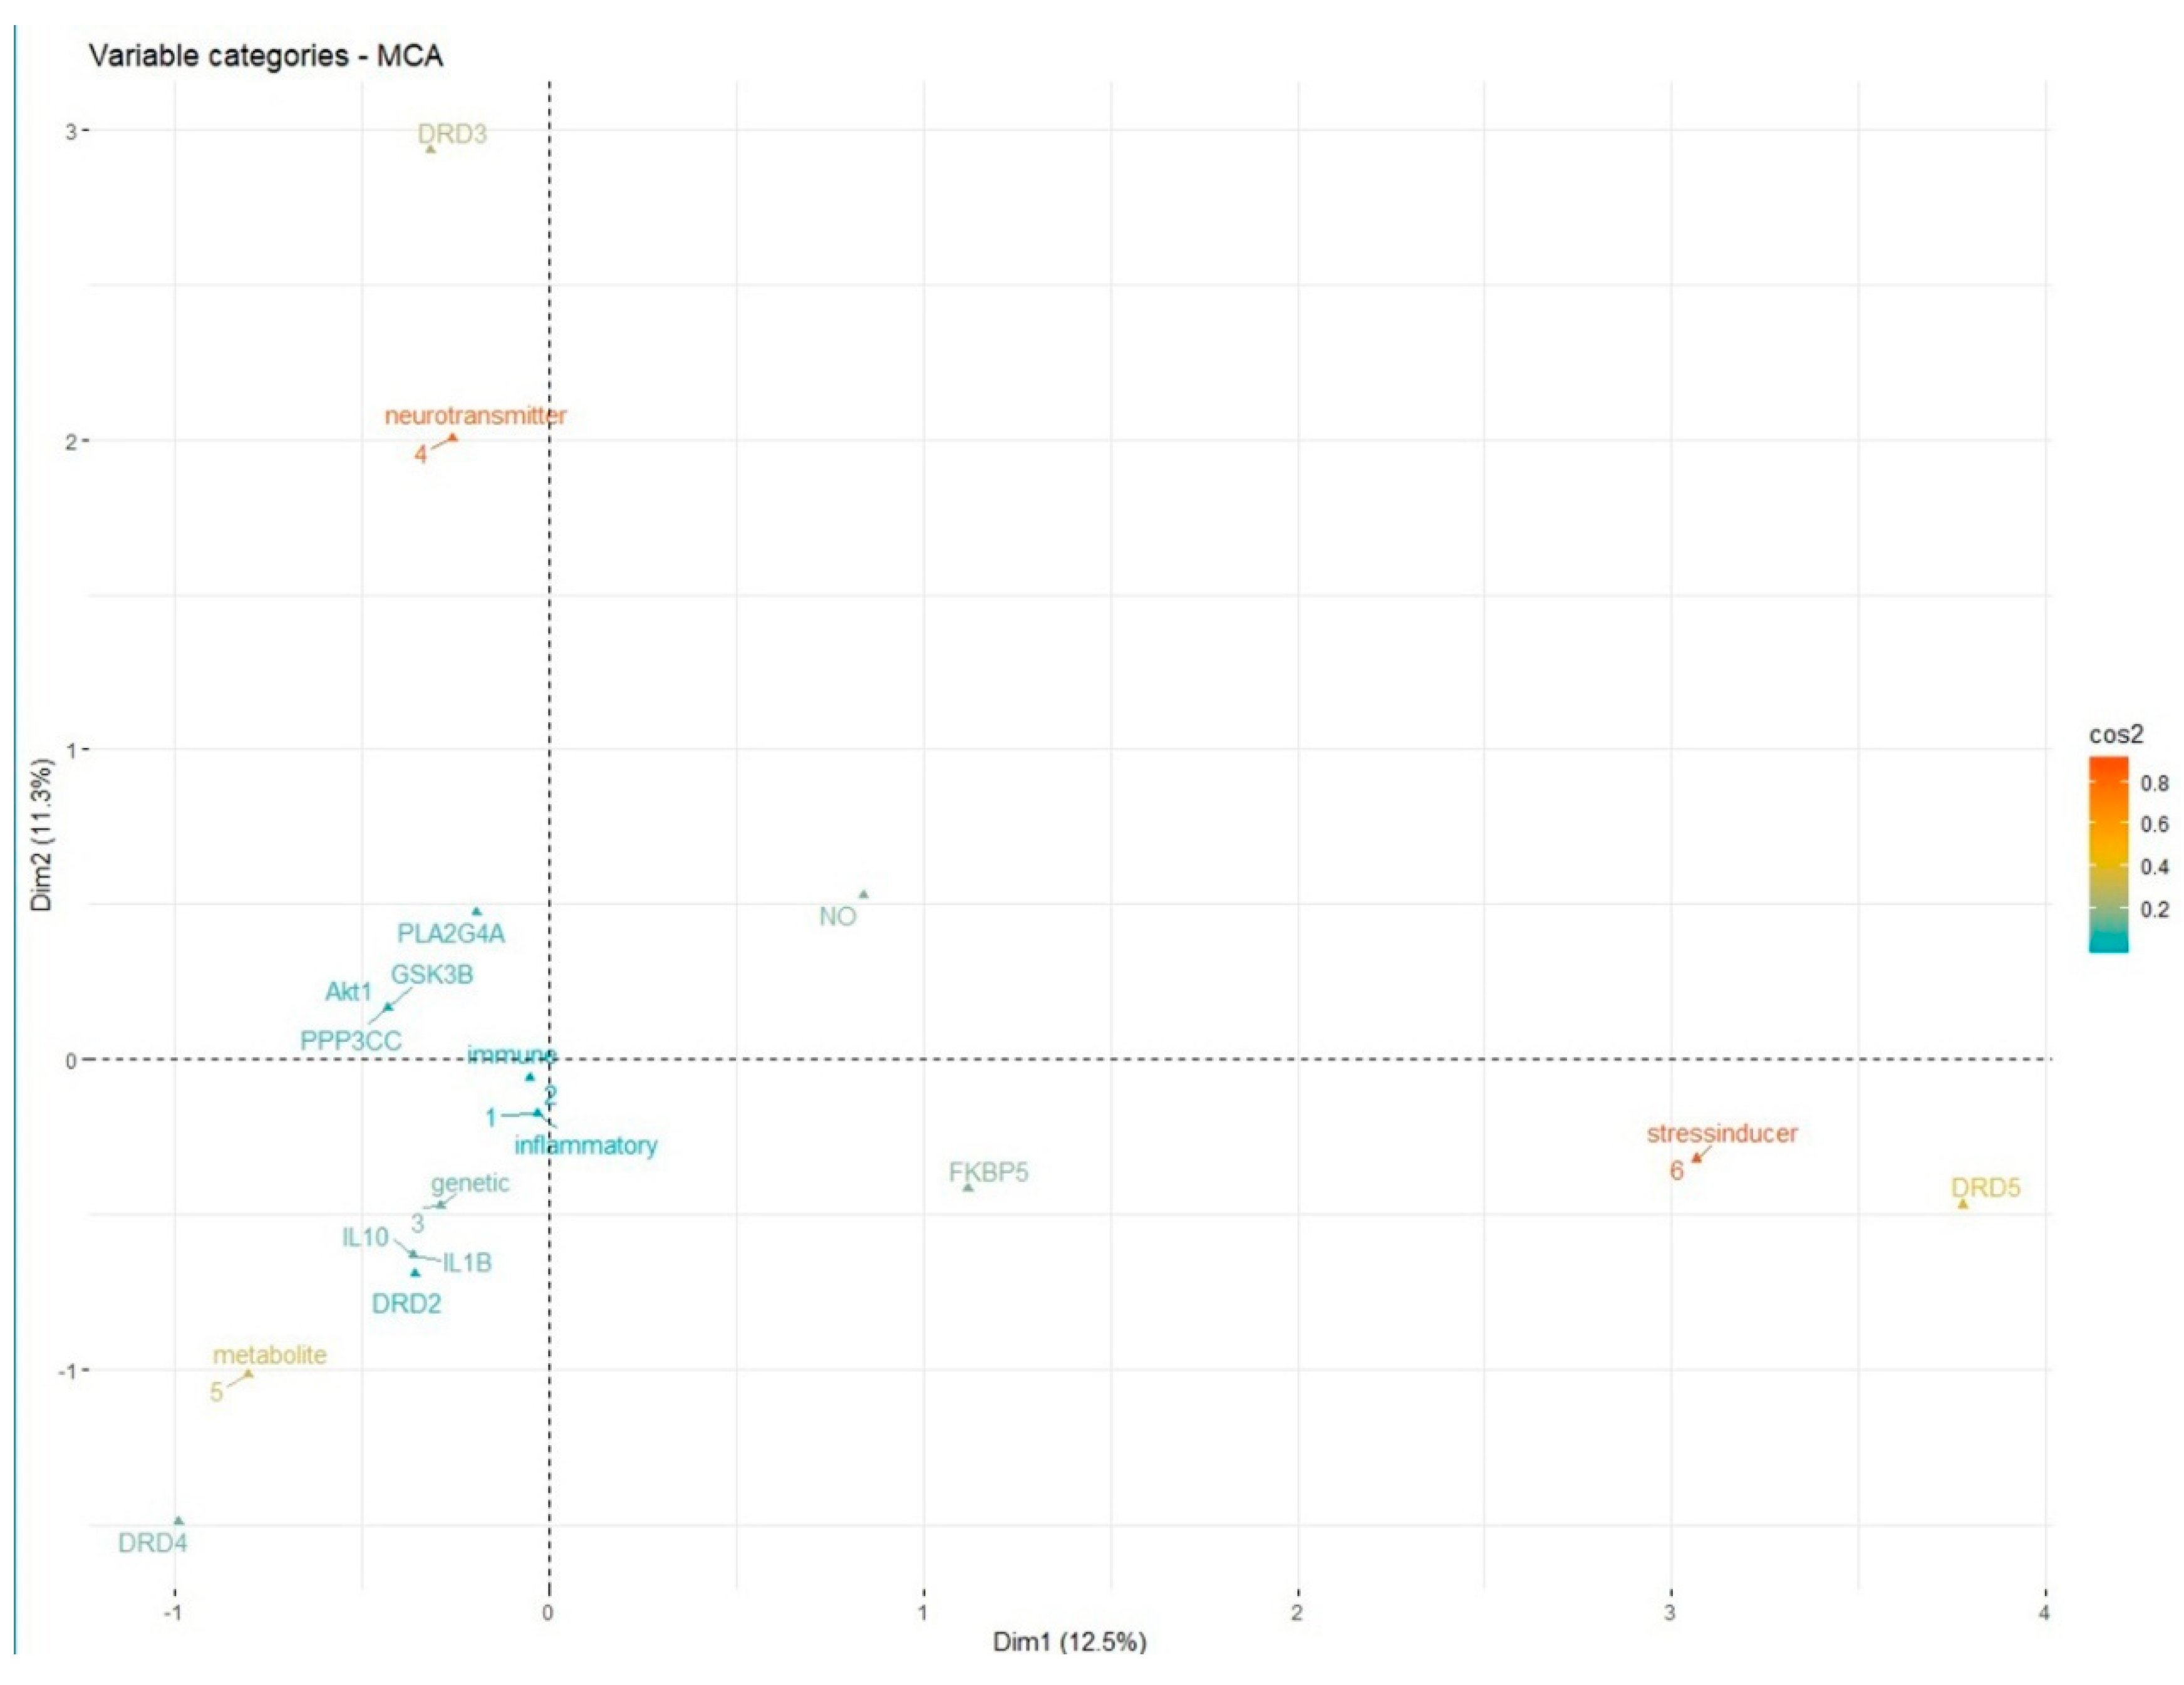
Relationship spanning across categorical network modules and their gene instances is detected using the MCA technique. This analysis exposes the concealed comprehensions within the schizophrenia network. The FactoMineR package available in R programming language is utilized for performing MCA [72]. Primarily, variations occurring across data instances are calculated using the eigenvalues. Based on these variations, individual modules are identified and visualized along with their gene associations. The quality of the associations is detected using cos2 metric. The metric is calculated for the genes to adjudicate their connotations. Higher the value of cos2 better is the associations across the entities. The genes corresponding to different gene modules are shown in Figure 7 as an MCA plot. This figure highlights the interactions based on the cos2 index.
5. Conclusions
This study explores the importance of tie structure in gene networks, inspired from the findings of Granovetter [21]. The study initially frames a few exploratory questions pertaining to the gene interactions in schizophrenia. Some of the relevant findings obtained from the study are discussed in this section. The first question is concerning the influence of community structure in schizophrenia gene network. Based on the analysis, it is observed that inherent modular structure in gene networks can be discovered proficiently by discovering communities. These modular structures are further considered for ascertaining hidden associations in the network. Hence, communities are found to be precise entities for quantifying biological properties from the gene network. The second question is based on the outcome of the first question. Since communities are considered to be crucial in networks, the next question ascertains the impact of tie structure within these communities. From observations, it is found that ties highlight the inherent associations among different genes. These associations further reveal the strength of network connectivity. The patterns of these ties within gene communities could also highlight the influence of a gene across the entire network. Hence, the study claims that integral ties are substantially imperative to ascertain the functioning of a gene network. The third question is framed to discover the relevance of strong and weak ties in the gene network. Investigating the gene network revealed that the entire network is composed of coexpressed ties scattered across different biological modules. These coexpressed ties are spanned across two or more communities representing weaker connections. However, these frail interactions maintain global connectivity of the gene network as compared to strong ties. Henceforth the study affirms that weak ties influence the functioning of schizophrenia gene network both locally and globally.
In brief, the study finds two crucial outcomes: (i) A novel implementation of modularity maximization algorithm, LTSACom based on LTSA function for detecting gene communities; and (ii) Detecting the influence of weak ties in schizophrenia network. The modularity-based algorithm so designed helps in revealing diverse gene communities across the network with an increased modularity value of 0.9256. Furthermore, these communities disclose coexpressive interactive ties across the network throwing light on the relevance of embedded ties. These ties influence the global connectivity of network with feeble interactions across prominent genes in the network. Identifying such genes helps in ascertaining the “dominant hotspots” that influence the progression of a disease. Additionally, the study also performs some fundamental analyses including topic modeling, centrality distributions, community validation and MCA testing for identifying the dynamics of the inherent gene network.
This study is novel in some directions. The research is innovative in discovering the impact of weak ties in schizophrenia gene networks. Previous studies have focused on network-based approaches for recognizing gene expressions from schizophrenia network [73,74]. However, these studies have not acknowledged the relevance of tie structures within schizophrenia gene networks. Furthermore, computational gene modeling employed in this study can be a promising technique for ascertaining the micro and macro level interactions across the network. These patterns of interactions can be scrutinized to uncover the expression of a particular gene of interest. Such pattern-based gene expressions can promote drug designing towards a susceptible gene target rather than a much more complex protein. However, this study is an initial attempt in this direction, as surplus investigation is required to reconstruct the schizophrenia gene network on large scale for measuring gene expressions for targeted therapy. The dataset adopted in this study focuses on genes alone while proteins and drugs are other significant entities to be considered for modelling the disease. Identifying interactions across protein networks and drug molecules will discover hidden functional implications of the disorder. Henceforth, such a dataset needs be constructed to aid in modelling the disorder at modular level. Furthermore, gene communities are discovered by optimizing the modularity metric which is often subjected to resolution limits resulting in local and global deviations, that needs to be nullified [75]. In this context it is necessary to evaluate the performance of optimized modularity on local and global scale prior to tie structure analysis. Despite these limitations, the current study identifies significant associations among multiple mechanisms that contribute for progression of the illness. These outcomes have significant implications in designing targeted therapies against schizophrenia. Such targeted therapeutics can be adopted in conjunction with other medications to combat the disorder at genomic level. Furthermore, contributions from current research help in detecting complex interactions among genetic, inflammatory, immune and environmental factors based on modularity metric derived from LTSACom algorithm. Unraveling such complex associations with the help of tie interactions helps in designing personalized medications on individual basis compared to universal treatment procedures for schizophrenia. Henceforth, the current approach looks promising for detecting functional entities within the gene network. Furthermore, this technique could be expanded in future to expose common functional modules across group of psychiatric disorders including schizophrenia, bipolar disorder, paraphrenia and other psychotic symptoms.
Supplementary Materials
The following are available online at https://www.mdpi.com/2306-5729/4/4/149/s1, Table S1: The curated schizophrenia gene dataset.
Author Contributions
The work is conceptualized by A.S., S.G.S. and A.H.M.R.; Data curation is performed by A.S., and K.N.; Methodology is implemented by A.S.; and K.N.; Original draft preparation by A.S.; and B.B.; Review and editing by A.S., K.N. and B.B.; Supervision and administration by S.G.S. and A.H.M.R.
Funding
This research is funded under DST-PhD scholarship scheme initiated by KSTePS, Government of Karnataka and supported by Visveshvaraya Technological University, Belgaum.
Conflicts of Interest
The authors declare no conflict of interest.
References
- Gilmore, J.H. Understanding what causes schizophrenia: A developmental perspective. Am. J. Psychiatry 2010, 167, 8–10. [Google Scholar] [CrossRef] [PubMed]
- Ebisch, S.J.; Mantini, D.; Northoff, G.; Salone, A.; De Berardis, D.; Ferri, F.; Gallese, V. Altered brain long-range functional interactions underlying the link between aberrant self-experience and self-other relationship in first-episode schizophrenia. Schizophr. Bull. 2014, 40, 1072–1082. [Google Scholar] [CrossRef] [PubMed]
- Stanley, J.A.; Pettegrew, J.W.; Keshavan, M.S. Magnetic resonance spectroscopy in schizophrenia: Methodological issues and findings—Part I. Biol. Psychiatry 2000, 48, 357–368. [Google Scholar] [CrossRef]
- Monk, C.S.; Peltier, S.J.; Wiggins, J.L.; Weng, S.J.; Carrasco, M.; Risi, S.; Lord, C. Abnormalities of intrinsic functional connectivity in autism spectrum disorders. Neuroimage 2009, 47, 764–772. [Google Scholar] [CrossRef] [PubMed]
- Braff, D.L.; Freedman, R.; Schork, N.J.; Gottesman, I.I. Deconstructing schizophrenia: An overview of the use of endophenotypes in order to understand a complex disorder. Schizophr. Bull. 2007, 33, 21–32. [Google Scholar] [CrossRef]
- Iasevoli, F.; Giordano, S.; Balletta, R.; Latte, G.; Formato, M.V.; Prinzivalli, E.; de Bartolomeis, A. Treatment resistant schizophrenia is associated with the worst community functioning among severely-ill highly-disabling psychiatric conditions and is the most relevant predictor of poorer achievements in functional milestones. Prog. Neuro Psychopharmacol. Biol. Psychiatry 2016, 65, 34–48. [Google Scholar] [CrossRef]
- Orsolini, L.; Tomasetti, C.; Valchera, A.; Vecchiotti, R.; Matarazzo, I.; Vellante, F.; Martinotti, G. An update of safety of clinically used atypical antipsychotics. Expert Opin. Drug Saf. 2016, 15, 1329–1347. [Google Scholar] [CrossRef]
- De Berardis, D.; Rapini, G.; Olivieri, L.; Di Nicola, D.; Tomasetti, C.; Valchera, A.; Serafini, G. Safety of antipsychotics for the treatment of schizophrenia: A focus on the adverse effects of clozapine. Ther. Adv. Drug Saf. 2018, 9, 237–256. [Google Scholar] [CrossRef]
- Rolls, E.T.; Loh, M.; Deco, G.; Winterer, G. Computational models of schizophrenia and dopamine modulation in the prefrontal cortex. Nat. Rev. Neurosci. 2008, 9, 696–709. [Google Scholar] [CrossRef]
- Blom, J.D.; van Praag, H.M. Schizophrenia: It’s broken and it can’t be fixed. A conceptual analysis at the centenary of Bleuler’s Dementia praecox oder Gruppe der Schizophrenien. Isr. J. Psychiatry Relat. Sci. 2011, 48, 240–248. [Google Scholar]
- Maatz, A.; Hoff, P. The birth of schizophrenia or a very modern Bleuler: A close reading of Eugen Bleuler’s “Die Prognose der Dementia praecox” and a re-consideration of his contribution to psychiatry. Hist. Psychiatry 2014, 25, 431–440. [Google Scholar] [CrossRef] [PubMed]
- Rish, I.; Cecchi, G.; Thyreau, B.; Thirion, B.; Plaze, M.; Paillere-Martinot, M.L.; Martelli, C.; Martinot, J.L.; Poline, J.B. Schizophrenia as a Network Disease: Disruption of Emergent Brain Function in Patients with Auditory Hallucinations. PLoS ONE 2013, 8, e50625. [Google Scholar] [CrossRef] [PubMed]
- Anticevic, A.; Murray, J.D.; Barch, D.M. Bridging Levels of Understanding in Schizophrenia through Computational Modeling. Clin. Psychol. Sci. 2015, 3, 433–459. [Google Scholar] [CrossRef] [PubMed]
- Looijestijn, J.; Blom, J.D.; Aleman, A.; Hoek, H.W.; Goekoop, R. An integrated network model of psychotic symptoms. Neurosci. Biobehav. Rev. 2015, 59, 238–250. [Google Scholar] [CrossRef] [PubMed]
- Galderisi, S.; Rucci, P.; Kirkpatrick, B.; Mucci, A.; Gibertoni, D.; Rocca, P.; Bellomo, A. Interplay Among Psychopathologic Variables, Personal Resources, Context-Related Factors, and Real-Life Functioning in Individuals with Schizophrenia: A Network Analysis. JAMA Psychiatry 2018, 75, 396–404. [Google Scholar] [CrossRef]
- Ruan, J.; Zhang, W. Identification and Evaluation of Functional Modules in Gene Co-expression Networks. In RCP 2006: Systems Biology and Computational Proteomics; Springer: Berlin/Heidelberg, Germany, 2006; pp. 57–76. [Google Scholar]
- Wang, J.; Li, M.; Chen, J.; Pan, Y.A. Fast Hierarchical Clustering Algorithm for Functional Modules Discovery in Protein Interaction Networks. IEEE/ACM Trans. Comput. Biol. Bioinform. 2011, 8, 607–620. [Google Scholar] [CrossRef]
- Spirin, V.; Mirny, L.A. Protein complexes and functional modules in molecular networks. Proc. Natl. Acad. Sci. USA 2003, 100, 12123–12128. [Google Scholar] [CrossRef]
- Girvan, M.; Newman, M.E.J. Community structure in social and biological networks. Proc. Natl. Acad. Sci. USA 2002, 99, 7821–7826. [Google Scholar] [CrossRef]
- Easley, D.; Kleinberg, J. Strong and Weak Ties. In Networks, Crowds, and Markets: Reasoning about a Highly Connected World; Cambridge University Press: Cambridge, UK, 2010; pp. 47–84. [Google Scholar]
- Granovetter, M.S. The Strength of Weak Ties. Am. J. Sociol. 1973, 78, 1360–1380. [Google Scholar] [CrossRef]
- Chung, F.; Lu, L.; Dewey, T.G.; Galas, D.J. Duplication Models for Biological Networks. J. Comput. Biol. 2003, 10, 677–687. [Google Scholar] [CrossRef]
- Almaas, E. Biological impacts and context of network theory. J. Exp. Biol. 2007, 210, 1548–1558. [Google Scholar] [CrossRef] [PubMed]
- Rish, I.; Thyreau, B.; Thirion, B.; Plaze, M.; Paillere-martinot, M.L.; Martelli, C.; Cecchi, G.A. Discriminative Network Models of Schizophrenia. Adv. Neural Inf. Process. Syst. 2009, 22, 252–260. [Google Scholar]
- Lynall, M.E.; Bassett, D.S.; Kerwin, R.; McKenna, P.J.; Kitzbichler, M.; Muller, U.; Bullmore, E. Functional Connectivity and Brain Networks in Schizophrenia. J. Neurosci. 2010, 30, 9477–9487. [Google Scholar] [CrossRef] [PubMed]
- Rapoport, J.L.; Giedd, J.N.; Gogtay, N. Neurodevelopmental model of schizophrenia: Update 2012. Mol. Psychiatry 2012, 17, 1228–1238. [Google Scholar] [CrossRef]
- Nekovarova, T.; Fajnerova, I.; Horacek, J.; Spaniel, F. Bridging disparate symptoms of schizophrenia: A triple network dysfunction theory. Front. Behav. Neurosci. 2014, 8, 171. [Google Scholar] [CrossRef]
- Steeds, H.; Carhart-Harris, R.L.; Stone, J.M. Drug models of schizophrenia. Ther. Adv. Psychopharmacol. 2015, 5, 43–58. [Google Scholar] [CrossRef]
- Gheiratmand, M.; Rish, I.; Cecchi, G.A.; Brown, M.R.; Greiner, R.; Polosecki, P.I.; Dursun, S.M. Learning stable and predictive network-based patterns of schizophrenia and its clinical symptoms. NPJ Schizophr. 2017, 3, 22. [Google Scholar] [CrossRef]
- Wolfers, T.; Doan, N.T.; Kaufmann, T.; Alnæs, D.; Moberget, T.; Agartz, I.; Andreassen, O.A. Mapping the Heterogeneous Phenotype of Schizophrenia and Bipolar Disorder Using Normative Models. JAMA Psychiatry 2018, 75, 1146–1155. [Google Scholar] [CrossRef]
- Trossbach, S.V.; Hecher, L.; Schafflick, D.; Deenen, R.; Popa, O.; Lautwein, T.; Malchow, B. Dysregulation of a specific immune-related network of genes biologically defines a subset of schizophrenia. Transl. Psychiatry 2019, 9, 156. [Google Scholar] [CrossRef]
- Palla, G.; Derényi, I.; Farkas, I.; Vicsek, T. Uncovering the overlapping community structure of complex networks in nature and society. Nature 2005, 435, 814–818. [Google Scholar] [CrossRef]
- Clauset, A.; Moore, C.; Newman, M.E. Hierarchical structure and the prediction of missing links in networks. Nature 2008, 453, 98–101. [Google Scholar] [CrossRef] [PubMed]
- Su, G.; Kuchinsky, A.; Morris, J.H.; States, D.J.; Meng, F. GLay: Community structure analysis of biological networks. Bioinformatics 2010, 26, 3135–3137. [Google Scholar] [CrossRef] [PubMed]
- Jia, G.; Cai, Z.; Musolesi, M.; Wang, Y.; Tennant, D.A.; Weber, R.J.; He, S. Community Detection in Social and Biological Networks Using Differential Evolution. Lect. Notes Comput. Sci. 2012, 7219, 71–85. [Google Scholar]
- Sah, P.; Singh, L.O.; Clauset, A.; Bansal, S. Exploring community structure in biological networks with random graphs. BMC Bioinform. 2014, 15, 220. [Google Scholar] [CrossRef] [Green Version]
- Tripathi, S.; Moutari, S.; Dehmer, M.; Emmert-Streib, F. Comparison of module detection algorithms in protein networks and investigation of the biological meaning of predicted modules. BMC Bioinform. 2016, 17, 129. [Google Scholar] [CrossRef] [Green Version]
- Didier, G.; Brun, C.; Baudot, A. Identifying communities from multiplex biological networks by randomized optimization of modularity. F1000Research 2018, 7, 1–34. [Google Scholar] [CrossRef]
- Tripathi, B.; Parthasarathy, S.; Sinha, H.; Raman, K.; Ravindran, B. Adapting Community Detection Algorithms for Disease Module Identification in Heterogeneous Biological Networks. Bioinform. Comput. Biol. 2019, 10, 164. [Google Scholar] [CrossRef]
- Onnela, J.P.; Saramäki, J.; Hyvönen, Y.; Szabó, G.; Lazer, D.; Kaski, K.; Kertész, J.; Barabási, A.L. Structure and tie strengths in mobile communication networks. Proc. Natl. Acad. Sci. USA 2007, 104, 7332–7336. [Google Scholar] [CrossRef] [Green Version]
- Wang, X.; Hoi, S.C.; Ester, M.; Bu, J.; Chen, C. Learning Personalized Preference of Strong and Weak Ties for Social Recommendation. In Proceedings of the 26th International Conference on World Wide Web, Perth, Australia, 3–7 April 2017; pp. 1601–1610. [Google Scholar]
- Hu, H.H.; Wang, L.; Jiang, L.; Yang, W. Strong ties versus weak ties in word-of-mouth marketing. BRQ Bus. Res. Q. 2018, 22, 245–256. [Google Scholar] [CrossRef]
- Fujita, Y.; Kichikawa, Y.; Fujiwara, Y.; Souma, W.; Iyetomi, H. Local bow-tie structure of the web. Appl. Netw. Sci. 2019, 4, 1–15. [Google Scholar] [CrossRef] [Green Version]
- Piñero, J.; Bravo, À.; Queralt-Rosinach, N.; Gutiérrez-Sacristán, A.; Deu-Pons, J.; Centeno, E.; García-García, J.; Sanz, F.; Furlong, L.I. DisGeNET: A comprehensive platform integrating information on human disease-associated genes and variants. Nucleic Acids Res. 2017, 45, D833–D839. [Google Scholar] [CrossRef] [PubMed]
- Wu, Y.; Yao, Y.G.; Luo, X.J. SZDB: A Database for Schizophrenia Genetic Research. Schizophr. Bull. 2017, 43, 459–471. [Google Scholar] [CrossRef] [PubMed] [Green Version]
- Jia, P.; Han, G.; Zhao, J.; Lu, P.; Zhao, Z. SZGR 2.0: A one-stop shop of schizophrenia candidate genes. Nucleic Acids Res. 2017, 45, D915–D924. [Google Scholar] [CrossRef] [PubMed] [Green Version]
- Kanehisa, M.; Goto, S. KEGG: Kyoto Encyclopedia of Genes and Genomes. Nucleic Acids Res. 2000, 28, 27–30. [Google Scholar] [CrossRef] [PubMed]
- Ashburner, M.; Ball, C.A.; Blake, J.A.; Botstein, D.; Butler, H.; Cherry, J.M.; Davis, A.P.; Dolinski, K.; Dwight, S.S.; Eppig, J.T.; et al. Gene Ontology: Tool for the unification of biology. Nat. Genet. 2000, 25, 25–29. [Google Scholar] [CrossRef] [PubMed] [Green Version]
- Kirkpatrick, B.; Miller, B. Inflammation and Schizophrenia. Schizophr. Bull. 2013, 39, 1174–1179. [Google Scholar] [CrossRef] [Green Version]
- Müller, N.; Schwarz, M.J. Immune System and Schizophrenia. Curr. Immunol. Rev. 2010, 6, 213–220. [Google Scholar] [CrossRef]
- Carlsson, A. Antipsychotic drugs, neurotransmitters, and schizophrenia. Am. J. Psychiatry 1978, 135, 165–173. [Google Scholar] [CrossRef]
- Corcoran, C.; Walker, E.; Huot, R.; Mittal, V.; Tessner, K.; Kestler, L.; Aalaspina, D. The Stress Cascade and Schizophrenia: Etiology and Onset. Schizophr. Bull. 2003, 29, 671–692. [Google Scholar] [CrossRef] [Green Version]
- De Hert, M.; Schreurs, V.; Vancampfort, D.; Van Winkel, R. Metabolic syndrome in people with schizophrenia: A review. World Psychiatry 2013, 8, 15–22. [Google Scholar] [CrossRef]
- Perkovic, M.N.; Erjavec, G.N.; Strac, D.S.; Uzun, S.; Kozumplik, O.; Pivac, N. Theranostic Biomarkers for Schizophrenia. Int. J. Mol. Sci. 2017, 18, 733. [Google Scholar] [CrossRef] [PubMed]
- McAuliffe, J.D.; Blei, D.M. Supervised Topic Models. In Proceedings of the NIPS’07 20th International Conference on Neural Information Processing Systems, Vancouver, BC, Canada, 3–6 December 2007; pp. 121–128. [Google Scholar]
- Litvin, O.; Causton, H.C.; Chen, B.J.; Pe’er, D. Modularity and interactions in the genetics of gene expression. Proc. Natl. Acad. Sci. USA 2009, 106, 6441–6446. [Google Scholar] [CrossRef] [PubMed] [Green Version]
- Lorenz, D.M.; Jeng, A.; Deem, M.W. The emergence of modularity in biological systems. Phys. Life Rev. 2011, 8, 129–160. [Google Scholar] [CrossRef] [PubMed] [Green Version]
- Roweis, S.T.; Saul, L.K. Nonlinear Dimensionality Reduction by Locally Linear Embedding. Science 2000, 290, 2323–2326. [Google Scholar] [CrossRef] [PubMed] [Green Version]
- Zhou, Y.; Sun, S. Local Tangent Space Discriminant Analysis. Neural Process. Lett. 2016, 43, 727–744. [Google Scholar] [CrossRef]
- Li, W. Modularity Embedding. In Proceedings of the International Conference on Neural Information Processing, Daegu, Korea, 3–7 November 2013; pp. 92–99. [Google Scholar]
- Zhang, Z.; Zha, H. Principal Manifolds and Nonlinear Dimension Reduction via Local Tangent Space Alignment. SIAM J. Sci. Comput. 2002, 26, 313–338. [Google Scholar] [CrossRef] [Green Version]
- Yang, Z.; Algesheimer, R.; Tessone, C.J. A Comparative Analysis of Community Detection Algorithms on Artificial Networks. Sci. Rep. 2018, 6, 30750. [Google Scholar] [CrossRef] [Green Version]
- Abdi, H.; Valentin, D. Multiple Correspondence Analysis. In Encyclopedia of Measurement and Statistics; Sage: Sauzend Oakes, CA, USA, 2007; pp. 1–11. [Google Scholar]
- Chang, J. Lda: Collapsed Gibbs Sampling Methods for Topic Models. 2015. Available online: https://cran.r-project.org/web/packages/lda/lda.pdf (accessed on 23 May 2019).
- Bastian, M.; Heymann, S.; Jacomy, M. Gephi: An Open Source Software for Exploring and Manipulating Networks. In Proceedings of the Third International Conference on Weblogs and Social Media, ICWSM 2009, San Jose, CA, USA, 17–20 May 2009; pp. 361–362. [Google Scholar]
- Newman, M.E.J. Fast algorithm for detecting community structure in networks. Phys. Rev. E 2004, 69, 066133. [Google Scholar] [CrossRef] [Green Version]
- Yang, B.; Cheung, W.; Liu, J. Community Mining from Signed Social Networks. IEEE Trans. Knowl. Data Eng. 2007, 19, 1333–1348. [Google Scholar] [CrossRef]
- Blondel, V.D.; Guillaume, J.L.; Lambiotte, R.; Lefebvre, E. Fast unfolding of communities in large networks. J. Stat. Mech. Theory Exp. 2008, 10, P10008. [Google Scholar] [CrossRef] [Green Version]
- He, D.; Liu, J.; Yang, B.; Huang, Y.; Liu, D.; Jin, D. An ant-based algorithm with local optimization for community detection in large-scale networks. Adv. Complex Syst. 2012, 15, 1250036. [Google Scholar] [CrossRef] [Green Version]
- Rosvall, M.; Bergstrom, C.T. Maps of random walks on complex networks reveal community structure. Proc. Natl. Acad. Sci. USA 2008, 105, 1118–1123. [Google Scholar] [CrossRef] [PubMed] [Green Version]
- Rosvall, M.; Bergstrom, C.T. Multilevel Compression of Random Walks on Networks Reveals Hierarchical Organization in Large Integrated Systems. PLoS ONE 2011, 6, e18209. [Google Scholar] [CrossRef] [PubMed] [Green Version]
- Husson, F.; Josse, J.; Le, S.; Mazet, J. FactoMineR: Multivariate Exploratory Data Analysis and Data Mining. 2017. Available online: https://cran.r-project.org/web/packages/FactoMineR/FactoMineR.pdf (accessed on 28 May 2019).
- Monaco, A.; Monda, A.; Amoroso, N.; Bertolino, A.; Blasi, G.; Di Carlo, P.; Bellotti, R. A complex network approach reveals a pivotal substructure of genes linked to schizophrenia. PLoS ONE 2018, 13, e0190110. [Google Scholar] [CrossRef] [Green Version]
- Kos, M.Z.; Duan, J.; Sanders, A.R.; Blondell, L.; Drigalenko, E.I.; Carless, M.A.; Göring, H.H. Dopamine perturbation of gene co-expression networks reveals differential response in schizophrenia for translational machinery. Transl. Psychiatry 2018, 8, 278. [Google Scholar] [CrossRef]
- Chen, S.; Wang, Z.Z.; Tang, L.; Tang, Y.N.; Gao, Y.Y.; Li, H.J. Global vs local modularity for network community detection. PLoS ONE 2018, 13, e0205284. [Google Scholar] [CrossRef] [Green Version]
Figure 1.
The orientation of schizophrenia genes at different phases: (a) the initial gene network comprising of all schizophrenia genes as a cluster; (b) the gene network highlighting the nodes after calculating their degrees; (c) the genes oriented based on their biological modules; (d) genes revealing the tie structure across the modules. The figure is generated from Gephi tool.

Figure 2.
The topics spanned gene modules revealing a strong association between topic 1 (i.e., inflammation), topic 2 (i.e., immune response) and topic 3 (i.e., genetic factors). The colored pattern indicates the type of gene mechanisms on X-axis (lr) with the estimate of their occurrence on Y-axis (density). The black colored patterns indicate gene mechanisms as topics. Topic 1 defines module 1 (inflammation), topic 2 is of module 2 (Immune response) and topic 3 is module 3 (genetic factors). The figure is generated from R programming language.

Figure 3.
Centrality, eccentricity and size distributions for the gene communities.

Figure 4.
The gene communities highlighting significant biological processes in schizophrenia: (a) backbone community structure; (b) embedded connections in the community structure.
Figure 4.
The gene communities highlighting significant biological processes in schizophrenia: (a) backbone community structure; (b) embedded connections in the community structure.
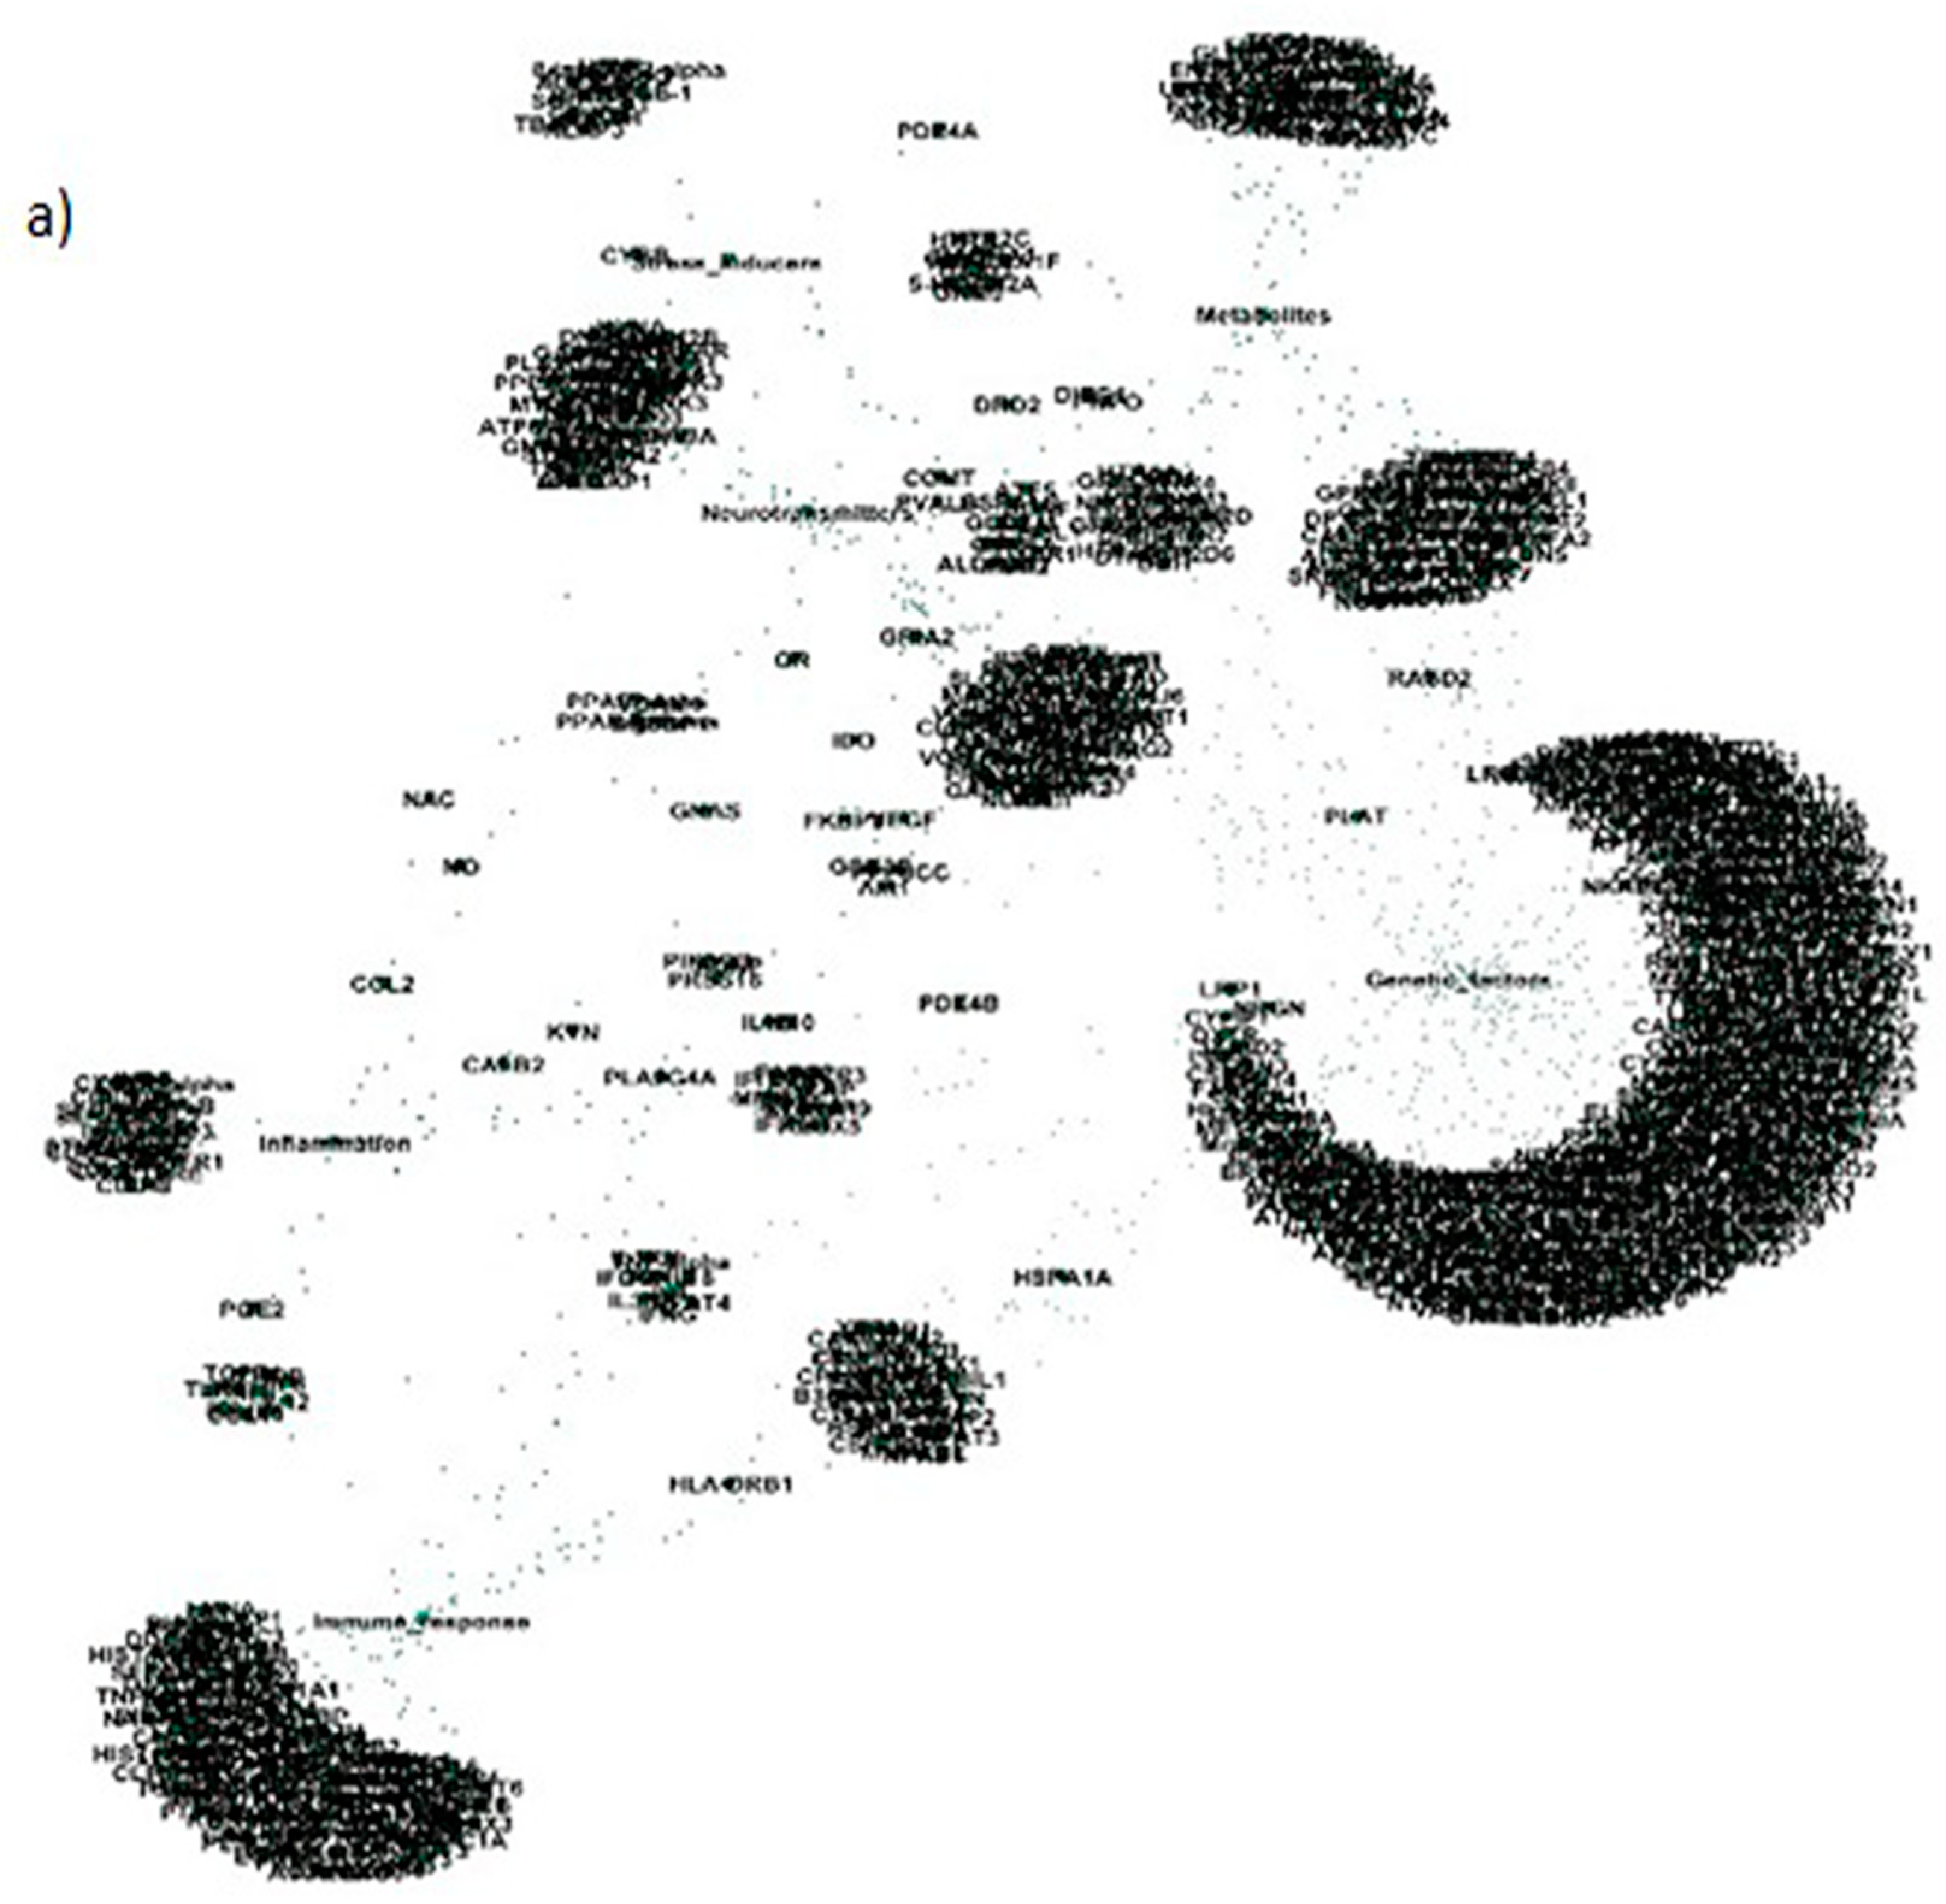

Figure 5.
The interactions between different gene communities: (a) interactions between inflammatory and immune response gene modules; (b) the interactions between inflammatory, immune response and genetic factor modules; (c) the interactions between genetic, neurotransmitter and metabolic gene modules.
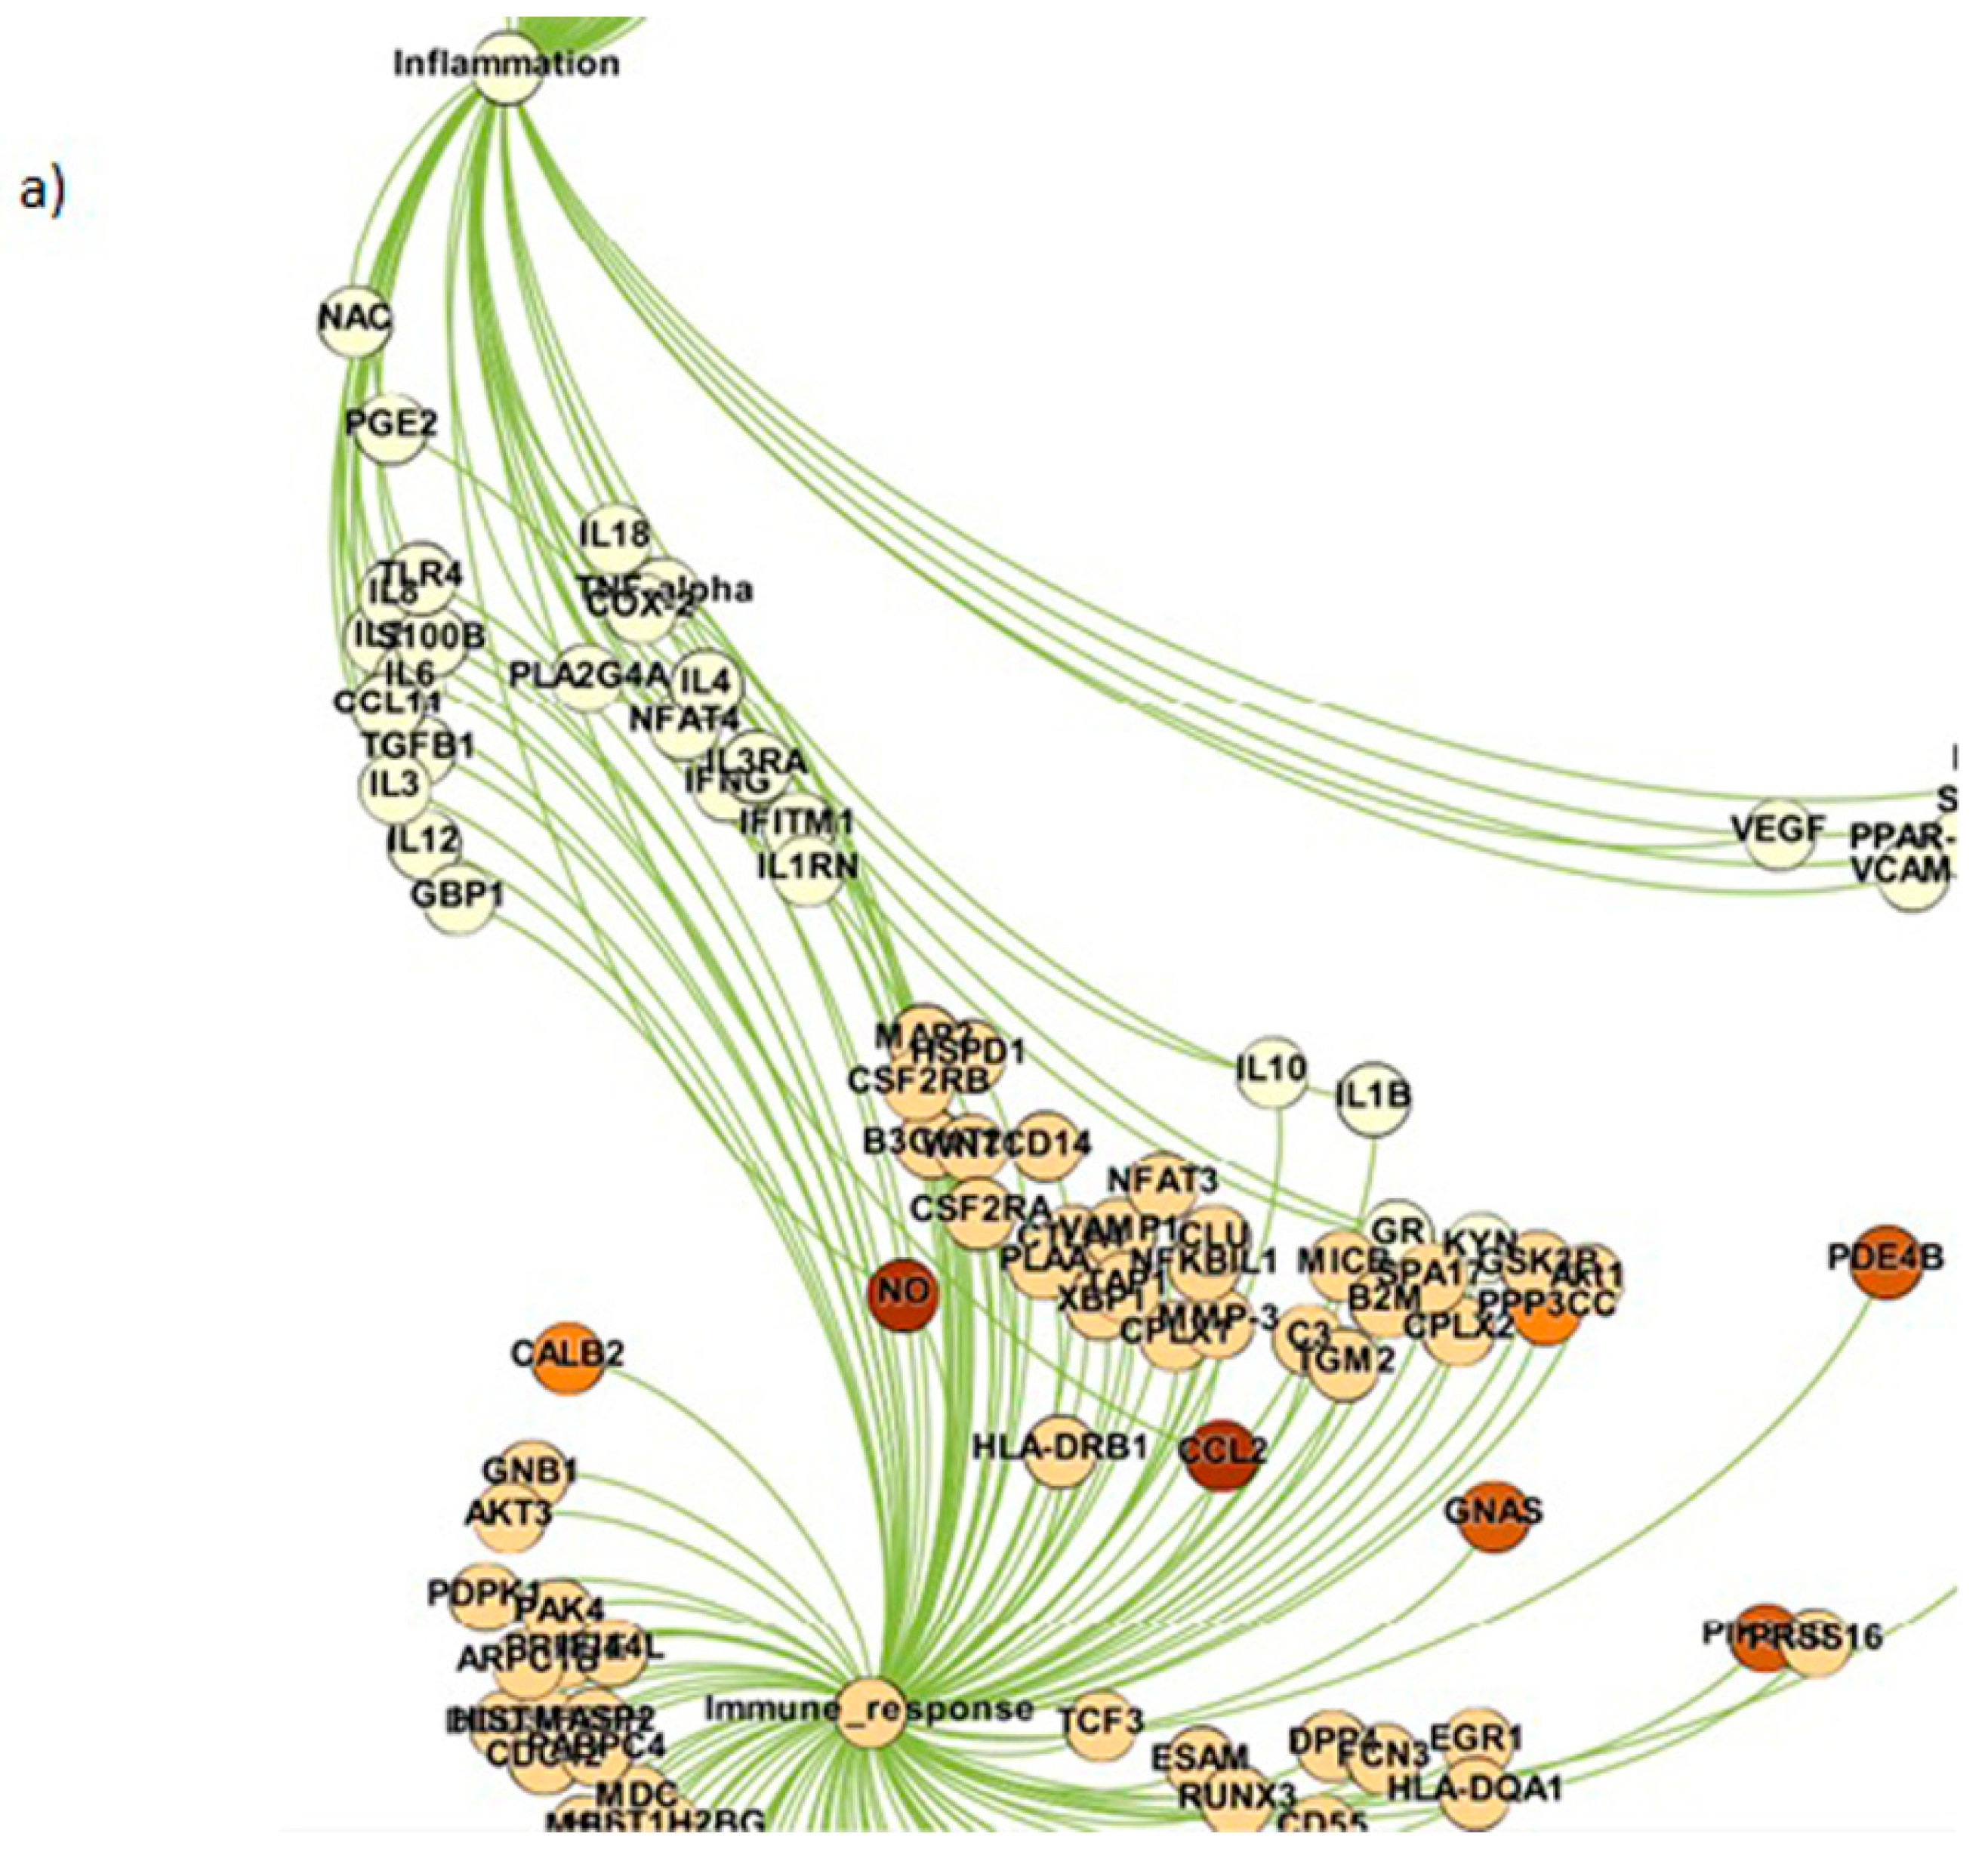
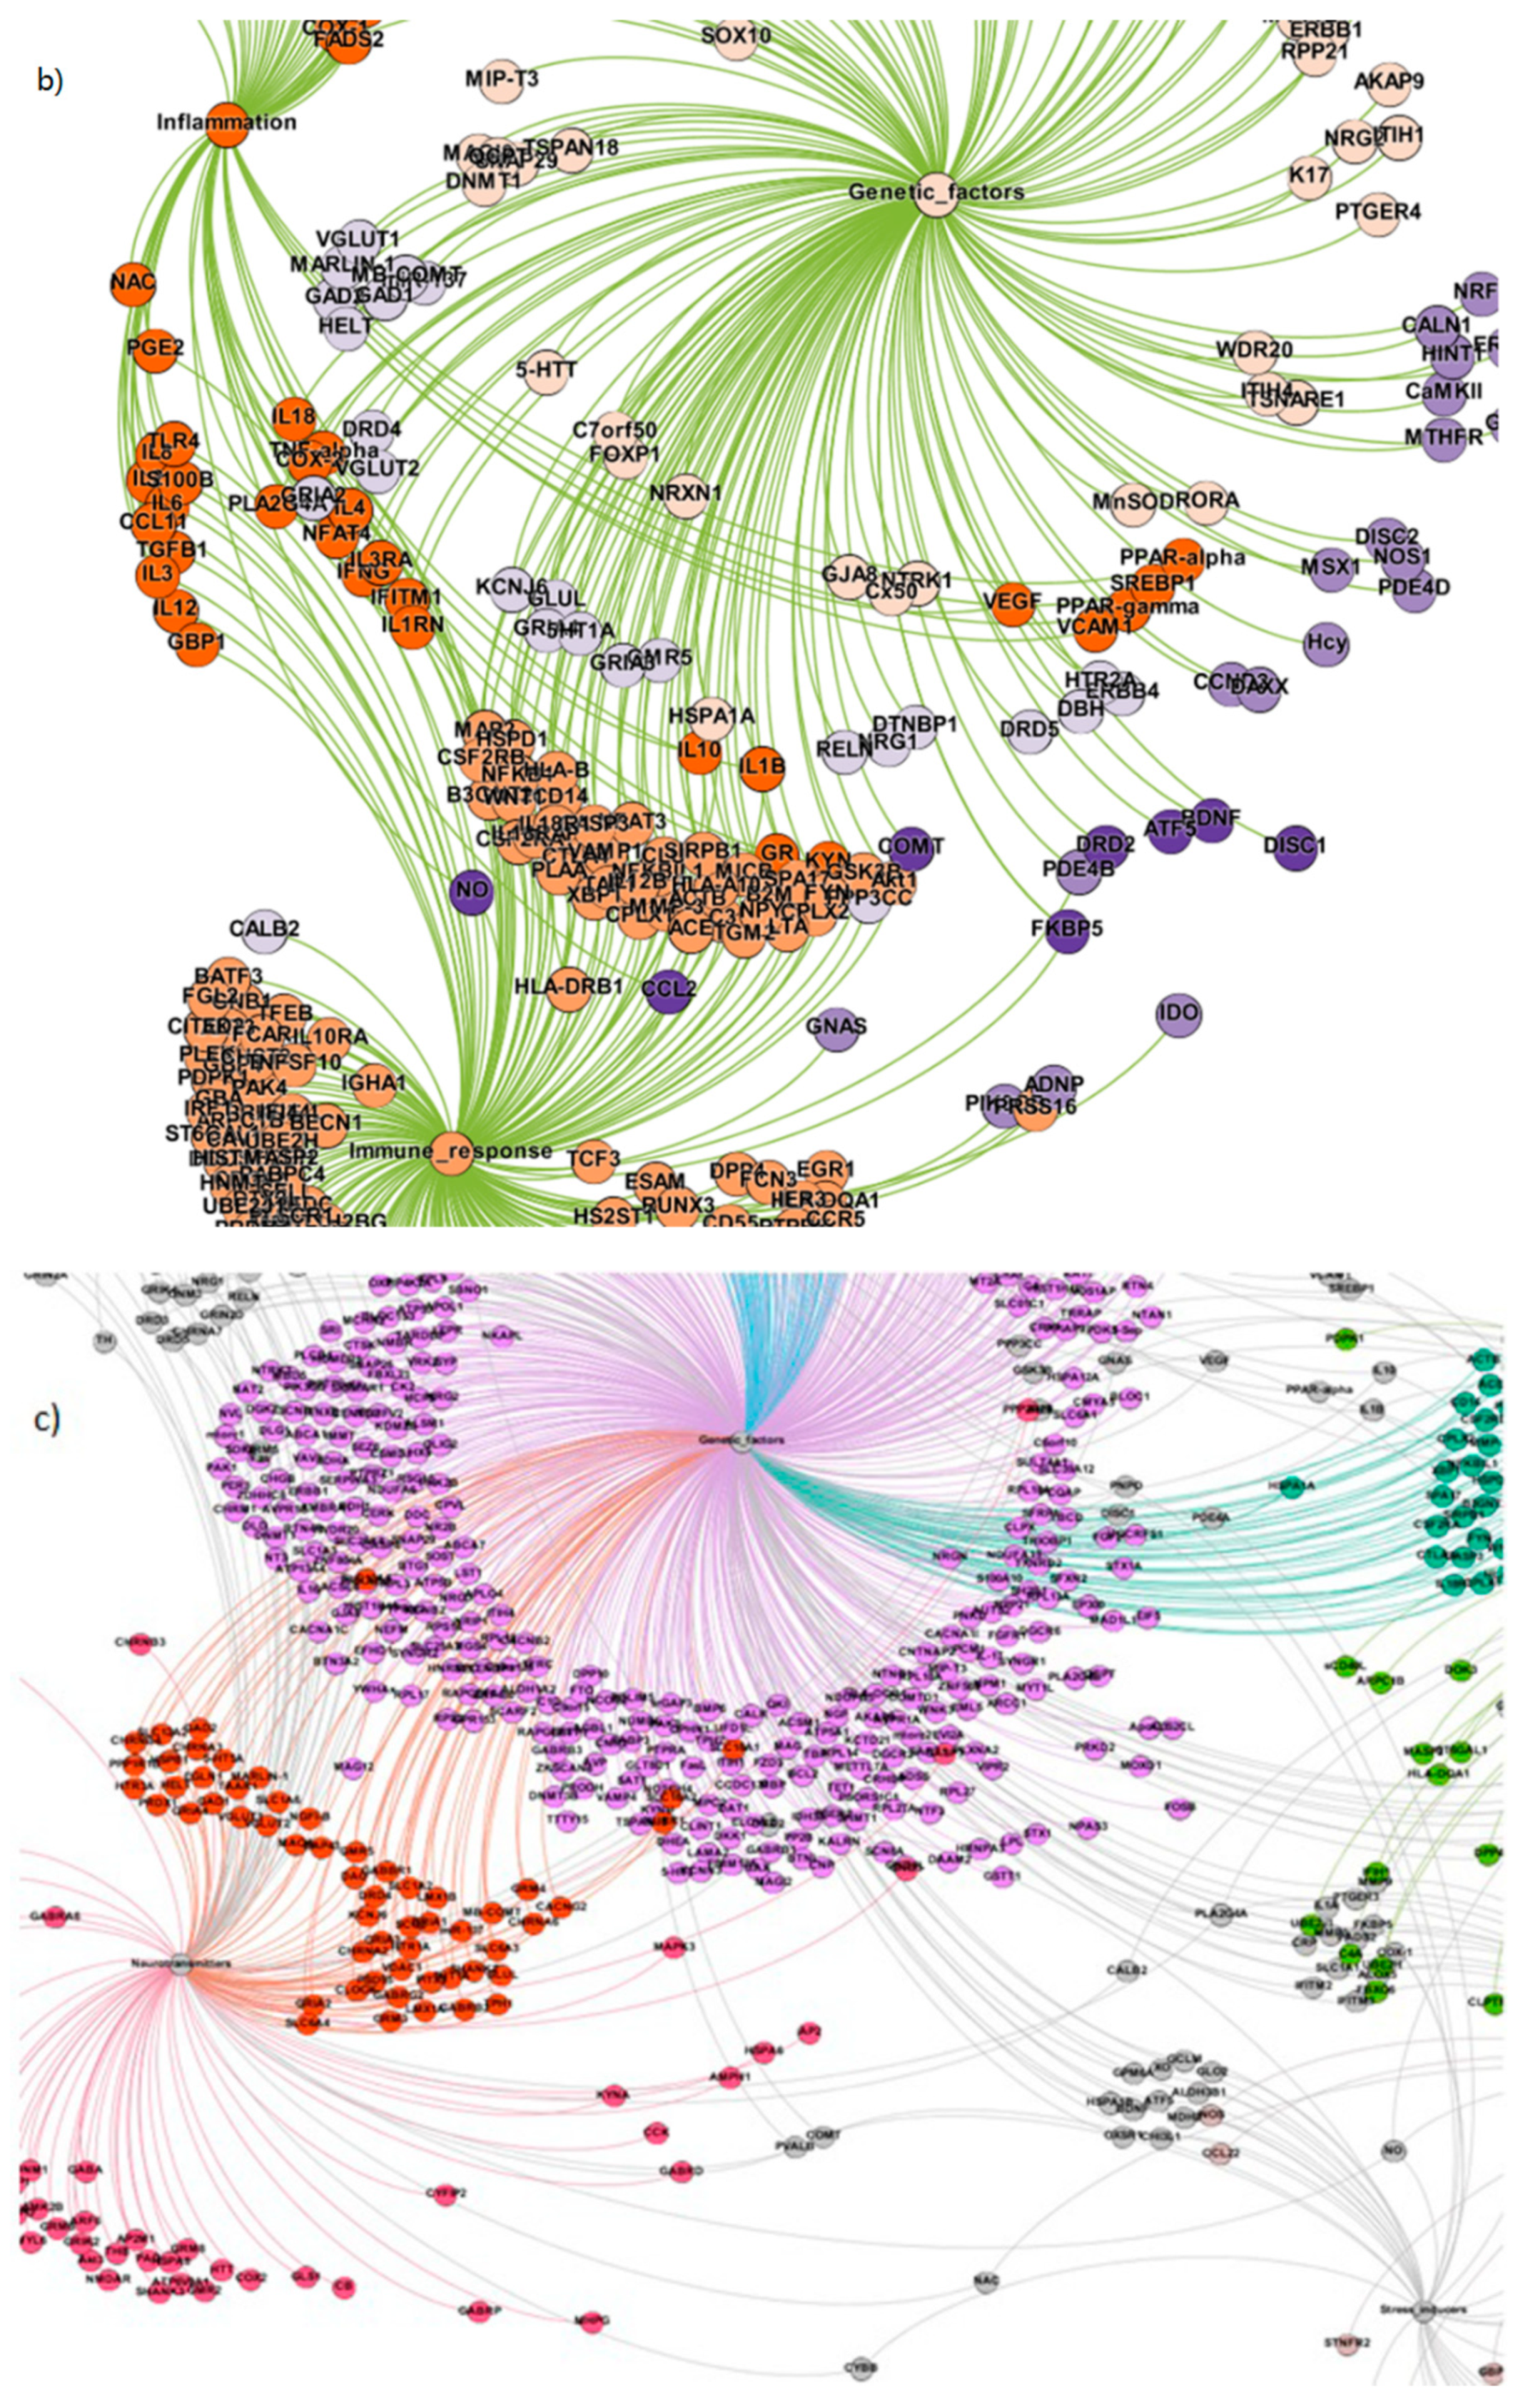
Figure 6.
The tie structure of schizophrenia network, (a) the core genes expressed across different gene modules; (b) few more genes obtained after increasing the network size; (c) the core genes forming a community structure displaying the inherent ties; (d) the community structure oriented across the core genes for the entire network.
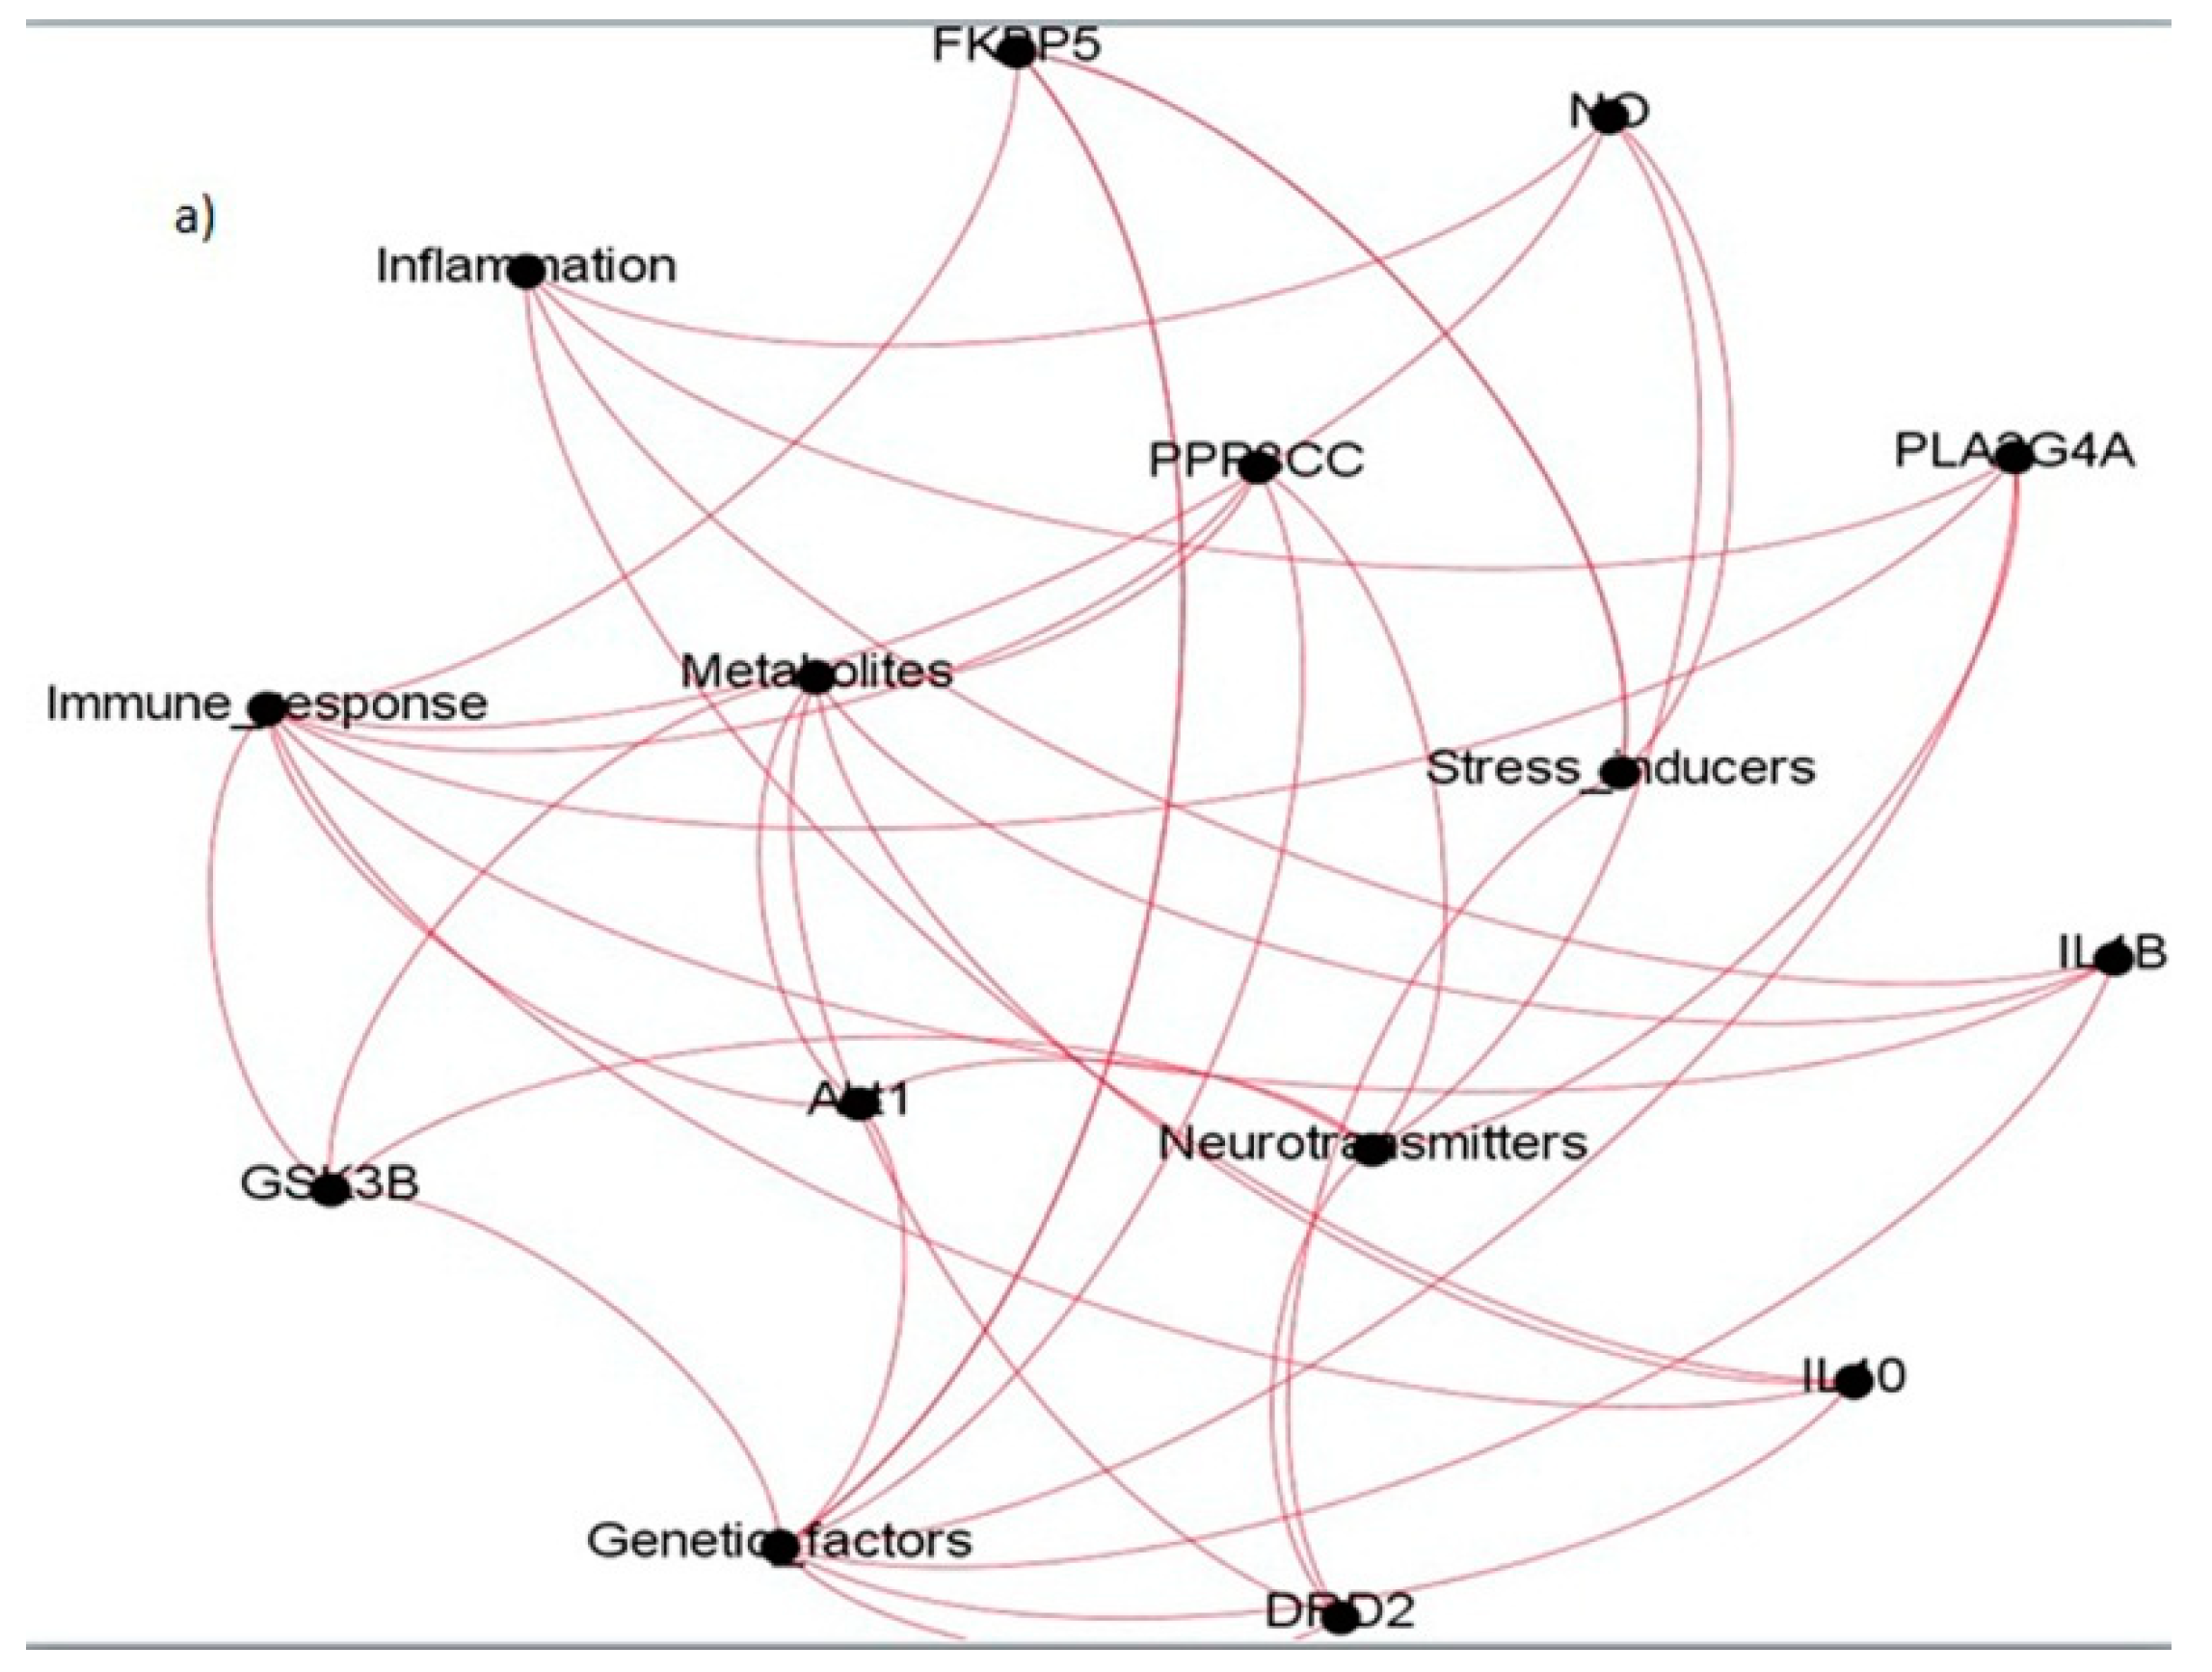
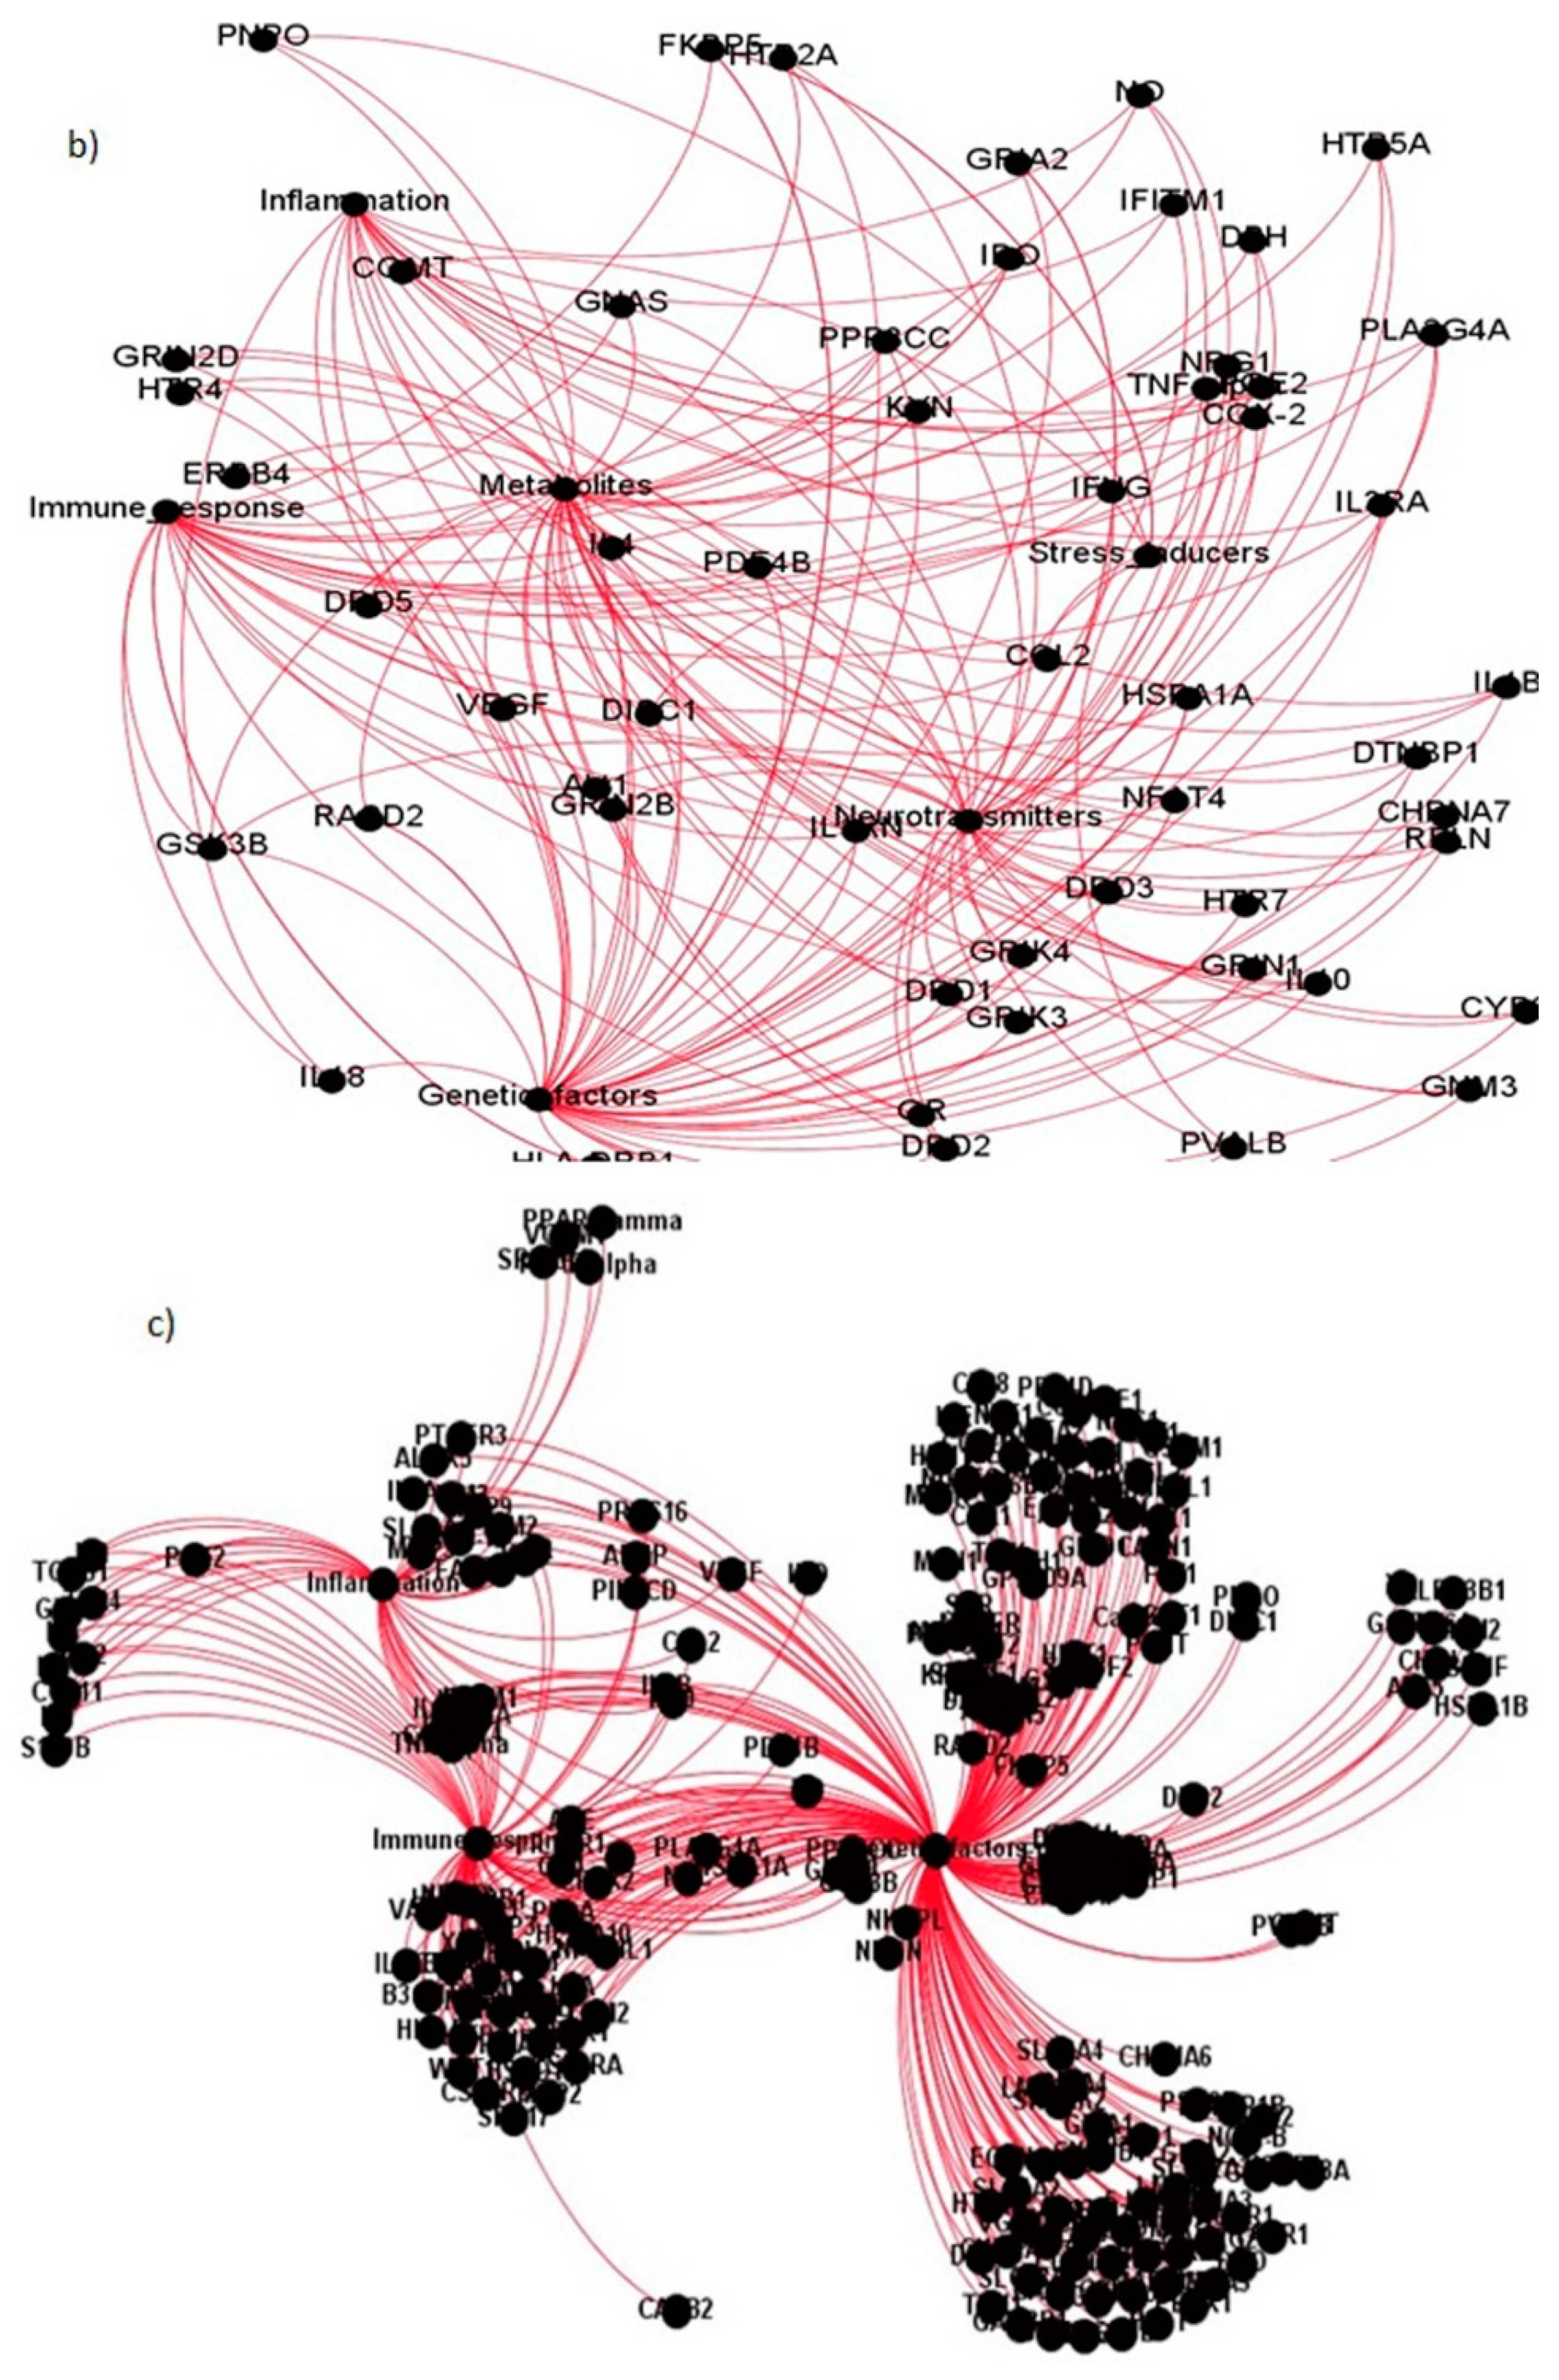

Figure 7.
The reflection of genes scattered across different modules based on cos2 metric.


Table 1.
Prominent studies modeling schizophrenia as a network.
| Sl. No. | Study | Methodology Adopted | Significant Contributions |
|---|---|---|---|
| 1 | [24] | Disrupted brain function is modeled using non-linear models like gaussian naïve bayes and SVM (Support Vector Machine) | Non-linear models resulted in better functional brain mapping with 86% accuracy |
| 2 | [25] | Functional connectivity between brain components are investigated | Network topology derived from fMRI (functional Magnetic Resonance Imaging) indicated robustness of schizophrenia brain connectivity with minimal hub regions |
| 3 | [26] | Neurodevelopmental model is developed for detecting schizophrenia using longitudinal population studies | Postmortem gene expression and brain imaging denotes phenotypic characterization with developmental risk |
| 4 | [14] | Disruption in brain patterns are detected from functional networks using fMRI experiment | Disruptions are found to be global in nature owing to long distance correlations with 93% classification accuracy differentiating schizophrenia and control samples |
| 5 | [27] | Triple brain network model is proposed based on central executive network (CEN) and default mode to detect aberrant behavior in schizophrenia | The unitary mechanism of the disease is identified in cognitive, negative and positive domains |
| 6 | [28] | Several drugs including dopaminergic, cholinergic, glutamatergic, GABA (Gamma-Aminobutyric Acid), kappa opioid, cannabinoid and serotonergic are evaluated to understand their interaction patterns in schizophrenia | The stimulants impacting progression of schizophrenia are identified from the drug models |
| 7 | [12] | Multiple alterations in brain disorders are identified using a network model | The network model detected the positive symptoms of diseases using integrated approach from social, biological and psychological factors. |
| 8 | [29] | Predictive model is developed based on functional network patterns to detect schizophrenia | Sparse multivariate regression model applied on whole-brain functionality resulted in 74% accuracy for predicting schizophrenia |
| 9 | [30] | Magnetic resonance imaging data is utilized for mapping differences in brain structure | Overlapping regions of 2% is observed in cerebral, frontal and temporal regions. |
| 10 | [31] | Differentially expressed schizophrenia transcripts are identified using dysregulated genes | Two markers RGS1 and CCL4 are identified with 97% accuracy from 27% of patient subset |
Table 2.
Studies highlighting community detection in biological networks.
| Sl. No. | Study | Algorithm/Methodology Adopted for Community Detection | Contributions/Future Scope |
|---|---|---|---|
| 1 | [32] | Overlapping communties are detected based on modularity metric in complex networks | Non-trivial interactions are detected across protein and word graphs |
| 2 | [33] | Hierarchy structure is inferred from biochemical networks to identify topological properties with enhanced accuracy | Several network phenomenas are identified by considering hierarchy as the central dogma for network orientation |
| 3 | [34] | Several community detection algorithms are designed for network visualization and clustering | GLay platform is found to be suitable for analysis of large biological networks using community detection |
| 4 | [35] | Differential evolution algorithm is designed for detecting network communities using modularity as fitness function | The algorithm does not require prior knowledge of the network structure, hence outperforms other community detection algorithms on real world datasets |
| 5 | [36] | Generative model is developed from undirected graphs to detect network communities | Community structure helps in detecting functional connections and dynamics for uncovering biological mechanisms |
| 6 | [37] | Modularity-based community detection agorithms are compared on benchmark networks | Protein interaction networks are investigated to identify multiple biological modules and hierarchical organization |
| 7 | [38] | Community detection is performed for detecting modularity in multiplex networks based on recursive clustering | Randomization improves the quality of community detection based on threshold p-value for disease dataset |
| 8 | [39] | Biologically relevant modules are deteted as non-overlapping communities using modularity and conductance metrics | It is noted that overlapping community detection algorithms are preferred for identification of diseases modules |
Table 3.
Substantial tie detection studies.
| Sl. No. | Study | Methodology Adopted | Significant Conclusion |
|---|---|---|---|
| 1 | [21] | The cohesive power of weak ties helps in analyzing connected components | Emphasis on weak ties reveals the connectivity and topological features in the network |
| 2 | [40] | Communication patterns are observed in mobile networks based on strength of interaction across the ties | Information diffusion revealed neither strong nor weak ties are effective |
| 3 | [41] | Importance of ties is explored and a recommender system is developed using probability-based matrix factorization algorithm | Different types of social network ties are classified using the recommendation system with enhanced accuracy and specificity |
| 4 | [42] | The word of mouth implication is demonstrated using agent-based modeling approach | Strong ties are found to disseminate information accurately compared to weak ties |
| 5 | [43] | Strongly connected components are analyzed based on the local bow-tie structures in world wide web graphs | Differences were observed between WWW graphs and other graphs due to global bow-tie associations |
Table 4.
The distribution of schizophrenia genes across the gene modules.
| Sl. No | Gene Modules | Number of Genes |
|---|---|---|
| 1. | Inflammation | 73 |
| 2. | Immune response | 213 |
| 3. | Genetic factors | 674 |
| 4. | Neurotransmitters | 149 |
| 5. | Metabolites | 168 |
| 6. | Stress Inducers | 36 |
Table 5.
Performance analysis of LTSACom for modularity maximization.
| Trials | Modularity | SP | FUA | MABA | FN | FEC | InfoMap | LTSACom |
|---|---|---|---|---|---|---|---|---|
| 20 | 0.1 | 0.6784 | 0.7622 | 0.7981 | 0.8021 | 0.7123 | 0.7892 | 0.9194 |
| 40 | 0.2 | 0.6755 | 0.7544 | 0.8083 | 0.8166 | 0.7851 | 0.7985 | 0.8996 |
| 60 | 0.3 | 0.7081 | 0.765 | 0.8348 | 0.7933 | 0.8037 | 0.7831 | 0.8631 |
| 80 | 0.4 | 0.7002 | 0.7598 | 0.8329 | 0.7821 | 0.8136 | 0.8043 | 0.9386 |
| 100 | 0.5 | 0.6923 | 0.7322 | 0.8071 | 0.8031 | 0.8203 | 0.8124 | 0.8931 |
| 120 | 0.6 | 0.7093 | 0.7999 | 0.8199 | 0.7932 | 0.8108 | 0.8342 | 0.9032 |
| 140 | 0.7 | 0.7129 | 0.7132 | 0.8478 | 0.8155 | 0.8093 | 0.8188 | 0.9203 |
| 160 | 0.8 | 0.7361 | 0.6992 | 0.8332 | 0.7973 | 0.8478 | 0.8109 | 0.9201 |
| 180 | 0.9 | 0.7102 | 0.7338 | 0.8554 | 0.8045 | 0.8313 | 0.8013 | 0.9289 |
| 200 | 1.0 | 0.7009 | 0.7221 | 0.8441 | 0.7899 | 0.8396 | 0.8032 | 0.9256 |
Table 6.
Significant ties in schizophrenia gene network.
| Sl. No. | Coexpressed Gene Ties | Gene Names | Categories They Belong to |
|---|---|---|---|
| 1. | Akt1 | Protein kinase B | Immune response, Genetic factors, Neurotransmitters, Metabolites |
| 2. | DRD2 | Dopamine Receptor 2 | Genetic factors, Neurotransmitters, Metabolites, Stress inducers |
| 3. | IL10 | Interleukin 10 | Inflammatory, Immune response, Genetic factors, Metabolites |
| 4. | PPP3CC | Protein Phosphatase 3 Catalytic Subunit Gamma | Immune response, Genetic factors, Neurotransmitters, Metabolites |
| 5. | PLA2G4A | Phospholipase A2 Group 4A | Inflammatory, Immune response, Genetic factors, Neurotransmitters, |
| 6. | GSK3B | Glycogen synthase kinase-3B | Immune response, Genetic factors, Neurotransmitter, Metabolites |
| 7. | NO | Nitric oxide | Inflammatory, Immune response, Neurotransmitter, Stress inducer |
| 8. | COX2 | Cyclooxygenase 2 | Inflammatory, Immune response, Genetic factor, Neurotransmitter |
| 9. | FKBP5 | FK506 Binding Protein 5 | Immune response, Genetic factors, Stress inducers |
| 10. | IL1B | Interleukin 1 beta | Inflammatory, Immune response, Metabolite |
| 11. | COMT | Catechol-O-methyltransferase | Genetic factors, Neurotransmitter, Stress inducer |
| 12. | DISC1 | Disrupted in Schizophrenia 1 | Genetic factor, Metabolite, Stress inducer |
| 13. | PDE4B | Phosphodiesterase 4B | Immune response, Genetic factor, Metabolite |
| 14. | PNPO | Pyridoxine 5’-phosphatase oxidase | Genetic factor, Metabolite, Stress inducer |
| 15. | NFAT4 | Nuclear Factor of Activated T Cells 4 | Inflammatory, Immune response, Genetic factor |
| 16. | IFNG | Interferon gamma | Inflammatory, Immune response, Genetic factor |
| 17. | TNFA | Tumor Necrosis Factor Alpha | Inflammatory, Immune response, Genetic factor |
| 18. | IL3RA | Interleukin 3 Receptor Subunit Alpha | Inflammatory, Immune response, Genetic factor |
| 19. | IL4 | Interleukin 4 | Inflammatory, Immune response, Genetic factor |
| 20. | GRIK3 | Glutamate Ionotropic Receptor Kainate Type Subunit 3 | Genetic factor, Neurotransmitter, Metabolite |
| 21. | VEGF | Vascular endothelial growth factor | Inflammatory, Genetic factor, Metabolite |
| 22. | HTR4 | 5-Hydroxytryptamine Receptor 4 | Genetic factor, Neurotransmitter, Metabolite |
| 23. | GNAS | Guanine nucleotide binding protein, alpha stimulating | Immune response, Genetic factor, Neurotransmitter |
| 24. | CHRNA7 | Cholinergic Receptor Nicotinic Alpha 7 | Genetic factor, Neurotransmitter, Metabolite |
| 25. | DTNBP1 | Dysbindin 1 | Genetic factor, Neurotransmitter, Metabolite |
| 26. | RELN | Reelin | Genetic factor, Neurotransmitter, Metabolite |
| 27. | DRD1 | Dopamine Receptor D1 | Genetic factor, Neurotransmitter, Metabolite |
| 28. | DRD3 | Dopamine Receptor D3 | Genetic factor, Neurotransmitter, Metabolite |
| 29. | DRD5 | Dopamine Receptor D5 | Genetic factor, Neurotransmitter, Metabolite |
| 30. | ERBB4 | Epidermal growth factor receptor family 4 | Genetic factor, Neurotransmitter, Metabolite |
| 31. | GRIA2 | Glutamate Ionotropic Receptor AMPA (Alpha-amino-3-hydroxy-5-methyl-4-isoxazolepropionic acid) Type Subunit 2 | Genetic factor, Neurotransmitter |
| 32. | HSPA1A | Heat Shock Protein Family A Member 1A | Immune response, Genetic factor |
| 33. | RASD2 | RASD Family Member 2 | Genetic factor, Metabolite |
| 34. | IDO | Indoleamine 2,3-dioxygenase | Immune response, Metabolite |
| 35. | PGE2 | Prostaglandin E2 | Inflammatory, Immune response |
| 36. | KYN | Kynurenine | Inflammatory, Immune response |
© 2019 by the authors. Licensee MDPI, Basel, Switzerland. This article is an open access article distributed under the terms and conditions of the Creative Commons Attribution (CC BY) license (http://creativecommons.org/licenses/by/4.0/).
Share and Cite
MDPI and ACS Style
Sridhar, A.; GS, S.; Reddy, A.M.; Bhattacharjee, B.; Nagaraj, K. The Eminence of Co-Expressed Ties in Schizophrenia Network Communities. Data 2019, 4, 149. https://doi.org/10.3390/data4040149
AMA Style
Sridhar A, GS S, Reddy AM, Bhattacharjee B, Nagaraj K. The Eminence of Co-Expressed Ties in Schizophrenia Network Communities. Data. 2019; 4(4):149. https://doi.org/10.3390/data4040149
Chicago/Turabian StyleSridhar, Amulyashree, Sharvani GS, AH Manjunatha Reddy, Biplab Bhattacharjee, and Kalyan Nagaraj. 2019. "The Eminence of Co-Expressed Ties in Schizophrenia Network Communities" Data 4, no. 4: 149. https://doi.org/10.3390/data4040149