Development of a Pressure Stable Inline Droplet Generator with Live Droplet Size Measurement


Institute of Process Engineering in Life Sciences, Karlsruhe Institute of Technology (KIT), 76131 Karlsruhe, Germany
*
Author to whom correspondence should be addressed.
†
Formerly Schuchmann.
ChemEngineering 2020, 4(4), 60; https://doi.org/10.3390/chemengineering4040060
Submission received: 31 July 2020
/
Revised: 21 August 2020
/
Accepted: 2 November 2020
/
Published: 10 November 2020
(This article belongs to the Special Issue Emulsion Process Design)
Abstract
:For the research on droplet deformation and breakup in scaled high-pressure homogenizing units, a pressure stable inline droplet generator was developed. It consists of an optically accessible flow channel with a combination of stainless steel and glass capillaries and a 3D printed orifice. The droplet size is determined online by live image analysis. The influence of the orifice diameter, the mass flow of the continuous phase and the mass flow of the disperse phase on the droplet diameter were investigated. Furthermore, the droplet detachment mechanisms were identified. Droplet diameters with a small diameter fluctuation between 175 µm and 500 µm could be realized, which allows a precise adjustment of the capillary (Ca) and Weber (We) Number in the subsequent scaled high pressure homogenizer disruption unit. The determined influence of geometry and process parameters on the resulting droplet size and droplet detachment mechanism agreed well with the literature on microfluidics. Furthermore, droplet trajectories in an exemplary scaled high-pressure homogenizer disruption unit are presented which show that the droplets can be reinjected on a trajectory close to the center axis or close to the wall, which should result in different stresses on the droplets.
1. Introduction
The research on high-pressure homogenizers started in the late 19th century with the first patent of a high-pressure homogenizer [1]. During the process, an emulsion is pumped through an extreme constriction with a pressure of several hundred bar, which results in an acceleration of the flow and exposes the droplets in the emulsion to elongational strain and shear stresses [2,3]. These deform the droplets and subsequently cause their breakup [4] into smaller droplets with a diameter of less than one micrometer [5]. Although the principle of high-pressure homogenizers has not changed since the first patent, droplet breakup mechanisms are still under investigation to this day [6,7,8,9,10,11,12,13,14,15,16,17].
Deformation and breakup of droplets in defined stationary flows is well investigated, starting with Taylor’s work [18] in pure shear and elongation flow. Taylor found a dimensionless number that describes the droplet deformation and breakup behavior in laminar flow, which was later described as the Capillary Number Ca [19].
Ca represents the ratio of the viscous drag force versus the interfacial tension, which acts across the interface of the two immiscible fluids. Here, is the dynamic viscosity of the continuous phase, u is the characteristic velocity and σ is the interfacial tension.
Furthermore, Rayleigh [20] and Tomotika [21] investigated the breakup of long thin threads. An overview of possible breakup mechanisms can be found in [2]. They include end-pinching, binary breakup, Rayleigh–Plateau-instabilities and tip streaming.
These findings from defined stationary flows cannot be directly transferred to droplet breakup during high-pressure homogenization, as the flow field in the disruption unit of the high-pressure homogenizer is complex with fast changing stresses from shear stress and elongational strain to turbulent stresses acting on the droplets during their passage through the disruption unit [6,22,23,24]. This led to several authors focusing on the visualization of droplets in this specific processing unit. Amongst them, Innings and Trägårdh [7] built the first optically accessible high-pressure homogenizer disruption unit with a capillary in front of the smallest cross section to introduce the disperse phase. They injected either a pre-emulsion with a wide droplet sizes distribution (DSD) (5–50 µm) or the pure oil disperse phase through the capillary. When injecting oil, large droplets with the diameter of the smallest cross section were produced. Increasing the flow velocity lead to an unstable droplet production which resulted in wide DSD. Kelemen et al. [9] and Bisten et al. [6] used a pre-emulsion with a wide DSD which was filled in a pipe coil and subsequently pumped through an optically accessible high-pressure homogenizer (HPH) orifice.
Using an originally scaled setup allows for only partial investigation of the process. High pressures (up to 1000 bar) and high velocities (up to 200 m/s) limit the optical accessibility of the processing unit. Scaling of the process is a promising approach to increase the resolution and reduce pressure and velocity at the same time [25]. Consequently, the droplets in the raw emulsion have to be scaled, too. No stable raw emulsions can be produced; however, if the droplet diameter is bigger than about 100 µm as the droplets are creaming rapidly, this would make it impossible to pump them from a pressure vessel the way Innings and Trägårdh [7], Kelemen et al. [9], and Bisten et al. [6] did, leading to the necessity of an inline production of pre-emulsion droplets. Inning et al. [8] used a capillary in the inlet of the disruption unit of a scaled high-pressure homogenizer (HPH) valve. Small flow fluctuations allowed for the produced droplets’ size to range from 0.2 to 1.5 mm. Kolb et al. [26] carried out their experiments with a not-further-specified droplet injection in their low pressure scaled HPH orifice which produced droplets with a size range of 2–3 mm. Budde et al. [27] injected single droplets using a capillary with an attached syringe in their scaled setup in which the trajectory of the droplet could be altered by moving the capillary in and out.
In contrast to the above mentioned droplet production methods with either wide DSD or only single droplet production, a large number of monodisperse droplets can be continuously produced in microfluidic devices with co-flowing, cross-flowing or elongation dominated streams [28]. These devices can be produced of several materials like Polydimethylsiloxane (PDMS), polyurethane-based polymers, silicone or glass, which all have their advantages and disadvantages [29]. Nevertheless, probably most of them can only be operated at pressures close to ambient pressure.
During the droplet production, the local fluid stress, which is deforming the emerging droplet, is working against the capillary pressure, which maintains the spherical shape [28]. The Capillary Number Ca is therefore also used to characterize the droplet breakup from the tip of the capillary in microfluidic devices. Furthermore, the Weber Number We can be used to characterize the droplet production if the capillary pressure and inertia stresses are dominating over the viscous stresses [28,30].
The Weber number is linked to the Capillary and Reynolds number:
where u is the velocity in the orifice, d the orifice diameter, ρc the density of the continuous phase and ηc the dynamic viscosity of the continuous phase.
There are two droplet breakup mechanisms known for droplet generation in microfluidic devices, namely dripping and jetting. During the dripping regime on the one hand, the disperse phase is injected at low flow rates whereby the produced droplets drip from the tip of the capillary [30]. In a first phase, the droplets grow and remain spherical, while in the following separation phase, the forces acting on the droplet are increasing, and a neck is formed. Subsequently, the droplet is detached from the tip. On the other hand, if the disperse phase is injected at higher flow rates, a thin jet is formed at the tip which may break up due to Rayleigh–Plateau instabilities [31,32]. Both regimes are capable of producing droplets with a minimal droplet diameter variance [31,33]. The droplet generation frequency in such microfluidic devices can range from 1 to 50 Hz [33], which increases the probability of taking a snapshot of droplets in the orifice.
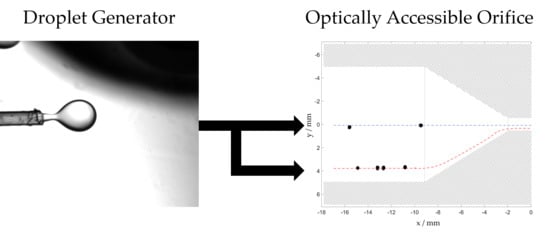
Droplets are exposed to fast changing stresses depending on their trajectory during their passage through the disruption unit of a high-pressure homogenizer. Figure 1 illustrates that droplets are exposed to higher shear forces on a trajectory close the wall compared to droplets which flow on the center axis. The stresses on the droplets are increasing rapidly when entering the disruption unit. Fast-changing stresses do not allow the droplets to reach the equilibrium state of deformation. Subsequent droplet breakup will thus also be influenced. Knowledge cannot be derived directly from former investigations under stationary conditions and constant stresses. For the investigation on the influence of the Ca and We Number on droplet deformation, it is also necessary to alter the droplet size by use of monodisperse emulsions. Furthermore, it was aimed at sending the pre-emulsion droplets through the orifice on selected trajectories to be able to investigate the influence of homogenization-typical stress histories on droplet deformation and break up. We followed the principal idea of Innings et al. [8], but placed the droplet generator in a side stream to avoid flow fluctuations in the inlet area. Moreover, a live droplet diameter measurement was implemented in the droplet generator. The target of the developed experimental setup was to produce monodisperse droplets within the size range of 200–400 µm.
In this paper constructive details and parameters with which droplet size and trajectory can be influenced are reported.
2. Materials and Methods
2.1. Materials
The continuous phase consisted of 58.823 wt.% glycerol (purity 99.5%, SuboLab GmbH, Pfinztal–Söllingen, Germany) and 40.877 wt.% demineralized water, to which 0.2 wt.% potassium sorbate (VWR International GmbH, Darmstadt, Germany) and 0.1 wt.% citric acid (Carl Roth GmbH + Co. KG, Karlsruhe, Germany) were added. Newtonian flow behavior was determined in the shear rate range of 0.2–600 s−1 while a dynamic viscosity of was measured with a rotational rheometer (Anton Paar Physica MCR 301, Graz, Austria) at a temperature of 20 °C. A density of at a temperature of 20 °C was measured with the density determination set DIS 11 (DCAT11, dataphysics, Filderstadt, Germany).
The disperse phase consisted of a middle-chain triglyceride (MCT) Miglyol 812® (IOI Oleo GmbH, Witten, Germany). The dynamic viscosity of the disperse phase was measured with a rotational rheometer (Anton Paar Physica MCR 301, Graz, Austria) at a temperature of 20 °C to . Newtonian flow behavior was determined within the shear rate range applied (). The oil had a density of according to the supplier’s data sheet. The interfacial tension was measured with a Wilhelmy plate (DCAT11, dataphysics, Filderstadt, Germany). An equilibrium interfacial tension of was found after a measuring time of 2 h at a temperature of 20 °C. 0.012 wt.% of the fluorescence color Nile red (9-(diethyl-amino)benzo[a]phenoxazin-5(5H)-one, Sigma-Aldrich Chemie GmbH, St. Louis, MO, USA) which was added to the MCT oil when performing droplet visualization experiments. The color did not result in significant material property changes. The material properties are summarized in Table 1.
2.2. Experimental Setup
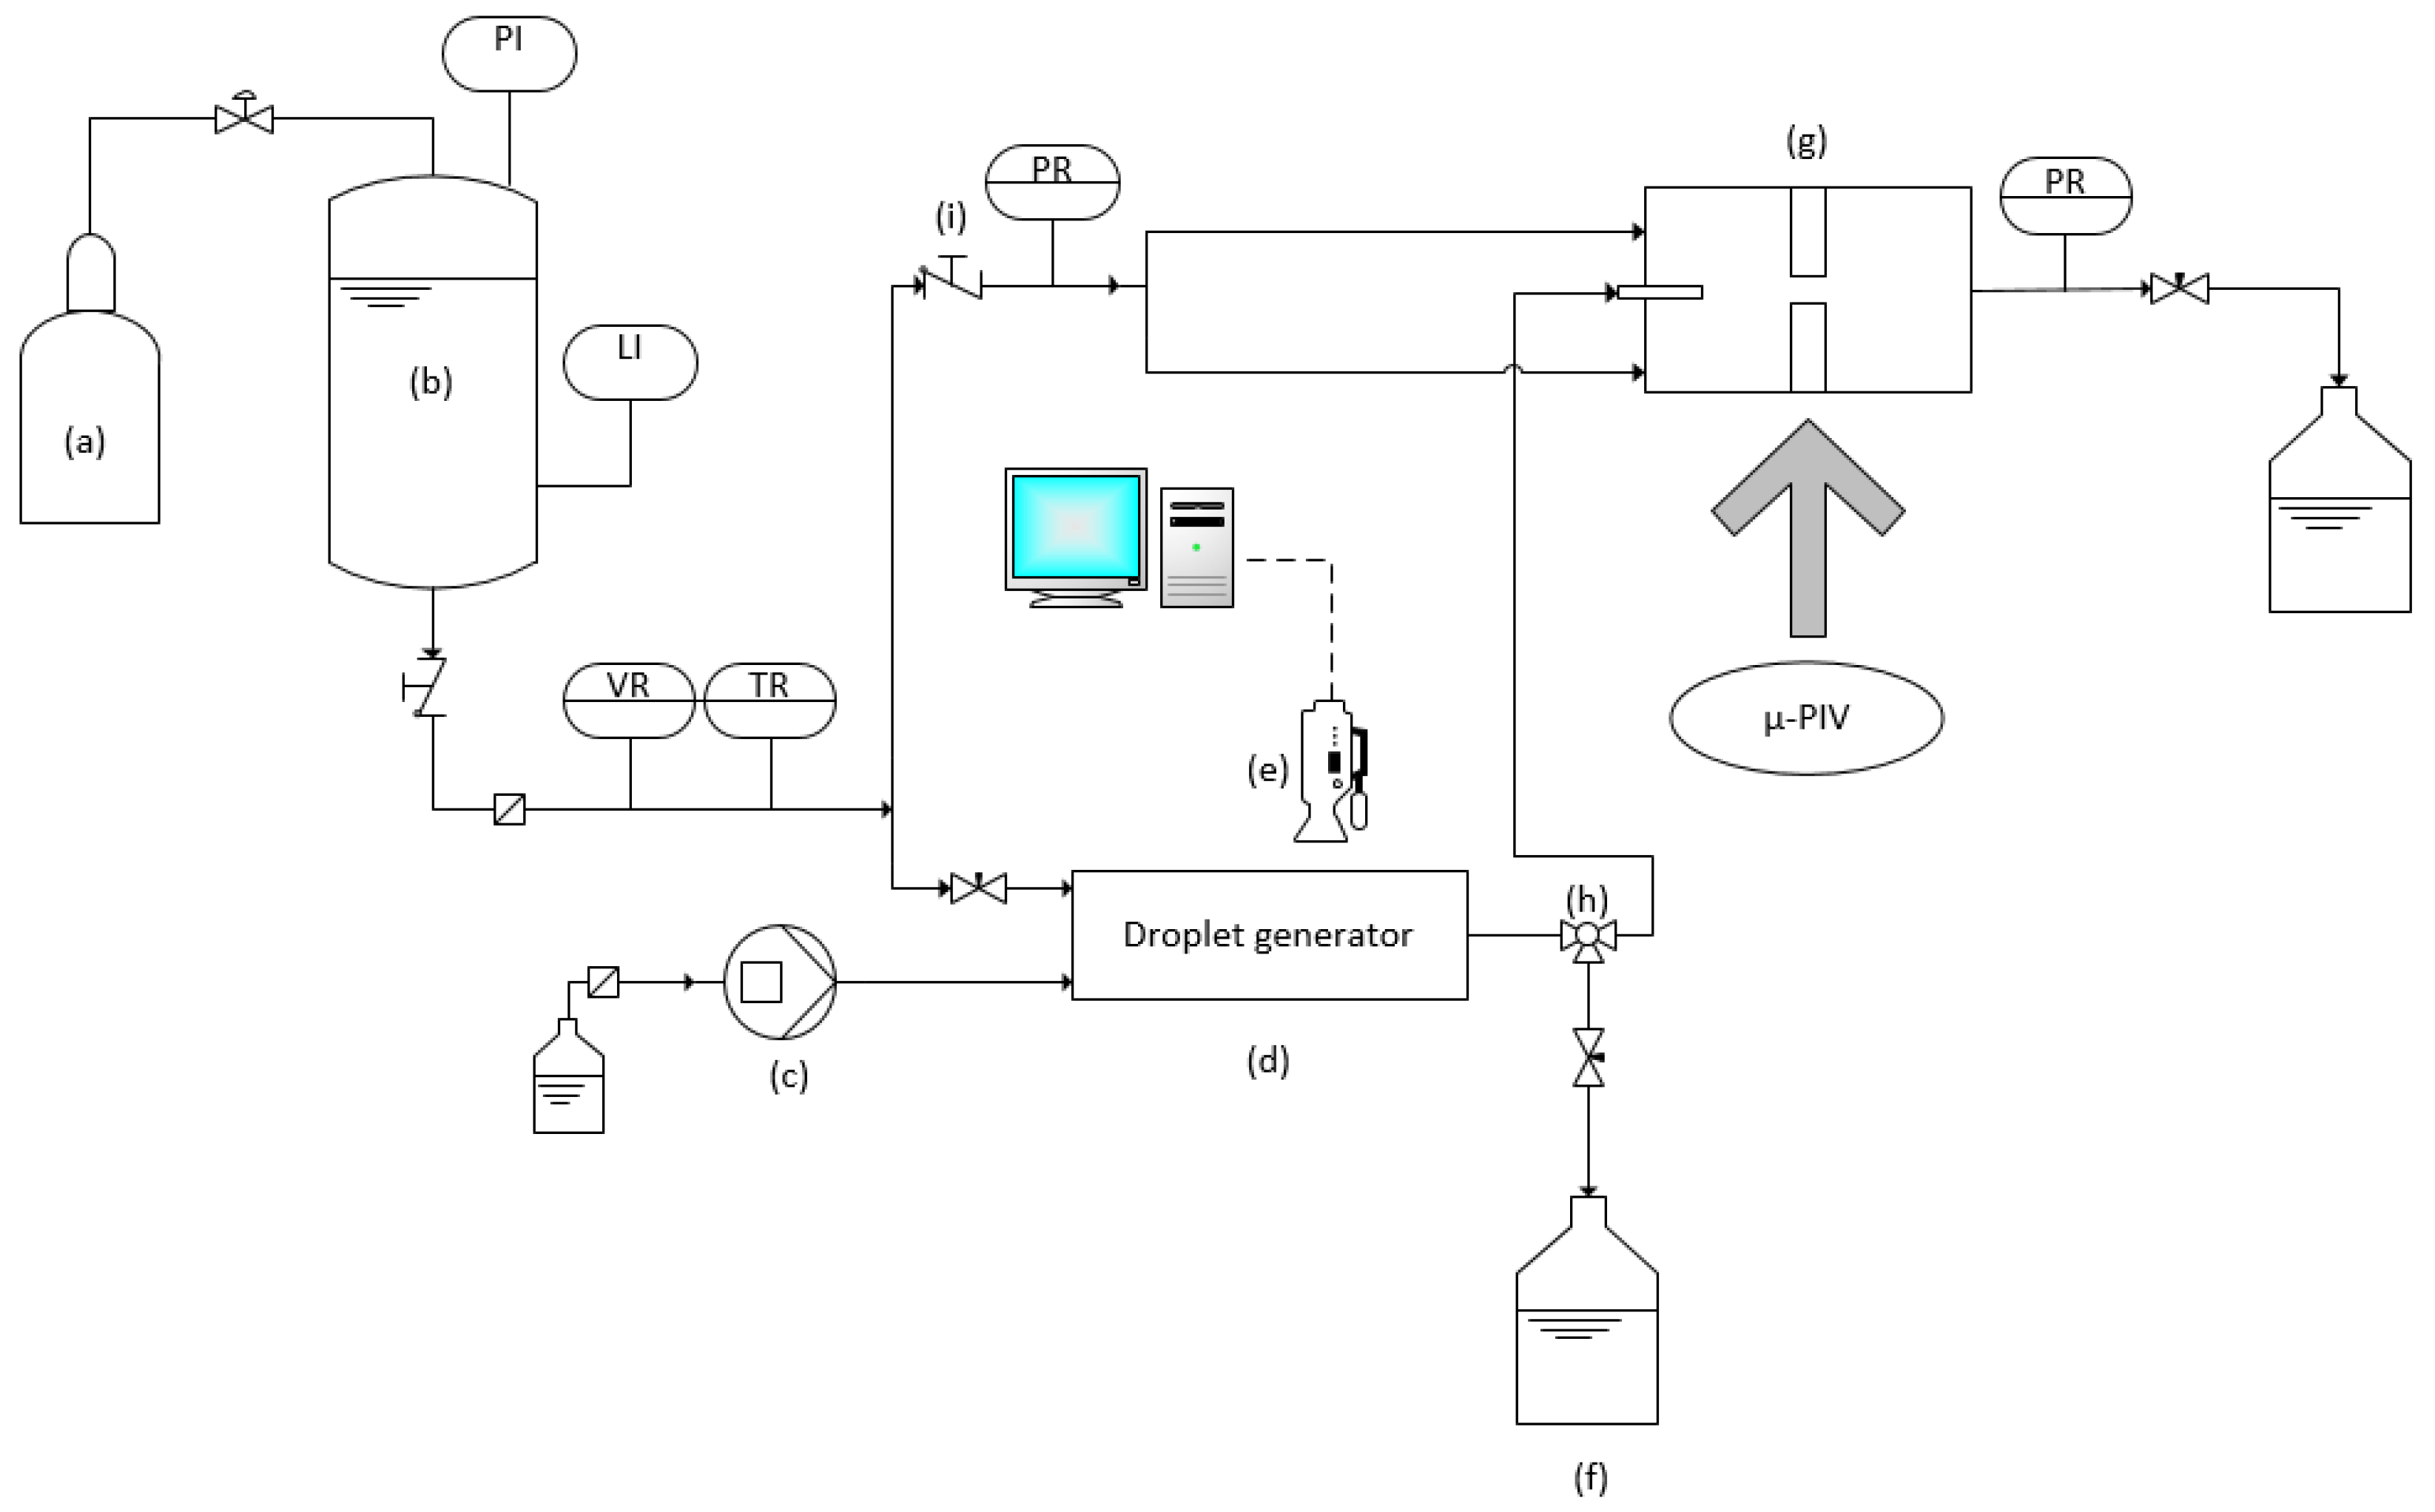
The experimental setup of the droplet generator is presented in Figure 2. The pressure vessel (b), which contained the continuous phase, was pressurized by a pressurized nitrogen gas cylinder (a) to pump the fluid through the setup. The pressure vessel ensured a pulsation free flow. The volume flow and the temperature of the continuous phase were recorded continuously during the experiments. A volume flow sensor (VSI 0,2/16 EPO 12V-32W15/4, VSE Volumentechnik GmbH, Neuenrade, Germany) was used to determine the volume flow and consequently the mass flow of the continuous water–glycerol phase during the experiments. The disperse oil phase was pumped with a displacement pump (TECHLAB Minipumpe, TECHLAB GmbH, Braunschweig, Germany) through the capillary in the droplet generator. The mass flow of the disperse phase was determined based on the revolutions per minute of the pump according to a prior calibration. An industrial camera with a 2/3″ CMOS-sensor with a resolution of 2448 × 2048 px (Baumer VCXG 51-M, Friedberg, Germany) was used to capture pictures with a framerate of 25 fps. The camera was combined with a 4× zoom objective (Qioptiq Makro CCD, Stemmer Imaging AG, Puchheim, Germany), resulting in a spatial resolution of 0.8 µm/pixel. A high-power LED was used as backlight. The exposure time of the pictures was set to 15 ms to obtain sharp pictures of the fast-moving droplets and 100 images were taken during one experiment, if all process conditions were in steady state. The valve (i) was closed and the three-way valve was set to the collecting vessel when characterizing the droplet generation and resulting droplet size. The volume flow was regulated with a needle valve downstream the droplet generator. The produced emulsion can be reintroduced in front of a scaled high-pressure homogenizer orifice with a steel capillary (Techlab GmbH, Braunschweig, Germany), which had an outer diameter of 3.18 mm and an inner diameter of 2 mm, if the valve (i) is open. The capillary can either be positioned on the center axis of the inlet channel or close to the wall of the channel. The inlet channel had a height and width of 10 mm, respectively. The orifice of the scaled disruption unit had a diameter of 1 mm with a prior conical inlet (as can also be found in Section 3.3).The scaling strategy of the scaled high-pressure homogenizer disruption unit with the droplet positioning capillary will also be published in this specific journal edition (citation to be added when available). The droplets have to enter separated from each other in front of the orifice to avoid influencing each other. Furthermore, the disperse phase fraction has to be kept low to avoid an influence of the disperse droplets on the flow. The reinjected droplets have to be accelerated to the speed of the surrounding continuous phase before entering the disruption unit to achieve an unaffected stress history in the disruption unit.
The colored droplets were visualized in the orifice with a high-speed camera setup of a micro particle image velocimetry (µ-PIV) measurement system, as described in detail in [6]. A ND:YAG laser (Dual-Power 30-15 of Dantec Dynamics, Skovlunde, Denmark), with a pulse energy of 30 mJ, was used to illuminate the images of the high-speed double frame camera (FlowSense 4M Camera Kit, Dantec Dynamics, Skovlunde, Denmark). Double frame images were taken with a frequency of 7.4 Hz, a 12 bit resolution, and a sensor area of 2048 × 2048 pixels. The laser pulse duration of a few nanoseconds prevented motion blur of the fast-moving droplets. The high-speed camera was attached to a microscope (Dantec HiPerformance Microscope, Skovlunde, Denmark) which resulted in magnification of 1.75. A spatial resolution of 6 µm/px was achieved with this setup. The snapshots were superimposed after image processing, as described in [9]. Detected objects with less than 20 pixels were removed for noise reduction during the post processing in MATLAB 2019b (Mathworks, Nantucket, MA, USA).
As the double frame high-speed camera allowed only snapshots with a frequency of 7.4 Hz, droplets had to be produced continuously. For this, a droplet generator with co-flowing streams was developed and will now be described in detail.
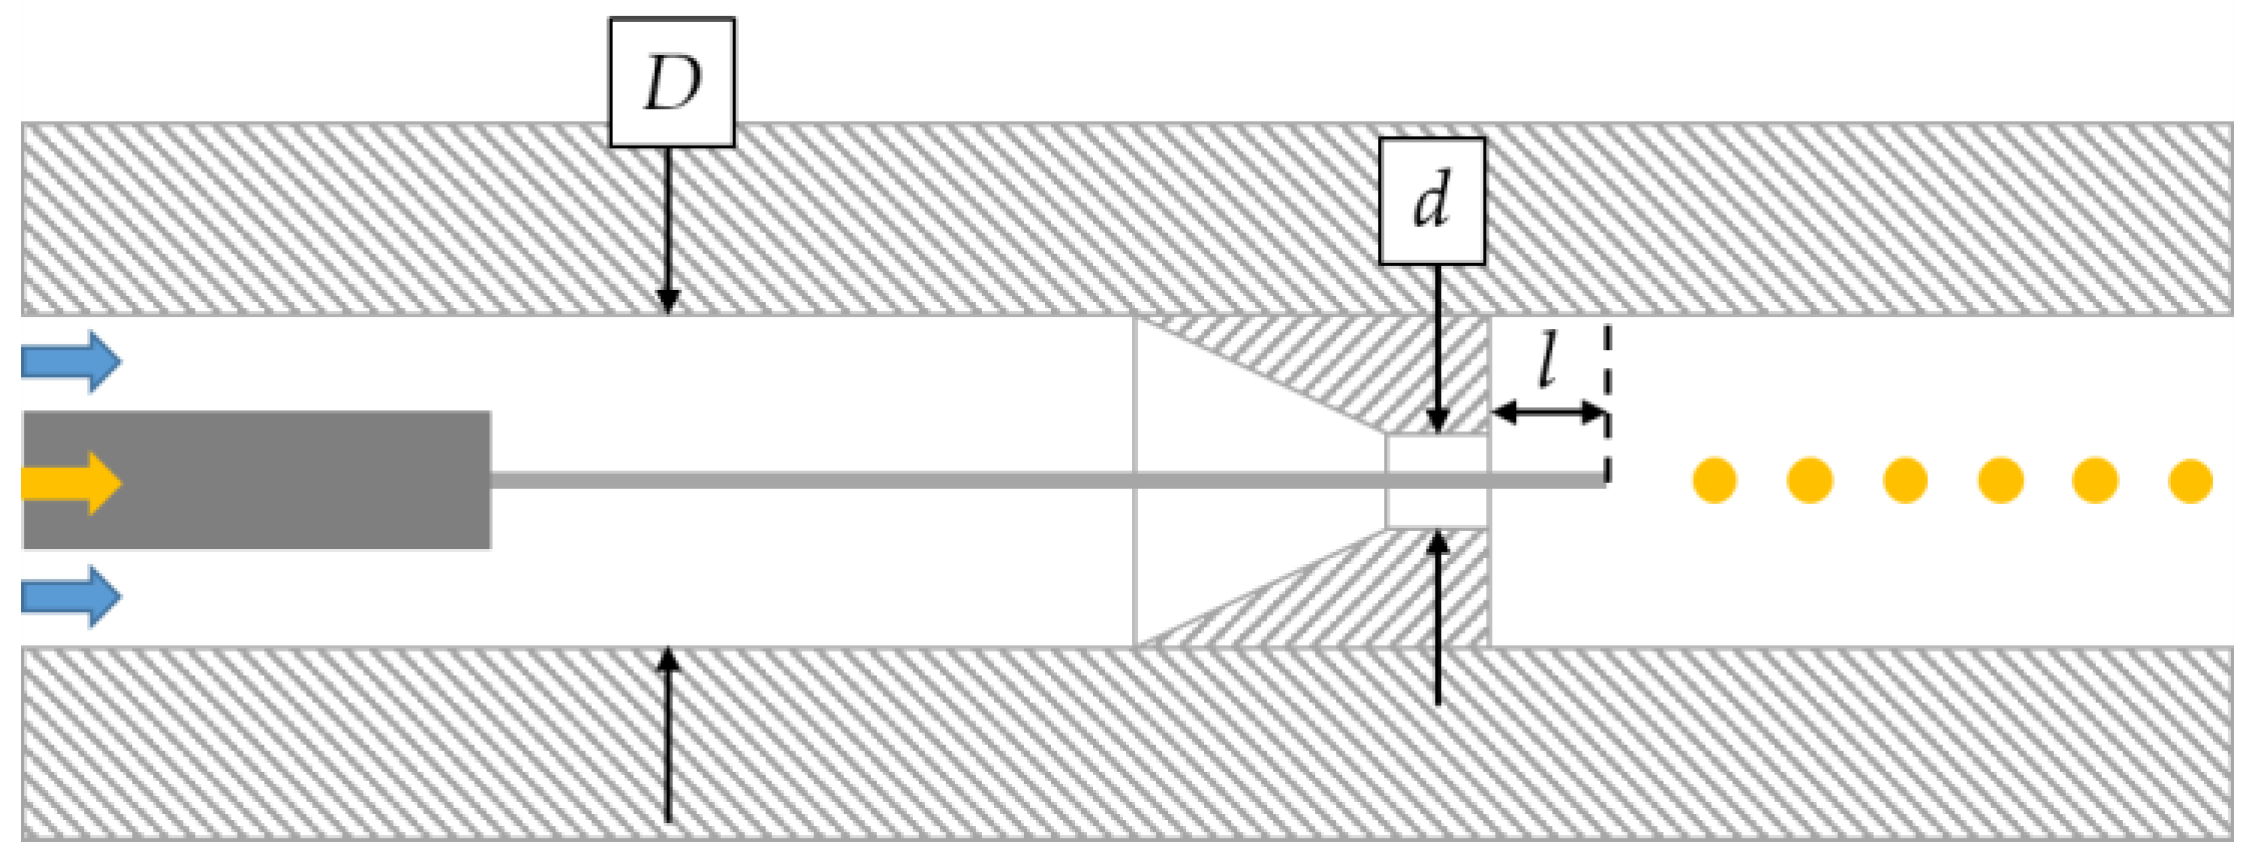
The droplet generator consists of a flow channel, depicted in Figure 3. It is milled in a stainless-steel block. The front and back side were covered with acrylic glass (Poly(methyl methacrylate)) plates for optical accessibility. The rectangular channel had a width of 4 mm and height D of 7.4 mm. The oil phase was pumped (Figure 2c) through a fused silica capillary with an outer diameter of 150 µm (Chromatographie Handel Müller GmbH, Fridolfing, Germany) that was glued in a steel capillary with an outer diameter of 1/16″ (Chromatographie Handel Müller GmbH, Fridolfing, Germany). The fused silica capillary was used for special calibration of the camera. The orifices with a conical inlet and a circular hole with a diameter d ranging from 0.5 to 2 mm were 3D printed from resin. The distance l from the capillary to the outlet of the orifice could be altered by moving the steel capillary. The droplet generator was tested up to a pressure of 4 MPa.
2.3. Image Processing
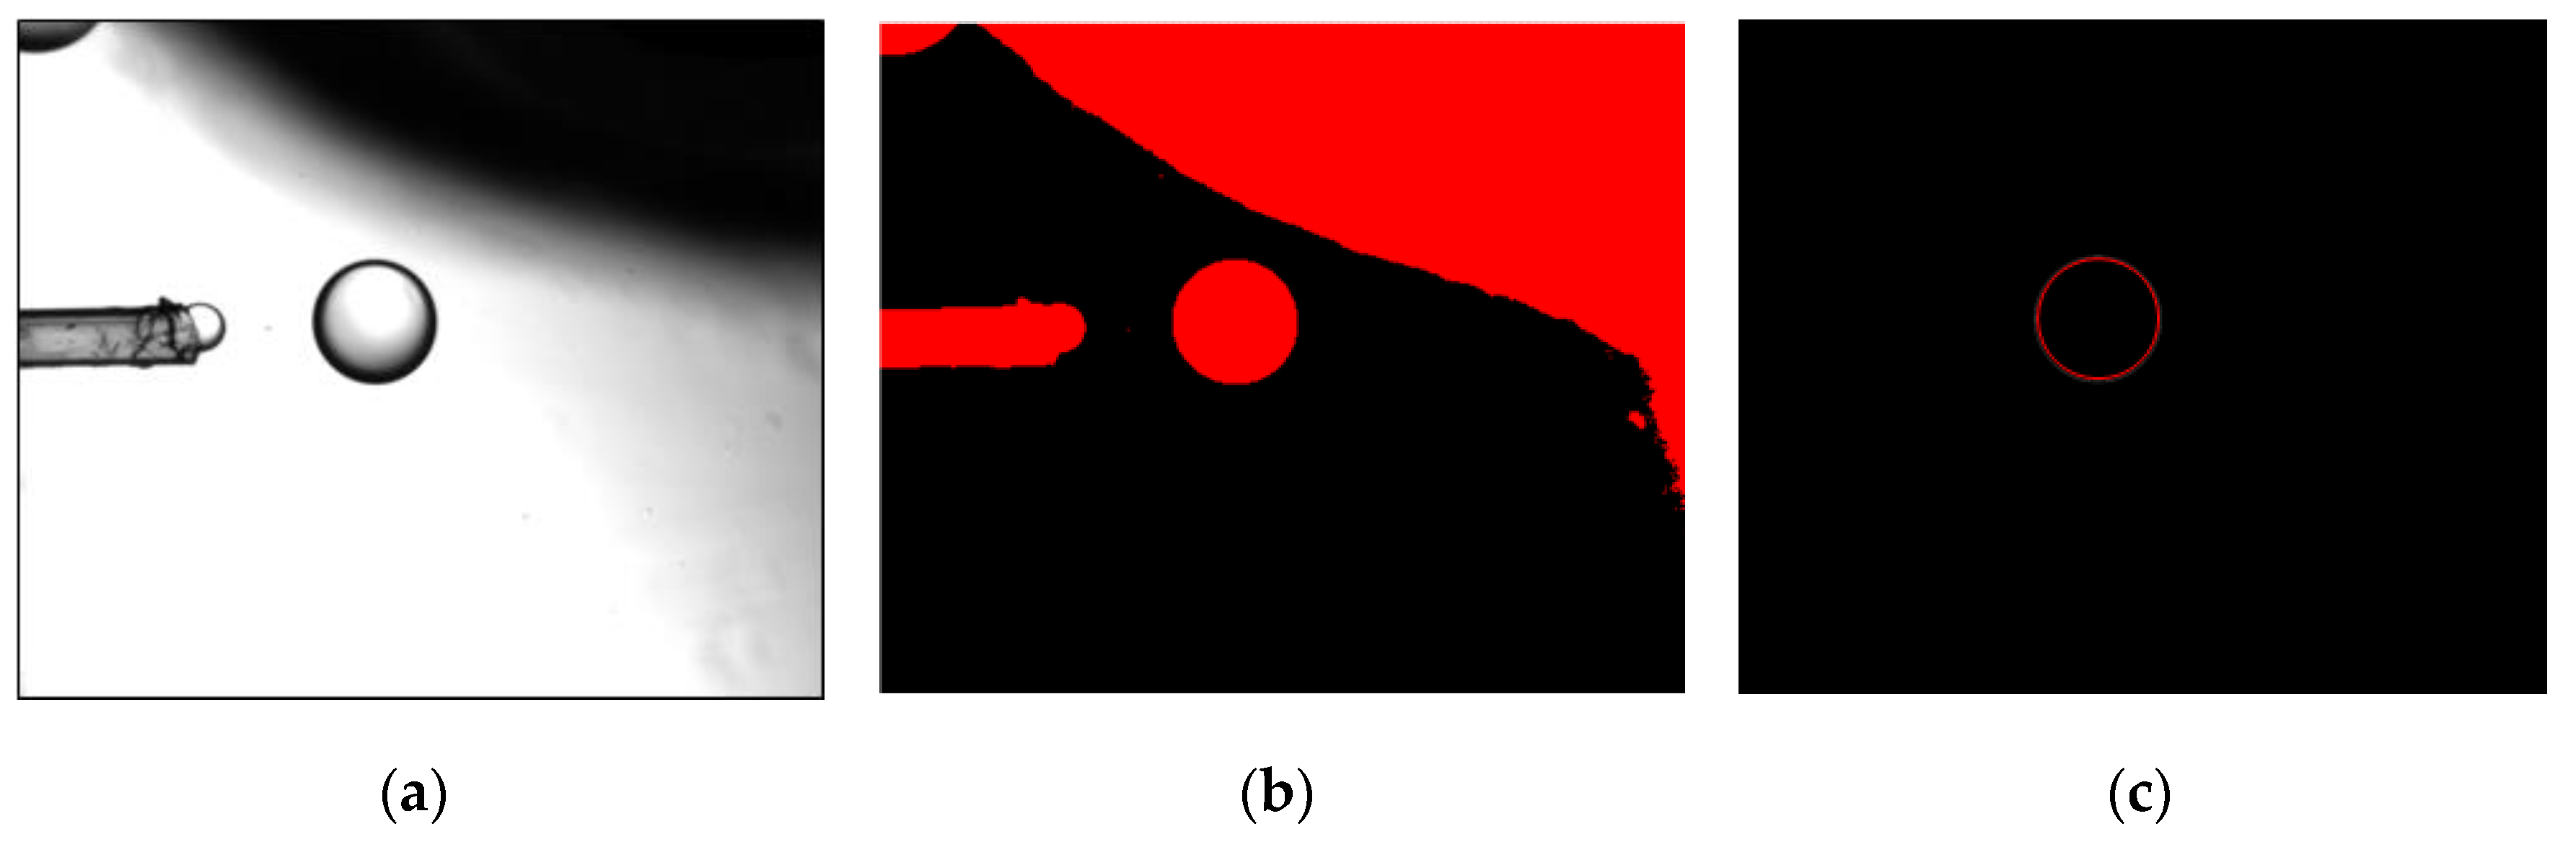
The images shot of the droplets in the droplet generator flow channel were continuously transferred to a computer where they were written in a buffer of a self-developed program in Labview 2019 (National Instruments, Austin, TX, USA). The brightness and contrast were adjusted in a next step, followed by the transformation into a binary image. Subsequently, possible holes were filled and circles in the diameter range of 130 to 800 µm were identified to avoid the detection of small satellite droplets or air bubbles. An example of this procedure is shown in Figure 4. Following that, the detected droplet sizes were stored, and an average droplet diameter was calculated from all evaluable droplets N within the 100 images.
The software OriginPro 2019 (OriginLab Corp., Northampton, MA, USA) was used for the statistical analysis, calculation of averages and standard deviations. Between 4 and 27 evaluable droplets were found in the set of 100 images. The focus plane was adjusted before every experiment to eliminate out of focus droplets. Each process parameter combination was addressed once.
All data underwent a multifactorial analysis of variance (ANOVA) and a Sheffé test as a post-hoc test. Deviations in measurement values were considered statistically relevant at a level of p ≤ 0.05.
3. Results
3.1. Influence of the Capillary’s Geometry and Position
According to the literature, the diameter of the emerging droplets is influenced by the forces acting on the droplet. The droplet diameter can be reduced by increasing the shear forces on the droplet which results in an earlier development of a neck and an earlier subsequent droplet detachment [30,33]. It is therefore hypothesized that the droplet diameter decreases if the orifice diameter is reduced, as the flow surrounding the capillary tip is accelerated. The acceleration of the flow surrounding the capillary tip is characterized by the Reynolds Number, see Equation (4).
The parameters chosen resulted in depending on the orifice diameter. A laminar jet is expected.
Droplet sizes were comparable to values found in the literature (see Section 1 [7,26,27]). As expected, the resulting droplet diameters are decreasing with decreasing orifice diameter for all capillary positions in the range as depicted in Figure 5. The orifice with a diameter of 2 mm resulted in a droplet diameter of about 500 µm, while the droplet diameter decreased to a value of about 225 µm by halving the orifice diameter to 1 mm.
3.2. Influence of Continuous and Disperse Phase Mass Flow
First, the droplet diameter in microfluidic devices can be altered by increasing or decreasing the volume flow of the inner or outer phase. Increasing the volume flow of the outer phase causes bigger forces acting on the emerging droplets which results in smaller droplets. Decreasing the volume flow of the outer phase results in larger droplets, respectively [33,34]. Concluding from this, we expect the droplet diameter to decrease with increasing mass flow of the continuous phase in the droplet generator.
Second, it is described in literature that the droplet diameter in co-flowing microfluidic devices increases if the volume flow of the inner phase is increased, as the necking and breakup process becomes dominant over the accumulation of the disperse phase in the developing droplet for determining the formation time [33,35]. It is therefore expected that the droplet diameter increases if the mass flow of the disperse phase in the capillary of the droplet generator is increased.
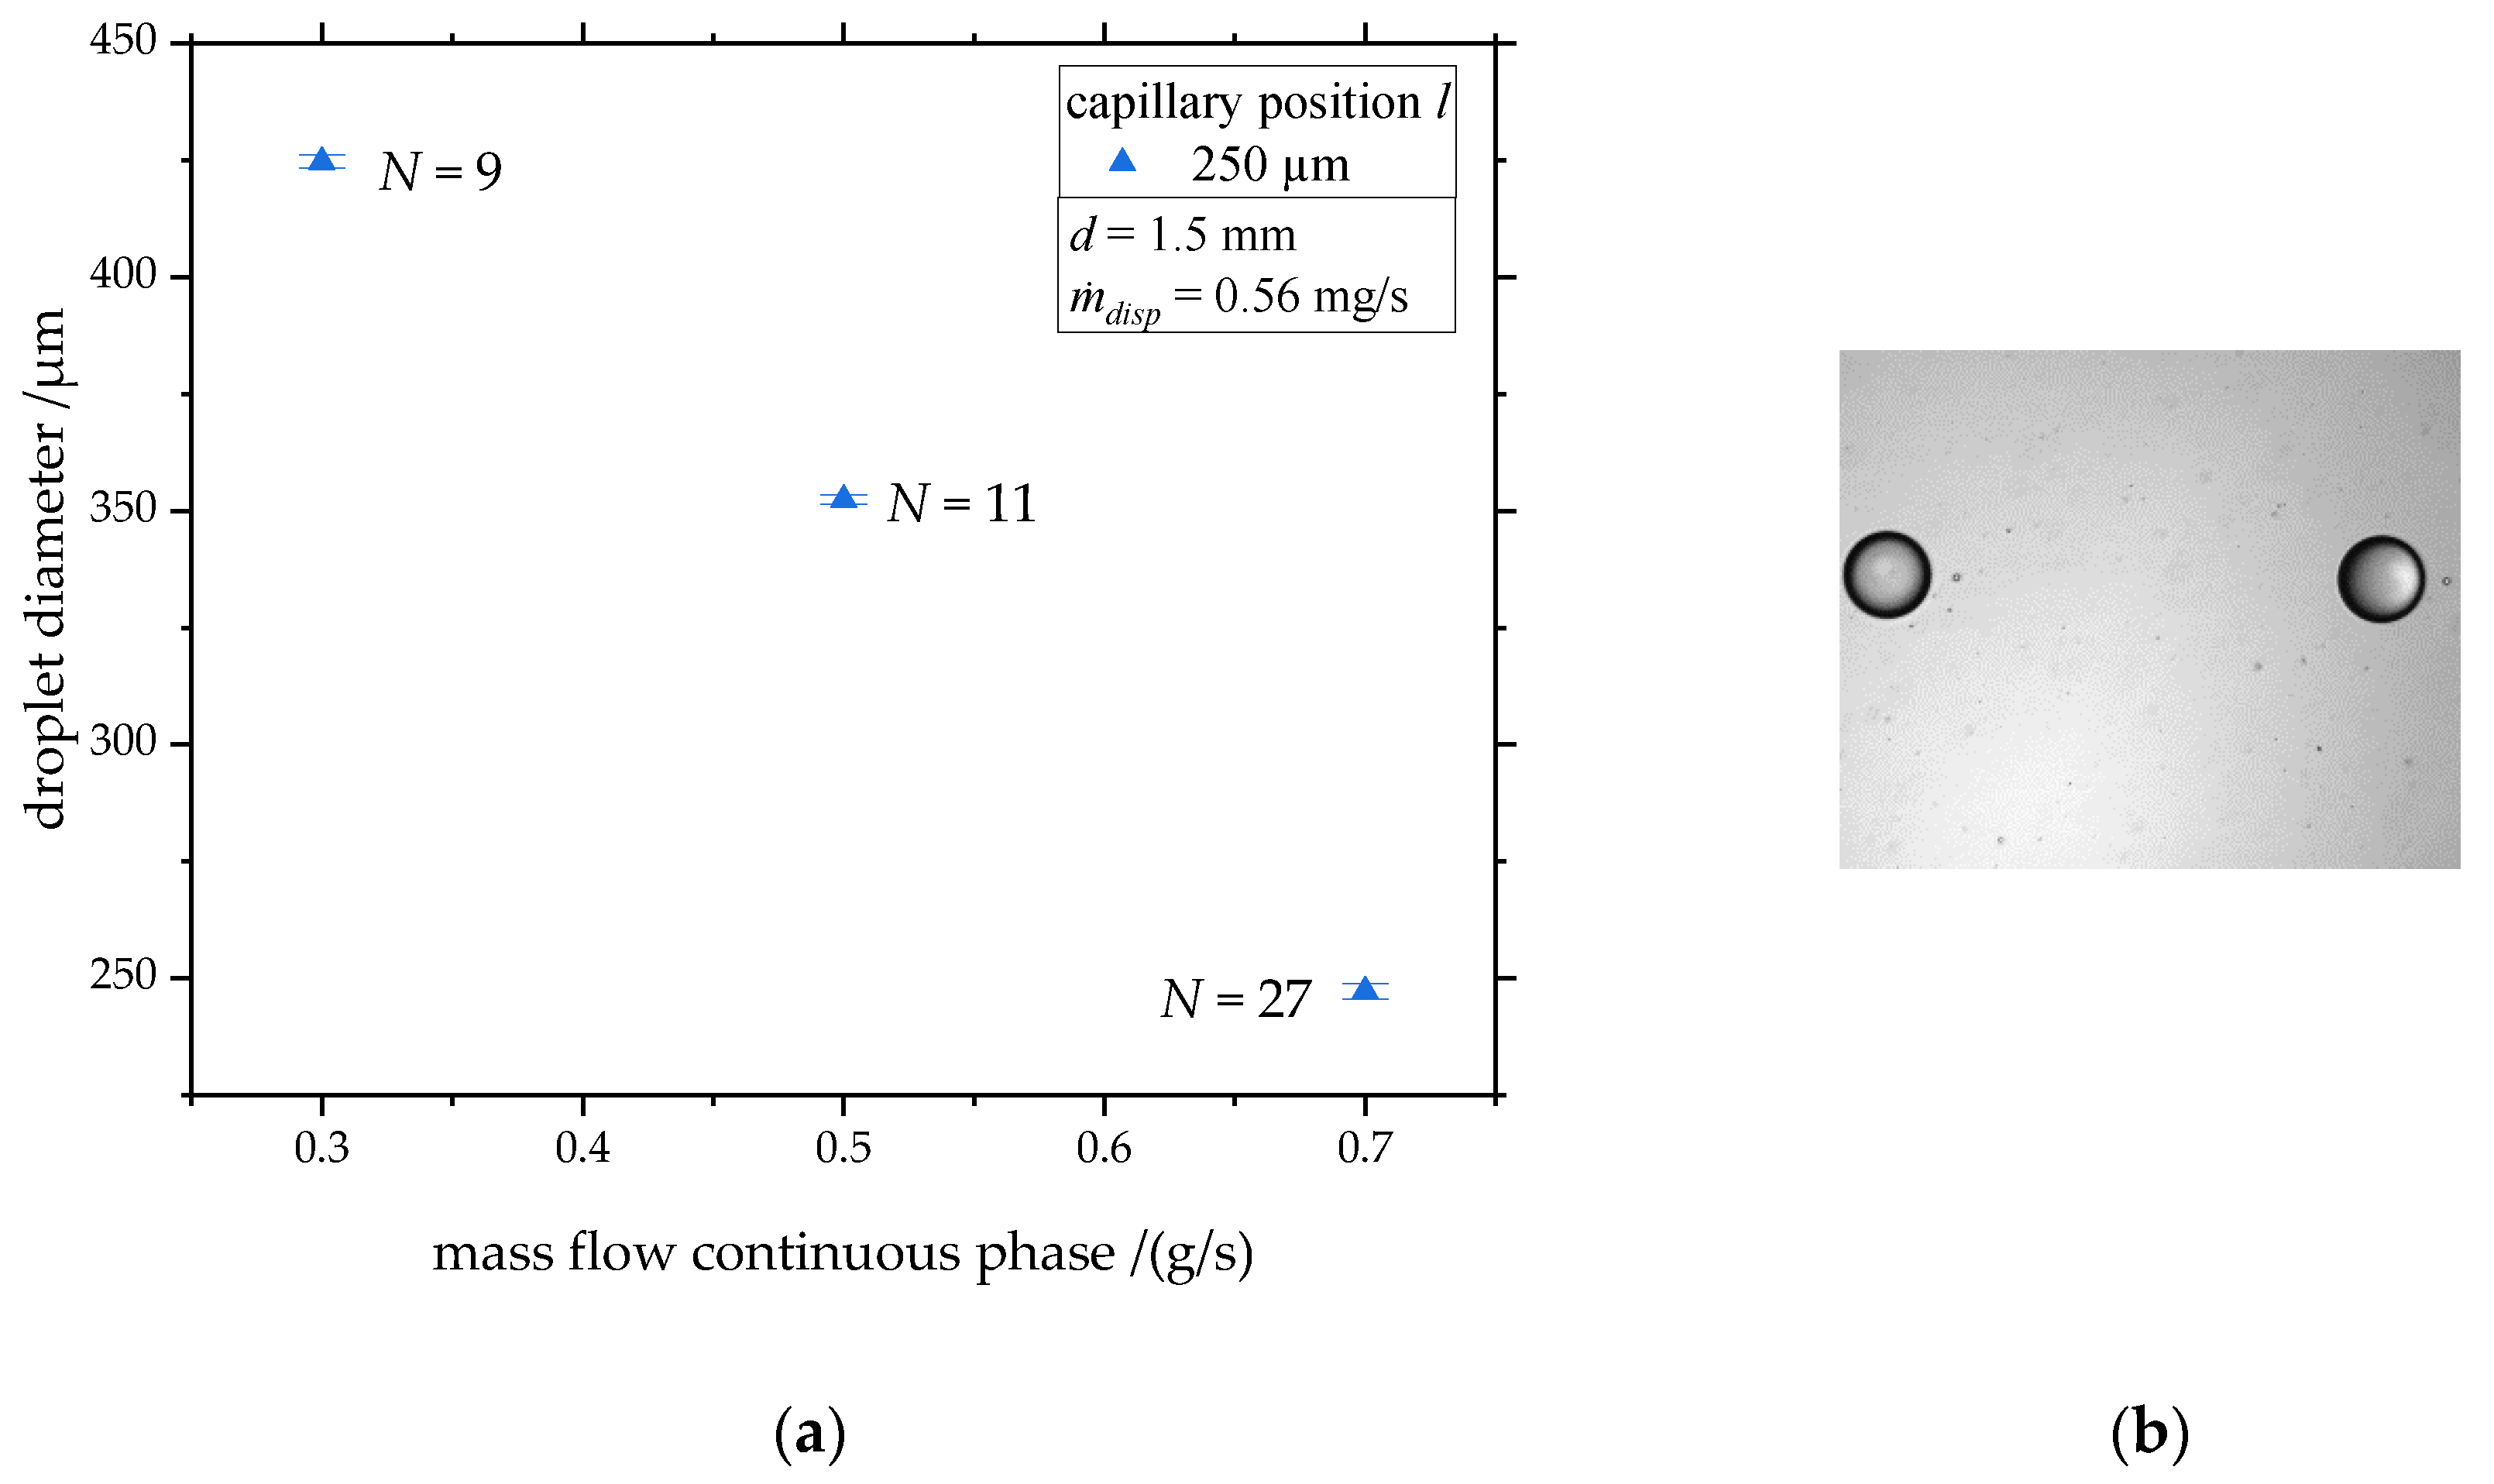
Figure 6a illustrates the influence of the mass flow of the continuous phase on the droplet diameter. The orifice in the droplet generator had a diameter of 1.5 mm and the tip of the capillary was positioned in a distance of to the exit of the orifice. The mass flow of the disperse oil phase was set to a constant value of 0.56 mg/s. The produced droplets had a diameter of 450 µm at a mass flow of 0.3 g/s, decreasing reciprocal when increasing the mass flow. A droplet diameter of 250 µm was achieved at a mass flow of 0.7 g/s. Furthermore, it can be noticed that the number of detected droplets N within the set of 100 images is increasing with growing mass flow of the continuous phase as the droplet production frequency is increasing. Figure 6b illustrates that the produced droplets have very small droplet diameter variation.
In conclusion, the hypothesis on the influence of the mass flow of the continuous phase can be confirmed. Duxenneuner [34] and Cramer et al. [33] have shown similar behavior when using a water-in-oil-emulsion. Cramer et al. [33] have also presented that the droplet formation time and consequently the droplet production frequency grows with increasing mass flow of the continuous phase.
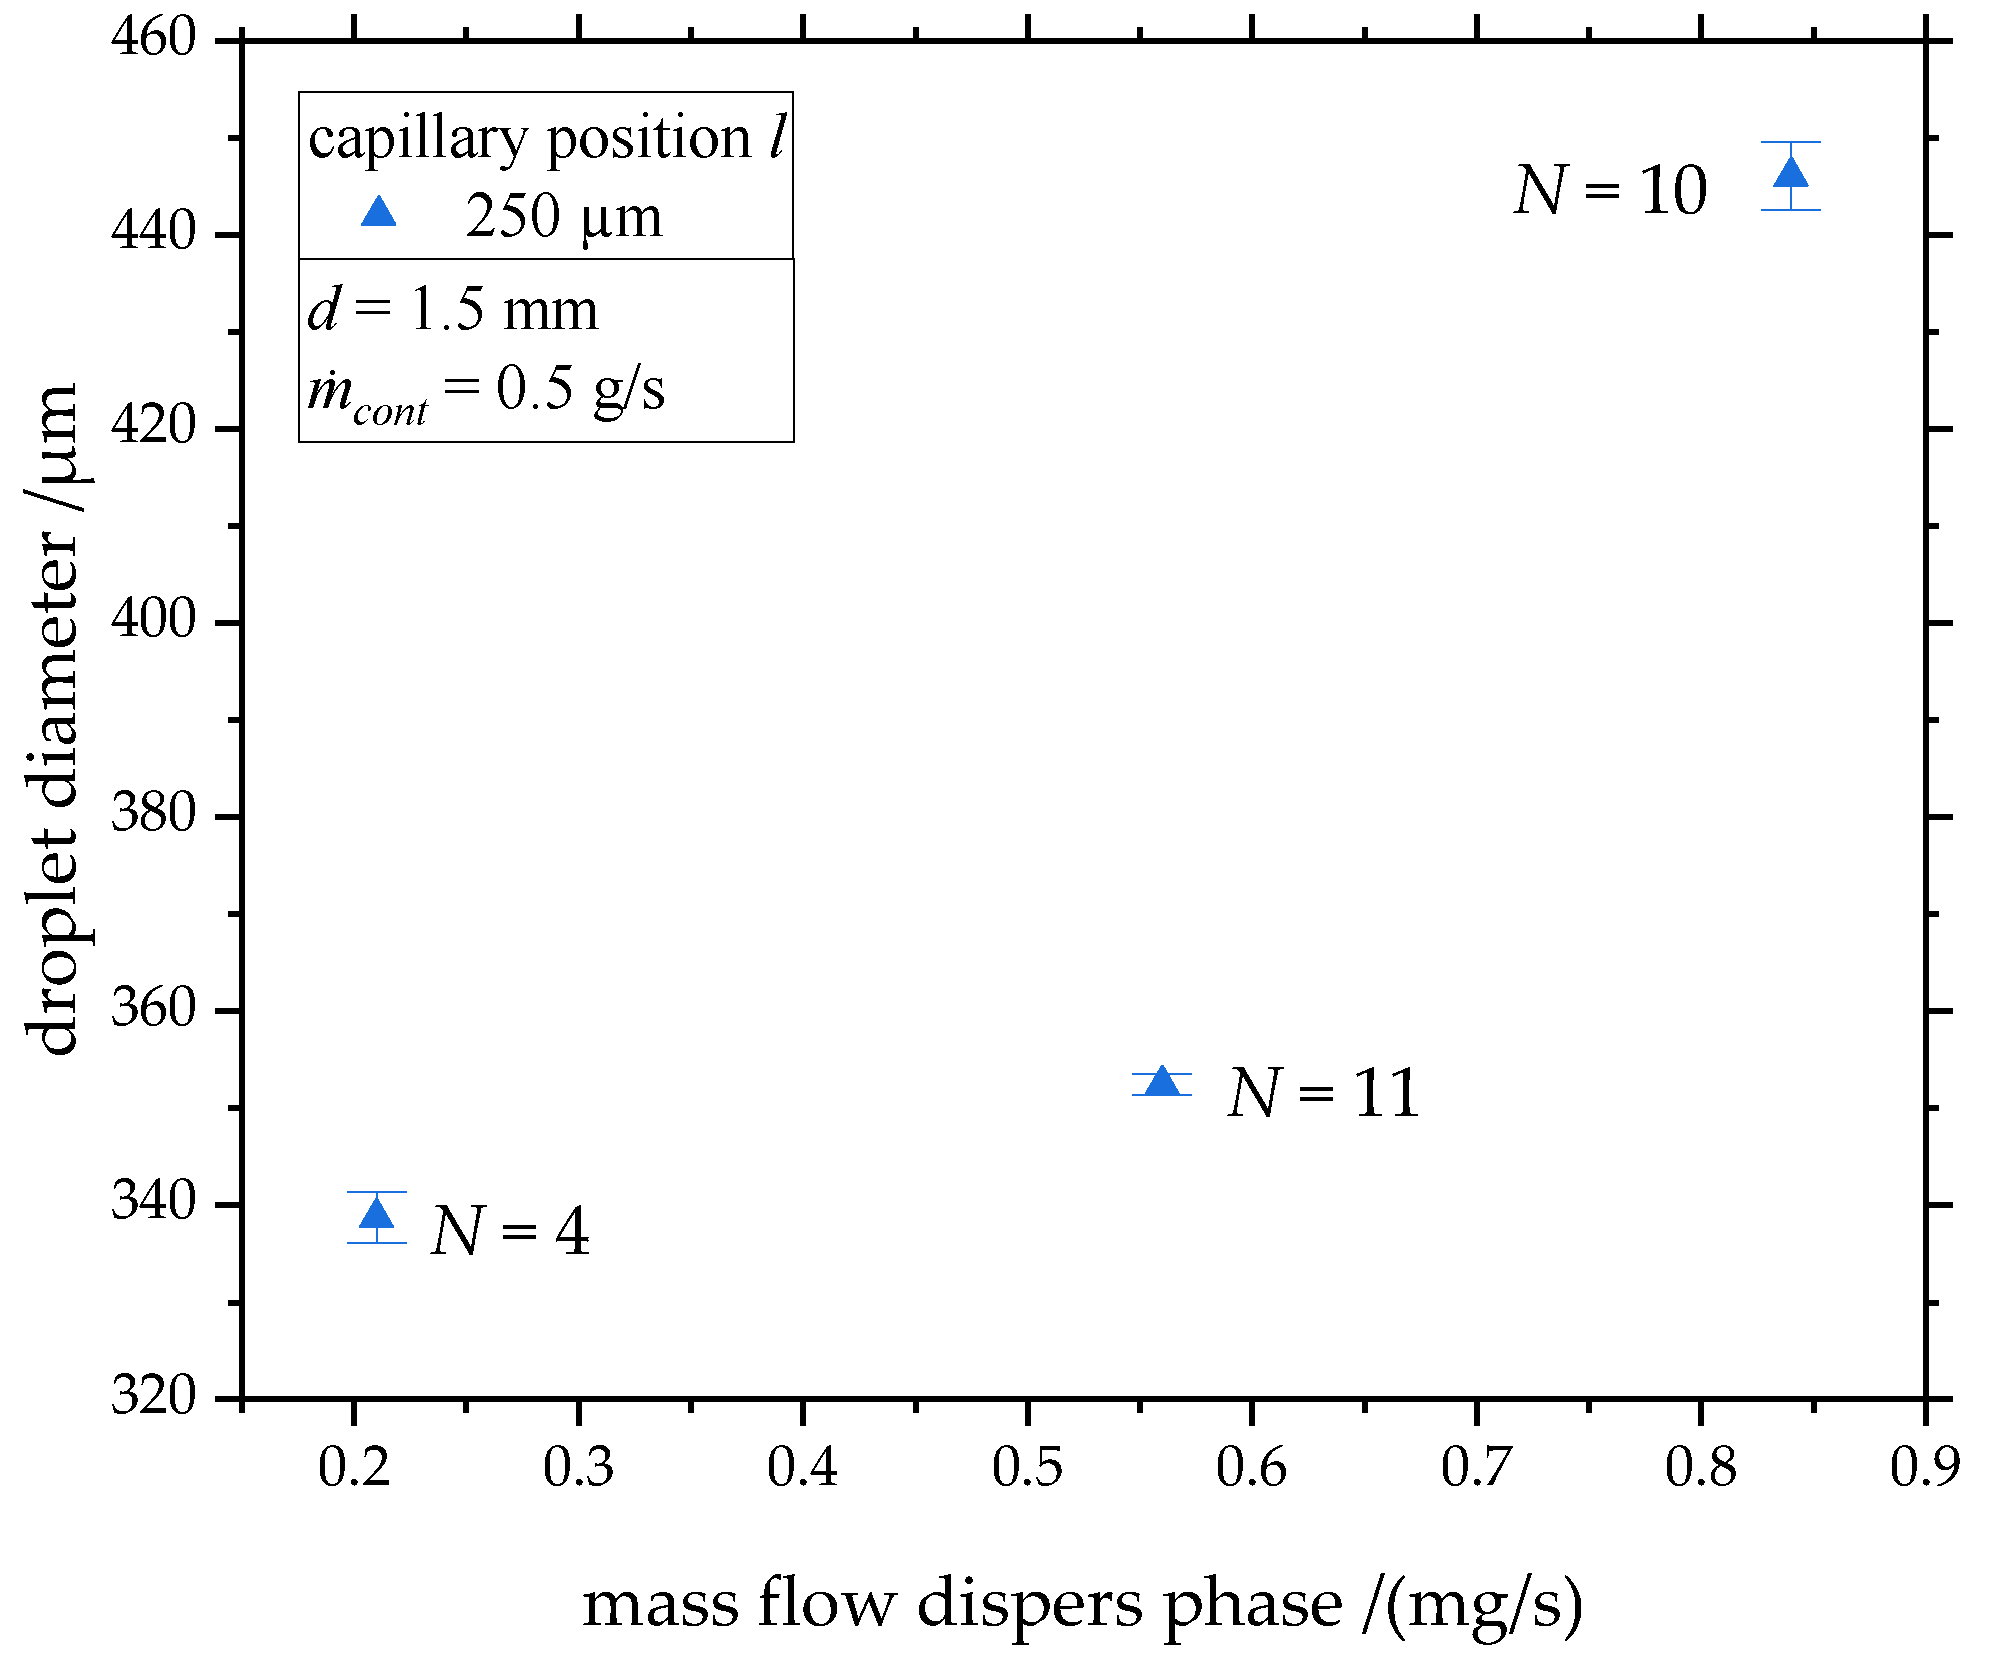
The influence of the mass flow of the disperse phase on the droplet diameter is presented in Figure 7. In the example shown here, the orifice in the droplet generator had a diameter of 1.5 mm and the tip of the capillary was positioned at a distance of to the exit of the orifice. The mass flow of the continuous phase was constant at 0.5 g/s. A mass flow of resulted in droplets with a diameter of 338 µm. When increasing the mass flow to , droplets with a diameter of 352 µm were produced. Further increasing the mass flow to lead to an exponential growth of the droplet diameter to 446 µm.
In conclusion, the hypotheses on the influence of the mass flow rate of the disperse phase flow can be confirmed. Monodisperse droplets of target sizes could be produced.
Droplets in microfluidic devices can either be produced in the dripping or in the jetting regime. At low flow rates, the interfacial tension forms droplets at the tip. At higher flow rates, the inertia forces exceed the interfacial tension and a jet is formed which subsequently breaks up due to Rayleigh–Plateau-Instabilities. The transition can either be driven by the flow of the continuous or the disperse phase [30]. According to Utada et al. [36], the transition from dripping to jetting should take place when the sum of the Weber Number and the Capillary number is about one, while dripping is found for .
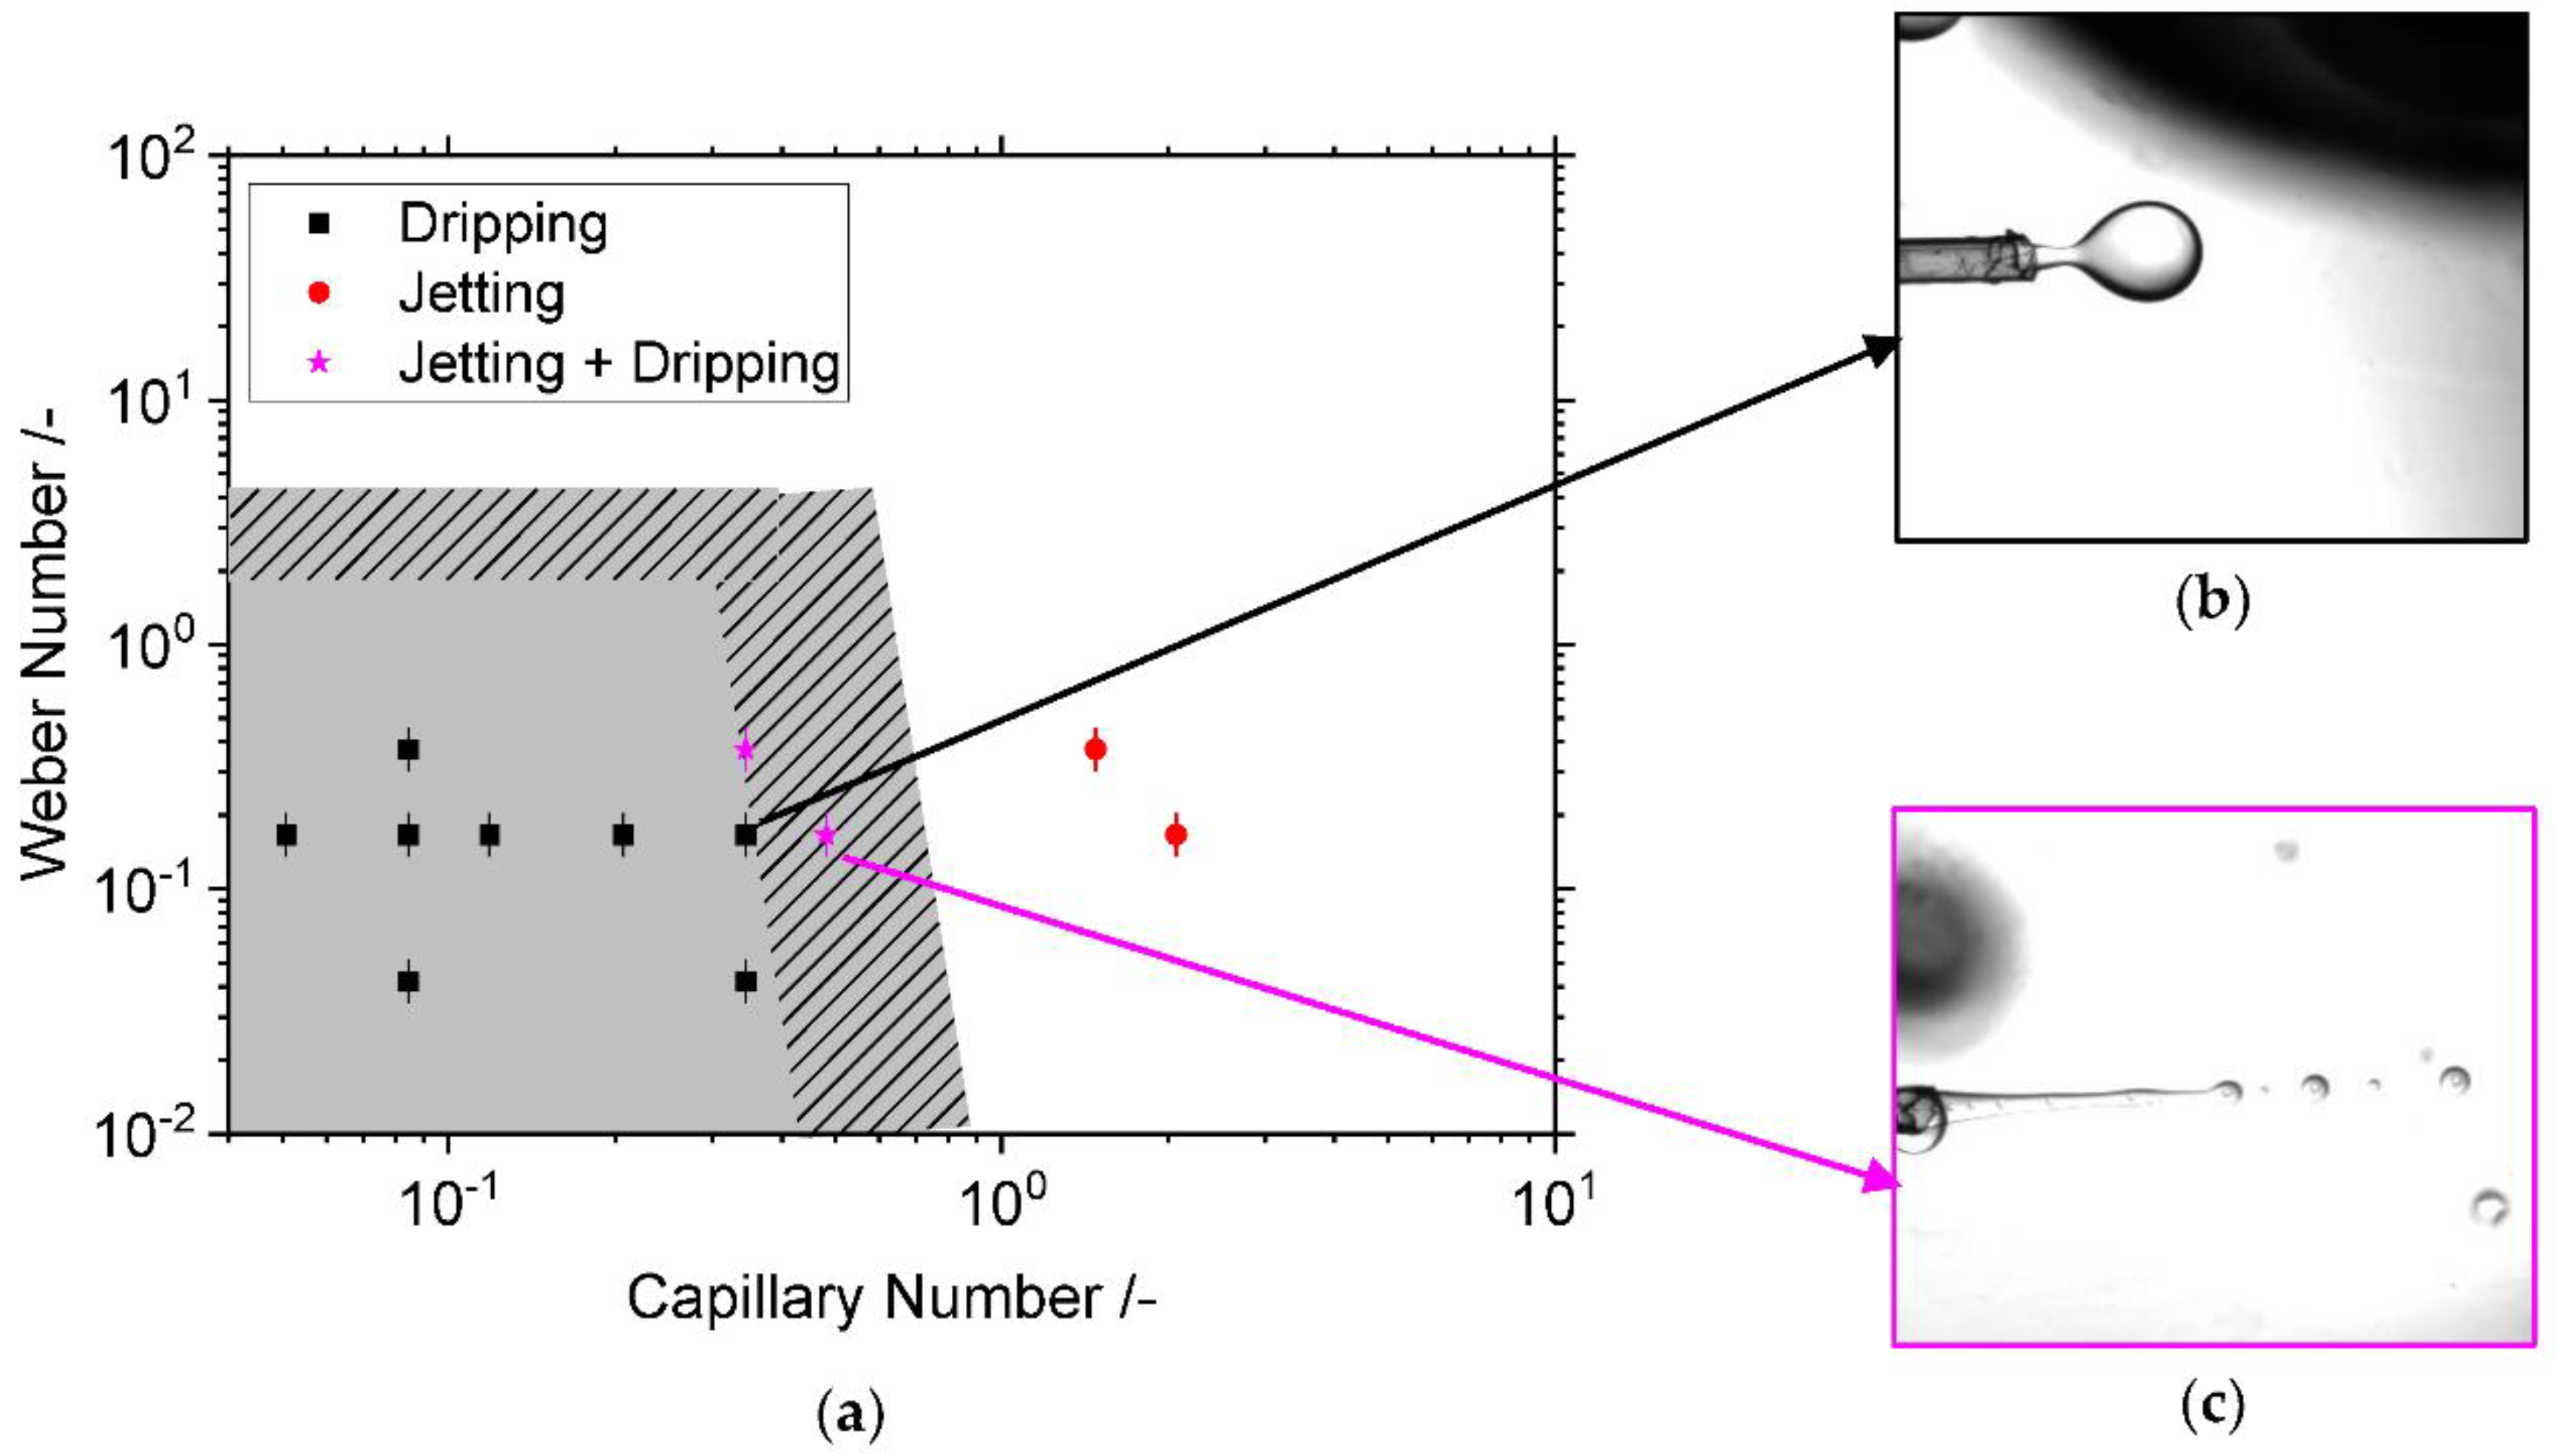
Figure 8 presents the influence of the Capillary Number Ca of the outer flow as well as the influence of the Weber Number We of the inner flow on the droplet detachment behavior. The results indicate that dripping is found for . What stands out in this figure is that there are process conditions in which sometimes dripping, and sometimes jetting, was present. This mixed behavior was detected for and , whereas jetting was observed for . An exemplary picture of the jetting regime is shown in Figure 8c.
The findings agree well with [30]. The grey crosshatched area in Figure 8 illustrated the transition regime proposed by Utada et al. [30]. Process conditions that should lead to dripping are colored in grey. An exemplary picture of droplet generation in the dripping regime is shown in Figure 8b. Cramer et al. [33] have also shown that the transition conditions depend on whether the velocity of the continuous phase is increased in order to achieve the transition from dripping to jetting, or whether inversely the velocity of the continuous phase is decreased to achieve the transition from jetting to dripping. As the velocity of the continuous and the disperse phase were not altered within a standardized procedure, this may have caused the blurred transition point from dripping to jetting in this investigation. The transient character of the emerging jet may also have caused a spontaneous change of the droplet detachment behavior. Process conditions close to the transition point should be avoided, as more satellite droplets are produced [33], which are unwanted in this application. The satellite droplets are shown in Figure 8c.
3.3. Reinjection of the Produced Emulsion in Front of a Scaled Disruption Unit
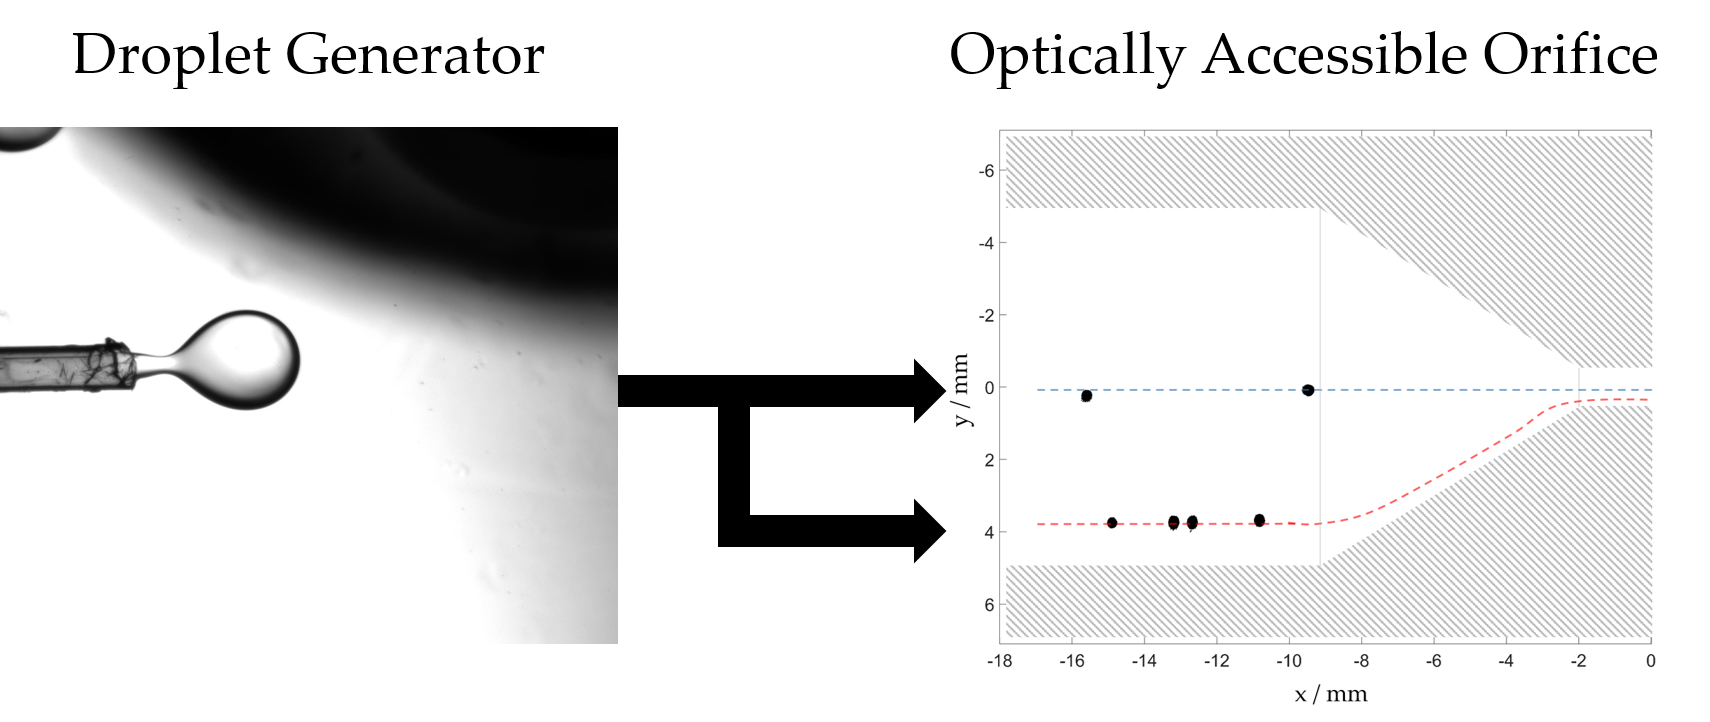
The produced droplets were reintroduced in front of the high-pressure disruption unit (Figure 2g) equipped with an orifice-type constriction. The droplets were analyzed using the µ-PIV double frame camera according to the procedure described in Section 2.2. The droplets leave the capillary separated from each other, which prevents the drops from affecting each other. The velocity of the injected droplets can be estimated from the displacement between the double pictures. Figure 9 shows the displacement of droplets at an average velocity of the surrounding fluid of on the droplet trajectory (a) and at velocity . When estimating the velocity from the displacement of the droplets between the double frame pictures and comparing it with the velocity field which was measured with a µ-PIV, it can be determined that the droplets accelerated to the velocity of the surrounding flow of the continuous phase if the surrounding continuous phase flows with a velocity of (Figure 9a). When comparing the droplet velocity at an average velocity of the continuous phase of in Figure 9b, it can be noticed that the droplets only reach about 70% of the velocity of the surrounding continuous phase before entering the conical inlet of the disruption unit. Possibly, the capillary which is used to reinject the pre-emulsion in front of the disruption unit influenced the flow at higher velocities of the continuous phase. That may cause lower stresses on the droplets if they do not completely accelerate to the velocity of the surrounding fluid in the conical inlet of the disruption unit.
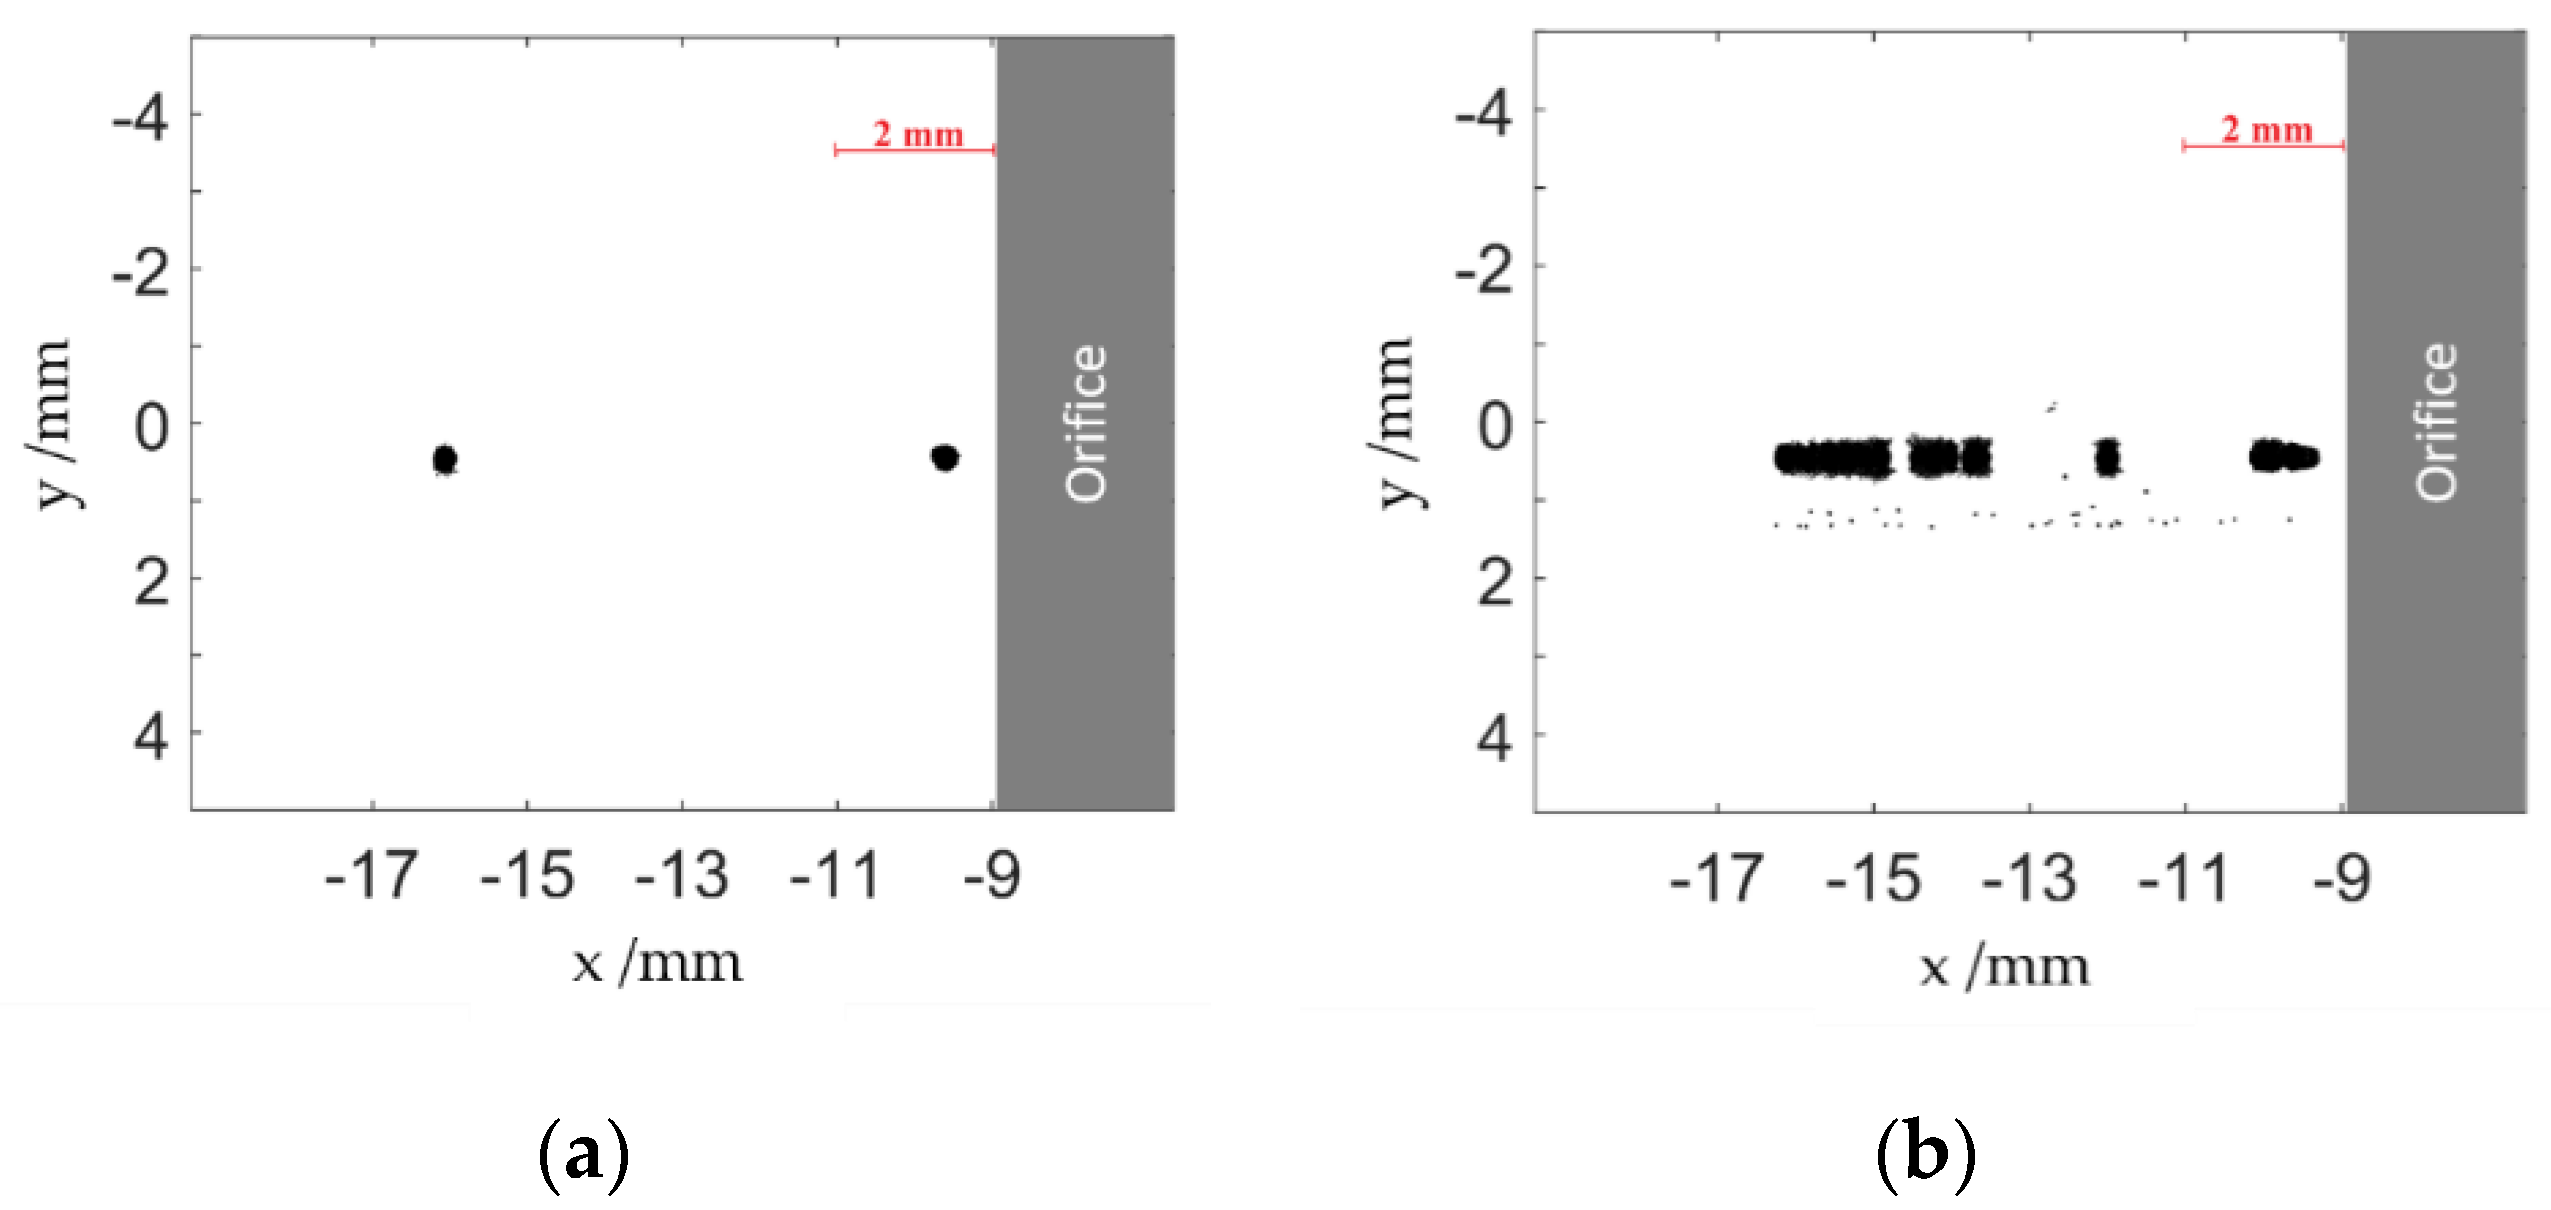
Figure 10b shows the superimposition of 27 snapshots. It illustrates that the droplets follow the trajectory with a very small variance. The blurry edges of the droplets were caused by a reflection of the emitted light on the acrylic glass cover plate. The small variance in droplet diameter is probably caused by droplets being not perfectly in the focus plane, as droplets which are off focus appear larger than they are. The droplets all follow a trajectory close to the centerline. No variance in the droplet trajectory was visible. We can therefore assume that all droplets will be exposed to an equal stress history when passing the orifice. In Figure 10b droplets that are significantly smaller surround the larger, injected droplets. These are most probably satellite droplets. As they can easily be distinguished from the bigger droplets by the evaluation algorithm, they do not interfere with our target of being able to follow deformation and breakup of the bigger droplets downstream. Figure 10c shows a superimposition of droplets which were injected on the center line of the flow channel, and droplets which were injected close to the wall. The dashed lines represent the expected droplet trajectories when passing through the non-optically accessible conical inlet of the scaled HPH disruption unit. Droplets which flow close to the wall on the red dashed trajectory are expected to be more deformed compared to droplets which flow on the center axis as the shear stress and elongation strain is higher closer to the wall in a conical inlet [6].
4. Discussion
In this study an external pressure stable droplet generator was developed that allows the production of a pre-emulsion with a tight droplet size distribution. The produced droplets could be reinjected separately from each other in front of a scaled high-pressure homogenizer disruption unit. It was possible to control the trajectory these droplets followed when approaching the disruption unit. Droplets on the centerline trajectory will then be exposed to stress histories totally different to those on a trajectory close to the wall.
This generator was operated in accordance to microfluidic droplet generating systems. It could be demonstrated that droplets in the dripping and the jetting regime could be produced. The process parameters, with which the droplet size can be adjusted, were identified and compared with known knowledge from the literature of microfluidic droplet generation.
Flow conditions to produce an oil-in-water emulsion with monodisperse droplets in the diameter range of 200 µm to 500 µm were identified. For size control, a live droplet diameter analysis was established. The determined standard deviation of the droplet diameters was in the range of 2 µm, which is equal to a deviation of 2.5 pixels in the raw image. The droplet diameter can be decreased by accelerating the continuous phase through an increase in the mass flow or a reduction in the orifice diameter, which agrees well with previous studies.
The following limits of the experimental setup proposed were detected:
- Orifice diameter : Due to production inaccuracies, no even jet was formed if the orifice diameter was smaller than 1 mm, resulting in larger droplets.
- Limit of the disperse phase fraction: The disperse phase fraction is connected to the flow conditions in the droplet generator, resulting in decreasing disperse phase fractions when increasing the total mass flow over the optically accessible disruption unit. This limitation can be solved by numbering up the capillary tips.
- Droplet velocity does not reach the velocity of the surrounding fluid: The droplets do not completely accelerate to the velocity of the continuous phase at higher velocities in the inlet channel of the disruption unit. This may result in lower stresses on the droplets. It is expected, however, that this influence is moderate as the fluid is accelerated by a factor of 100 in the disruption unit which should eliminate the velocity deviation of the droplets.
Despite its limitations, the study presents a pressure stable droplet generator that allows the production of monodisperse droplets in a range of 200 µm to 500 µm on defined trajectories of a high-pressure homogenizing unit. The droplet size can be controlled by altering the flow conditions, which allows a precise adjustment of the We Number of the droplet breakup in the optically accessible orifice. The produced droplets can be reintroduced in front of a scaled orifice with a small trajectory variation. This setup will be used in future research to investigate the influence of the droplet size and stress history on its deformation and breakup.
Author Contributions
Conceptualization, F.J.P., H.P.K., and M.F.; software, F.J.P. and T.D.; formal analysis, F.J.P. and T.D.; investigation, T.D.; writing—original draft preparation, F.J.P.; writing—review and editing, H.P.K. and T.D.; visualization, F.J.P. and T.D. All authors have read and agreed to the published version of the manuscript.
Funding
This research was funded by the German Research Foundation (DFG), grant number 265685259.
Acknowledgments
The authors thank Thomas Hufnagel (Hochschule Mannheim-University of Applied Sciences) and Julian Deuerlinger (Hochschule Mannheim-University of Applied Sciences) for 3D printing the orifices. Furthermore, the authors thank the IOI Oleo GmbH for providing the oil. The authors also thank Peter Walzel for fruitful discussions on the concept of this study.
Conflicts of Interest
The authors declare no conflict of interest. The funders had no role in the design of the study; in the collection, analyses, or interpretation of data; in the writing of the manuscript, or in the decision to publish the results.
References
- Gaulin, A. Appareil et Procédé pour la Stabilisation du Lait. Patent Brecet 295,596, 23 May 1899. [Google Scholar]
- Walstra, P. Formation of Emulsions. In P. Becher: Encyclopedia of Emulsion Technology, Volume 1 Basic Theory; Mieth, G., Ed.; Marcel Dekker: New York, NY, USA, 1983. [Google Scholar]
- Schuchmann, H.P. Advances in Hydrodynamic Pressure Processing for Enhancing Emulsification and Dispersion. In Innovative Food Processing Technologies: Extraction, Separation, Component Modification and Process Intensification, 1st ed.; Knoerzer, K., Juliano, P., Smithers, G., Eds.; Woodhead Publishing: Sawston, UK, 2016; pp. 387–412. ISBN 978-0-08-100294-0. [Google Scholar]
- Walstra, P.; Smulders, P.E.A. Chapter 2. Emulsion Formation. In Modern Aspects of Emulsion Science; Binks, B.P., Ed.; Royal Society of Chemistry: Cambridge, UK, 1998; pp. 56–99. ISBN 978-0-85404-439-9. [Google Scholar]
- Schlender, M.; Minke, K.; Spiegel, B.; Schuchmann, H.P. High-pressure double stage homogenization processes: Influences of plant setup on oil droplet size. Chem. Eng. Sci. 2015, 131, 162–171. [Google Scholar] [CrossRef]
- Bisten, A.; Rudolf, D.; Karbstein, H.P. Comparison of flow patterns and droplet deformations of modified sharp-edged and conical orifices during high-pressure homogenisation using µPIV. Microfluid. Nanofluid. 2018, 22, 607. [Google Scholar] [CrossRef]
- Innings, F.; Trägårdh, C. Visualization of the Drop Deformation and Break-Up Process in a High Pressure Homogenizer. Chem. Eng. Technol. 2005, 28, 882–891. [Google Scholar] [CrossRef]
- Innings, F.; Fuchs, L.; Trägårdh, C. Theoretical and experimental analyses of drop deformation and break-up in a scale model of a high-pressure homogenizer. J. Food Eng. 2011, 103, 21–28. [Google Scholar] [CrossRef]
- Kelemen, K.; Gepperth, S.; Koch, R.; Bauer, H.-J.; Schuchmann, H.P. On the visualization of droplet deformation and breakup during high-pressure homogenization. Microfluid. Nanofluid. 2015, 19, 1139–1158. [Google Scholar] [CrossRef]
- Wieth, L.; Kelemen, K.; Braun, S.; Koch, R.; Bauer, H.-J.; Schuchmann, H.P. Smoothed Particle Hydrodynamics (SPH) simulation of a high-pressure homogenization process. Microfluid. Nanofluid. 2016, 20, 5011. [Google Scholar] [CrossRef]
- Håkansson, A. Scale-down failed—Dissimilarities between high-pressure homogenizers of different scales due to failed mechanistic matching. J. Food Eng. 2017, 195, 31–39. [Google Scholar] [CrossRef]
- Håkansson, A.; Innings, F.; Revstedt, J.; Trägårdh, C.; Bergenståhl, B. Estimation of turbulent fragmenting forces in a high-pressure homogenizer from computational fluid dynamics. Chem. Eng. Sci. 2012, 75, 309–317. [Google Scholar] [CrossRef]
- Håkansson, A.; Innings, F.; Trägårdh, C.; Bergenståhl, B. A high-pressure homogenization emulsification model—Improved emulsifier transport and hydrodynamic coupling. Chem. Eng. Sci. 2013, 91, 44–53. [Google Scholar] [CrossRef]
- Håkansson, A.; Trägårdh, C.; Bergenståhl, B. Dynamic simulation of emulsion formation in a high pressure homogenizer. Chem. Eng. Sci. 2009, 64, 2915–2925. [Google Scholar] [CrossRef]
- Håkansson, A.; Trägårdh, C.; Bergenståhl, B. Studying the effects of adsorption, recoalescence and fragmentation in a high pressure homogenizer using a dynamic simulation model. Food Hydrocoll. 2009, 23, 1177–1183. [Google Scholar] [CrossRef]
- Håkansson, A. Emulsion Formation by Homogenization: Current Understanding and Future Perspectives. Annu. Rev. Food Sci. Technol. 2019, 10, 239–258. [Google Scholar] [CrossRef] [PubMed]
- Håkansson, A. On the validity of different methods to estimate breakup frequency from single drop experiments. Chem. Eng. Sci. 2020, 115908. [Google Scholar] [CrossRef]
- Taylor, G.I. The formation of emulsions in definable fields of flow. Proc. R. Soc. A 1934, 146, 501–523. [Google Scholar]
- Grace, H.P. dispersion phenomena in high viscosity immiscible fluid systems and application of static mixers as dispersion devices in such systems. Chem. Eng. Commun. 1982, 14, 225–277. [Google Scholar] [CrossRef]
- Rayleigh, L. On The Instability of Jets. Proc. Lond. Math. Soc. 1878, 1, 4–13. [Google Scholar] [CrossRef] [Green Version]
- Tomotika, S. On the instability of a cylindrical thread of a viscous liquid surrounded by another viscous fluid. Proc. R. Soc. Lond. A 1935, 150, 322–337. [Google Scholar] [CrossRef]
- Kelemen, K.; Crowther, F.E.; Cierpka, C.; Hecht, L.L.; Kähler, C.J.; Schuchmann, H.P. Investigations on the characterization of laminar and transitional flow conditions after high pressure homogenization orifices. Microfluid. Nanofluid. 2015, 18, 599–612. [Google Scholar] [CrossRef]
- Håkansson, A.; Fuchs, L.; Innings, F.; Revstedt, J.; Trägårdh, C.; Bergenståhl, B. High resolution experimental measurement of turbulent flow field in a high pressure homogenizer model and its implications on turbulent drop fragmentation. Chem. Eng. Sci. 2011, 66, 1790–1801. [Google Scholar] [CrossRef]
- Innings, F.; Trägårdh, C. Analysis of the flow field in a high-pressure homogenizer. Exp. Therm. Fluid Sci. 2007, 32, 345–354. [Google Scholar] [CrossRef]
- Walzel, P. Advanteges and Limits in large Scale Modeling of Atomizers. In Proceedings of the 2nd International Conference on Liquid Atomization and Spray Systems: ICLASS-‘82, Madison, WI, USA, 20–24 June 1982; Crosby, E.J., Ed.; Department of Chemical Engineering-University of Wisconsin: Madison, WI, USA, 1982; pp. 187–194. [Google Scholar]
- Kolb, G.; Wagner, G.; Ulrich, J. Untersuchungen zum Aufbruch von Einzeltropfen in Dispergiereinheiten zur Emulsionsherstellung. Chem. Ing. Tech. 2001, 73, 80–83. [Google Scholar] [CrossRef]
- Budde, C.; Schaffner, D.; Walzel, P. Drop Breakup in Liquid-Liquid Dispersions at an Orifice Plate Observed in a Large-Scale Model. Chem. Eng. Technol. 2002, 25, 1164–1167. [Google Scholar] [CrossRef]
- Christopher, G.F.; Anna, S.L. Microfluidic methods for generating continuous droplet streams. J. Phys. D Appl. Phys. 2007, 40, R319–R336. [Google Scholar] [CrossRef]
- Vladisavljević, G.T.; Kobayashi, I.; Nakajima, M. Production of uniform droplets using membrane, microchannel and microfluidic emulsification devices. Microfluid. Nanofluid. 2012, 13, 151–178. [Google Scholar] [CrossRef] [Green Version]
- Utada, A.S.; Fernandez-Nieves, A.; Stone, H.A.; Weitz, D.A. Dripping to jetting transitions in coflowing liquid streams. Phys. Rev. Lett. 2007, 99, 94502. [Google Scholar] [CrossRef]
- Umbanhowar, P.B.; Prasad, V.; Weitz, D.A. Monodisperse Emulsion Generation via Drop Break off in a Coflowing Stream. Langmuir 2000, 16, 347–351. [Google Scholar] [CrossRef]
- Rayleigh, L., VI. On the capillary phenomena of jets. Proc. R. Soc. Lond. 1879, 29, 71–97. [Google Scholar] [CrossRef]
- Cramer, C.; Fischer, P.; Windhab, E.J. Drop formation in a co-flowing ambient fluid. Chem. Eng. Sci. 2004, 59, 3045–3058. [Google Scholar] [CrossRef]
- Duxenneuner, M.R. Visualization, Design, and Scaling of Drop Generation in Coflow Processes; ETH Zurich: Zürich, Switzerland, 2009. [Google Scholar]
- Zhang, D.F.; Stone, H.A. Drop formation in viscous flows at a vertical capillary tube. Phys. Fluids 1997, 9, 2234–2242. [Google Scholar] [CrossRef] [Green Version]
- Utada, A.S.; Chu, L.-Y.; Fernandez-Nieves, A.; Link, D.R.; Holtze, C.; Weitz, D.A. Dripping, Jetting, Drops, and Wetting: The Magic of Microfluidics. Mrs Bull. 2007, 32, 702–708. [Google Scholar] [CrossRef] [Green Version]
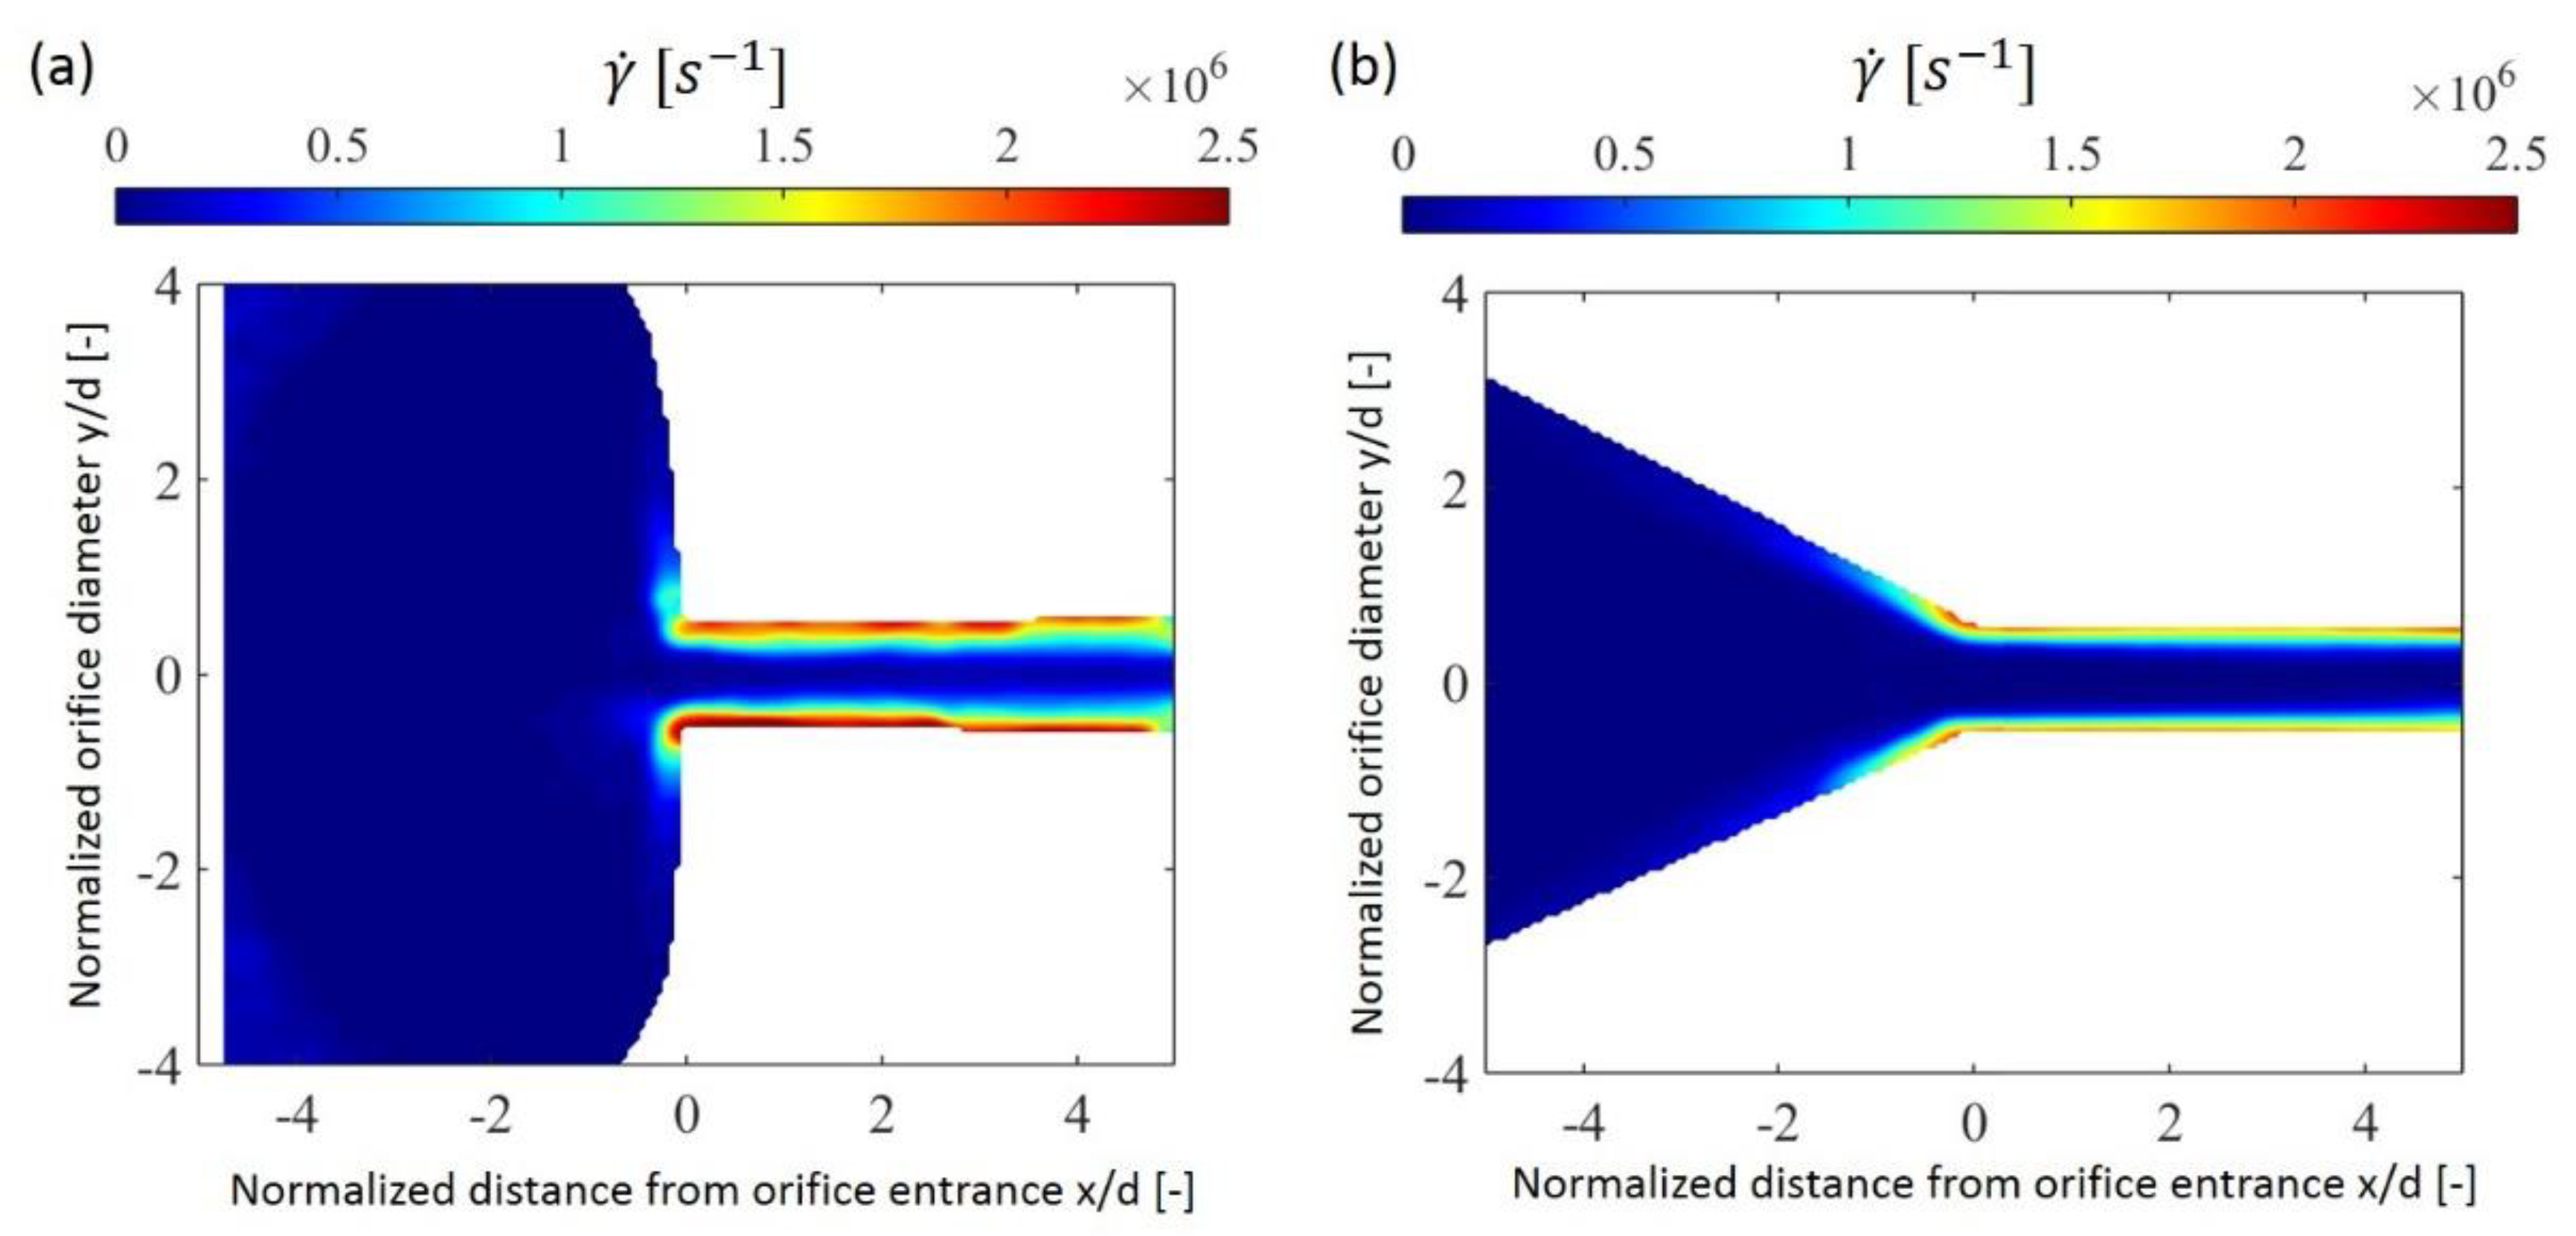
Figure 1.
Shear stresses in an optically accessible orifice with a conical (a) and sharp-edge (b) inlet geometry. The Figure was taken from Bisten et al. [6].
Figure 1.
Shear stresses in an optically accessible orifice with a conical (a) and sharp-edge (b) inlet geometry. The Figure was taken from Bisten et al. [6].

Figure 2.
Experimental setup with pressurized gas cylinder (a), pressure vessel (b), displacement pump (c), droplet generator (d), camera with back lighting (e), collecting vessel (f), optically accessible orifice with positioning capillary (g), three-way valve (h) and shut-off valve (i).
Figure 2.
Experimental setup with pressurized gas cylinder (a), pressure vessel (b), displacement pump (c), droplet generator (d), camera with back lighting (e), collecting vessel (f), optically accessible orifice with positioning capillary (g), three-way valve (h) and shut-off valve (i).

Figure 3.
Schematic representation of the droplet generator with steel and fused silica capillary, orifice with diameter d and flow channel with height D. The capillary position is represented by the parameter l.
Figure 3.
Schematic representation of the droplet generator with steel and fused silica capillary, orifice with diameter d and flow channel with height D. The capillary position is represented by the parameter l.

Figure 4.
Example for the image processing procedure with a raw image (a), binary image with filled holes (b) and detected circles in the binary image (c).
Figure 4.
Example for the image processing procedure with a raw image (a), binary image with filled holes (b) and detected circles in the binary image (c).

Figure 5.
Influence of the orifice diameter on the droplet diameter. The Reynolds Number Re in the orifice is given at the measurement points. N represents the number of droplets that were found in the set of 100 images.
Figure 5.
Influence of the orifice diameter on the droplet diameter. The Reynolds Number Re in the orifice is given at the measurement points. N represents the number of droplets that were found in the set of 100 images.
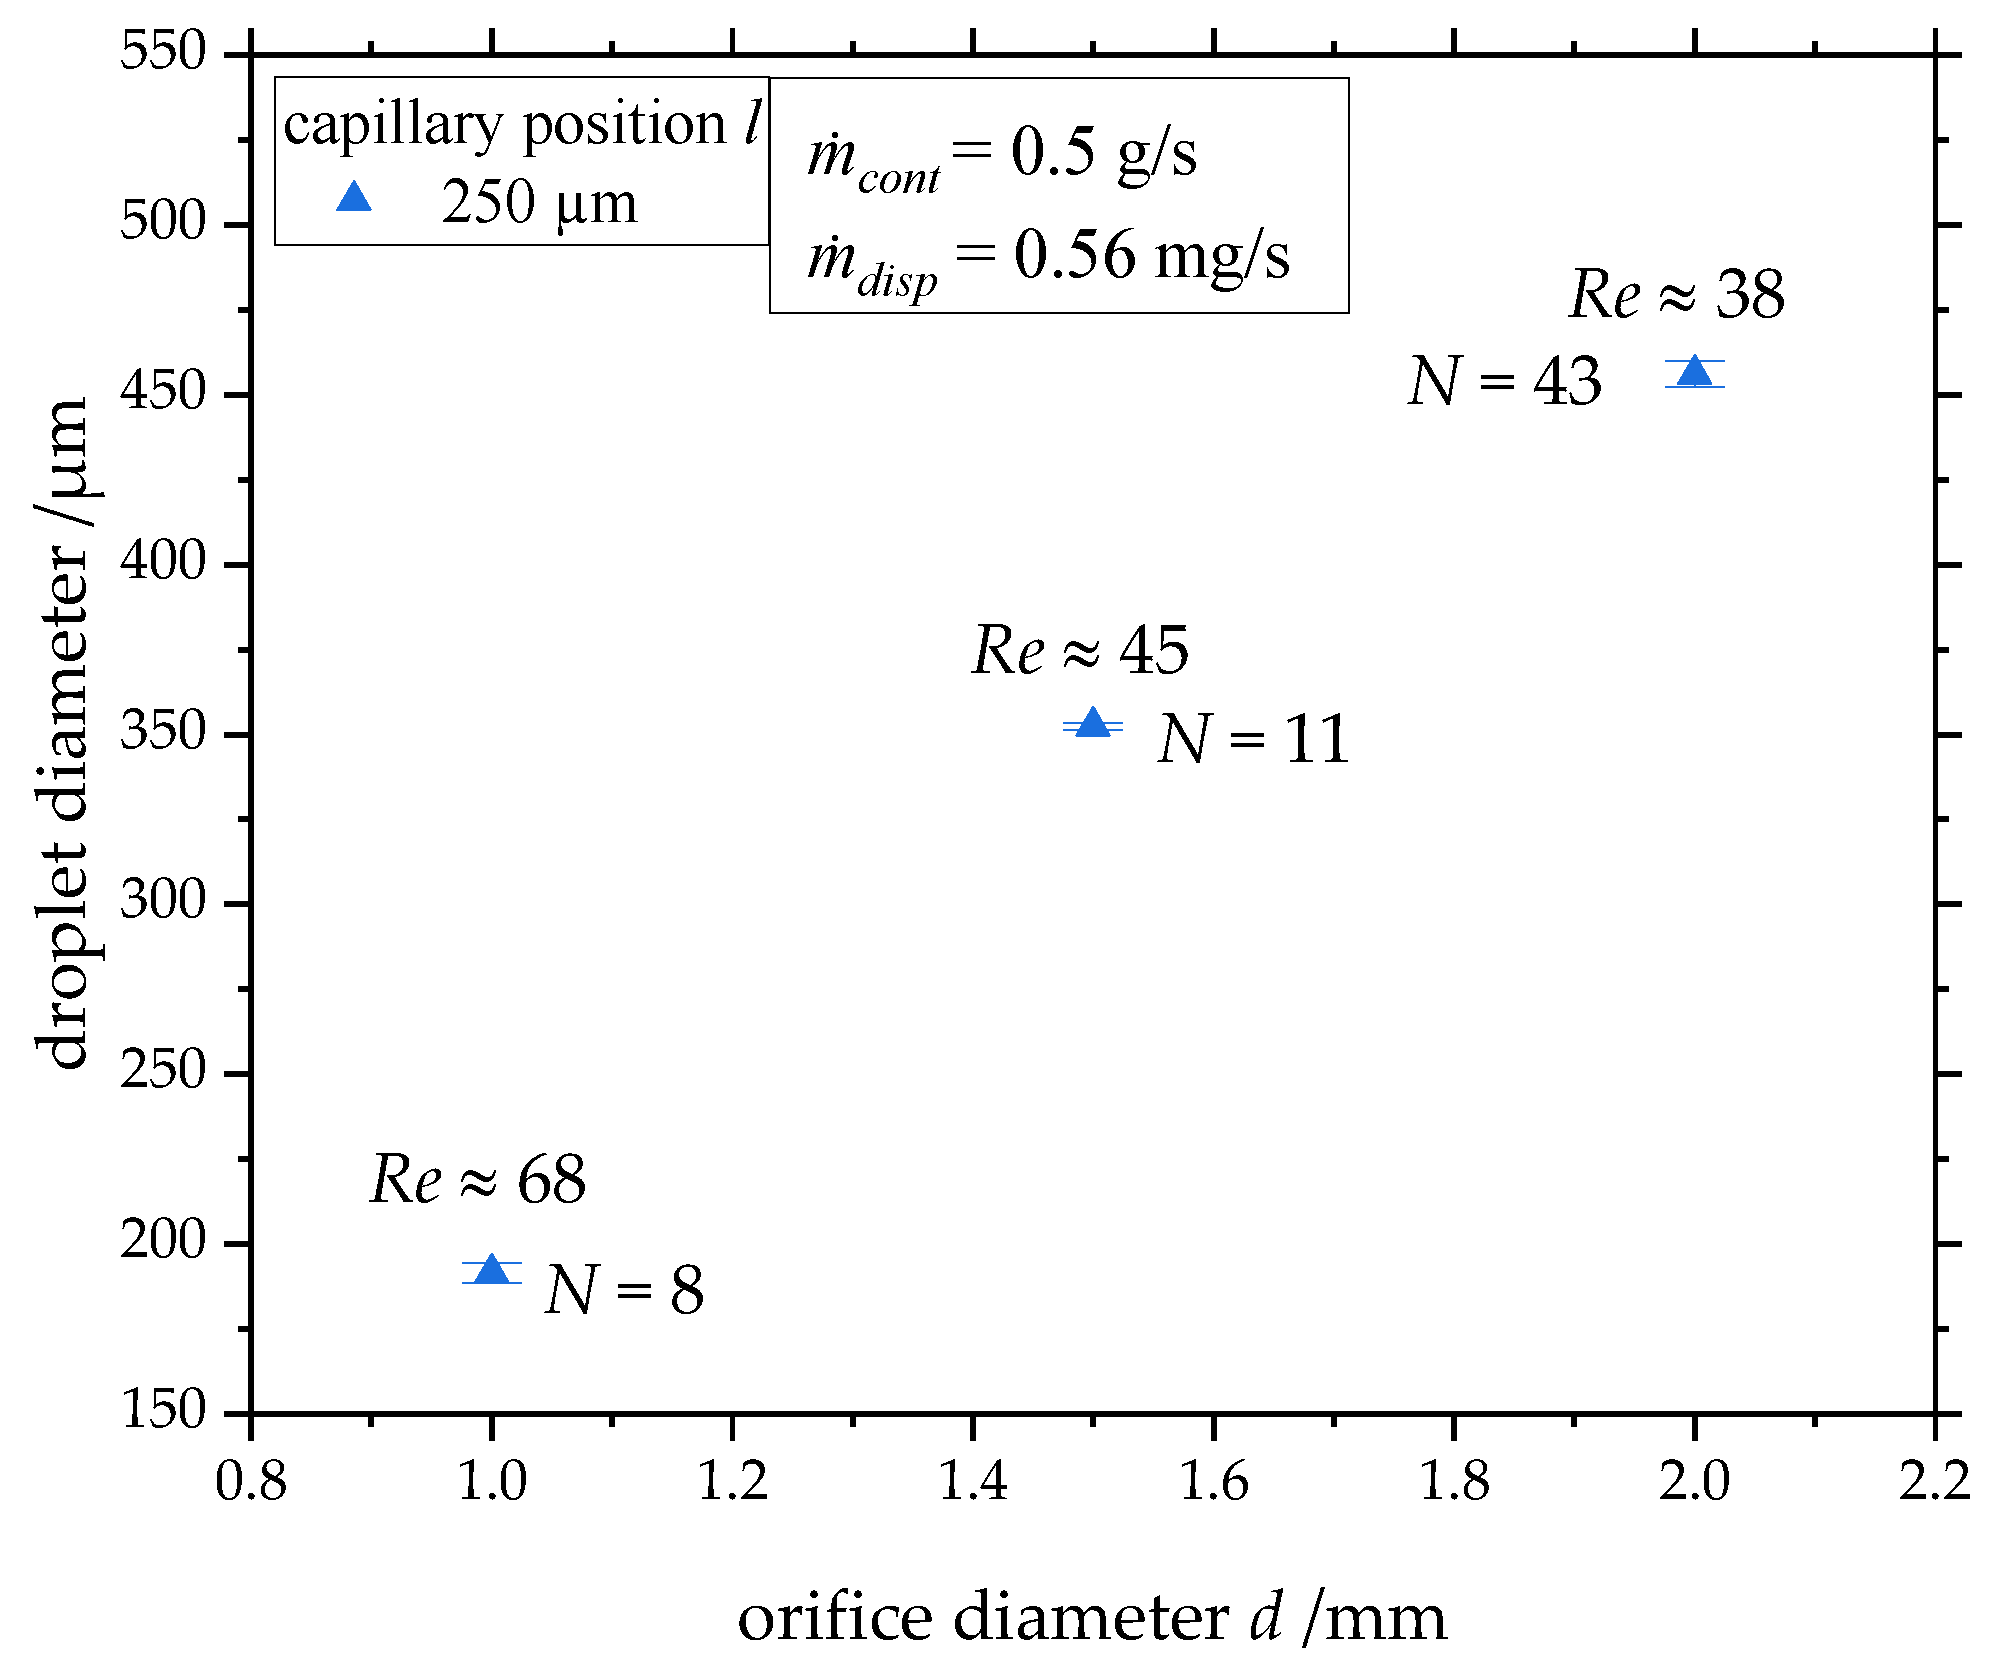
Figure 6.
(a) Droplet diameter as a function of the mass flow of the continuous phase. The diameter of the orifice was 1.5 mm and the tip of the capillary was positioned in a distance of 250 µm from the orifice exit. The mass flow of the disperse phase was set constant to . N represents the number of droplets that were found in the set of 100 images. (b) Exemplary raw image of two droplets with equal diameter.

Figure 7.
Droplet diameter as a function of the mass flow of the disperse phase. The diameter of the orifice was 1.5 mm and the tip of the capillary was positioned at a distance of 250 µm from the orifice exit. The mass flow of the continuous phase was set constant to . N represents the number of droplets that were found in the set of 100 images.

Figure 8.
(a) Dripping and jetting droplet detachment mechanisms depending on the Capillary and the Weber Number. The grey crosshatched area illustrates the process conditions where both mechanisms can be present [30]. The grey colored area represents the process conditions where only dripping is expected according to [30]. (b) Raw picture of dripping regime at and . (c) Raw picture of jetting regime at and .

Figure 9.
(a) Superimposition of a double frame picture which was taken with delay of . The average velocity on the trajectory of the droplets was . (b) Superimposition of a double frame picture which was taken with delay of . The average velocity on the trajectory of the droplets was . The x-axis shows the distance from the orifice exit (cf. Figure 10c).
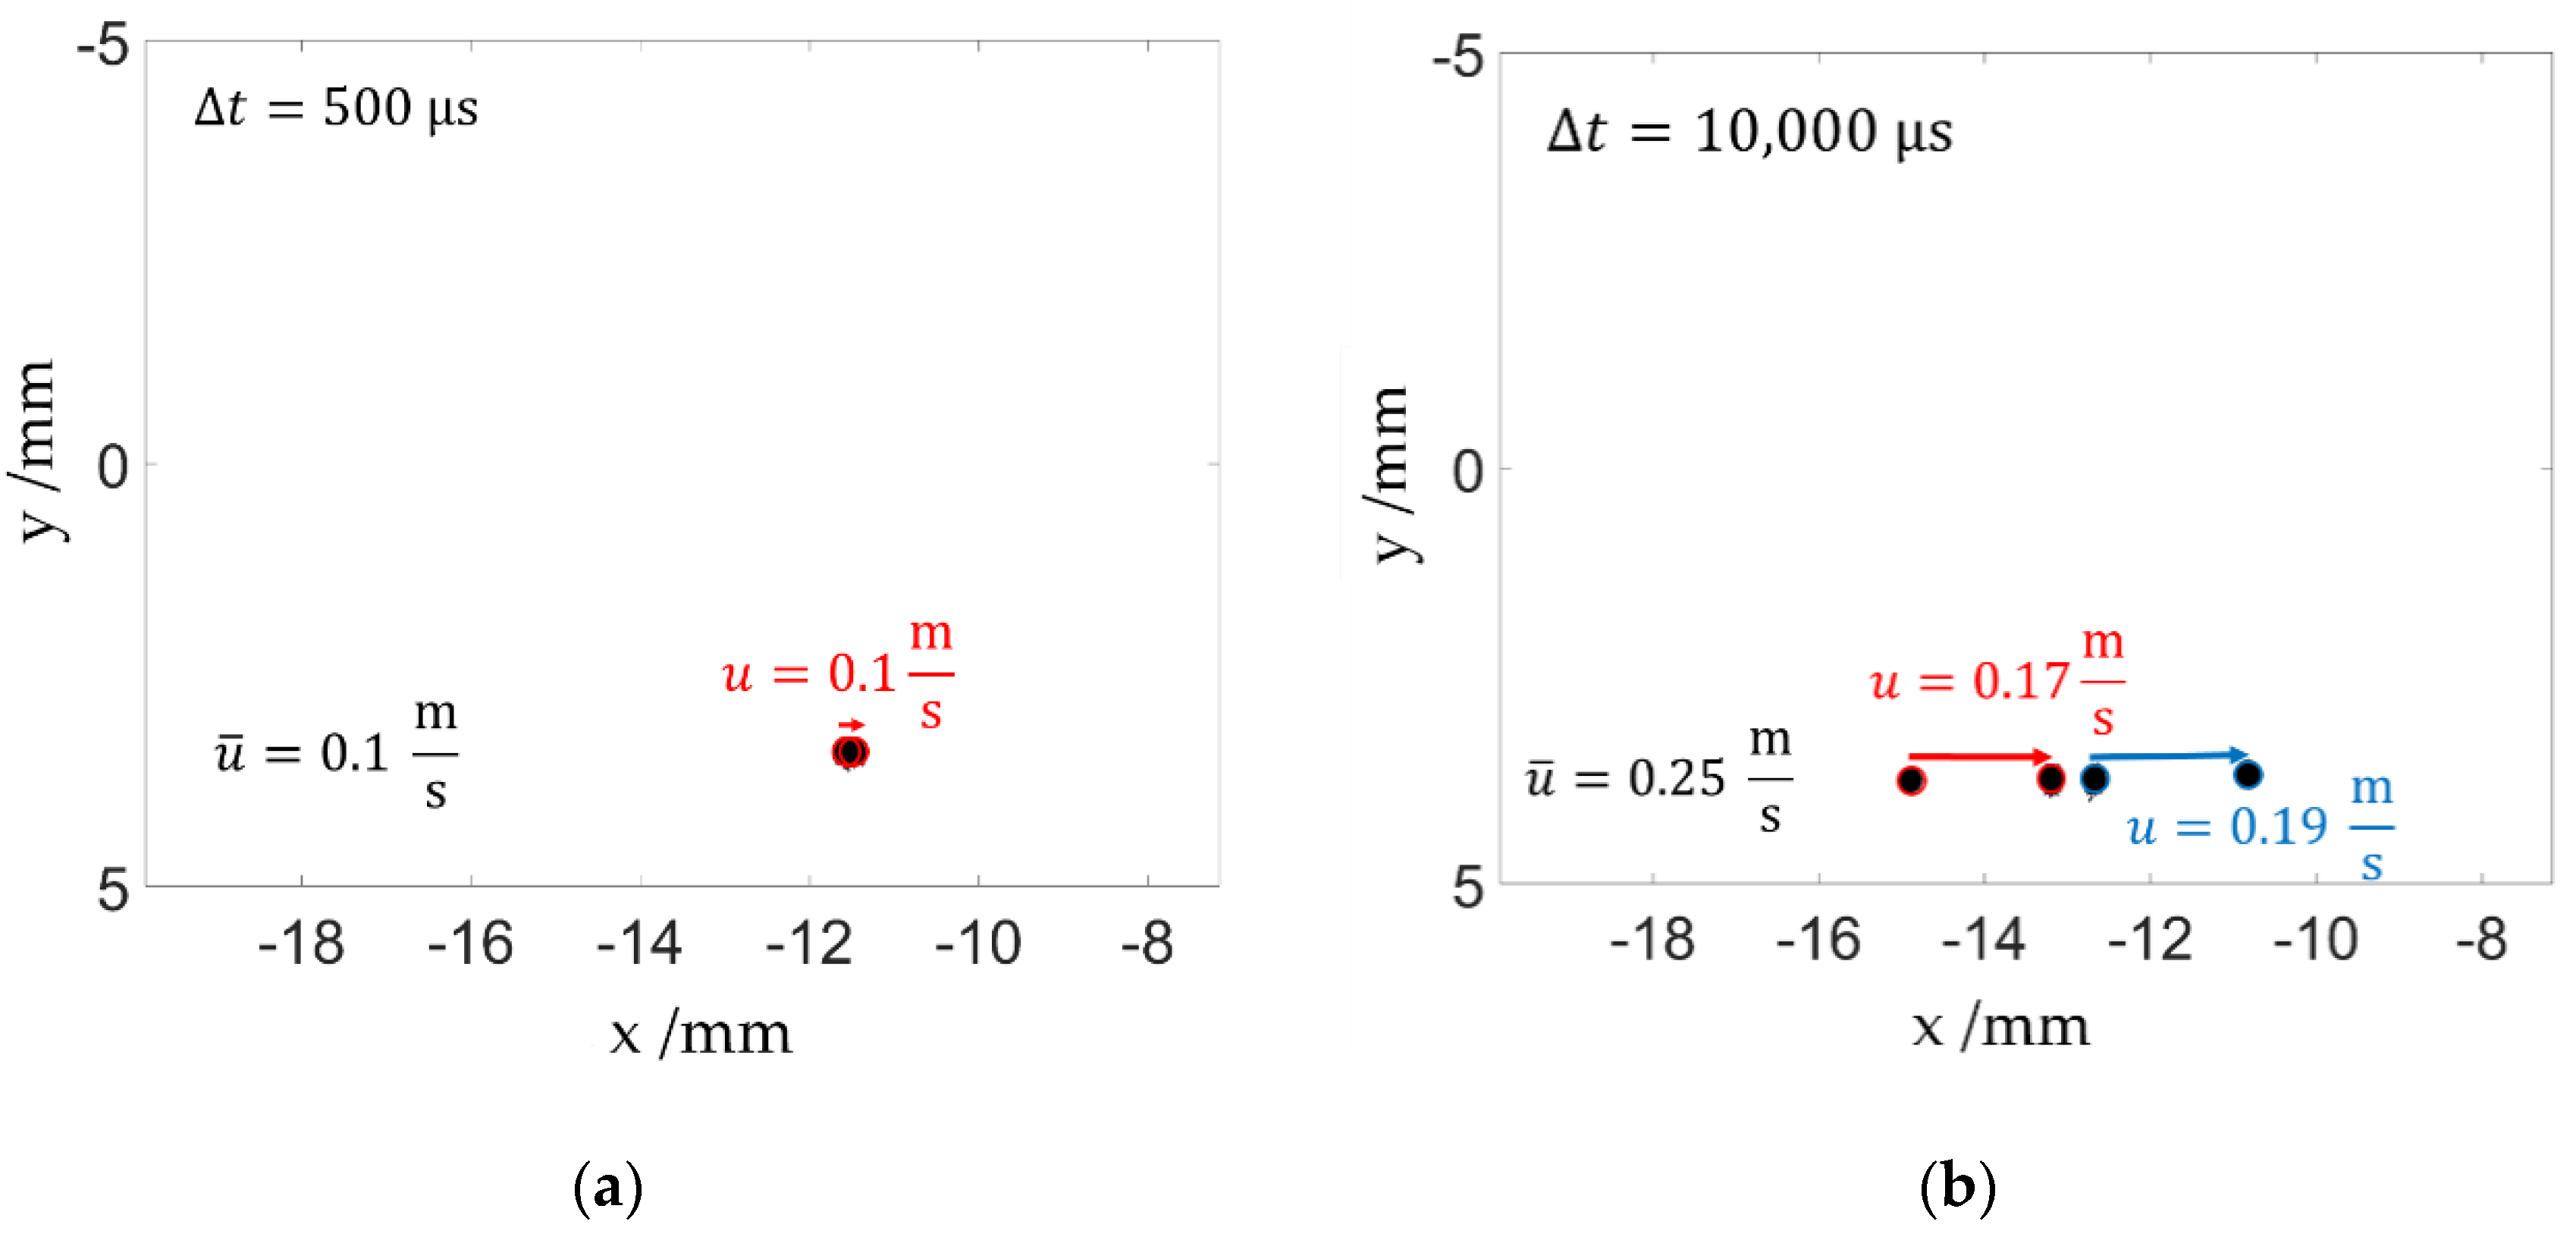
Figure 10.
(a) Snapshot of droplets with a diameter of about 220 µm in front of the orifice, which was positioned on the centerline of the flow with a capillary. The flow is from left to right. (b) Superimposition of 27 snapshots. (c) Superimposition of images where droplets were injected on the center line and close to the wall. The dashed lines represent the expected trajectory of the droplets in the scaled high-pressure homogenizer orifice. The x-axis always shows the distance from the orifice exit.


Table 1.
Overview of all material properties.
| 1148.55 | |
| 920 | |
| 15.5 | |
| 0.00942 | |
| 0.02947 |
Publisher’s Note: MDPI stays neutral with regard to jurisdictional claims in published maps and institutional affiliations. |
© 2020 by the authors. Licensee MDPI, Basel, Switzerland. This article is an open access article distributed under the terms and conditions of the Creative Commons Attribution (CC BY) license (http://creativecommons.org/licenses/by/4.0/).
Share and Cite
MDPI and ACS Style
Preiss, F.J.; Dagenbach, T.; Fischer, M.; Karbstein, H.P. Development of a Pressure Stable Inline Droplet Generator with Live Droplet Size Measurement. ChemEngineering 2020, 4, 60. https://doi.org/10.3390/chemengineering4040060
AMA Style
Preiss FJ, Dagenbach T, Fischer M, Karbstein HP. Development of a Pressure Stable Inline Droplet Generator with Live Droplet Size Measurement. ChemEngineering. 2020; 4(4):60. https://doi.org/10.3390/chemengineering4040060
Chicago/Turabian StylePreiss, Felix Johannes, Teresa Dagenbach, Markus Fischer, and Heike Petra Karbstein. 2020. "Development of a Pressure Stable Inline Droplet Generator with Live Droplet Size Measurement" ChemEngineering 4, no. 4: 60. https://doi.org/10.3390/chemengineering4040060