
Visualization Concept of Automotive Quality Management System Standard


Institute of Industrial Engineering and Management, Faculty of Materials Science and Technology in Trnava, Slovak University of Technology in Bratislava, Jána Bottu 25, 917 24 Trnava, Slovakia
Standards 2022, 2(2), 226-245; https://doi.org/10.3390/standards2020017
Submission received: 15 January 2022
/
Revised: 20 February 2022
/
Accepted: 6 April 2022
/
Published: 8 June 2022
(This article belongs to the Special Issue Feature Papers to Celebrate the Inaugural Issue of Standards)
Abstract
:In organizations that manufacture products or provide services as well as in academic practice, the visualization of management systems’ standards is presented primarily in the form of static diagrams or tables. Demands for the quality of products and services are reflected in the complexity and interconnectedness of standards, which could cause complications during the implementation phase. This article presents a visualization of the standard IATF 16949 Automotive Quality Management System Standard, Quality management system requirements for automotive production and relevant service parts organizations, which incorporates in its content ISO 9001 Quality Management Systems—Requirements using a dynamic cluster model built using software TouchGraph Navigator. The visualization process began with a detailed examination of the two-stage requirements, documented information, and notes detailed in IATF 16949 and continued with the creation of a central node to which new nodes were subsequently connected, containing the introductory parts of the standard, including clauses. The activation of clauses and sub-clauses for other parts of the document followed. The dynamic behavior of the resulting cluster can be used in the implementation, execution, maintenance, or certification process to encourage organizations to improve their operational processes by incorporating more rigorous quality considerations into their operational frameworks.
1. Introduction
The reason why it is worth visualizing standards is derived from the needs of all stakeholders. Stakeholders relevant to the management system are those who are in any way influenced by the system or constitute a part of its operation, e.g., shareholders, creditors, stock investors, suppliers, employees, customers, or local communities. Typically, they all have different interests in the company. The importance of understanding their expectations and requirements is best known to those who deal with the implementation of management systems and their associated standards within the company. The implementors are responsible for and required to have a detailed understanding of what the standard deals with, its scope, structure or the number of levels of a structure, or how the standard intends to help establish, maintain, and improve management systems.
Standards can be, by default, quite complicated to work with correctly. One can use graphics to make them more understandable, but that is not sufficient. Graphics on their own are also insufficient, they are part of a whole. They complement the text and are complemented by the text [1]. Hence, there is a search for a synergy between text and graphics, where one can retrieve the text related to the graphic information instantaneously and move fluently within the standard. Visualization provides such a solution and at the same time communicates the purpose behind the process.
Technical and management standards are not frequently visualized in industrial practice. The standard use could be found in terms of pure data/value visualization, but not as data/text visualization. The transition from a paper-based approach to visualization is not simple. Becoming visual requires many skills. One needs to know how to process and mine data to identify findings, generate presentation quality graphics, and communicate outcomes to the target audience [2]. In this case the targeted audience are people directly working with management systems.
It is crucial for managers, as internal stakeholders, to have the ability to navigate as quickly and as clearly as possible within the standard, and its individual clauses. It is not appropriate for them either to fumble and thus sabotage the implementation of a management system during the implementation stage, or, during the maintenance stage, if the system is in place and needs regular care to work correctly.
Visualization is a kind of storyline that gives a clear answer to a question without necessary details. By focusing on the original intent of the question, you can eliminate such details because the question provides a benchmark for what is and is not necessary [3].
Many people who are involved in the various stages of the lifecycle of the management system adhere strictly to the Plan-Do-Check-Act (PDCA) cycle or, more effectively, to the Plan-Do-Study-Act (PDSA). PDSA was originally designed by Deming [4], and supporters of this type of cycle are more aware of the complexity and scope of the management system if they do not look at it “classically.” Classically, or conventionally, means that they have the document (standard) in question in their hands or on the monitors and in order to locate the information they need to look for it manually. “Non-classical” means that they have a visualized dynamic cluster available that is alive, and one click brings immediate results. In such an unconventional representation, the proverb that “It is better to see once than to hear three times” is valid.
1.1. Visualization Management
The Moravian pedagogue Jan Amos Komenský, who also supported visualization as a didactic means of acquiring knowledge, has clearly stated that, “There is nothing in reason that was not in the senses before” [5]. Thus, visualization will help to ensure that the standard makes its way effectively through the eyes to the mind of the stakeholder.
People, or stakeholders, are constantly looking for a way to identify new information. They try to find them as quickly as possible. The reason we want to be better informed is so that we can make better decisions. Research shows that visualized information is faster and easier to understand and is much more likely to be remembered by people [6].
It is not easy to define what visualization means and how to “grasp” this concept intellectually. Some authors are considering information visualization because visualization can also be multimodal, that is, composed of both textual and visual elements such as lines, shapes, icons, or background images. These elements are then used to organize information visually [7].
Other authors understand visualization as a process of graphically representing data or information. Here, the visualization itself provides encoded relationships, patterns, similarities, and differences through shape, color, position, and size. These visual representations of the data can make findings and ideas stand out. Data visualization is a basic skill in our modern, data-driven world. Almost every aspect of our daily routine generates data: the steps we take; the movies we watch; the products we buy; and the conversations we lead. Much of this data from our digital “exhaust” is stored, waiting for someone to make sense of it [8].
The abbreviation “infovis” stands for information visualization, but it is not easy to define the MSS visualization in such a way that it is applicable to all projects and can be distinguished from other related areas such as scientific visualization or information design. The preliminary definition includes a mapping between discrete data and the representation visual [2].
1.2. Management Systems Standards Suitable for Clustering
Management system visualization means the ability to create a dynamic cluster for any MSS, which can then be merged with other clusters into one multi-cluster through interconnections and thus integrate management systems. One such larger cluster already available is a visualized integrated model for up to three standards: ISO 9001 QMS (Quality), ISO 14001 EMS (Environment), and ISO 20121 SEMS (Sustainability Events) [9] or a single small cluster dedicated to only one standard, ISO 46001 WEMS (Water Efficiency) [10].
Currently, 98 management systems are defined in standards by the International Automotive Task Force and International Organization for Standardization as well as alternative standards in the International Workshop Agreement (IWA). The International Workshop Agreement is one of several working alternatives to ISO international standards where the rapid development and publication of a document is a priority. Compared to the usual ISO process of developing international standards through a technical commission structure, IWA documents are developed in open workshops and organized by the National Standards Institute. The documents are approved by consensus between the participants in these workshops [11].
The list of standards is constantly being expanded to include new management systems that have a harmonized structure (HS). The standards, which are registered under the list of management standards as HS, have the same structure and contain many of the same terms and definitions as the “Consolidated ISO Supplement”. This harmonized label is particularly useful for those organizations that choose to operate a single management system that can meet the requirements of two or more management system standards simultaneously [12,13].
The standards revised since 2015 have a high level of structuring (HLS), which means that the standards arranged in this way provide the same structure, text, and common terms and definitions for all future MSS ISOs. In this way, all ISO management systems’ standards can be harmonized to facilitate the full integration of multiple standards into a single management system for operation in a single organization [14].
2. Materials and Methods
The key goal of this work was to create a cluster for a specific single standard called IATF 16949, which belongs to an organization with international operations, whose abbreviation and designation of the standard are identical [15].
2.1. Automotive Quality Standards
IATF is a global technical specification and quality management standard for the automotive industry. Based on the standard ISO 9001:2015, it was published in October 2016 and replaces standard ISO/TS 16949. It is designed to be used in conjunction with standard ISO 9001:2015 and includes supplementary requirements specific for the automotive industry rather than being a standalone QMS. IATF combines standards from across Europe and the U.S. IATF 16949:2016 outlines everything you need to know about achieving best practice when designing, developing, manufacturing, installing, or servicing automotive products [16].
IATF organization is developed for that purpose by a group of automobile manufacturers and their related national associations of the automotive industry with the aim of providing the customers in the automotive industry with high quality products.
Following is a list of specific purposes for which the IATF was established:
- To develop a consensus regarding international fundamental quality system requirements, primarily for the participating companies’ direct suppliers of production materials, products, or service parts or finishing services (e.g., heat treating, painting, and plating). These requirements will also be available for other interested parties in the automotive industry;
- To develop policies and procedures for the common IATF third party registration scheme to ensure consistency worldwide;
- To provide appropriate training to support IATF 16949 requirements and the IATF registration scheme;
- To establish formal liaisons with appropriate organizations to support the goals of IATF [17].
The history of IATF 16949 is somewhat complicated, as it was developed by two organizations simultaneously, although with the same goal. That was to create a standard that would ensure quality in the automotive industry specifically. It embodies ISO 9001, which is a generic standard for the assessment of quality management systems. It is not a product standard. ISO/TS 16949 does not contain requirements with which a product or a service can comply. There are no product acceptance criteria in ISO/TS 16949, so you cannot inspect a product against the standard [18]. Thus, while the original ISO/TS 16949 addresses only the organization’s requirements, IATF 16949 also includes specifications and customer requirements in the audit to determine whether the service organization or product organization meets them [19].
We can find the answer to the question why two manuals are there, IATF 16949:2016 and ISO 9001:2015, to address the same issue, in the IATF document 16949:2016 FAQ, revised and reissued in April 2021. The IATF and ISO were simply not able to reach a licensing agreement to publish IATF 16949 in an integrated document. In order to not further delay the launch of the new IATF 16949 standard, the IATF decided to publish it in a two-manual format. Prior to release, the IATF confirmed with international accreditation organizations that other industry sectors use a two manual format model to define their sector specific requirements, and auditing with the two manual model, while not optimal, is effective. The IATF maintains strong cooperation with ISO by continuing the liaison committee status, ensuring continued alignment with ISO 9001 [20].
IATF 16949 could therefore be characterized as two standards in one. We could also label it as a superstructure because ISO 9001 QMS forms the basis—the so-called “golden core” of the management system in IATF 16949. Compared to the two management systems, we can say that the IATF is a much more rigorous standard than ISO 9001, which is generally more widely applicable to all organizations that offer services or manufacture products. In addition, the QMS standard includes another ISO 9000 standard, which deals with management system terminology [21,22].
A topic that is often discussed is the connection between IATF 16949 and ISO 9001. According to a study conducted by Laserukin-Iturbea at al. the findings show that IATF 16949 adds value to a more flexible ISO 9001 in five main areas: market, customer service in the supply chain, operational performance, staff, and technology [23]. Overall, IATF 16949 is seen as a ‘license to operate’ for automotive sector suppliers, for whom ISO 9001 seems to have lost its signaling value. The rigor of IATF 16949 is also evident from the number of revisions in a given time interval. The revisions concern in particular the binding interpretations of the individual articles of the standard, because the binding interpretations change the interpretation of the rules or requirements, and the latter itself becomes a disagreement (non-compliance). The first edition of IATF 16949 was published in English in October 2016 and entered into force on 1 January 2017. The first revision has been in force since October 2017 and there is currently a fifth edition containing 22 revisions valid from November 2021 [24]. On the other hand, the ISO 9001:2015 standard shows greater resistance because it was last revised and validated in May 2021, while the original version of the standard remains current.
As part of continuing support, the IATF organization published the fifth edition in February 2021 of FAQs for certification organizations and interested parties, in order to improve the understanding of existed requirements [20].
Based on the above, we are of the opinion that it is significantly necessary to facilitate the orientation of interested parties in the discussed standard IATF 16949 and the subsequent understanding of its requirements. Another support tool (outside the IATF organization) appears to be the creation of a visualized concept of a quality management system standard in the automotive industry using a software application that allows, in addition to the desktop use, also a presentation on a web platform. This concept should help managers working in organizations producing series production and production of relevant components in the automotive industry to fully meet the requirements of stakeholders and facilitate first-, second- and third-party audits at a higher level. The amount of work involved in developing the concept is significant only at the beginning, the incorporation of Sanctioned Interpretations (IATF 16949) can be completed on an ongoing basis as revisions are issued.
As already mentioned, the other materials used for the concept development are the ISO 9001 and ISO 9000 standards. They represent an integral part and without them it is not possible to develop the given cluster correctly. The Supplementary Materials were already discussed in detail in the following article: “Innovative Approaches to Model Visualization for Integrated Management Systems” [9].
2.2. Methodology of Visualization
To create a cluster using visualization, it is necessary to emphasize that visualization is not just an image that at first glance presents its content, but it is a smart project that captures the essence, has a descriptive value, and is dynamic. Visualization is used to present project models for spatial networks, hierarchical structures, relationships, interactions, and communities. The process of visualizing the cluster follows the following procedure:
- Selection of a data set, which can also be completed by importing data from an external database, their correct filtering and data transformation, which is performed if we do not have the data in the required form and it is necessary to transform it;
- Defining individual nodes or cells of the cluster and graphical differentiation according to selected criteria, whether using the size, shape, color, or other attribute of the node;
- Defining individual edges between the nodes and, again, graphical differentiation in terms of thickness, format, color, etc.;
- Control of the interaction correctness;
- Research and further study of the cluster.
However, there are many formats available for storing data, and a large number of generic or specialized software applications for cluster networking and analysis. Many software packages are available in paid format, as a volume license for academic processes, or as open-source programs.
To develop a visualized concept of the Automotive Quality Standards, TouchGraph Navigator software was used. It enables the generation of interactive network visualizations of existing data that could be retrieved from the Excel (.xls) database.
In a given computer application, it is possible to analyze and variously visualize individual connections in a cluster, export visualizations to .pdf, png and .jpg formats and export the data to Table Data (Excel MS), Graph, or Merged Graph (Vna) formats [25]. This software is also used in the author’s workplace, where several large-scale projects related to legislation and MSS have already been built based on it.
To create a data set for MSS visualization of the IATF 16949 standard in the TouchGraph Navigator application, the data file must be compiled correctly. For convenience, only one sheet of the Excel file was used for the cluster, in which detailed data contained in IATF 16949 were edited and specially arranged. These data include the structure of the standard with its clauses, individual management system requirements, documented information, and notes for further explanation of the MSS. A total of 276 rows and a range of A-AC columns were used. Because IATF 16949 is a paid document and is not publicly available, the AC column is edited as an example only, for illustration. This file serves as a database for our network visualization of the MSS cluster.
3. Results
Based on a detailed examination of the common and specific requirements, documented information and notes for IATF 16949, Table 1 has been derived. The table shows the assignment of clauses to the PDCA cycle phases for ISO 9001. The other clauses contained in the IATF 16949 extension standard are shown in bold.
3.1. Development of the Visualized Cluster of IATF 16949 Standard
The visualized cluster is seemingly complicated, but its dynamic behavior facilitates the user with a simple orientation. The cluster is based on the so-called degrees of separation. The number of degrees depends on the complexity of the document being processed; the IATF 16949 cluster we created has a total of seven degrees of separation. Each subsequent level of separation increases the information available to the user.
The following steps describe the process of cluster formation and the basic characteristics of each step.
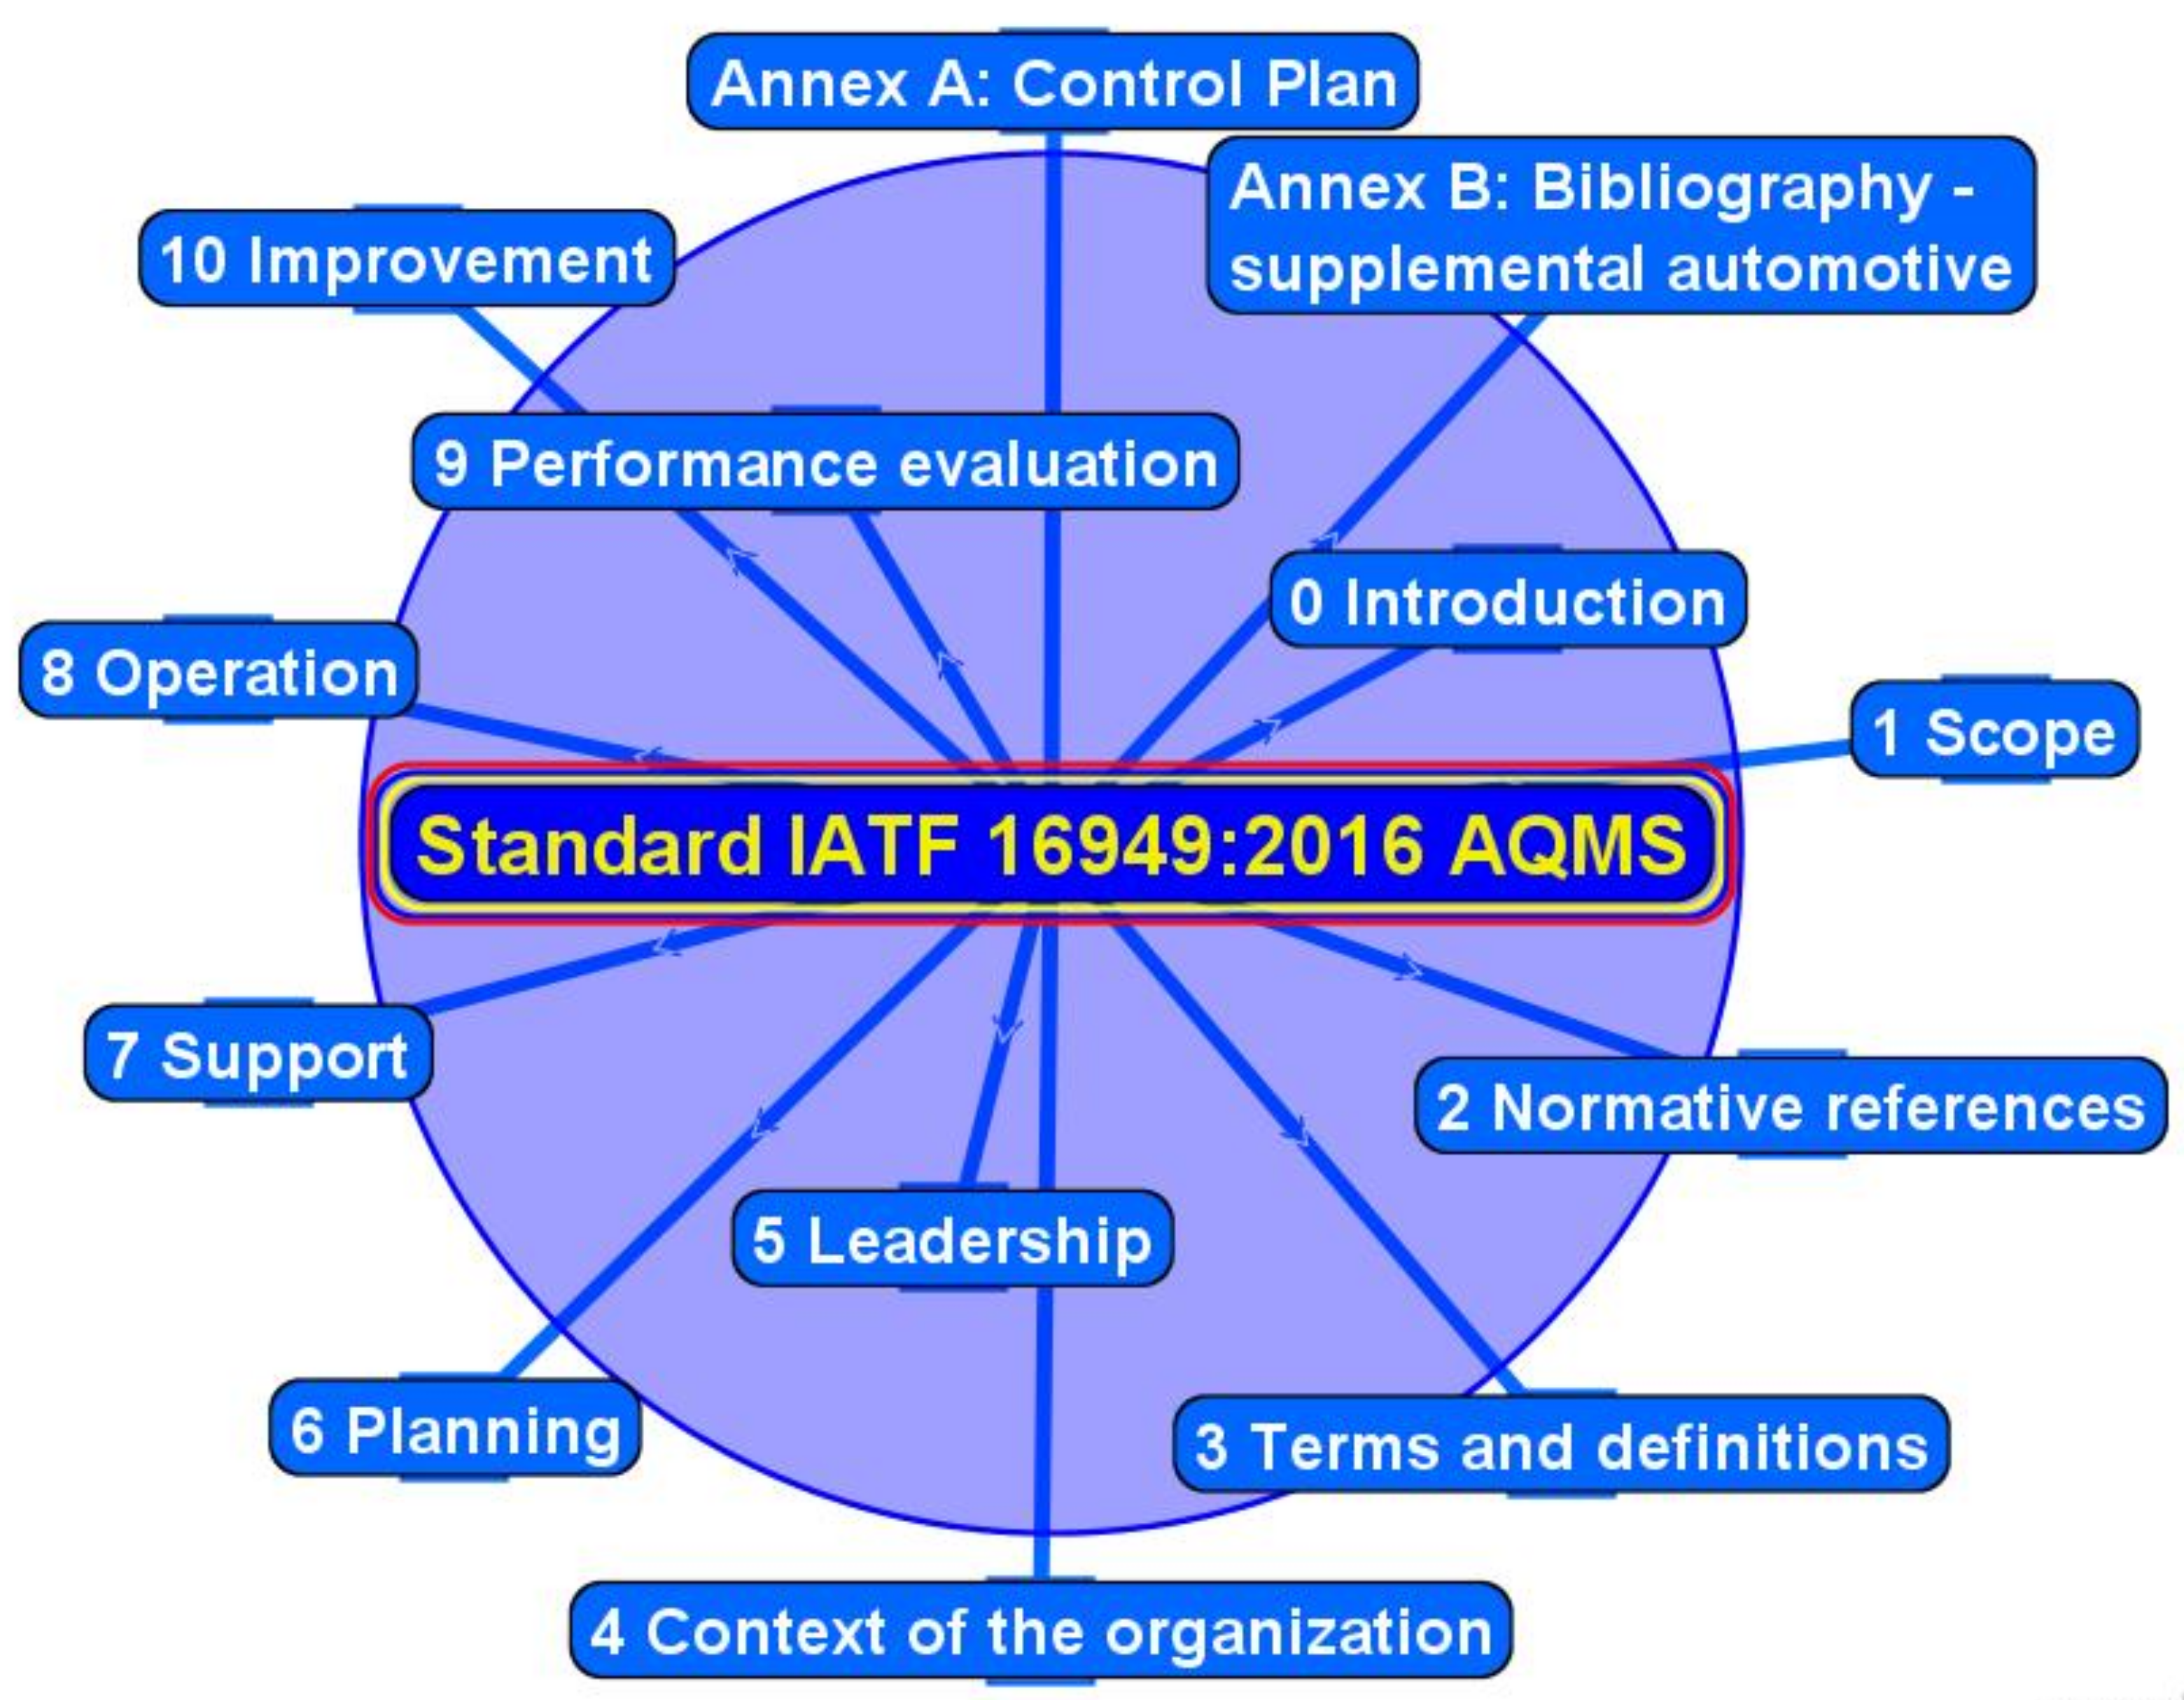
The first step involves creation of a central node, from which other nodes connected by connectors are networked (node switching). The central node is called “IATF Standard 16949:2016 AQMS” and is marked as a blue rounded rectangle with a colored circle that expresses a “halo” effect, see Figure 1. The number of degrees of separation in the first step is 0.
The second step involves the creation of 13 new nodes, which contain the “Introduction” section and a dozen of main Clauses plus two Annexes, according to Table 1. The nodes correspond exactly to the structure of IATF 16949. The nodes forming the Clauses and Annexes are activated with the first degree of separation. They are shown as blue rounded rectangles networked with a central node. Networking is oriented outwards from the main node to 13 new points. Individual nodes are linked with the core node by using edges, or so-called connectors. They vary based on the depth of the structure separation and the type of the node.
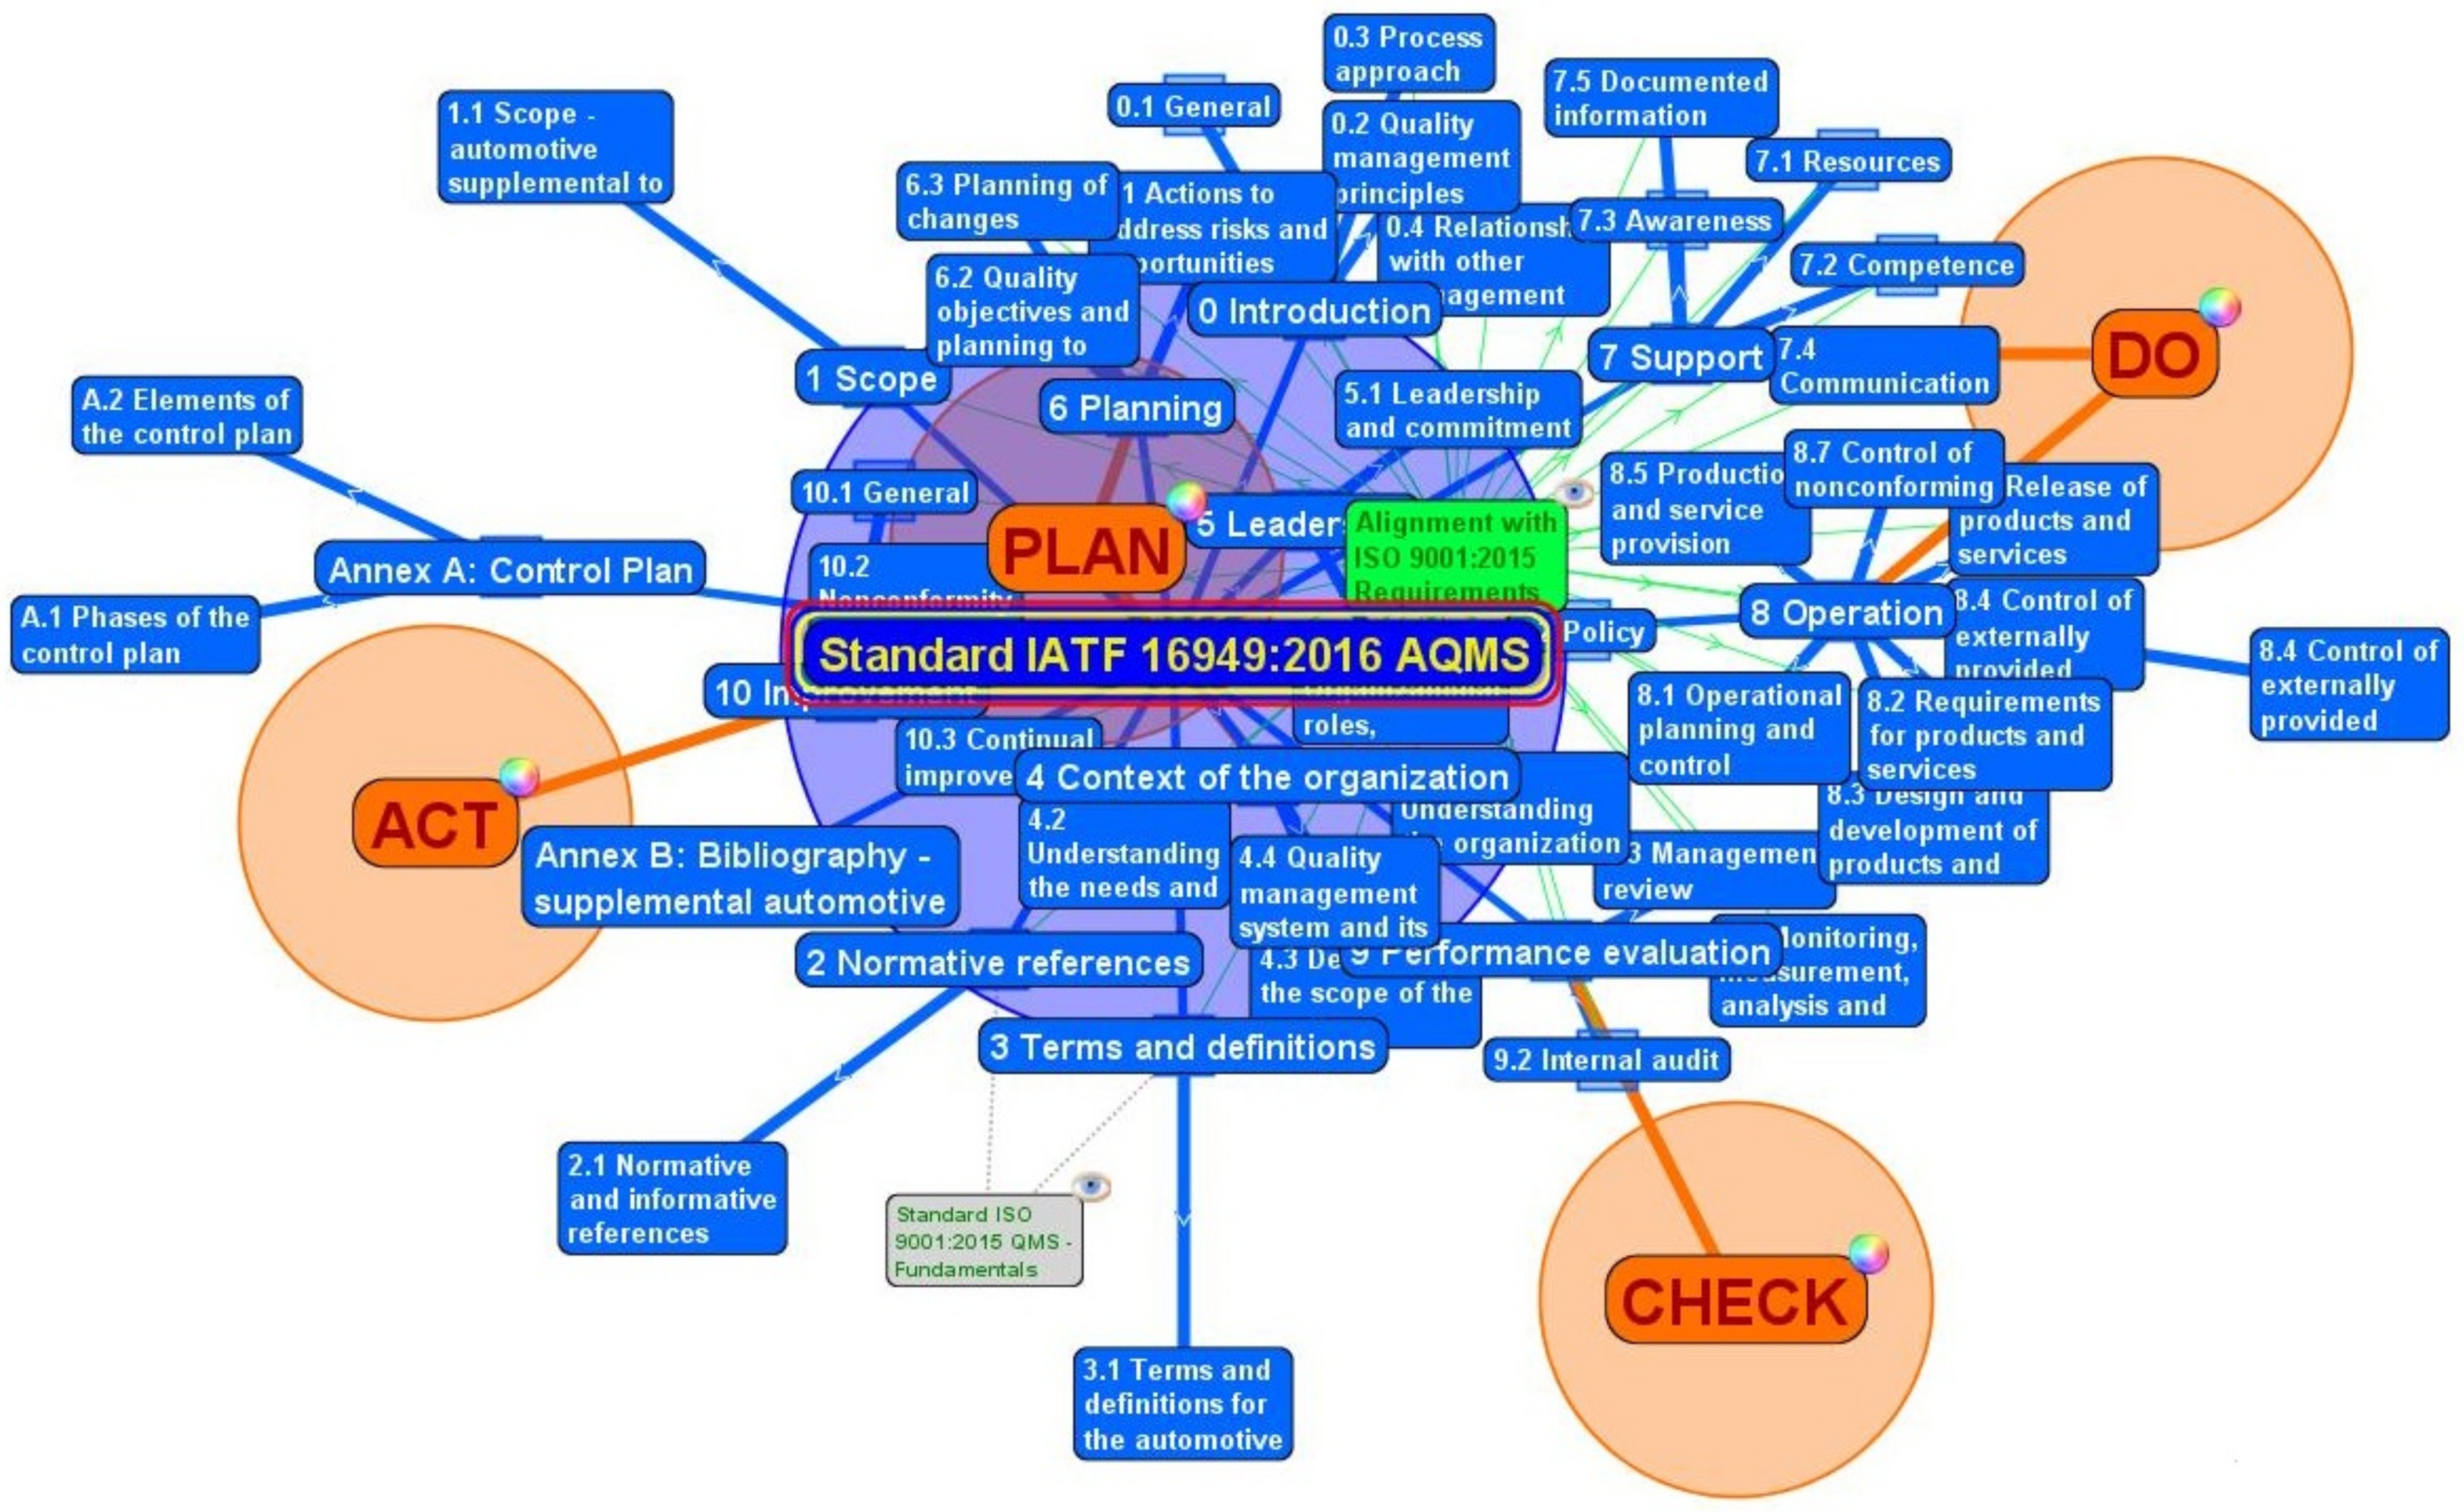
The third visualization step activates 36 sub-clauses, according to Table 1, and networks them with the main 10 clauses. For these nodes, blue rounded rectangles are also used as a mean for display. The Annexes also have their two Sub-annexes marked as “A1”. “Phases of the control plan” and “A2. Elements of the control plan”. Networking of PDCA clauses and sub-clauses also occurs in this step. Again, we use Table 1. The nodes for “Plan”, “Do”, “Control”, and “Act” are displayed as orange rounded rectangles with a round halo effect and a label expressing the rainbow cycle. Undirected connectors are visualized by a thick orange line. A very important node called “Alignment with ISO 9001:2015” with its connectors was also visualized. This is shown as a distinct green (reflective green) rounded rectangle. This node and its connectors are connected to all nodes (clauses, sub-clauses, etc.) that contain parts of the basic standard ISO 9001:2015. The last node marked as “ISO 9001:2015 QMS—Fundamentals and Vocabulary”, linked to Clauses 2 and 3, expresses the shared references, terms, and definitions for IATF 16949 of ISO 9001:2015. It is shown as a gray rounded rectangle with a small eye tag, see Figure 2, with a separation degree equal to two.
The fourth step is a separation level equal to three, see Figure 3. It visualizes the sub-sub-clauses, in this case from the sub-sub-clause “0.3.1 General” to the sub-sub-clause “10.3.1 Continual improvement—supplemental” as blue rounded rectangles. These nodes are extremely important because they are related to the mandatory management system requirements according to the standard. The requirements of subclauses are shown in a distinctive red color with a circular halo effect in the background. To emphasize them, each requirement is assigned a label in the form of an icon. In our case, the anchor was chosen. Each node also has a number of requirements. Each requirement node is networked with the relevant clauses or subclauses that contain the requirement in the text of the standard. The connectors are solid, oriented lines in red color and connect individual nodes.
In the fourth step, the nodes for binding Documented information are also activated, because in addition to meeting the requirement, evidence must also be provided to the interested parties that the requirement was, in fact, met. Nodes for binding requirements are displayed as white rounded rectangles with a tag that represents the edited page of the document. In a similar way to requirements, the extent of binding documented information is provided. The connectors are expressed in a dark blue and unoriented, dashed line.
The nodes for Notes, which are listed for each clause or subclause, are also presented. They are displayed as gray text with a pencil mark tag. These nodes serve more as a closer look at the request. They are not binding, they are explanatory. Connectors are expressed by a gray and undirected solid line.
As the degrees of separation are progressing, more requests, documented information, and notes are added along with other sub-sub-clauses. Sub-sub-sub-clauses are already distinguished by the turquoise color of the node. When specifying the number of requests and documented information, the numerical interval is sometimes given, e.g., from—to. This is especially the case if the customer has additional requirements of the organization and requires documentation to prove the facts.
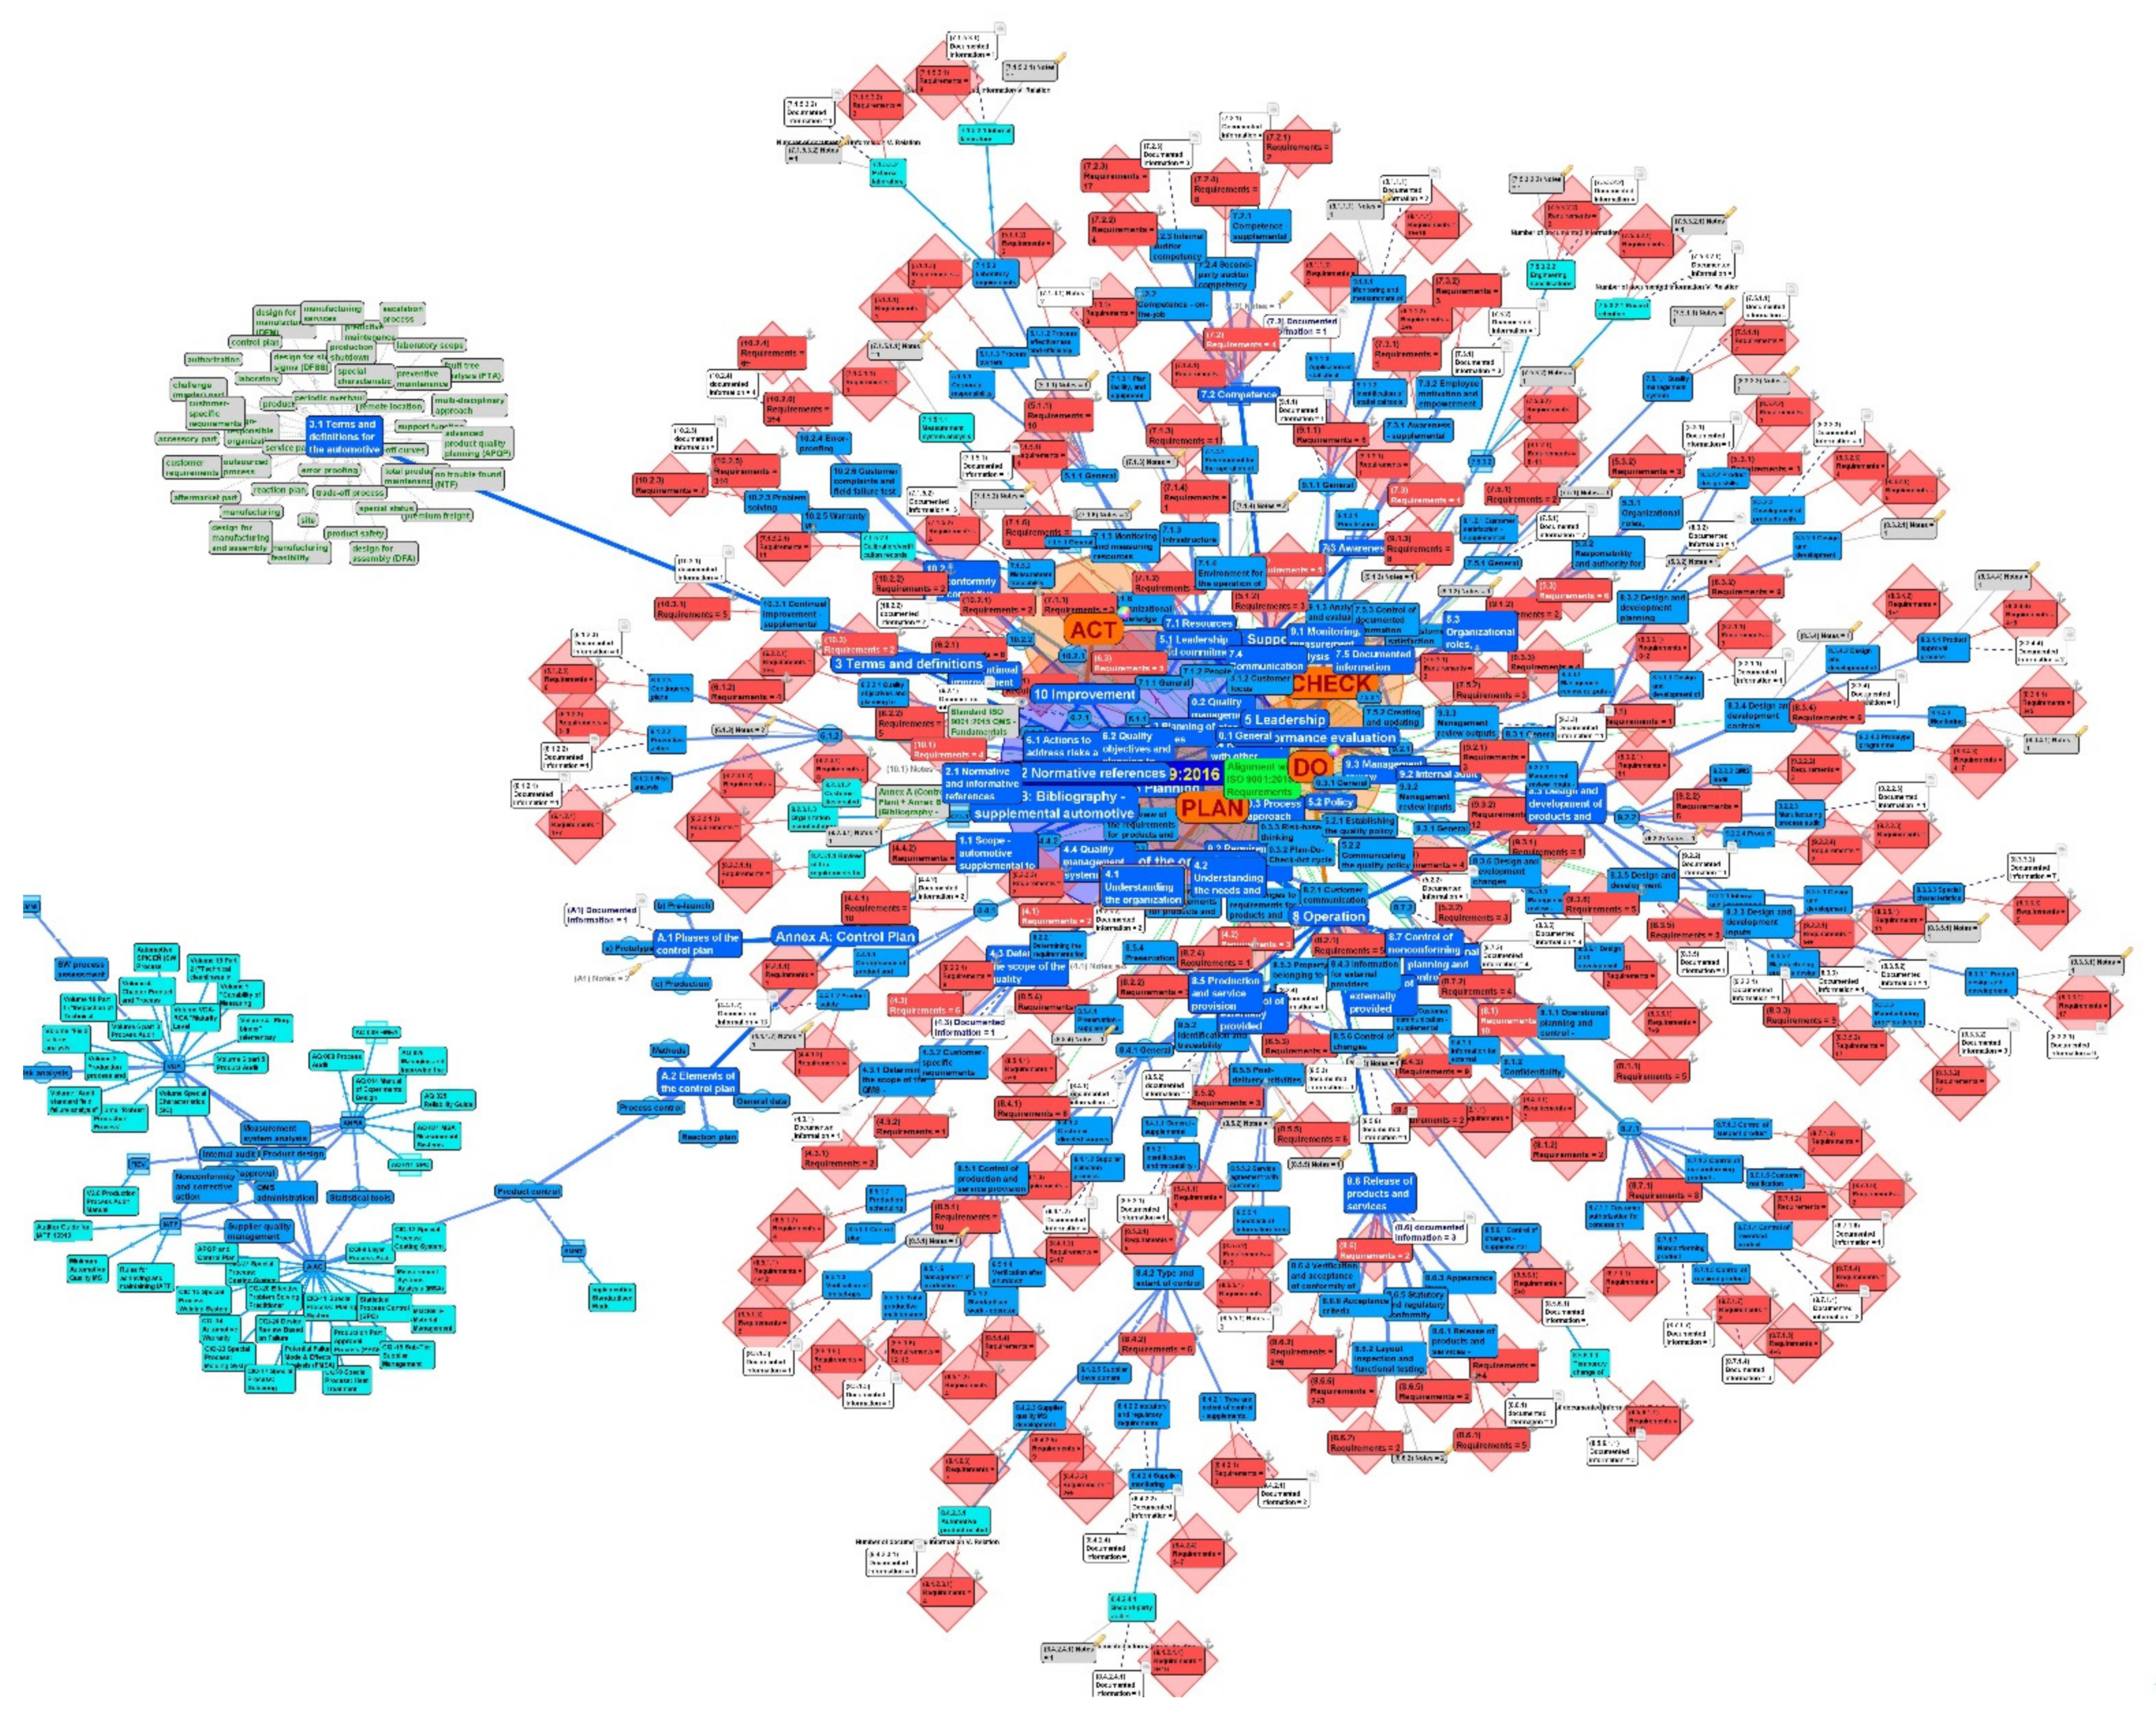
Together, the IATF 16949 cluster has seven degrees of separation, with more elements of this vast structure being displayed in turn. The complex model is shown in Figure 4. Due to the complexity of the figure, the same picture, but in its highest possible definition, was added to the section Supplementary Materials under the title: “Complex cluster for individual MSS according to IATF 16949”.
It might seem that the model is becoming very confusing. In static display, this statement is true, but for dynamic display, it is possible to zoom the cluster, and create longer or even shorter connectors. Simply put, the user can jump directly to the part he needs to explore. It is also possible to activate a specific node or hide unnecessary nodes. The unique option is to “shake” the whole structure or just parts of it.
3.2. Management Review and Audits Support
In assessing the extent of cluster structuring, this visualization is the most extensive for one management system according to the standard because, as mentioned above, it connects two management systems into one. This system connection can be referred to as “internal integration”. Managers must study two documents: ISO 9001 and IATF 16949. This visualized dynamic cluster serves as a tool, which allows the interested parties the so-called intelligent (smart) view and subsequent analysis and synthesis of management systems according to these two standards.
It follows that this is a valuable support for those stakeholders who must create, maintain, and continually improve the management system according to IATF 16949 in their organization. These are mainly the internal managers of the organization and internal auditors. For all parties involved in other party audits and certification audits, it is an excellent tool for minimizing discrepancies and nonconformities. The aim is, therefore, that the audits in the organization are carried out without the complications that arise when a standard-related audit criterion is not met.
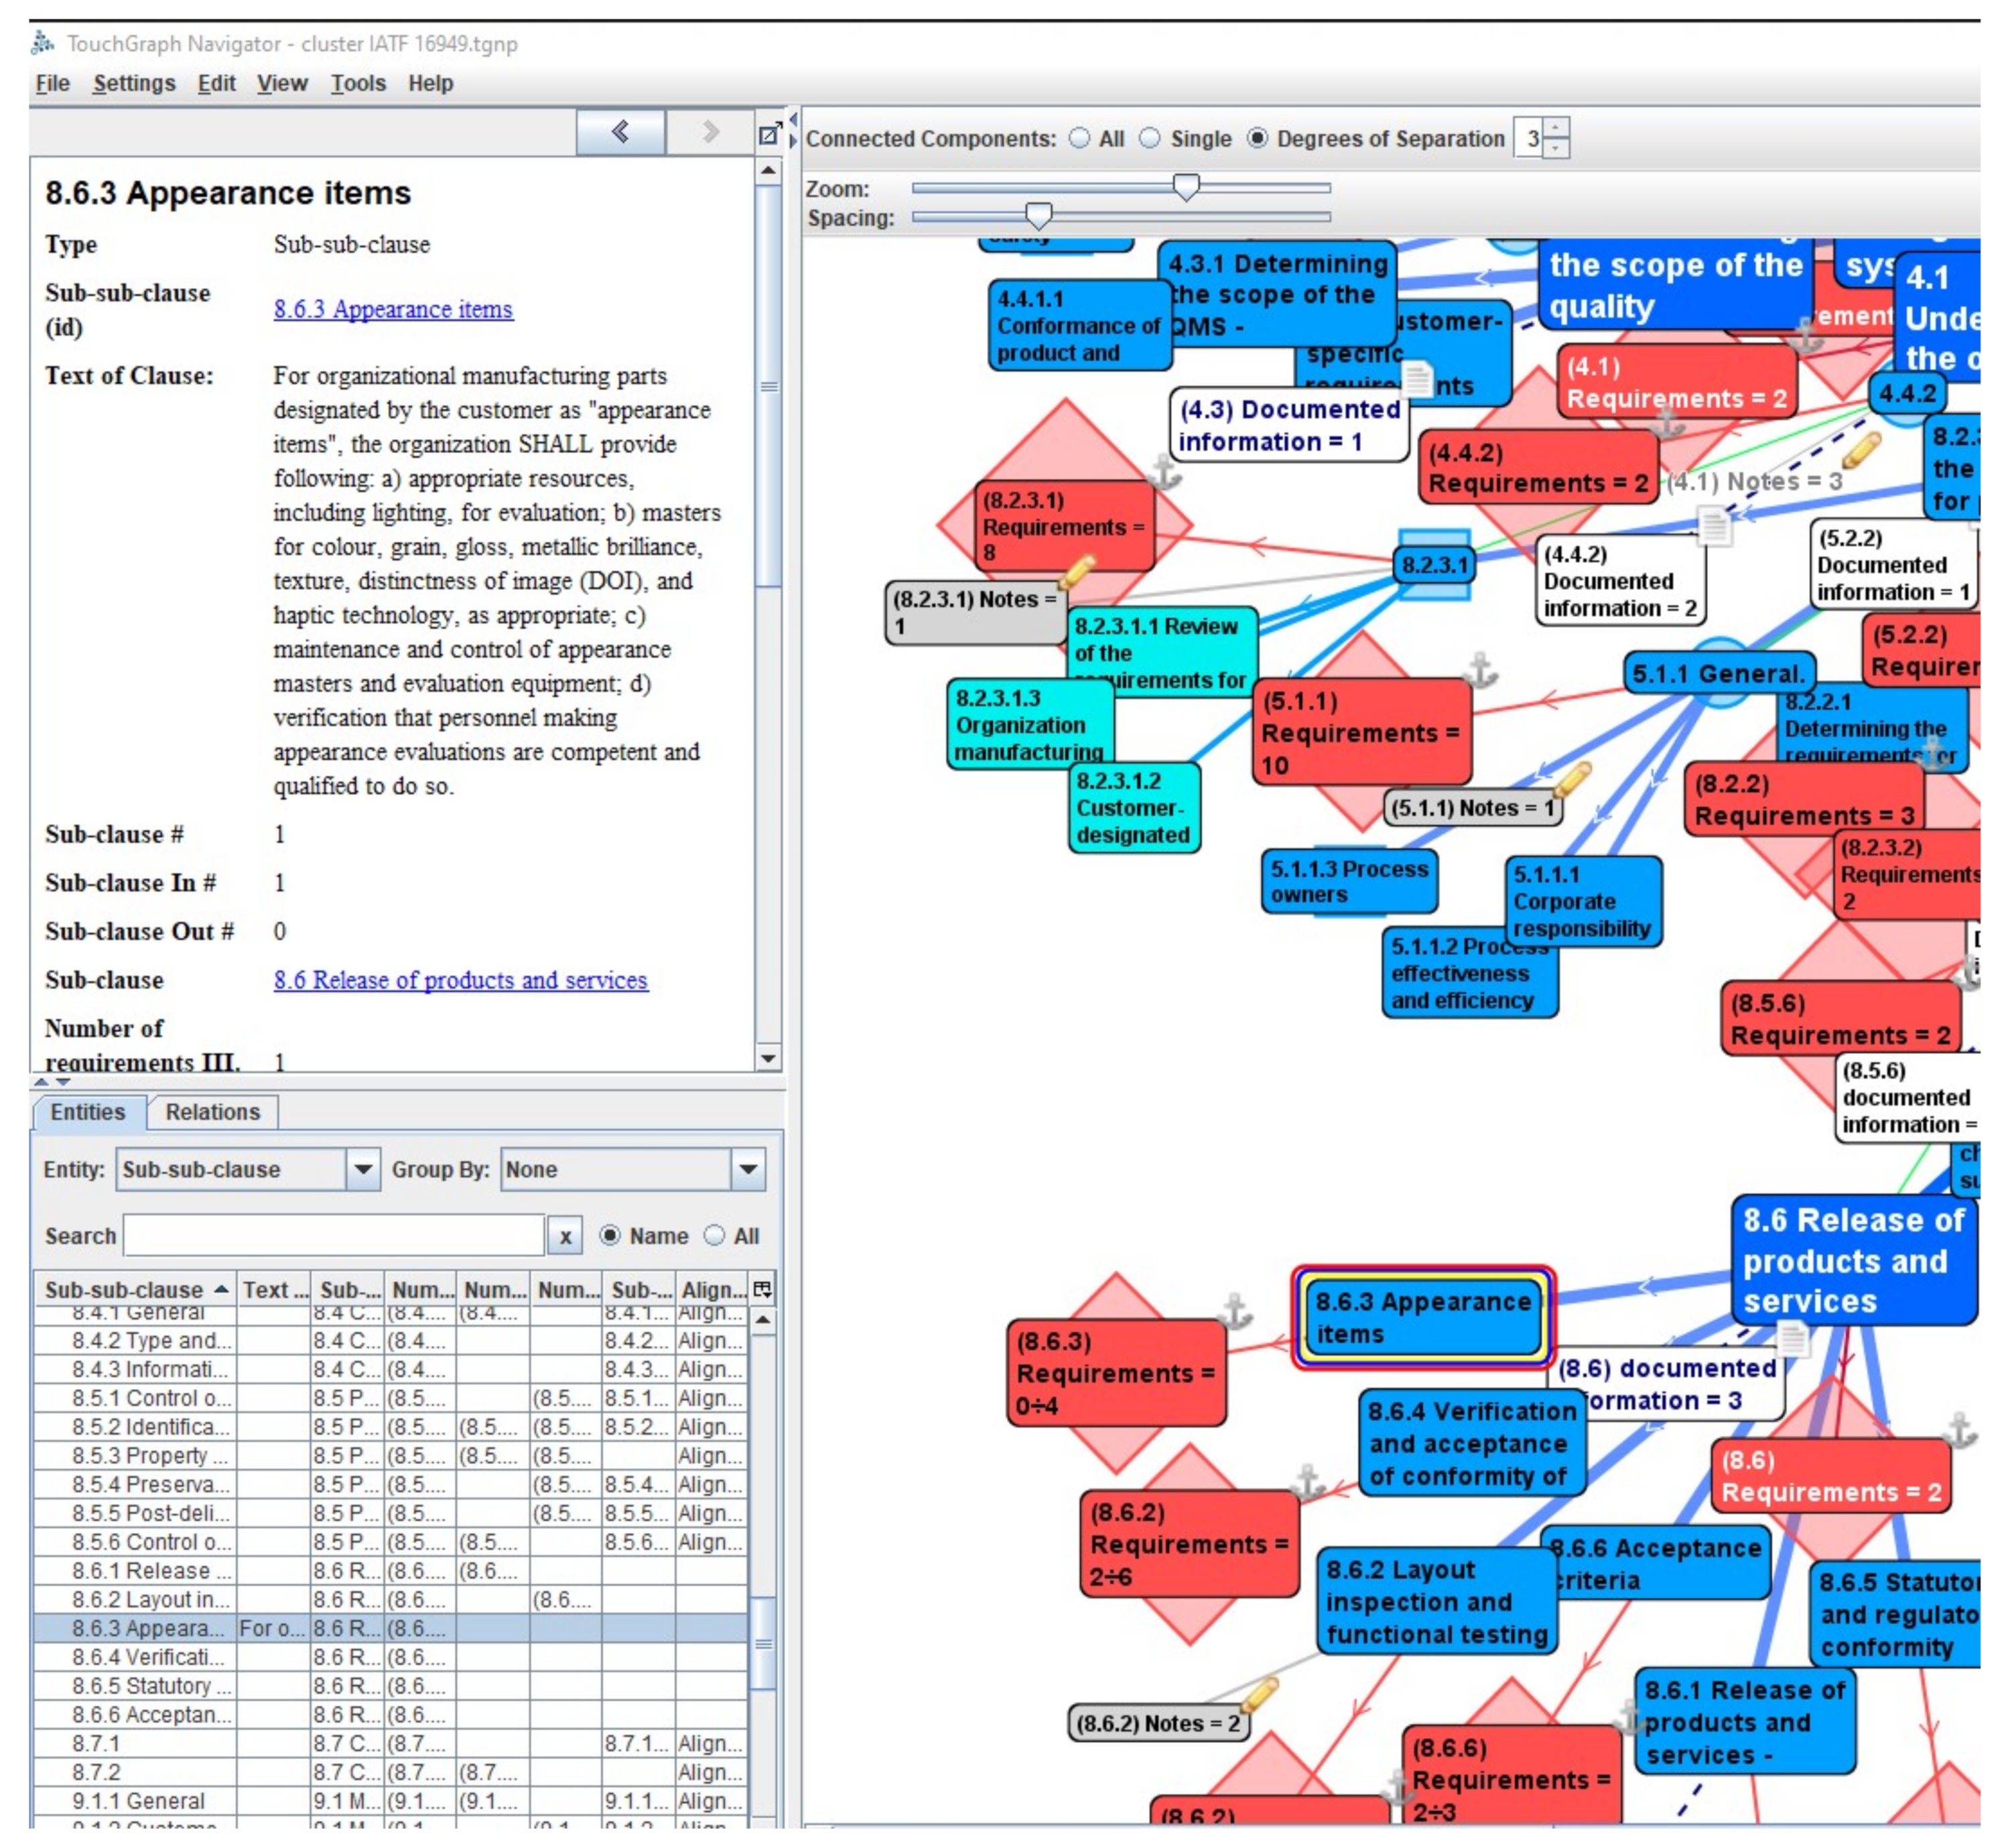
The interested party can easily and quickly find out how many requirements to deal with and gain an insight into the text content of the standard by activating the given node (as a representative of the clause). Because the text of IATF 16949 is commercially provided this sharing must be limited to only examples in this article. Specifically, we chose and activated for selected visualized image (red-yellow border of the blue round rectangle) sub-sub-clause 8.6.3 “Appearance items”, which lists the quality attributes for the appearance of the product, see Figure 5. The figure shows the text content of the activated node, located in the right part of Figure 5. This text corresponds precisely to the content of the sub-sub-clause No. 8.6.3 defined by the standard IATF 16949.
The advantage of this IATF 16949 visualization cluster is that it is possible to examine each item (clause, sub-clause, requirement, or documented information) separately. The given cluster also visualizes the connection with the ISO 9001 standard, i.e., it also makes the internal integration of the given management system available to interested parties. If the addition of other management systems according to ISO standards continues, the database in MS Excel could be expanded with new sheets, i.e., new management systems. This is especially advantageous for integration with consolidated management systems or those that have been revised [26].
4. Discussion
In organizations that manufacture products or provide services as well as in academic practice, the visualization of management systems standards is presented primarily in the form of static diagrams or tables. This article presents a visualization of the standard IATF 16949 Automotive Quality Management System Standard, Quality management system requirements for automotive production and relevant service parts organizations, which incorporates in its content ISO 9001 Quality Management Systems—Requirements using a dynamic cluster model built using software TouchGraph Navigator and MS Excel applications to create a source database.
This article is intended to highlight the usefulness of such an approach to technical specifications or standards for stakeholders who wish to plan, implement, maintain, and continuously improve the management system. These stakeholders include, in particular, the top managers of the organization, internal auditors, external auditors, but also auditees [27].
The presented cluster enables the analysis of the standard structure, its individual clauses, sub2clauses, sub3clauses, sub4clauses, sub5clauses (up until the fifth level), binding requirements and documented information and explanatory notes. In the cluster, after the activation of individual nodes, it is possible to display the text content of the standard and learn the specifications related to the requirements and documented information, which are required during the activities with the management system.
After the analysis, it is possible to develop an effective synthesis from the acquired knowledge and thus simplify and speed up the “manipulation” with the standard.
The article emphasizes the use of visual management for management systems of given standards, which could be perceived as management for management.
For further processing, it is possible to connect other management systems to the given cluster according to selected ISO standards and create twins, triplets, etc. Management systems, in Table 2, that have great potential for integrated visualization with respect to QMS and AQMS include the following management systems with HS or HLS structure.
From the research perspective it would be fitting to observe if the frequency of updates for ISO 90001, which is now set for five years, would be also suitable for the IATF 16494 due to the acceleration of the update in the form of Sanctioned Interpretation (SIs) of the Technical Specification for IATF 16949.
Furthermore, for the purpose of this research we intend to study if visualization, as a working tool, would enhance and simplify the understanding of the management systems and standards related to them. It will be useful to identify such visualization expressions that would have the support and acceptance of most stakeholders.
Finally, it will be appropriate to examine, considering that management systems according to ISO standards are restructured after updating and have an HLS or HS structure, whether there is a finite number of management systems that can be integrated into one organization while maintaining the functionality of the integrated complex.
5. Conclusions
One of the most widely used international standards for quality management in the automotive industry, ISO/TS 16949, is being developed with the release of a new global industry standard by the International Automobile Task Force (IATF). ISO/TS 16949 was initially created in 1999 by the IATF in cooperation with the ISO’s Technical Committee on Quality Management and Quality Assurance (ISO/TC 176). It has subsequently become one of the most commonly used international standards in the automotive industry and it seeks to synchronize various assessment and certification systems in the global automotive supply chain.
IATF 16949:2016 was first published by the IATF in October 2016 and it supersedes and replaces the last version of the ISO/TS 16949. IATF 16949:2016 is in accordance with the latest version of the ISO 9001:2015 quality management system standard, refers to it, and entirely respects its structure and requirements. IATF 16949: 2016 is not an independent quality management standard but is implemented in addition to and in conjunction with ISO 9001:2015. The IATF will ensure continual conformity to the ISO 9001 by maintaining strong cooperation with ISO through its participation in ISO/TC 176 [41].
The aim of the article was to present a visualization cluster that supports this conjunction and helps decision-makers as well as other stakeholders. It also intends to support persons involved in the preparation of the implementation of several standards within the organization. Implementing a standard cluster that incorporates IATF 16949, ISO 9001, and ISO 9000 standards can lead to effective preparation for certification, which is considered an indicator of success where the organization demonstrates its commitment to systemic management. Such an approach can inspire organizations to expand their internal operational processes by integrating sustainability and quality aspects into their operational contexts. As stated by Silva et al. [42], QMS aims to help organizations respond to change by creating more open and agile models. The QMS also aims to promote ongoing dialogue with stakeholders, to respond more flexibly to current challenges and to create a lasting systemic environment. The effectiveness of such an approach is reflected in the increased adaptability of production and in the shortening of the reaction time to the implementation of changes. The result is reflected in the greater competitiveness of the organization.
The benefits of the application of visualization in practice are both internal and external. The internal benefits include, for example, raising the awareness of top management and internal stakeholders about the implementation of IATF 16949 in automotive organizations, and its use as a powerful decision-making tool. Visualization offers an insight into complexity and a scope of the management system according to IATF 16949 and better understanding of the internal integration between ISO 9001 and IATF 16949 as an inseparable pair of management systems.
Flexibility is yet another benefit to visualization because the organization can eventually add other management systems to the picture and adjust existing clusters according to its changed requirements.
Reducing administrative requirements is also considered as a benefit, as visualization contains a significant amount of supporting documentation that does not have to be stored physically.
From an external point of view, we can consider the advantage of increasing the competitiveness of the organization by obtaining quality certification [43]. The visualized format of the standard is very helpful during the audit. Information found in the clauses “Management review” and “Improvement” are especially important during the process and simplified access to this information can streamline the process of certification or re-certification.
Limitations of the software application are mostly seen during the creation of a certain number of nodes and edges; the number depends on the type of SW and its quality. Moreover, at low resolution, the 2D views of nodes and description may be unreadable. The study of IATF 16949 is limited to a comprehensive 3D view.
The ultimate goal of every manufacturer or service provider in the automotive industry is to offer high quality products and services, to be successful and competitive, and at the same time to be able to meet all the necessary requirements for sustainable production or service provision.
Supplementary Materials
The following is available online at https://www.mdpi.com/article/10.3390/standards2020017/s1, Complex cluster for individual MSS according to IATF 16949 (.jpg).
Funding
This research received no external funding.
Institutional Review Board Statement
Not applicable.
Informed Consent Statement
Not applicable.
Data Availability Statement
The first part of data supporting reported results in this research can be found on the web pages of the International Automotive Task Force. These links are publicly archived: https://www.iatfglobaloversight.org/wp/wp-content/uploads/2021/07/IATF-16949-SIs-July-2021.pdf (accessed on 3 December 2021); https://www.iatfglobaloversight.org/wp/wp-content/uploads/2021/03/IATF-Rules-5th-Edition_FAQs-February-2021.pdf (accessed on 3 December 2021). The second part of data supporting reported results in this research can be found on the web pages of the International Standard Organization. These links are publicly archived: https://www.iso.org/obp/ui/#iso:std:iso:9001:ed-5:v1:en (accessed on 3 December 2021); https://www.iso.org/obp/ui/#iso:std:iso:9000:ed-4:v1:en (accessed on 3 December 2021).
Acknowledgments
This paper was written with the support of the Cultural and Educational Grant Agency of the Ministry of Education, Youth and Sports of the Slovak Republic as a part of the project No. KEGA 031STU-4/2020 “Network visualization of common and specific elements and documented information of integrated management systems with respect to relevant ISO standards”.
Conflicts of Interest
The author declares no conflict of interest.
References
- Unwin, A. Why is Data Visualization Important? What is Important in Data Visualization? Harvard Data Science Review. 31 January 2020; 7p. Available online: https://hdsr.mitpress.mit.edu/pub/zok97i7p (accessed on 17 February 2022).
- Sosulski, K. Data Visualization Made Simple: Insights Into Becoming Visual, 1st ed.; Taylor & Francis: New York, NY, USA, 2019; 285p, ISBN 978-1-138-50387-8. [Google Scholar]
- Fry, B. Visualizing Data: Exploring and Explaining Data with the Processing Environment, 1st ed.; O’Reilly Media Inc.: Sebastopol, CA, USA, 2008; 384p, ISBN -13:978-0596514556. [Google Scholar]
- Moen, R.; Norman, D.; Clifford, L. Circling Back; Associates in Process Improvement; Quality Progress: Georgetown, TX, USA, 2010; Volume 43, pp. 22–28. [Google Scholar]
- Komenský, J.A. Veľká Didaktika (The Great Didactic), 2nd ed.; Slovenské Pedagogické Nakladateľstvo: Bratislava, Slovakia, 1991; 271p, ISBN 8008010223. [Google Scholar]
- Krum, R. Cool Infographics: Effective Communication with Data Visualization and Design, 1st ed.; John Wiley & Sons Inc.: Indianapolis, IN, USA, 2013; 370p, ISBN 978-1-118-58230-5. [Google Scholar]
- Bresciani, S. Visual Design Thinking: A Collaborative Dimensions framework to profile visualizations. Des. Stud. 2019, 63, 92–124. [Google Scholar] [CrossRef]
- Manovich, L. What is visualization? Vis. Stud. 2011, 26, 36–49. Available online: https://www.tandfonline.com/doi/abs/10.1080/1472586X.2011.548488 (accessed on 10 December 2021). [CrossRef]
- Pauliková, A.; Lestyánszka Škůrková, K.; Kopilčáková, L.; Zhelyazkova-Stoyanova, A.; Kirechev, D. Innovative Approaches to Model Visualization for Integrated Management Systems. Sustainability 2021, 13, 8812. [Google Scholar] [CrossRef]
- Cvelihárová, D.; Pauliková, A. Water efficiency management systems for transport drinking water supply. In Proceedings of the 3rd International Conference Advances in Environmental Engineering, Online, 25–26 November 2021; VŠB-Technical University of Ostrava: Ostrava, Czech Republic, 2021. ISSN: 1755-1307. Available online: https://iopscience.iop.org/article/10.1088/1755-1315/900/1/012005/pdf (accessed on 14 January 2022).
- What is an IWA? In ISO Focus—The Magazine of the International Organization for Standardization; ISO’s Central Secretariat: Genève, Switzerland, November 2007; Volume 4, p. 28. ISSN 1729-8709. Available online: https://www.iso.org/files/live/sites/isoorg/files/news/magazine/ISO%20Focus%20(2004-2009)/2007/ISO%20Focus,%20November%202007.pdf (accessed on 31 December 2021).
- Consolidated ISO Supplement—Procedures for the Technical Work—Procedures Specific to ISO. ISO/IEC Directives, Part 1, 12th ed.; International Organization for Standardization: Geneve, Switzerland, 2021; p. 14. Available online: https://isotc.iso.org/livelink/livelink/fetch/-10469877/10469901/16474137/Annex_SL_%2D_excerpt_from_ISO_IEC_Directives_Part_1_and_Consolidated_ISO_Supplement_%2D_2021_%2812th_edition%29.pdf?nodeid=17859835&vernum=-2 (accessed on 31 December 2021).
- Management System Standards List. 14 December 2021. Available online: https://www.iso.org/management-system-standards-list.html (accessed on 31 December 2021).
- Lambert, G. A stroll down Quality Street. In ISO Focus #123. Your Gateway to International Standards; International Organization for Standardization: Geneve, Switzerland, 2017; pp. 36–43. ISSN 2226-1095. Available online: https://www.iso.org/files/live/sites/isoorg/files/news/magazine/ISOfocus%20(2013-NOW)/en/2017/ISOfocus_123/ISOfocus_123_EN.pdf (accessed on 31 December 2021).
- Technical Specification IATF 16949:2016 Automotive Quality Management System Standard, Quality Management System Requirements for Automotive Production and Relevant Service Parts Organizations, 1st ed.; International Automotive Task Force (IATF), SMMT Industry Forum Ltd.: Birmingham, UK, 2016; p. 119. ISBN 9781605343471.
- BSI—British Standard Institution. What is IATF 16949:2016 Automotive Quality Management? Available online: https://www.bsigroup.com/en-US/iatf-16949-automotive (accessed on 3 January 2022).
- About IATF. International Automotive Task Force (IATF). SMMT Industry Forum Ltd.: Birmingham, UK,, 2017. Available online: https://www.iatfglobaloversight.org/about-iatf/ (accessed on 10 December 2021).
- Hoyle, D. Automotive Quality System Handbook, 2nd ed.; ISO/TS 16949:2002 Edition; Elsevier Butterworth-Heinemann: Oxford, UK, 2005; p. 712, eBook; ISBN 9780080458502. [Google Scholar]
- Areas of Impact for Client Consideration Taken from the Rules for Achieving and Maintaining IATF Recognition 5th Edition for Technical Specification IATF 16949, 1st ed; 2016 Automotive Quality Management System Standard, Quality management system requirements for automotive production and relevant service parts organizations; International Automotive Task Force (IATF), SMMT Industry Forum Ltd.: Birmingham, UK, 2017; p. 19. Available online: https://www.iatfglobaloversight.org/wp/wp-content/uploads/2017/06/Rules-5th-Edition-Areas-of-Impact-for-Client-Condisderation-01Feb2017.pdf (accessed on 3 December 2021).
- Rules for Achieving and Maintaining IATF Recognition 5th Edition (Frequently Asked Questions) for Technical Specification IATF 16949, 5th ed; 2016 Automotive Quality Management System Standard, Quality Management System Requirements for Automotive Production and Relevant Service Parts Organizations; International Automotive Task Force (IATF), SMMT Industry Forum Ltd.: Birmingham, UK, 2021; p. 8. Available online: https://www.iatfglobaloversight.org/wp/wp-content/uploads/2021/03/IATF-Rules-5th-Edition_FAQs-February-2021.pdf (accessed on 31 December 2021).
- Standard ISO 9001:2015 Quality Management Systems—Requirements; ISO/TC 176/SC 2 Quality Systems, ICS: 03.100.70 Management Systems and ICS: 03.120.10 Quality Management and Quality Assurance, 5th ed.; International Organization for Standardization with Technical Committee: Geneva, Switzerland, 2015; p. 29.
- Standard ISO 9000:2015 Quality Management Systems—Fundamentals and Vocabulary, ISO/TC 176/SC 1 Concepts and Terminology. ICS: 01.040.03 Services. Company Organization, Management and Quality. Administration. Transport. Sociology. (Vocabularies) and ICS: 03.120.10 Quality Management and Quality Assurance, 4th ed.; International Organization for Standardization with Technical Committee: Geneva, Switzerland, 2015; p. 51.
- Laskurain-Iturbe, I.; Arana-Landín, G.; Heras-Saizarbitoria, I.; Boiral, O. How does IATF 16949 add value to ISO 9001? An empirical study. Total Qual. Manag. Bus. Excell. 2020, 32, 1341–1358. [Google Scholar] [CrossRef]
- International Automotive Task Force. IATF 16949:2016—Sanctioned Interpretations, 5th ed.; Sanctioned Interpretation (SIs) of Technical Specification IATF 16949:2016 Automotive Quality Management System Standard, Quality Management System Requirements for Automotive Production and Relevant Service Parts Organizations; International Automotive Task Force (IATF), SMMT Industry Forum Ltd.: Birmingham, UK, 2022; p. 30. Available online: https://www.iatfglobaloversight.org/wp/wp-content/uploads/2022/04/IATF-Rules-5th-Edition-Sanctioned-Interpretations_Apr-2022.pdf (accessed on 21 May 2022).
- TouchGraph Navigator. Available online: https://www.touchgraph.com/navigator (accessed on 11 December 2021).
- Majernik, M.; Daneshjo, N.; Chovancová, J.; Sanciova, G. Design of integrated management systems according to the revised ISO standards. Pol. J. Manag. Stud. 2017, 15, 135–143. [Google Scholar] [CrossRef]
- IATF Observer Guideline, 1st ed; International Automotive Task Force (IATF), SMMT Industry Forum Ltd.: Birmingham, UK, 2017; p. 2. Available online: https://www.iatfglobaloversight.org/wp/wp-content/uploads/2020/12/IATF-Observer-Guideline.pdf (accessed on 3 December 2021).
- Standard ISO 10012:2003 Measurement Management Systems—Requirements for Measurement Processes and Measuring Equipment, ISO/TC 176/SC 3 Supporting Technologies. ICS: 01.040.03 Services. Company Organization, Management and Quality. Admin-istration. Transport. Sociology. (Vocabularies) and 03.100.70 Management systems, 1st ed.; International Organization for Standardization with Technical Committee: Geneva, Switzerland, 2003; p. 19.
- Standard ISO 14001:2015 Environmental Management Systems—Requirements with Guidance for Use, ISO/TC 207/SC 1 Environmental Management Systems. ICS: 03.100.70 Management Systems and ICS 13.020.10 Environmental Management, 3rd ed.; International Organization for Standardization with Technical Committee: Geneva, Switzerland, 2015; p. 35.
- Standard ISO/IEC 27001:2013 Information Technology—Security Techniques—Information Security Management Systems—Requirements, ISO/IEC JTC 1/SC 27 Information Security. Cybersecurity and Privacy Protection; ICS 35.030 IT Security and ICS: 03.100.70 Management Systems, 2nd ed.; International Organization for Standardization with Technical Committee: Geneva, Switzerland, 2013; p. 23.
- Standard ISO 22301:2019 Security and Resilience—Business Continuity Management Systems—Requirements, ISO/TC 292 Security and Resilience. ICS: 03.100.01 Company Organization and Management in General and ICS: 03.100.70 Management Systems, 2nd ed.; International Organization for Standardization with Technical Committee: Geneva, Switzerland, 2019; p. 21.
- Standard ISO 28000:2007 Specification for Security Management Systems for the Supply Chain, ISO/TC 292 Security and Resilience. ICS: 03.100.01 Company Organization and Management in General and ICS: 03.100.70 Management Systems, 1st ed.; International Organization for Standardization with Technical Committee: Geneva, Switzerland, 2007; p. 16.
- Standard ISO 28001:2007 Security Management Systems for the Supply Chain—Best Practices for Implementing Supply Chain Security, Assessments and Plans—Requirements and Guidance, ISO/TC 292 Security and Resilience. ICS: 03.100.01 Company Organization and Management in General and ICS: 03.100.70 Management Systems, 1st ed.; International Organization for Standardization with Technical Committee: Geneva, Switzerland, 2007; p. 27.
- Standard ISO 28002:2011 Security Management Systems for the Supply Chain—Development of Resilience in the Supply Chain—Requirements with Guidance for Use, ISO/TC 292 Security and Resilience; ICS: 03; 100.01 Company Organization and Management in General and ICS: 03.100.70 Management Systems, 1st ed.; International Organization for Standardization with Technical Committee: Geneva, Switzerland, 2011; p. 55.
- Standard ISO 30301:2019 Information and Documentation—Management Systems for Records—Requirements, ISO/TC 46/SC 11 Archives/Records Management. ICS: 01.140.20 Information Sciences, 2nd ed.; International Organization for Standardization with Technical Committee: Geneva, Switzerland, 2019; p. 16.
- Standard ISO 37301:2021 Compliance Management Systems—Requirements with Guidance for Use, ISO/TC 309 Governance of Organizations. ICS: 03.100.01 Company Organization and Management in General and ICS: 03.100.02 Governance and Ethics and ICS: 03.100.70 Management Systems, 1st ed.; International Organization for Standardization with Technical Committee: Geneva, Switzerland, 2021; p. 40.
- Standard ISO 39001:2012 Road Traffic Safety (RTS) Management Systems—Requirements with Guidance for Use, ISO/TC 241 Road traffic Safety Management Systems. ICS: 03.100.70 Management Systems and ICS: 03.220.20 Road Transport, 1st ed.; International Organization for Standardization with Technical Committee: Geneva, Switzerland, 2012; p. 37.
- Standard ISO 44001:2017 Collaborative Business Relationship Management Systems—Requirements and Framework, ISO/TC 286 Collaborative Business Relationship Management. ICS: 03.100.01 Company Organization and Management in General and ICS: 03.100.70 Management SYSTEMS, 1st ed.; International Organization for Standardization with Technical Committee: Geneva, Switzerland, 2017; p. 60.
- Standard ISO 50001:2018; Energy Management Systems—Requirements with Guidance for Use, ISO/TC 301 Energy Management and Energy Savings. ICS: 27.015 Energy Efficiency. Energy Conservation in General and ICS:03.100.70 Management Systems, 2nd ed.; International Organization for Standardization with Technical Committee: Geneva, Switzerland, 2018; p. 30.
- Standard ISO/AWI 56001 Innovation Management—Innovation Management System—Requirements, ISO/TC 279 Innovation Management. ICS: 03.100.01 Company Organization and Management in General and ICS: 03.100.40 Research and Development and ICS: 03.100.70 Management Systems, 1st ed.; International Organization for Standardization with Technical Committee: Geneva, Switzerland, Under development.
- Naden, C. A New Evolution for Quality Management in the Automotive Industry; International Organization for Standardization: Geneva, Switzerland, 2016; Available online: https://www.iso.org/news/2016/08/Ref2109.html (accessed on 14 January 2022).
- Silva, C.S.; Magano, J.; Matos, A.; Nogueira, T. Sustainable Quality Management Systems in the Current Paradigm: The Role of Leadership. Sustainability 2021, 13, 2056. [Google Scholar] [CrossRef]
- Nováková, R.; Šujanová, J.; Ševčíková, M. The importance of quality inspection in the process of permanent improvement. In Toyotaryzm. Analiza Strumieni Wartości z Wykorzystaniem Metody Bost, 1st ed.; Polski Instytut Jakości: Warsaw, Poland, 2016; pp. 33–61. ISBN 978-83-946495-3-1. [Google Scholar]
Figure 1.
The core node “Standard IATF 16949:2016 AQMS” with its main clauses (Source: author).

Figure 2.
PDCA cycle cluster—nodes PLAN, DO, CHECK, ACT with their relations—software cut-out (Source: author).
Figure 2.
PDCA cycle cluster—nodes PLAN, DO, CHECK, ACT with their relations—software cut-out (Source: author).

Figure 3.
The cut-out of IATF 16949 cluster as viewed in the software with its affiliated requirements, documented information, and notes; (Source: author).
Figure 3.
The cut-out of IATF 16949 cluster as viewed in the software with its affiliated requirements, documented information, and notes; (Source: author).
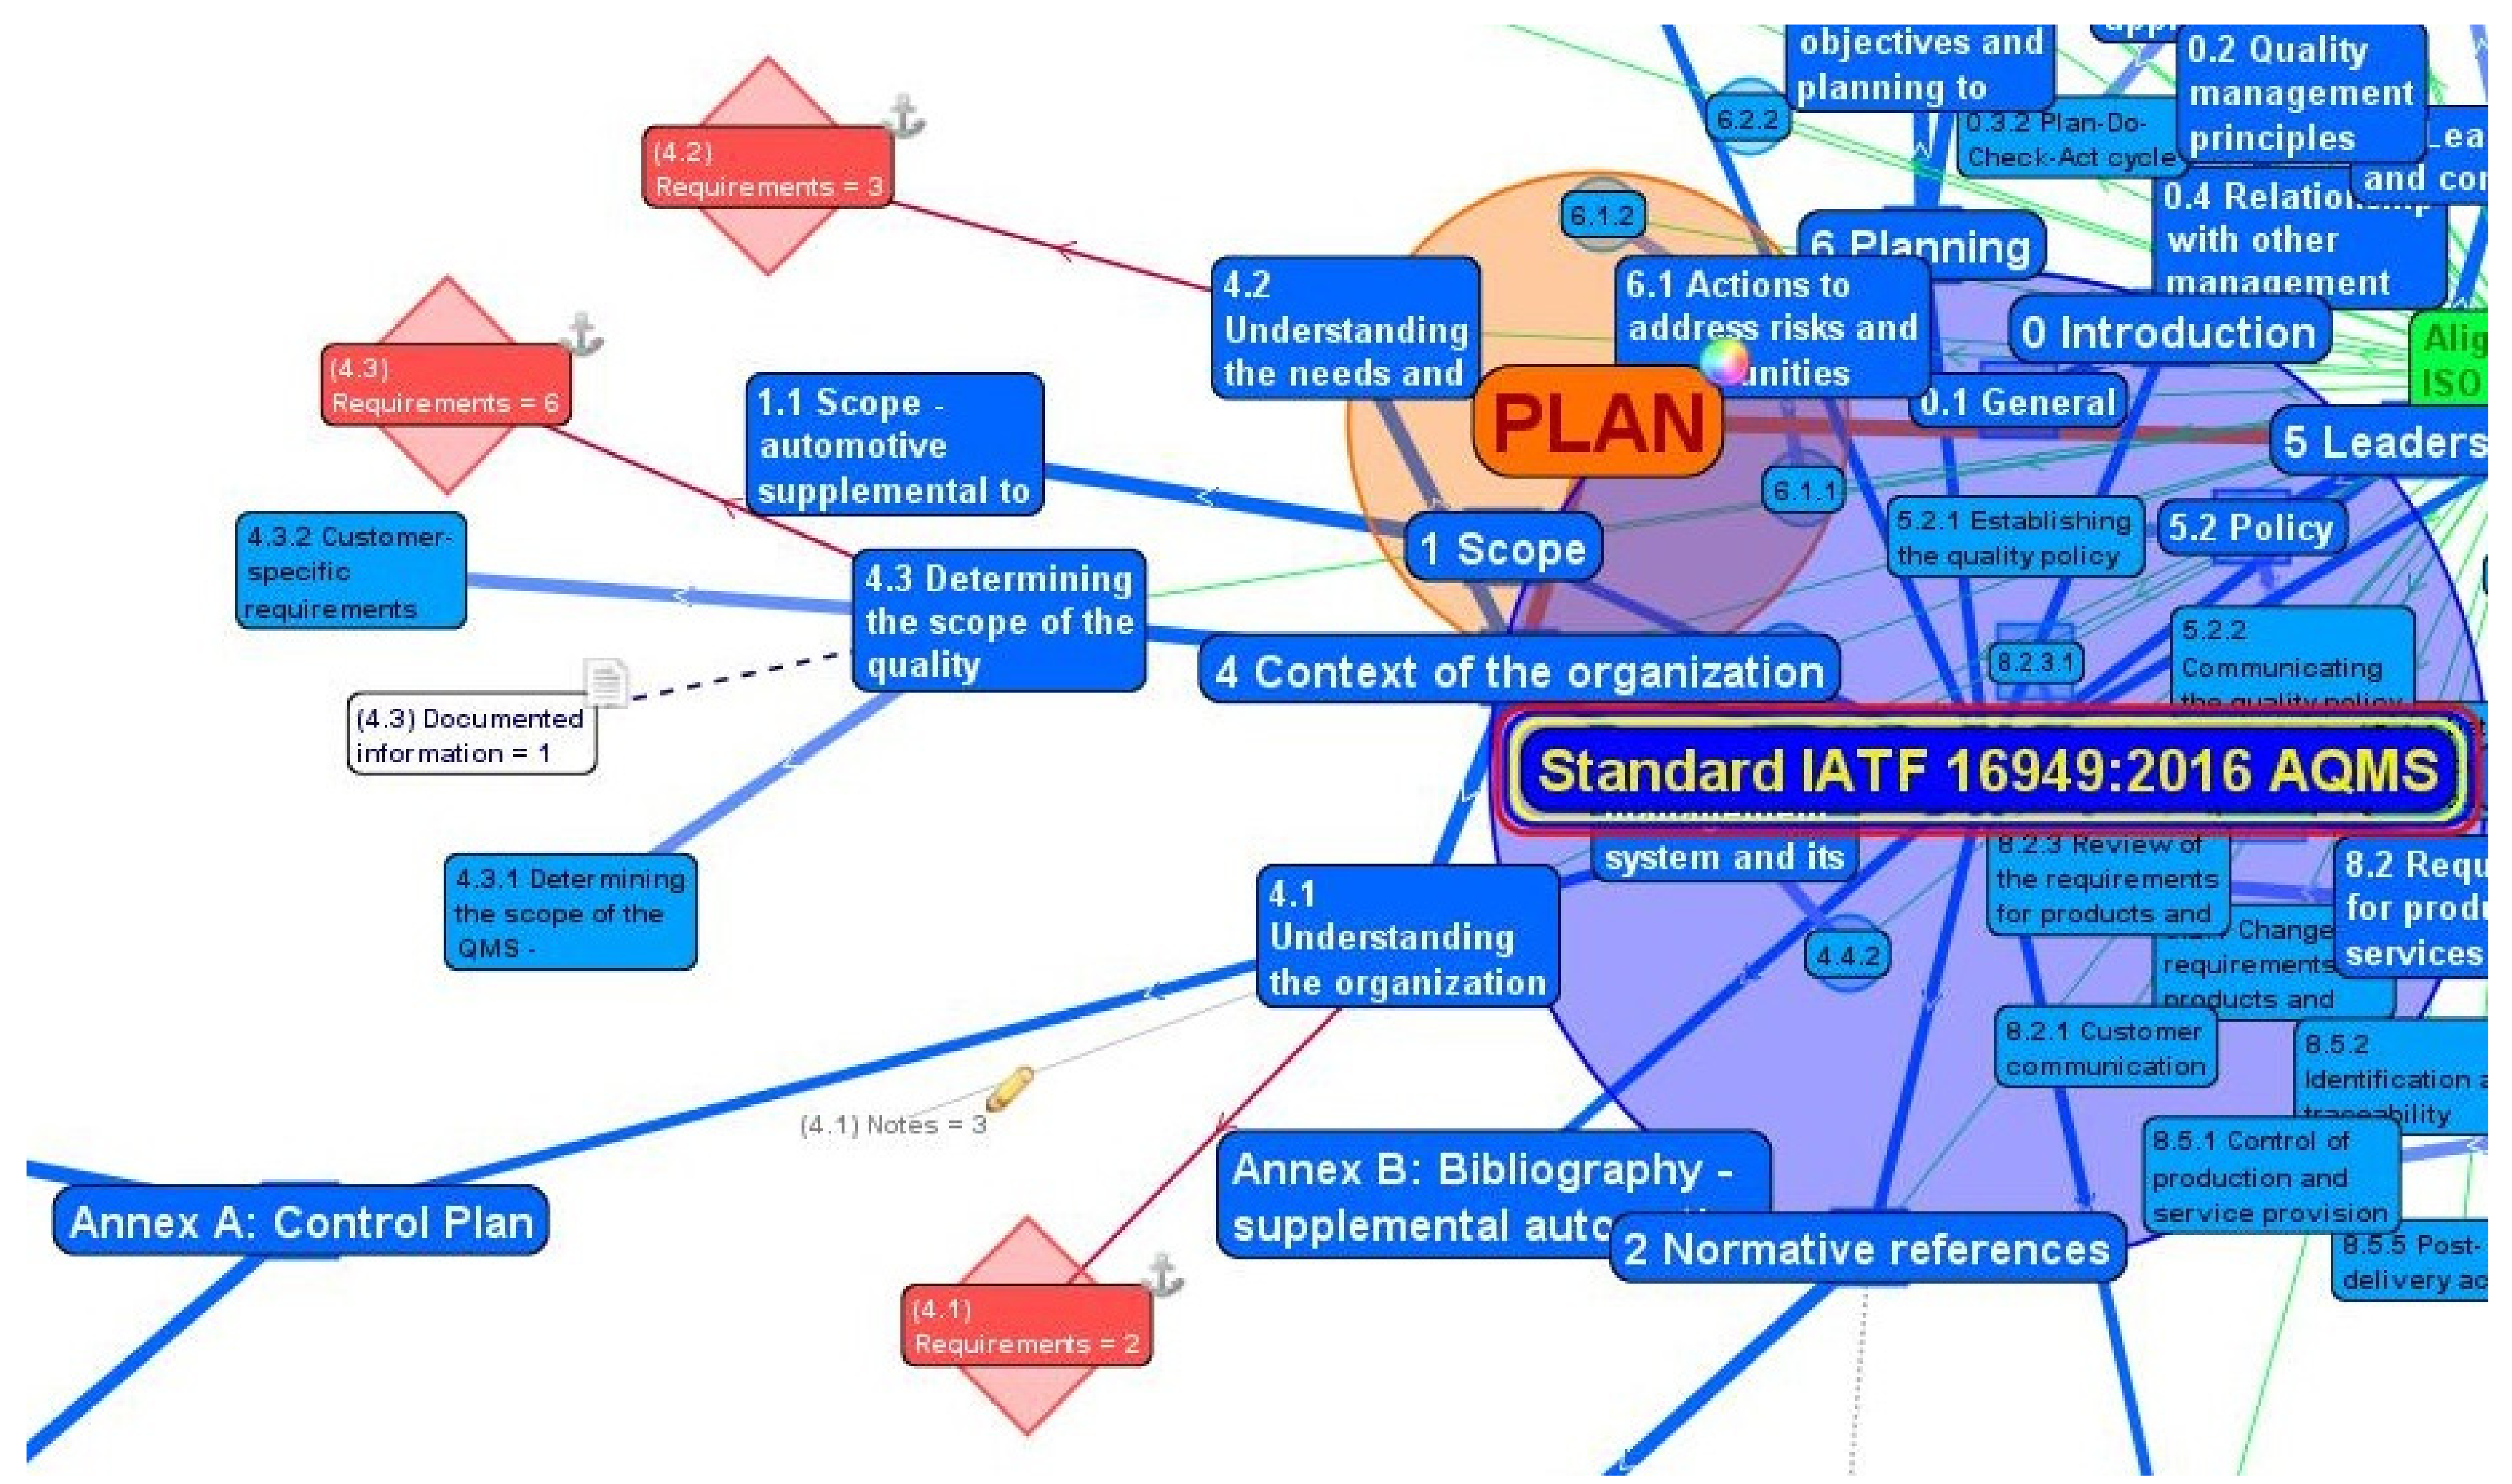
Figure 4.
Full view of a complex cluster for individual MSS according to IATF 16949 —three with their affiliated clauses, subclauses, requirements, documented information, and notes; (Source: author). Note: Figure 4 is also available in the section Supplementary Materials in higher resolution.
Figure 4.
Full view of a complex cluster for individual MSS according to IATF 16949 —three with their affiliated clauses, subclauses, requirements, documented information, and notes; (Source: author). Note: Figure 4 is also available in the section Supplementary Materials in higher resolution.

Figure 5.
Partial display of the description window of the activated by sub-sub-clause 8.6.3 “Appearance items” for quick insight into the details of the given requirements (Source: author).
Figure 5.
Partial display of the description window of the activated by sub-sub-clause 8.6.3 “Appearance items” for quick insight into the details of the given requirements (Source: author).

Table 1.
Phases of PDCA Cycle management system according to IATF 16949 (Source: author).
| Phase of PDCA Cycle | ISO 9001 (Base) and IATF 16949 (Extension/Supplemental) |
|---|---|
| 0 Introduction | |
| 0.1 General | |
| 0.2 Quality management principles | |
| 0.3 Process approach | |
| 0.3.1 General | |
| 0.3.2 Plan-Do-Check-Act cycle | |
| 0.3.3 Risk-based thinking | |
| 0.4 Relationship with other MSSs 1 | |
| 1 Scope | |
| 1.1 Scope—automotive supplemental to ISO 9001:2015 | |
| 2 Normative references | |
| 2.1 Normative and informative references | |
| 3 Terms and definitions | |
| 3.1 Terms and definitions for the automotive industry | |
| 4 Context of the organization | |
| 4.1 Understanding the organization and its context | |
| I. phase: PLAN | 4.2 Understanding the needs and expectations of interested parties |
| I. phase: PLAN | 4.3 Determining the scope of the QMS 2 |
| 4.3.1 Determining the scope of the QMS—supplemental | |
| 4.3.2 Customer-specific requirements | |
| 4.4 Quality management system and its processes | |
| 4.4.1 | |
| I. phase: PLAN | 4.4.1.1 Conformance of product and processes |
| I. phase: PLAN | 4.4.1. 2 Product safety |
| 4.4.2 | |
| 5 Leadership | |
| 5.1 Leadership and commitment | |
| 5.1.1 General | |
| 5.1.1.1 Corporate responsibility | |
| 5.1.1.2 Process effectiveness and efficiency | |
| 5.1.1.3 Process owners | |
| 5.1.2 Customer focus | |
| I. phase: PLAN | 5.2 Policy |
| I. phase: PLAN | 5.2.1 Establishing the quality policy |
| I. phase: PLAN | 5.2.2 Communicating the quality policy |
| I. phase: PLAN | 5.3 Organizational roles, responsibilities, and authorities |
| I. phase: PLAN | 5.3.1 Organizational roles, responsibilities, and authorities—supplemental |
| I. phase: PLAN | 5.3.2 Responsibility and authority for product requirements and corrective actions |
| All clauses No. 6—I. phase: PLAN | 6 Planning |
| 6.1 Actions to address risks and opportunities | |
| 6.1.1 | |
| 6.1.2 | |
| 6.1.2.1 Risk analysis | |
| 6.1.2.2 Preventive action | |
| 6.1.2.3 Contingency plans | |
| 6.2 Quality objectives and planning to achieve them | |
| 6.2.1 | |
| 6.2.2 | |
| 6.2.2 | |
| 6.2.2.1 Quality objectives and planning to achieve them—supplemental | |
| 6.3 Planning of changes | |
| All clauses No. 7—II. phase: DO | 7 Support |
| 7.1 Resources | |
| 7.1.1 General | |
| 7.1.2 People | |
| 7.1.3 Infrastructure | |
| 7.1.3.1 Plan, facility, and equipment planning | |
| 7.1.4 Environment for the operation of processes | |
| 7.1.4.1 Environment for the operation of processes—supplemental | |
| 7.1.5 Monitoring and measuring resources | |
| 7.1.5.1 General | |
| 7.1.5.1.1 Measurement system analysis | |
| 7.1.5.2 Measurement traceability | |
| 7.1.5.2.1 Calibration/verification records | |
| 7.1.5.3 Laboratory requirements | |
| 7.1.5.3.1 Internal laboratory | |
| 7.1.5.3.2 External laboratory | |
| 7.1.6 Organizational knowledge | |
| 7.2 Competence | |
| 7.2.1 Competence—supplemental | |
| 7.2.2 Competence—on-the-job | |
| 7.2.3 Internal auditor competency | |
| 7.2.4 Second-party auditor competency | |
| 7.3 Awareness | |
| 7.3.1 Awareness—supplemental | |
| 7.3.2 Employee motivation and empowerment | |
| 7.4 Communication | |
| 7.5 Documented information | |
| 7.5.1 General | |
| 7.5.1.1 Quality management system documentation | |
| 7.5.2 Creating and updating | |
| 7.5.3 Control of documented information | |
| 7.5.3.1 | |
| 7.5.3.2 | |
| 7.5.3.2.1 Record retention | |
| 7.5.3.2.2 Engineering specifications | |
| All clauses No. 8—II. phase: DO | 8 Operation |
| 8.1 Operational planning and control | |
| 8.1.1 Operational planning and control—supplement | |
| 8.1.2 Confidentiality | |
| 8.2 Requirements for products and services | |
| 8.2.1 Customer communication | |
| 8.2.1.1 Customer communication—supplemental | |
| 8.2.2 Determining the requirements for products and services | |
| 8.2.2.1 Determining the requirements for products and services—supplemental | |
| 8.2.3 Review of the requirements for products and services | |
| 8.2.3.1 | |
| 8.2.3.1.1 Review of the requirements for products and services—supplemental | |
| 8.2.3.1.2 Customer-designated special characteristics | |
| 8.2.3.1.3 Organization manufacturing feasibility | |
| 8.2.3 Review of the requirements for products and services | |
| 8.2.4 Changes to requirements for products and services | |
| 8.3 Design and development of products and services | |
| 8.3.1 General | |
| 8.3.1.1 Design and development of products and services—supplemental | |
| 8.3.2 Design and development planning | |
| 8.3.2.1 Design and development planning—supplemental | |
| 8.3.2.2 Product design skills | |
| 8.3.2.3 Development of products with embedded software | |
| 8.3.3 Design and development inputs | |
| 8.3.3.1 Product design and development inputs | |
| 8.3.3.2 Manufacturing process design input | |
| 8.3.3.3 Special characteristics | |
| 8.3.4 Design and development controls | |
| 8.3.4.1 Monitoring | |
| 8.3.4.2 Design and development of validation | |
| 8.3.4.3 Prototype program | |
| 8.3.4.4 Product approval process | |
| 8.3.5 Design and development outputs | |
| 8.3.5.1 Design and development outputs—supplemental | |
| 8.3.5.2 Manufacturing process design output | |
| 8.3.6 Design and development changes | |
| 8.3.6.1 Design and development changes—supplemental | |
| 8.4 Control of externally provided processes, products and services | |
| 8.4.1 General | |
| 8.4.1.1 General—supplemental | |
| 8.4.1.2 Supplier selection process | |
| 8.4.1.3 Customer-directed sources (also known as “Directed-Buy”) | |
| 8.4.2 Type and extent of control | |
| 8.4.2.1 Type and extent of control—supplemental | |
| 8.4.2.2 Statutory and regulatory requirements | |
| 8.4.2.3 Supplier quality MS development | |
| 8.4.2.3.1 Automotive product-related SW or automotive products with embedded SW | |
| 8.4.2.4 Supplier monitoring | |
| 8.4.2.4.1 Second-party audits | |
| 8.4.2.5 Supplier development | |
| 8.4.3 Information for external providers | |
| 8.4.3.1 Information for external providers—supplemental | |
| 8.5 Production and service provision | |
| 8.5.1 Control of production and service provision | |
| 8.5.1.1 Control plan | |
| 8.5.1.2 Standardized work—operator instructions and visual standards | |
| 8.5.1.3 Verification of job set-ups | |
| 8.5.1.4 Verification after shutdown | |
| 8.5.1.5 Total productive maintenance | |
| 8.5.1.6 Management of production tooling and manufacturing, test, inspection tooling and equipment | |
| 8.5.1.7 Production scheduling | |
| 8.5.2 Identification and traceability | |
| 8.5.2.1 Identification and traceability—supplemental | |
| 8.5.3 Property belonging to customers or external providers | |
| 8.5.4 Preservation | |
| 8.5.4.1 Preservation—supplemental | |
| 8.5.5 Post-delivery activities | |
| 8.5.5.1 Feedback of information from service | |
| 8.5.5.2 Service agreement with customer | |
| 8.5.6 Control of changes | |
| 8.5.6.1 Control of changes—supplemental | |
| 8.5.6.1.1 Temporary change of process controls | |
| 8.6 Release of products and services | |
| 8.6.1 Release of products and services—supplemental | |
| 8.6.2 Layout inspection and functional testing | |
| 8.6.3 Appearance items | |
| 8.6.4 Verification and acceptance of conformity of externally provided products and services | |
| 8.6.5 Statutory and regulatory conformity | |
| 8.6.6 Acceptance criteria | |
| 8.7 Control of nonconforming | |
| 8.7.1 | |
| 8.7.1.1 Customer authorization for concession | |
| 8.7.1.2 Control of nonconforming product—customer-specified process | |
| 8.7.1.3 Control of suspect product | |
| 8.7.1.4 Control of reworked product | |
| 8.7.1.5 Control of repaired product | |
| 8.7.1.6 Customer notification | |
| 8.7.1.7 Nonconforming product disposition | |
| 8.7.2 | |
| All clauses No. 9—III. phase CHECK | 9 Performance evaluation |
| 9.1 Monitoring, measurement, analysis and evaluation | |
| 9.1.1 General | |
| 9.1.1.1 Monitoring and measurement of manufacturing processes | |
| 9.1.1.2 Identification of statistical tools | |
| 9.1.1.3 Application of statistical concepts | |
| 9.1.2 Customer satisfaction | |
| 9.1.2.1 Customer satisfaction—supplemental | |
| 9.1.3 Analysis and evaluation | |
| 9.1.3.1 Prioritization | |
| 9.2 Internal audit | |
| 9.2.1 | |
| 9.2.2 | |
| 9.2.2.1 Internal audit program | |
| 9.2.2.2 QMS audit | |
| 9.2.2.3 Manufacturing process audit | |
| 9.2.2.4 Product audit | |
| 9.3 Management review | |
| 9.3.1 General | |
| 9.3.1.1 Management review—supplemental | |
| 9.3.2 Management review inputs | |
| 9.3.2.1 Management review inputs—supplemental | |
| 9.3.3 Management review outputs | |
| 9.3.3.1 Management review outputs—supplemental | |
| All clauses No. 10—IV. phase ACT | 10 Improvement |
| 10.1 General | |
| 10.2 Nonconformity and corrective action | |
| 10.2.1 | |
| 10.2.2 | |
| 10.2.3 Problem solving | |
| 10.2.4 Error-proofing | |
| 10.2.5 Warranty MS | |
| 10.2.6 Customer complaints and field failure test analysis | |
| 10.3 Continual improvement | |
| 10.3.1 Continual improvement—supplemental | |
| Annex A: Control Plan | |
| A.1 Phases of the control plan | |
| (a) Prototype | |
| (b) Pre-launch | |
| (c) Production | |
| A.2 Elements of the control plan | |
| General data | |
| Product control | |
| Process control | |
| Methods | |
| Reaction plan | |
| Annex B: Bibliography—supplemental automotive | |
| Internal audit | |
| Nonconformity and corrective action | |
| Measurement system analysis | |
| Product approval | |
| Product design | |
| Product control | |
| QMS administration | |
| Risk analysis | |
| SW process assessment | |
| Statistical tools | |
| Supplier quality management | |
| Health and Safety |
1 MSSs—Management Systems Standards. 2 QMS—Quality Management Systems.
Table 2.
The selected ISO standards with a potential for integration visualization (arranged by standard number from lowest to highest).
Table 2.
The selected ISO standards with a potential for integration visualization (arranged by standard number from lowest to highest).
| Number of ISO Standard | Year of Publication | Title of Standard for Management Systems (MSs) | Requirements {R} Guidance for Use {G} | Reference |
|---|---|---|---|---|
| 10012 | 2003 | Measurement MSs | {R} for measurement processes and measuring equipment | [28] |
| 14001 | 2015 | Environmental MSs | {R} with {G} | [29] |
| 27001 1 | 2013 | Information technology—Security techniques— Information security MSs | {R} | [30] |
| 22301 | 2019 | Security and resilience—Business continuity MSs | {R} | [31] |
| 28000 | 2007 | Specification for security MSs for the supply chain | [32] | |
| 28001 | 2007 | Security MSs for the supply chain—Best practices for implementing supply chain security, assessments and plans | {R} and guidance | [33] |
| 28002 | 2011 | Security MSs for the supply chain—Development of resilience in the supply chain | {R} with {G} | [34] |
| 30301 | 2019 | Information and documentation—MSs for records | {R} | [35] |
| 37301 | 2021 | Compliance MSs | {R} with {G} | [36] |
| 39001 | 2012 | Road traffic safety (RTS) MSs | {R} with {G} | [37] |
| 44001 | 2017 | Collaborative business relationship MSs | {R} and framework | [38] |
| 50001 | 2018 | Energy MSs | {R} with {G} | [39] |
| 56001 2 | 202X | Innovation management—Innovation MSs | {R} with {G} | [40] |
1 ISO/IEC; 2 ISO/AWI.
Publisher’s Note: MDPI stays neutral with regard to jurisdictional claims in published maps and institutional affiliations. |
© 2022 by the author. Licensee MDPI, Basel, Switzerland. This article is an open access article distributed under the terms and conditions of the Creative Commons Attribution (CC BY) license (https://creativecommons.org/licenses/by/4.0/).
Share and Cite
MDPI and ACS Style
Pauliková, A. Visualization Concept of Automotive Quality Management System Standard. Standards 2022, 2, 226-245. https://doi.org/10.3390/standards2020017
AMA Style
Pauliková A. Visualization Concept of Automotive Quality Management System Standard. Standards. 2022; 2(2):226-245. https://doi.org/10.3390/standards2020017
Chicago/Turabian StylePauliková, Alena. 2022. "Visualization Concept of Automotive Quality Management System Standard" Standards 2, no. 2: 226-245. https://doi.org/10.3390/standards2020017