
Photovoltaic Qualification and Approval Tests


Renewable Energy Group, Northeast National University UNNE, Corrientes W3400BCH, Argentina
*
Author to whom correspondence should be addressed.
Standards 2022, 2(2), 136-156; https://doi.org/10.3390/standards2020011
Submission received: 20 January 2022
/
Revised: 25 February 2022
/
Accepted: 28 February 2022
/
Published: 21 April 2022
(This article belongs to the Special Issue Exclusive Papers Collection of Editorial Board Members and Invited Scholars in Standards)
Abstract
:This paper presents the main aspects of implementing a laboratory for testing qualification and approval related to crystalline silicon terrestrial photovoltaic devices. In this aspect, a simplified review-based IEC 61215 standard methodology for mechanical and electrical tests is presented from a practical-experimental view. The instrumental requirements and uncertainties are discussed. Specially focused on the nowadays high-size PV modules.
1. Introduction
This work aims to help manufacturers understand the key concepts and standards involved in the photovoltaic (PV) module certification. In this manner, previous verifications can be made before appealing to an accredited laboratory for its final certification. All procedures and the main concepts are presented condensed in an easy-to-read and to understand guide in order to be useful for readers to quickly identify relevant information.
Throughout this paper, it is considered the reader is familiar with the electrical, mechanical, and environmental quantities required to understand the standards described.
The IEC 61215 standard [1] lays down requirements for the design qualification and type approval of terrestrial photovoltaic modules suitable for long-term operation [2]. This paper describes the procedures referred to that particular standard and does not include PV modules used with concentrated sunlight, neither bifacial nor flexible technology, making an effort to focus on typical crystalline silicon (C-Si) PV modules.
This testing guide is considered from a practical point of view. Among the several PV devices referred to in the standard, we will center on C-Si PV modules of several Watt-peak because these are the most commonly available in the actual market [3]. The method employed in each test is the easiest to implement or is typically implemented in PV modules from tens to hundreds of Watt-peak.
Thus, this paper exposed the main aspect presented in the IEC 61215-2 standard [4], where all these tests are precisely detailed, following an ordered sequence and test procedures. Here, we include advice from our practical experience getting from implementing them. We do not intend to review the different ways to perform specific tests. Otherwise, we point to re-order and re-write the concepts presented, assisted with simple graphics.
Passing these tests, we can assume the PV module can withstand prolonged weather exposure. Further, from this, reliable technical information is extracted [5]. Thanks to the implementation and application of the mentioned standard, the actual market may adopt 20 or more years of warranty in their products [6].
For further details, we highly recommend evaluating the original text.
2. Preparation
It is recommended each PV module must have a clear and unique identification and must be time perdurable—this is helpful for further references or test repetitions. The label must highlight the manufacturer’s logo or name, following the model and serial number.
The absolute maximum ratings can be labeled too (if they are known); otherwise, it must be verified before the testing starts by a sector manager in order to avoid electrical or mechanical risks.
First of all, as is indicated in the IEC 61215-2, the PV module must be submitted through a so-called “preconditioning process” (see Test 19). This process suggests the module in open circuit condition must be under solar radiation, natural or artificial, into the range of 5 kWh/m2 to 5.5 kWh/m2. In other words, if we assume a mean irradiance of 800 W/m2, we must leave the module for about 7 h to achieve the energy level recommended.
Finished the preconditioning process, the tests can start. The latest mentioned IEC standards [4] lists 21 tests that can be carried out, and several of them, to ensure good performance in its service life. The following sections describe this set of tests in detail.
Each of the modules must successfully pass the so-called test criteria. The principal aspect related to the pass criteria are:
- The maximum power output must be in the range indicated by the manufacturer and does not present a difference higher than 8% between tests.
- The module does not exhibit any open-circuit state or insulation deficiencies when a test is performed.
- It must pass a visual inspection. This inspection is related to “major visual defects” [7] that can be detected by a trained operator, involving: broken, bent, misaligned cells, frame or junction boxes, defects related to glue or substrate (such as bubbles or delaminations).
3. Tests
The objectives to be achieved with each test, the hardware used for it, the methodology to be followed, and the pass condition are described below.
3.1. Test 01—Visual Inspection
This test is in the easy difficulty level and does not necessarily require complex equipment or apparatus to carry out.
Objective. Look for visible defects in the module, including cells, frame, junction box, cables, glue, encapsulating, and so on, carrying out an analysis of all constructive aspects of the PV module.
Hardware. To carry out this test PV module must be carefully observed under light with an intensity of at least 1000 lux [8].
Methodology. A close examination with the naked eye must be performed on the whole of the module surfaces. The examiner must look for defects in the manufacturing process. Although there is a large spectrum of flaws that can be found in a PV module, the so-called major defects are:
- Misaligned, broken, bent, or not correctly ensemble frames.
- Adhesive bonds are not correctly positioned.
- Broken or cracked cells. Interconnection improperly implemented.
- Junction-box defects or exposed live electrical parts, or bypass diodes improperly welding or installed.
- Bubble detection or delamination, especially observed between frame and cells. This type of defect can point out to an electrical isolation problem.
- Any other manufacturing defect that can affect the PV module performance.
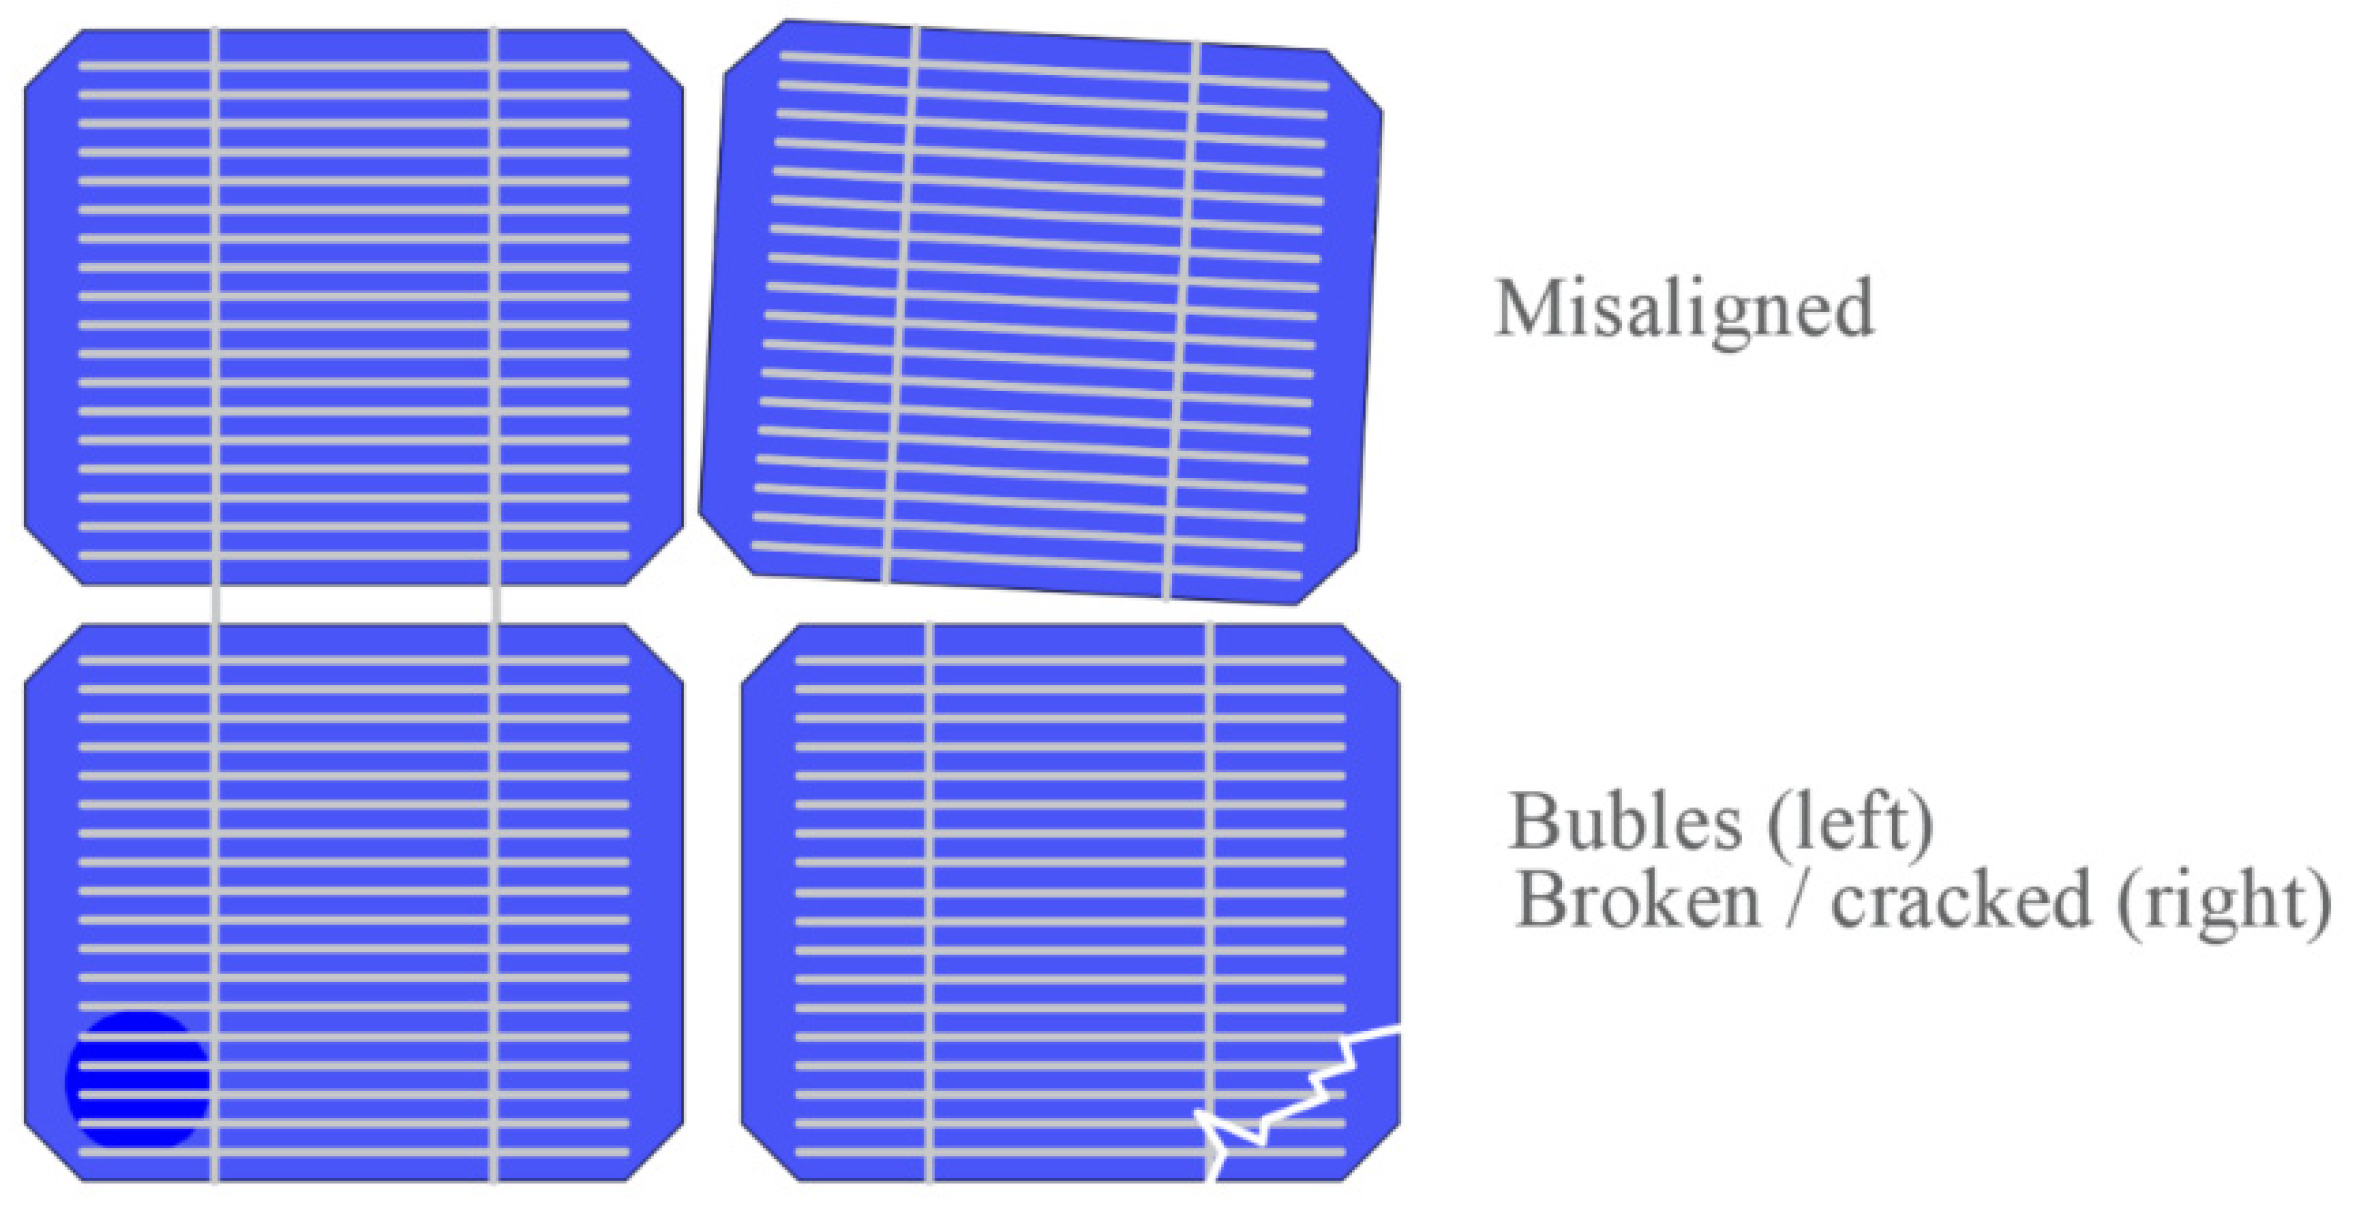
Some of the more common defects that might be found in the PV module are presented in Figure 1. This figure shows a pair of misaligned PV cells, a cell with a bubble on it, and a broken cell.
Pass. The module is approved and passes the test if any defects (known as major defects) are not present.
3.2. Test 02—Maximum Power Determination
This test probably is one of the most sophisticated and complicated to carry out. It is necessarily a complex device and equipment simultaneously with a high level of personal preparation. This determination is made before and after each environmental test to determine any deviation. It is considered acceptable if the difference between the tests is less than 5%. In most cases, the translation is carried out to the Standard Test Condition (STC) (measured at 100 W/m2, Tc = 25 °C, and spectral distribution AM 1.5) [9,10], finding out the nominal power delivered for the PV module or Watt-peak.
Objective. Found the module maximum power output under standard test conditions (STC), determining its power in Watt-peak. Find deviations related to environmental exposure.
Hardware. First, a radiant source is needed. It can be natural or artificial sunlight as a class B solar simulator or better, according to IEC 60904-9 Classification of solar simulator characteristics [11].
A PV reference cell or a PV reference module for irradiance determination. Preferably it must be manufactured with the same cell technology [12] to guarantee the same spectral response. In some cases, an identical third-party calibrated module may be used.
A temperature sensor or probe must be attached to the module backside, right behind a cell, with an accuracy of ±1 °C and repeatability of ±0.5 °C to determine the cell temperature. Usually, it is attached with tape and silicone grease [13] to assure proper thermal conductivity. For example, a PT100 probe is frequently used [14].
Electronics instruments to simultaneously measure the current and the voltage with an accuracy of ±0.2% of the reading to obtain a data set suitable for its I–V curve representation. For example, a pulse train can synchronize these instruments with an external trigger input, as described by [15].
The measuring range must be suitable to register the module Isc (short-circuit current) and Voc (open-circuit voltage). Often, a calibrated shunt resistance is used for indirect current determination. The sweep time must be fast enough to obtain the entire data set so that irradiance and cell temperature can be considered changeless [16]. There are several options to do this sweep.
The sweep can mainly be implemented with a four-quadrant programmable source, a controlled electronic load, or a capacitive analog load [17,18,19].
A rack or mount to support the module under test and the reference cell.
Conveniently, the supporting structure should allow the reorientation of the entire set into the sun (or sun simulator) radiation normal to the incidence plane.
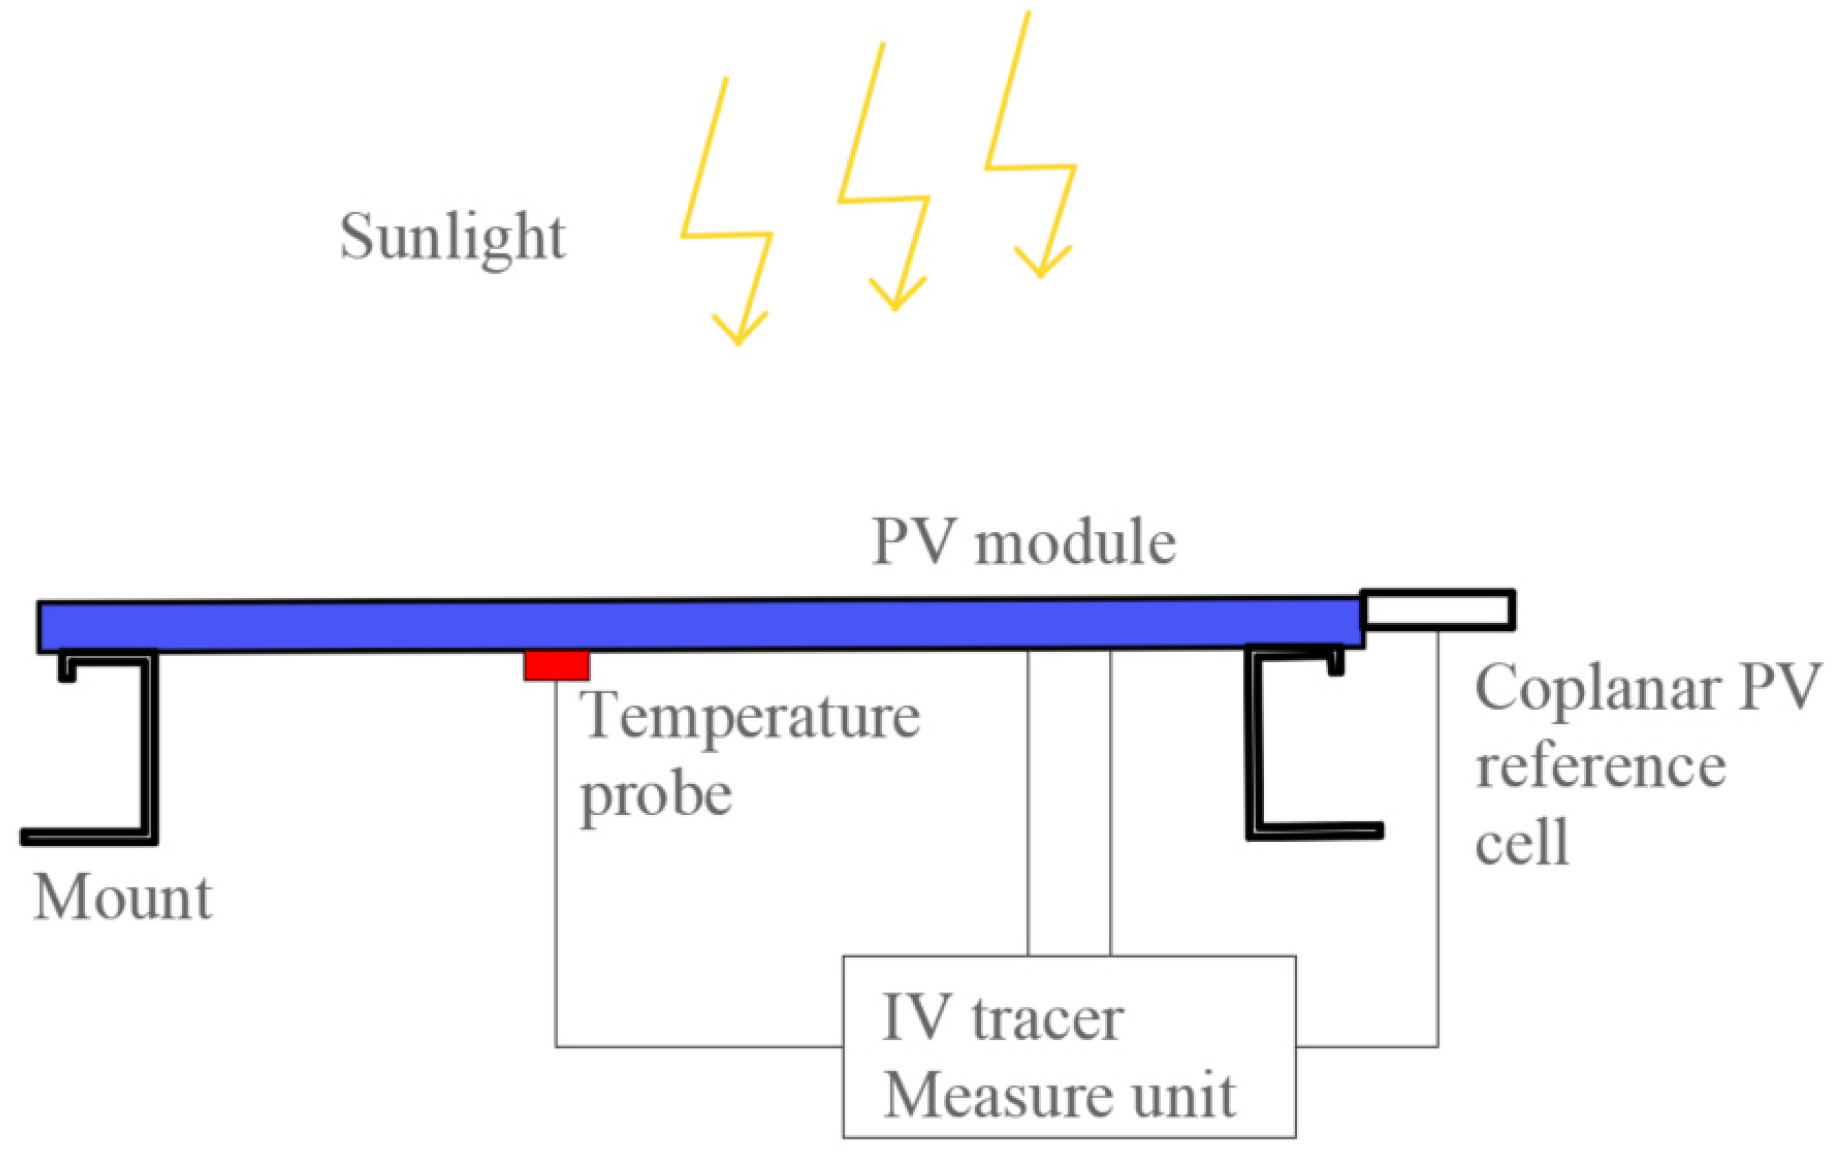
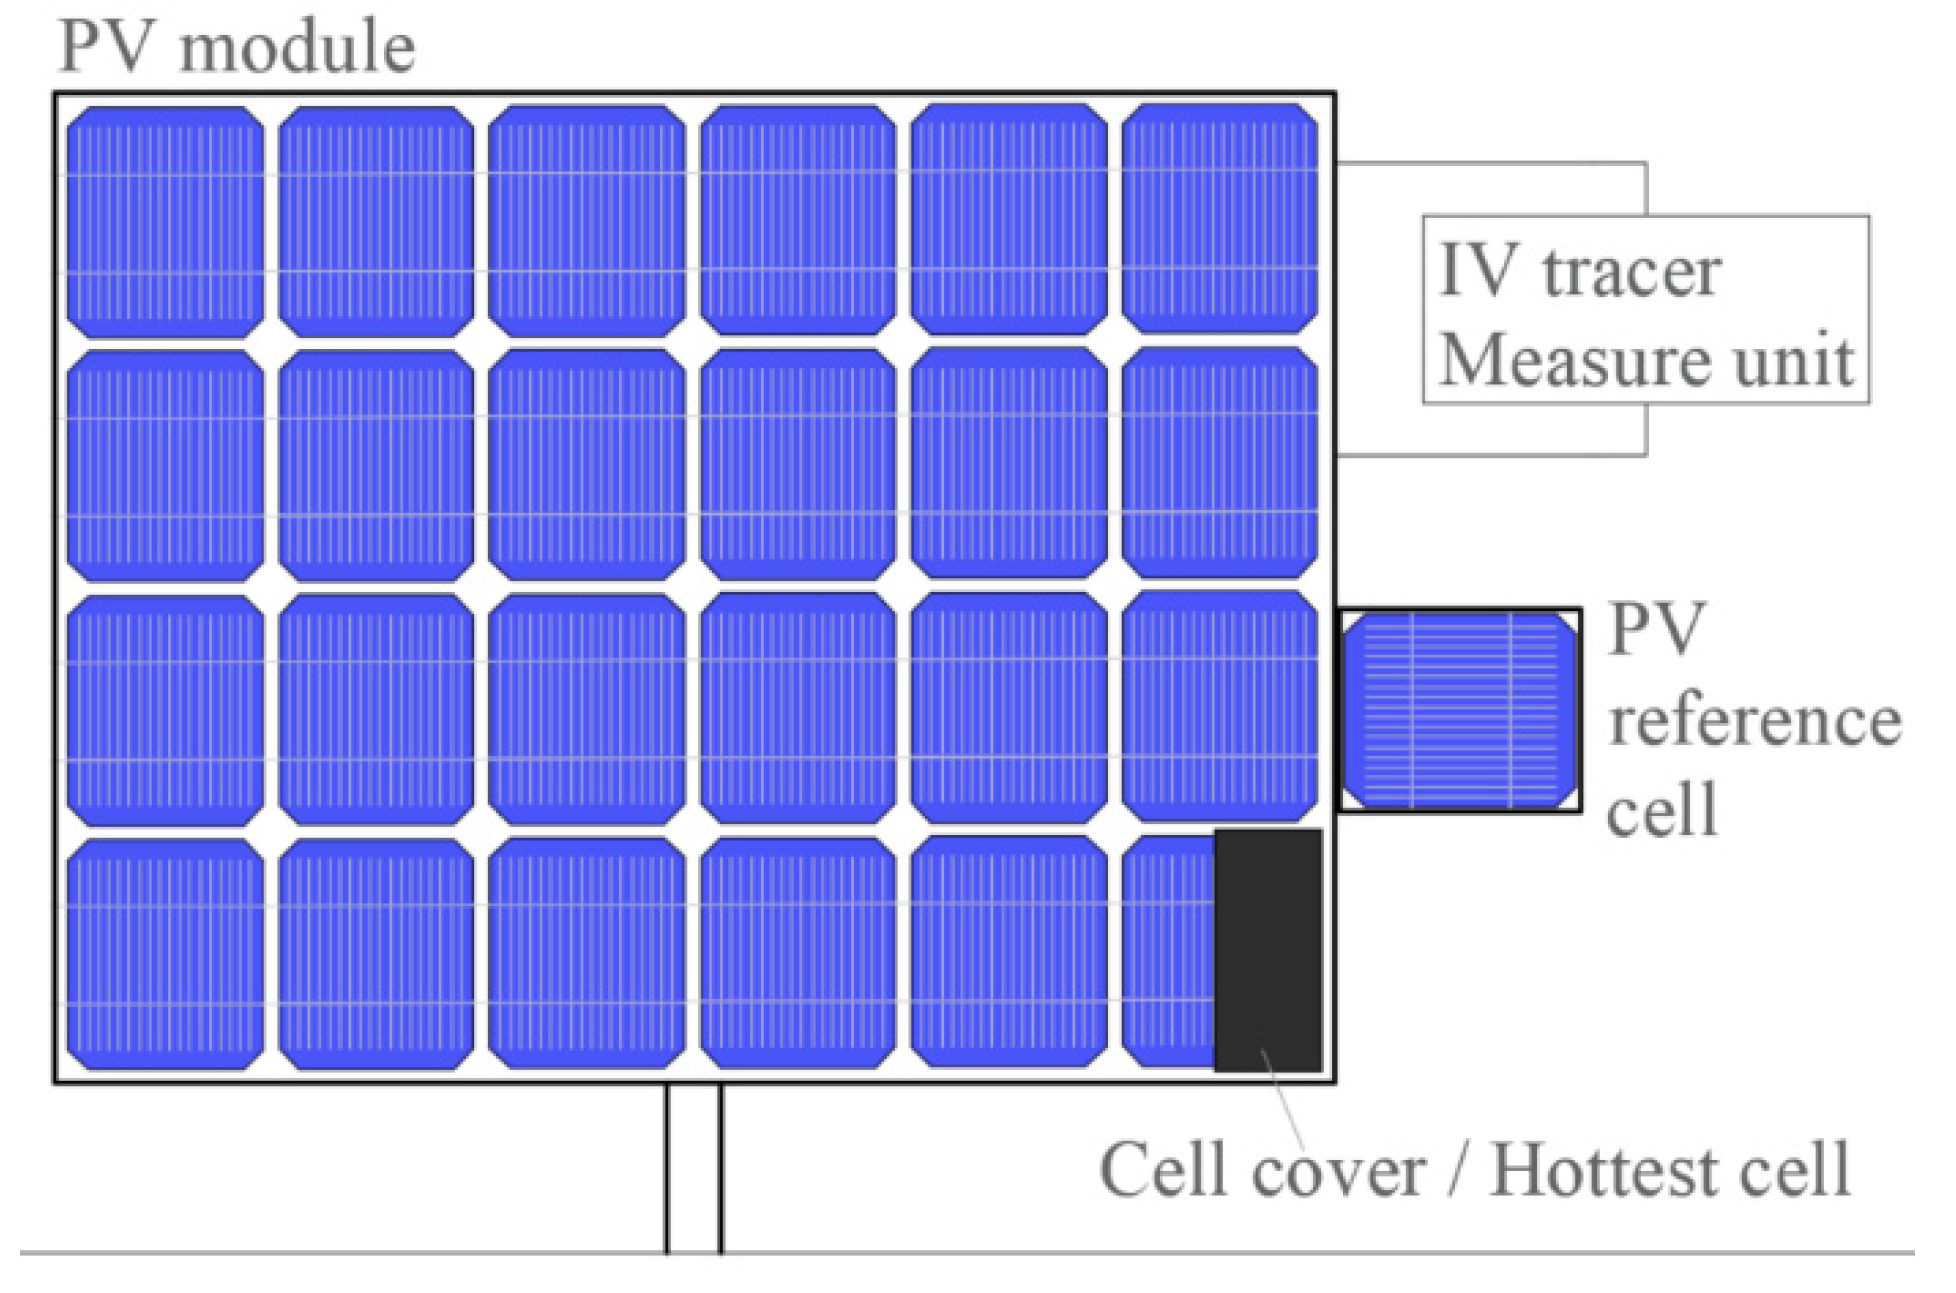
Methodology. The I–V curve must be traced between the cell temperature range of 25–50 °C, and the irradiance level range of 700–1100 W/m2. According to IEC 60904-1 “Measurement of photovoltaic current-voltage characteristics” [20], natural or artificial sunlight can be employed. To perform a comparison, the maximum power-point must be translated to the STC according to IEC 60891 [21], which indicates three different procedures for irradiance and temperature corrections of the characteristics I–V curve. The methodological setup for the maximum power determination test can be seen in Figure 2. This figure represents the PV module with the temperature probe attached to its backside and the reference cell-attached coplanar to its frame. The “IV tracer measure unit” indicates the set of instruments, control and commutation devices, and variable load required for the I–V curve data acquisition.
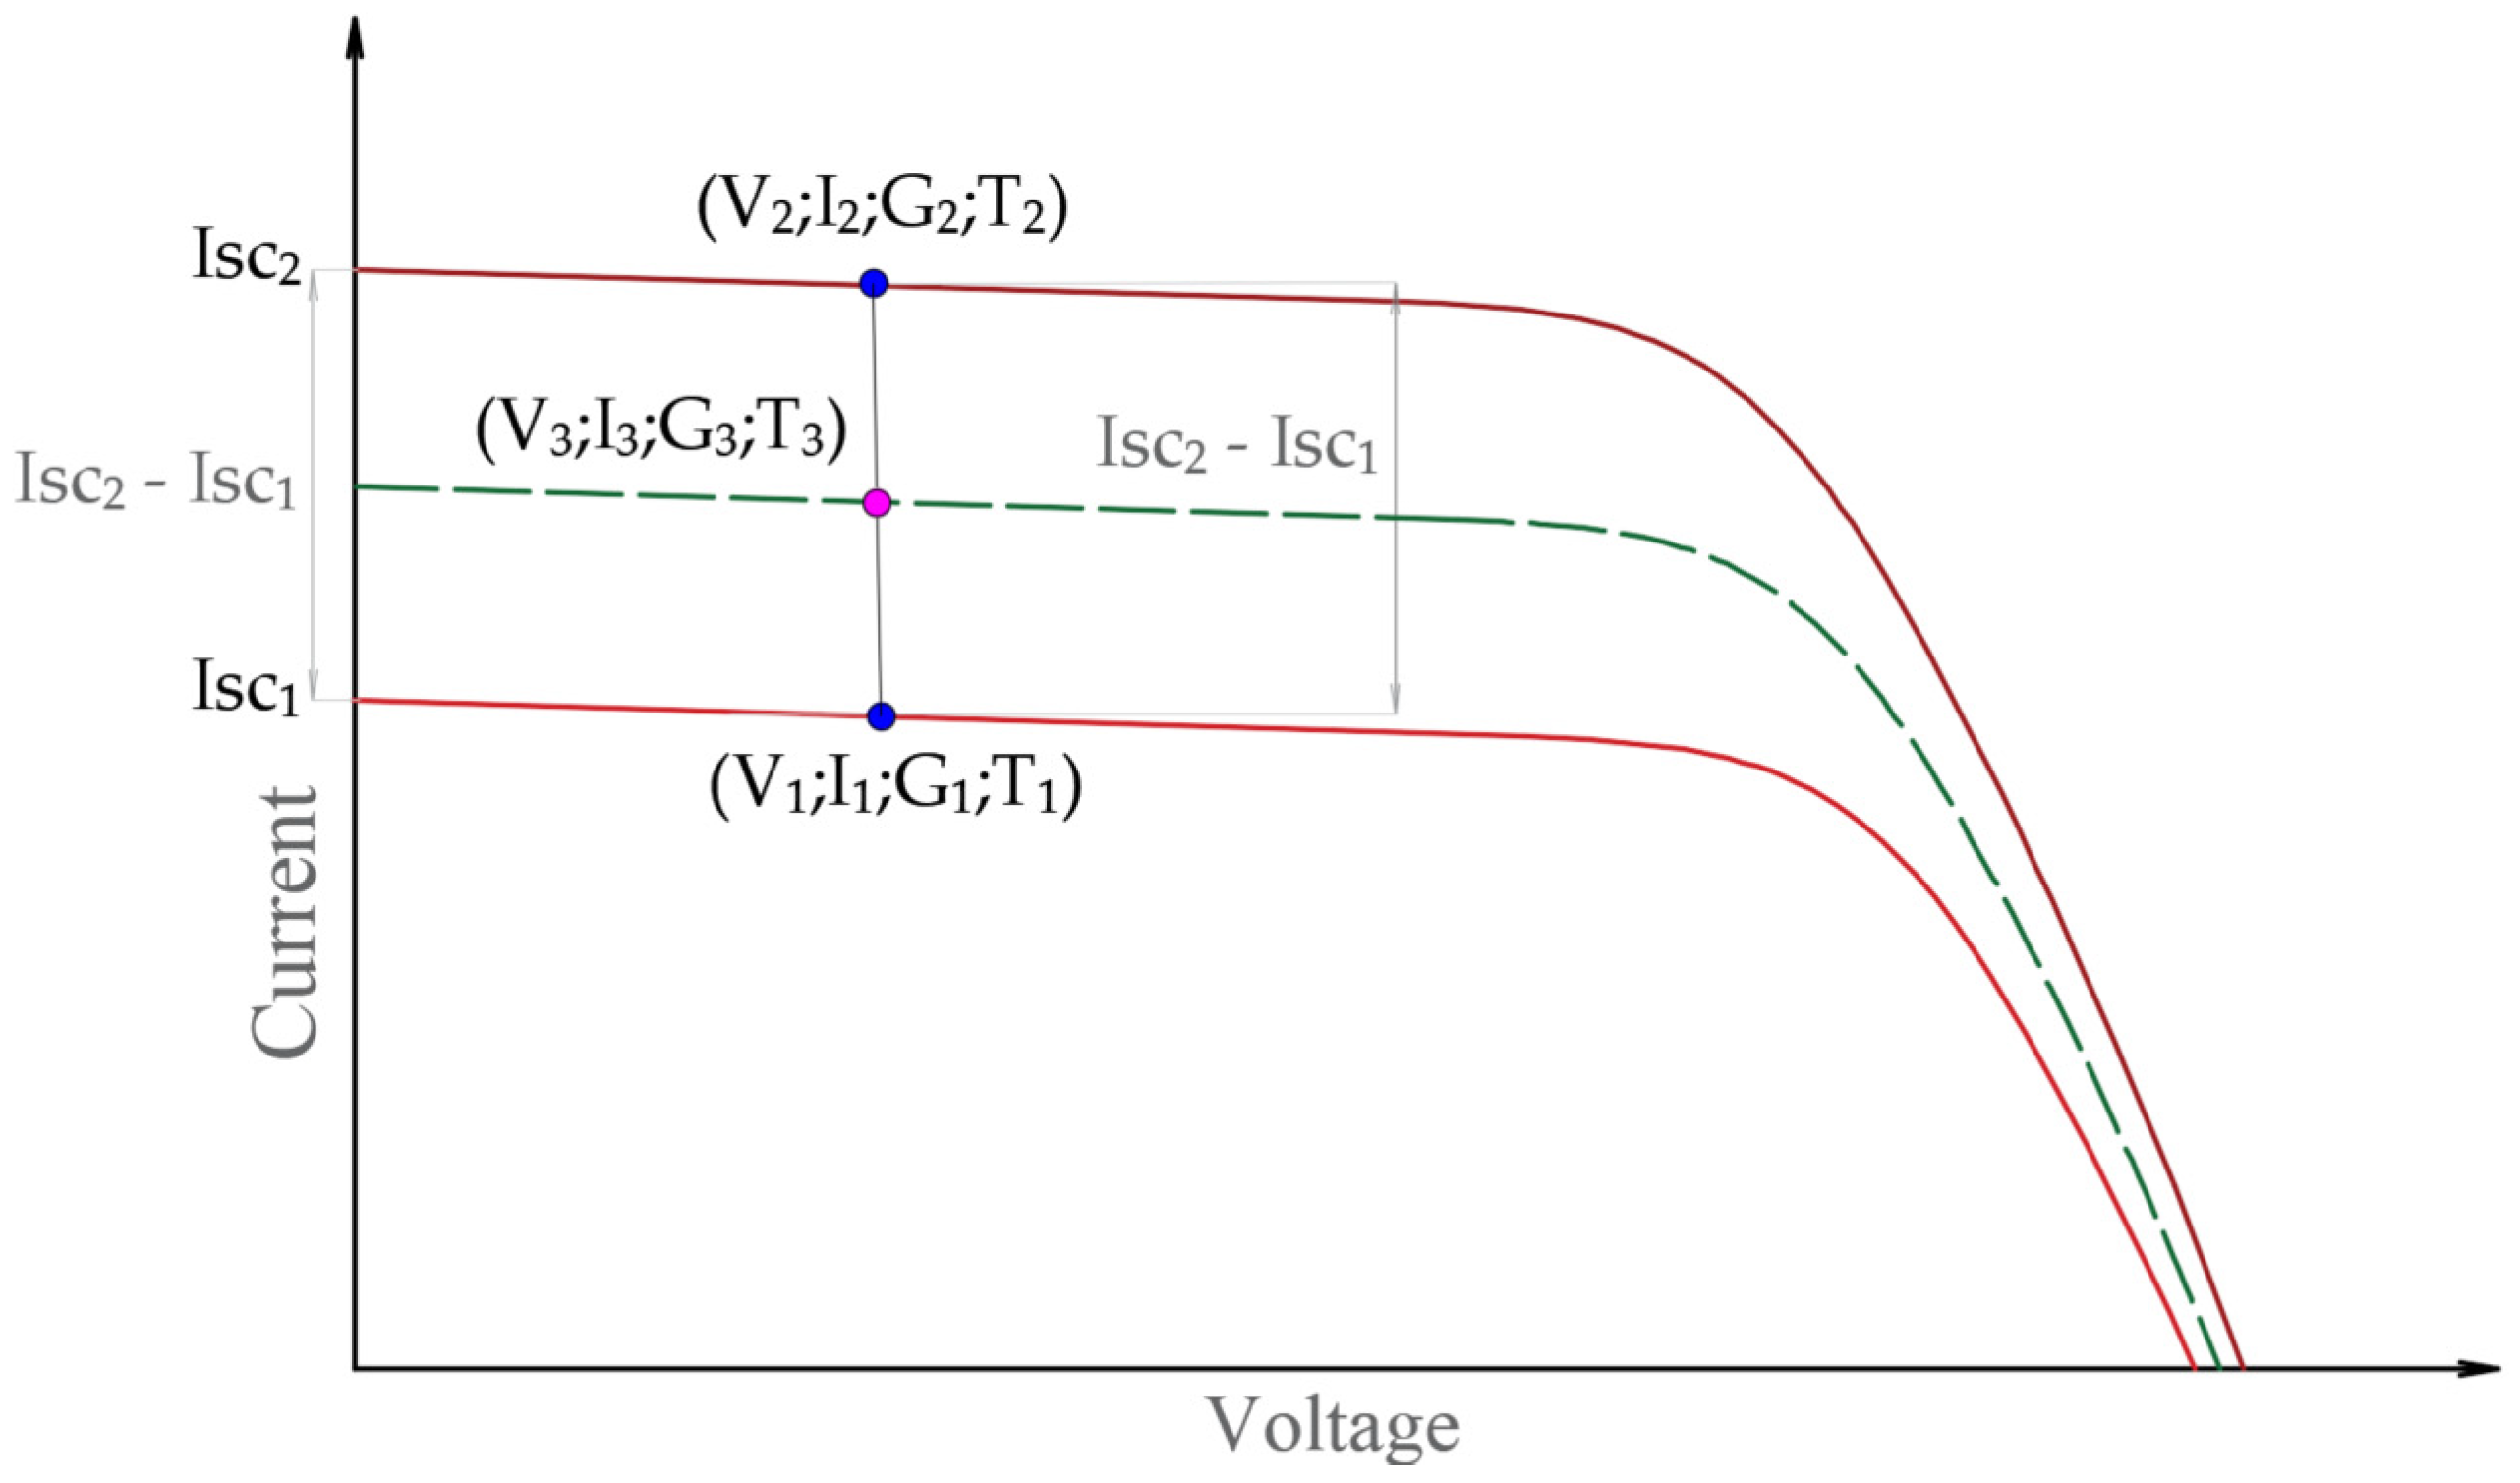
Among the proposed methods mentioned in the IEC standard 61215 (2016 version) [1], one is simpler to apply because it does not require correction parameters as input to carry out a linear interpolation/extrapolation. Two I–V curves are needed to adjust the constant “a” value parameter and perform the translation, given in Equations (1)–(4).
V3 = V1 + a(V2 − V1)
I3 = I1 + a(I2 − I1)
G3 = G1 + a(G2 − G1)
T3 = T1 + a(T2 − T1)
The pair (V1, I1) and (V2, I2) must be chosen that the differences between the current values be the same that the difference between the short circuit values, so I2 − I1 = Isc2 − Isc1 (see Figure 3). The subindex in these equations denotes the values measured at the same time. The parameter “a” is constant for the whole process of interpolation.
Note that G3 and T3 cannot be independently chosen because it refers to linear interpolation, and therefore we only can translate to a different environmental condition over a linear path. The problem to translate to any G y T condition can be solved by acquiring four I–V curves and translating them three times, so:
- From Equation (3), calculate the “a” value with G3 = 1000 W/m2 from two I–V experimental curves and perform the translation applying Equations (1) and (2). Next, calculate the resulting temperature from Equation (4) for that I–V curve. Repeat the process with the other two I–V experimental curves. Thus, we have two translated I–V curves to 1000 W/m2 but different temperature values.
- Now, we only need to translate the temperature. From the two new curves determined, apply Equation (4) to find a new “a” value doing T3 = 25 °C. Finally, using Equations (1) and (2), calculate the values for I and V.
In consequence, this is the I–V curve for the desired condition of 1000 W/m2 and 25 °C. Finally, the maximum power point at STC can be calculated. This linear interpolation procedure for a single point is shown in Figure 3, where the dashed line represents the translated I–V curve.
3.3. Test 03—Insulation
From an electrical point of view, the insulation test is helpful to find out if the module is properly isolated. Hence, it prevents the risk of electric shock during its normal operation [22]. Personnel also should avoid the risk of electric shock during its manipulation because of the voltages used during the test.
Objective. Determine if the value of its insulation resistance is higher than 400 MΩ.
Hardware. A high voltage DC power supply until 1000 V.
An instrument to measure the insulation resistance. Practically, this hardware can be replaced by an insulation meter that includes a DC source and performs the test automatically.
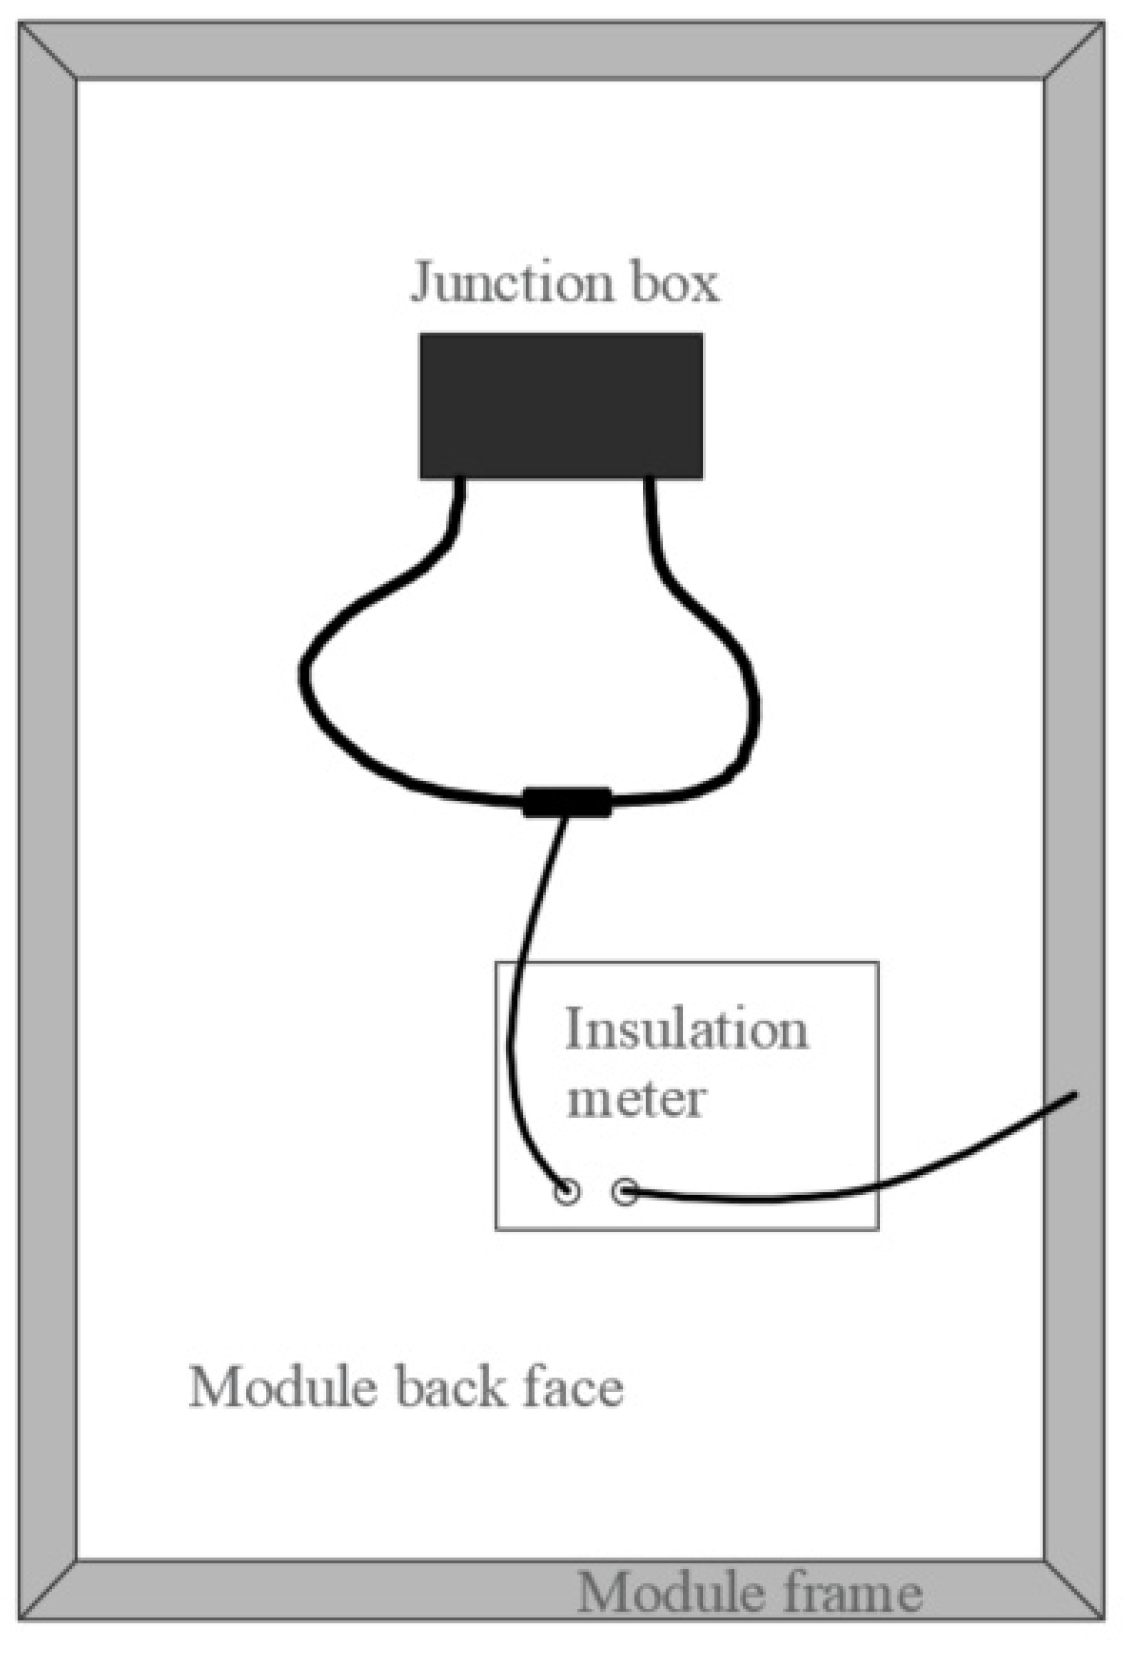
Methodology. First, the electrical output terminals of the PV module must be connected between them (short circuit). Next, connect one insulation meter probe to the cables and the other ends to the module metallic parts (such as the frame) and energize it. Figure 4 shows a schematic for the insulation test, highlighting the connection method.
Pass. The PV module passes if the insulation resistance exceeds the value of 400 MΩ.
3.4. Test 04—Measurement of Temperature Coefficients
This test allows finding the values of the temperature coefficients of the PV module electrical parameters as current, voltage, and peak power. These coefficients let us implement an alternative I–V curve translation methodology [23] already explained in Test 02.
Objective. Determine the temperature coefficients of current (α), voltage (β), and peak power (γ).
Hardware. This test requires the same equipment listed in Test 02. Again, with natural sunlight or class B sun simulator or better, according to IEC 60904.
A PV reference cell (or PV reference module) is required for irradiance measure. Preferably it must be manufactured with the same cell technology to guarantee the same spectral response. In some cases, an identical third-party calibrated module may be used.
Temperature probe with an accuracy of ±1 °C and repeatability of ±0.5 °C. Electronic instruments for measuring simultaneously current and voltage to an accuracy of ±0.2% of the reading.
The measuring range must be carried out from Isc (short-circuit current) until Voc (open-circuit voltage). The sweep time shall be fast enough to obtain the entire current–voltage (I–V) data set, and the irradiance and cell temperature can be considered changeless. There are several options to do this sweep. Similar to before, it can be performed by a programmable four-quadrant source, or an electronically controlled load, or a capacitive analogic load. Suitable mount or rack for supporting the hole devices.
Finally, in this case, equipment destined to control the temperature of the PV module. In most cases, it can be achieved by simple sun exposure [24].
Methodology. First, expose the PV module under natural or artificial sunlight. The irradiance level must be in the range of ±2%, and the wind speed must be below 2 m/s.
In all cases, the reference device must be coplanar with the PV module, and both be normal to the sun direction within ±5° with its temperatures stabilized. Take several I–V curves for different cell temperatures in steps of 5 °C to cover a wide operational range (according to the climate to be exposed). Thus, we will obtain a set of I–V curves from the PV module at the same irradiance levels but with different temps. To find out the coefficients α, β, and γ, plot the values of Isc, Voc, and maximum power (Pmax), respectively, as a function of the temperature and fit the data point linearly to obtain its slope by the least-squares method [25].
In this test, the angular direction could be changed between the limits to keep the irradiance changeless. Further, this test must be performed on a clear sunny day.
3.5. Test 05—Measurement of Nominal Operating Cell Temperature (NOCT)
This test allows determining the value of the nominal operating cell temperature (NOCT). The NOCT is the temperature that reaches the module in open circuit under an in-plane irradiance of 800 W/m2, ambient temperature of 20 °C, and wind speed of 1 m/s. These parameters are known as standard reference environments (SRE). NOCT is helpful to understand how the module behaves environmentally [26].
Objective. Determine the temperature NOCT.
Hardware. A PV module supporting an open rack with low heat conduction that can be positioned at 45 ± 5°.
A reference cell installed coplanar at the module (or pyranometer).
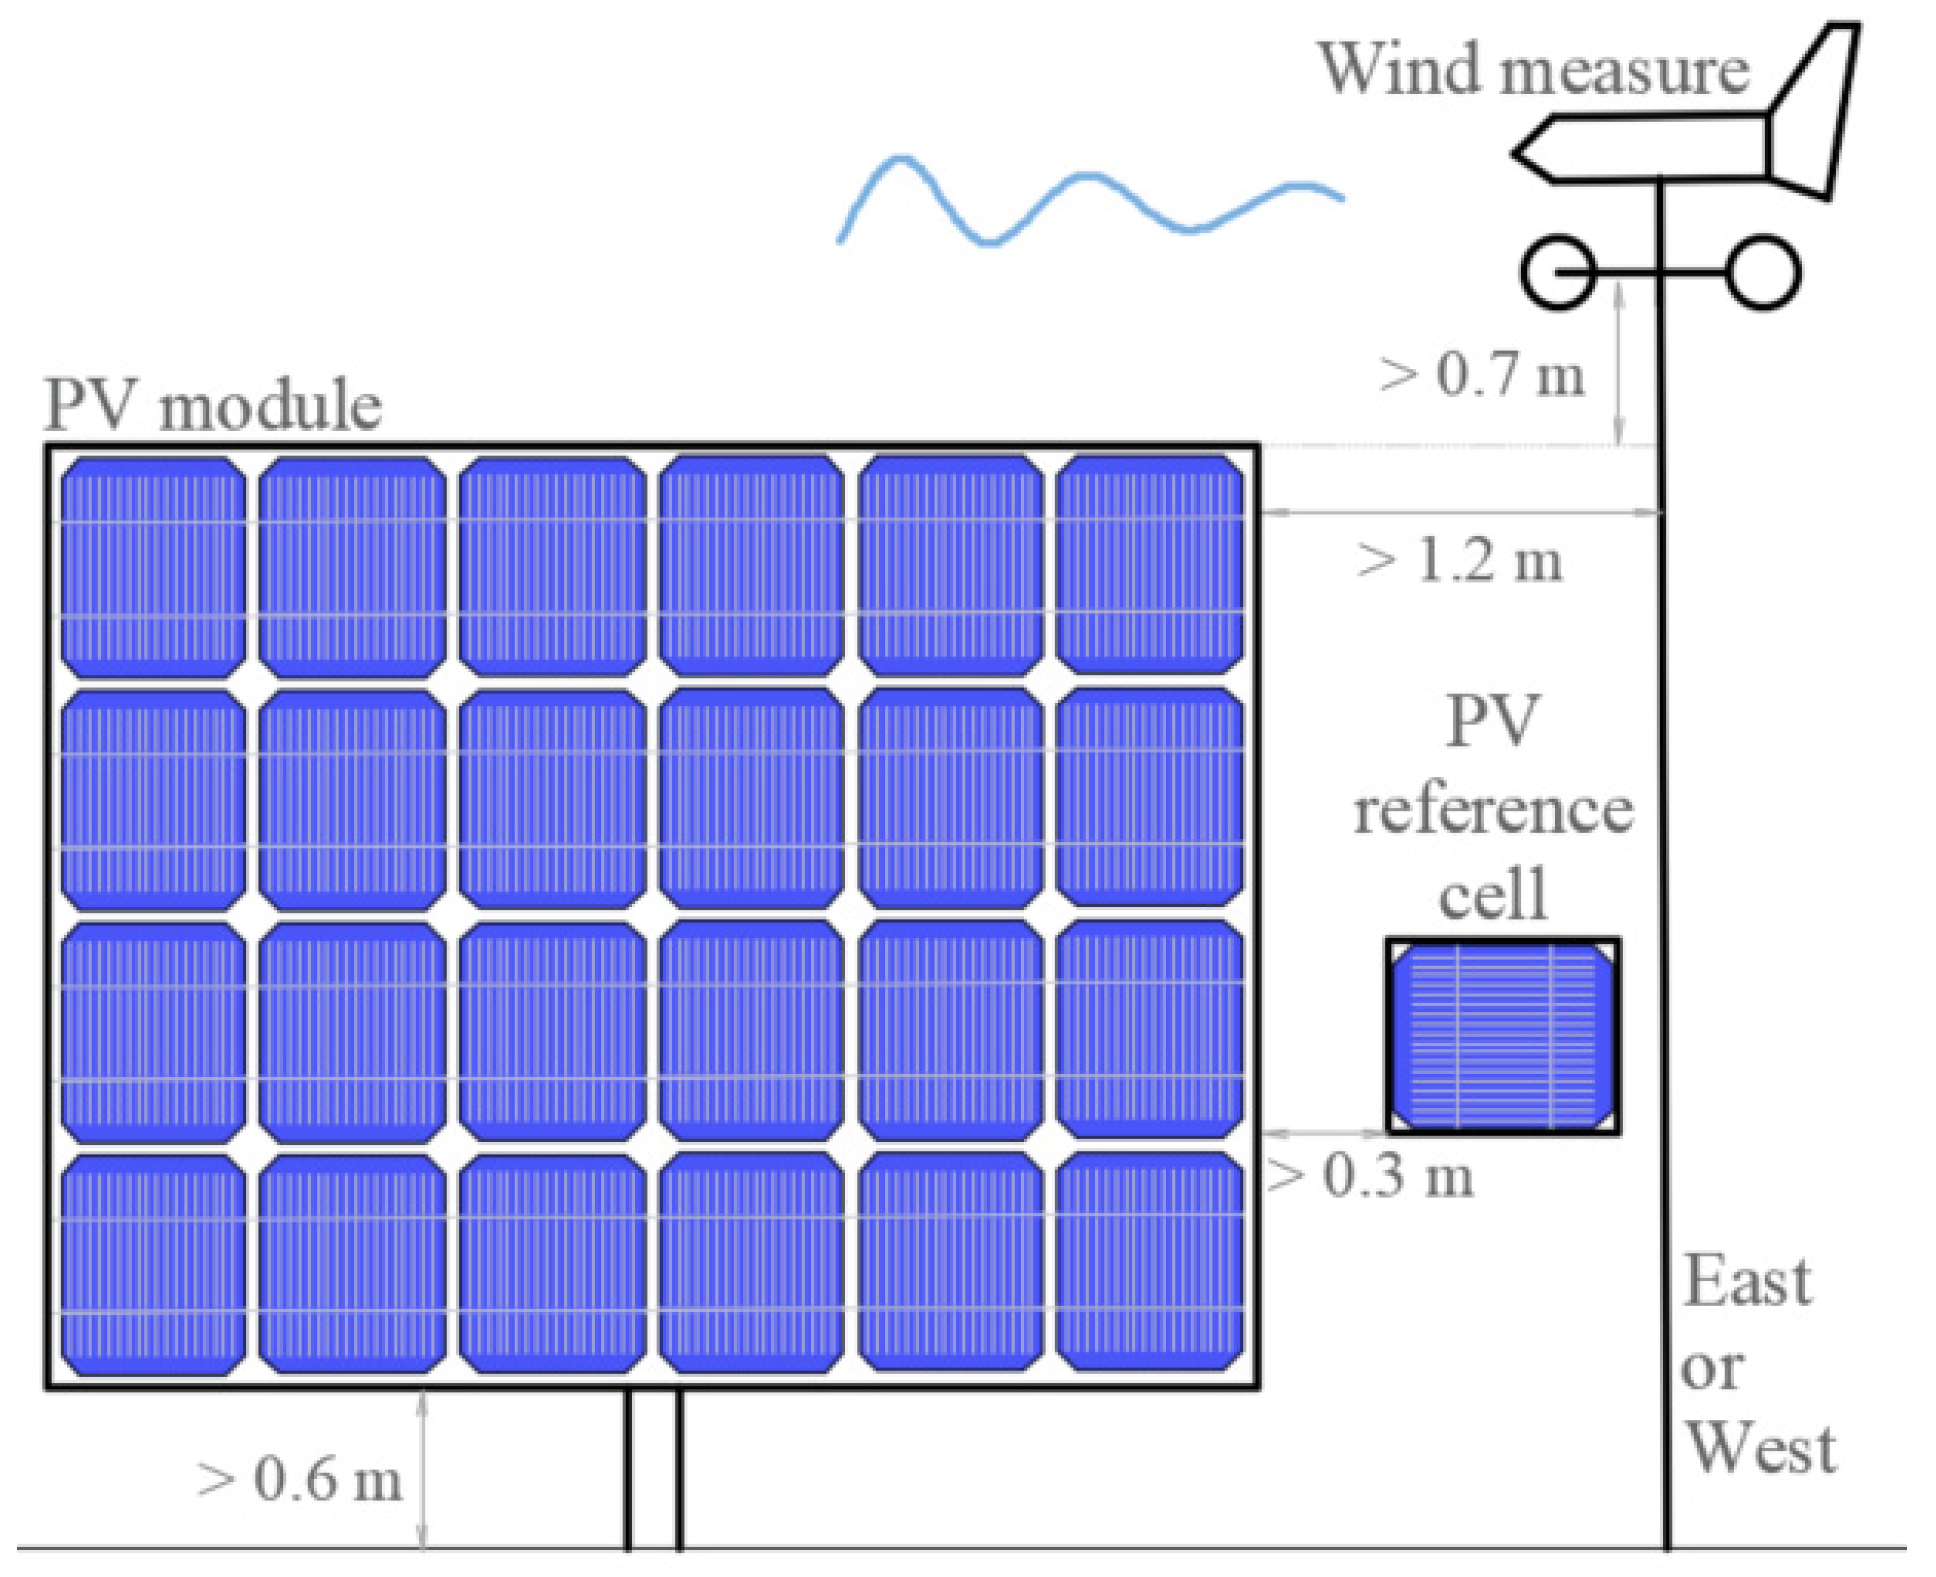
An instrument to measure wind speed, and its direction, installed 0.7 m over the top of the module. The lower PV module edge must be at least 0.6 m above ground level. Further, it must have 0.6 m free space for surrounding objects and avoid reflectance from near objects.
An instrument to measure ambient temperature and a temp probe for the cell temperature, both with an accuracy of ±1 °C.
Methodology. Figure 5 shows a diagram of the arrangement employed to measure the nominal operating cell temperature (NOCT).
From a clear day recorded data set, extract only those corresponding to irradiance values higher than 400 W/m2, with 10 min irradiance variation under 10%, wind speed within 0.75–1.0 m/s, wind direction into ±70° of north or south, and finally, with the ambient temperature in the range of 5–35 °C.
At least 10 data points must be extracted and must include morning and afternoon information.
Plot cell temperature (Tc) minus the ambient temperature (Ta) as a function of irradiance (G), so (Tc − Ta) = f(G) and fit the data by linear regression analysis. From there, determine (Tc − Ta) at 800 W/m2 and add 20 °C, finding the so-called preliminary NOCT’ value. Calculate the mean for ambient temperature and wind speed to carry out the wind correction. Next, with these two values, extract the temperature correction factor from the diagram presented in Figure 6.
Next, add the temperature correction factor to the preliminary NOCT’ value resulting in the estimated NOCT value corrected for temperature of 20 °C and wind speed of 1 m/s.
The final NOCT value will be determined by the average of those obtained in three consecutive tests.
3.6. Test 06—Performance at STC and NOCT
This test is helpful to figure out the behavior of the PV module under the Standard Test Condition (STC) (measured at 1000 W/m2, Tc = 25 °C, and spectral distribution AM 1.5), and into Nominal Operating Cell Temperature NOCT (SRE: determined at 800 W/m2, ambient temperature Ta = 20 °C, and wind speed Ws = 1 m/s).
Objective. Determine the module performance (I–V characteristic curve) at STC and SRE-NOCT.
Hardware. Sun source (natural or artificial).
Set of instruments to measure irradiance (G), cell temperature (Tc), and to register current (I)–voltage (V) simultaneously. Moreover, a variable load to obtain the I–V curve (such as in Test 02).
Methodology. STC: Trace the I–V characteristic curve when the irradiance is 1000 W/m2, and the cell temperature is 25 °C (or translate them).
NOCT: Trace the I–V characteristic curve when the irradiance is 800 W/m2, the cell temperature is the NOCT, and the wind speed of 1 m/s.
These tests are hard to carry out over natural sunlight due to the difficulty in keeping the temperature constant. Thus, some translation methods frequently are used as described in Test 02 [27]; therefore, it is preferable to use a solar simulator.
3.7. Test 07—Performance at Low Irradiance
This test allows evaluating the performance of a PV module in low irradiance conditions (G = 200 W/m2) and cell temperature (Tc = 25 °C).
Objective. Determine the module performance (I–V characteristic curve) at 200 W/m2 and cell temperature of 25 °C.
Hardware. Sun source (natural or artificial).
Set of instruments to measure irradiance (G), cell temperature (Tc), and to register current (I)–voltage (V) simultaneously. Moreover, a variable load to obtain the I–V curve (as in the previous Test 02).
Methodology. Trace the module I–V curve at Tc = 25 ± 2 °C with and G = 200 W/m2. The irradiance level could be dismissed using suitable filters above the PV module without altering the sun spectrum. The result expected is the I–V curve and its maximum power point at that irradiance level.
3.8. Test 08—Outdoor Exposure
The purpose of this test is to know if the module withstands ambient exposure and determine degradation effects that may occur.
Objective. Estimate if the module can withstand environmental conditions.
Hardware. A device to register the irradiance values (as a reference cell connected to a datalogger). The irradiance must be measured within ±5%.
A resistive load to polarize the module near its maximum power point at the STC conditions.
A suitable structure or mount to hold the PV module.
Methodology. The PV module should have passed the visual inspection and insulation tests and have a known maximum power value (Test 01—Visual inspection, Test 02—Maximum power determination, and Test 03—Insulation). Then, connect the module to the resistive load and expose it outdoors in ambient conditions to natural sunlight until the module reaches 60 kWh/m2. Make sure the irradiance device is coplanar. Finally, repeat Tests 01, 02, and 03.
Pass. The module will pass the test if there is no evidence of major defects (pass the visual test), its maximum power does not drop by more than 5%, and its insulation resistance remains higher than 400 MΩ (pass insulation test) after exposure.
3.9. Test 09—Hot-Spot Endurance
This test seeks to check if the PV module withstands prolonged periods with a hot spot in a cell. The hot spot may occur by partial shadows, soiling, cracked cells, electrical mismatch effects, and so on. When the module cells try to force current into one with less capacity, the excess of energy is dissipated similar to heat [28].
This section only discusses testing on modules with all its cells being electrically series-connected. In our own experience, Series modules are the more widely available modules used nowadays. The IEC reference standard [4] should be consulted for further details of other kinds of PV modules.
Objective. Determine if the PV module can withstand excessive heating from a cell without suffering visual or measurable deterioration.
Hardware. For this test, two different steady-state sun sources are needed. These can be natural or artificial. One of them with an irradiance higher than 700 W/m2 ± 2%, with a temporal stability ± 5%, and the other with an irradiance of 1000 W/m2 ± 10%.
An I–V curve tracer device.
Single-cell covers for blocking the light in 5% steps.
A temperature IR camera is recommended.
An instrument to measure short-circuit current.
Methodology. Put the module under sunlight with 700 W/m2 or higher irradiance level, and trace one I–V curve to determine its current at the maximum power (Im). Then, put the module in short circuit and locate, with the IR camera, which is the hottest cell, and cover it. A simplified schematic for the hot-spot endurance test is shown in Figure 7, with one of its cells is conveniently covered.
Trace a new I–V curve and extract the shaded short-circuit current (Isc’).
Only if Isc’ > Im, remove step by step the cover until reaching Im = Isc’. In this situation, the same power is dissipated.
Finally, put the module under an irradiance of 1000 W/m2 for five hours, and keep the value of Isc adjusting the cover over the cell. In these conditions, the module temperature should be within 50 ± 10 °C.
Next, similar to in the previous test, repeat Tests 01, 02, and 03.
Pass. The module will pass if there is no evidence of major defects (pass the visual test), its maximum power does not drop by more than 5%, and its insulation resistance is higher than 400 MΩ (pass insulation test).
3.10. Test 10—UV Preconditioning
This test studies the plausible degradation that may present the PV module under UV radiation. It includes its electrical behavior and integrity, such as cables, junction boxes, adhesive joints, encapsulation, and module parts.
Objective. Put the PV module under UV radiation over a defined time for evaluating if the module presents some electrical or mechanical alteration or degradation.
Hardware. A device to keep the module warm within 60 ± 5 °C, such as a controlled air current flow [29].
An instrument to measure cell temperature with a ±2 °C precision installed in the center of the module back surface.
A device to measure the UV radiation incident over the module surface from 280–385 nm.
Ultra-violet (UV) source to obtain on-plane irradiation of 250 W/m2 with uniformity less than 15% for the same wavelength range.
A pyranometer for irradiance determination.
Protective eye goggles.
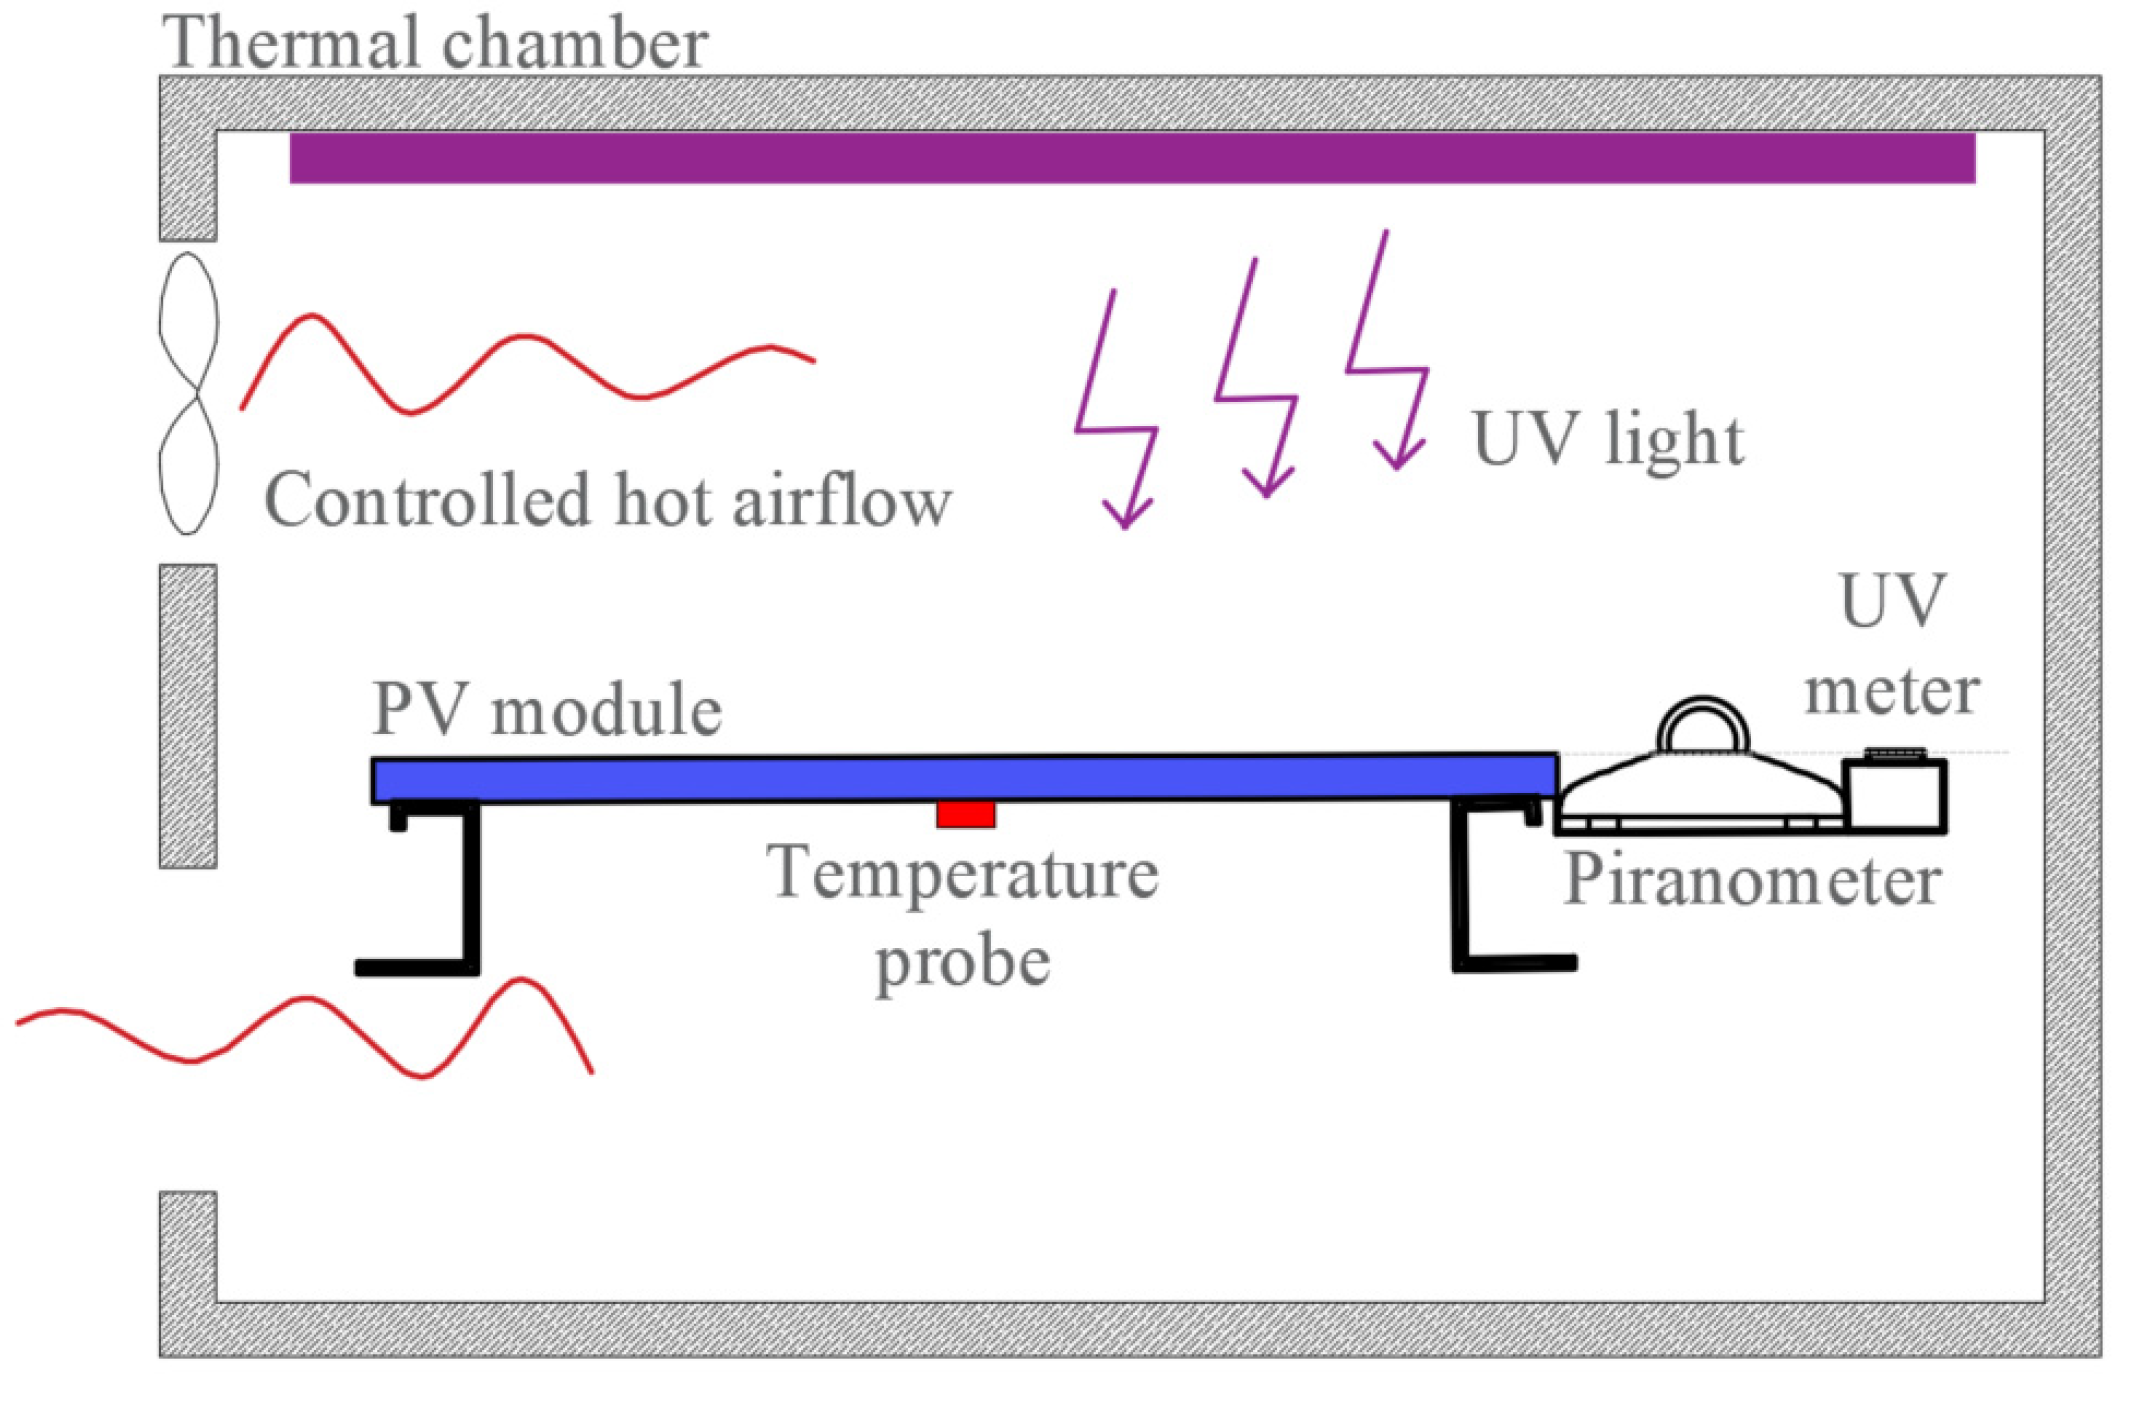
A schematic for the UV preconditioning test bench inside a controlled thermal chamber with a UV light source is shown in Figure 8.
Methodology. With the pyranometer, verify that the UV source irradiance intensity is about 250 W/m2, and its uniformity is less than 15% in the wavelengths range of 280–385 nm. Verify that the module is in open-circuit and its temperature is between 55–65 °C. Put the PV module under UV radiation until reaching 15 kW/m2 over the entire wavelength range, with at least 5 kW/m2 over the 280–320 nm. Keep the module temperature constant during the whole test.
Finally, to detect any difference and pass, repeat Tests 01, 02, and 03.
3.11. Test 11—Thermal Cycling
This test submits the PV module over a repetitive thermal cycle to detect any electrical or mechanical problems that may occur, such as mechanical fatigue or stress.
Objective. Determine if the PV module may withstand periodic thermal cycling over its lifespan.
Hardware. A controlled thermal chamber (between −40 °C to +85 °C and ±2 °C), with enough room to hold the PV module inside, allowing air circulation all around it to assure uniformity and avoid condensation.
The module must be installed thermally isolated from the mount.
An instrument to measure the module temperature and register it, with an accuracy of ±1 °C.
A DC power source to inject the standard peak power current (Im) into the module.
An amp-meter.
A simplified schematic for the thermal cycling test with the module inside a thermally controlled chamber is shown in Figure 9.
Methodology. Secure the PV module into the thermal chamber [30]. Connect the temperature probe, set the DC source in current-source mode to Im, and connect it beside the amp-meter to control its current between ±2%.
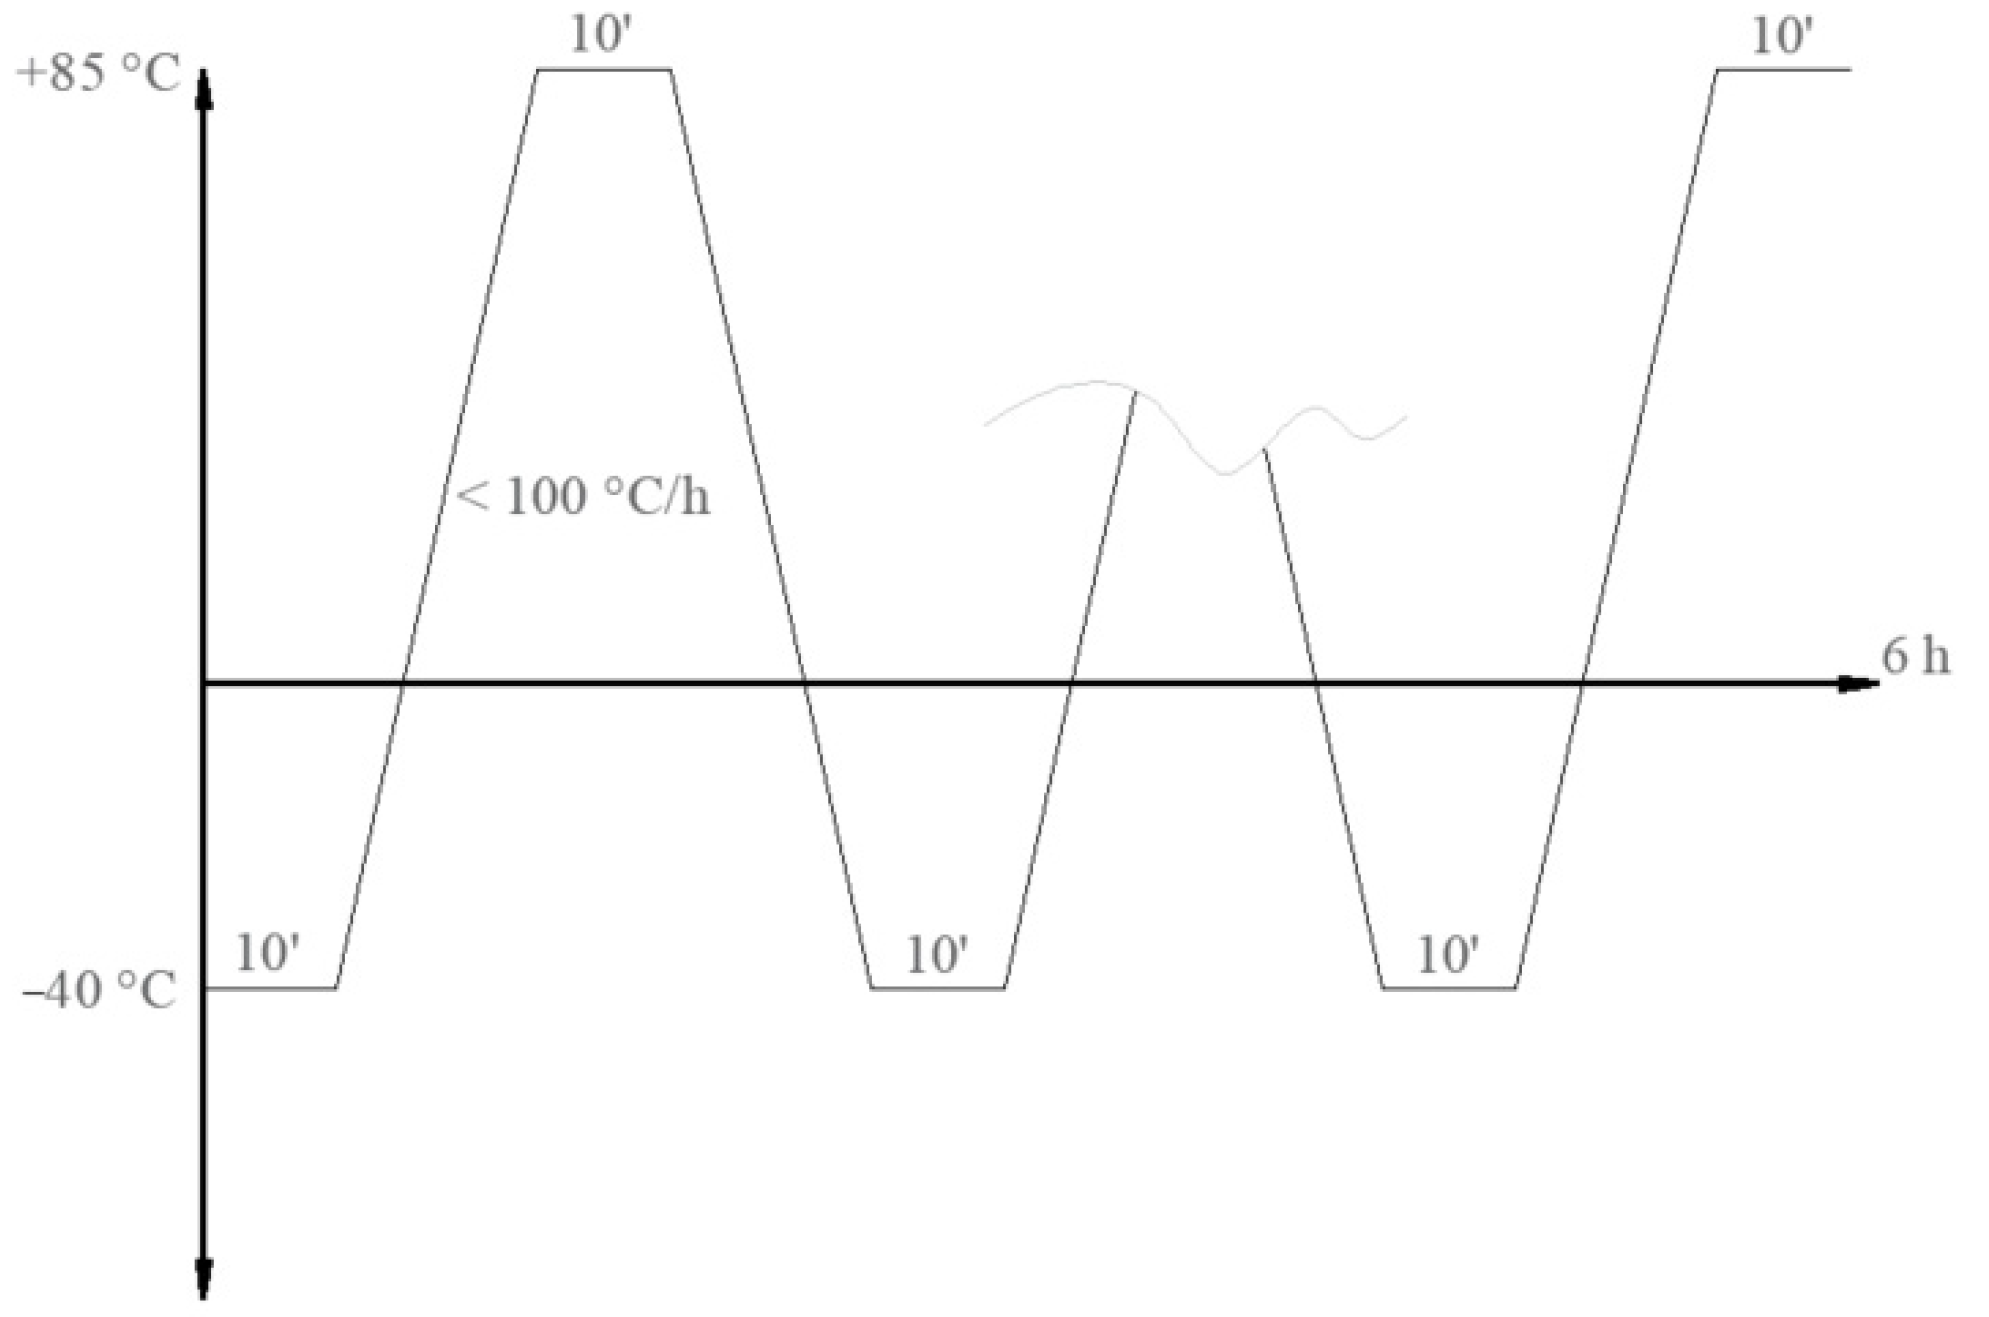
The thermal chamber controller must be set to stay 10 min (minimum) in the lower temp of (−40 °C), then another 10 min in the higher temp (+85 °C) with a transition rate of no more than 100 °C/h (within a cycle time under 6 h), as is shown in Figure 10.
Hence, two tests may be performed: the thermal 50 cycle test and the 200 cycles test. The 50 cycles test is executed without any current injection. In the 200 cycles test, the current only is applied when the module temp is higher than 25 °C. The current must be equal to the current at the maximum power point (Im).
The temp and the current must be recorded and monitored throughout the whole process. When the entire process is completed, let the PV module reach room temperature (approximately one hour) and repeat Tests 01, 02, and 03 to compare with previous results looking for any deviation.
3.12. Test 12—Humidity-Freeze
This test is conducted to estimate if the module appropriately withstands humidity and freezing weather.
Objective. Determine if the PV module can withstand a large humidity cycle with extreme temperature changes.
Hardware. A controlled thermal chamber [31] but now, with humidity control (working between −40 °C to +85 °C and ±2 °C, with 85 ± 5% RH) with enough room to hold the PV module inside, allowing air circulation all around it to assure uniformity and avoid condensation. The module must be installed thermally isolated from the mount.
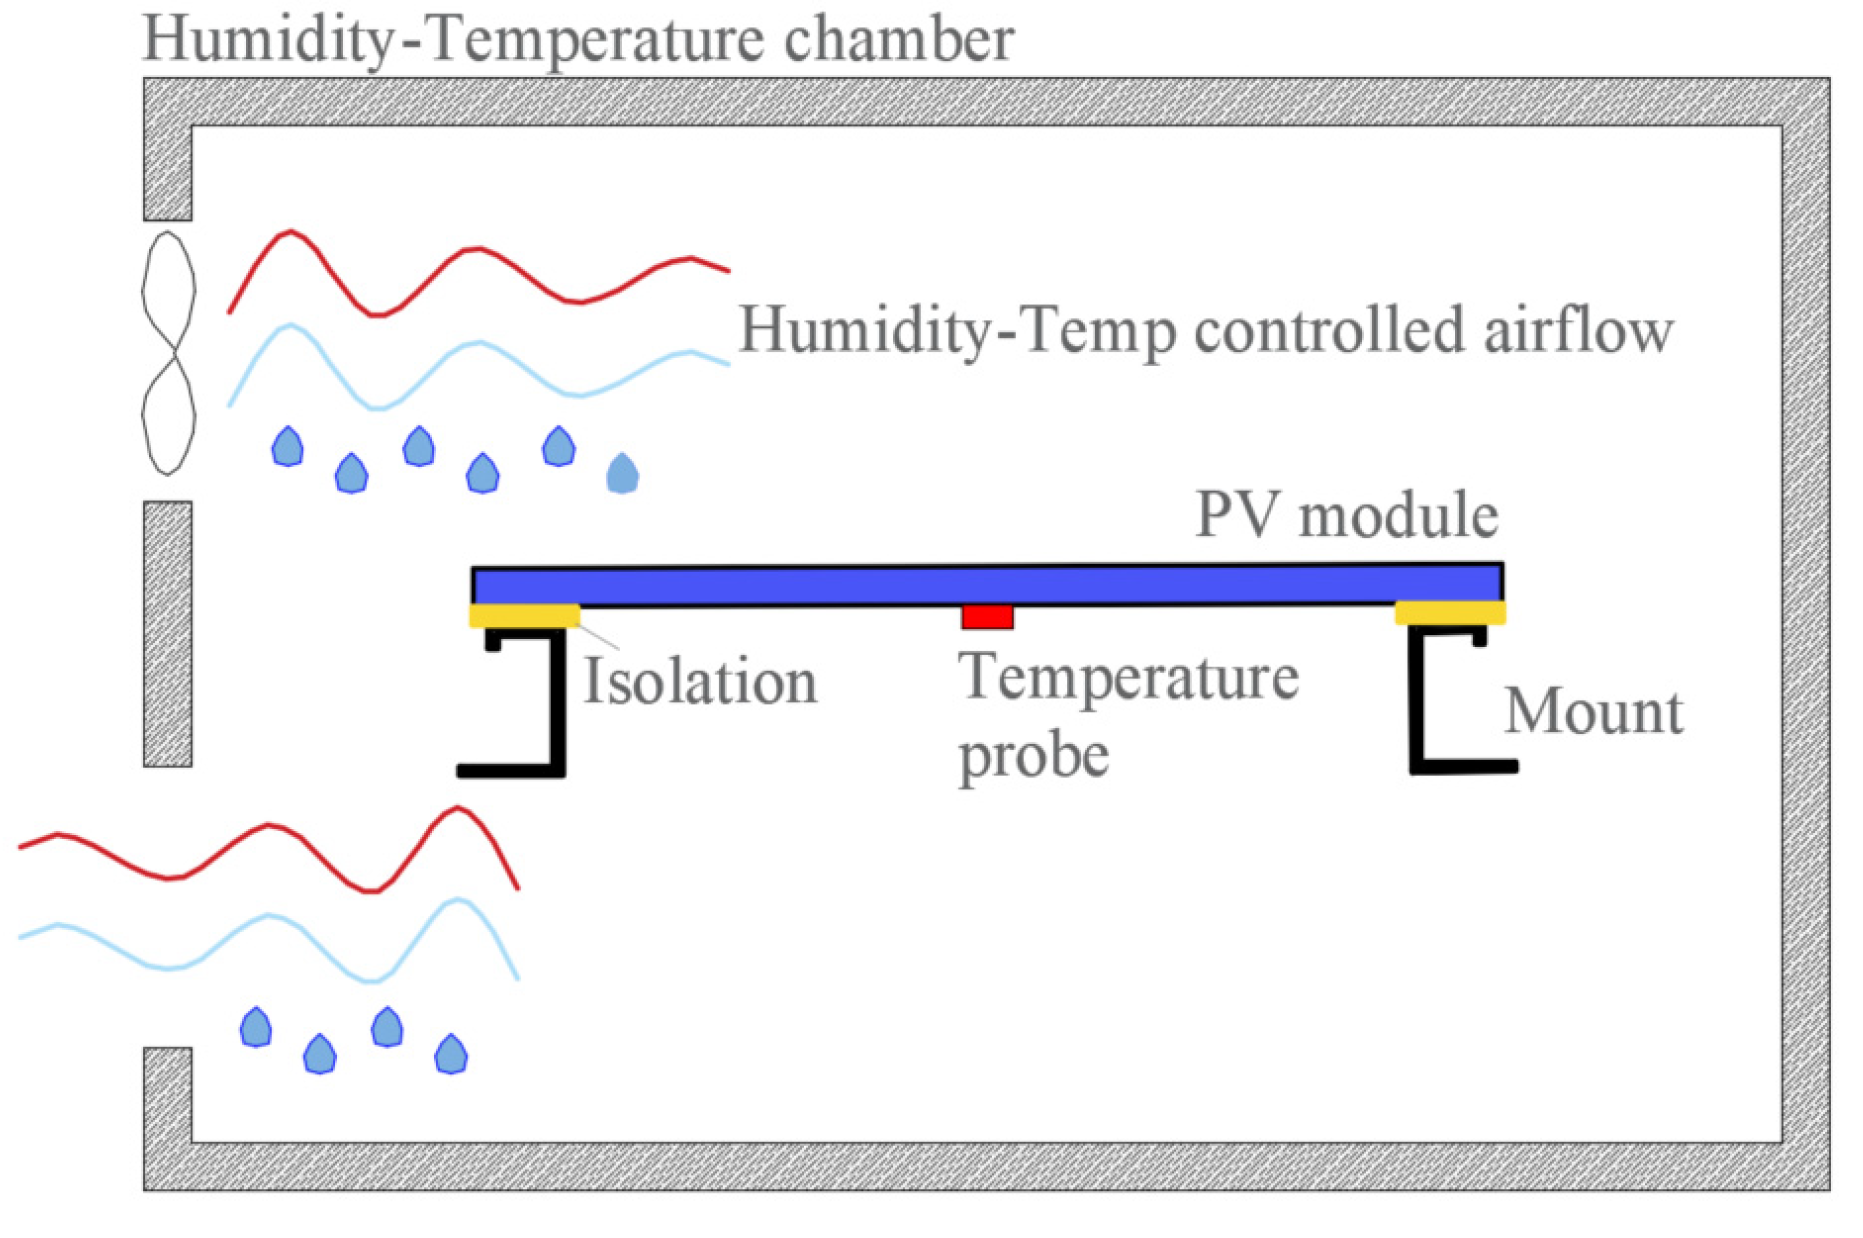
An instrument to measure the module temperature and register it, with an accuracy of ±1 °C. A Schematic for the humidity-freeze test bench is shown in Figure 11.
Methodology. Put the PV module in open-circuit at room temp over a suitable mount. Attach the temperature probe over its front or back surface. Start the test when the humidity reaches 80–90% RH, then heat the module and keep it for 10 min at 85 °C. Next, keep it for 10 min at −40 °C. Below room temperature, humidity control is no longer required. To avoid heat stress, the thermal variation rate must be below 100 °C/h for temps over room temperature and up to 200 °C/h for temps below. All cycles must be under a maximum permitted cycle time of 4 h. The test finalizes when ten complete cycles are performed.
Finally, wait until the module reaches room temperature and repeat Tests 01, 02, and 03 for comparison with previous results.
3.13. Test 13—Damp-Heat
This test, relatively easy to carry out but time-consuming, is designed for studying if the module may present any filtration or leak in its edges or junction box.
Objective. Determine if the module can withstand without any damp filtration after prolonged exposure to a hot-humidity ambient.
Hardware. A controlled thermal chamber, with humidity control (working at 85 ± 2 °C, and 85 ± 5% RH) with enough room to hold the PV module inside, allowing air circulation all around it to assure uniformity and avoid condensation. The module must be installed thermally isolated from the mount. An instrument to measure the module temperature and register it, with an accuracy of ±1 °C. The chamber for this test is similar to the humidity-freeze test, but now, no temps below ambient are required.
Methodology. Set the PV module in open-circuit at room temp over a suitable mount. Attach the temperature probe over its front or back surface. Start the test when the humidity reaches the range of 80–90% RH, then heat the module at 85 °C, and keep it for 1000 h.
Finally, wait until the module reaches room temperature and repeat Test 03, and perform test 15—“Wet leakage current”.
3.14. Test 14—Robustness of Terminations
The following test is carried out to determine if the module power connections may support a mechanical load such as tensile and bending. That may appear in hand installation. Principally, the following description is orientated to modern PV modules, which are widely used nowadays. Usually, they have circular section wires with MC4 type connectors at their ends.
Objective. Determine if the module power cables can hold up a mechanical load.
Hardware. A balance with a precision of ±10% or better.
A set of different weights. In most cases, a water-filled device can be helpful to perform all tests.
Chronometer.
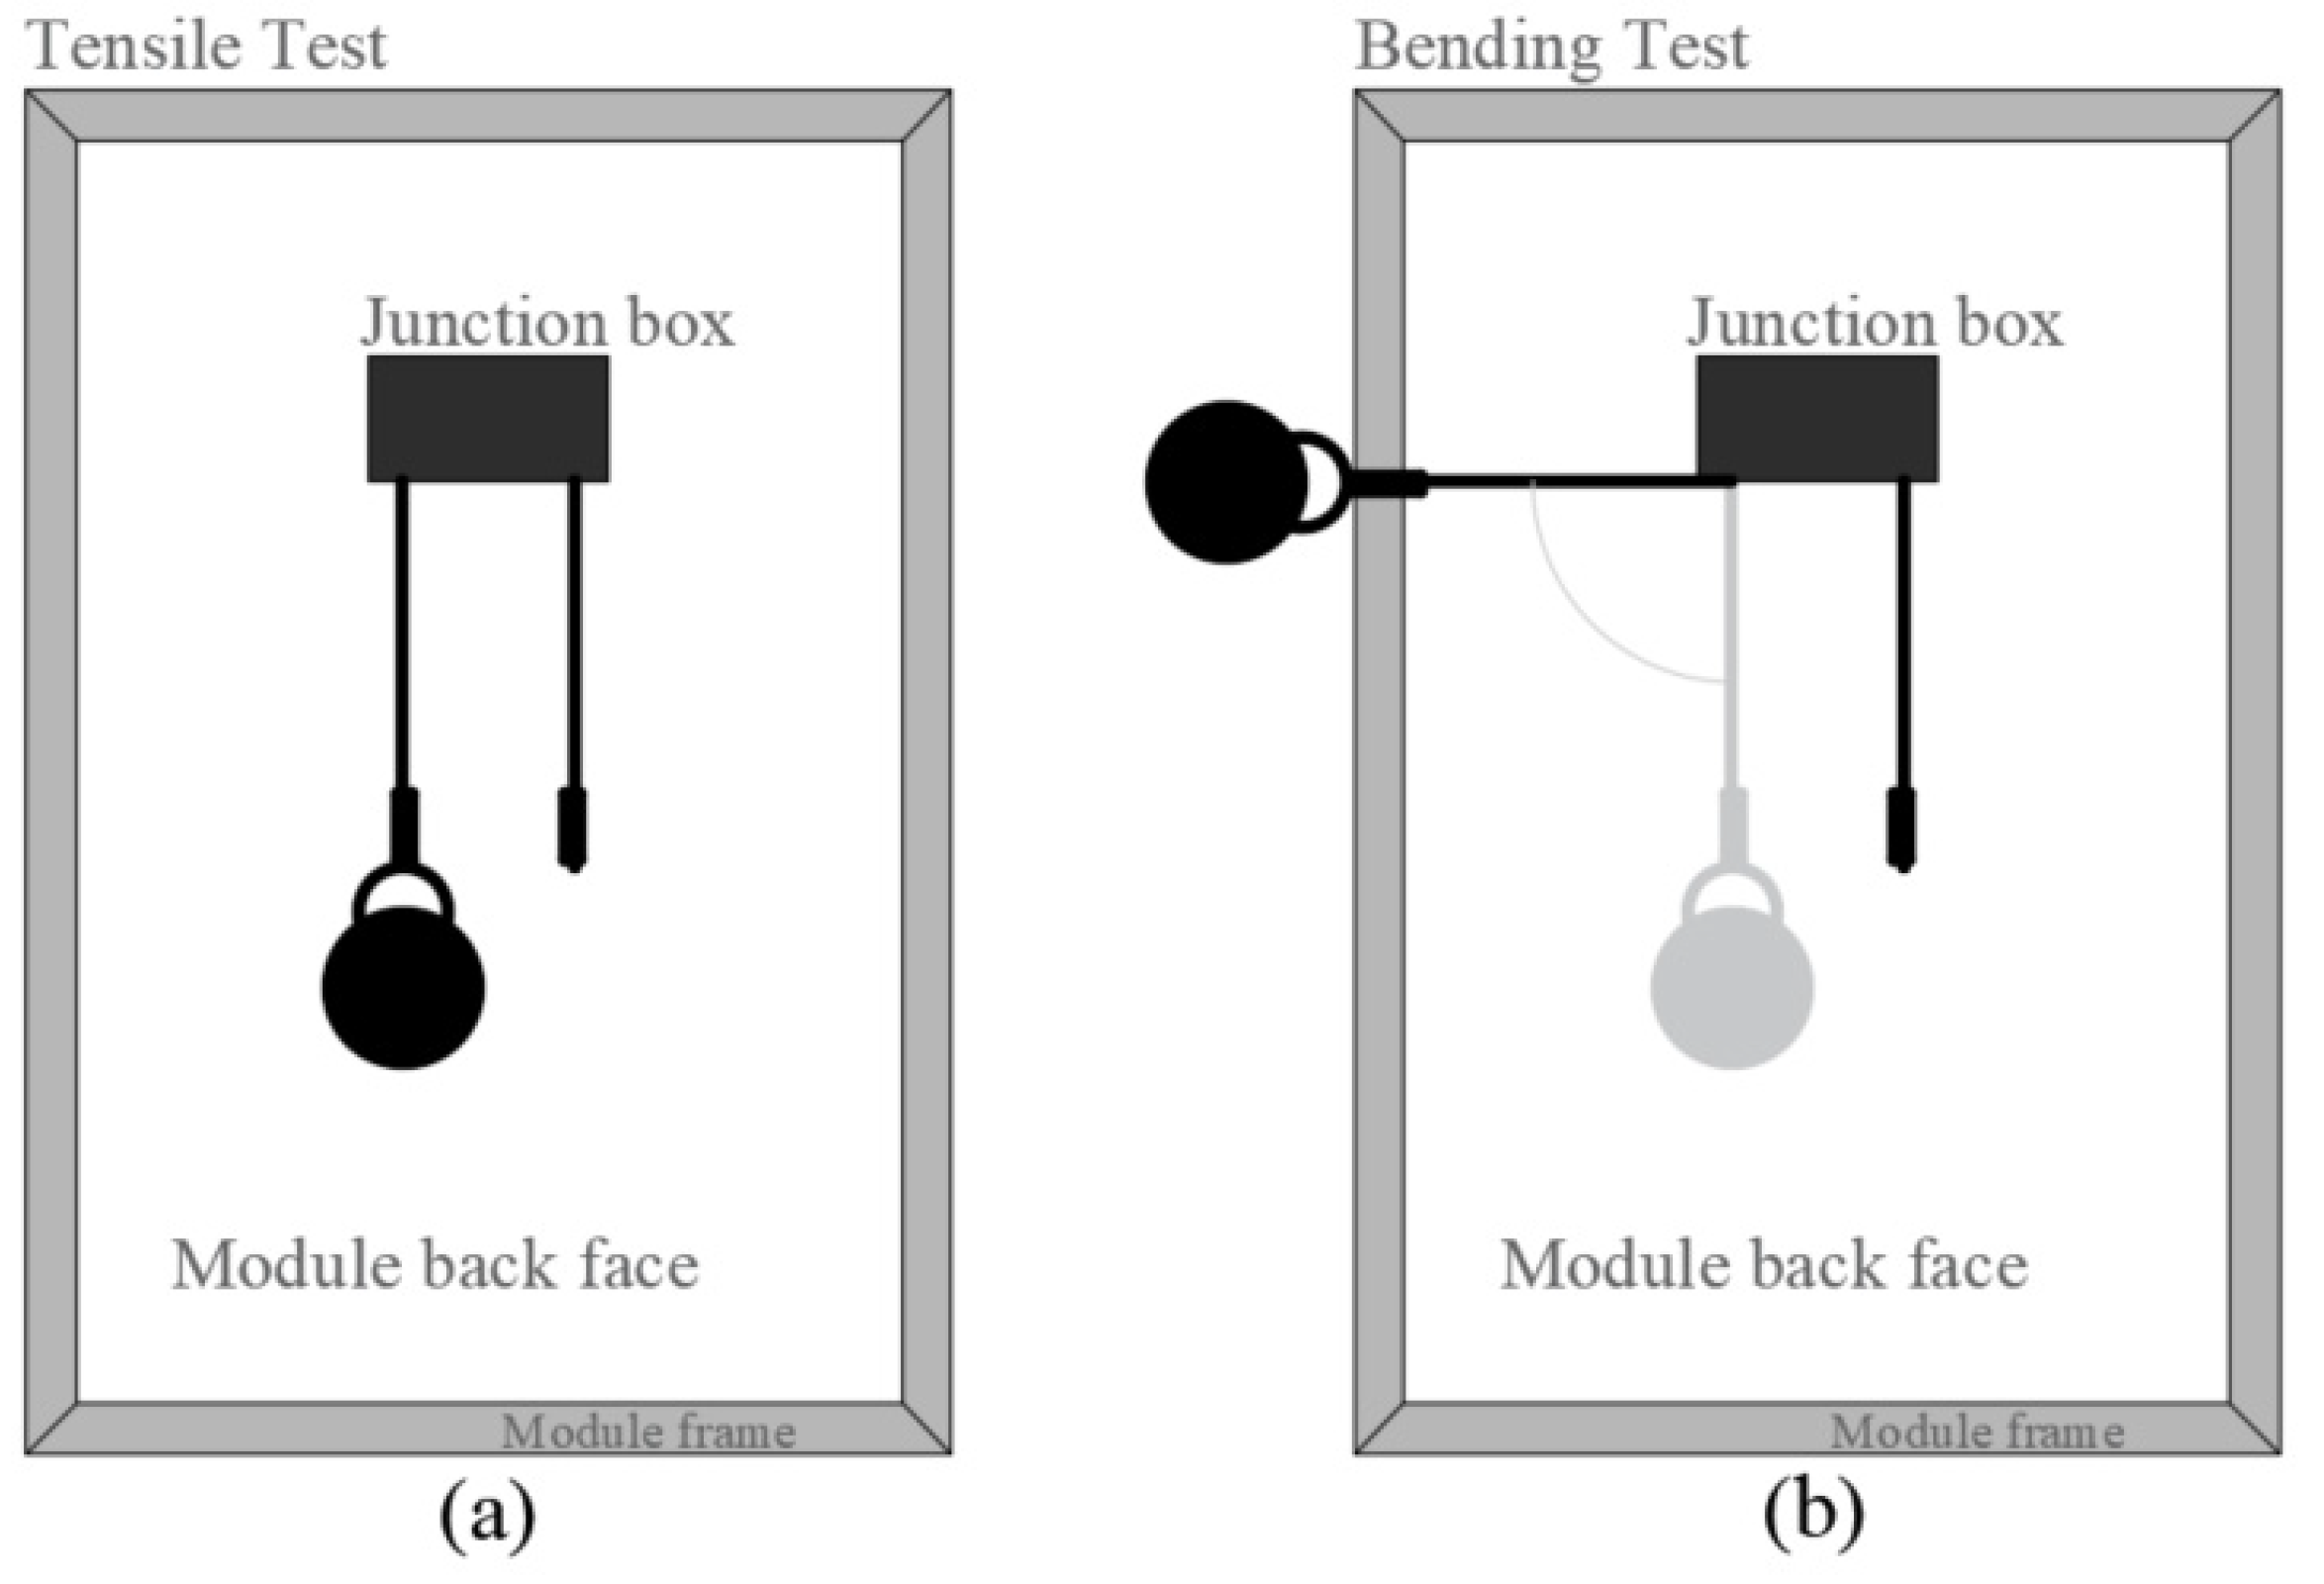
Methodology. After a module visual inspection, a tensile test must be performed, applying a force lower than the module weight and a bending test, carrying out between 1 and 10 repetitions. The tests are performed as follows:
Tensile test: with the module upward, a force is chosen as is indicated in Table 1 must be applied, pulled away progressively in its usual axial direction, and maintained for about 10 ± 1 s (see Figure 12a). Next, the module must be visually, electrically, and mechanically inspected.
Bending test: with the module upward, a force chosen as indicated in Table 1 must be applied and rotate progressively to an angle of 90° and return to its usual position. Next, the module must be visually, electrically, and mechanically inspected, as is shown in Figure 12b.
For further details, or considerations specific to these tests, see the standard IEC 60068-2-21 [32].
3.15. Test 15—Wet Leakage Current
This test is performed to analyze if the PV module can withstand prolonged environmental exposure, such as rain, fog, snow, etc. Here we are looking for insulation problems or electrical malfunction symptoms.
Objective. Determine if the PV module exposed through prolonged wet conditions present signs of mechanical or electrical problems.
Hardware. A suitable tank to put on the PV module in the flat horizontal position. This tank must contain a solution of water and additives to achieve a maximum resistivity of 3500 Ωcm, surface tension of 0.03 N/m, and a temperature of 22 ± 3 °C.
Spray equipment filled with the same solution.
500 V DC power source and an instrument to measure insulation resistance. For convenience, these may be replaced with an automatic digital insulation tester.
Methodology. Immerse the PV module into the solution up to its junction box, or totally if the junction box is designed for that (see Figure 13). The cables must be sprayed with the water solution [33]. Connect the module terminals in short circuit and connect them to the positive terminal of the DC source and the negative to the frame or a metallic part immersed in the solution. Apply voltage with the DC source and increment it to a rate under 500 V/s up to 500 V and keep it for 2 min, then measure the insulation resistance.
Pass. The test is satisfactory if the insulation resistance exceeds 400 MΩ for modules under 0.1 m2 and higher than 40 MΩm2 for bigger ones.
3.16. Test 16—Mechanical Load
This test is performed to analyze if the PV module can withstand prolonged environmental exposure, such as rain, wind, snow, etc., from a mechanical point of view.
Objective. Determine if the module can appropriately withstand load on its surfaces.
Hardware. A flat solid surface to lie down the PV module face up, with a small notch to keep out its cables.
A DC voltage power source and an amp-meter to detect any loss of electrical continuity.
Weights to apply uniformly and gradually load over the PV module. From a practical point of view, the load must be performed by a device such as a PVC pool, which ensures a uniform load distribution over the module surface and easy control by the water column. Further, the load can be applied by pneumatic flow over the module.
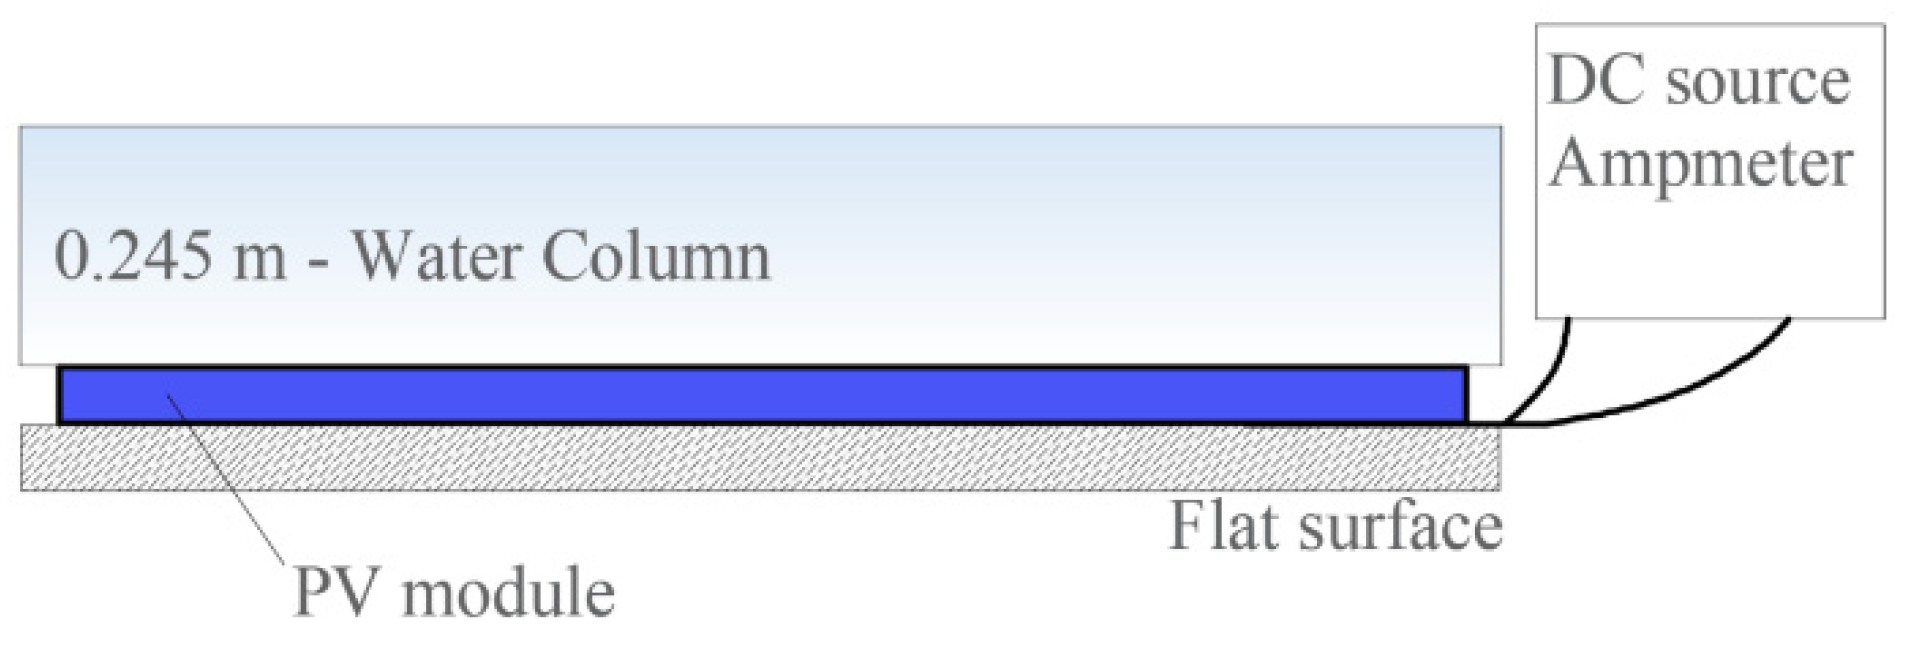
Methodology. Put the PV module face up over the flat surface and connect the source and the amp-meter. Set the DC source to deliver a current easily detected. Gradually, apply load up to 2400 Pa (N/m2), and keep it for 1 h. Then, perform the same procedure to the module back surface. The test finished after completing three cycles. (If a water column device is used, considering a water density of 997 kg/m3 and a gravity acceleration constant of 9.81 m/s2, the water high must reach up to 0.245 m). A schematic for the mechanical load test with a water column is shown in Figure 14.
Finally, repeat the Tests 01, 02, and 03 to compare.
Pass. The test is satisfactory if no loss of continuity were detected and passed the tests 01, 02 Pm within 5%, and 03 insulation over 400 MΩ.
3.17. Test 17—Hail
The test is designed to determine if the PV module can withstand hail impacts successfully.
Objective. Determine if the PV module can withstand repetitive hail impacts over its surface.
Hardware. Ice cube tray, to make 25 mm ± 5% spherical ice balls with a mass of 7.53 g ± 5%. The trays can be made of two symmetrical parts with a single water entry. A tray material with low thermal conductivity is preferable to avoid rapid volume changes when unmolding.
A digital thermometer.
A suitable module rack.
A freezer, working in the range of −5 to −15 °C.
A suitable container to keep the balls within −4 ± 2 °C.
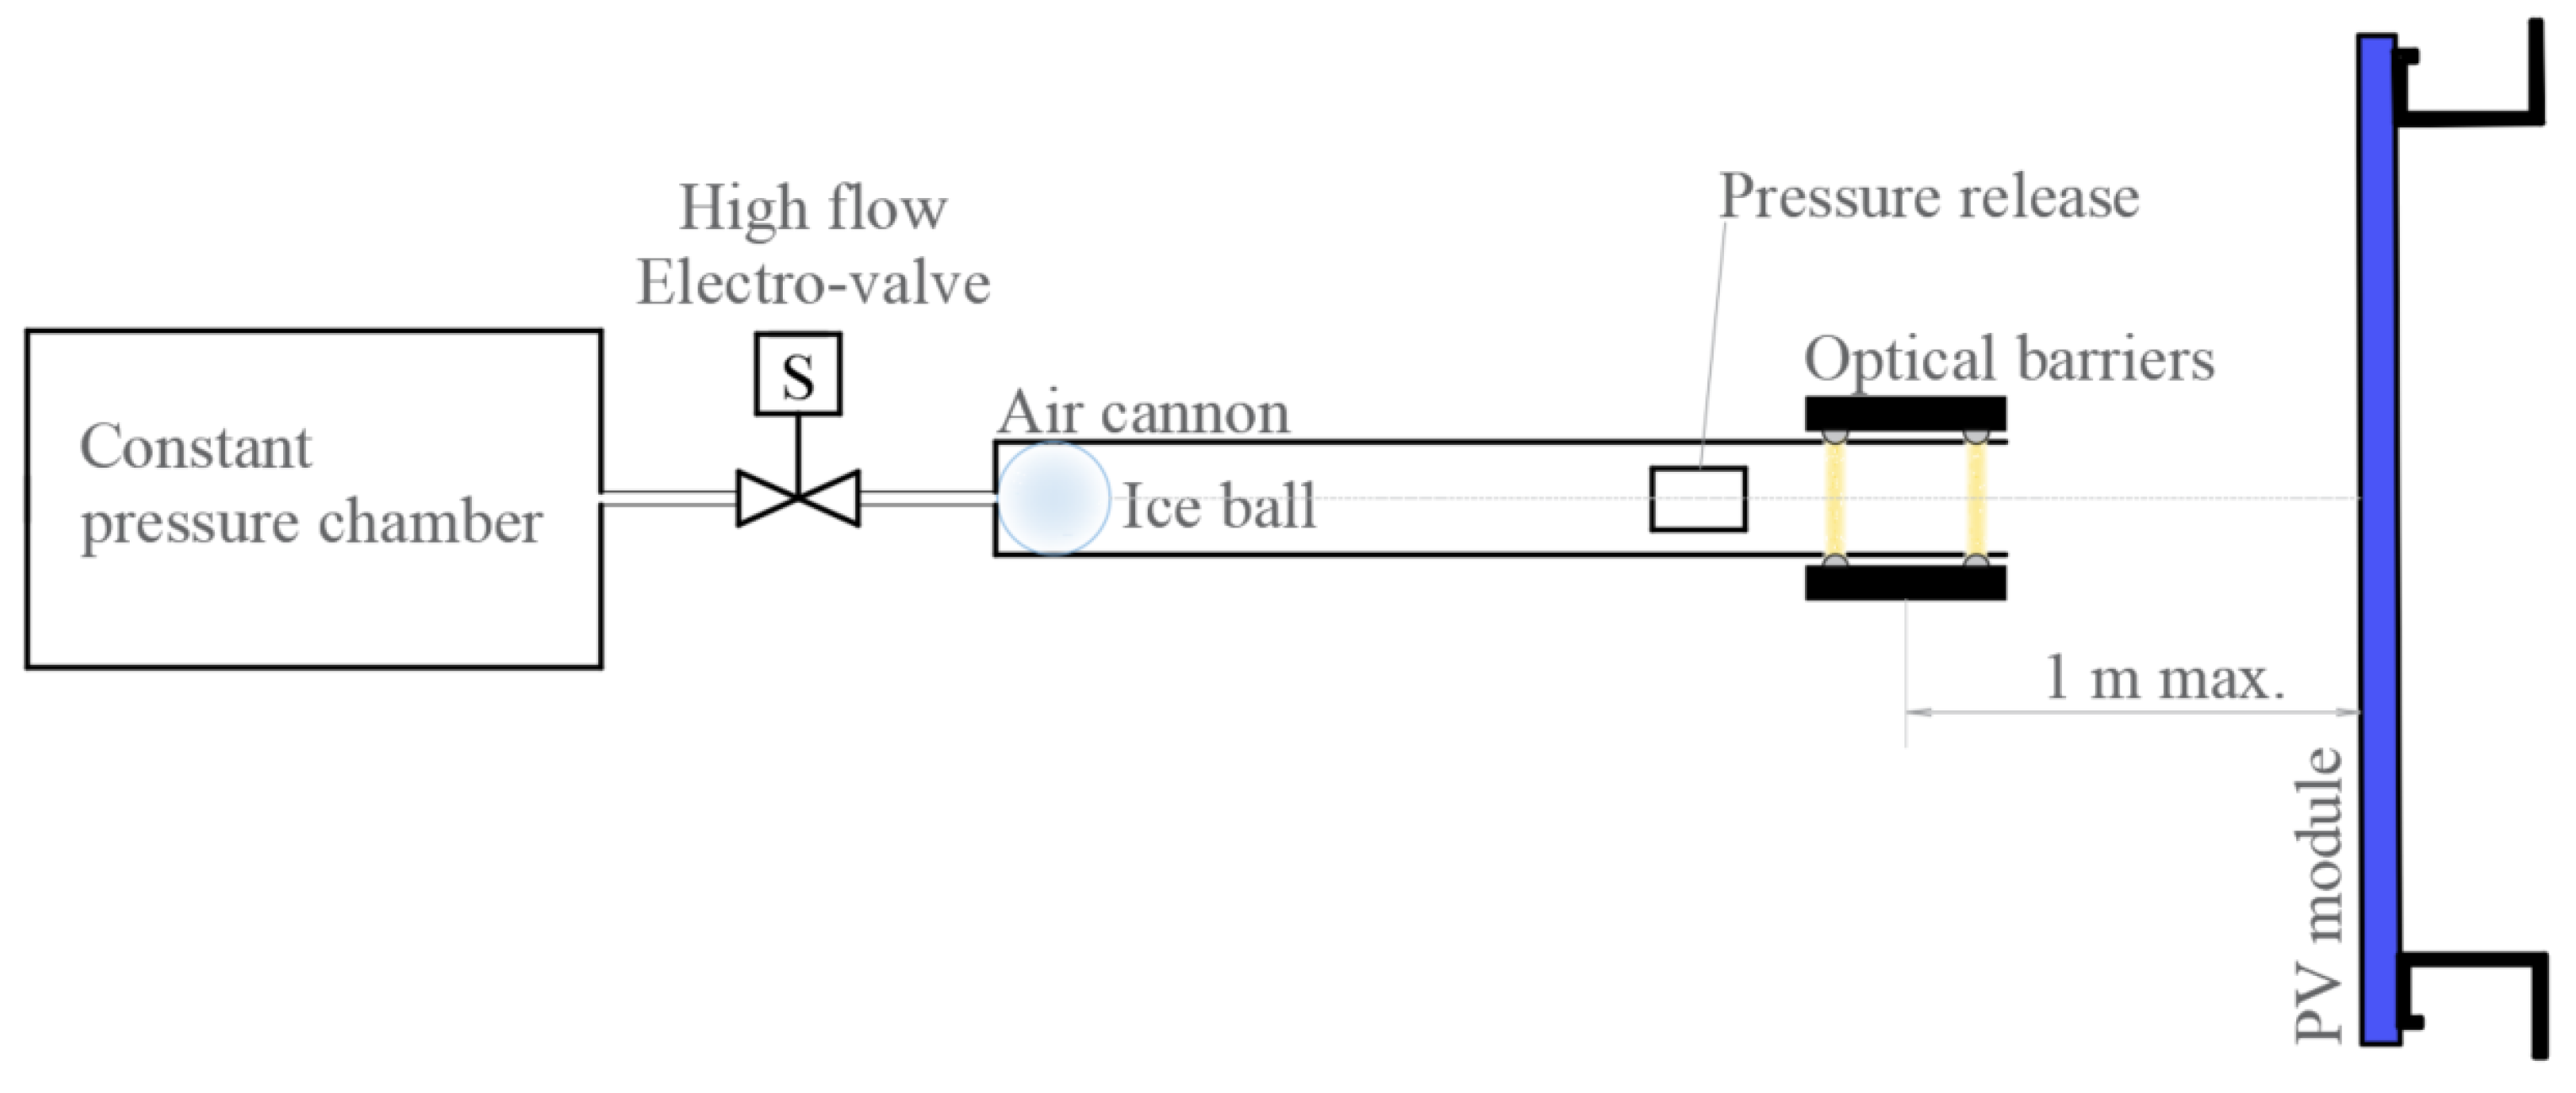
A low thermal conductivity air cannon to launch the balls at the velocity of 23 m/s ± 2%. The ball velocity may be measured by optical barriers installed in holes or notches on the sides of the cannon. The distance between the module and the velocity measure must have a maximum of 1 m (as is indicated in Figure 15).
A balance to measure the ball mass to an accuracy of ±2%.
Other ice balls sizes can be utilized. For additional information, see the standard IEC 61215.
Methodology. Put the balls for at least 1 h for acclimatization in the container before starting the test. Then, put the module vertically over the mount and horizontally hit the module with an ice ball shot and visually inspect the impact area, looking for any issues [34].
Perform a total of eleven impacts within a time lower than 60 s. The impacts must include different module zones, such as corners, center, frame proximity, and other points considered vulnerable.
Finally, repeat the Tests 01, 02, and 03 and look for deviations.
3.18. Test 18—Bypass Diode Thermal Test
This test is designed to estimate if the bypass diodes can withstand thermal effects associated with prolonged activation, such as may be present in cases of electrical mismatch, shadows, etc. [35].
Objective. Determine if the bypass diode can adequately support 1.25 times the short-circuit current (Isc) in a hot module.
Hardware. A heating chamber or controlled airflow for heating the module to 75 ± 5 °C.
An instrument to measure the diode case temperature with an accuracy of ±1 °C. Using an infrared or thermographic camera is preferable and practical to avoid altering the diode temp.
A DC power source to inject a current of 1.25 times the Isc module at STC.
An amp-meter.
A diode checker.
Methodology. Heat the module to 75 ± 5 °C and inject the Isc current ±2% for 1 h (Figure 16). Measure the case diode temp (Td), the diode voltage (Vd), and the diode current (Id). Calculate the junction temperature (Tj) as a function of its diode thermal junction-case resistance (RTHjc) extracted from the manufacturer datasheet, Equation (5).
Tj = Td + RTHjc × Vd × Id
Next, increase the current module to 1.25 × Isc for another 1 h, and verify the diode is correctly working.
Finally, repeat the Tests 01, 02, and 03 and look for deviations.
Pass. The test is satisfactory if the diode is correctly working and the calculated Tj is lower than the maximum recommended in its datasheet. Further, if passed the Tests 01, 02 Pm within 5%, and 03 insulation over 400 MΩ.
3.19. Test 19—Stabilization
The purpose of this test is to achieve the electrical stabilization of the PV module, performing cycles of solar exposure until the variation of the peak power stands under certain limits.
Objective. Submit the PV module to a series of sunlight exposure until reaching its electrical stabilization. This test must be performed before any testing procedure starts.
Hardware. A solar simulator (or natural sunlight) CCC, according to IEC 60904-9 [11] able to reach an irradiation value between 800 W/m2 and 1000 W/m2.
A pyranometer (or reference PV cell) in order to measure incident solar radiation.
A suitable mount to keep the module and the irradiation measure device coplanar.
A thermometer with an accuracy of ±2 °C and repeatability of ±0.5 °C.
A resistive load to polarize the PV module in its maximum power point (this also can be achieved by connecting a device with the maximum power point tracker available).
Methodology. Find the maximum output power Pm by applying Test 02—“Maximum power determination”.
Place the PV module under test connected to its maximum load at an irradiance in the desired range. If the exposure is under natural sunlight, check the irradiance levels be above 500 W/m2.
Check the coplanarity with the irradiance meter and check the module temp is between 40 °C and 60 °C.
The specific normative set an energy level to expose the PV module. As indicated in the preconditioning process, for C-Si the range of 5 kWh/m2 to 5.5 kWh/m2 is used. After the exposure, a new value of Pm’ must be measured.
At least three consecutive exposures must be carried out, and the test finalizes when the inequation (6) is true (valid for C-Si) [36].
(Pmaximum − Pminimum)/Paverage < 0.01
3.20. Test 20—Dynamic Cyclic Mechanical Load Test
The finality of this test is to determine if the PV module can withstand low levels of dynamic mechanical load, mainly focusing on the more fragile parts such as the cells.
Objective. This test was designed to identify possible parts susceptible to failure under dynamic tensile loads. Performing this test, we can consider PV module effectively can withstand ambient dynamic stress conditions.
Hardware. To carry out the present test is required expensive and complex devices.
Suitable rack or mount to hold the PV module under test and a pneumatic array to perform a bidirectional tensile load test.
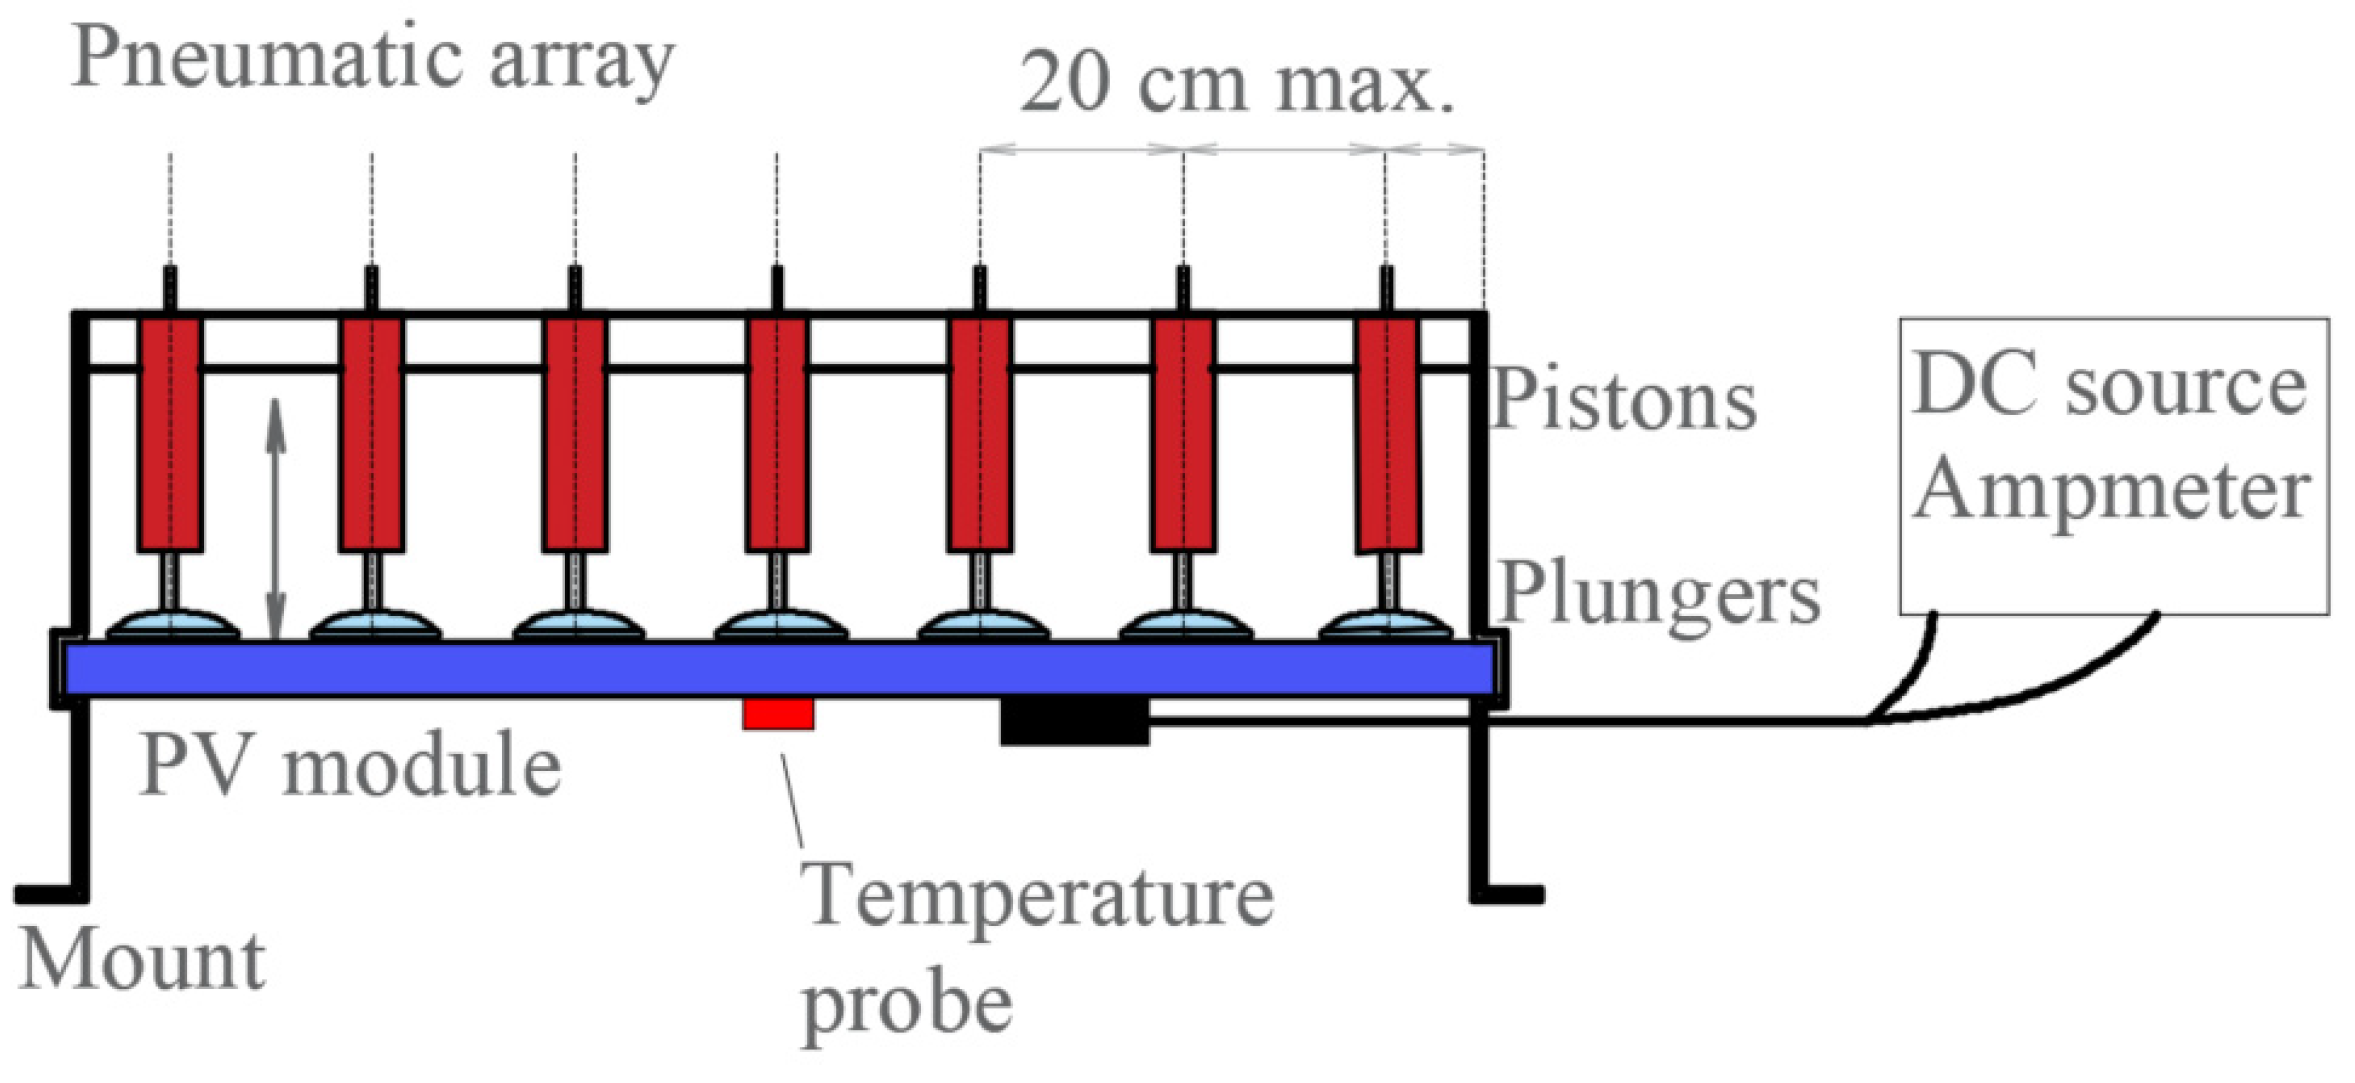
A set de pneumatic pistons with suction plumbers end to apply a total pressure of 1000 Pa ± 10% over the PV surface (adding all the pistons). The system must achieve a cycle rate of 3 to 7 cycles per minute. The distance between pistons cannot exceed 20 cm, including the border frame.
A (or several) DC power source to inject around 1% of module Isc until two times its Im.
An amp-meter to detect any loss of electrical continuity.
A thermometer with an accuracy of ±2 °C and repeatability of ±0.5 °C.
An infrared (IR) camera or thermographic camera (to be used after test).
An Electroluminescence (EL) camera (to be used after test).
A balance to adjust the piston force.
Methodology. Previous to this test, Test 01 must be completed—“Visual inspection”, and Test 15—“Wet leakage current”, in order to compare its results.
Hold the PV module over a suitable rack and attach (sucking) the plumber pistons over its surface.
Connect the DC current source to inject around 1% of the module Isc to check the electrical continuity.
Check the module temp range is between its operating temperature.
Activate the pneumatic array to apply pressure in both directions of 1000 Pa ± 10%. To set the force of each piston, may be used the Equation (7). Where F is the force in N, P is the desired pressure, A is the module area, and n is the number of pistons. Then 1000 cycles [36,37] must be performed with a rate of 3 to 7 cycles per minute. For further details see IEC TS 62782 [38].
F = PA/n
Figure 17 shows a simplified schematic of the system. This system also may be used to perform test 16—“Mechanical load”.
Optionally, check the module EL performing a scan over its surface when a current is applied through it between 0.1 to 1 time its Isc, looking for cracked cells or changes.
Finally, perform an IR scan with a current between 1 to 2 times its Im, looking for overheated cells or changes. A guideline to carry out these checks can be found in the standard IEC TS 60904-9.
Pass. The test is satisfactory if no loss of continuity were detected, and Tests 01 and 15 are satisfactory.
3.21. Test 21—Potential Induced Degradation Test
This test is designed to know if the PV module may withstand electrical degradation induced due to high voltage, known as Potential Induced Degradation (PID).
Objective. Force an elevated electric field over the PV module connecting a high voltage DC source into its terminals with the module surface and frame to detect any potential degradation PID risk.
Hardware. A DC voltage source for reaching the module maximum system voltage in both polarities, between ±5%.
An amp-meter to detect any leaking current to the ground (or a volt-meter with a shunt resistance).
Datalogger to register the environmental parameters, such as relative humidity and temperature (± 1 °C).
A thermal chamber to maintain a constant temp.
A conductive flat plate to be in contact with the module surface (glass). This plate can be aluminum or copper foil.
A set of wires with proper isolation to be used.
Methodology. Determine reading the PV module information (or datasheet) the maximum module voltage to ground that can withstand when it is connected in strings. Here, two cases can be differentiated: (1) PV modules without ground connection must be tested in two reverse polarities; (2) if the module has a ground connection (one terminal connected to the ground), it must only be tested in the indicated polarity.
Further, there are two ways to perform the present test. We focus only on the easiest to implement (without employing a climate chamber) with single glass PV modules. See IEC TS 62804-1 for further details or other kinds of modules.
First, the following tests must be carried out: Test 01—“Visual inspection”, and 15—“Wet leakage current”.
Next, check the module temp between 25 ± 1 °C with relative humidity less than 60%.
Attach the plate or foil over the module surface and connect it with the frame to the DC voltage source in 1 end and the PV connectors together on the other end. If the module has a ground terminal, also connect it.
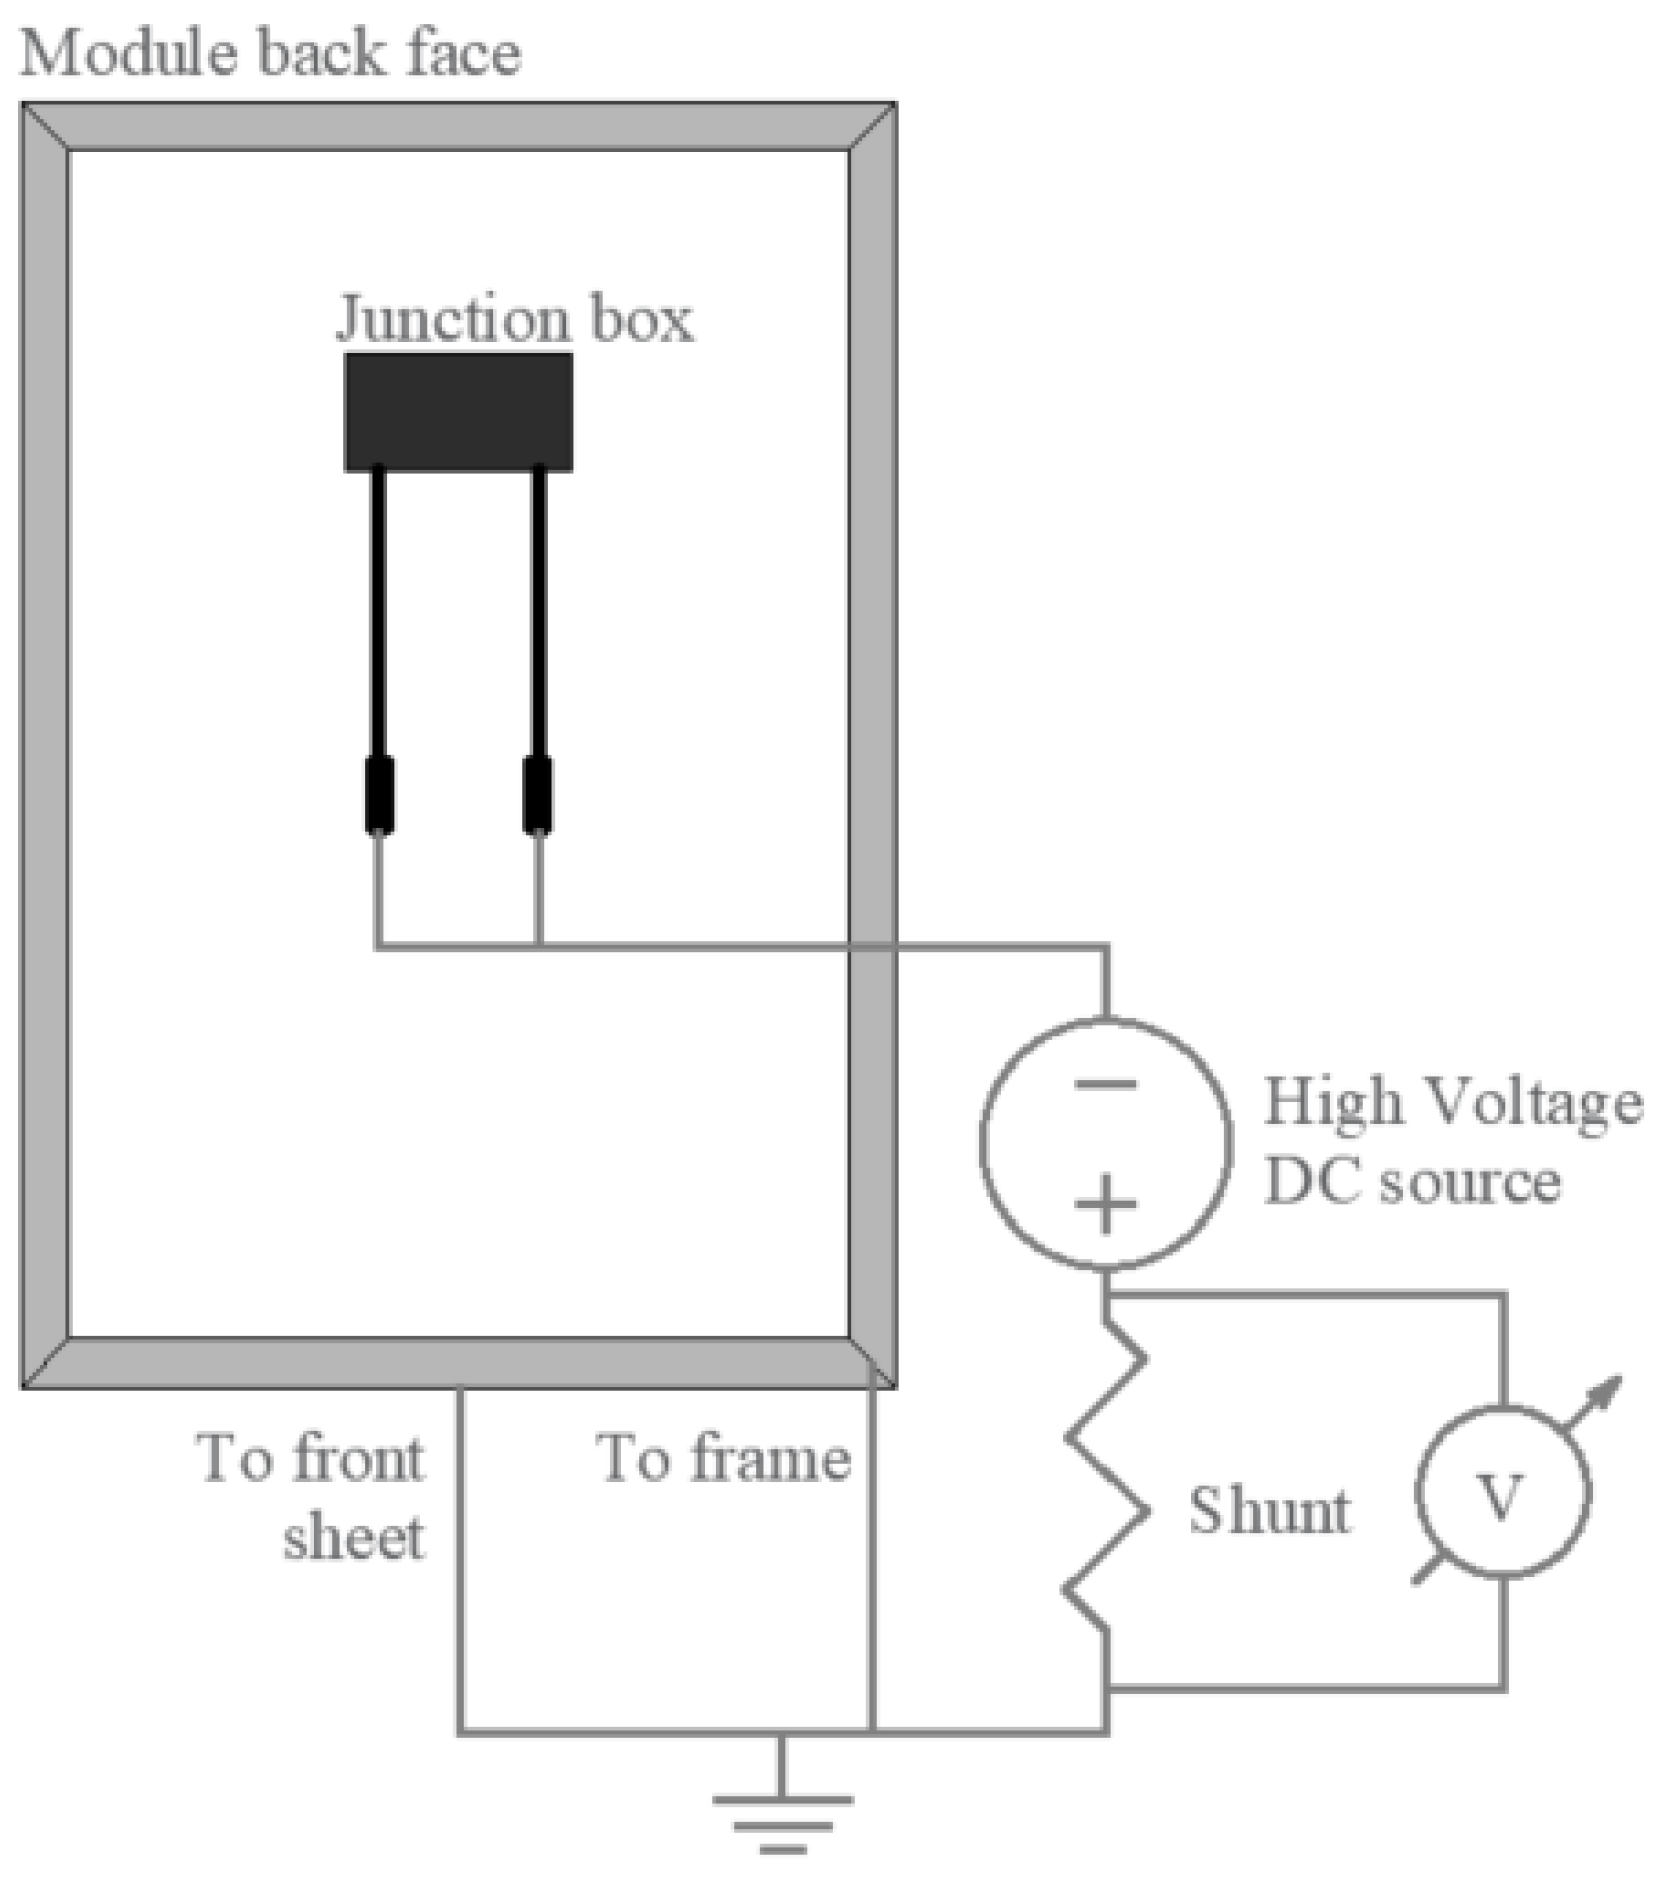
Set the source to 2 times the maximum system voltage and apply it for 168 h (7 full days) [39] in order to submit the module in an intense electric field. Figure 18 shows a diagram indicating the connections. Finally, the criterion involved in the PID detection is to compare by repeating after a prudent time (8 h) Test 01 and 15, looking for issues [40].
4. Conclusions
Throughout this work, every test presented in the IEC 61215-2:2021 standard is explained from a pragmatic point of view. Further, we have provided details concerning our experience to make it easy to implement.
As we refer to in the introduction, the document aims to help manufacturers carry out some of them before resorting to expensive accredited laboratories for its final revision according to their interest. Thus, they can identify and correct any issues that could be detected in the assembly process.
Performing some of these tests is possible to conduct to reliable PV products because they are designed to examine the conditions possible to be found in its usual lifespan in an accelerated way.
In the same way, it would help any university for educational or research purposes because it can be used as referenceable or consulting material.
This IEC 61215 review has been written to follow the main concepts easily, incorporating single figures to illustrate the procedures/concepts, and it is not only leading to an expert audience.
Finally, this text was not written to discuss the methods reported and internationally recognized in the standard, nor to replace the original concepts in any way.
Author Contributions
Conceptualization, A.F. and M.C.; methodology, A.F., M.C., A.R.G.M. and L.H.V.; formal analysis, L.H.V.; investigation, A.F., M.C. and A.R.G.M.; writing—review and editing, A.F. and M.C. All authors have read and agreed to the published version of the manuscript.
Funding
This research received no external funding.
Institutional Review Board Statement
Not applicable.
Informed Consent Statement
Consent was obtained from all subjects involved in the study.
Data Availability Statement
Not applicable.
Conflicts of Interest
The authors declare no conflict of interest.
References
- IEC International Standard 61215; IEC 61215:2005 Crystalline Silicone Terrestrial Photovoltaic (PV) Modules—Design Qualification and Type Approval. IEC: Geneva, Switzerland, 2005; pp. 1–102.
- Lien, C.; Yang, W.-L.; Lu, K.-W.; Ting, S.-Y.; Chen, S.-H.; Hsieh, C.-F.; Tsai, C.-C.; Wu, H.-S.; Wu, T.-C. The comparative study in the performance of bifacial and monofacial c-Si photovoltaic modules under the specific sequential tests. In Proceedings of the 2018 IEEE 7th World Conference on Photovoltaic Energy Conversion (WCPEC) (A Joint Conference of 45th IEEE PVSC, 28th PVSEC & 34th EU PVSEC), Waikoloa, HI, USA, 10–15 June 2018; pp. 1305–1308. [Google Scholar]
- IEA-PVPS, Photovoltaic Power Systems Programme. Trends in Photovoltaic Applications. Task 1. Strategic PV Analysis and Outreach; IEA-PVPS T1-38; IEA: Paris, France, 2020; pp. 1–88. [Google Scholar]
- IEC International Standard 61215-2; IEC 61215-2:2021 Terrestrial Photovoltaic (PV) Modules—Design Qualification and Type Approval—Part 2: Test Procedures. IEC: Geneva, Switzerland, 2021; pp. 1–112.
- Kurtz, S.; Repins, I.L.; Hacke, P.L.; Jordan, D.; Kempe, M.D.; Whitfield, K.; Phillips, N.; Sample, T.; Monokroussos, C.; Hsi, E.; et al. Qualification Testing Versus Quantitative Reliability Testing of pv-Gaining Confidence in a Rapidly Changing Technology; National Renewable Energy Lab. (NREL): Golden, CO, USA, 2017; pp. 1–11.
- Flicker, J.; Tamizhmani, G.; Moorthy, M.K.; Thiagarajan, R.; Ayyanar, R. Accelerated testing of module-level power electronics for long-term reliability. IEEE J. Photovolt. 2016, 7, 259–267. [Google Scholar] [CrossRef]
- Bora, B.; Sastry, O.S.; Mondal, S.; Prasad, B. Reliability Testing of PV Module in the Outdoor Condition. Prog. Sol. Energy Technol. Appl. 2019, 13, 196. [Google Scholar]
- AbdulMawjood, K.; Refaat, S.S.; Morsi, W.G. Detection and prediction of faults in photovoltaic arrays: A review. In Proceedings of the 2018 IEEE 12th International Conference on Compatibility, Power Electronics and Power Engineering (CPE-POWERENG 2018), Doha, Qatar, 10–12 April 2018; pp. 1–8. [Google Scholar]
- Batzelis, E.I.; Papathanassiou, S.A. A method for the analytical extraction of the single-diode PV model parameters. IEEE Trans. Sustain. Energy 2015, 7, 504–512. [Google Scholar] [CrossRef]
- Imenes, A.G.; Yordanov, G.H.; Midtgård, O.M.; Saetre, T.O. Development of a test station for accurate in situ IV curve measurements of photovoltaic modules in Southern Norway. In Proceedings of the 2011 37th IEEE Photovoltaic Specialists Conference, Seattle, WA, USA, 19–24 June 2011; pp. 3153–3158. [Google Scholar]
- IEC International Standard 60904-9; IEC 60904-9:2020 Photovoltaic Devices—Part 9: Classification of Solar Simulator Characteristics. IEC: Geneva, Switzerland, 2020; pp. 1–59.
- Gostein, M.; Stueve, B.; Clark, R.; Keelin, P.; Grammatico, M.; Reusser, M. Field Trial of Meteorological Station Using PV Reference Cells. In Proceedings of the 2020 47th IEEE Photovoltaic Specialists Conference (PVSC), Calgary, AB, Canada, 15 June–21 August 2020; pp. 520–523. [Google Scholar]
- Wang, A.; Xuan, Y. Close examination of localized hot spots within photovoltaic modules. Energy Convers. Manag. 2021, 234, 1–10. [Google Scholar] [CrossRef]
- Pereira, R.I.; Jucá, S.C.; Carvalho, P.C.; Souza, C.P. Iot network and sensor signal conditioning for meteorological data and photovoltaic module temperature monitoring. IEEE Lat. Am. Trans. 2019, 17, 937–944. [Google Scholar] [CrossRef]
- Montes-Romero, J.; Piliougine, M.; Muñoz, J.V.; Fernández, E.F.; De la Casa, J. Photovoltaic device performance evaluation using an open-hardware system and standard calibrated laboratory instruments. Energies 2017, 10, 1869. [Google Scholar] [CrossRef] [Green Version]
- Vega, A.; Valiño, V.; Conde, E.; Ramos, A.; Reina, P. Double sweep tracer for IV curves characterization and continuous monitoring of photovoltaic facilities. Solar Energy 2019, 190, 622–629. [Google Scholar] [CrossRef]
- Duran, E.; Piliougine, M.; Sidrach-de-Cardona, M.; Galan, J.; Andujar, J.M. Different methods to obtain the I–V curve of PV modules: A review. In Proceedings of the 2008 33rd IEEE Photovoltaic Specialists Conference, San Diego, CA, USA, 11–16 May 2008; pp. 1–6. [Google Scholar]
- Tupta, M.A. IV characterization of solar cells and panels using a source-measure unit. EE-Eval. Eng. 2017, 56, 22–24. [Google Scholar]
- Zhu, Y.; Xiao, W. A comprehensive review of topologies for photovoltaic I–V curve tracer. Solar Energy 2020, 196, 346–357. [Google Scholar] [CrossRef]
- IEC International Standard 60904-1; IEC 60904-1:2017 Measurement of Photovoltaic Current-Voltage Characteristics. IEC: Geneva, Switzerland, 2017; pp. 1–23.
- IEC International Standard 60891; IEC 60891:2009 Photovoltaic Devices—Procedures for Temperature and Irradiance Corrections to Measured I–V Characteristics. IEC: Geneva, Switzerland, 2009; pp. 1–40.
- da Fonseca JE, F.; de Oliveira, F.S.; Prieb CW, M.; Krenzinger, A. Degradation analysis of a photovoltaic generator after operating for 15 years in southern Brazil. Solar Energy 2020, 196, 196–206. [Google Scholar] [CrossRef]
- Jones, C.B.; Hamzavy, B.; Hobbs, W.B.; Libby, C.; Lavrova, O. IEC 61215 Qualification Tests vs Outdoor Performance using Module Level In Situ IV Curve Tracing Devices. In Proceedings of the 2018 IEEE 7th World Conference on Photovoltaic Energy Conversion (WCPEC) (A Joint Conference of 45th IEEE PVSC, 28th PVSEC & 34th EU PVSEC), Waikoloa, HI, USA, 10–15 June 2018; pp. 1286–1291. [Google Scholar]
- Osterwald, C.R.; Campanelli, M.; Kelly, G.J.; Williams, R. On the reliability of photovoltaic short-circuit current temperature coefficient measurements. In Proceedings of the 2015 IEEE 42nd Photovoltaic Specialist Conference (PVSC), New Orleans, LA, USA, 14–19 June 2015; pp. 1–6. [Google Scholar]
- Menke, W. Review of the generalized least squares method. Surv. Geophys. 2015, 36, 1–25. [Google Scholar] [CrossRef]
- Chauhan, A.; Prakash, S. Parameter Estimation of Solar Photovoltaic and Impact of Environmental Conditions on Its Performance. In Handbook of Renewable Energy Technology & Systems; World Scientific: Singapore, 2022; pp. 201–234. [Google Scholar]
- Fuentes, M.; Nofuentes, G.; Aguilera, J.; Talavera, D.L.; Castro, M. Application and validation of algebraic methods to predict the behaviour of crystalline silicon PV modules in Mediterranean climates. Solar Energy 2007, 81, 1396–1408. [Google Scholar] [CrossRef]
- Wendlandt, S.; Süthoff, L.; Berendes, S.; Teubner, J.; Podlowski, L.; Krauter, S.; Grunow, P. Advanced PV Module Hot Spot Characterisation. EU PVSEC 2017, 2017, 1–7. [Google Scholar]
- Koehl, M.; Philipp, D. Inter-laboratory comparison of UV-light sources for testing of PV-modules. Prog. Photovolt. Res. Appl. 2015, 23, 1815–1819. [Google Scholar] [CrossRef]
- Roy, S.; Kumar, S.; Gupta, R. Investigation and analysis of finger breakages in commercial crystalline silicon photovoltaic modules under standard thermal cycling test. Eng. Fail. Anal. 2019, 101, 309–319. [Google Scholar] [CrossRef]
- Spataru, S.; Hacke, P.; Sera, D.; Packard, C.; Kerekes, T.; Teodorescu, R. Temperature-dependency analysis and correction methods of in situ power-loss estimation for crystalline silicon modules undergoing potential-induced degradation stress testing. Prog. Photovolt. Res. Appl. 2015, 23, 1536–1549. [Google Scholar] [CrossRef]
- IEC International Standard 60068-2-21 IEC; IEC 60068-2-21:2006 Robustness of Terminations and Integral Mounting Devices. IEC: Geneva, Switzerland, 2006; pp. 1–28.
- Islam, M.A.; Hasanuzzaman, M.; Abd Rahim, N. Effect of different factors on the leakage current behavior of silicon photovoltaic modules at high voltage stress. IEEE J. Photovolt. 2018, 8, 1259–1265. [Google Scholar] [CrossRef]
- Park, J.J.; Park, C.Y.; Ryu, J.W. Hail Impact Analysis of Photovoltaic Module using IEC Test. J. Korean Sol. Energy Soc. 2020, 40, 23–33. [Google Scholar] [CrossRef]
- Shiradkar, N.S.; Gade, V.S.; Schneller, E.J.; Sundaram, K.B. Revising the bypass diode test to incorporate the effects of photovoltaic module mounting configuration and climate of deployment. In Proceedings of the 2018 IEEE 7th World Conference on Photovoltaic Energy Conversion (WCPEC) (A Joint Conference of 45th IEEE PVSC, 28th PVSEC & 34th EU PVSEC), Waikoloa, HI, USA, 10–15 June 2018; pp. 1766–1772. [Google Scholar]
- Wohlgemuth, J.H. Photovoltaic Module Reliability; John Wiley & Sons: Hoboken, NJ, USA, 2020; pp. 1–258. [Google Scholar]
- Gabor, A.M.; Janoch, R.; Anselmo, A.; Lincoln, J.L.; Seigneur, H.; Honeker, C. Mechanical load testing of solar panels—Beyond certification testing. In Proceedings of the 2016 IEEE 43rd Photovoltaic Specialists Conference (PVSC), Portland, OR, USA, 5–10 June 2016; pp. 3574–3579. [Google Scholar]
- IEC International Standard 62782; IEC TS 62782:2016 Photovoltaic (PV) Modules—Cyclic (Dynamic) Mechanical Load Testing. IEC: Geneva, Switzerland, 2016; pp. 1–9.
- López-Escalante, M.C.; Caballero, L.J.; Martín, F.; Gabás, M.; Cuevas, A.; Ramos-Barrado, J.R. Polyolefin as PID-resistant encapsulant material in PV modules. Sol. Energy Mater. Sol. Cells 2016, 144, 691–699. [Google Scholar] [CrossRef]
- Luo, W.; Khoo, Y.S.; Hacke, P.; Naumann, V.; Lausch, D.; Harvey, S.P.; Singh, J.P.; Chai, J.; Wang, Y.; Ramakrishna, S.; et al. Potential-induced degradation in photovoltaic modules: A critical review. Energy Environ. Sci. 2017, 10, 43–68. [Google Scholar] [CrossRef] [Green Version]
Figure 1.
PV cell defects illustration.

Figure 2.
Methodological setup for maximum power determination test.

Figure 3.
Method to translate an I–V curve by linear interpolation within two measured curves.

Figure 4.
Schematic for the insulation test and connection method.

Figure 5.
Schematic for the measurement of nominal operating cell temperature (NOCT) test.

Figure 6.
Temperature correction factor for wind and ambient temperature.

Figure 7.
Schematic for the hot-spot endurance test.

Figure 8.
Schematic for the UV preconditioning test.

Figure 9.
Schematic for the thermal cycling test.
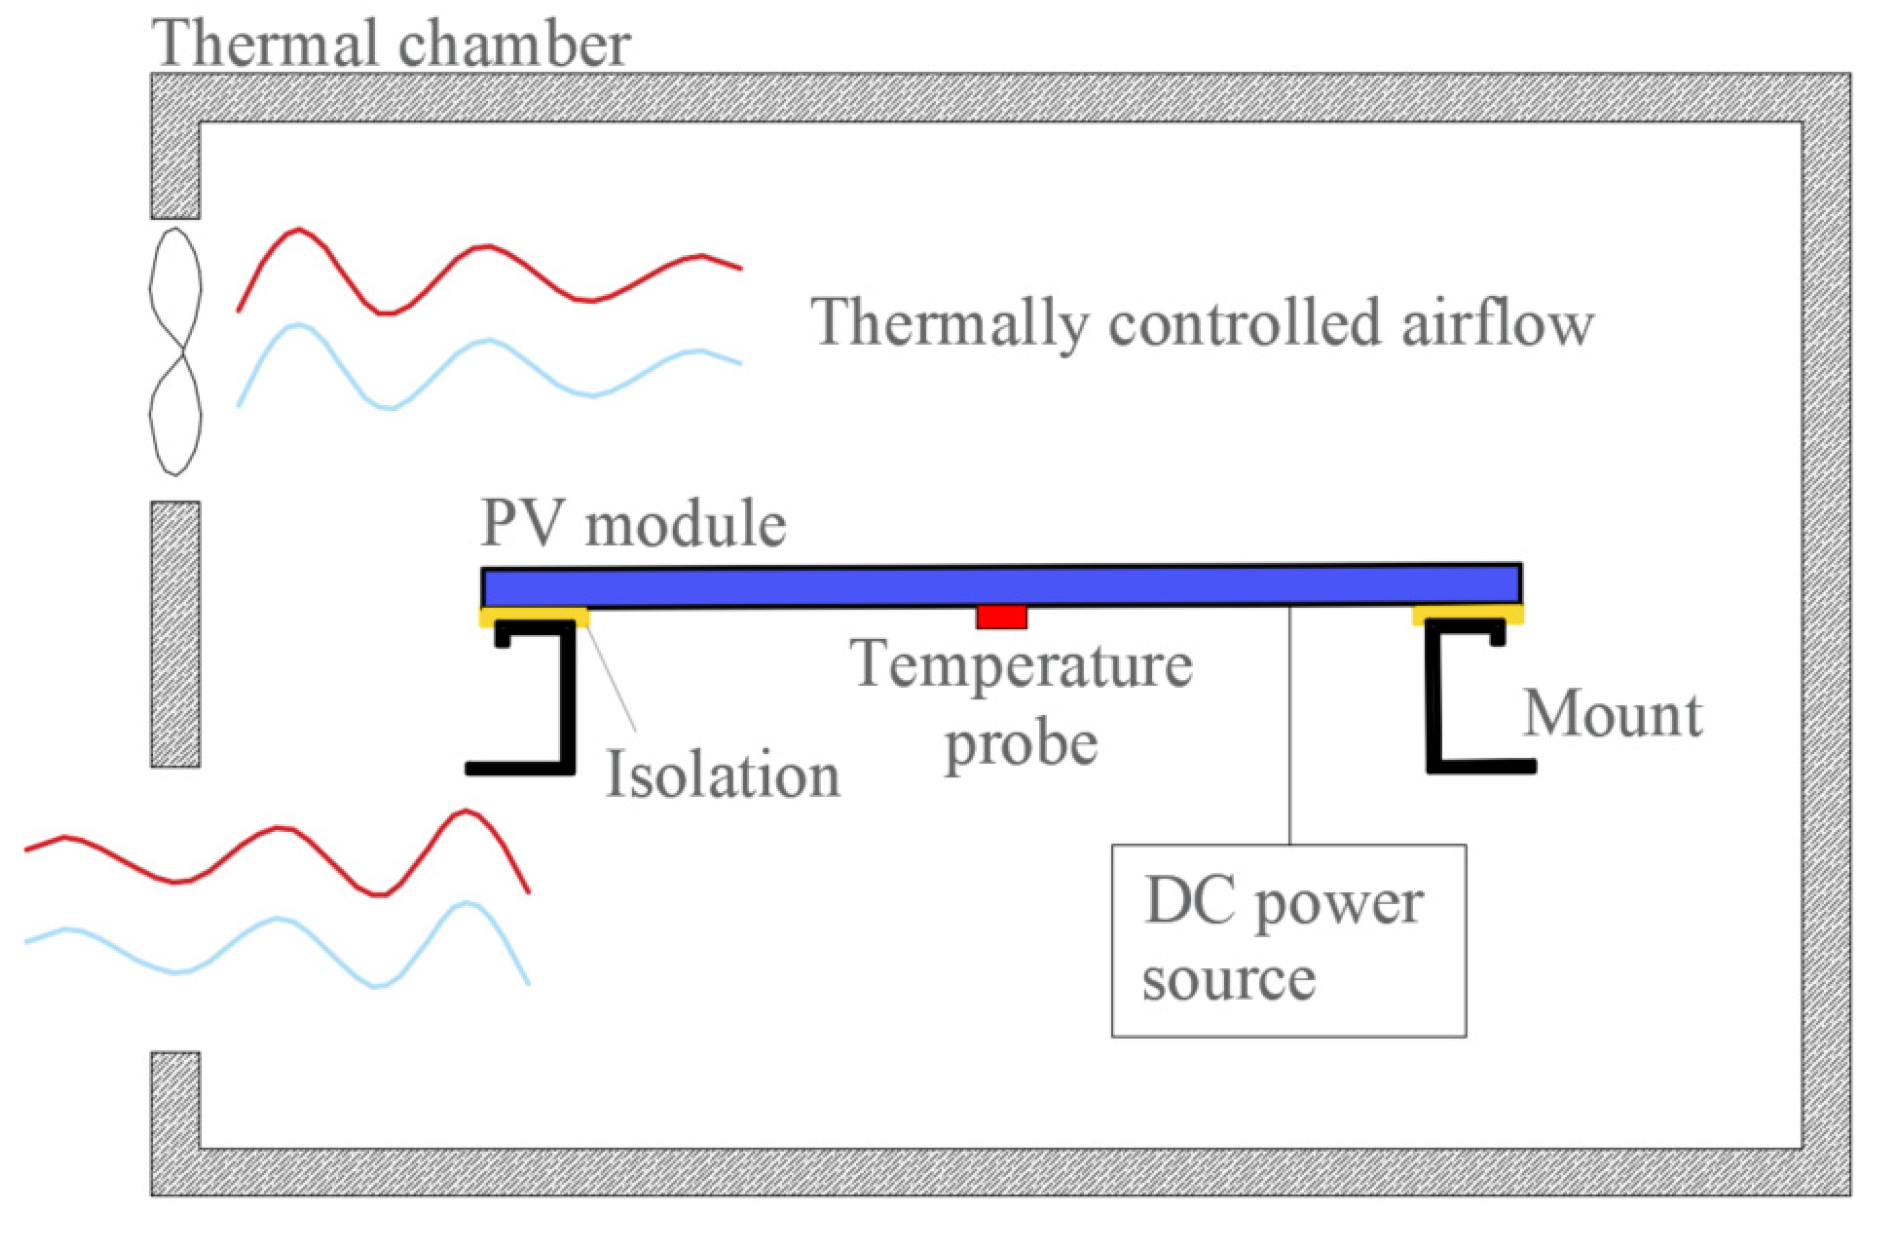
Figure 10.
Cycling procedure for the thermal cycling test.

Figure 11.
Schematic for the humidity-freeze test.

Figure 12.
Procedure for the robustness of terminations test. (a) Tensile test, (b) Bending test.

Figure 13.
Schematic for the wet leakage current test.
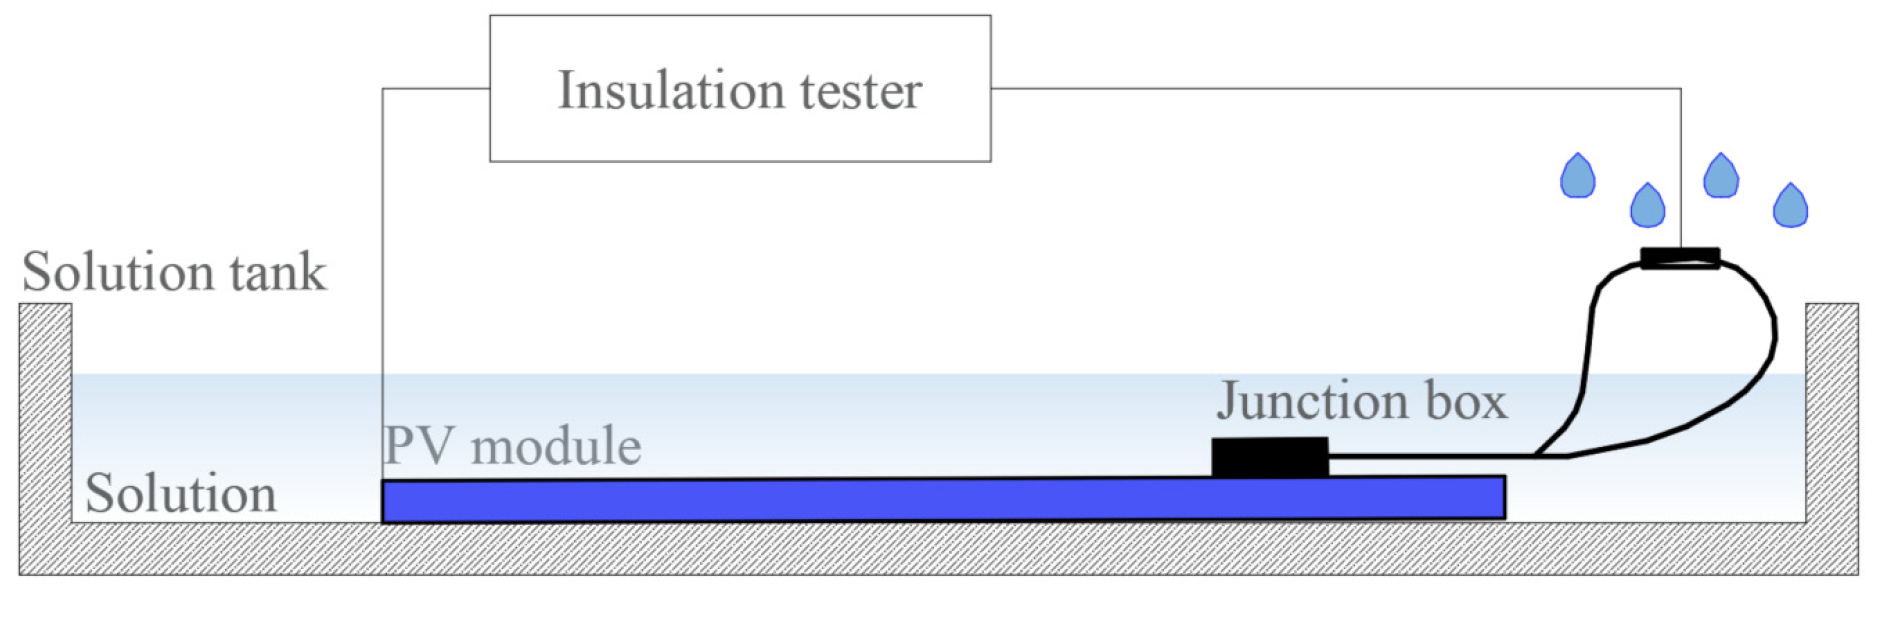
Figure 14.
Schematic for the mechanical load test.

Figure 15.
Schematic for the hail test.

Figure 16.
Schematic for the bypass diode thermal test.
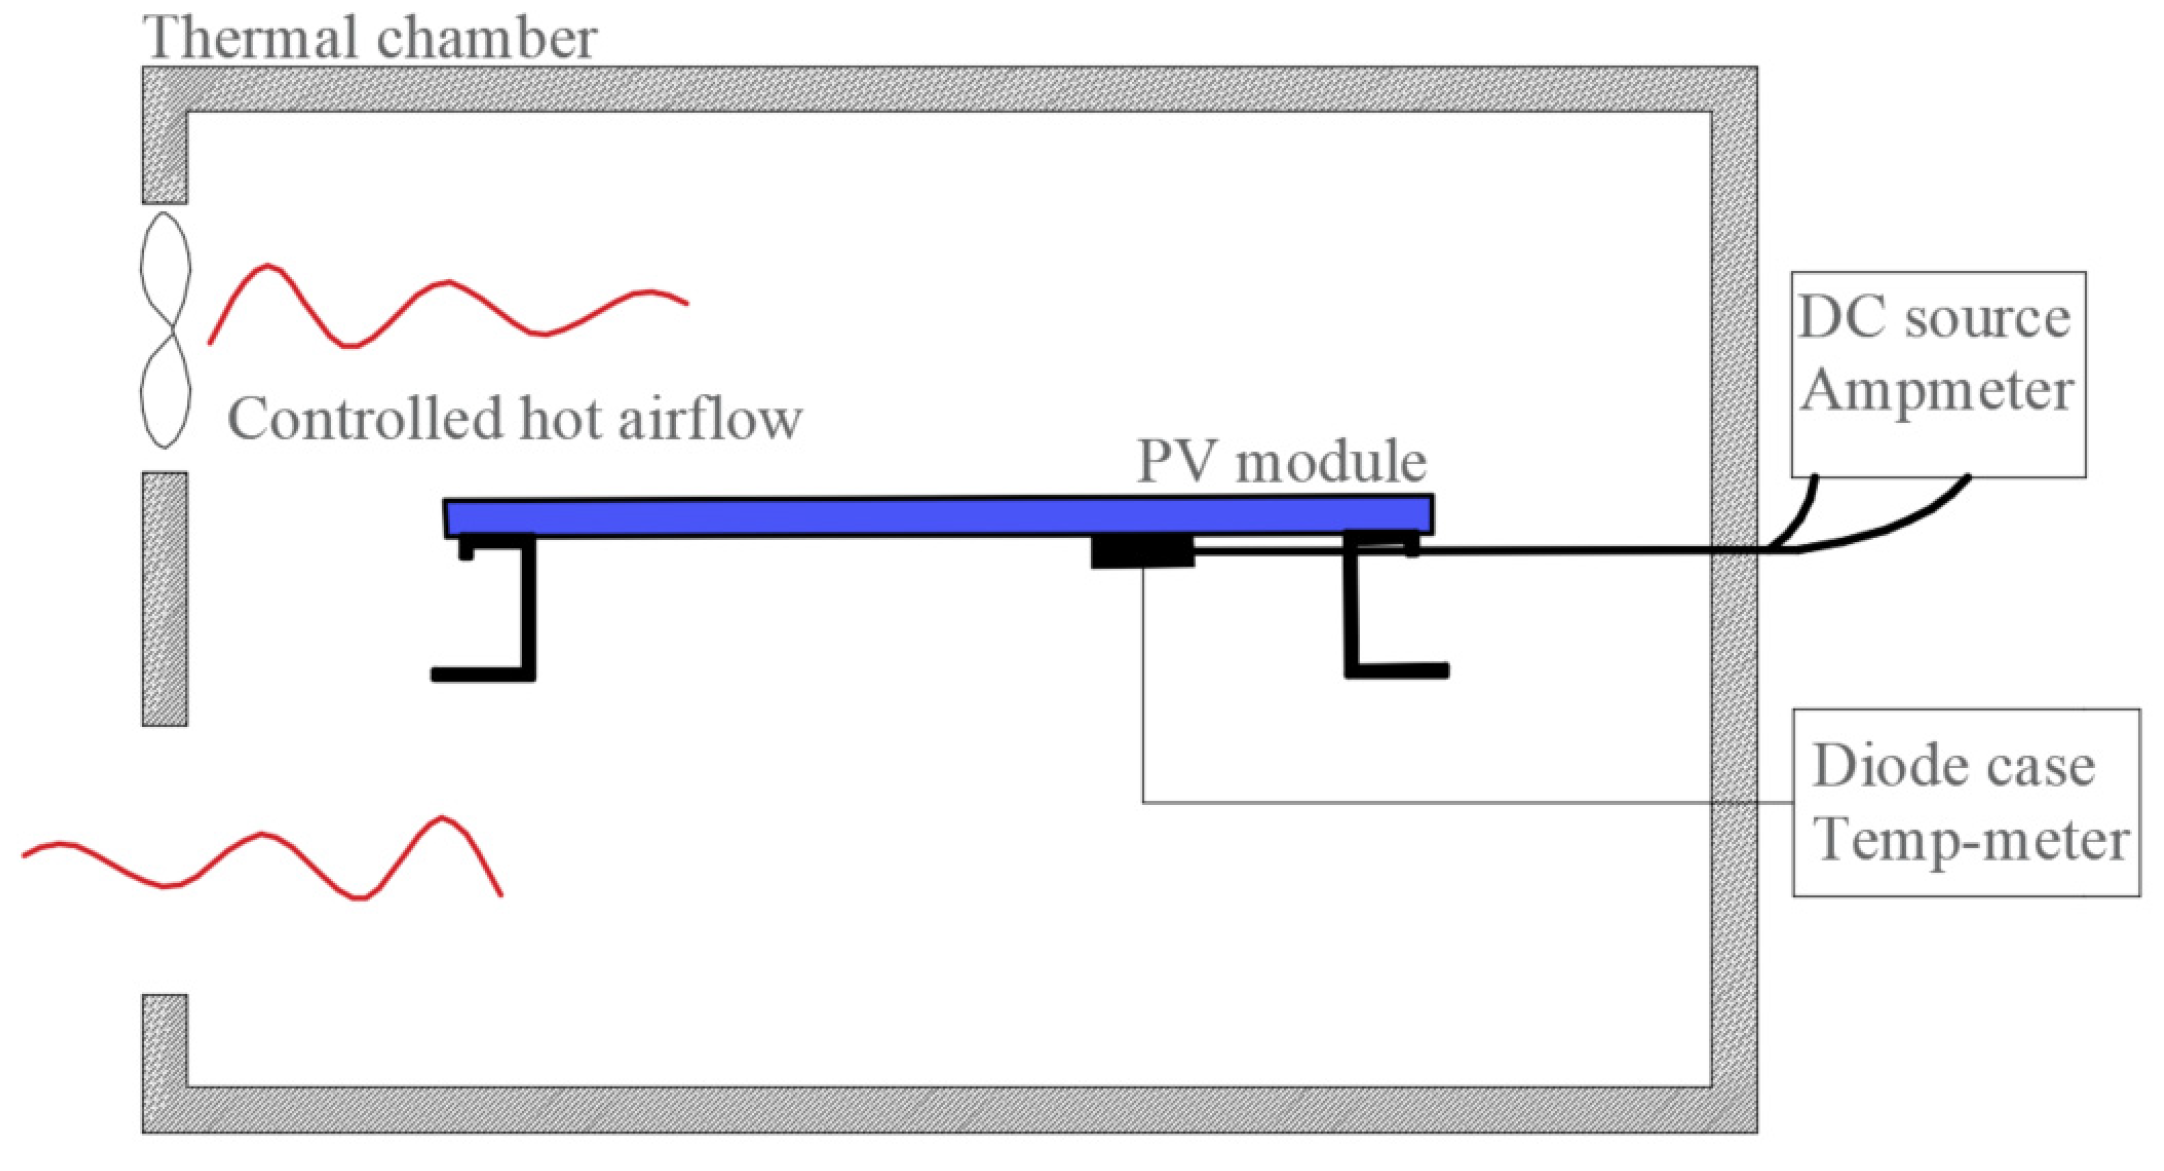
Figure 17.
Schematic for the dynamic cyclic mechanical load test.

Figure 18.
Schematic for the potential induced degradation test.


Table 1.
Force selection for the tensile and bending test.
| Circular Wire Diameter [mm] | Tensile Force [N] | Bending Force [N] |
|---|---|---|
| 0.5–0.8 | 10 | 5 |
| 0.8–1.25 | 20 | 10 |
| >1.25 | 40 | 20 |
Publisher’s Note: MDPI stays neutral with regard to jurisdictional claims in published maps and institutional affiliations. |
© 2022 by the authors. Licensee MDPI, Basel, Switzerland. This article is an open access article distributed under the terms and conditions of the Creative Commons Attribution (CC BY) license (https://creativecommons.org/licenses/by/4.0/).
Share and Cite
MDPI and ACS Style
Firman, A.; Cáceres, M.; González Mayans, A.R.; Vera, L.H. Photovoltaic Qualification and Approval Tests. Standards 2022, 2, 136-156. https://doi.org/10.3390/standards2020011
AMA Style
Firman A, Cáceres M, González Mayans AR, Vera LH. Photovoltaic Qualification and Approval Tests. Standards. 2022; 2(2):136-156. https://doi.org/10.3390/standards2020011
Chicago/Turabian StyleFirman, Andrés, Manuel Cáceres, Alexis Raúl González Mayans, and Luis Horacio Vera. 2022. "Photovoltaic Qualification and Approval Tests" Standards 2, no. 2: 136-156. https://doi.org/10.3390/standards2020011