
Evaluation of Skin Irritation of Acids Commonly Used in Cleaners in 3D-Reconstructed Human Epidermis Model, KeraSkinTM

1
College of Pharmacy, Ewha Womans University, Seoul 03760, Korea
2
Transdisciplinary Major in Learning Health Systems, Department of Health and Safety Convergence Science, Korea University, Seoul 02481, Korea
*
Authors to whom correspondence should be addressed.
Toxics 2022, 10(10), 558; https://doi.org/10.3390/toxics10100558
Submission received: 10 September 2022
/
Revised: 20 September 2022
/
Accepted: 21 September 2022
/
Published: 24 September 2022
(This article belongs to the Special Issue Exposure to Indoor Hazardous Chemicals and Harmful Impacts on Human Body)
Abstract
:Cleaners such as dishwashing liquids contain various chemicals that cause skin damage. Alkaline agents used in cleaners alter the lipid composition of the skin and damage the skin barrier. However, little is known about the effects of acids used in cleaners on the skin. Here, we investigated the effects of acidic pH on the skin and evaluated the skin irritation of acids commonly used in cleaners with a 3D-reconstructed human epidermis model, KeraSkinTM, according to OECD TG439. First, to examine the effects of acidic pH, we evaluated the skin irritation of citrate buffers (0.1 M, McIlvaine buffer) prepared in a wide pH range (pH 1.5–6.0). Surprisingly, cell viability was not significantly affected even at pH 1.5, reflecting that the acidity alone may not be sufficient to induce skin irritation. Even after longer exposure (180 min), the cell viability was not reduced below 50%, a cutoff to determine an irritant. To examine the effect of the anionic part, several organic acids used in cleaners (citric acid, glycolic acid, lactic acid, malic acid, and succinic acid) were examined. These organic acids also failed to reduce viability at 0.1 M. However, at 1 M, most of the acids tested, except lactic acid, were determined to be skin irritants. Histology further supported the skin irritancy of acids at 1 M. Similarly, inorganic acids (hydrogen bromide, hydrogen chloride, nitric acid, and sulfuric acid) were determined to be irritants only at 1 M. In the case of alkaline agents, pH and concentrations were also important factors to determine the skin irritancy, although the epidermal structure and lipids were more damaged than acids. Collectively, we demonstrated that both the pH and concentration are important factors for the skin irritancy of acids, shedding an important insight into the mechanism of skin irritation.
1. Introduction
Cleaners are widely used household chemicals for the purpose of cleaning the surface of utensils, foods, and houses. Cleaning products contain detergents, solvents, acids, bases, and disinfectants, which facilitate the removal of dirt and stains from surfaces, and sanitizes it. Cleaners can be also categorized into acidic and alkaline cleaners depending on the pH [1]. Acidic cleaners, which contain various organic and inorganic acids are useful for removing mineral deposits or oxidation products on surfaces by dissolving alkaline minerals and salts. On the other hand, alkaline cleaners can effectively remove organic stains such as oils, fats, greases, and proteins from the surface [2].
Cleaners can damage the skin by destroying the epidermal lipid barriers. The type, concentration, and combination of detergents, their persistence on the skin, and pH can decide the adverse effects of products with respect to skin dryness and irritation [3,4]. In particular, the strong bases essential for removing animal-derived dirt result in highly alkaline cleaner products, which may be strongly irritating to the skin since the skin itself has a slightly acidic pH, between 4.0 and 6.0 [5,6,7], and the acid mantle of SC is pivotal for the formation of skin barrier function [8]. Indeed, it has been reported that the skin proteins swell markedly if exposed to highly alkaline substances (pH > 8.0). Optical coherence tomography (OCT) images of the stratum corneum (SC) [9] after its exposure to acidic (4.0), neutral (6.5), and alkaline pH (10.0) conditions, showed that there is significantly greater SC swelling when exposed to alkaline pH solutions, while acidic pH induces SC shrinking [10]. Alkaline pH also has an effect on SC lipids, with the ionization of fatty acids in the lipid bilayers causing the overall destabilization of the lipid bilayers [11].
As with alkaline agents, acids are expected to induce skin irritation. Extreme pH (<2.0 or >11.0) is generally considered to be corrosive or strongly irritating to the skin [12]. The United Nations Globally Harmonized System of Classification and Labeling of Chemicals (GHS) recommends the exemption of skin irritation tests for substances within those extreme pH ranges [4,12]. Interestingly, while the skin irritancy of alkaline agents has been well established through many experimental studies [13], the skin irritancy of acids was not clearly characterized with respect to pH, concentration, or types of acids. This is an important point for the manufacture of cleaners, since companies produce cleaners with acidic to neutral pH, in a range of 5.5–7.0, which may have less impact on the structural SC integrity.
Here, we studied the effect of pH, concentrations, and types of acids on skin irritation using a 3D-reconstructed human epidermis model, KeraSkin™, in accordance with the Organisation for Economic Co-operation and Development (OECD) Test No. 439: In Vitro Skin Irritation: Reconstructed Human Epidermis Test Method. In addition, alkaline agents used in cleaners were prepared at high and low concentrations, and their skin irritancies and effects on the epidermal lipids were compared with those of acids.
2. Materials and Methods
2.1. Materials
Specific details about the acid and alkali chemicals, with pH 0.1 and 1.0 M, and skin hazard classification, according to the GHS systems and EU, are shown in Table 1. All acidic and basic materials, MTT (3-(4,5-dimethylthiazol-2-yl)-2,5-diphenyltetrazolium bromide), D-PBS, and sodium dodecyl sulfate (SDS), were purchased from Sigma–Aldrich (St. Louis, MO, USA) with the highest grade available. McIlvaine buffer consists of 0.1 M monohydrated citric acid and 0.2 M disodium hydrogen phosphate (Na2HPO4) prepared in different volume ratios to achieve the specific pH [14].
2.2. D-Reconstructed Human Epidermis Skin Model
The skin model used in the skin irritation tests, KeraSkin™ (Biosolution Co., Ltd., Seoul, Korea), is a commercially available reconstructed human epidermis model prepared from primary normal human keratinocytes [28]. The KeraSkin™ model was cultured to be a multilayered and fully differentiated human keratinocyte. DMEM-based maintenance medium was also provided along with KeraSkin™ by Biosolution Co. Upon delivery, KeraSkin™ was placed on a 6-well plate filled with 0.9 mL/well culture media, and pre-incubated for 22 ± 2 h at 37 °C and 5% CO2.
2.3. In Vitro Skin Irritation Test (SIT)
The protocol for the KeraSkin™ skin irritation test was adopted using the me-too test method for OECD TG 439 [29] and was used for the evaluation of skin irritation of various chemicals [30,31,32,33]. After the pre-incubation, the tissue was removed from the incubator (Thermo Scientific, Waltham, MA, USA), and the test materials were applied immediately. Then, 40 μL of acid or alkali diluted in deionized water (DW) at indicated concentrations was dispensed directly on the tissue surface, and sterile forceps were used to tilt the insert and gently spread the liquid. DW was used as the negative control and 5% SDS as the positive control. After the test chemicals were applied, the plates were incubated at 37 °C and 5% CO2. After 30 min, the tissues were rinsed with DPBS. Tissues were post-incubated for 42 ± 2 h and then the entire medium was removed. Tissues were blotted and transferred to a 24-well plate that contained MTT (0.4 mg/mL) and incubated for 3 h at 37 °C and 5% CO2 [34]. Next, tissues were transferred to a new 6-well plate, prefilled with 2 mL of isopropanol. Formazan extraction was performed at room temperature for 3 h, and 250 μL of formazan extract per tissue was transferred to a 96-well plate (SPL, Pocheon-si, Republic of Korea). Optical density (OD) was measured at 570 nm using isopropanol as a blank with a microplate spectrophotometer (BioTek Instruments, Inc., Winooski, VT, USA). No test chemicals appeared to react with MTT.
2.4. Histological Analysis
For the histological examination, after MTT extraction, KeraSkin™ samples were fixed in 10% neutral-buffered formalin. According to the previous study [35], preserved tissues from each group were paraffin-embedded, sectioned, stained with hematoxylin and eosin (H&E, Dako, Agilent, anta Clara, CA, USA), and then examined microscopically under an Olympus DP71 microscope (Center Valley, PA, USA). All images of tissues were obtained using the virtual slide system (Aperio Scanscope XT, Vista, CA, USA).
2.5. Visualization of Lipid Distribution in KeraSkinTM with Nile Red Staining
Cryosections of KeraSkinTM models which had not undergone the MTT assay were stained with Nile Red (Sigma–Aldrich) to visualize the distribution of lipids [36]. Before Nile Red was used, 15 μL stock solution (500 μg/mL Nile Red in acetone) was diluted in 1 mL of 75% glycerol (VWR International, Radnor, PA, USA), and a diluted staining solution was dropped on each biopsy specimen section. A glass coverslip was then placed over each slide, and the slides were left in the dark for 5 min before observation by Softmax 5.2 program and Axio Observer 7 microscope (Carl Zeiss, Oberkochen, Germany) equipped at the Ewha Drug Development Research Core Center.
2.6. Statistics
Data are expressed as the mean ± standard error of the mean (SEM) of three or more independent experiments. The statistical significance of differences between groups was assessed using a two-sided Student’s t-test. p-values < 0.05 were considered significant.
3. Results
3.1. Skin Irritation of Acidic pH Determined in KeraSkin™
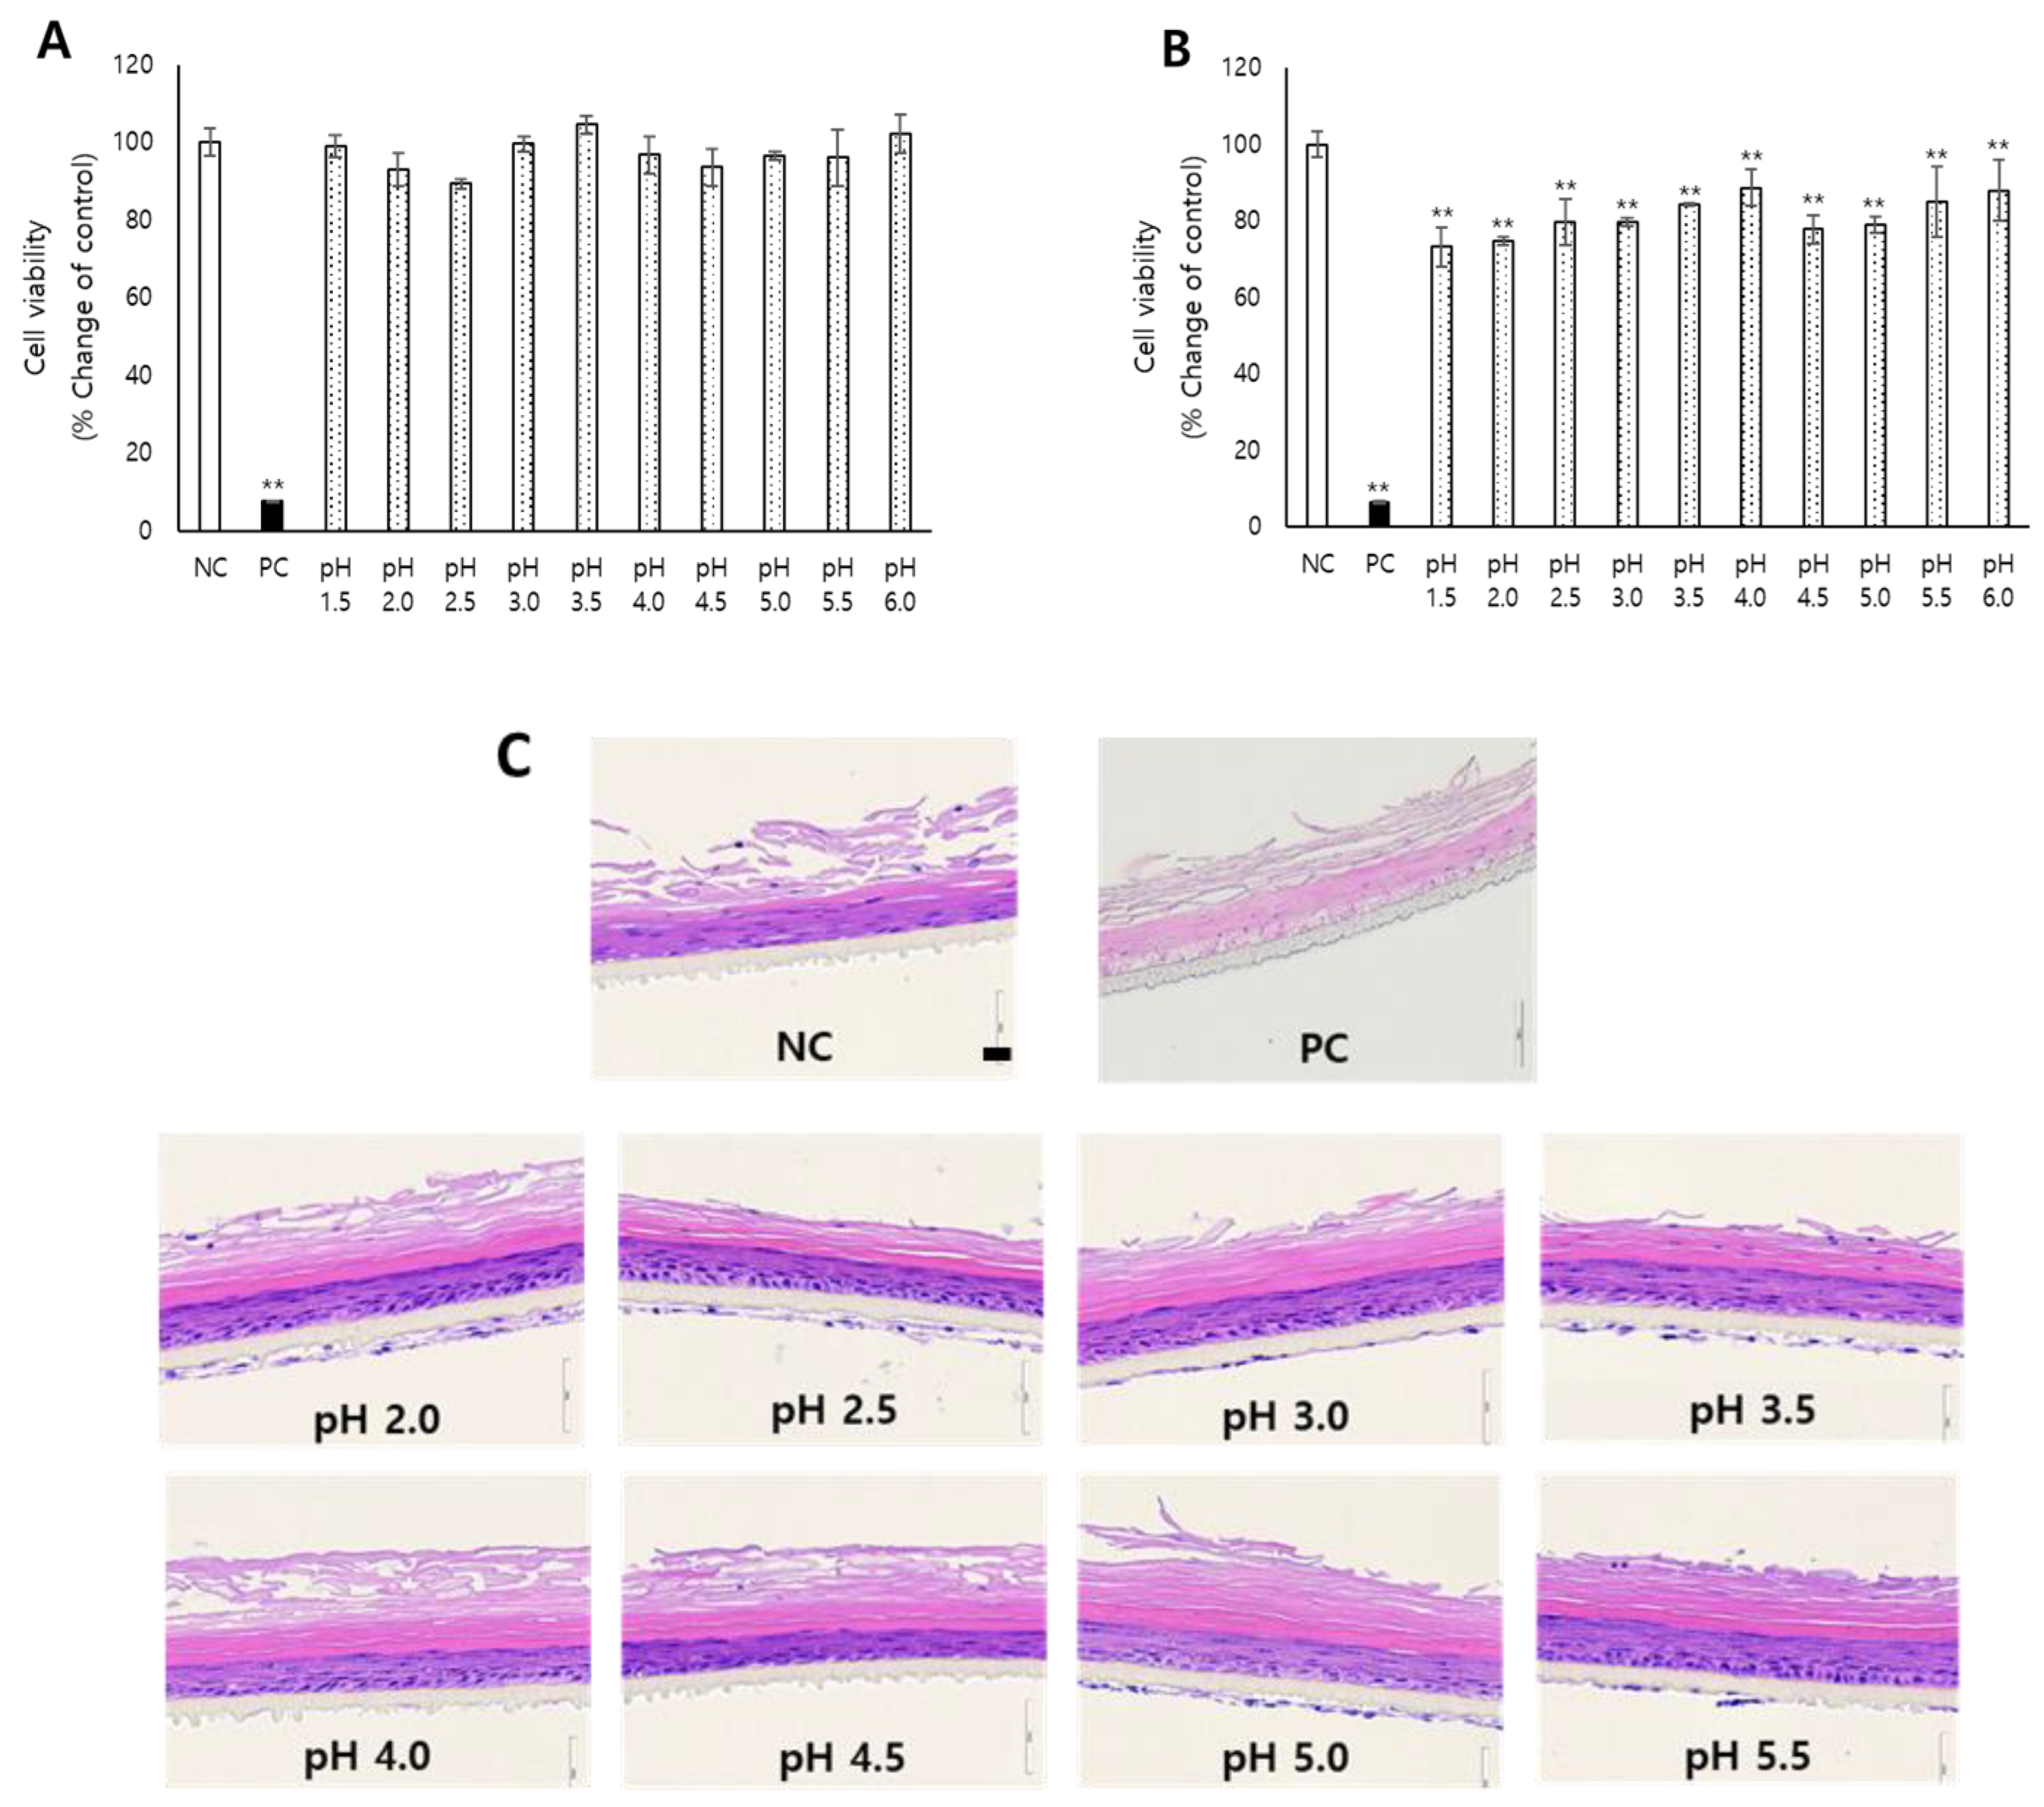
To examine the effect of acidic pH on skin irritation, the McIlvaine buffer, which had the widest pH range among the various biological buffers based on citric acids and phosphates, was employed. McIlvaine buffers have been widely used in biological tests to simulate a variety of conditions occurring in living organisms [37]. McIlvaine buffers prepared at 0.1 M in the range of pH 1.5–6.0 were applied for 30 min to KeraSkinTM. Surprisingly, there were no significant changes in cell viability at the tested pH (Figure 1A). After a longer exposure beyond the standard time (180 min exposure), the tissue viability was significantly reduced compared to the negative control, but the cell viability was preserved as higher than 50%, the cutoff for determining the test substance as a skin irritant. (Figure 1B). In line with this, the tissues treated for 180 min showed no significant difference in the histology from the negative control.
3.2. Evaluation of Skin Irritation of Various Organic Acids
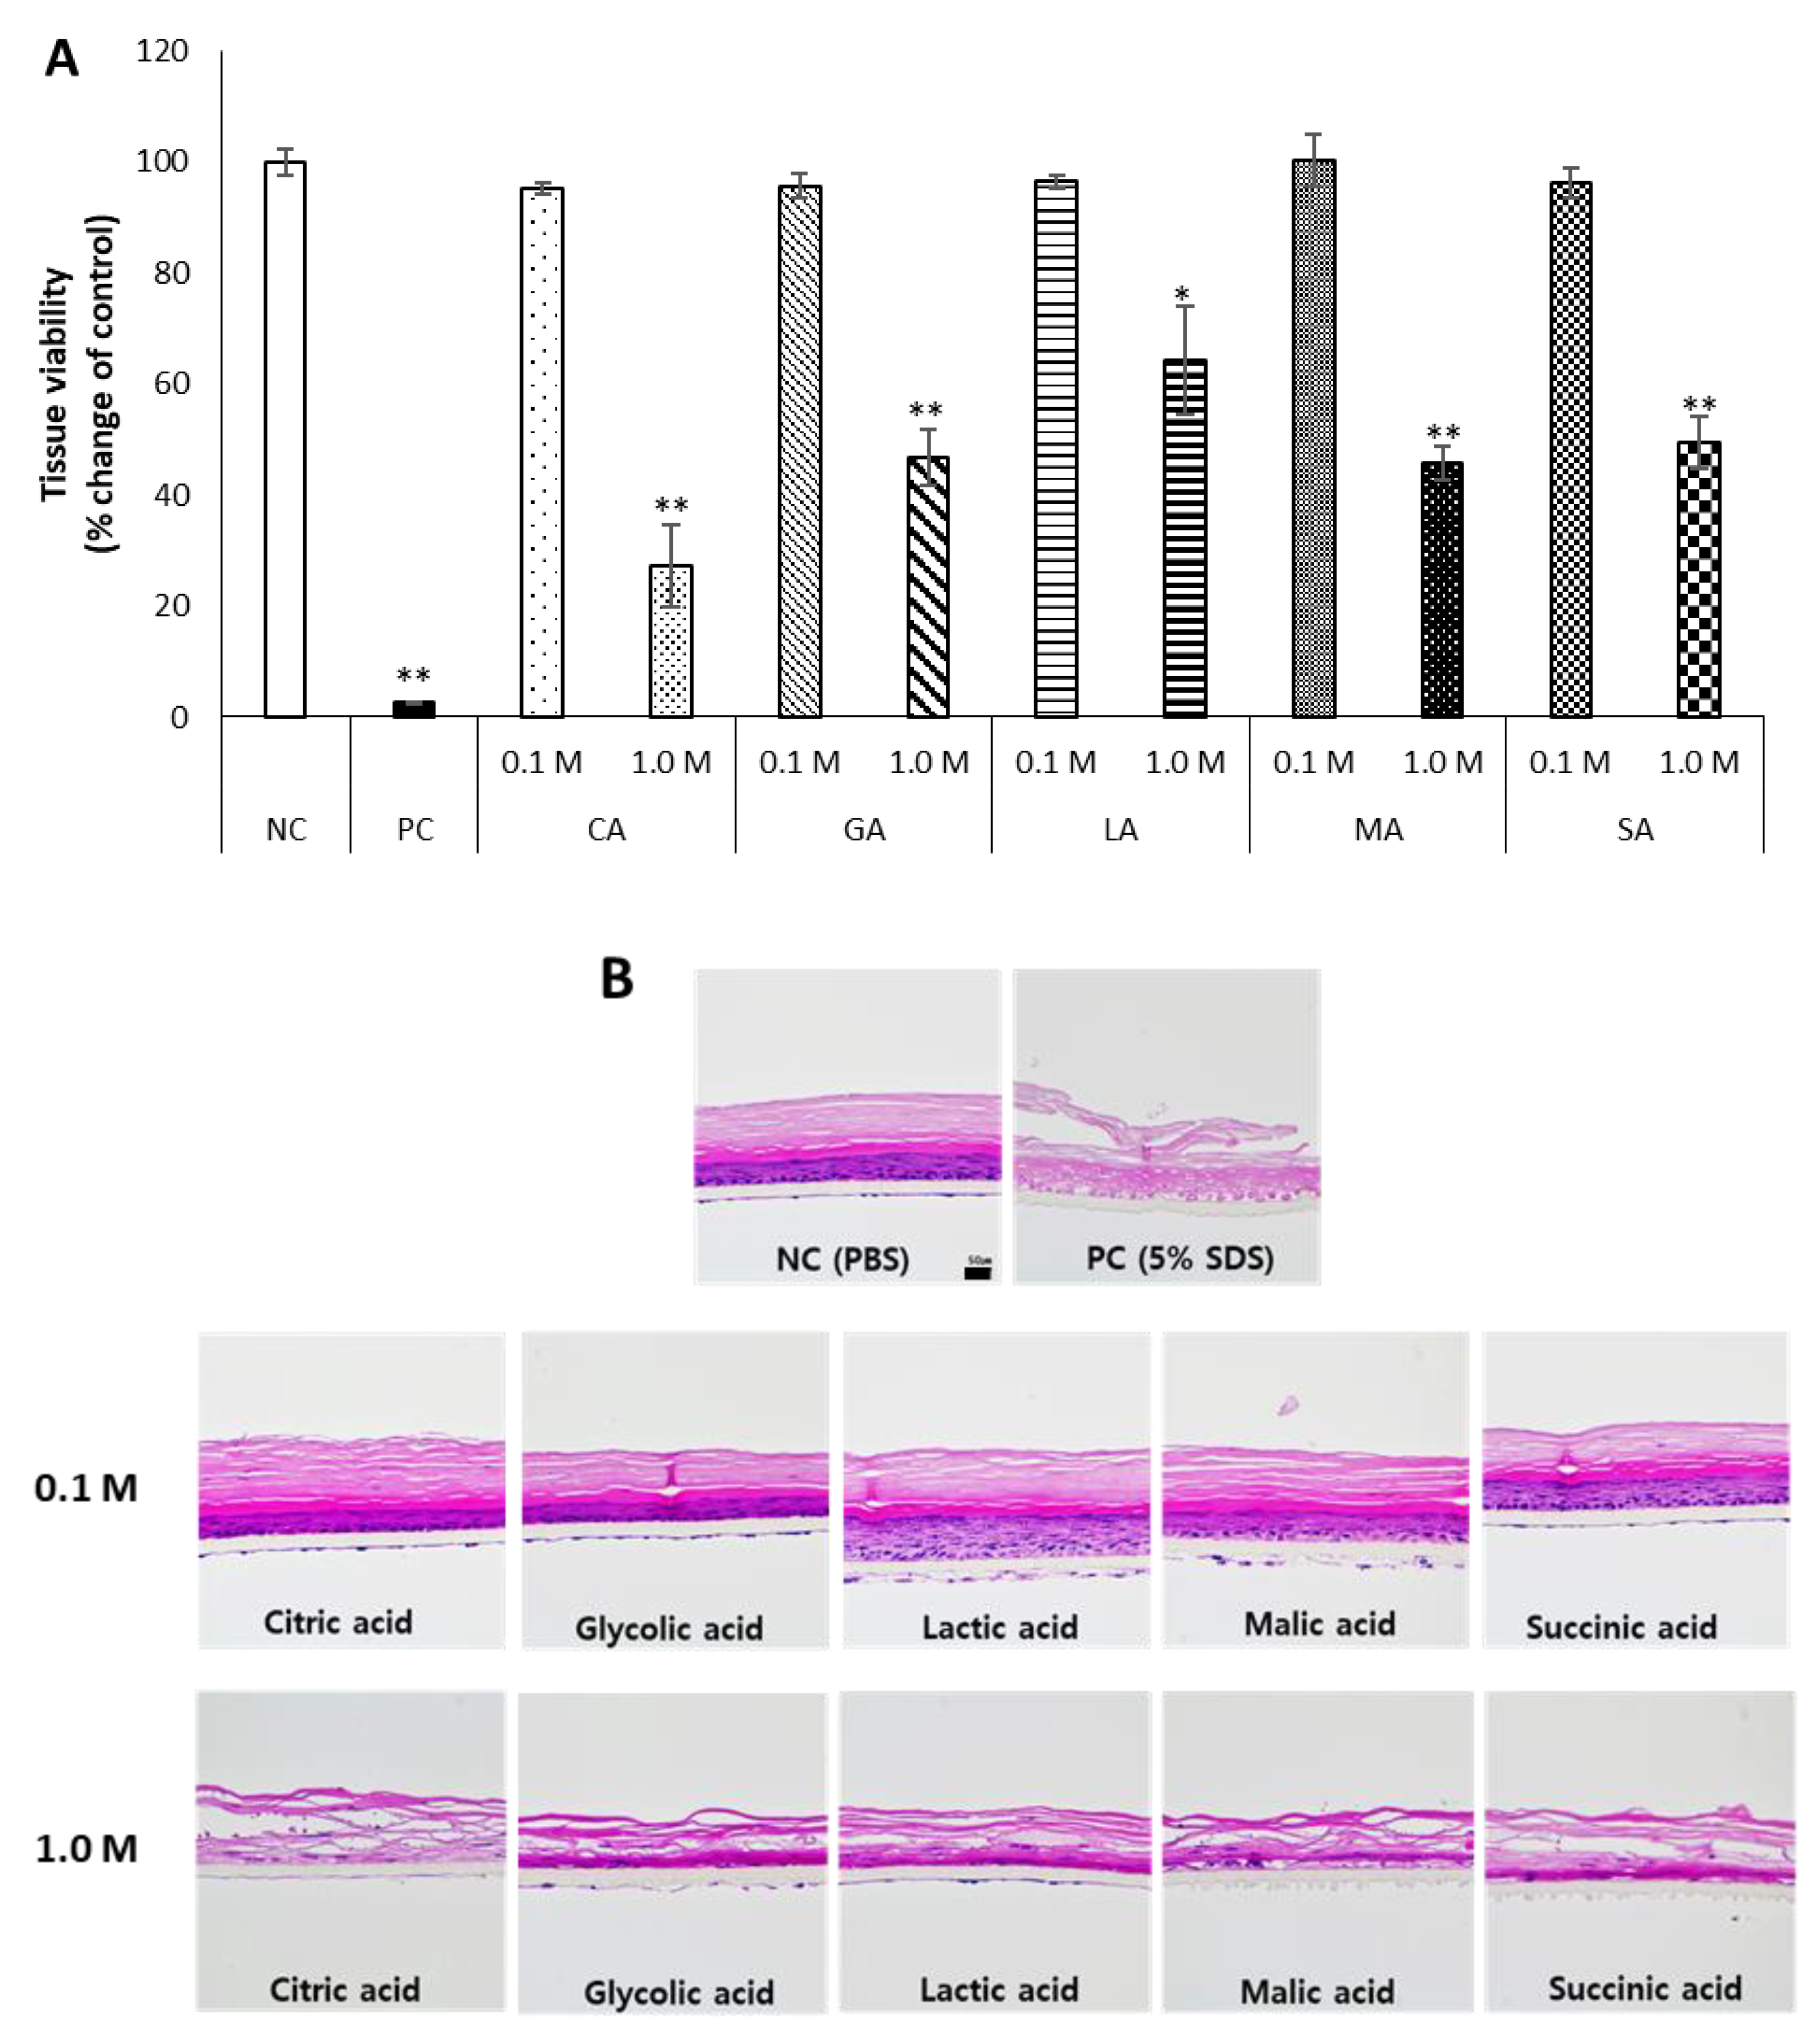
The acid components of McIlvaine buffer are citric acid and phosphoric acid. To examine whether the anionic part may affect the skin irritation of acidic substances, various organic acids commonly used in the cleaners [37] were tested at low (0.1 M) and high concentrations (1.0 M). This concentration range is close to the maximum concentrations of acids used in cleaners [38]. The organic acids selected were citric acid, glycolic acid, lactic acid, malic acid, and succinic acid. Their pH range was 1.89–2.60 at 0.1 M and 1.13–1.82 at 1 M (Table 1). When acids were tested for skin irritation using KeraSkin™, there was no significant decrease in cell viability at 0.1 M. However, at 1 M, it was confirmed that the organic acids significantly reduced the viability to below 50%, except for lactic acid (Figure 2A).
KeraSkin™ tissues remaining after the MTT assay were processed and stained with H&E. When treated with low concentrations of organic acids, the stratified structures of the stratum corneum, stratum granulosum, stratum spinosum, and stratum basale were relatively well preserved, similarly to the negative control. However, when high concentrations of organic acids were treated, the stratified structure of the epidermis was mostly destroyed, which was more severe than the pattern shown in the tissue viability. Interestingly, compared to other skin layers, the stratum corneum maintained its shape relatively well (Figure 2B).
3.3. Evaluation of Skin Irritation of Various Inorganic Acids
In order to determine the effect of inorganic acids, inorganic acids composed of a single component at low (0.1 M) and high concentrations (1.0 M) were evaluated for skin irritation (Figure 3).
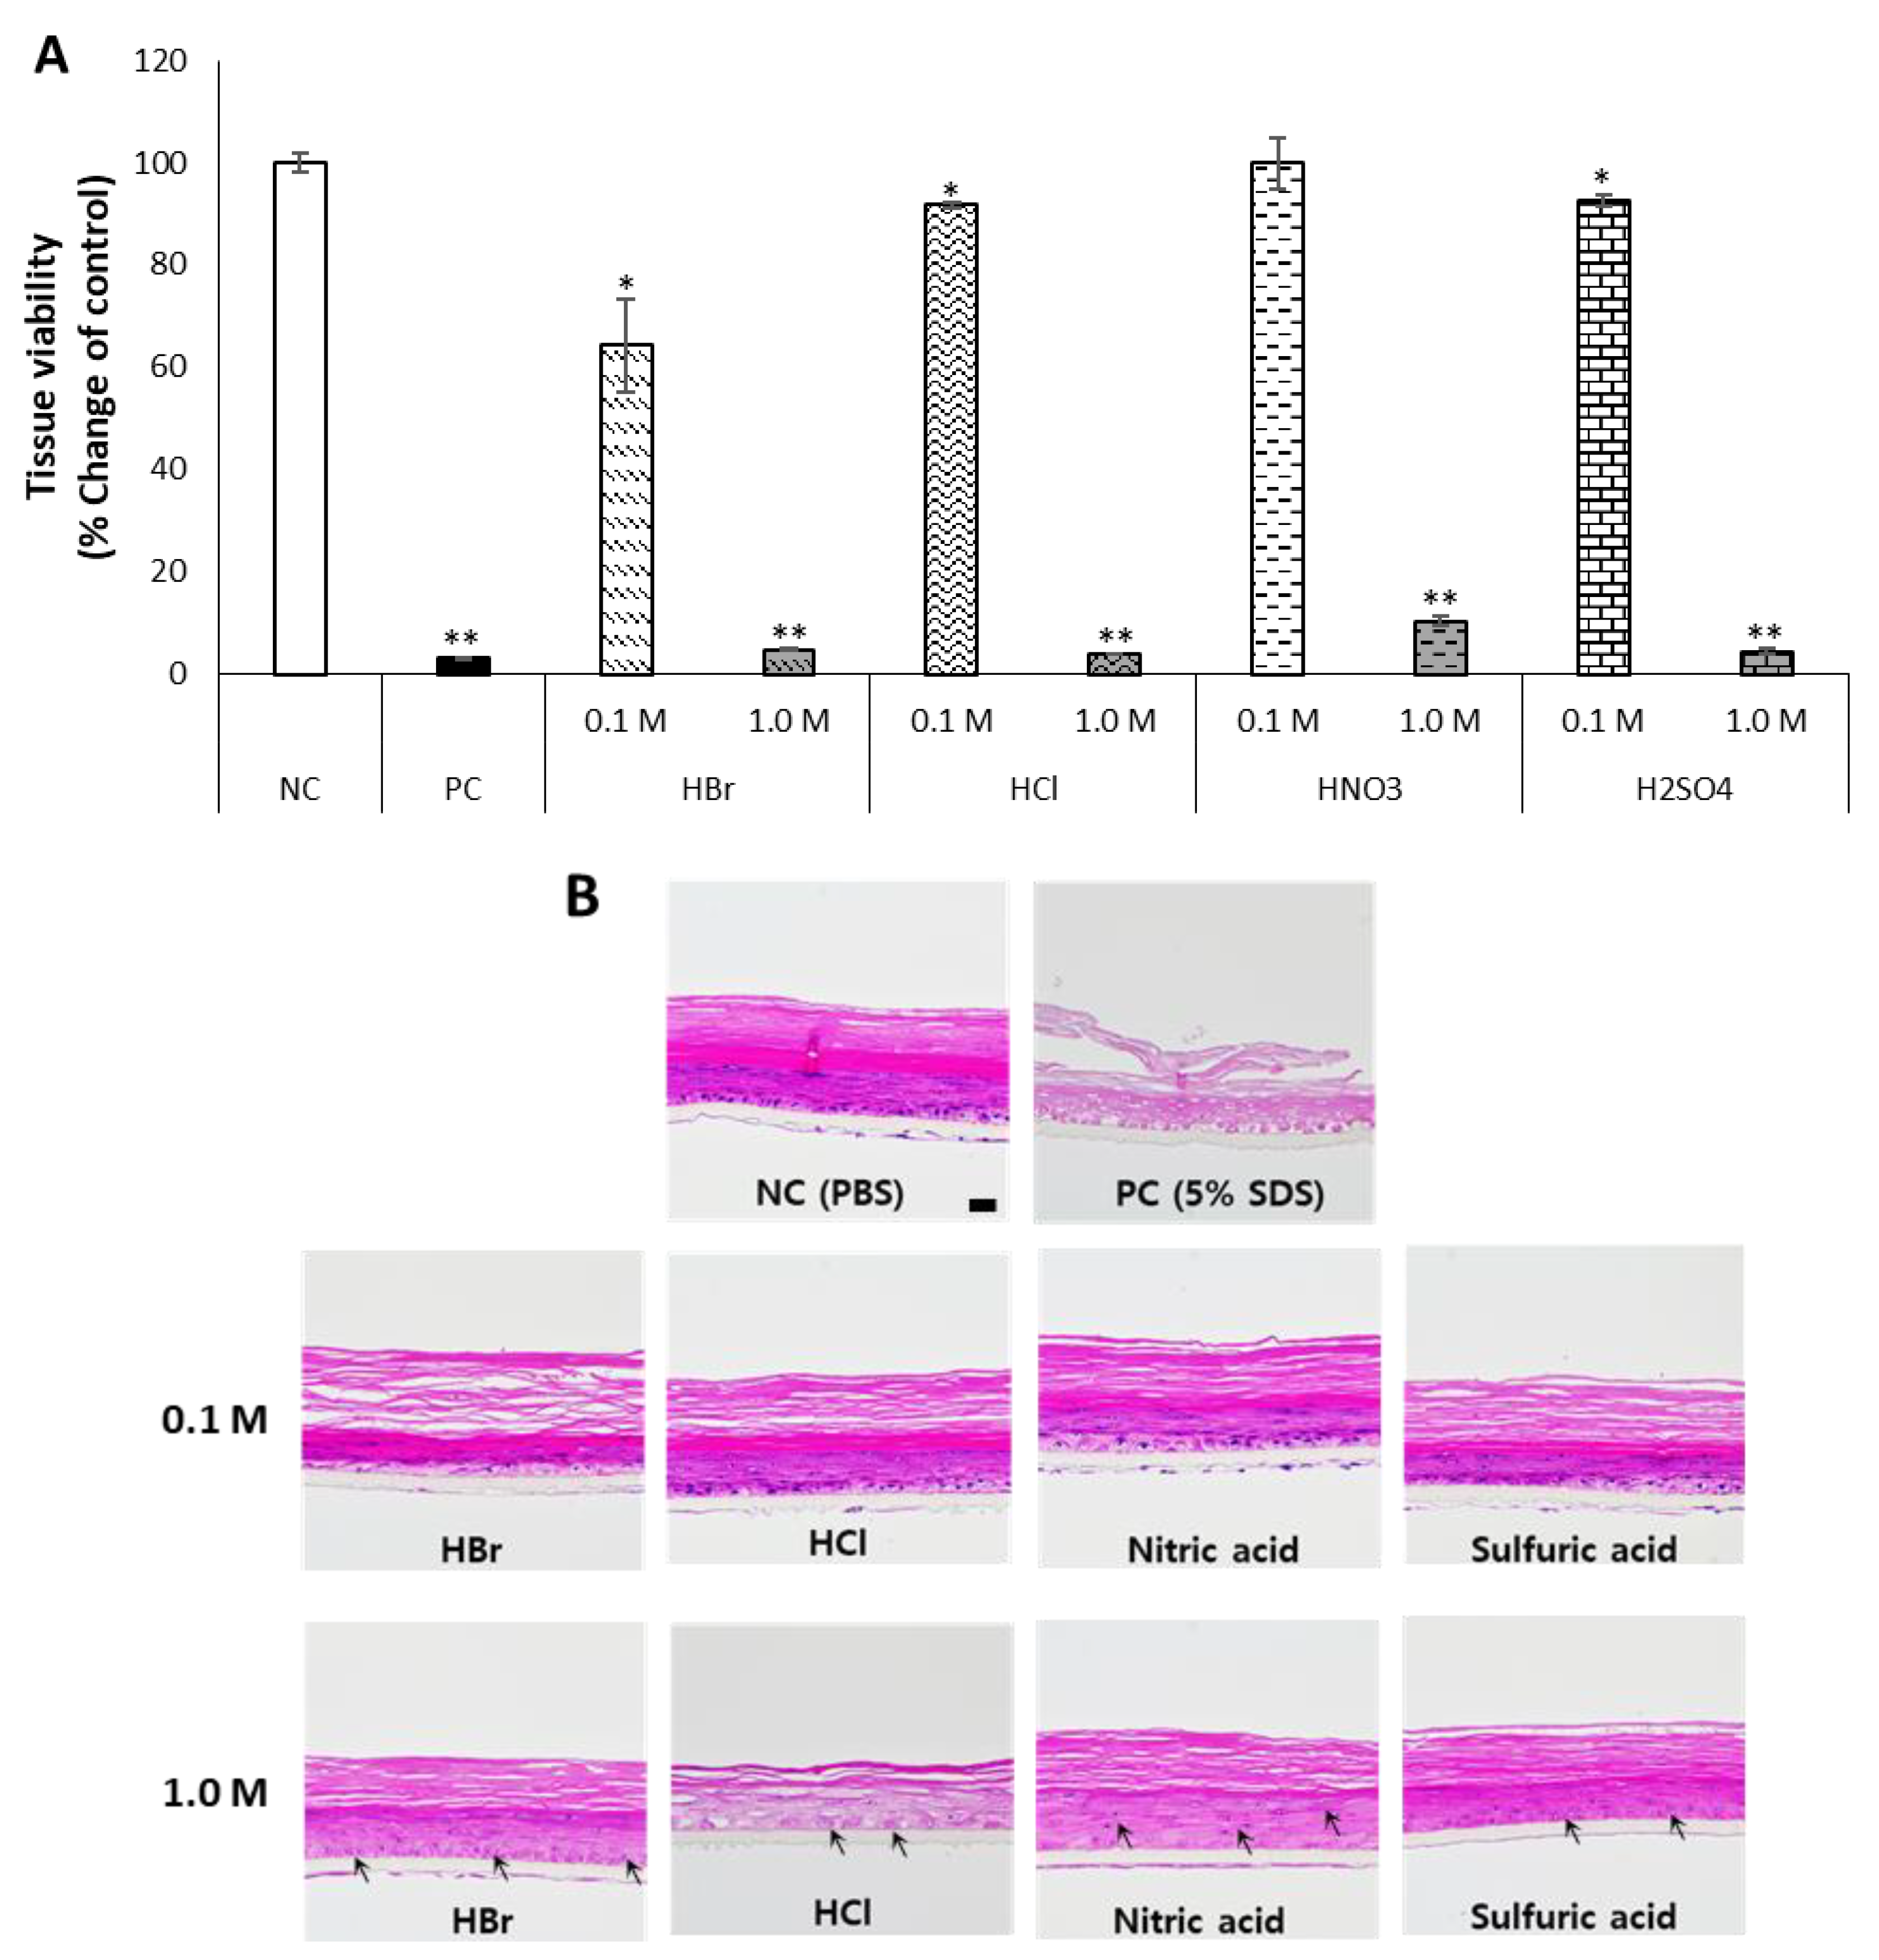
The inorganic acids selected were hydrogen chloride (HCl), hydrogen bromide (HBr), nitric acid (HNO3), and sulfuric acid (H2SO4). Their pH range was 0.47–0.69 at 0.1 M and −0.66–−0.29 at 1 M. The pH of inorganic acids was mostly lower than that of organic acids (Table 1). When inorganic acids were treated at 0.1 M, while the cell viability was maintained above the 50% cutoff, the skin tissue showed more damaged patterns compared to those treated with the organic acids. At 1 M, the irritation was pronounced, and all the inorganic acids tested were classified as skin irritants with respect to cell viability (Figure 3A). Additionally, in the histological analysis, the thickness of the skin layers except for the stratum corneum was slightly thinned at 0.1 M. The tissue treated with 1 M of inorganic acids showed vacuolization and pyknosis from necrosis in most of the skin layers. The cell layers, especially stratum granulosum, stratum spinosum, and stratum basale, were much thinned, and it was almost impossible to distinguish each cell layer. Interestingly, the thickness and shape of the stratum corneum were relatively well preserved (Figure 3B).
3.4. Evaluation of Skin Irritation of Various Organic and Inorganic Alkalis
In order to compare the effects of alkaline pH with acids, organic and inorganic alkalis used in cleaning agents were investigated. Two of the most widely used organic and inorganic alkaline substances were selected and their toxicity was evaluated, and the materials used in the experiment are shown in Table 1.
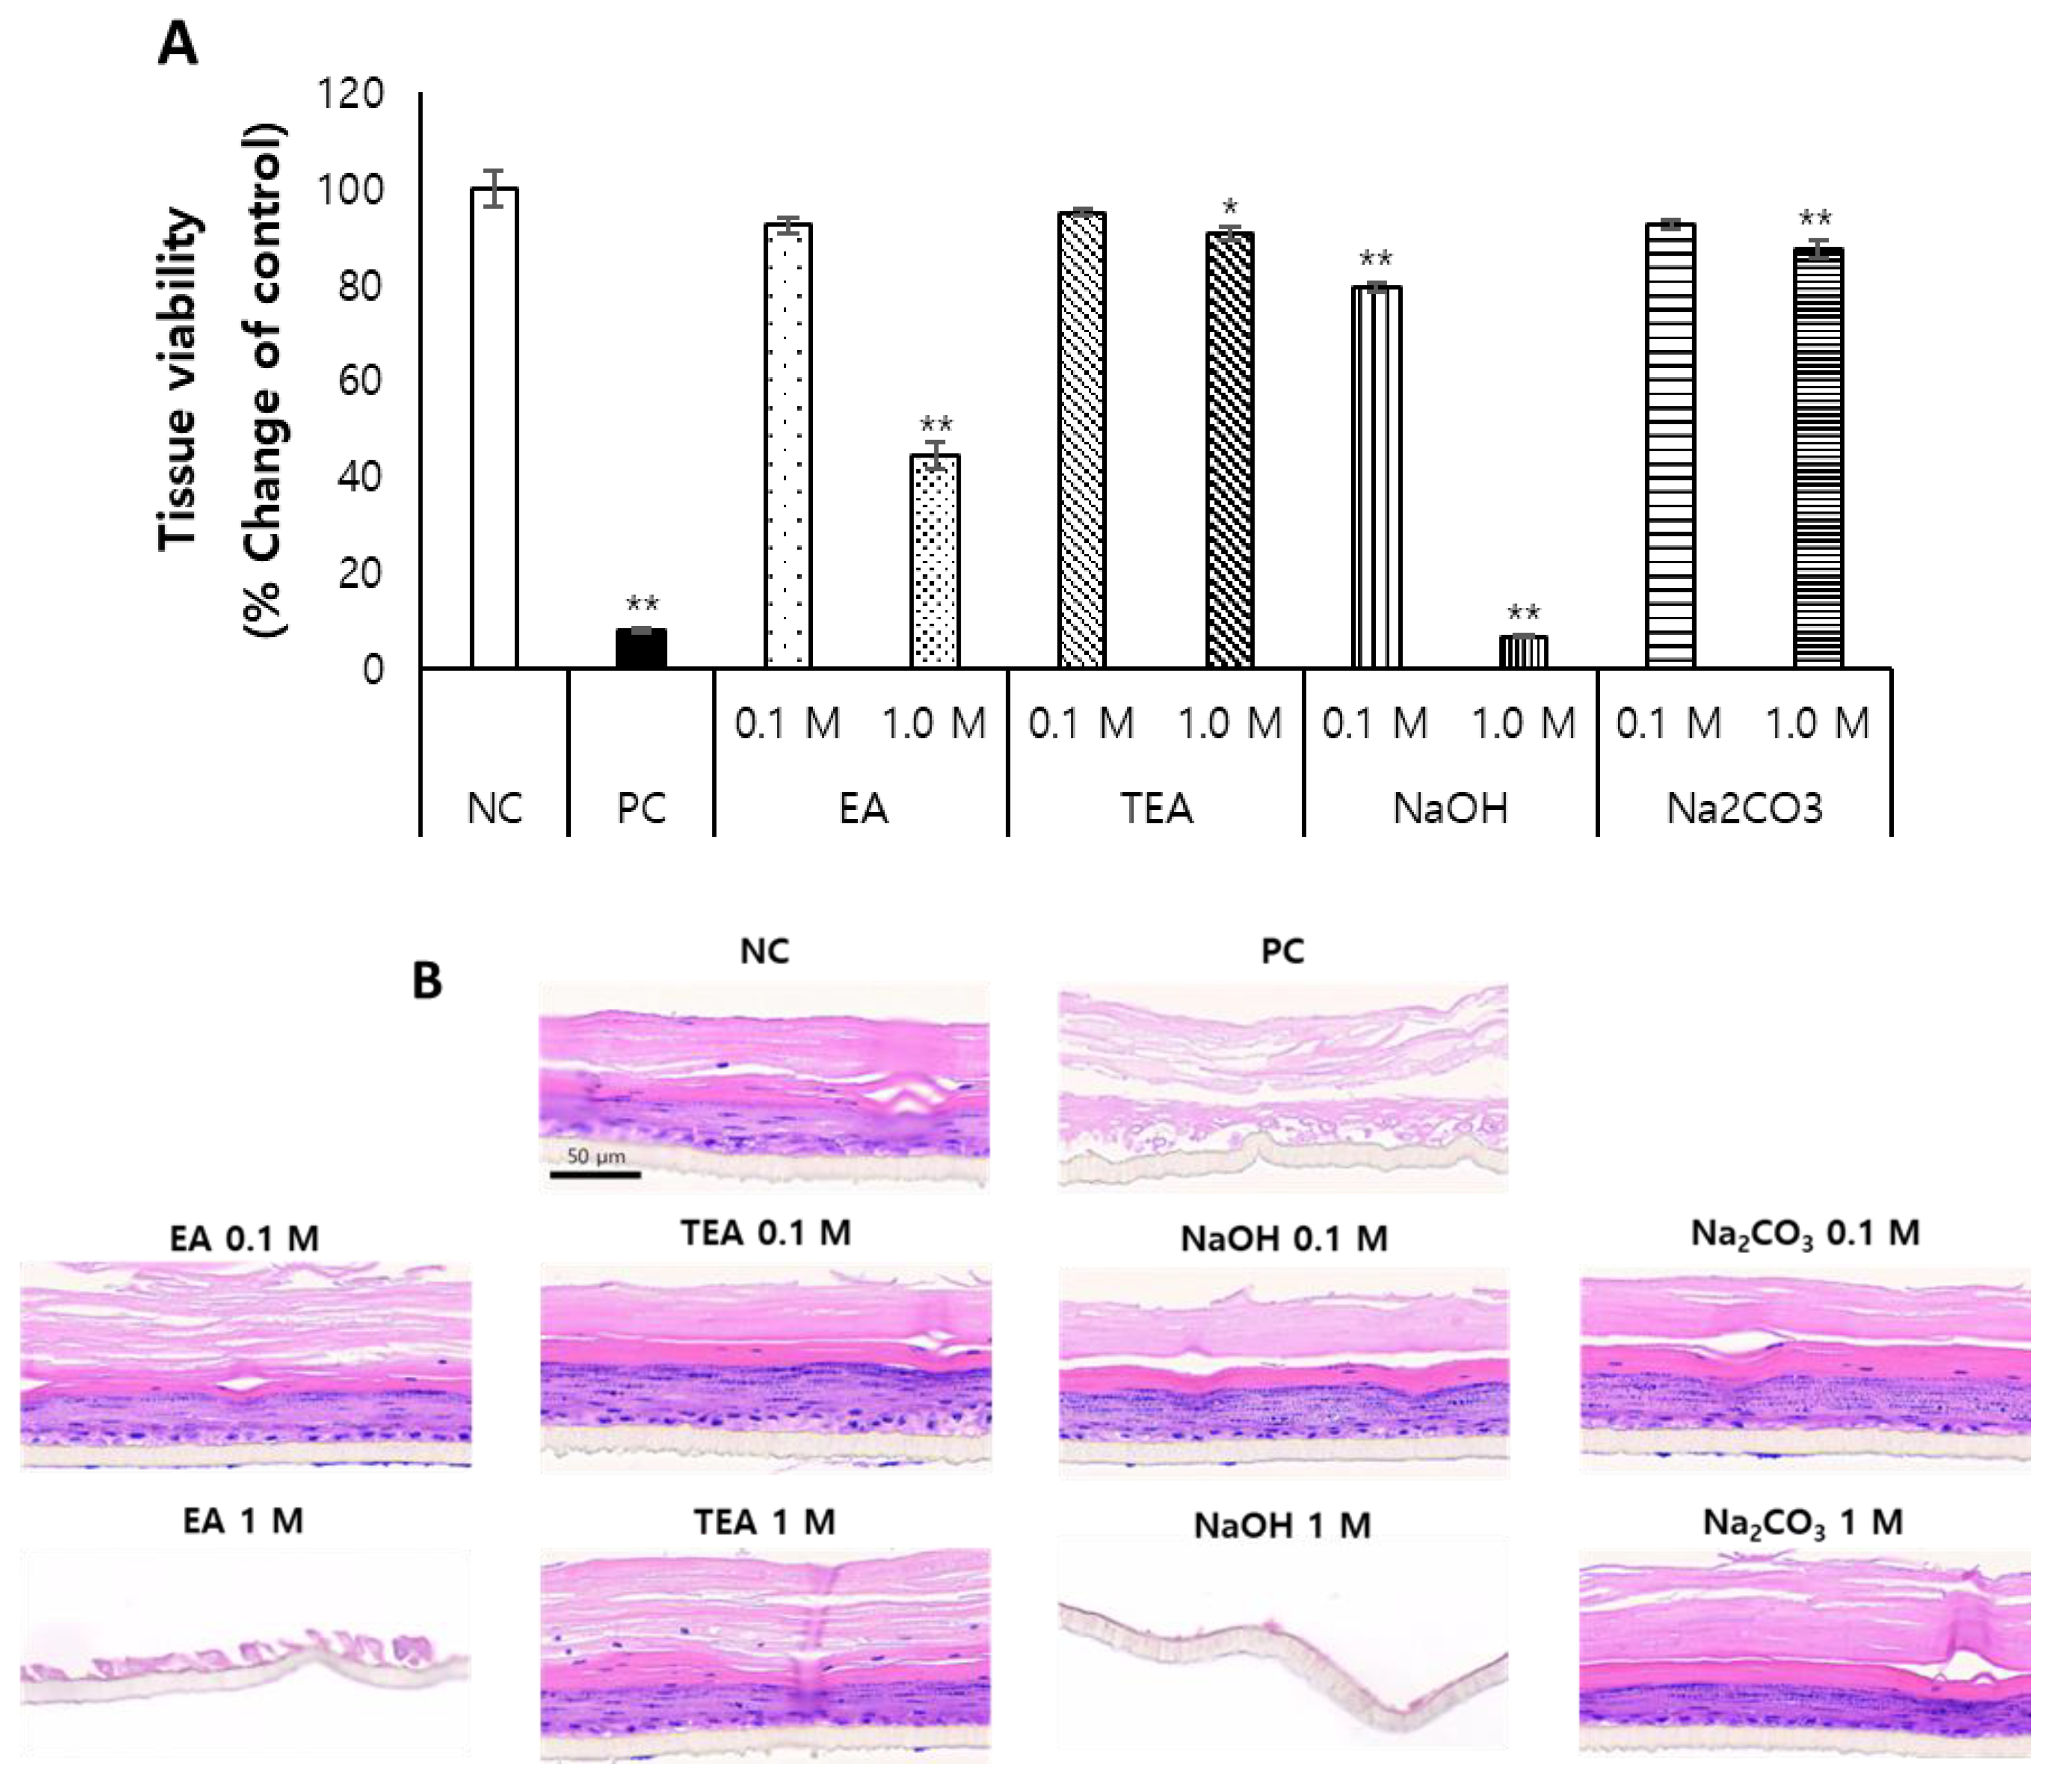
When the alkaline solutions were evaluated for skin irritation with KeraSkinTM, it was revealed that both the pH (>12) and concentration (>0.1 M) are key to the irritancy of alkaline substances, as demonstrated by the cases of ethanolamine (EA) and sodium hydroxide (NaOH). As shown in Figure 4A, EA was not an irritant at 0.1 M (pH 11.4), but at 1 M (pH 12.0), it was a skin irritant. In the case of NaOH, it was not irritant at 0.1 M even though the pH was 13.07. NaOH showed skin irritancy only at 1.0 M (pH 13.68).
KeraSkin™ tissues remaining after the MTT assay were processed and stained with H&E (Figure 4B) which supports the cell viability results.
3.5. Effects of Acid and Alkali Substances on the Lipid Composition of KeraSkinTM
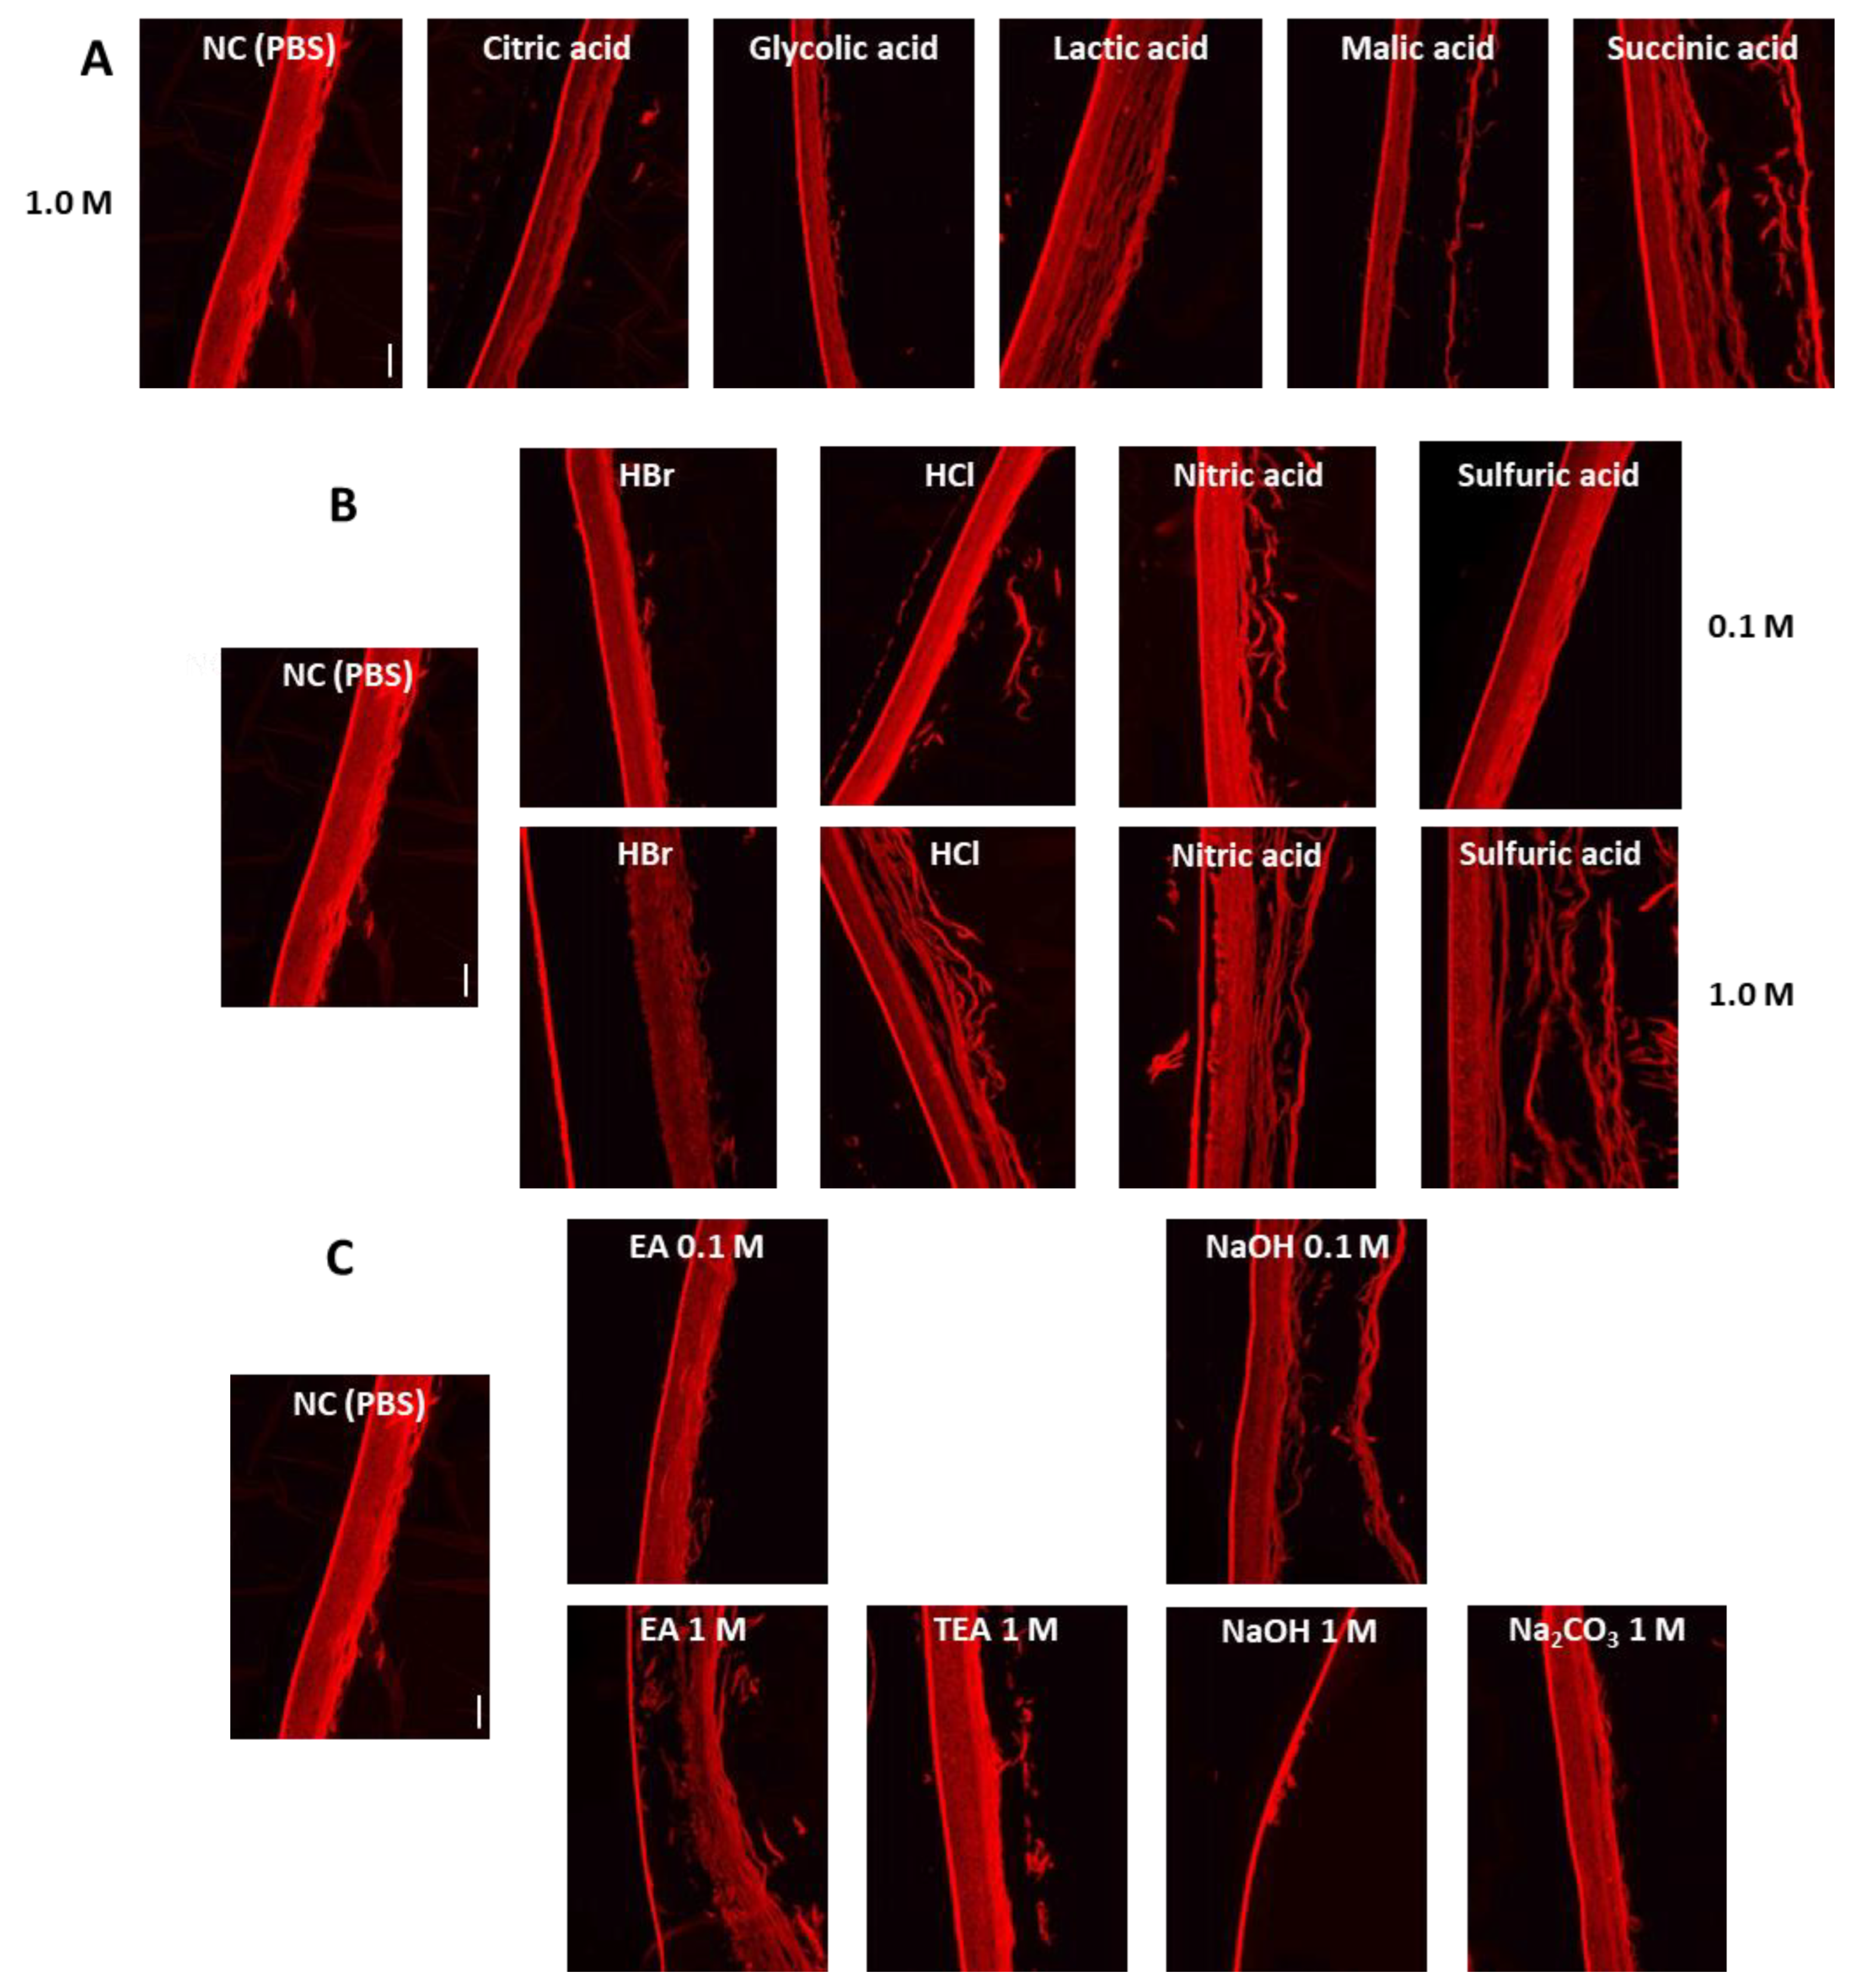
To investigate the effects of acid and alkali substances on the lipid composition of KeraSkinTM, treated tissues were stained with a lipid-specific fluorescent dye, Nile Red. As shown in Figure 5, organic acids at irritant concentrations depleted the epidermal lipids, as shown by the paler Nile Red staining, but the overall lipid structure was preserved relatively intact. However, inorganic acids at irritant concentrations not only depleted epidermal lipids but destroyed the overall lipid structures. In the case of alkali, the tissues were more severely damaged than those treated with acids with badly destroyed lipid structures even at non-irritant concentrations.
4. Discussion
Here we investigated whether acidic pH plays a direct role in determining the skin irritation of acidic agents. Our results demonstrated that acidic pH alone cannot be the sole factor to induce skin irritation, but the concentrations and types of anions are also important in determining the skin irritancy of acids.
Here we could observe that the tissues treated with acids had a well-preserved stratum corneum (SC), although the underlying epidermal layers were damaged after the treatment with high concentrations of acids. This feature is completely different from the cases of other types of skin irritants such as surfactants or alkaline agents, wherein the SC is the primary target of the skin epidermis. Ananthapadmanabhan et al. also showed that acidic pH 4.0 induced the shrinking of SC but in a well-organized fashion [10]. The SC is a barrier that prevents the entry of environmental pollutants and pathogens into the body. Furthermore, it prevents excessive water loss from deeper skin layers into the environment [39]. Therefore, the loss of SC integrity is considered to be a critical and primary step for the manifestation of skin irritancy [40]. The formation of the SC requires pH-dependent enzymes such as acid hydrolase, β-glucocerebrosidase, acid sphingomyelinase, acid lipases, phosphatases, and phospholipases [6]. These enzymes need a milieu of acidic pH to properly function. Indeed, the SC is maintained at a slightly acidic pH ranging from 5.4–5.9 supporting the suggestion that the SC may be more resistant to acidic substances.
It was reported that alkaline pH increases SC swelling and impairs the fluidity of SC lipids [41]. We could also observe that the tissues treated with alkali agents showed badly damaged SC lipids, the extent of which was more severe than those treated with acids, supporting that high alkaline pH can be more detrimental to the organization of SC lipids as well as SC protein structure. In addition, it is generally accepted that skin irritation by surfactants is caused by their penetration into living epidermis through the SC and the subsequent disruption of epidermal cells [42]. For this reason, SC is seriously damaged by surfactants as an early event of skin irritation, as can be seen with the images of tissues treated with the positive control, SDS. Conversely, acidic cleaners result in more minimal disruption of the skin’s barrier [43].
In this study, the skin irritation was remarkable only at high concentrations (>0.1 M) of organic and inorganic acids. When high concentrations of organic acids were treated on skin tissues, the stratified structure of the epidermis was severely damaged. Considering that the SC was relatively intact, we consider that acids permeated through the SC without damaging it, but affected the inner layer of viable keratinocyte layers. Indeed, fatty acids are known to enhance transdermal delivery by perturbing the SC lipid structure [44], which may explain our results.
A physicochemical approach to predict the skin irritancy of a substance was tried based on the determination of the pH of the acidic and alkaline substances [45]. Worth and Balls studied prediction models based on pH values to predict the potential of chemicals to cause skin corrosion and irritation [46]. The prediction models have a clear mechanistic interpretation: Chemicals that form acidic or basic solutions are likely to be corrosive or irritating [45]. This supports the need to consider the acidic and basic properties of chemicals during the assessment of skin irritancy [47]. However, these models used highly concentrated substances (over 10 M) for the construction of the base data and a number of chemicals with intermediate pH values are also determined to be corrosives or skin irritants [45], which indicates the existence of mechanisms other than pH. Further supporting the importance of these types of acids, ECHA database records based on in vivo data suggest that many of acids were indeed not irritating or mildly irritating, which is in line with our data.
5. Conclusions
Collectively, we demonstrated that the skin irritancy of acidic substances is not simply determined by acidity only, but by a number of other factors such as the type of anions, concentration, and duration of skin exposure. We believe that further studies are necessary to fully characterize the factors determining the skin irritation of acidic substances to develop safer cleaners.
Author Contributions
Conceptualization, J.-h.H. and K.-M.L.; methodology, J.-h.H. H.G.L. and D.C.; formal analysis, J.-h.H. and S.L., and H.G.L.; data curation, J.-h.H., S.L.; writing—original draft preparation, J.-h.H.; writing—review and editing, K.-M.L. and D.C.; supervision, K.-M.L. and D.C.; project administration, K.-M.L. and D.C.; funding acquisition, K.-M.L. and D.C. All authors have read and agreed to the published version of the manuscript.
Funding
This work was funded by the Ministry of Food and Drug Safety in 2021 (21162MFDS015-2) and the Korea Basic Science Institute (National Research Facilities and Equipment Center) grant funded by the Ministry of Education (2021R1A6C101A442).
Data Availability Statement
The data presented in this study are available on request from the corresponding author.
Conflicts of Interest
The authors declare no conflict of interest.
References
- Zumelzu, E.; Cabezas, C. Observations on the influence of cleaners on material corrosion in the food industry. Mater. Charact. 1996, 37, 187–194. [Google Scholar] [CrossRef]
- Lieu, V.T.; Kalbus, G.E. Potentiometric titration of acidic and basic compounds in household cleaners. J. Chem. Educ. 1988, 65, 184. [Google Scholar]
- Robinson, M.K.; Kruszewski, F.H.; Al-Atrash, J.; Blazka, M.E.; Gingell, R.; Heitfeld, F.A.; Mallon, D.; Snyder, N.K.; Swanson, J.E.; Casterton, P.L. Comparative assessment of the acute skin irritation potential of detergent formulations using a novel human 4-h patch test method. Food Chem. Toxicol. 2005, 43, 1703–1712. [Google Scholar] [CrossRef] [PubMed]
- Scheel, J.; Heppenheimer, A.; Lehringer, E.; Kreutz, J.; Poth, A.; Ammann, H.; Reisinger, K.; Banduhn, N. Classification and labeling of industrial products with extreme pH by making use of in vitro methods for the assessment of skin and eye irritation and corrosion in a weight of evidence approach. Toxicol. Vitr. 2011, 25, 1435–1447. [Google Scholar] [CrossRef]
- Lambers, H.; Piessens, S.; Bloem, A.; Pronk, H.; Finkel, P. Natural skin surface pH is on average below 5, which is beneficial for its resident flora. Int. J. Cosmet. Sci. 2006, 28, 359–370. [Google Scholar] [CrossRef]
- Schmid-Wendtner, M.-H.; Korting, H.C. The pH of the skin surface and its impact on the barrier function. Ski. Pharmacol. Physiol. 2006, 19, 296–302. [Google Scholar] [CrossRef]
- Wohlrab, J.; Gebert, A. pH and buffer capacity of topical formulations. In pH of the Skin: Issues and Challenges, 1st ed.; Surber, C., Abels, C., Maibach, H., Eds.; Karger Publishers: Basel, Switzerland, 2018; Volume 54, pp. 123–131. [Google Scholar]
- Fluhr, J.W.; Elias, P.M. Stratum corneum pH: Formation and function of the ‘acid mantle’. Exog. Dermatol. 2002, 1, 163–175. [Google Scholar] [CrossRef]
- Ananthapadmanabhan, K.P.; Moore, D.J.; Subramanyan, K.; Misra, M.; Meyer, F. Cleansing without compromise: The impact of cleansers on the skin barrier and the technology of mild cleansing. Dermatol. Ther. 2004, 17, 16–25. [Google Scholar] [CrossRef]
- Ananthapadmanabhan, K.P.; Lips, A.; Vincent, C.; Meyer, F.; Caso, S.; Johnson, A.; Subramanyan, K.; Vethamuthu, M.; Rattinger, G.; Moore, D.J. pH-induced alterations in stratum corneum properties. Int. J. Cosmet. Sci. 2003, 25, 103–112. [Google Scholar] [CrossRef]
- Johnson, A.W.; Ananthapadmanabhan, K.; Hawkins, S.; Nole, G. Bar cleansers. In Cosmetic Dermatology: Products and Procedures, 3rd ed.; Draelos, Z.D., Ed.; Wiley: Hoboken, NJ, USA, 2022; pp. 115–134. [Google Scholar]
- UN. United Nations Globally Harmonized System of Classification and Labelling of Chemicals (GHS); UN: New York, NY, USA; Geneva, Switzerland, 2011.
- Craan, A.G.; Sanfacon, G.; Walker, R.H. The use of pH and acid/alkaline reserve for the classification and labelling of household cleaning products: Data from a poison control center. Int. J. Consum. Prod. Saf. 1997, 4, 191–213. [Google Scholar] [CrossRef]
- McIlvaine, T. A buffer solution for colorimetric comparison. J. Biol. Chem. 1921, 49, 183–186. [Google Scholar] [CrossRef]
- ECHA. ECHA Registration Dossier: Citric Acid. Available online: https://echa.europa.eu/el/registration-dossier/-/registered-dossier/15451 (accessed on 20 September 2022).
- ECHA. ECHA Registration Dossier: Glycollic Acid. Available online: https://echa.europa.eu/el/registration-dossier/-/registered-dossier/14561 (accessed on 20 September 2022).
- ECHA. ECHA Registration Dossier: Lactic Acid. Available online: https://echa.europa.eu/el/registration-dossier/-/registered-dossier/5165 (accessed on 20 September 2022).
- ECHA. ECHA Registration Dossier: Malic Acid. Available online: https://echa.europa.eu/el/registration-dossier/-/registered-dossier/11511 (accessed on 20 September 2022).
- ECHA. ECHA Registration Dossier: Succinic Acid. Available online: https://echa.europa.eu/el/registration-dossier/-/registered-dossier/15265 (accessed on 20 September 2022).
- ECHA. ECHA Registration Dossier: Hydrogen Bromide. Available online: https://echa.europa.eu/el/registration-dossier/-/registered-dossier/14814 (accessed on 20 September 2022).
- ECHA. ECHA Registration Dossier: Hydrogen Chloride. Available online: https://echa.europa.eu/el/registration-dossier/-/registered-dossier/15859 (accessed on 20 September 2022).
- ECHA. ECHA Registration Dossier: Nitric Acid. Available online: https://echa.europa.eu/el/registration-dossier/-/registered-dossier/15881 (accessed on 20 September 2022).
- ECHA. ECHA Registration Dossier: Sulphuric Acid. Available online: https://echa.europa.eu/el/registration-dossier/-/registered-dossier/16122 (accessed on 20 September 2022).
- ECHA. ECHA Registration Dossier: 2-Aminoethanol. Available online: https://echa.europa.eu/el/registration-dossier/-/registered-dossier/15808 (accessed on 20 September 2022).
- ECHA. ECHA Registration Dossier: 2,2′,2″-Nitrilotriethanol. Available online: https://echa.europa.eu/el/registration-dossier/-/registered-dossier/15134 (accessed on 20 September 2022).
- ECHA. ECHA Registration Dossier: Sodium Hydroxide. Available online: https://echa.europa.eu/el/registration-dossier/-/registered-dossier/15566 (accessed on 20 September 2022).
- ECHA. ECHA Registration Dossier: Sodium Carbonate. Available online: https://echa.europa.eu/el/registration-dossier/-/registered-dossier/15432 (accessed on 20 September 2022).
- Jung, K.M.; Lee, S.H.; Jang, W.H.; Jung, H.S.; Heo, Y.; Park, Y.H.; Bae, S.; Lim, K.M.; Seok, S.H. KeraSkin™-VM: A novel reconstructed human epidermis model for skin irritation tests. Toxicol. Vitr. 2014, 28, 742–750. [Google Scholar] [CrossRef] [PubMed]
- OECD. Test No. 439: In Vitro Skin Irritation: Reconstructed Human Epidermis Test Method; OECD: Paris, France, 2021. [Google Scholar]
- Lee, N.; Jang, D.Y.; Lee, D.H.; Jeong, H.; Nam, K.T.; Choi, D.W.; Lim, K.M. Local Toxicity of Biocides after Direct and Aerosol Exposure on the Human Skin Epidermis and Airway Tissue Models. Toxics 2021, 9, 29. [Google Scholar] [CrossRef] [PubMed]
- Hwang, J.H.; Jeong, H.; Jung, Y.O.; Nam, K.T.; Lim, K.M. Skin irritation and inhalation toxicity of biocides evaluated with reconstructed human epidermis and airway models. Food Chem. Toxicol. 2021, 150, 112064. [Google Scholar] [CrossRef] [PubMed]
- Hwang, J.H.; Jeong, H.; Hur, S.; Nam, K.T.; Lim, K.M. Employment of cytology for in vitro skin irritation test using a reconstructed human epidermis model, Keraskin. Toxicol. Vitr. 2020, 69, 104962. [Google Scholar] [CrossRef]
- Jung, Y.O.; Jeong, H.; Cho, Y.; Lee, E.O.; Jang, H.W.; Kim, J.; Nam, K.; Lim, K.M. Lysates of a Probiotic, Lactobacillus rhamnosus, Can Improve Skin Barrier Function in a Reconstructed Human Epidermis Model. Int. J. Mol. Sci. 2019, 20, 4289. [Google Scholar] [CrossRef]
- Lee, J.K.; Lee, H.E.; Yang, G.; Kim, K.B.; Kwack, S.J.; Lee, J.Y. Para-phenylenediamine, an oxidative hair dye ingredient, increases thymic stromal lymphopoietin and proinflammatory cytokines causing acute dermatitis. Toxicol. Res. 2020, 36, 329–336. [Google Scholar] [CrossRef]
- Lee, K.J.; Park, K.H.; Hahn, J.H. Alleviation of Ultraviolet-B Radiation-Induced Photoaging by a TNFR Antagonistic Peptide, TNFR2-SKE. Mol. Cells 2019, 42, 151–160. [Google Scholar]
- Fowler, S.D.; Greenspan, P. Application of Nile red, a fluorescent hydrophobic probe, for the detection of neutral lipid deposits in tissue sections: Comparison with oil red O. J. Histochem. Cytochem. 1985, 33, 833–836. [Google Scholar] [CrossRef]
- Schmidt, A.M.; Azambuja, D.S.; Martini, E.M. Semiconductive properties of titanium anodic oxide films in McIlvaine buffer solution. Corros. Sci. 2006, 48, 2901–2912. [Google Scholar] [CrossRef]
- Agency, U.S.E.P. 40 CFR 180.940. Title 40—Protection of Environment, Part 180—Tolerances and Exemptions for Pesticide Chemical Residues In Food, Sec. 180.940—Tolerance Exemptions for Active and Inert Ingredients for Use in Antimicrobial Formulations (Food-Contact Surface Sanitizing Solutions). 2004. Available online: www.law.cornell.edu/cfr/text/40/180.940 (accessed on 20 September 2022).
- Seweryn, A. Interactions between surfactants and the skin–Theory and practice. Adv. Colloid Interface Sci. 2018, 256, 242–255. [Google Scholar] [CrossRef] [PubMed]
- Danby, S.G.; Andrew, P.V.; Kay, L.J.; Pinnock, A.; Chittock, J.; Brown, K.; Williams, S.F.; Cork, M.J. Enhancement of stratum corneum lipid structure improves skin barrier function and protects against irritation in adults with dry, eczema-prone skin. Br. J. Dermatol. 2022, 186, 875–886. [Google Scholar] [CrossRef] [PubMed]
- Bouwstra, J.A.; Gooris, G.S.; van der Spek, J.A.; Lavrijsen, S.; Bras, W. The lipid and protein structure of mouse stratum corneum: A wide and small angle diffraction study. Biochim. Biophys. Acta-Lipids Lipid Metab. 1994, 1212, 183–192. [Google Scholar] [CrossRef]
- Kim, E.; Kim, S.; Nam, G.; Lee, H.; Moon, S.; Chang, I. The alkaline pH-adapted skin barrier is disrupted severely by SLS-induced irritation. Int. J. Cosmet. Sci. 2009, 31, 263–269. [Google Scholar] [CrossRef] [PubMed]
- Kuehl, B.; Fyfe, K.; Shear, N. Cutaneous cleansers. Ski. Ther. Lett. 2003, 8, 1–4. [Google Scholar]
- Pham, Q.D.; Bjorklund, S.; Engblom, J.; Topgaard, D.; Sparr, E. Chemical penetration enhancers in stratum corneum - Relation between molecular effects and barrier function. J. Control Release 2016, 232, 175–187. [Google Scholar] [CrossRef]
- Worth, A.P.; Cronin, M.T. The use of pH measurements to predict the potential of chemicals to cause acute dermal and ocular toxicity. Toxicology 2001, 169, 119–131. [Google Scholar] [CrossRef]
- Worth, A.P.; Balls, M. The importance of the prediction model in the validation of alternative tests. Altern. Lab. Anim. 2001, 29, 135–143. [Google Scholar] [CrossRef]
- OECD. Test No. 404: Acute Dermal Irritation/Corrosion; OECD: Paris, France, 2015. [Google Scholar]
Figure 1.
In this figure, 0.1 M McIlvaine buffers prepared with indicated pH ranges were treated with KeraSkin™ for (A) 30 and (B) 180 min, and cell viability was measured with an MTT assay. See Methods for detailed procedure. (C) KeraSkin™ treated with test chemicals was stained with H&E. Scale bar is 50 μm. NC; negative control (DW) with white bars, PC; positive control (5% SDS) with filled bars. McIlvaine buffers with dotted bars ** p < 0.01.

Figure 2.
Various organic acids were prepared at a low concentration (0.1 M) and a high concentration (1.0 M) and exposed to KeraSkin™ for 30 min. Then, (A) cell viability was evaluated, and (B) skin tissues were stained with H&E. Scale bar is 50 μm. NC; negative control (DW) with white bars, PC; positive control (5% SDS) with filled bars. Tested samples with patterned bars, CA; citric acid, GA; glycolic acid, LA; lactic acid, MA; malic acid, SA; succinic acid. * p < 0.05, ** p < 0.01.

Figure 3.
Inorganic acids were prepared at a low concentration (0.1 M) and a high concentration (1.0 M) in DW and exposed to KeraSkin™ for 30 min. Then, (A) cell viability was evaluated, and (B) skin tissues were stained with H&E. Scale bar is 50 μm. NC; negative control (DW) with white bars, PC; positive control (5% SDS) with filled bars. Tested samples with patterned bars, HBr; hydrogen bromide, HCl; hydrogen chloride, HNO3; nitric acid, H2SO4; sulfuric acid. Arrows show vacuolization and pyknosis. * p < 0.05, ** p < 0.01.

Figure 4.
Various organic and inorganic alkalis were prepared at a low concentration (0.1 M) and a high concentration (1.0 M) and exposed to KeraSkin™ for 30 min. Then, (A) cell viability was evaluated, and (B) skin tissues were stained with H&E. Scale bar is 50 μm. NC; negative control (DW) with white bars, PC; positive control (5% SDS) with filled bars. Tested samples with patterned bars, EA; ethanolamine, TEA; triethanolamine, NaOH; sodium hydroxide, Na2CO3; sodium carbonate. * p < 0.05, ** p < 0.01.

Figure 5.
Distribution of lipids in the treated tissues was examined by Nile Red staining. Representative fluorescent microscope image with x magnification. Scale bar is 100 μm. (A) Organic acids, (B) inorganic acids, and (C) organic and inorganic alkalis were treated.
Figure 5.
Distribution of lipids in the treated tissues was examined by Nile Red staining. Representative fluorescent microscope image with x magnification. Scale bar is 100 μm. (A) Organic acids, (B) inorganic acids, and (C) organic and inorganic alkalis were treated.


Table 1.
Information on acid and alkali agents tested.
| Chemical | IUPAC Name | CAS No. | Molecular Weight | Molecular Formula | Purity | Water Solubility b | pH (Skin Irritation a) | ECHAb | ||
|---|---|---|---|---|---|---|---|---|---|---|
| 0.1 M | 1.0 M | Skin hazard | Source | |||||||
| Organic acid | ||||||||||
| Citric acid | 2-Hydroxypropane-1,2,3-tricarboxylic acid | 77-92-9 | 192.12 | C6H8O7 | ≥97% | 540 g/L | 1.89 (NI) | 1.13 (I) | Mildly irritating (0.5 g powder) | [15] |
| Glycolic acid | 2-Hydroxyacetic acid | 79-14-1 | 76.05 | C2H4O3 | 99% | > 300 g/L | 2.41 (NI) | 1.61 (I) | Skin Corr. 1B (99% liquid) | [16] |
| Lactic acid | 2-Hydroxypropanoic acid | 50-21-5 | 90.08 | C3H6O3 | 88–92% | 861 g/L | 2.43 (NI) | 1.60 (NI) | Mildly irritating (88% aqueous solution) | [17] |
| Malic acid | 2-Hydroxybutanedioic acid | 6915-15-7 | 134.09 | C4H6O5 | ≥99% | 647 g/L | 2.25 (NI) | 1.43 (I) | Mildly irritating (0.5 g wetted with paraffin oil) | [18] |
| Succinic acid | Butanedioic acid | 110-15-6 | 118.09 | C4H6O4 | ≥99% | 83 g/L | 2.60 (NI) | 1.82 (I) | Not irritating (0.5 g moistened with water) | [19] |
| Inorganic acid | ||||||||||
| Hydrogen bromide | Bromane | 10035-10-6 | 80.91 | HBr | 30–32% in acetic acid | 665 g/L | 0.55 (NI) | −0.66 (I) | Skin Corr. 1A | [20] |
| Hydrogen chloride | Chlorane | 7647-01-0 | 36.46 | HCl | 37% aq. solution | 500 g/L | 0.69 (NI) | −0.29 (I) | Skin Corr. 1A (25~30%) | [21] |
| Nitric acid | Nitric acid | 7697-37-2 | 63.01 | HNO3 | 70% aq. solution | >500 g/L | 0.58 (NI) | −0.39 (I) | Skin Corr. 1A (≥28%) | [22] |
| Sulfuric acid | Sulfuric acid | 7664-93-9 | 98.08 | H2SO4 | 95–98% | 1000 g/L | 0.47 (NI) | −0.55 (I) | Skin Corr. 1A (Predicted) | [23] |
| Organic alkali | ||||||||||
| Ethanolamine | 2-Aminoethanol | 141-43-5 | 61.08 | C2H7NO | ≥99% | 1000 g/L | 11.40 (NI) | 12.00 (I) | Skin Corr. 1B (Neat liquid, 20% solution) | [24] |
| Triethanolamine | 2-[Bis(2-hydroxyethyl)amino]ethanol | 102-71-6 | 149.19 | C6H15NO3 | ≥99% | 1000 g/L | 10.36 (NI) | 10.90 (NI) | Not irritating (0.5 mL neat) | [25] |
| Inorganic alkali | ||||||||||
| Sodium hydroxide | Sodium hydroxide | 1310-73-2 | 39.997 | HNaO | ≥97% | 1000 g/L | 13.07 (NI) | 13.68 (I) | Skin Corr. 1A (>2%) | [26] |
| Sodium carbonate | Disodium carbonate | 497-19-8 | 105.988 | Na2CO3 | ≥99.5% | 212.5 g/L | 11.49 (NI) | 11.60 (NI) | Not irritating (0.5 g) | [27] |
a NI; Non-irritant, I; irritant. b ECHA database accessed through eChemportal on 19 September 2022 [15].
Publisher’s Note: MDPI stays neutral with regard to jurisdictional claims in published maps and institutional affiliations. |
© 2022 by the authors. Licensee MDPI, Basel, Switzerland. This article is an open access article distributed under the terms and conditions of the Creative Commons Attribution (CC BY) license (https://creativecommons.org/licenses/by/4.0/).
Share and Cite
MDPI and ACS Style
Hwang, J.-h.; Lee, S.; Lee, H.G.; Choi, D.; Lim, K.-M. Evaluation of Skin Irritation of Acids Commonly Used in Cleaners in 3D-Reconstructed Human Epidermis Model, KeraSkinTM. Toxics 2022, 10, 558. https://doi.org/10.3390/toxics10100558
AMA Style
Hwang J-h, Lee S, Lee HG, Choi D, Lim K-M. Evaluation of Skin Irritation of Acids Commonly Used in Cleaners in 3D-Reconstructed Human Epidermis Model, KeraSkinTM. Toxics. 2022; 10(10):558. https://doi.org/10.3390/toxics10100558
Chicago/Turabian StyleHwang, Jee-hyun, Seungmi Lee, Ho Geon Lee, Dalwoong Choi, and Kyung-Min Lim. 2022. "Evaluation of Skin Irritation of Acids Commonly Used in Cleaners in 3D-Reconstructed Human Epidermis Model, KeraSkinTM" Toxics 10, no. 10: 558. https://doi.org/10.3390/toxics10100558
Note that from the first issue of 2016, this journal uses article numbers instead of page numbers. See further details here.