Article

Sputtering Deposition of TiO2 Thin Film Coatings for Fiber Optic Sensors

1
Department of Physics, NOVA School of Science and Technology, NOVA University Lisbon, 2829-516 Almada, Portugal
2
Department of Engineering Physics, Faculty of Engineering, University of Porto, R. Dr. Roberto Frias, s/n, 4200-465 Porto, Portugal
3
Centre for Applied Photonics, Institute for Systems and Computer Engineering, Technology and Science (INESC TEC), Rua do Campo Alegre, 687, 4150-179 Porto, Portugal
4
i3N/CENIMAT, Department of Materials Science, NOVA School of Science and Technology and CEMOP/UNINOVA, NOVA University Lisbon, Campus de Caparica, 2829-516 Caparica, Portugal
5
Laboratory of Instrumentation, Biomedical Engineering and Radiation Physics (LIBPhys-UNL), Department of Physics, NOVA School of Science and Technology, NOVA University Lisbon, 2829-516 Caparica, Portugal
*
Author to whom correspondence should be addressed.
Photonics 2022, 9(5), 342; https://doi.org/10.3390/photonics9050342
Submission received: 25 February 2022 / Revised: 4 May 2022 / Accepted: 11 May 2022 / Published: 13 May 2022
(This article belongs to the Special Issue Optical Sensing)

Abstract

:
Thin films of titanium dioxide (TiO2) and titanium (Ti) were deposited onto glass and optical fiber supports through DC magnetron sputtering, and their transmission was characterized with regard to their use in optical fiber-based sensors. Deposition parameters such as oxygen partial pressure, working pressure, and sputtering power were optimized to attain films with a high reflectance. The films deposited on glass supports were characterized by UV-Vis spectroscopy, X-ray diffraction (XRD), and scanning electron microscopy (SEM). Regarding the deposition parameters, all three parameters were tested simultaneously, changing the working pressure, the sputtering power, and the oxygen percentage. It was possible to conclude that a lower working pressure and higher applied power lead to films with a higher reflectance. Through the analysis of the as-sputtered thin films using X-ray diffraction, the deposition of both Ti and TiO2 films was confirmed. To study the applicability of TiO2 and Ti in fiber sensing, several thin films were deposited in single mode fibers (SMFs) using the sputtering conditions that revealed the most promising results in the glass supports. The sputtered TiO2 and Ti thin films were used as mirrors to increase the visibility of a low-finesse Fabry–Perot cavity and the possible sensing applications were studied.

1. Introduction

Sensing has become a key technique in many areas such as environment, industrial technologies, and real time in situ health care. In all these areas, miniaturization, sensitivity, accuracy, and non-invasive and remote detection are vital and, therefore, are features in which fiber optic-based detection techniques can provide new solutions [1,2]. Optical sensing was revolutionized in the 1960s with the development of the optical fiber and, in the 1970s, researchers started applying optical fibers in sensing techniques. The use of optical fibers not only allowed the development of sensors immune to electromagnetic interference, but also permitted measurements to be accessible remotely. When applied to sensors, there are multiple advantages over conventional sensors, since an optical fiber provides greater precision and has smaller dimensions, a high flexibility, and small propagation losses [3,4,5].
Fiber optic-based sensors are particularly expeditious for refractive index measurements, mainly due to their immunity to electromagnetic interference, robustness even in corrosive and other aggressive environments, and small size. Refractive index detection is particularly adequate in biological and chemical applications, as various substances can be detected through refractive index measurements [6]. Some examples of fiber optic sensors which have been employed to measure the refractive index include fiber Bragg grating (FBG) sensors, sensors based on long-period fiber gratings (LPFGs), and sensors based on surface plasmon resonance (SPR). However, all these sensors present some drawbacks [6,7]. Regarding this, fiber optic Fabry–Perot interferometric-based sensors (FFPI) have been widely used for measuring the refractive index, along with other physical quantities such as pressure, strain, and temperature [8,9,10,11]. FFPI sensors offer several desirable advantages over other fiber optic sensors, such as a large range of measurement, the ability to measure multiple parameters, and a fast response [6].
In any type of sensor, it is crucial to improve the interaction between the measured object and the light that is guided by the optical fiber, increasing its visibility. To attain this goal, light can be made to pass several times through the same length of the optical fiber, something achieved using multi-beam interferometry such as that observed in a finesse Fabry–Perot interferometer (FPI) [12,13]. A FPI can be seen as a two-beam interferometer since the incident light is split into two beams: one that interacts with the physical or chemical parameter to be assessed and the other that works as a reference beam [3].
As fiber optic devices became more sophisticated, researchers began using other approaches to create fiber optic sensors. The need for fabrication techniques that control the structure at the nanoscale has enabled the use of thin films as sensitive elements to obtain feedback from environments in which optical fibers work as signal carriers. Additionally, combined with previous optical approaches, these have led to new detection techniques and new sensors with improved properties [14,15].
Titanium dioxide (TiO2) coatings belongs to the metal oxide group and are of great interest due to their high chemical stability, low cost, non-toxicity, excellent optical and electrical properties, and excellent hydrophilic and hydrophobic properties. As a result, TiO2 coatings have been used in several applications, such as self-cleaning, anti-fog, antibacterial, biomedical materials, and photocatalysis [16,17,18]. Various chemical and physical methods can be used to produce TiO2 thin films; however, the magnetron sputtering technique presents several advantages, such as reproducibility, thickness control, high mechanical stability, good adhesion to the substrate, easy control of the film structure and composition, and its applicability at an industrial scale [16].
Several properties exhibited by TiO2 have been explored regarding its application for optical fiber sensors. Titanium dioxide films possess a good reflectivity in the near infrared (NIR) region [19], making it an interesting material for the improvement of Fabry–Perot interferometer-based sensors [20,21]. Moreover, TiO2 is capable of gas and water adsorption, particularly in TiO2 with the anatase phase [22], allowing for humidity, gas, or pH sensing [22,23,24]. Other important properties of TiO2 are its high dielectric constants and high refractive index, which enhances light confinement, improving the performance of evanescent field-based sensors [25] as well as shifting the resonance wavelength of surface plasmon resonance (SPR) sensors towards the NIR region [26]. Recently, in 2008, Ran et al. reported a Fabry–Perot refractive index sensor with thin-film mirrors [27]. The sensor head consisted of a small air cavity, located near the end of a single mode fiber (SMF), with a microchannel at the end of the fiber through which the medium under test is driven to the Fabry–Perot cavity. The sensor presents two thin films of SiO2 and TiO2 that coat the reflective interfaces of the Fabry–Perot cavity, acting as mirrors. The microchannel can be easily inscribed using 157 nm ultraviolet laser ablation technology. The developed sensor showed a high sensitivity in measuring the refractive index (~1130 nm/RIU). In 2013, Jiang et al. developed a new Fabry–Perot optical fiber sensor coated with TiO2 nanoparticles for the detection of the refractive index, which contains an air cavity near a cleaved end of the SMF. To measure the external changes in the refractive index, the medium can be injected into the Fabry–Perot cavity, or the simplest and most convenient method is to immerse the Fabry–Perot sensor directly in the medium to be measured. A refractive index detection sensitivity of 69.38 dB/RIU was achieved, approximately 2.6 times greater than the sensitivity of the sensor without the TiO2 coating [28]. Additionally, this sensor was independent of temperature. By 2017, Hirsch presented the concept of an optical fiber sensing head whose proposed structure consists of a TiO2 thin film deposited by atomic layer deposition (ALD) at the tip of the SMF [29]. The TiO2 layer showed a maximum reflectance of 17.4% at 1300 nm. Moreover, in 2020, Chauhan and Singh developed a fiber optic refractive index sensor inserting a section of a no-core fiber (NCF) coated with a TiO2 thin film between two multi-mode fibers (MMFs) [30]. Since TiO2 has a higher refractive index than silica fiber and glass, this film provides a strong interaction between light passing through the fiber and the external environment, leading to better sensitivity. The sensitivity of this sensor is equal to 67.3 dBm/RIU, while the sensitivity of the sensor without the TiO2 coating is 41.6 dBm/RIU.
In this context, the present work reports the production of TiO2 films, as well as pure Ti films with different deposition parameters, onto glass supports by DC magnetron sputtering and their characterization by UV-Vis spectroscopy, X-ray diffraction, and scanning electron microscopy for application in fiber optic sensor devices. Subsequently, the featured thin films were deposited on cleaved optical fibers and the ability of the different thin films (metallic and metallic oxide), using deposition methods previously used in optical fibers [26,31], to tune the reflectivity of the Fabry–Perot cavity was investigated; its dependence with temperature was also studied.

2. Materials and Methods

All chemicals used in this work were of analytical grade or chemical grade (Sigma-Aldrich).

2.1. Materials

In this work, model AF 45 glass supports from Präzisions Glass & Optik GmbH, with dimensions 10 mm by 20 mm and 0.5 mm thick, were used. These substrates are made of borosilicate glass with a high content of barium oxide (BaO) and aluminum oxide (Al2O3). They present a high thermal resistance, low thermal expansion coefficient, and high light transmission.
The optical fibers used in this study were purchased from Corning (SMF-28) and were cut to ~50 cm in length.
The used gases, argon, oxygen, and nitrogen, had a ≥99.9% purity. Additionally, the titanium target (64.5 mm in diameter and 4 mm in thickness) used in the magnetron-assisted sputtering process was purchased from Goodfellow and had a purity of 99.99%.

2.2. Thin Film Deposition

2.2.1. Process Optimization

The titanium dioxide or titanium films were deposited by DC magnetron sputtering onto glass substrates and optical fibers.
A titanium disc (Goodfellow, Huntingdon, England, 99.99% purity) of 64.5 mm in diameter and 4 mm in thickness was used as the sputtering target. A turbomolecular pump (Pfeiffer TMH 1001, Pfeiffer Vacuum GmbH, Asslar, Germany) was employed to attain a base pressure of 10−4–10−5 Pa (before introducing the sputtering gas). Before the sputter-deposition step of the films, a movable shutter was interposed between the target and the substrates. The target was pre-sputtered in Ar atmosphere for 1 min to clean the target surface. The target-to-substrate distance was kept constant at 100 mm. Gases in the system were pure Ar and O2 (both 99.99%, Air liquide, Algés, Portugal), and their pressures were separately controlled by needle valves and measured by a Pfeiffer/Balzers TPG-300 vacuum gauge controller (Pfeiffer Vacuum GmbH, Asslar, Germany) before the ignition of the discharge.
Table 1 summarizes the sputtering conditions of all the TiO2 and Ti thin films deposited onto glass substrates and optical fibers, including the oxygen percentage; the working pressure (PT), which was fixed at ~0.8 or ~1 Pa; and the sputtering power, which in turn was fixed at ~500 W or ~1000 W. The deposition time was kept constant at 15 min. It should be noted that the aforementioned sputtering conditions were chosen based on previous studies performed by the group regarding these films [32].
No external substrate heating was used during the depositions. The substrate temperature was measured by a thermocouple passing through a small hole in a copper piece, which was placed in contact with the substrate. During the deposition process, the sample temperature increased up to 100 °C for the higher applied power due to the bombardment of plasma particles of the substrate.

2.2.2. Optical Fiber Deposition

The preparation of the optical fibers consisted of cutting the fibers to approximately 50 cm in length, removing at least 1 cm of its coating and cleaning the cleaved end with isopropyl alcohol, to avoid impurities before the thin film deposition. Using a custom-made fiber holder, the optical fibers were fastened with the help of two side springs so that they remained immobile during the film deposition process. Additionally, this support was intended to guarantee the vertical and perpendicular position of the optical fiber ends to the sputtering target. Optical fibers were placed in sets of even numbers, mainly sets of two, since to produce Fabry–Perot interferometers, two fibers are required. To fix the fibers in these sets, a 25 mm Kapton tape was used. For these assays and for each deposition condition, apart from the optical fibers, glass substrates were also placed inside the sputtering chamber near the fibers and centered with the magnetron cathode to allow the study of the reflectance in the UV-Vis spectrophotometer and therefore to check the deposition parameters of the selected conditions regarding the reflectance.

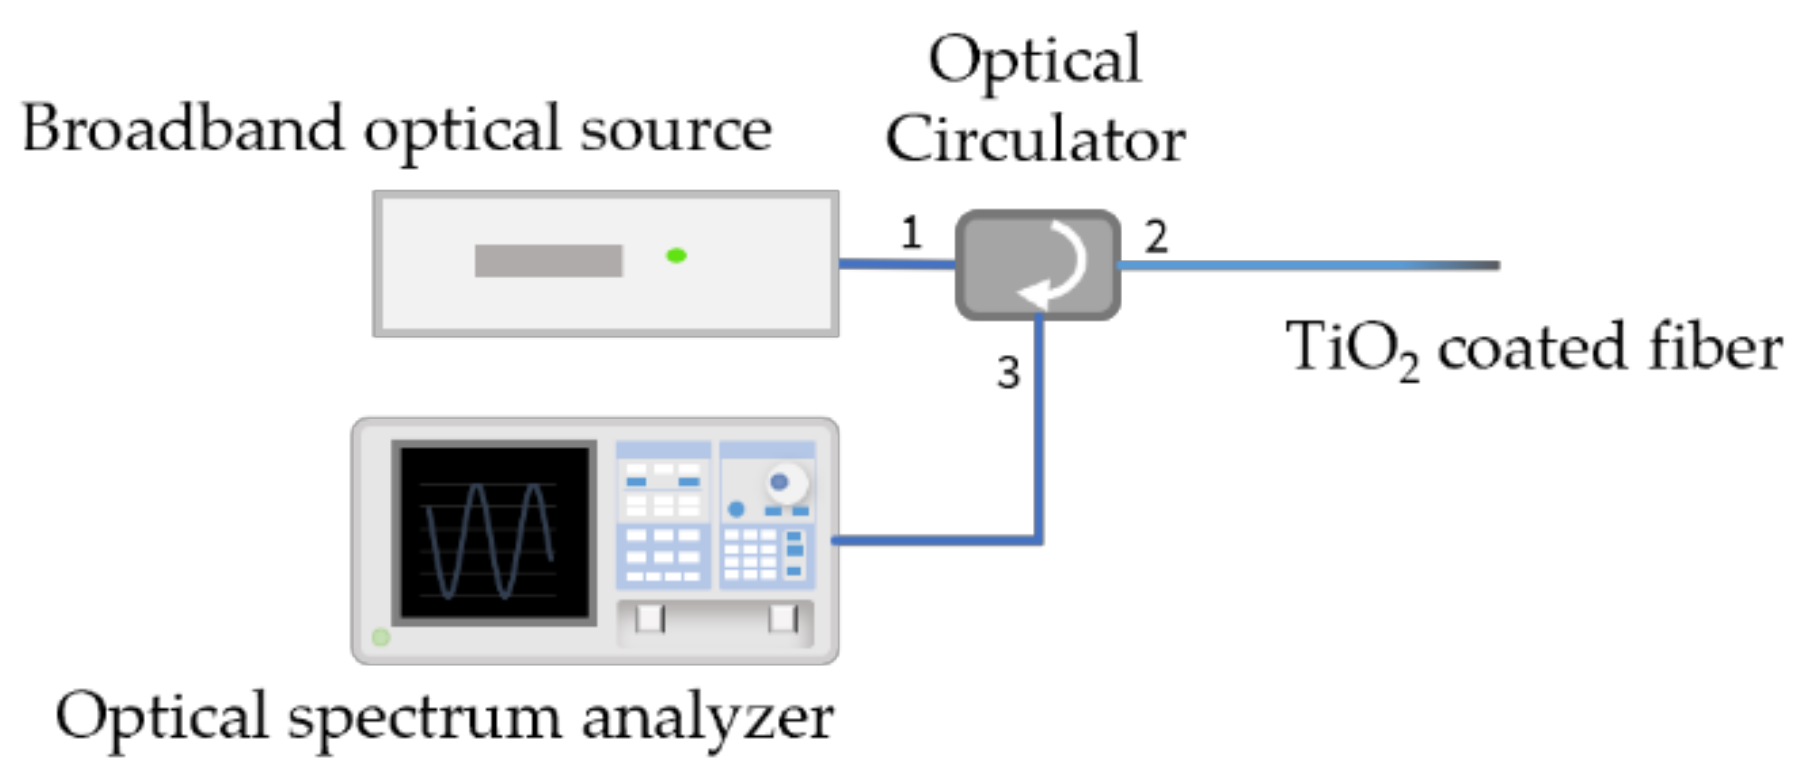
2.3. Characterization Techniques

The characterization of the thin films deposited on the glass substrates was carried out by UV-Vis spectroscopy using the Shimadzu UV-2101PC spectrophotometer, by measuring the reflectance between 200 nm and 900 nm, to verify under which conditions the more reflective films are obtained.
The X-ray diffractograms were obtained with a PANalytical MPD X’pert Pro Diffractometer equipped with Cu X-ray tube (operated at 45 KV and 40 mA) and a 1D detector. Scans were performed in the Bragg–Brentano geometry varying 2θ between 10° and 90°, with a scanning step of 2θ = 0.0334° and a time per step of 29,845 s.
Additionally, the surface morphology was studied by a scanning electron microscope, Thermo Fisher Scientific model Phenom ProX G6, operating at 15 keV. A palladium-gold thin film (~20 nm of thickness) was coated on the films surface before SEM analysis to prevent charge build-up.
The optical properties of the coated fibers were studied using the experimental setup presented in Figure 1. This interrogation system is composed of a broadband optical source with a bandwidth of 100 nm, centered at 1550 nm, an optical circulator, and an optical spectrum analyzer (OSA, model Yokogawa AQ6370C) with a resolution of 0.1 nm. This experimental setup is capable of interrogating the reflected signal from the fiber under study.

3. Results and Discussion

3.1. Characterization of Films Deposited on Glass Substrates

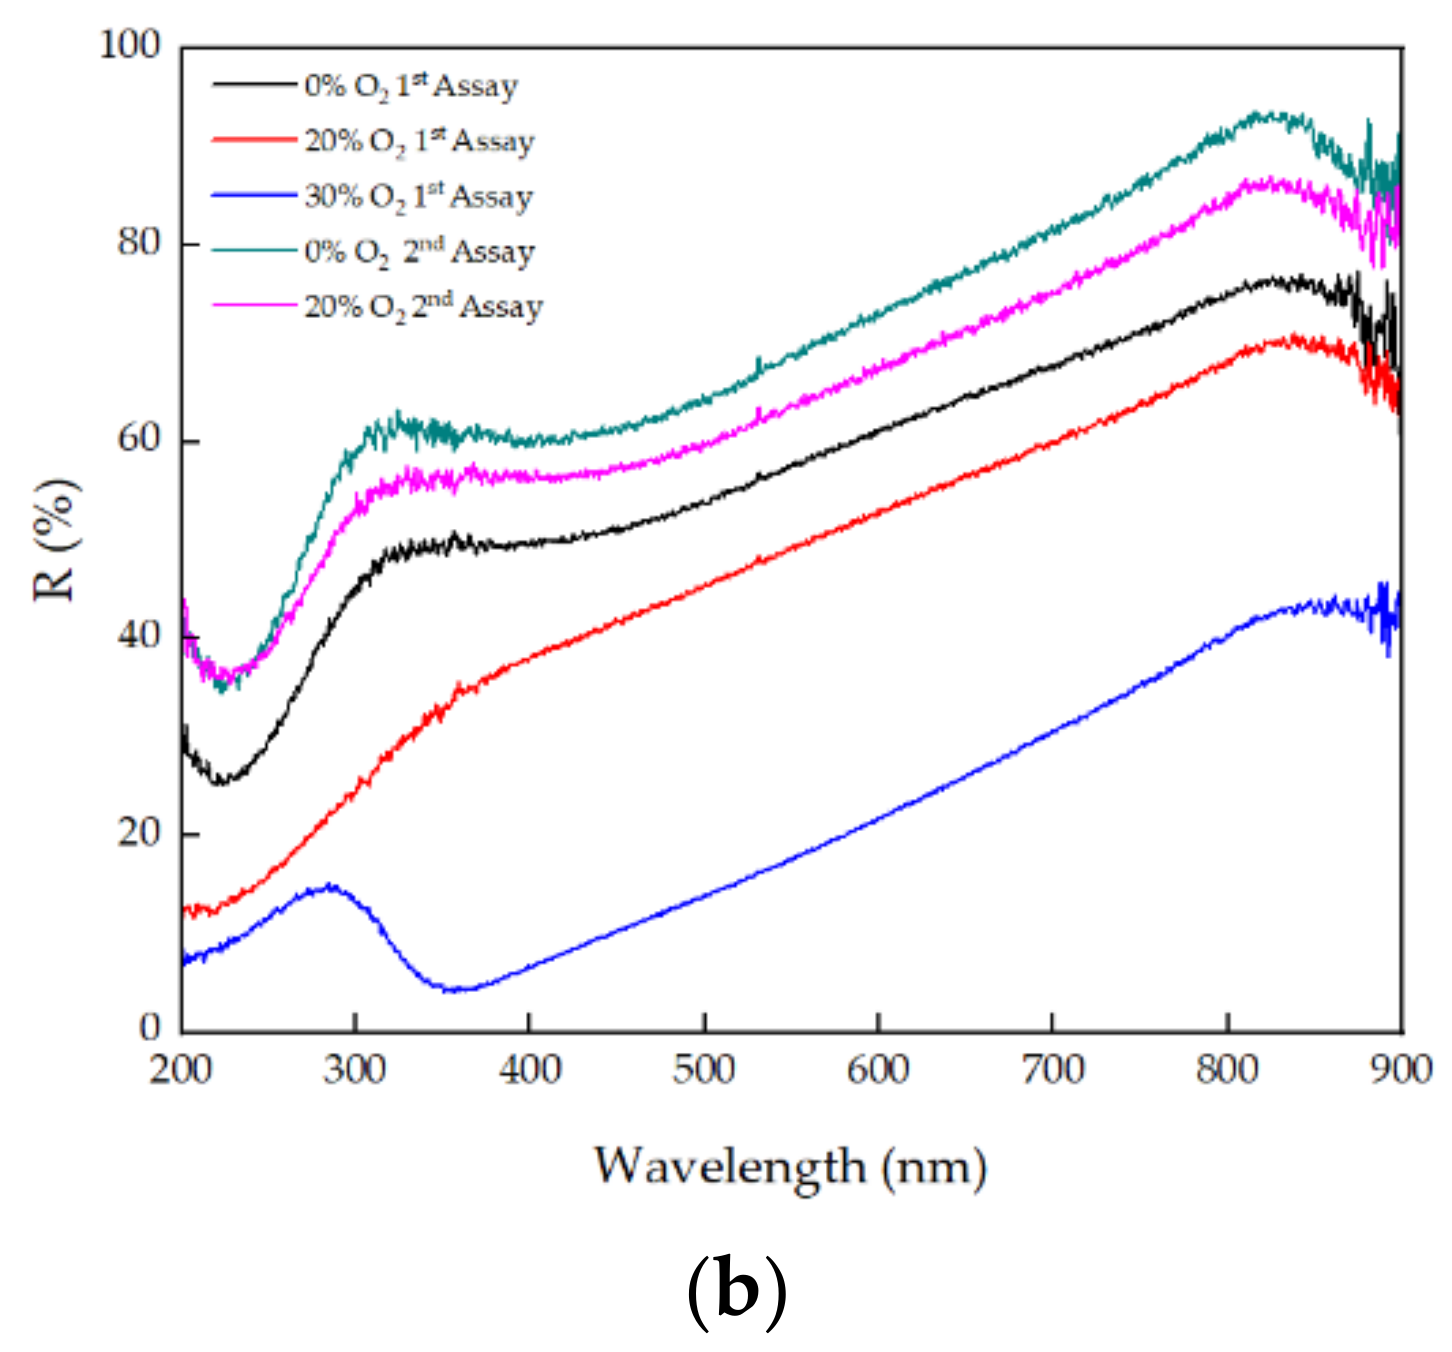
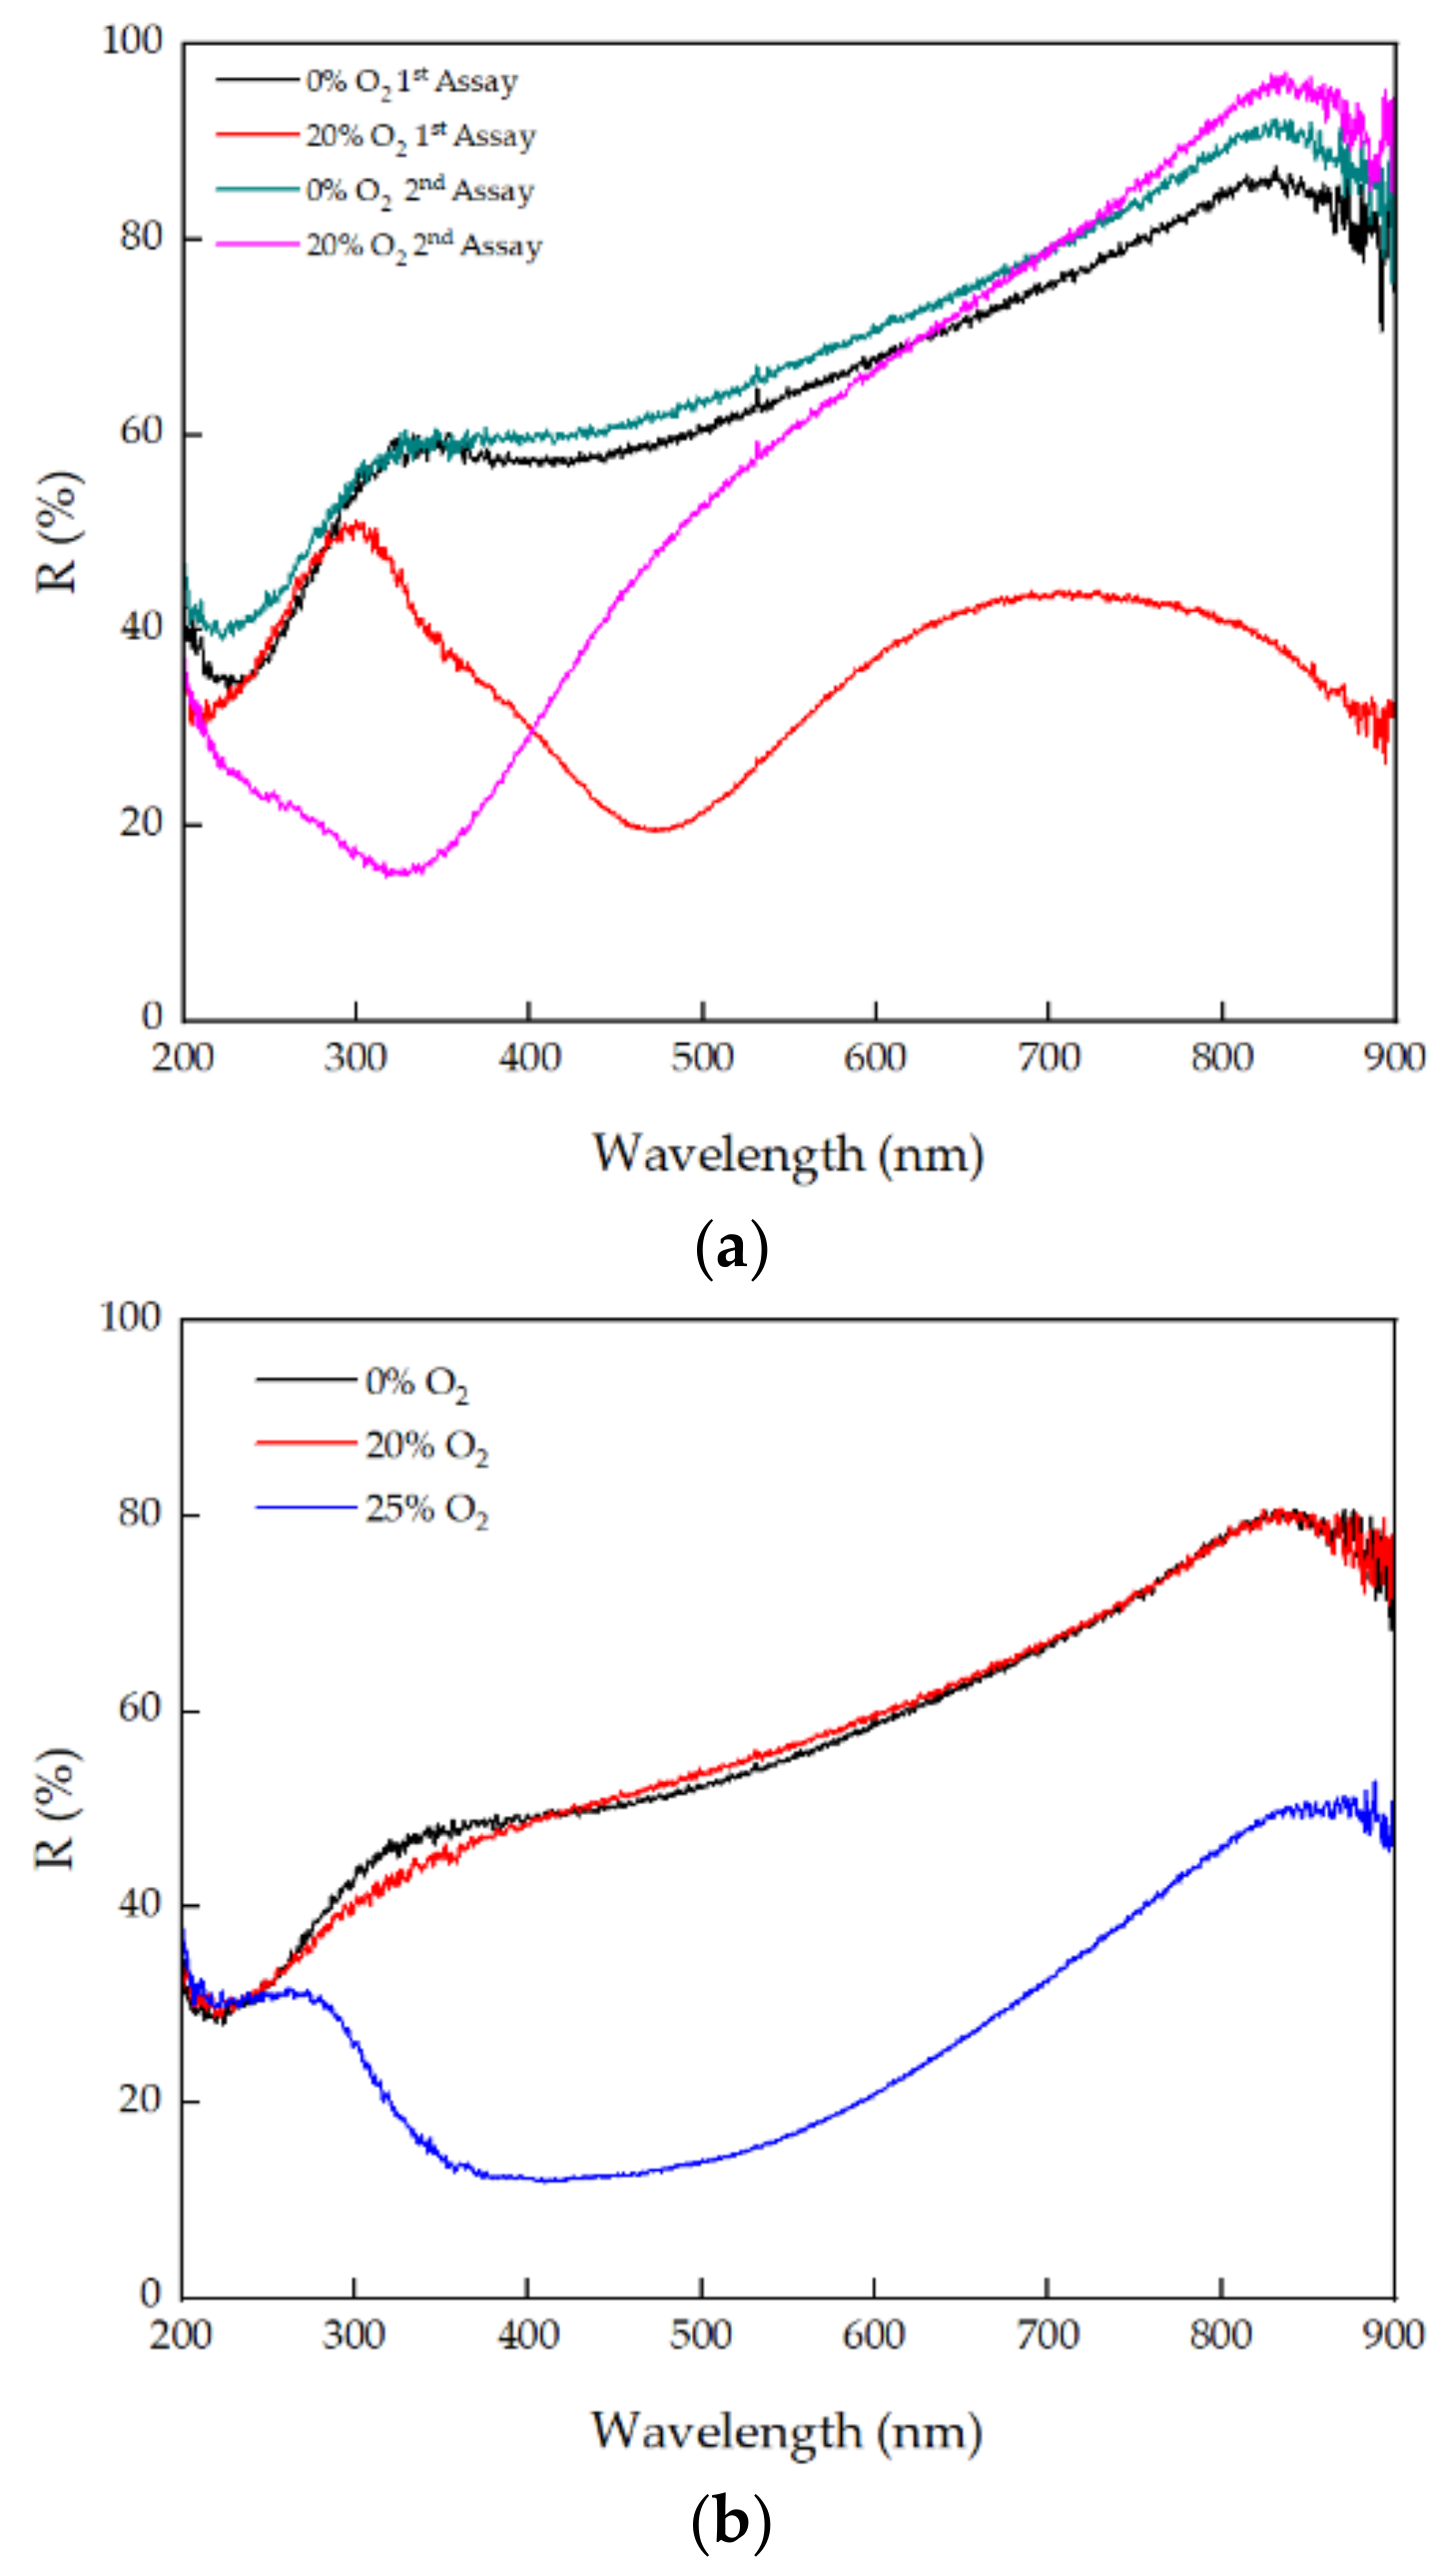
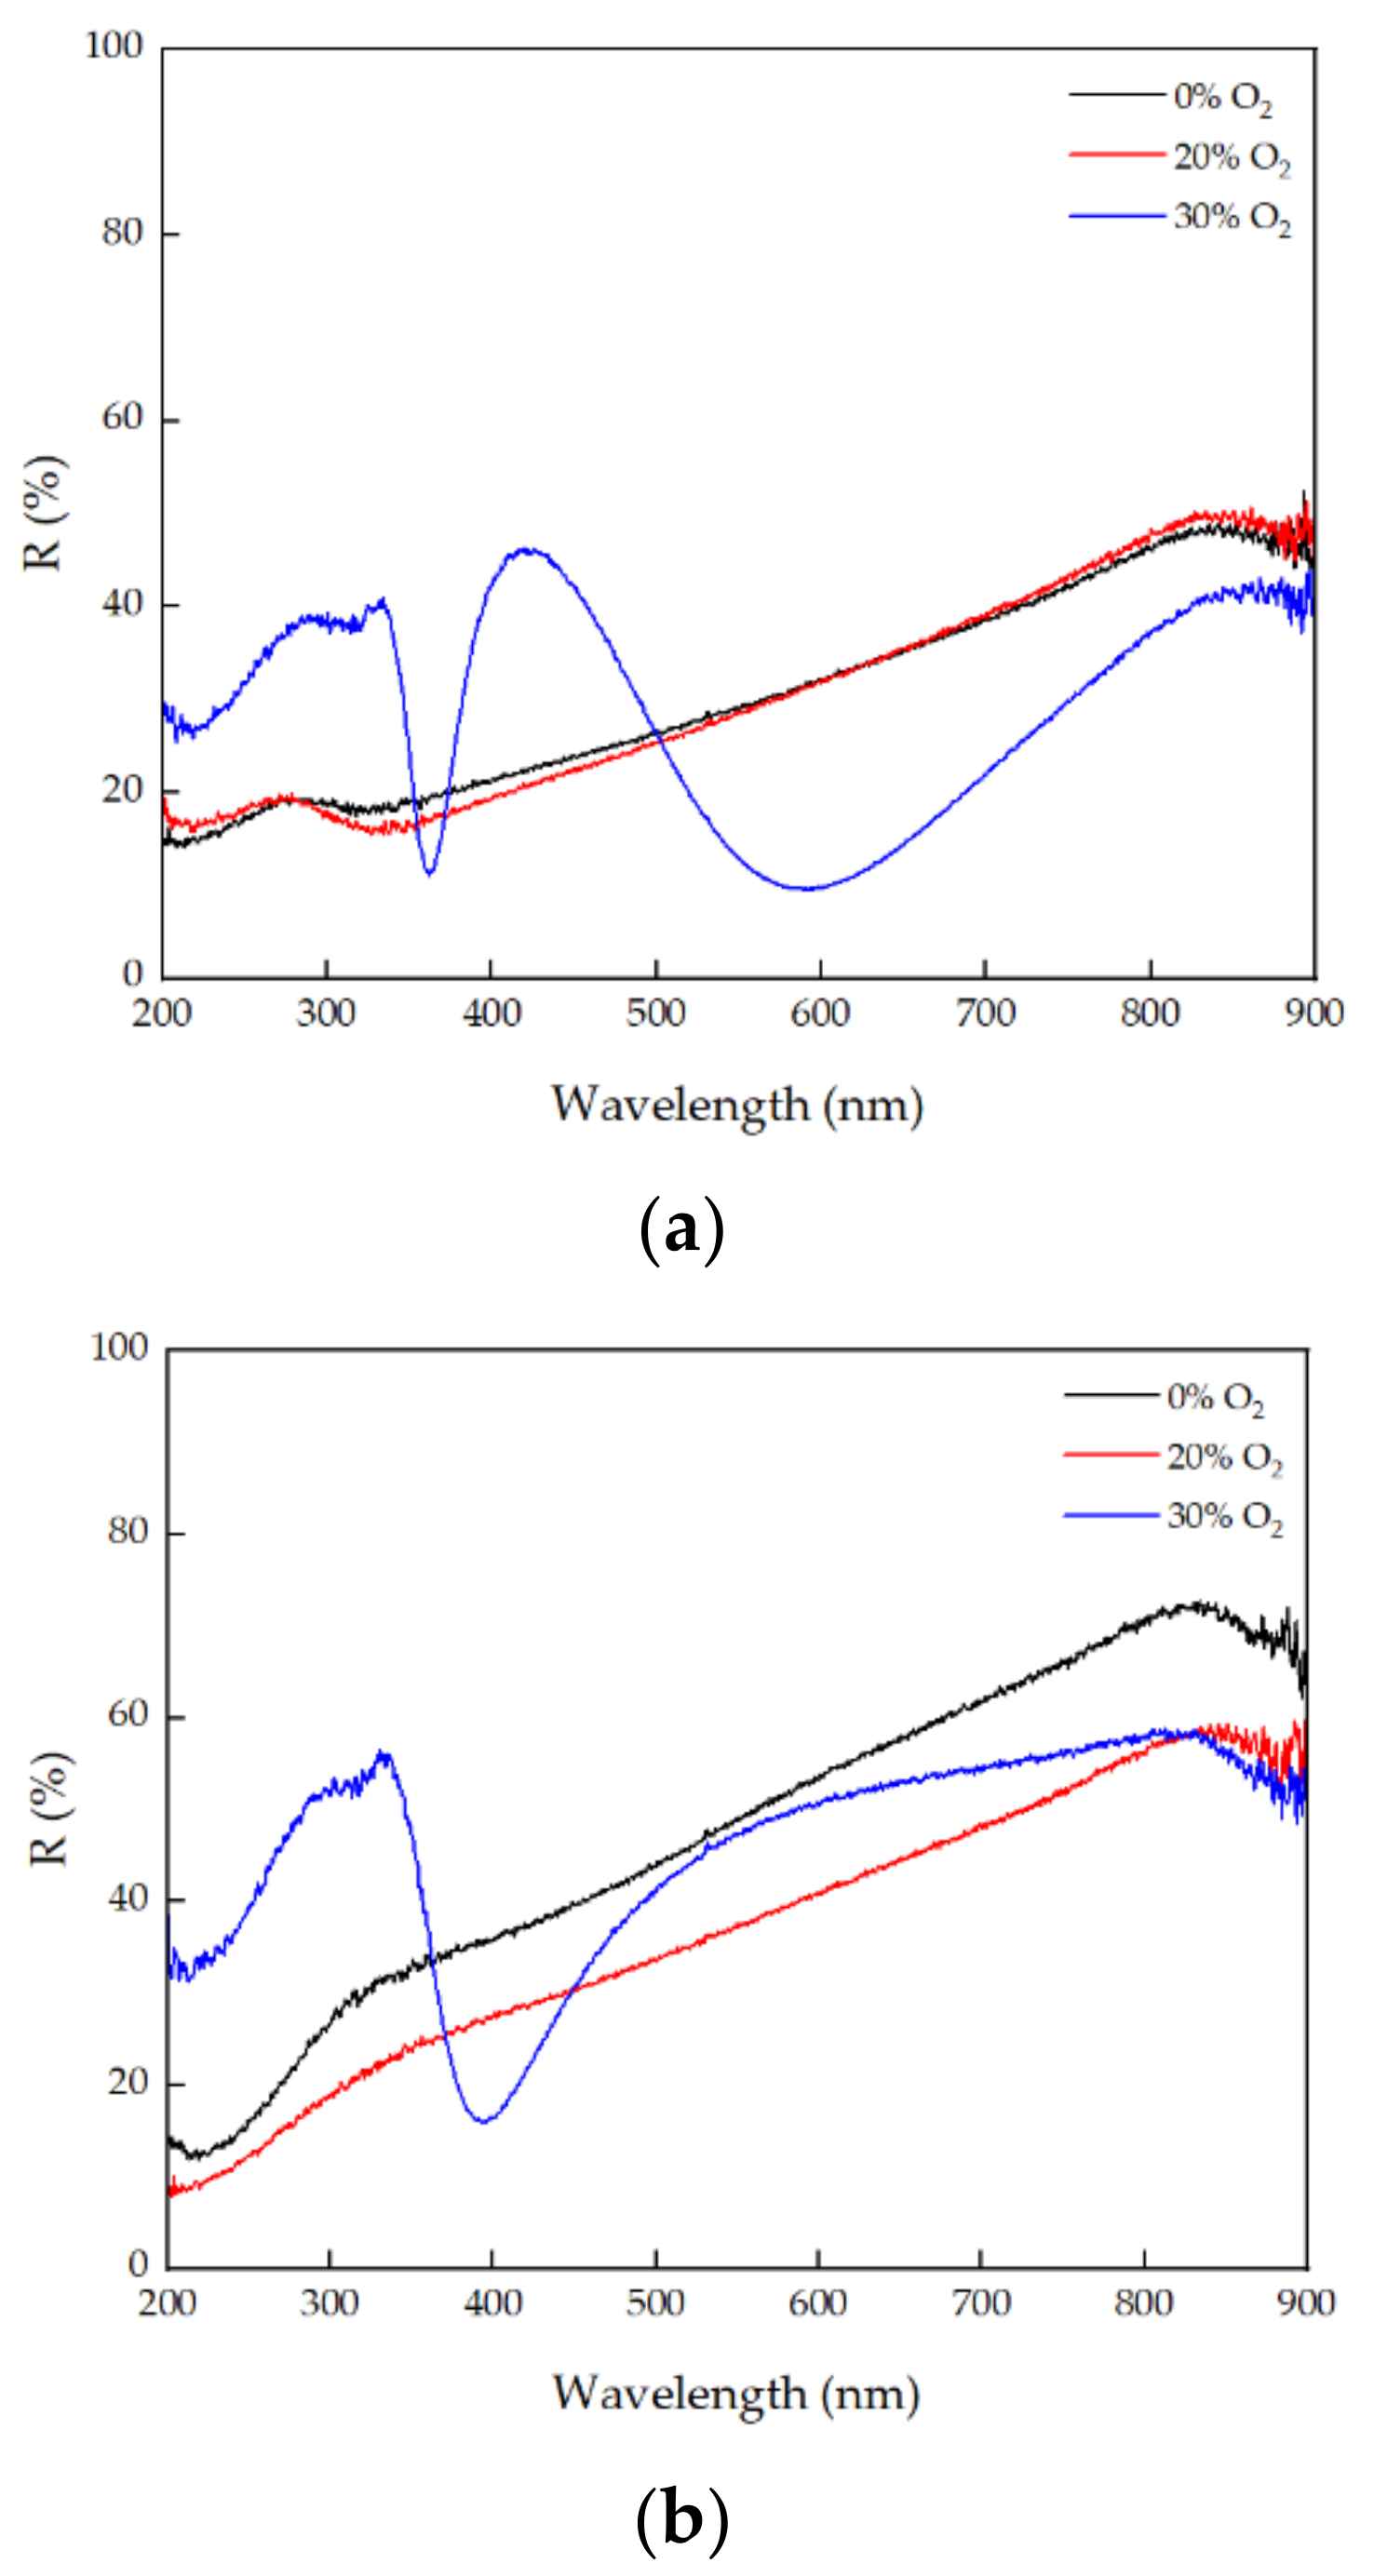
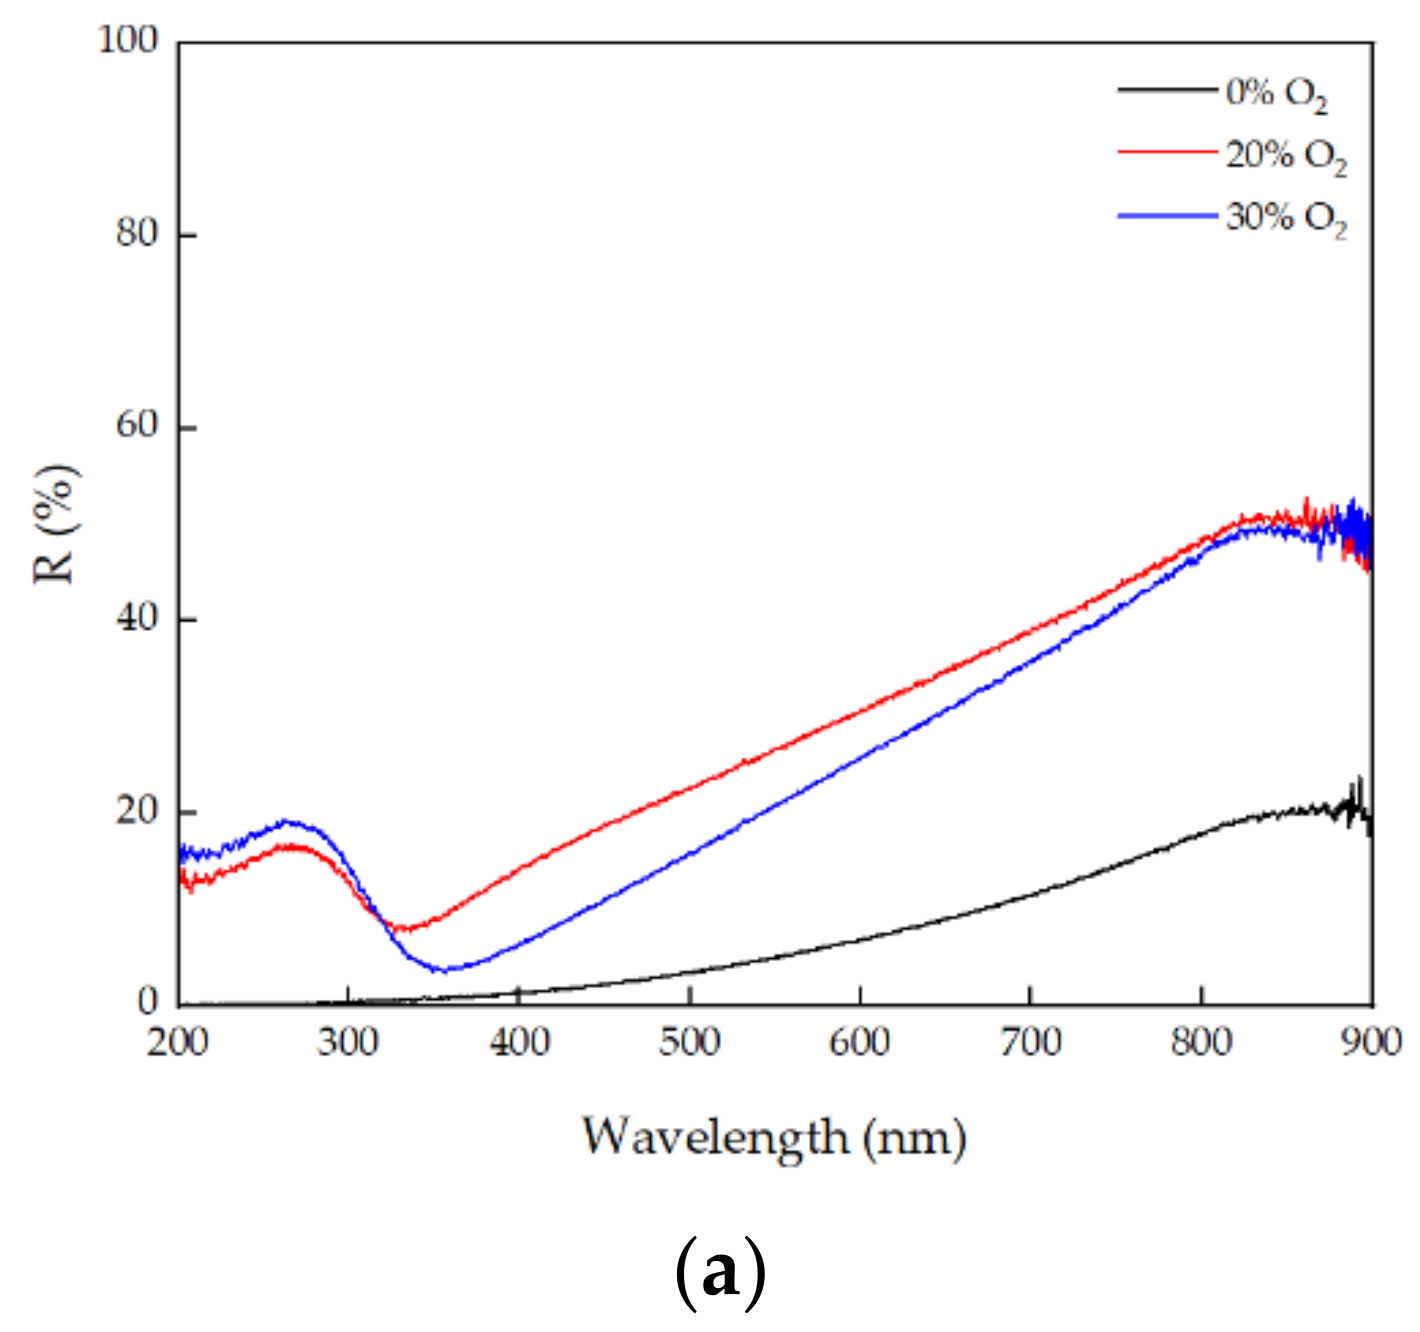
3.1.1. UV-Vis Spectroscopy

It is well known that TiO2 belongs to the metal oxides group and is transparent in the visible region. However, for the development of the sensors reported in this study, there was the requisite of producing high reflectance coatings. This goal is normally accomplished when metallic films are produced, such as a titanium coating, which is promising for this application.
Therefore, to obtain efficient fiber optical sensors, the reflectivity of the Fabry–Perot cavities was tuned by producing Ti- and TiO2-based films using different sputtering deposition parameters and therefore distinct reflectivity. One of the key parameters to attain high reflectivity is to control the ·% O2 used in the discharge during the TiO2 deposition. Thus, this parameter was adjusted up to a threshold where the reflectance of the produced TiO2-based coatings started to decrease and the films became visually more transparent. It is important to stress that the production of the Ti films was performed in the metallic sputtering mode (no added oxygen in the discharge) and, in the case of the TiO2 films, in the reactive mode (argon/oxygen mixture used in the discharge). To analyze the opacity of the various films and to verify under which conditions the more reflective films are obtained, the reflectance of each film deposited onto glass substrates was characterized by a UV-Vis spectrophotometer. Figure 2 and Figure 3 display the behavior of the Ti and TiO2 films in the region between 200 nm and 900 nm, varying the % O2 but keeping the working pressure and applied power fixed.
From Figure 2, for an applied power of ~500 W, it can be inferred that, although a reflectance greater than 80% was not reached, the most promising films were those deposited with a working pressure of 0.8 Pa. The pure titanium and TiO2 films deposited with 20% O2, shown in Figure 2b, in the range of 800 to 900 nm, exhibited a reflectance between 62.24% and 72.67%, and 52.18% and 59.64%, respectively.
In Figure 3, for an applied power of ~1000 W, the highest reflectance values were obtained for the working pressure conditions equal to 0.8 Pa. For the second assay, in the range between 800 and 900 nm, the reflectance of the film deposited with 20% O2 varied between 77.71% and 87% and the reflectance of the pure titanium film varied between 80.11% and 93.54%.
For the fiber optic tests, the most promising deposition parameters were chosen. As mentioned before, for these assays and for each deposition condition, apart from the optical fibers, glass substrates were also placed inside the sputtering chamber close to the fibers and centered to the magnetron cathode. The glass substrates were used as a control of the deposition parameters of the selected conditions regarding the reflectance and therefore to guarantee that the values of the reflectance remained high as desired. Figure 4 depicts the reflectance spectra of the Ti and TiO2 films deposited onto glass substrates with a working pressure of 0.8 Pa, which were deposited simultaneously with the corresponding optical fiber coatings, and with the applied power kept constant at ~500 W or ~1000 W.
Figure 4a depicts the reflectance spectra of the coatings produced with an applied power of 1000 W and the highest values of reflectance that were obtained with the tested deposition parameters can be observed. In the range from 800 to 900 nm, the reflectance of the sample produced with 0% O2 (Ti coating) varied between 75.62% and 92.31%, and the reflectance of the sample deposited with 20% O2 (TiO2-based coating) varied between 84.84% and 97.11%. From Figure 4b, which corresponds to the films produced with 500 W, although the reflectance was noticeably lower, the films deposited with 0% and 20% O2 reached reflectance values of 80.61% and 80.79%, respectively, in the 800 to 900 nm range. The fact that these values were so close suggests that the added oxygen concentration in the discharge was not substantial to produce coatings with distinct reflectances. On the other hand, for the TiO2 film obtained with 25% oxygen, the maximum reflectance was only 52.9%, which is in agreement with the fact that, with more O2 in the discharge, the transition between the metal and compound mode occurs, i.e., between the high rate deposition of an oxygen-deficient layer and a subsequent oxidation at a high oxygen partial pressure corresponding to a low deposition rate. It is well known that for a higher %O2, the TiO2 films produced by magnetron sputtering become transparent and thus are not adequate for the desired application reported in this work, which requires coatings with a high reflectivity [32].
Also, it is important to point out that the observed difference in reflectance for the different assays for the same deposition parameters is due to the fact that these results were attained in a sequential order and consequently with a higher erosion of the sputtering target. It is known that, besides the deposition parameters, the erosion-zone profile of the target-cathode can play a key role on the coatings properties, due to its effect on the deposition rate [33]. Particularly, as the erosion depth increases, the plasma density changes due to the increase in the strength of the magnetic field responsible for the capture of secondary electrons, leading to the increase of the deposition rate, which can consequently contribute to the observed high reflectance results.

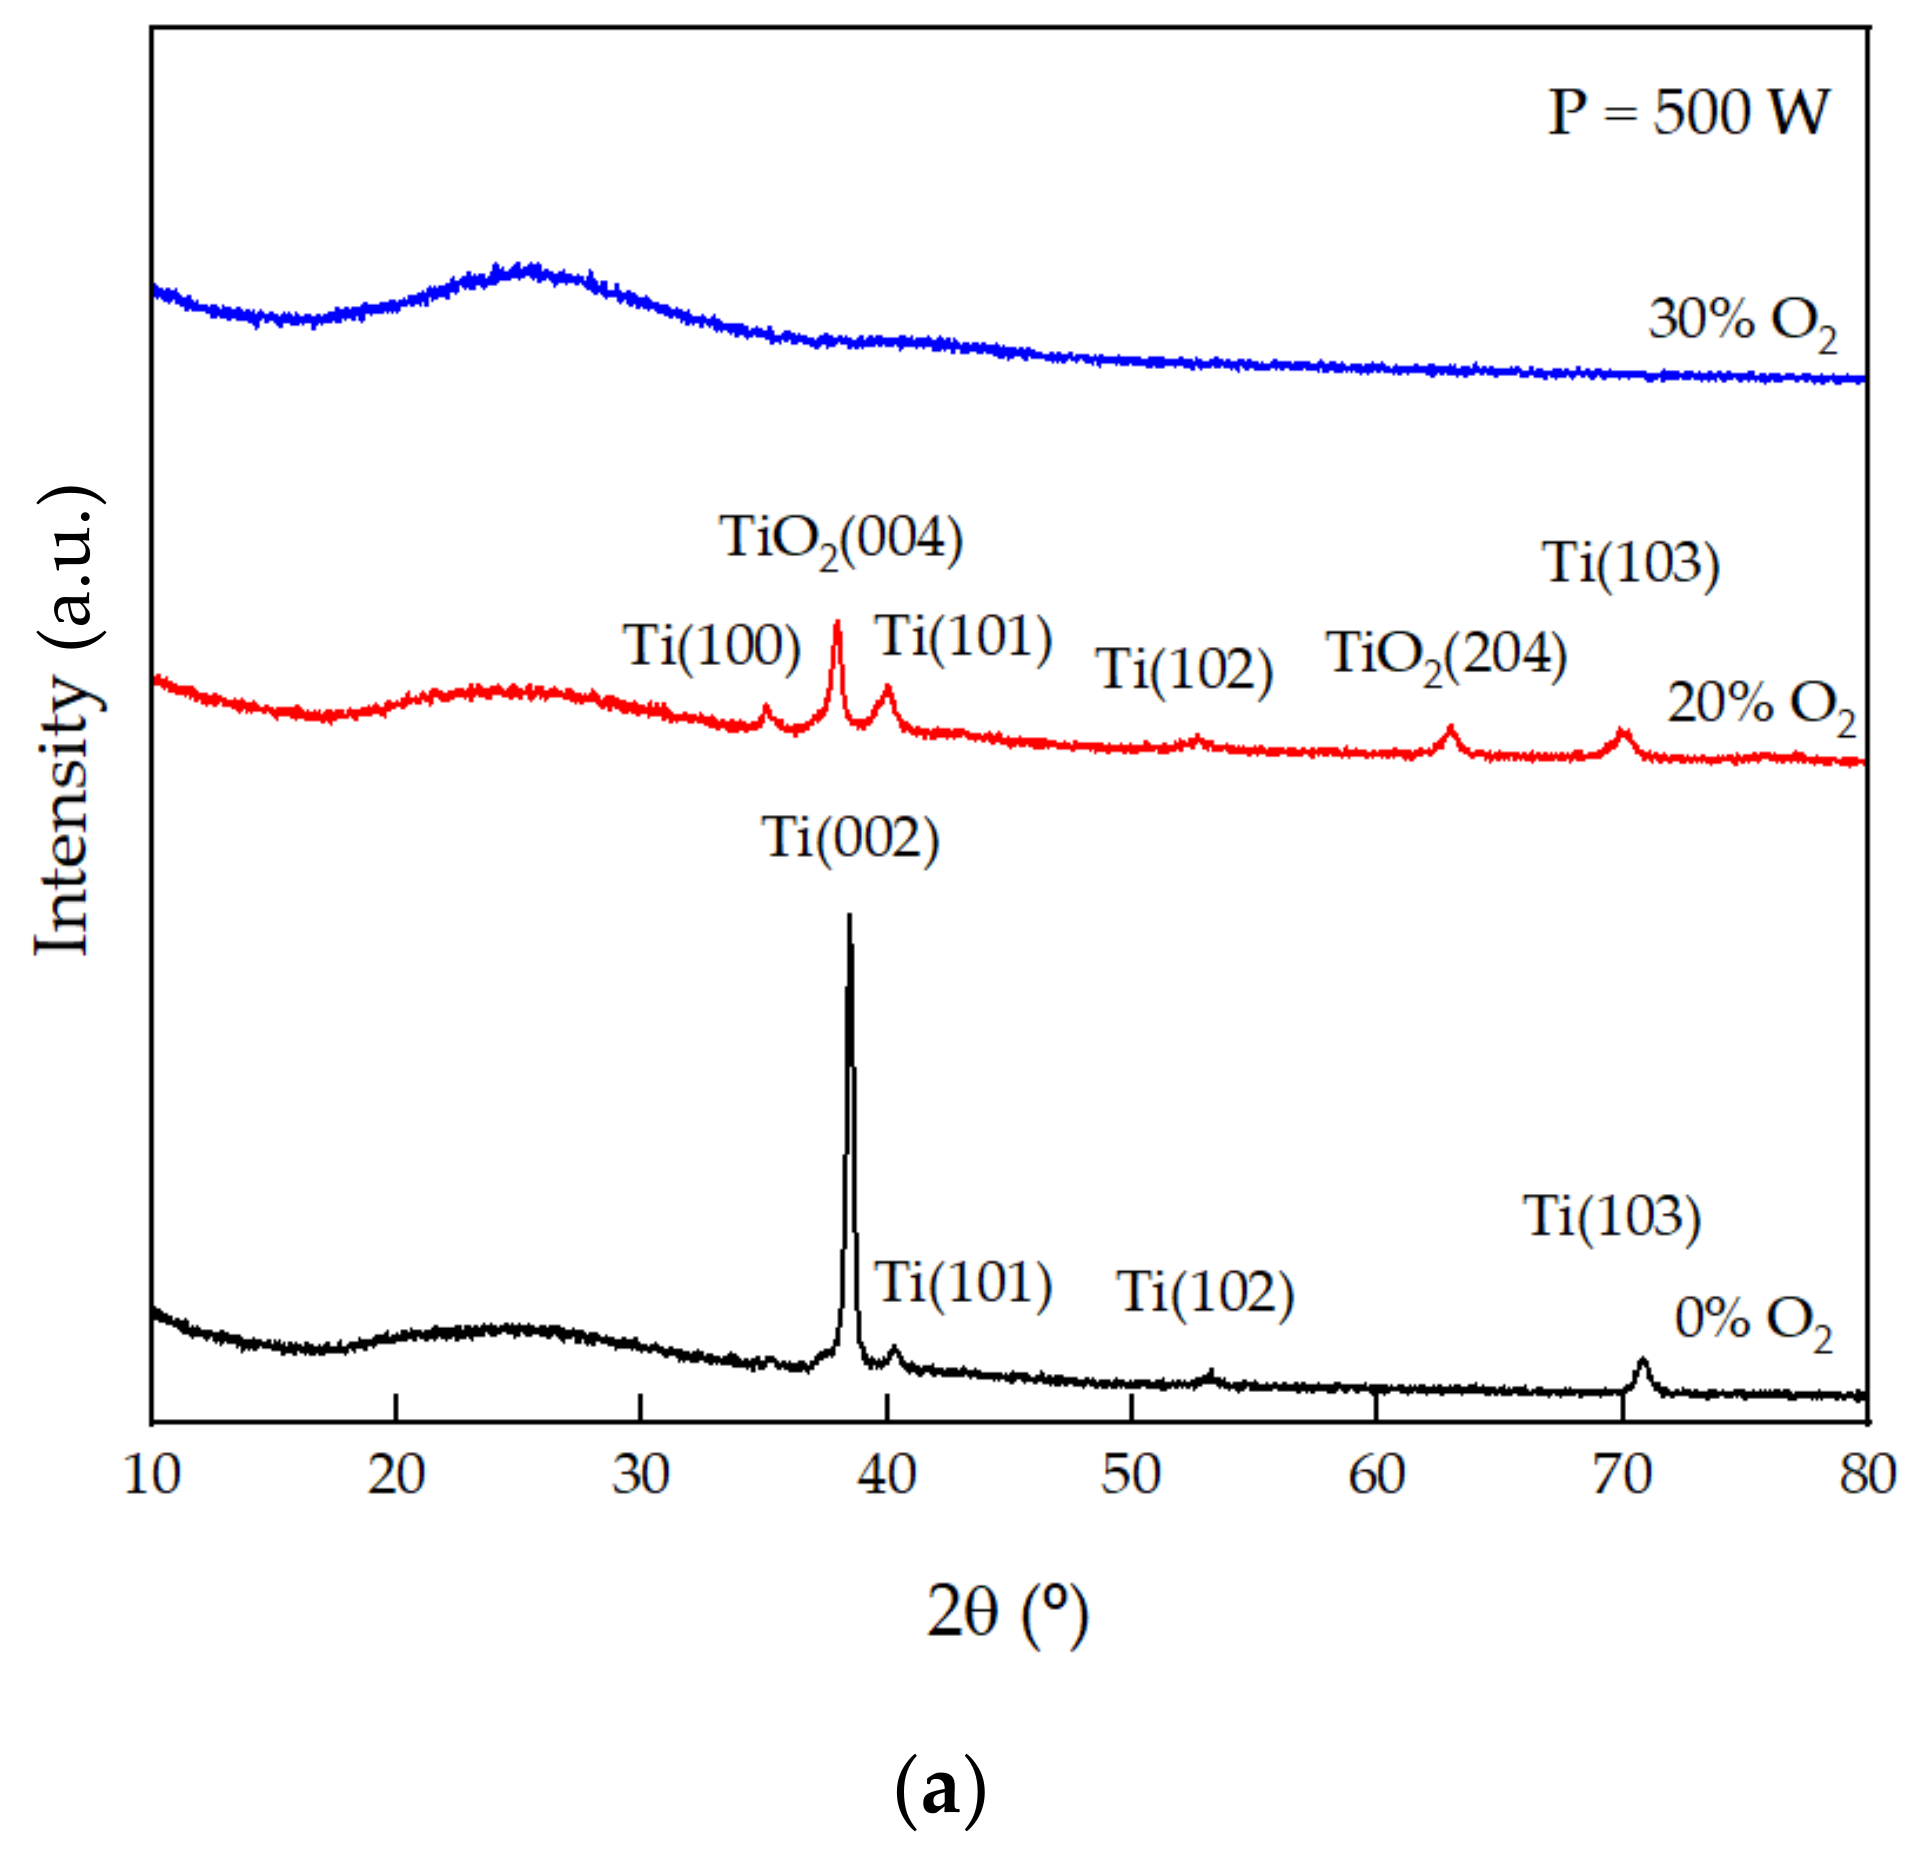
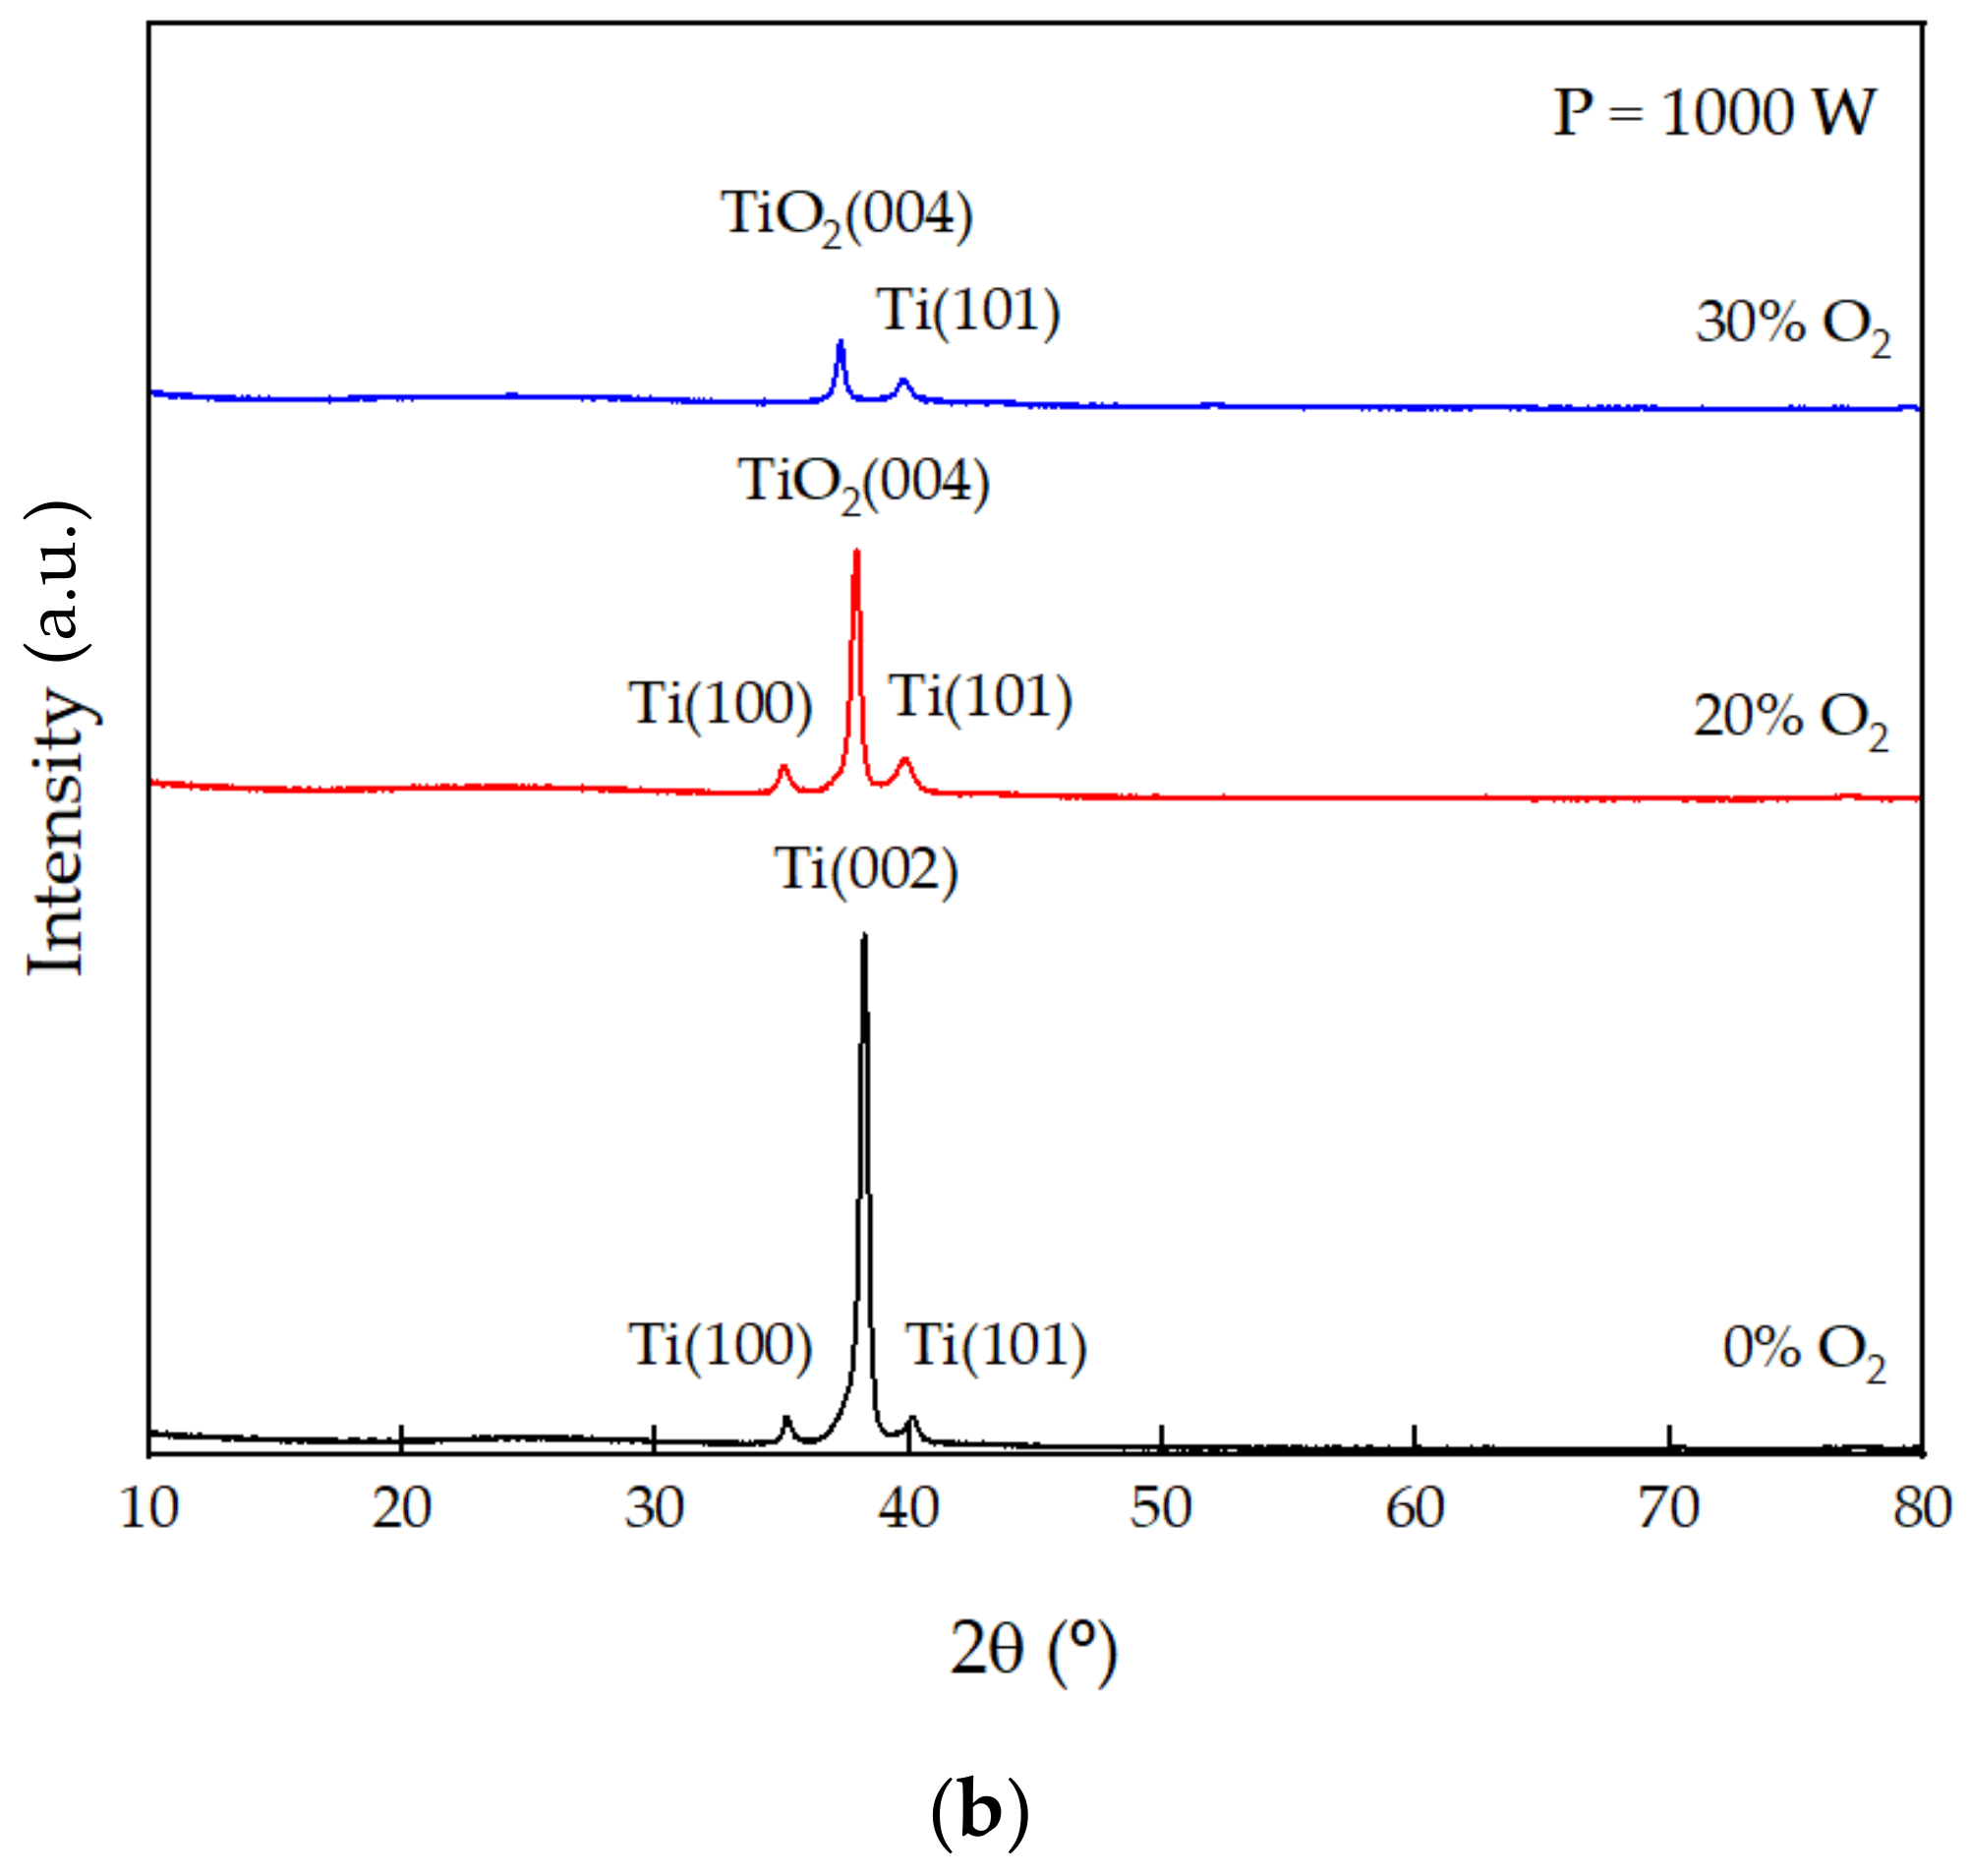
3.1.2. X-ray Diffraction

The Ti and TiO2 thin films were also characterized by X-ray diffraction, and the results are presented in the following figures. Figure 5 shows the X-ray diffractograms of the Ti and TiO2 films deposited on glass substrates with a working pressure of 0.8 Pa for different oxygen concentrations and applied powers.
In the diffractograms shown in Figure 5a, corresponding to films produced with an applied power of ~500 W, it can be observed that the pure titanium film and the TiO2 film produced with 20% O2 are crystalline. In the case of the Ti film, the diffraction peaks corresponding to the planes (002), (101), (102), and (103) can be observed, while for the TiO2 film deposited with 20% O2, although the diffraction peaks corresponding to titanium—planes (101) and (103)—are detected, the TiO2 anatase phase can be observed as the major phase, which is one of the crystalline phases that TiO2 can exhibit, with the predominant diffraction peak at 2𝜃 = 37.80° corresponding to the (004) plane. Furthermore, it also presents another peak characteristic of this phase at 2𝜃 = 62.99°, corresponding to the (204) plane. The film deposited with 30% O2 is amorphous. Furthermore, in Figure 5a, a bump in the 2𝜃 region of 20°–30° can be noticed for all diffractograms, which is most probably due to the glass substrate, because the corresponding diffractogram (not shown here) exhibits a similar pattern to the X-ray pattern of the TiO2-based film deposited with 30% O2. Increasing the applied power to 1000 W (Figure 5b), the produced films are all crystalline with preferential growth in the direction of the (004) plane, for the TiO2 films and in the case of the Ti film, according to the (002) crystalline plane. It is important to note that, for the films deposited with a certain % of O2, in addition to the TiO2 anatase phase, a minority metallic titanium phase is also visible. It is well known that the two key factors for the crystallization of the film during the sputtering process are the thermal energy induced by substrate heating and the energy of sputtered particles impinging on the substrate surface. In this study, the substrates were not intentionally heated and the rise in the substrate temperature due to the sputtering process (energy impact of particles) monitored by a thermocouple reached a maximum temperature of 60 and 100 °C when the sputtering power was 500 W and 1000 W, respectively. The impinging particles could be the sputtered particles from the target (atomic Ti, molecular TiO, molecular TiO2, TiO2 clusters), energetic electrons, negative ions (O), and neutrals reflected from the target (atomic Ar and O) [34,35].

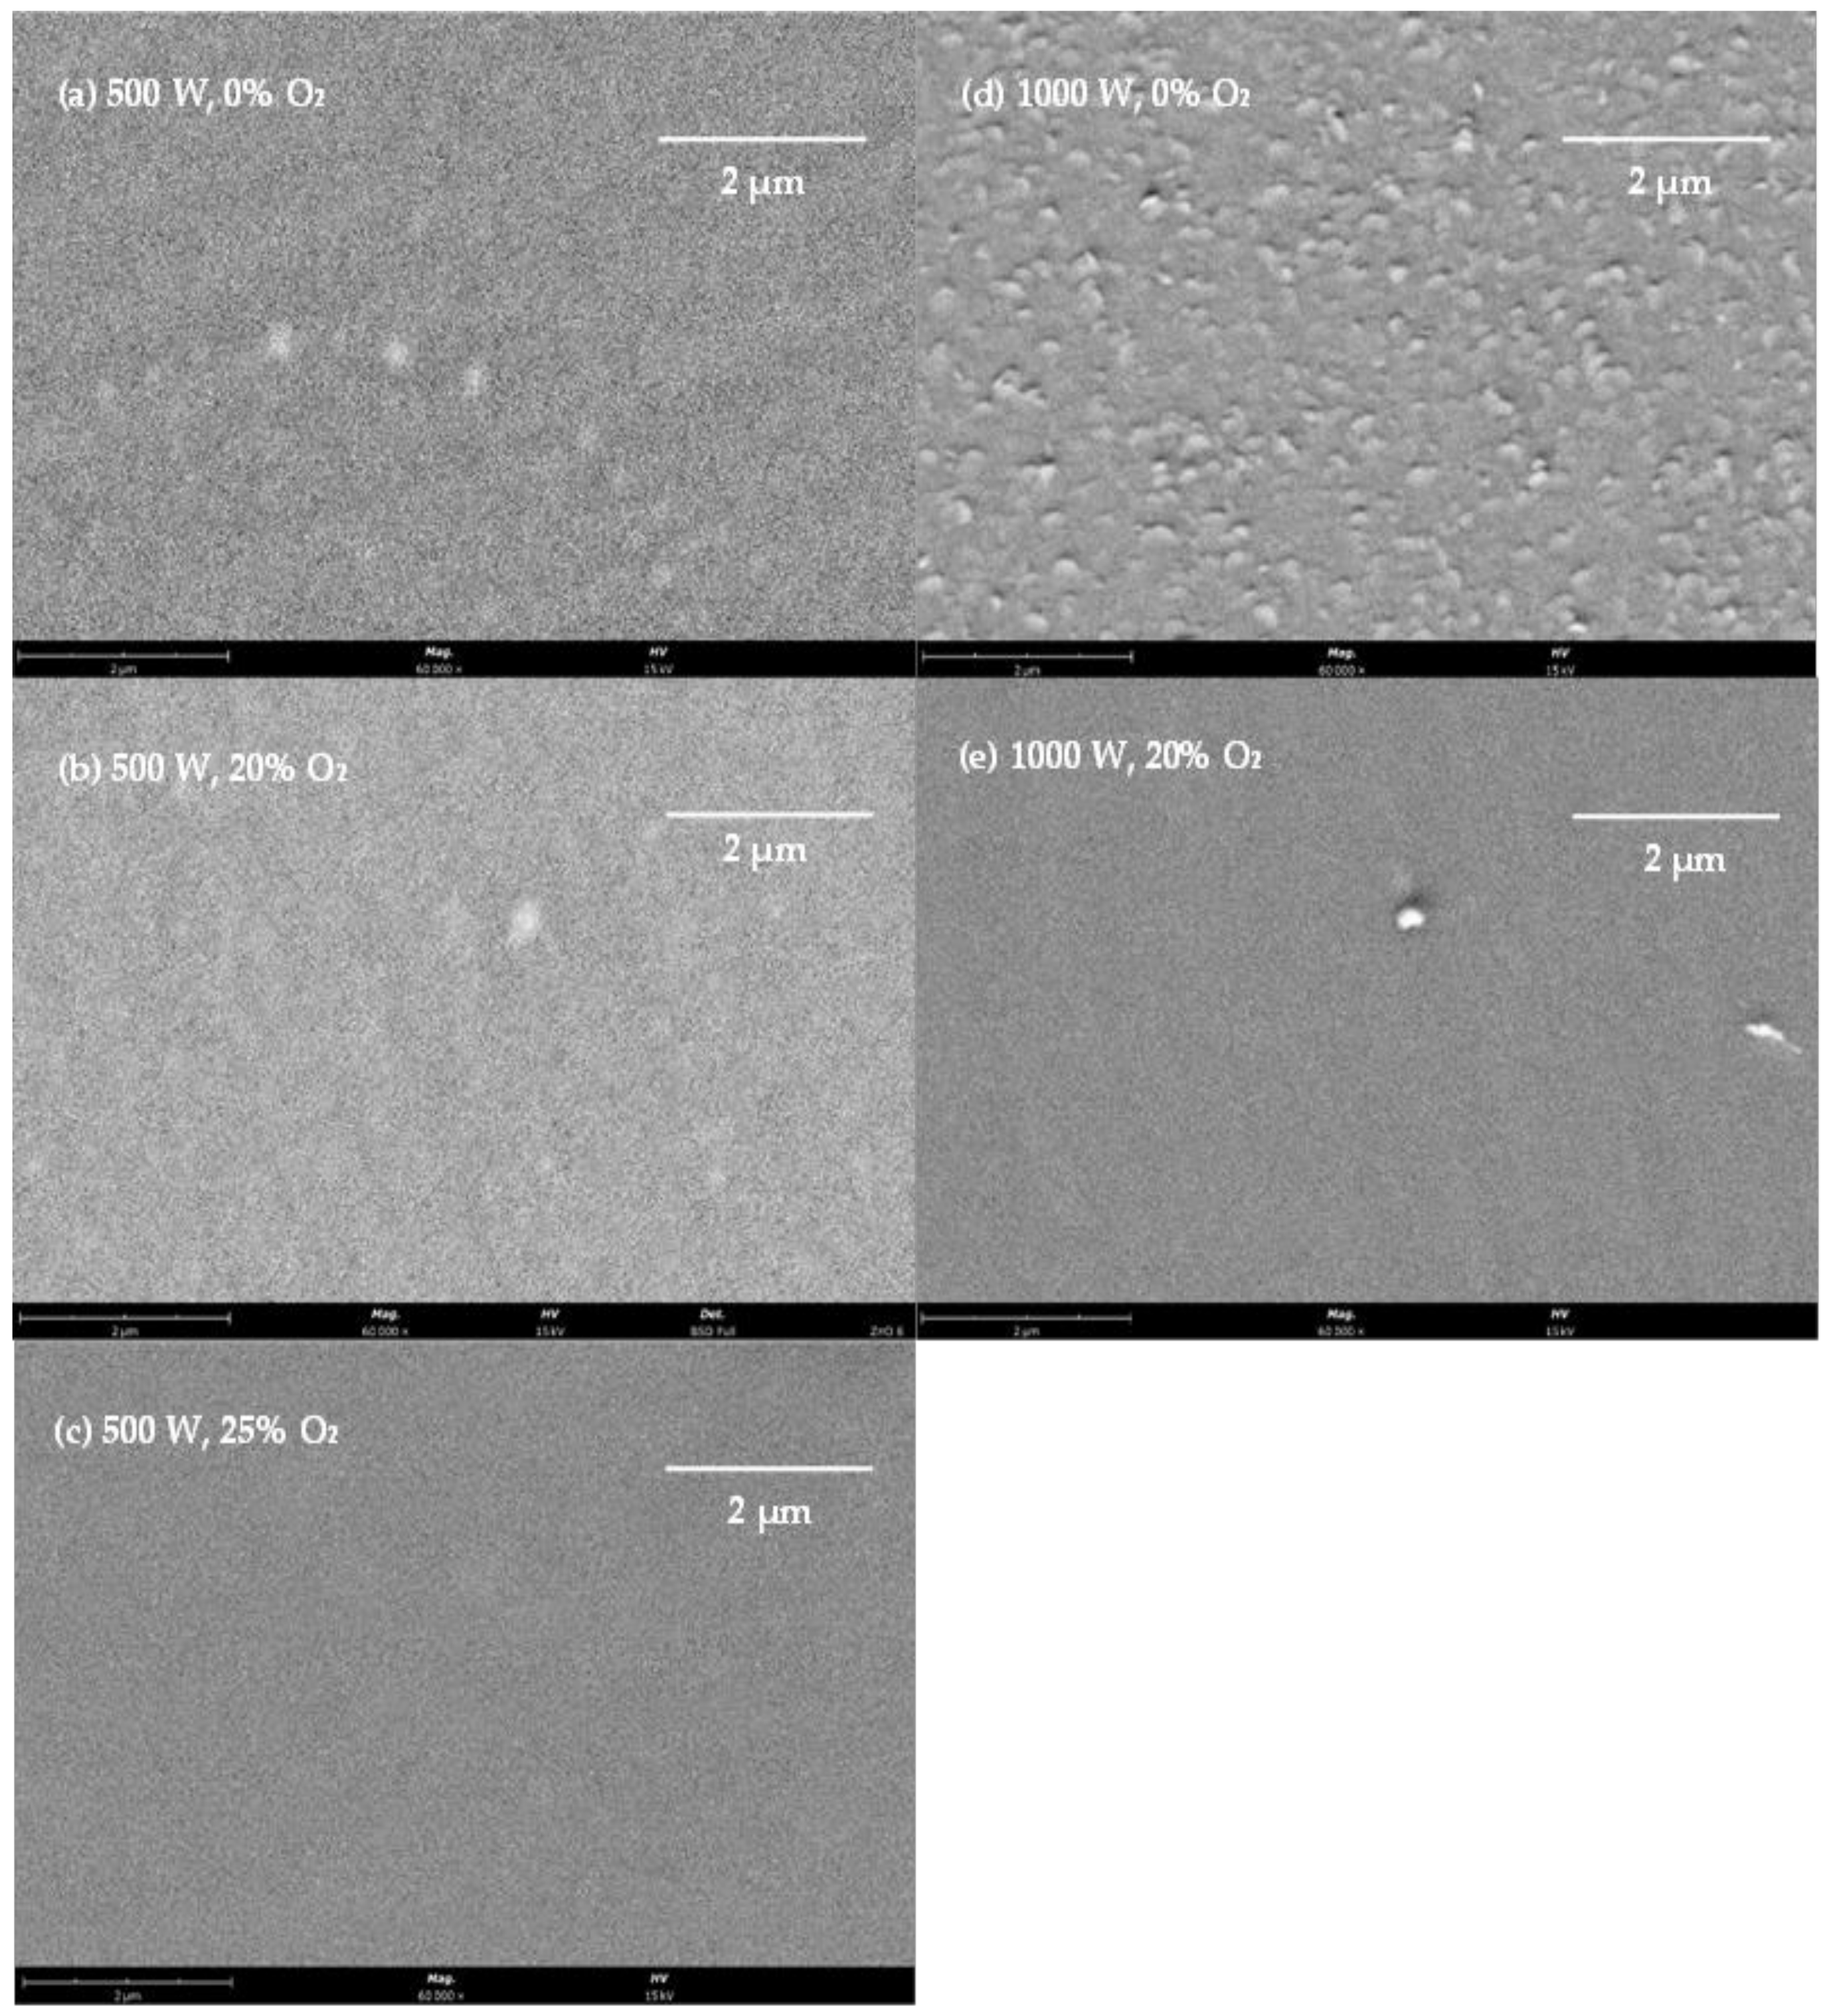
3.1.3. Scanning Electron Microscopy

The surface morphology of the titanium and titanium dioxide thin films was analyzed by scanning electron microscopy and the obtained SEM images are depicted in Figure 6. From the analysis of the SEM images, it can be observed that the surface of the pure titanium films appears to be rougher than the surface of the TiO2 films, exhibiting the presence of more agglomerates. Under both applied power conditions, an increase in the oxygen percentage of the argon/oxygen mixture results in a smoother film surface with less irregularities.

3.2. Study of Sensing Capabilities of Ti- and TiO2-Coated Optical Fibers

The variation of the normalized optical power in relation to the value of an uncoated fiber, for the different samples of these films, was studied and the average value and corresponding dispersion for each sample (A and B, which correspond to two optical fibers coated with the same film—Ti or TiO2 films) were determined, as presented in Figure 7. It can be concluded that surfaces coated with pure titanium and titanium dioxide films also have a much higher reflectivity than that of an uncoated fiber, except for TiO2 deposited with 20% O2 and a sputtering power of 1000 W (sample A), as can be observed in Figure 7. This high variation in the reflectivity may be due to irregularities on the face of the fiber caused in the cleaving process. The fibers coated with the TiO2 films deposited with 20% O2 and pure Ti films showed the highest reproducibility between two samples, both deposited with an applied power of ~1000 W (A and B).
The average value of the optical power normalized for different O2 concentrations was studied. For these conditions, the films that produced more consistent results, with a lower dispersion, were those deposited with 0% O2 (Ti film). It is also noteworthy that a lower reflectivity was achieved for an O2 percentage of 25%, which is in agreement with the fact that most probably in these conditions the sputtering process is at the compound mode, as explained previously. The effect of the applied sputtering power on the reflectivity of the films was also studied, attaining a smaller reflectivity dispersion for a higher sputtering power (~1000 W).

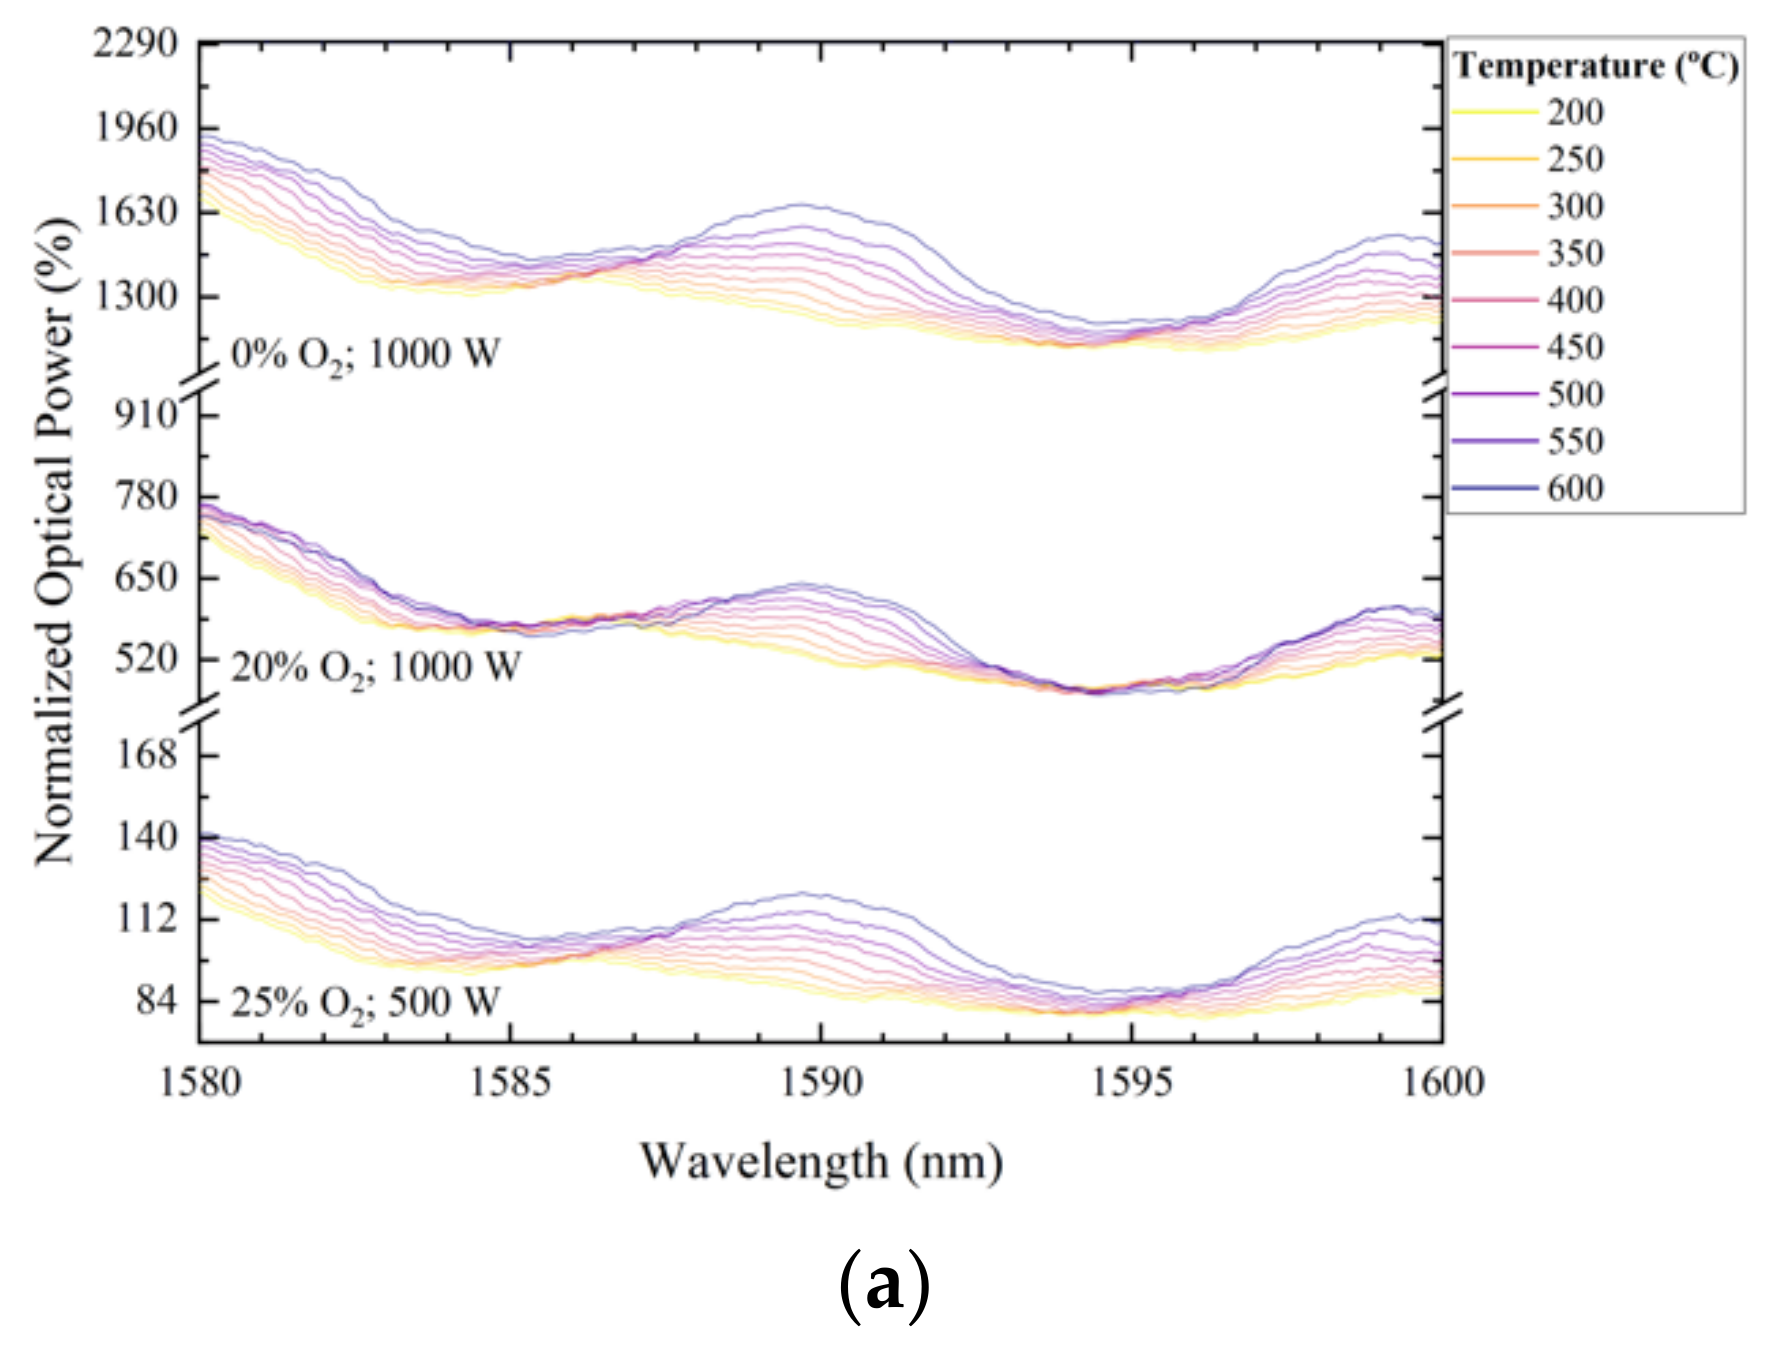
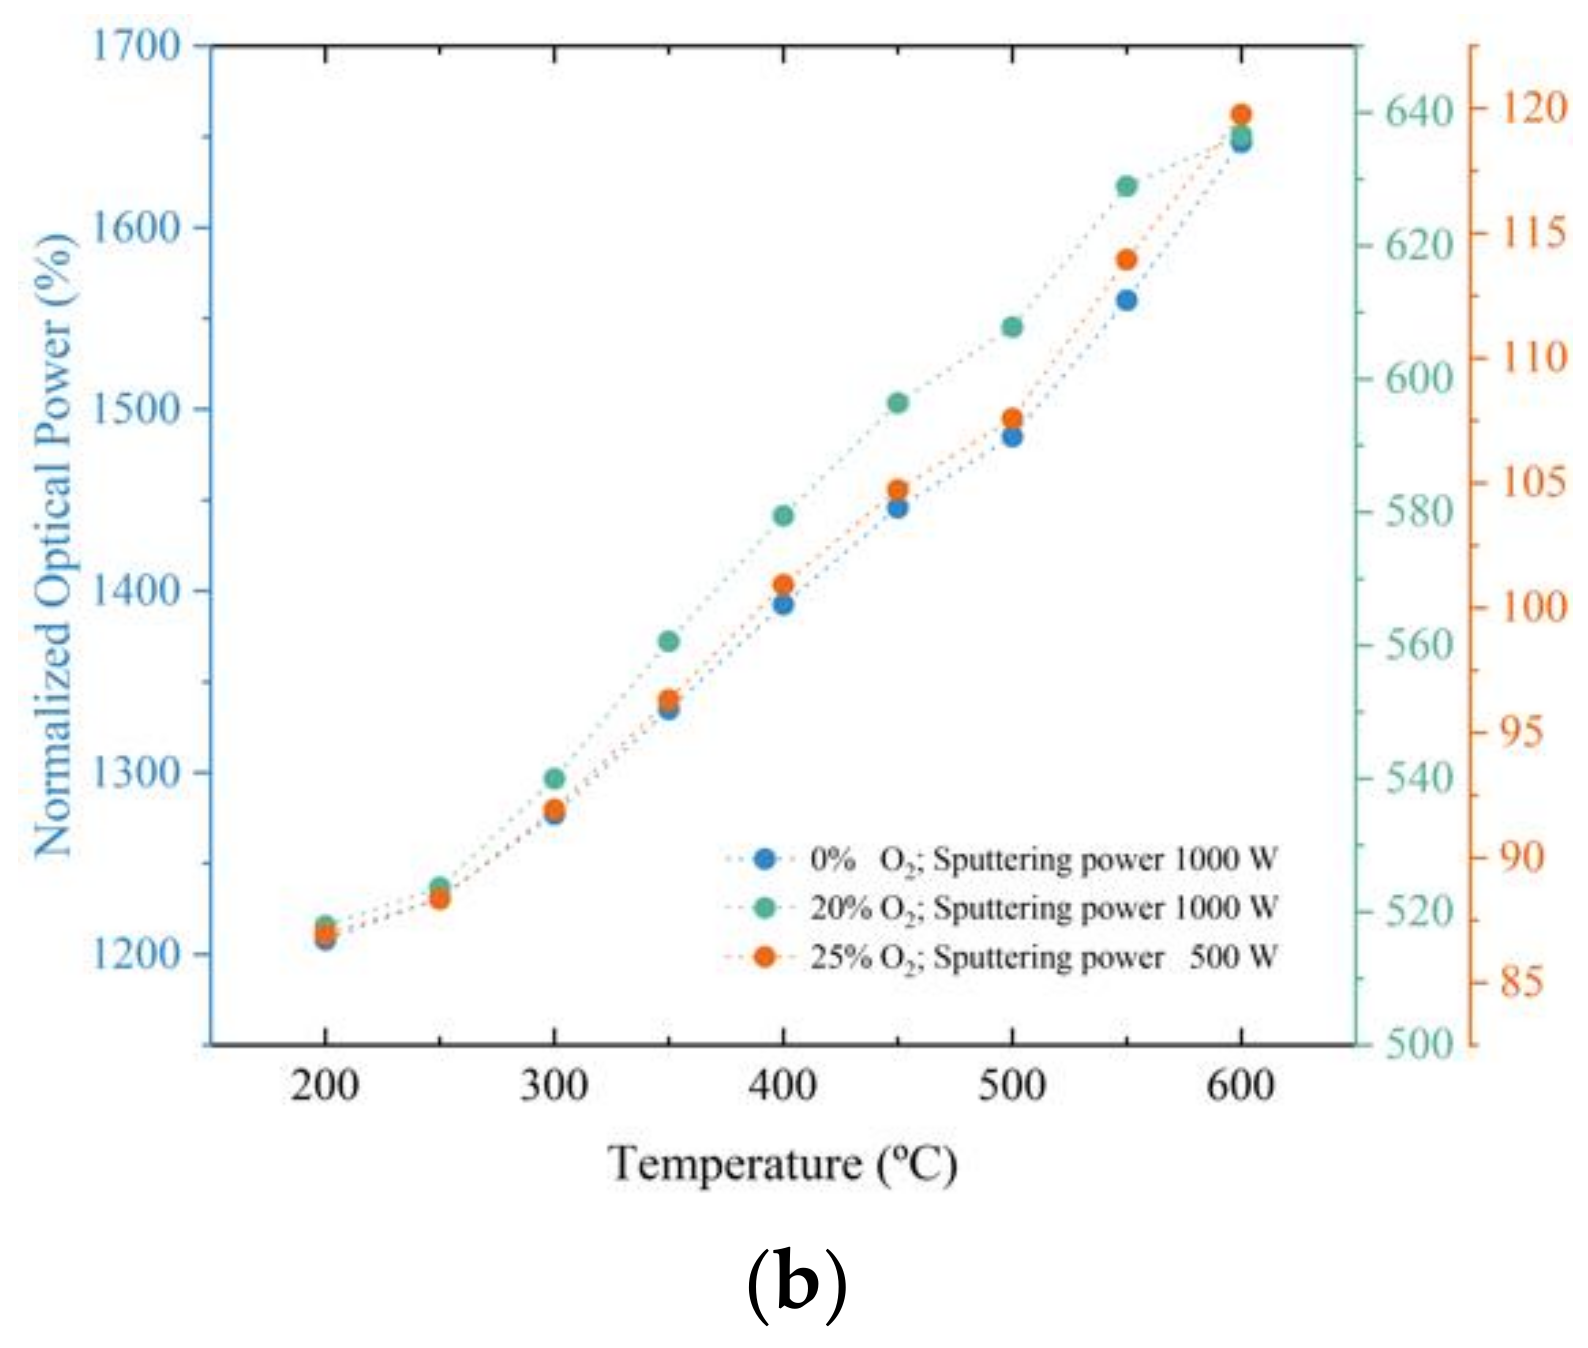
3.2.1. Temperature Sensor Characterization

One important characteristic of fiber coatings for sensing applications is their stability with temperature. To study this feature, the samples fabricated with the highest reflectivity, namely Ti (deposited with 0% O2) and TiO2 deposited with 20% O2, both produced with an applied power of 1000 W, and TiO2 deposited with 25% O2 and an applied power of 500 W, were subjected to a temperature cycle from 200 to 600 °C. The samples were placed on a tubular oven, at room temperature, and the temperature was slowly increased up to 600 °C and, afterwards, the temperature was slowly decreased down to 200 °C. The reflectivity variation, shown in Figure 8a, presents a similar variation for the three samples. The variation of reflectivity at a wavelength equal to 1590 nm was also determined, as presented in Figure 8b. It is possible to observe that the three samples followed a similar monotonic increase tendency at the studied wavelength. Moreover, the reflectivity reverted to the initial values when the temperature reached room temperature. Therefore, this study reveals that these films can be used for sensing at high temperatures.

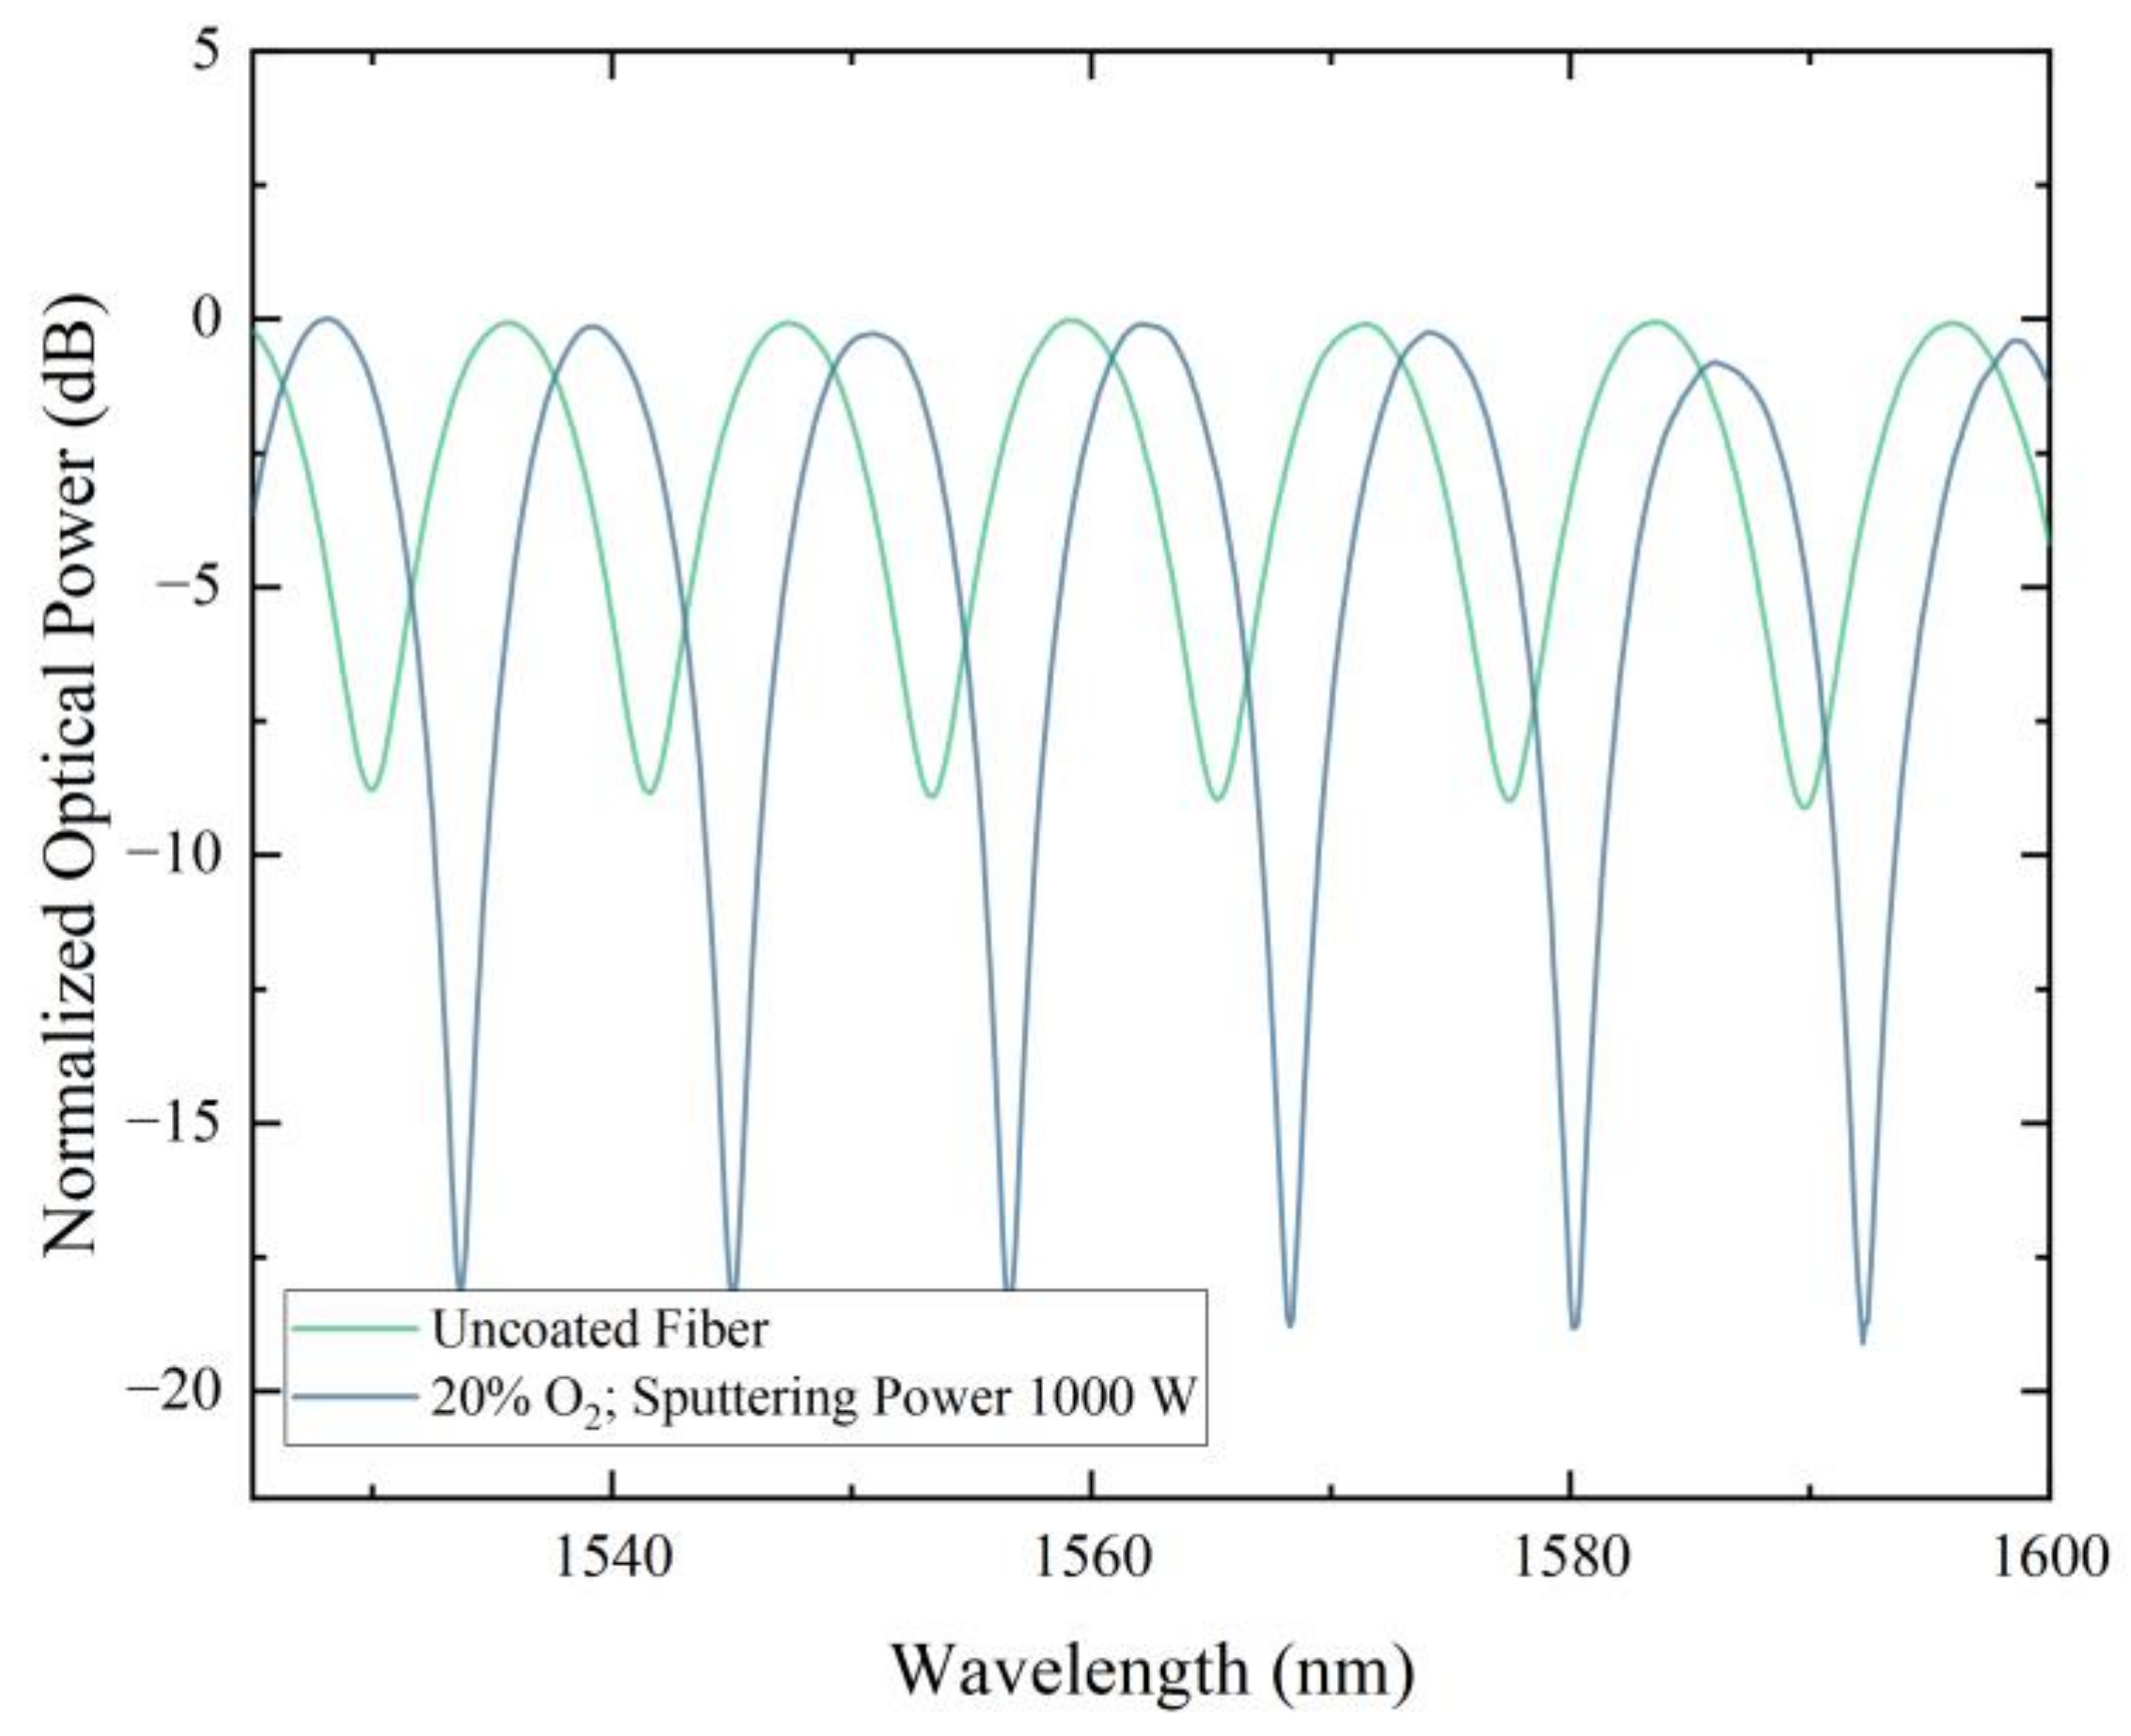
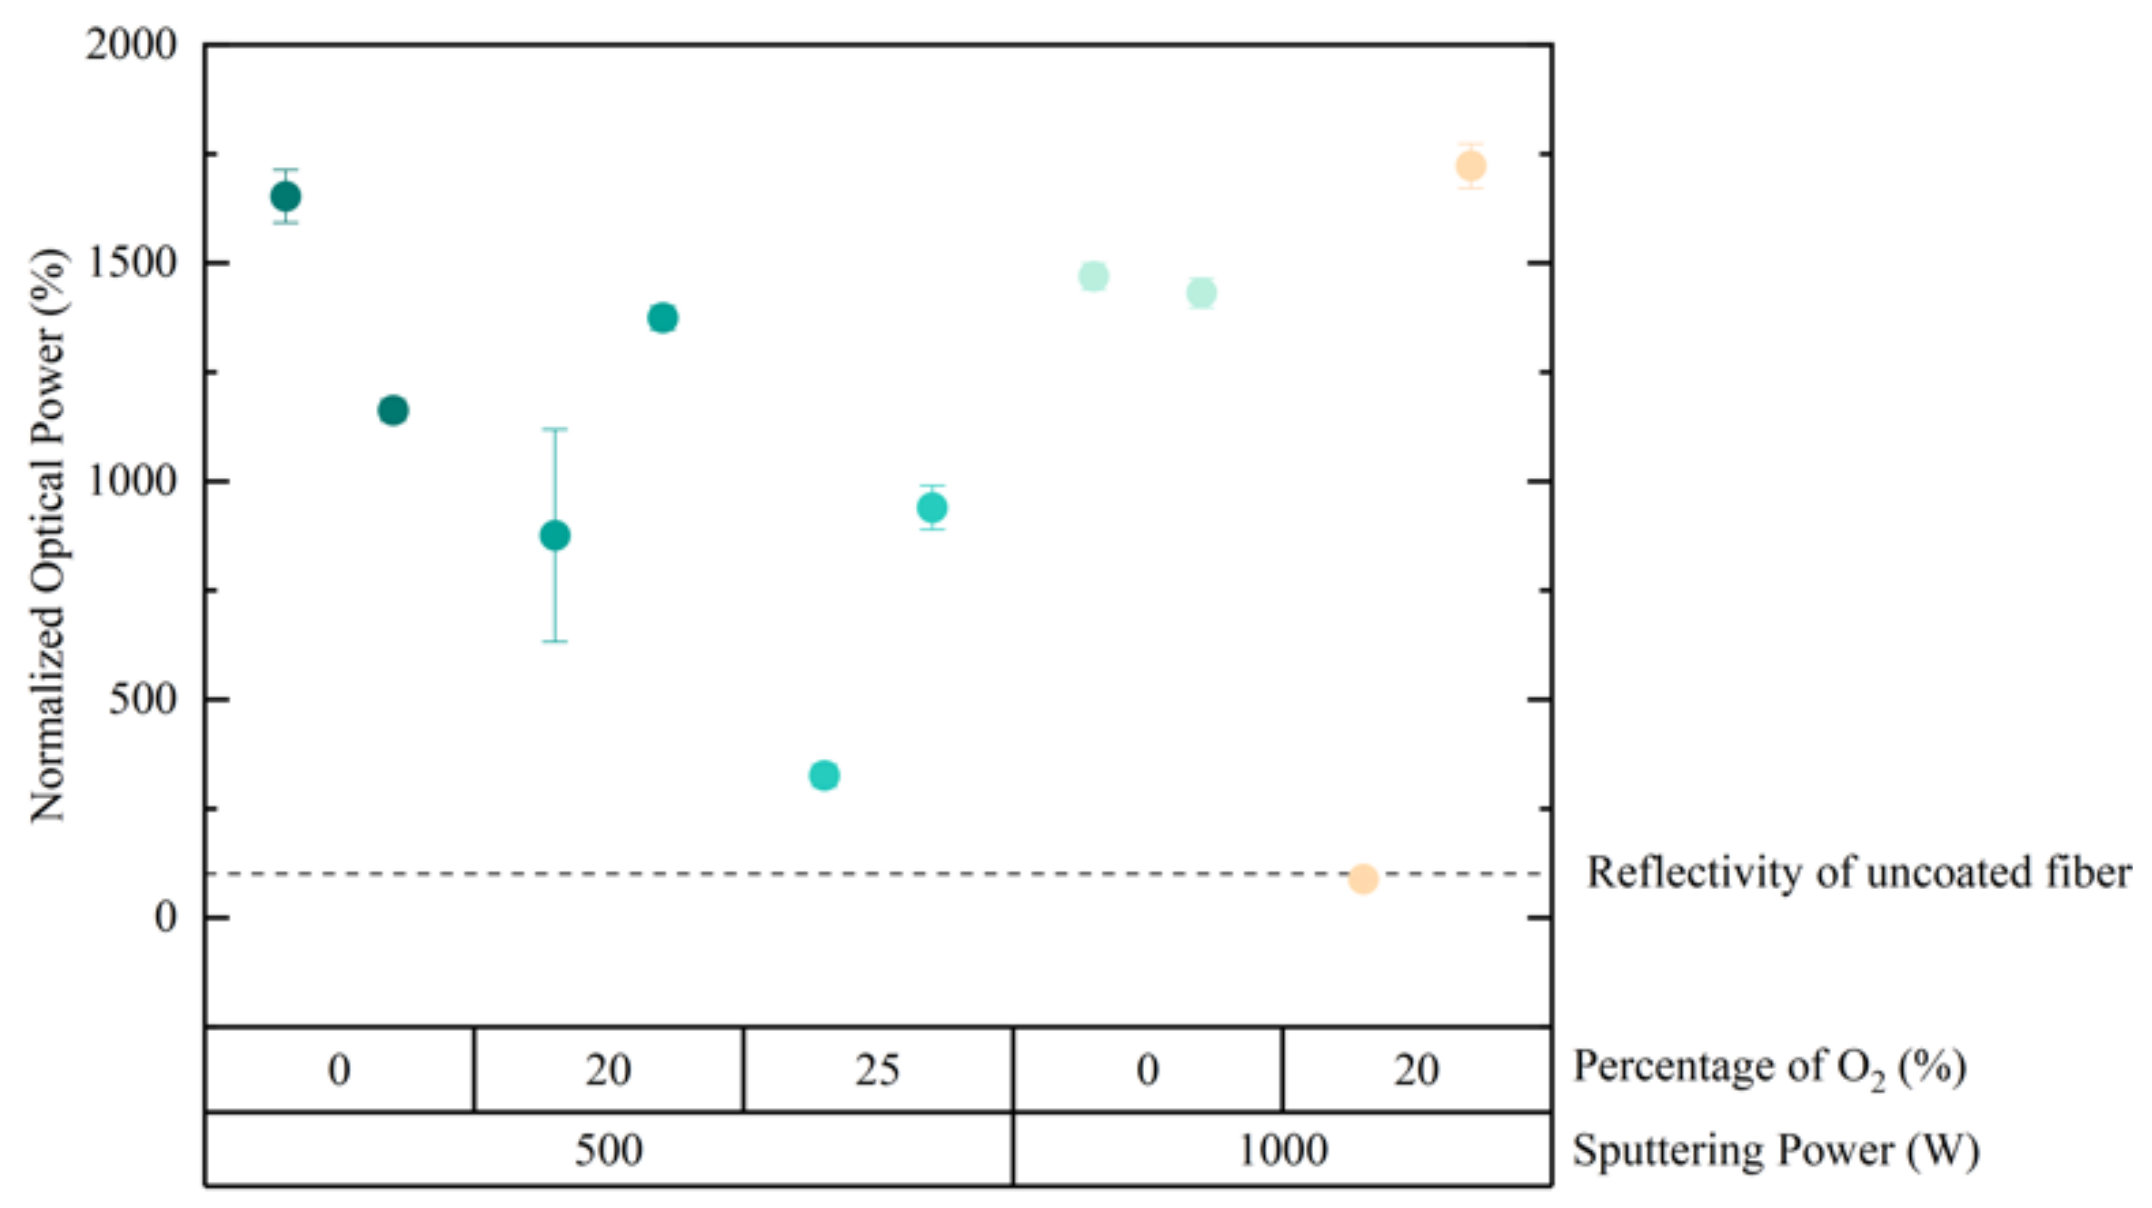
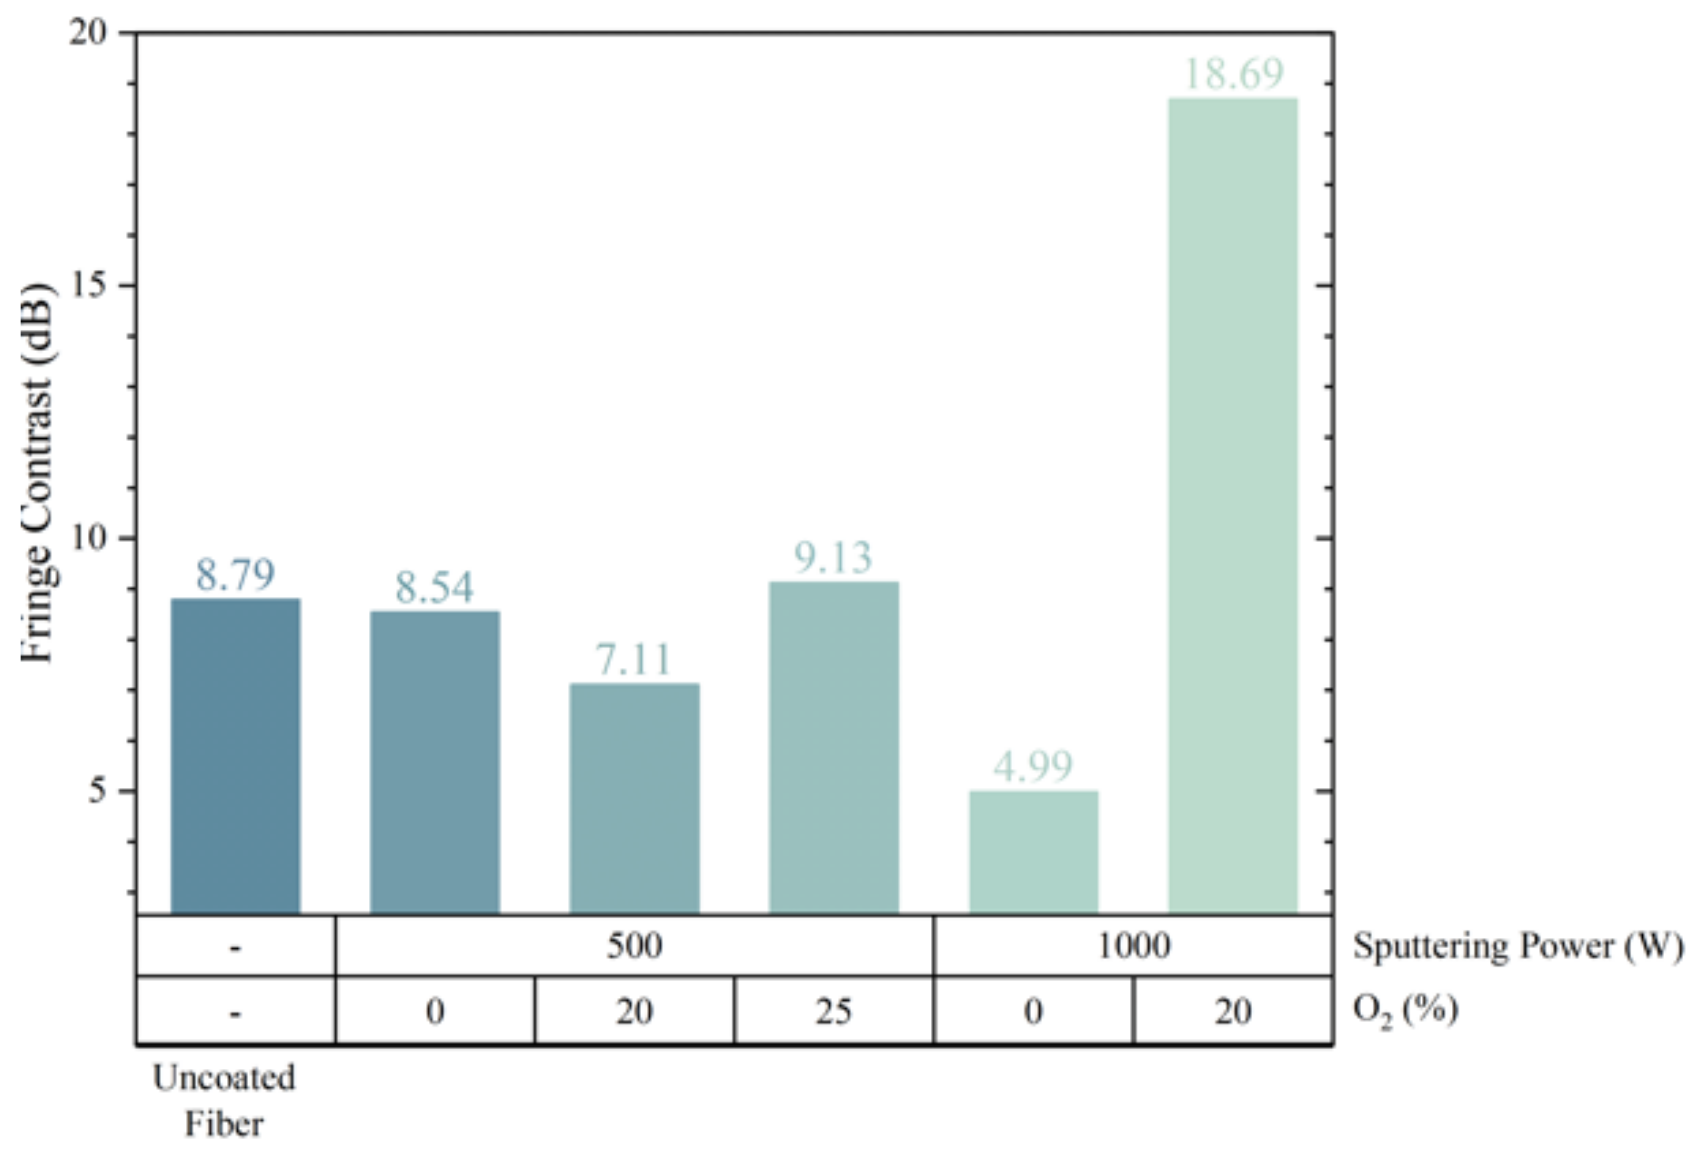
3.2.2. Fabry–Perot Microcavities with Ti and TiO2 Coatings

The study of the application of Ti and TiO2 coatings for the fabrication of Fabry–Perot cavities was achieved by using a non-coated SMF as a low-reflectivity mirror, distanced from a coated SMF. The two fibers were aligned using a splice machine in manual mode (Sumitomo Type-71C) to prevent cleaning arc discharges as it could lead to film degradation. In Figure 9, a schematic diagram of the assembled Fabry–Perot cavity is presented.
The intensity of the reflected light can be approximated to:
I r λ = I 1 + I 2 2 I 1 I 2 c o s 4 π n L λ
where I 1 , 2 are, respectively, the intensities of the light that is reflected in the non-coated fiber surface and in the TiO2 coated fiber, n is the refractive index of the cavity, L is the cavity length given by the spacing between the two fibers, and λ is the light wavelength. In the present case, the refractive index of the cavity is equal to the value for air, which is approximately 1. The intensity of the reflected light ( I 1 , 2 ) is intrinsically dependent on surface reflectivity, affecting the spectrum amplitude and visibility and, therefore, the cavity’s finesse.
Different Fabry–Perot cavities were created for the different Ti and TiO2 samples. For comparison, the reflected spectrum of a cavity formed by two uncoated SMFs was also attained. All the created cavities presented a similar cavity length around 100 µm. Figure 10 presents the comparison between the Fabry–Perot cavity formed by uncoated fibers and with the TiO2 film deposited with 20% O2 and an applied power of ~1000, which presented a higher reflectance. A high increase of visibility in the coated fiber can be observed, with a fringe contrast increase from 8.79 to 18.69 dB, representing an increase of 9.9 dB.
For each cavity, the sample that exhibited a higher reflectance was chosen. In Figure 11, the fringe contrast results are summarized. It can be observed that, although all samples exhibited a higher reflectance than that of an uncoated SMF, not all samples resulted in a higher fringe contrast and, therefore, a higher finesse. This can be due to surface irregularities or due to the oxidation of the outer surface of the Ti and TiO2 coatings.

4. Conclusions

This work reports the deposition of titanium and titanium dioxide thin films on glass supports and on optical fibers, by DC magnetron sputtering, for applications in optical fiber sensing. Through X-ray diffraction analysis, it was confirmed that most of the deposited films were crystalline and the TiO2 films exhibited the presence of the metallic titanium apart from the anatase phase. Additionally, scanning electron microscopy showed that the surface of the Ti films was rougher than the surface of the TiO2 films.
The sputtering parameters that showed the most promising results for the development of sensors were used for deposition on cleaved optical fibers. After testing the reflectivity of the fibers coated with the thin films, it was confirmed that the Ti or TiO2 coatings led to optical fibers with a greater reflectivity when compared to uncoated fibers.
Possible application of these films for Fabry–Perot cavity fabrication was also studied: a great increase of fringe contrast and finesse was attained for a TiO2 film deposited with 20% O2 concentration and fabricated with a sputtering power of ~1000 W, evidencing that coatings with higher TiO2 anatase phase crystallinity and a smooth surface may have more potential for this application. The results further show that TiO2 thin films can be applied to the fabrication of Fabry–Perot cavities for sensing, resulting in sensors capable of operation in harsh environments with high temperatures.

Author Contributions

Conceptualization, D.S., C.S.M., O.F., P.A.R. and S.S.; methodology, D.S. and C.S.M.; software, D.S. and C.S.M.; validation, S.O.S., O.F., M.R., P.A.R. and S.S.; formal analysis, D.S., C.S.M., P.A.R., O.F. and S.S.; investigation, D.S., C.S.M., P.A.R., O.F. and S.S.; resources, S.O.S., O.F., J.V.P., M.R., P.A.R. and S.S.; data curation, D.S.; writing—original draft preparation, D.S., C.S.M., O.F., P.A.R. and S.S.; writing—review and editing, C.S.M., O.F., P.A.R. and S.S.; supervision, O.F., P.A.R. and S.S; project administration, O.F., P.A.R. and S.S.; funding acquisition, S.O.S., O.F., J.V.P., M.R., P.A.R. and S.S. All authors have read and agreed to the published version of the manuscript.

Funding

The research leading to these results has received funding from the Portuguese funding agency FCT—Fundação para a Ciência e a Tecnologia—within project UID/FIS/04559/2020 to LIBPhys-UNL and from the FCT/MCTES/PIDDAC. C.S.M. was financed by the FCT—Portuguese national funding agency for science, research and technology—through grant number SFRH/BD/135820/2018.

Acknowledgments

The authors acknowledge Isabel Nogueira from Microlab, IST, for the SEM measurements.

Conflicts of Interest

The authors declare no conflict of interest.

References

  1. Rajan, G. Introduction to optical fiber sensors. In Optical Fiber Sensors: Advanced Techniques and Applications, 1st ed.; Rajan, G., Iniewski, K., Eds.; CRC Press: Boca Raton, FL, USA, 2017; p. 1. [Google Scholar]
  2. Jackson, D.A.; Jones, J.D.C. Fibre optic sensors. Opt. Acta Int. J. Opt. 1986, 33, 1469–1503. [Google Scholar] [CrossRef]
  3. Udd, E. The emergence of fiber optic sensor technology. In Fiber Optic Sensors: An Introduction for Engineers and Scientists, 2nd ed.; Udd, E., Spillman, W.B., Eds.; John Wiley & Sons: Hoboken, NJ, USA, 2011. [Google Scholar]
  4. Rao, Y.J.; Deng, M.; Duan, D.W.; Zhu, T. In-line fiber Fabry-Perot refractive-index tip sensor based on endlessly photonic crystal fiber. Sens. Actuators A Phys. 2008, 148, 33–38. [Google Scholar] [CrossRef]
  5. Rao, Y.-J. Recent progress in fiber-optic extrinsic Fabry-Perot interferometric sensors. Opt. Fiber Technol. 2006, 12, 227–237. [Google Scholar] [CrossRef]
  6. Kirkendall, C.K.; Dandridge, A. Overview of high performance fibre-optic sensing. J. Phys. Appl. Phys. 2004, 37, R197–R216. [Google Scholar] [CrossRef]
  7. Zhao, J.R.; Huang, X.G.; He, W.X.; Chen, J.H. High-resolution and temperature-insensitive fiber optic refractive index sensor based on fresnel reflection modulated by Fabry-Perot interference. J. Lightwave Technol. 2010, 28, 2799–2803. [Google Scholar] [CrossRef]
  8. Lee, C.L.; Hsu, J.M.; Horng, J.S.; Sung, W.Y.; Li, C.M. Microcavity fiber Fabry-Perot interferometer with an embedded golden thin film. IEEE Photonics Technol. Lett. 2013, 25, 833–836. [Google Scholar] [CrossRef]
  9. Sun, B.; Wang, Y.; Qu, J.; Liao, C.; Yin, G.; He, J.; Zhou, J.; Tang, J.; Liu, S.; Li, Z.; et al. Simultaneous measurement of pressure and temperature by employing Fabry-Perot interferometer based on pendant polymer droplet. Opt. Express 2015, 23, 1906–1911. [Google Scholar] [CrossRef] [Green Version]
  10. Zhou, A.; Qin, B.; Zhu, Z.; Zhang, Y.; Liu, Z.; Yang, J.; Yuan, L. Hybrid structured fiber-optic Fabry-Perot interferometer for simultaneous measurement of strain and temperature. Opt. Lett. 2014, 39, 5267–5270. [Google Scholar] [CrossRef]
  11. Choi, H.Y.; Park, K.S.; Park, S.J.; Paek, U.C.; Lee, B.H.; Choi, E.S. Miniature fiber-optic high temperature sensor based on a hybrid structured Fabry-Perot interferometer. Opt. Lett. 2008, 33, 2455–2457. [Google Scholar] [CrossRef]
  12. Santos, J.L.; Farahi, F. Handbook of Optical Sensors, 1st ed.; CRC Press Taylor & Francis Group: London, UK, 2014; p. 368. [Google Scholar]
  13. Xiao, G.Z.; Adnet, A.; Zhang, Z.; Sun, F.G.; Grover, C.P. Monitoring changes in the refractive index of gases by means of a fiber optic Fabry-Perot interferometer sensor. Sens. Actuators A Phys. 2005, 118, 177–182. [Google Scholar] [CrossRef]
  14. Yang, M.; Dai, J. Review on optical fiber sensors with sensitive thin films. Photonic Sens. 2012, 2, 14–28. [Google Scholar] [CrossRef] [Green Version]
  15. Rivero, P.J.; Goicoechea, J.; Arregui, F.J. Layer-by-layer nano-assembly: A powerful tool for optical fiber sensing applications. Sensors 2019, 19, 683. [Google Scholar] [CrossRef] [PubMed] [Green Version]
  16. Wang, B.; Wei, S.; Guo, L.; Wang, Y.; Liang, Y.; Xu, B.; Pan, F.; Tang, A.; Chen, X. Effect of deposition parameters on properties of TiO2 films deposited by reactive magnetron sputtering. Ceram. Int. 2017, 43, 10991–10998. [Google Scholar] [CrossRef]
  17. Xi, B.; Verma, L.K.; Li, J.; Bhatia, C.S.; Danner, A.J.; Yang, H.; Zeng, H.C. TiO2 thin films prepared via adsorptive self-assembly for self-cleaning applications. ACS Appl. Mater. Interfaces 2012, 4, 1093–1102. [Google Scholar] [CrossRef] [PubMed]
  18. Antony, R.P.; Mathews, T.; Dash, S.; Tyagi, A.K. Kinetics and physicochemical process of photoinduced hydrophobic ↔ superhydrophilic switching of pristine and N-doped TiO2 nanotube arrays. J. Phys. Chem. C 2013, 117, 6851–6860. [Google Scholar] [CrossRef]
  19. Praveen, P.; Viruthagiri, G.; Mugundan, S.; Shanmugam, N. Structural, optical and morphological analyses of pristine titanium di-oxide nanoparticles—Synthesized via sol-gel route. Spectrochim. Acta Part A Mol. Biomol. Spectrosc. 2017, 117, 622–629. [Google Scholar] [CrossRef]
  20. Inci, M.N.; Kidd, S.R.; Barton, S.; Jones, J.D.C. Fabrication of single-mode fibre optic Fabry-Perot interferometers using fusion spliced titanium dioxide optical coatings. Meas. Sci. Technol. 1992, 3, 678–684. [Google Scholar] [CrossRef]
  21. Hirsch, M.; Majchrowicz, D.; Wierzba, P.; Weber, M.; Bechelany, M.; Jędrzejewska-Szczerska, M. Low-coherence interferometric fiber-optic sensors with potential applications as biosensors. Sensors 2017, 17, 261. [Google Scholar] [CrossRef] [Green Version]
  22. Yusoff, S.F.A.Z.; Lim, C.S.; Azzuhri, S.R.; Ahmad, H.; Zakaria, R. Studies of Ag/TiO2 plasmonics structures integrated in side polished optical fiber used as humidity sensor. Results Phys. 2018, 10, 308–316. [Google Scholar] [CrossRef]
  23. Deng, Y.; Li, M.; Cao, W.; Wang, M.; Hao, H.; Xia, W.; Su, F. Fiber optic coupled surface plasmon resonance sensor based Ag-TiO2 films for hydrogen detection. Opt. Fiber Technol. 2021, 65, 102616. [Google Scholar] [CrossRef]
  24. Pathak, A.K.; Bhardwaj, V.; Gangwar, R.K.; De, M.; Singh, V.K. Fabrication and characterization of TiO2 coated cone shaped nano-fiber pH sensor. Opt. Commun. 2017, 386, 43–48. [Google Scholar] [CrossRef]
  25. Zhang, H.; Chen, Y.; Wang, H.; Hu, S.; Xia, K.; Xiong, X.; Huang, W.; Lu, H.; Yu, J.; Guan, H.; et al. Titanium dioxide nanoparticle modified plasmonic interface for enhanced refractometric and biomolecular sensing. Opt. Express 2018, 26, 33226. [Google Scholar] [CrossRef] [PubMed]
  26. Wang, T.; Zhang, M.; Liu, K.; Jiang, J.; Zhao, Y.; Ma, J.; Liu, T. The effect of the TiO2 film on the performance of the optical fiber SPR sensor. Opt. Commun. 2019, 448, 93–97. [Google Scholar] [CrossRef]
  27. Ran, Z.; Rao, Y.; Zhang, J.; Liu, Z.; Xu, B. A miniature fiber-optic refractive-index sensor based on laser-machined Fabry-Perot interferometer tip. J. Light. Technol. 2009, 27, 5426–5429. [Google Scholar] [CrossRef]
  28. Jiang, M.; Li, Q.; Wang, J.; Jin, Z.; Sui, Q.; Ma, Y.; Shi, J.; Zhang, F.; Jia, L.; Yao, W.; et al. TiO2 nanoparticle thin film-coated optical fiber Fabry-Perot sensor. Opt. Express 2013, 21, 3083. [Google Scholar] [CrossRef] [PubMed]
  29. Hirsch, M. Optical properties of thin TiO2 film deposited on the fiber optic sensor head. In Proceedings of the Photonics Applications in Astronomy, Communications, Industry, and High Energy Physics Experiments 2017, Wilga, Poland, 29 May–4 June 2017; p. 10445. [Google Scholar]
  30. Chauhan, M.; Singh, V.K. A fiber optic refractive index sensor using a high index layer of TiO2. In Proceedings of the 3RD International Conference on Condensed Matter and Applied Physics (ICC-2019), Bikaner, India, 14–15 October 2020; p. 2220. [Google Scholar]
  31. Tien, C.L.; Lin, H.Y.; Su, S.H. High sensitivity refractive index sensor by D-shaped fibers and titanium dioxide nanofilm. Adv. Condens. Matter Phys. 2018, 2018, 2303740. [Google Scholar] [CrossRef] [Green Version]
  32. Sério, S.; Jorge, M.E.M.; Maneira, M.J.P.; Nunes, Y. Influence of O2 partial pressure on the growth of nanostructured anatase phase TiO2 thin films prepared by DC reactive magnetron sputtering. Mater. Chem. Phys. 2011, 126, 73–81. [Google Scholar] [CrossRef]
  33. Madsen, N.D.; Christensen, B.H.; Louring, S.; Berthelsen, A.N.; Almtoft, K.P.; Nielsen, L.P.; Bøttiger, J. Controlling the deposition rate during target erosion in reactive pulsed DC magnetron sputter deposition of alumina. Surf. Coat. Technol. 2012, 206, 4850–4854. [Google Scholar] [CrossRef]
  34. Alfonso, E.; Olaya, J.; Cubillos, G. Thin Film Growth Through Sputtering Technique and Its Applications. In Crystallization—Science and Technology; Andreeta, M.R.B., Ed.; IntechOpen: London, UK, 2012. [Google Scholar]
  35. Grao, M.; Ratova, M.; Amorim, C.C.; Marcelino, R.B.P.; Kelly, P. Crystalline TiO2 supported on stainless steel mesh deposited in a one step process via pulsed DC magnetron sputtering for wastewater treatment applications. J. Mater. Res. Technol. 2020, 9, 5761–5773. [Google Scholar] [CrossRef]
Figure 1. Experimental setup of the reflectivity test carried out on the optical fibers.
Photonics 09 00342 g001
Figure 2. Reflectance spectra of Ti and TiO2 films deposited with 0%, 20%, and 30% O2 in the Ar/O2 mixture, an applied power of 500 W, and a working pressure of (a) 1.0 Pa and (b) 0.8 Pa.
Photonics 09 00342 g002
Figure 3. Reflectance spectra of Ti and TiO2 films deposited with 0%, 20%, and 30% O2 in the Ar/O2 mixture, an applied power of 1000 W, and a working pressure of (a) 1.0 Pa and (b) 0.8 Pa.
Photonics 09 00342 g003aPhotonics 09 00342 g003b
Figure 4. Reflectance spectra of Ti and TiO2 films deposited onto glass substrates with a working pressure of 0.8 Pa, which were deposited simultaneously with the corresponding optical fibers coatings, at (a) 0% and 25% O2 in the Ar/O2 mixture and an applied power of 1000 W and (b) 0%, 20%, and 25% O2 in the Ar/O2 mixture and an applied power of 500 W.
Photonics 09 00342 g004
Figure 5. X-ray diffractograms of Ti and TiO2 thin films deposited at 0%, 20%, and 30% O2 in the Ar/O2 mixture with working pressure of 0.8 Pa and applied power of (a) 500 W and (b) 1000 W.
Photonics 09 00342 g005aPhotonics 09 00342 g005b
Figure 6. SEM images with 60,000 times magnification for Ti and TiO2 films obtained with a working pressure of 0.8 Pa, at different percentages of O2 and power equal to (ac) 500 W and (d,e) 1000 W.
Photonics 09 00342 g006
Figure 7. Mean value of the normalized optical power variation between different Ti and TiO2 samples deposited with different % O2 and applied power for wavelengths between 1525 and 1600 nm.
Photonics 09 00342 g007
Figure 8. Variation of the normalized reflected optical power with temperature for three samples sputtered with different concentration of O2 and sputtering power (a) in the range between 1580 and 1600 nm and (b) at a wavelength of 1590 nm.
Photonics 09 00342 g008aPhotonics 09 00342 g008b
Figure 9. Schematic diagram of a Fabry–Perot cavity, with the primary reflected waves and cavity length also depicted.
Photonics 09 00342 g009
Figure 10. Reflected spectrum of the Fabry–Perot cavities created with uncoated fibers and with a TiO2 coated fiber deposited with 20% O2 and a sputtering power ~1000 W.
Photonics 09 00342 g010
Figure 11. Fringe contrast results of Ti and TiO2 thin films deposited with different sputtering parameters.
Photonics 09 00342 g011
Table 1. Summary of the sputtering conditions of the TiO2 and Ti thin films deposited onto glass substrates and optical fibers.
O2 (%)PT (Pa)P (W)U (V)I (A)t (min)
00.805302381.8715
200.805403021.7815
250.815403021.7815
300.825404001.3415
00.8110203303.1015
00.8210403103.3415
200.8210203303.1015
200.8110202484.1215
300.8110403103.3415
01.005403301.6315
201.005403101.7315
301.005503691.4815
01.0010203303.1015
201.0010403572.9015
301.0010403413.0515
Publisher’s Note: MDPI stays neutral with regard to jurisdictional claims in published maps and institutional affiliations.

