Article

Evaluation of High Resolution Melting (HRM) Analysis for Meat Species Identification of Raw and Cooked Meat

by
Peyman Gholamnezhad
1,
Hamed Ahari
2,*,
Gholamreza Nikbakht Brujeni
3,
Seyed Amir Ali Anvar
1 and
Abbasali Motallebi
1
1
Department of Food Hygiene, Science and Research Branch, Islamic Azad University, Tehran 1477893855, Iran
2
Department of food Science and Technology, Science and Research Branch, Islamic Azad University, Tehran 1477893855, Iran
3
Department of Microbiology and Immunology, Faculty of Veterinary Medicine, University of Tehran, Tehran 1419963111, Iran
*
Author to whom correspondence should be addressed.
Separations 2021, 8(8), 116; https://doi.org/10.3390/separations8080116
Submission received: 28 June 2021 / Revised: 26 July 2021 / Accepted: 3 August 2021 / Published: 8 August 2021

Abstract

:
The current study aimed to examine a real-time PCR assay with high-resolution melting (HRM) analysis for the species identification of minced meat samples. Meat samples from several animal species were purchased and minced separately or as a mixture of two species. DNA was extracted from all meat samples and subjected to real-time PCR assay by amplifying species-specific mitochondrial cytochrome b regions. Regarding the meat mixtures, two separate melting curves with specific melt peak temperatures (Tm) were detected. Additionally, DNA from each species was quantified, based on the calibration curves. The results showed that a real-time PCR assay with HRM analysis is suitable for the species identification of meat products, and could be used for the detection of meat frauds.

1. Introduction

Since ancient times, meat has been considered a primary food source in people’s daily diet. It is recognized as a valuable source of proteins, including all essential amino acids necessary for human health. It is also rich in essential fatty acids and micronutrients, such as iron, zinc, selenium, magnesium, folic acid, and vitamin B12 [1,2]. Minced or ground meat of different animal species (mainly beef) is one of the most popular meat products, and is widely used in many recipes, including pizza, hamburgers, sausages, and kebabs around the world [3]. Among different meat products, minced meat is most commonly subjected to adulteration, since after chopping and mixing with other ingredients, it is not possible to distinguish all of the raw components. Therefore, due to the increasingly common use of minced meat in processed foods, especially in modern societies, manufacturers must correctly label their meat products.
Over the past few decades, regarding the increased rate of fraud in the process of preparing meat products from meat sources with a low nutritional value, the reliability of labeled meat products has been suspected by consumers, and significant concerns have been raised regarding the use of meat products [4]. To detect any probable toxicity and contamination in meat products for the safety of foodstuff and to gain the consumers’ confidence, the use of rapid and reliable methods for the authentication of meat products can be of essential importance. Some of these methods depend on near-infrared (NIR) technologies combined with chemometrics [5], the detection of species-specific proteins by enzyme-linked immunosorbent assay (ELISA) [6], and the detection of DNA molecules by polymerase chain reaction (PCR) [7]. Bargen et al. (2014) introduced a new high-performance liquid chromatography mass spectrometry (HPLC–MS/MS)-based method as a specific and sensitive method for detecting marker peptides to discriminate pork from horse meat in processed foods [8]. Besides standard techniques for meat authentication, genetic and DNA-based approaches have recently received major attention due to some valuable characteristics, including their high sensitivity, specificity, reliability and feasibility, as well as their rapid processing time, high throughput, low cost, and applicability for various foods (raw, precooked, and cooked) with different animal species origins [9]. Some DNA-based techniques for food authentication include PCR-restriction fragment length polymorphism (RFLP) techniques [10], sequence-specific gene assays [11], and real-time PCR [12].
The PCR technique is widely used because of its high sensitivity, feasibility, and ease of use, and it is regarded as a reliable technique for detecting meat frauds [13]. Sensitive PCR assays as popular techniques for DNA detection can be used when primers target multicopy genes, including mitochondrial DNA (mtDNA) genes such as 12S rRNA and cytochrome b, which are commonly used due to their sequence diversity and the presence of multicopy genes [14]. In a previous study, the cytochrome b fragment of the mtDNA gene was used as the target to distinguish the species origin of meat samples. In that study, after aligning the cytochrome b gene sequence in pork, chicken, beef, mutton, and horse meat according to the NCBI database, forward and reverse primers, as well as TaqMan MGB probes, were used for each species-specific region [15].
Today, the use of quantitative DNA-based methods, such as real-time PCR and high-resolution melting (HRM) analysis, seems to be more effective and reliable than other methods, given their high sensitivity and accuracy [16]. These methods are novel homogeneous methods that have been developed after PCR amplification, in which a fluorescence-rich region is amplified in double-stranded DNA [17]. A real-time PCR assay with HRM analysis can distinguish nucleic acid samples, based on sequence, length, and GC content. This technique is based on the pattern of the double-stranded DNA melting curve at a specific temperature, and is highly dependent on the primers used [18].
The use of real-time PCR with HRM analysis is a high-quality technique for the identification of target genes in unknown samples (e.g., species origin of the minced meat). Additionally, the use of specific primers and appropriate target regions plays an important role in enhancing the accuracy of this technique [12]. Over the past few decades, significant advances in real-time PCR techniques have made them more useful for food quality analyses and the detection of adulteration in the food industry. The qPCR method has overcome the limitations of other techniques in terms of sensitivity, cost, time, analysis of multiple samples, and applicability for a wide range of targets (e.g., various food ingredients derived from a different plant or animal species), even at low concentrations in highly processed foods [12]. Jian Ye et al. (2016) used TaqMan probe-based real-time PCR assays to identify four common squid species in single and mixed samples [19]. Mane et al. (2011) also identified adulteration in buffalo meat by amplifying species-specific mitochondrial DNA regions in PCR assays [20]. Regarding this research background, it was assumed that a qPCR-HRM technique using a more sensitive dye, such as Syto 9, would be applicable for meat species identification in minced meat products. Thus, the present study aimed to investigate species identification by real-time PCR assay with HRM analysis in raw and cooked minced meat from one single animal species or a mixture of two different species.

2. Materials and Methods

2.1. Sample Preparations

A total of 40 samples were evaluated in this study. Meat samples from five animal species including cattle, sheep, chicken, turkey and pig were provided for this research. Beef, mutton, chicken, and turkey samples were purchased from a reliable hypermarket in Tehran city, Iran. All the provided meat samples had received a valid operating license from the veterinary organization of Iran. The pork samples were obtained from the food outlets of religious minorities in Tehran. Iran. Then, the meat samples were prepared, according to the Institute of Standards and Industrial Research of Iran (No. 4622). Briefly, the meat samples of each species were separately minced. Then, to prepare different meat products containing 10 and 20% of the desired meat type, the minced meat of five animal species was separately mixed with food additives including salt, spices, and toasted flour, according to the standard formula used in the production of sausages, hot dogs, and hamburgers in meat product factories in Iran. The proportion of spices to flour was 20 to 80% and the ratio of flour and spices to meat was proportional to the meat percentage. For example, for preparing 10% meat samples, 10% meat was mixed with 90% additives, including 18% spices and 72% toasted flour. For 20% meat samples, the remaining 80% contents were composed of 16% spices and 64% toasted flour. Furthermore, different meat mixtures, composed of two types of meat species (at 10 and 20% of purity), were prepared based on the standard formula described above. After weighing, all raw materials were transferred to a mixer and homogenized. The samples were stored at temperatures of −18 to −20 °C until further analyses.

2.2. Study Design

The samples were classified into different groups, as shown in Table 1. Five types of minced meat from five animal species (cattle, sheep, chicken, turkey, and pig) were labeled as follows: Letters A and A+ indicate 10% raw and 10% cooked samples, respectively. Letters B and B+ demonstrate 20% raw and 20% cooked samples, respectively. Numbers 1 to 5 indicate meat samples from cattle, sheep, chicken, turkey, and pig, respectively. For binary meat mixtures, as shown in Table 2, the samples were defined as follows: Letters C1 to C3 indicate 10% raw beef samples mixed with 10% raw mutton, chicken and turkey, respectively. Letters C4 to C6 indicate 20% raw beef samples mixed with 20% raw mutton, chicken and turkey, respectively. Letters D1 to D2 mean 10% raw mutton mixed with 10% raw chicken and turkey, respectively. Letters D3 to D4 indicate 20% raw mutton mixed with 20% raw chicken and turkey, respectively. Letters E1 to E2 indicate 10 and 20% raw chicken mixed with 10 and 20% raw turkey, respectively. Letters G1 to G4 indicate 10% raw pork mixed with 10% raw chicken, turkey, beef and mutton, respectively. Finally, G5 to G8 indicate 20% raw pork mixed with 20% raw chicken, turkey, beef and mutton, respectively. Similarly, the “+” symbol indicates cooked meat samples. Three replicates were performed for molecular assessment in each group.

2.3. Molecular Assessment

2.3.1. DNA Extraction

DNA extraction from raw and cooked meat samples was carried out using a blood/tissue DNA extraction mini kit (DynaBioTM, Takapozist Co., Tehran, Iran), according to the manufacturer protocol. In brief, the meat samples were cut wth a scalpel and added to a 1.5 mL microtube. To extract genomic DNA from the cells, lysis process was performed using a lysis buffer. For this purpose, 300 µL of tissue lysis buffer (TL) and 20 µL of proteinase K were added to the samples and rigorously vortexed for 20 s. Separating the cell debris from DNA, the lysates were centrifuged (Heraeus, Thermo Fisher Scientific, Waltham, MA, USA) at 12,000 rpm for one minute. After transferring 200 µL of supernatant to a new microtube, 200 µL of binding buffer and then 200 µL of absolute ethanol were added and mixed. The entire content of the microtube was transferred to a binding column, loaded on a collection tube, and centrifuged at 5000 rpm for one minute. The column containing DNA molecules was placed on a new collection tube and washed twice with wash buffer 1 and wash buffer 2, respectively. It was then centrifuged at 8000 rpm for one minute. For eluting DNA molecules, the column was placed on a new microtube and incubated with 60 µL of elution buffer for one minute; next, it was centrifuged at 12,000 rpm for one minute. Finally, the extracted DNA samples were collected in microtubes and stored at –20 °C for further examinations. The concentration of DNA samples was determined using NanoDrop™ One/OneC Microvolume (Thermo Scientific™).

2.3.2. Real-Time PCR Assay

In this study, the cytochrome b region of mtDNA was selected as the target to detect each meat species. All primers specific to the cytochrome b regions of different meat species (cattle, sheep, chicken, turkey, and pig) were designed, according to the NCBI database (shown in Table 3). For ensuring the PCR specificity for each meat sample and its specific primers, all required controls, including NTC (no template control) and cross controls (e.g., cross-amplification of beef DNA with mutton primers and vice versa), were considered. Primer concentrations were adjusted based on band density in gel and amplification efficiency in real-time PCR. For primer optimization, varying ratios of each reverse primer mixed with the same concentration of forward primer, starting with 1:1 to 3:1 when a mix of DNA template was used. The best result in equal band density and amplification efficiency for all targets was used for further examinations.
A real-time PCR assay was performed using a real-time PCR instrument (Rotor-Gene, Qiagen). The PCR reaction mixtures were prepared in a final volume of 25 µL, containing 2 µL of DNA template (200 ng), 2.5 µL of qPCR Syto-9 Master Mix (Life Technologies Corp., Carlsbad, CA, USA), 1 µL of MgCl2, 2 µL of dNTP, 0.5 µL of each primer (10 mM), 0.2 µL of Taq polymerase enzyme, and 16.5 µL of ddH2O. For multiplex PCR, 1 µL of common forward primer and 3 µL of each of the two reverse primers related to each of the two desired species (beef and mutton, beef and chicken, etc.) were used in each PCR reaction.
The PCR thermal conditions included an initial denaturation step at 94 °C for five min, followed by 35 cycles for 30 s at 94 °C, for 30 s at 60 °C, and for 30 s at 72 °C. For qualitative examination, the amplified PCR products were visualized using 1.5% gel electrophoresis (Mupid® One, Japan).
Moreover, the sensitivity of the current real-time PCR method was evaluated by quantitative assessments. For this purpose, dilution series of DNA samples isolated from the pure meats (100%) of each species were prepared as followed: 1 (100%), 1/5 (20%), 1/25 (4%), 1/125 (0.8%), 1/625 (0.16%), and 1/3125 (0.032%). The real-time PCR assay was then performed and the standard curve of each species meat was drawn by plotting the threshold of cycle (Ct) values against DNA percentage. Next, real-time PCR was performed for DNA samples extracted from 10% and 20% minced meat products (according to Table 1), and the resulting Ct of each sample was merged in the relevant standard curve for estimating the amount DNA. The parameters of the calibration curves, including correlation coefficient (R2) and correlation slope, were determined and the PCR efficiency was calculated using the E = [10 (−1/slope) −1] formula. Additionally, the linear equation for each meat-specific calibration curve was obtained by Microsoft Excel software (version 2017).

2.3.3. HRM and Melt Curve Analysis

The HRM and melt curve analyses were performed immediately after the real-time PCR assay. By increasing the temperature, the optimal melting conditions for the differentiation of meat species was found to be 0.22 °C/s, ramping between 75 °C and 90.5 °C. All meat samples were examined, and their melting curve profiles were obtained using Rotor-Gene 1.7 software. The normalized regions of 81–89.5 were used for analyses, and identical graphs were classified in the same group at the 95% confidence interval.

2.3.4. Statistical Analysis

All experiments were performed in duplicate. All amplification plots, melting curves, and standard curves were plotted using the Rotor-Gene software (version 1.7). The data analyses were generally performed using Microsoft Excel 2017 and GraphPad prism 5. Moreover, the linear regression analyses for the standard curves were performed with GraphPad prism 5. The analyzed data are presented as the mean.

3. Results

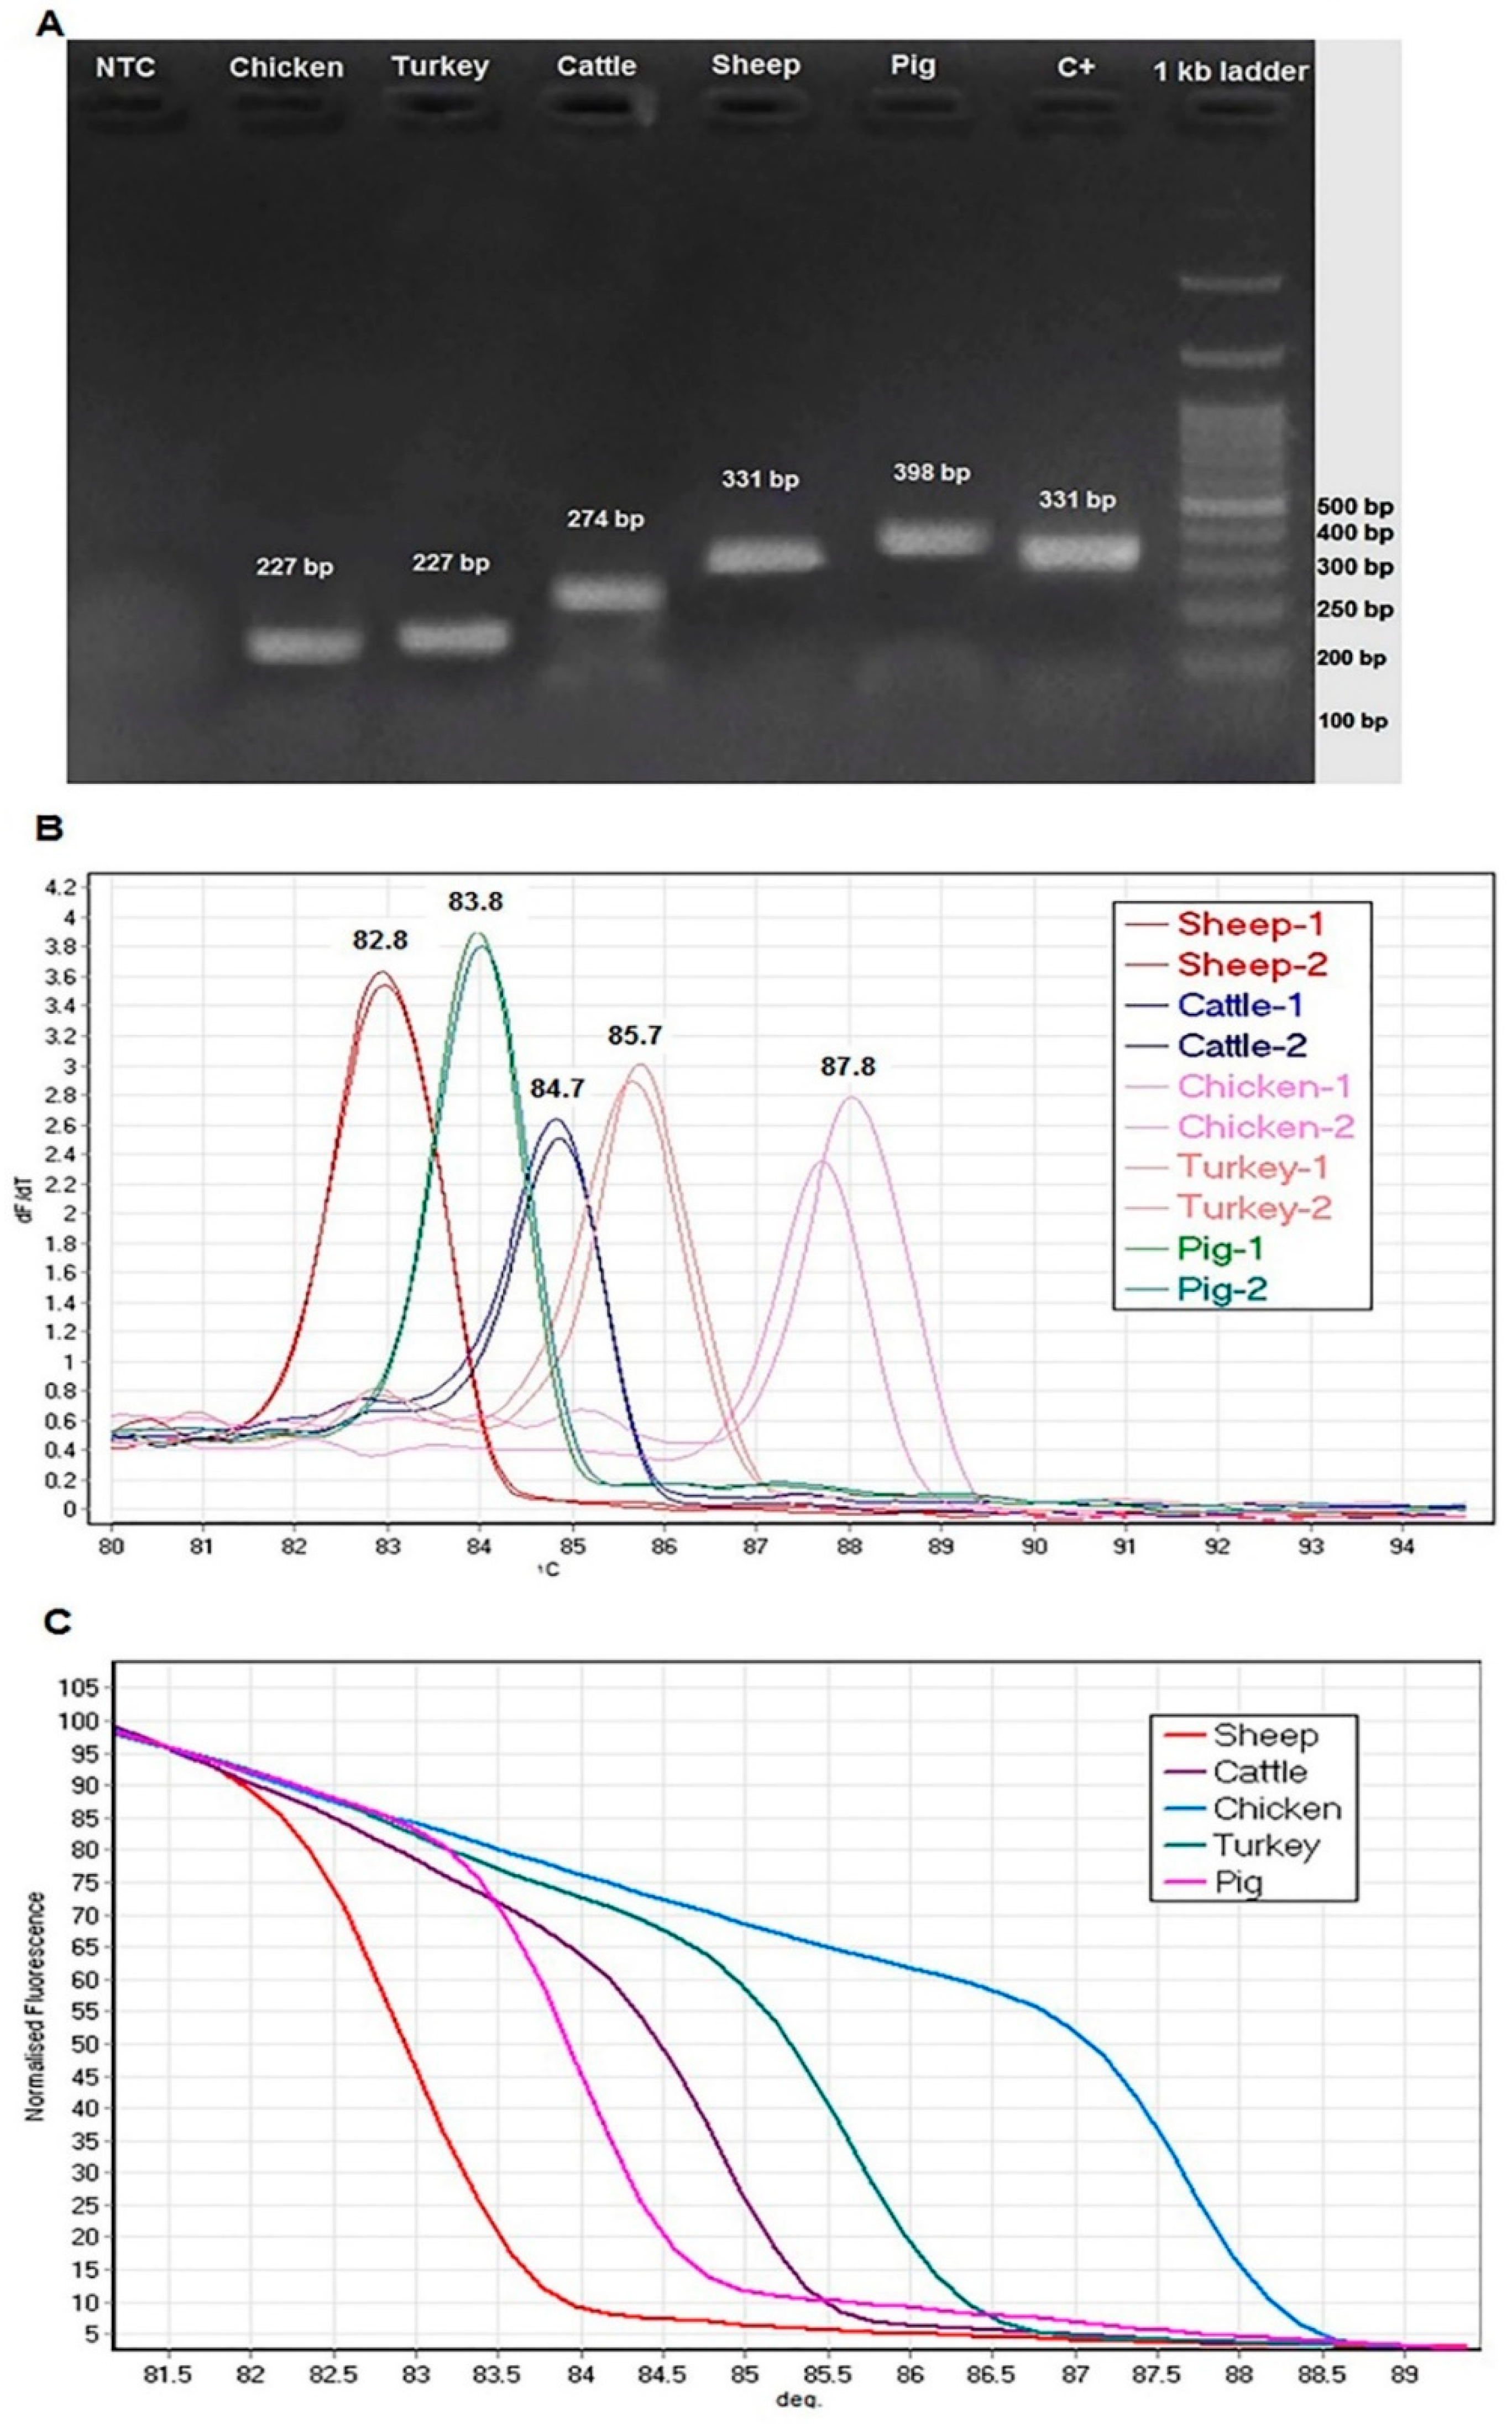
3.1. Qualitative Verification of Species-Specific Cytochrome b Fragments

The purity and proper concentrations of the extracted DNA samples were verified, as their 260/280 nm absorbance was around 1.7–1.8 and the mean concentration of samples was ~150 ng/µL. The qPCR data showed that the primers, explicitly designed for cytochrome b fragments of beef, mutton, chicken, and turkey meat, were adequately efficient. As shown in Figure 1A, the PCR product of each meat species was efficiently amplified. The lengths of species-specific amplicons were as follows: 227 bp for chicken and turkey meat; 274 bp for beef; 331 bp for mutton, and 398 bp for pork.

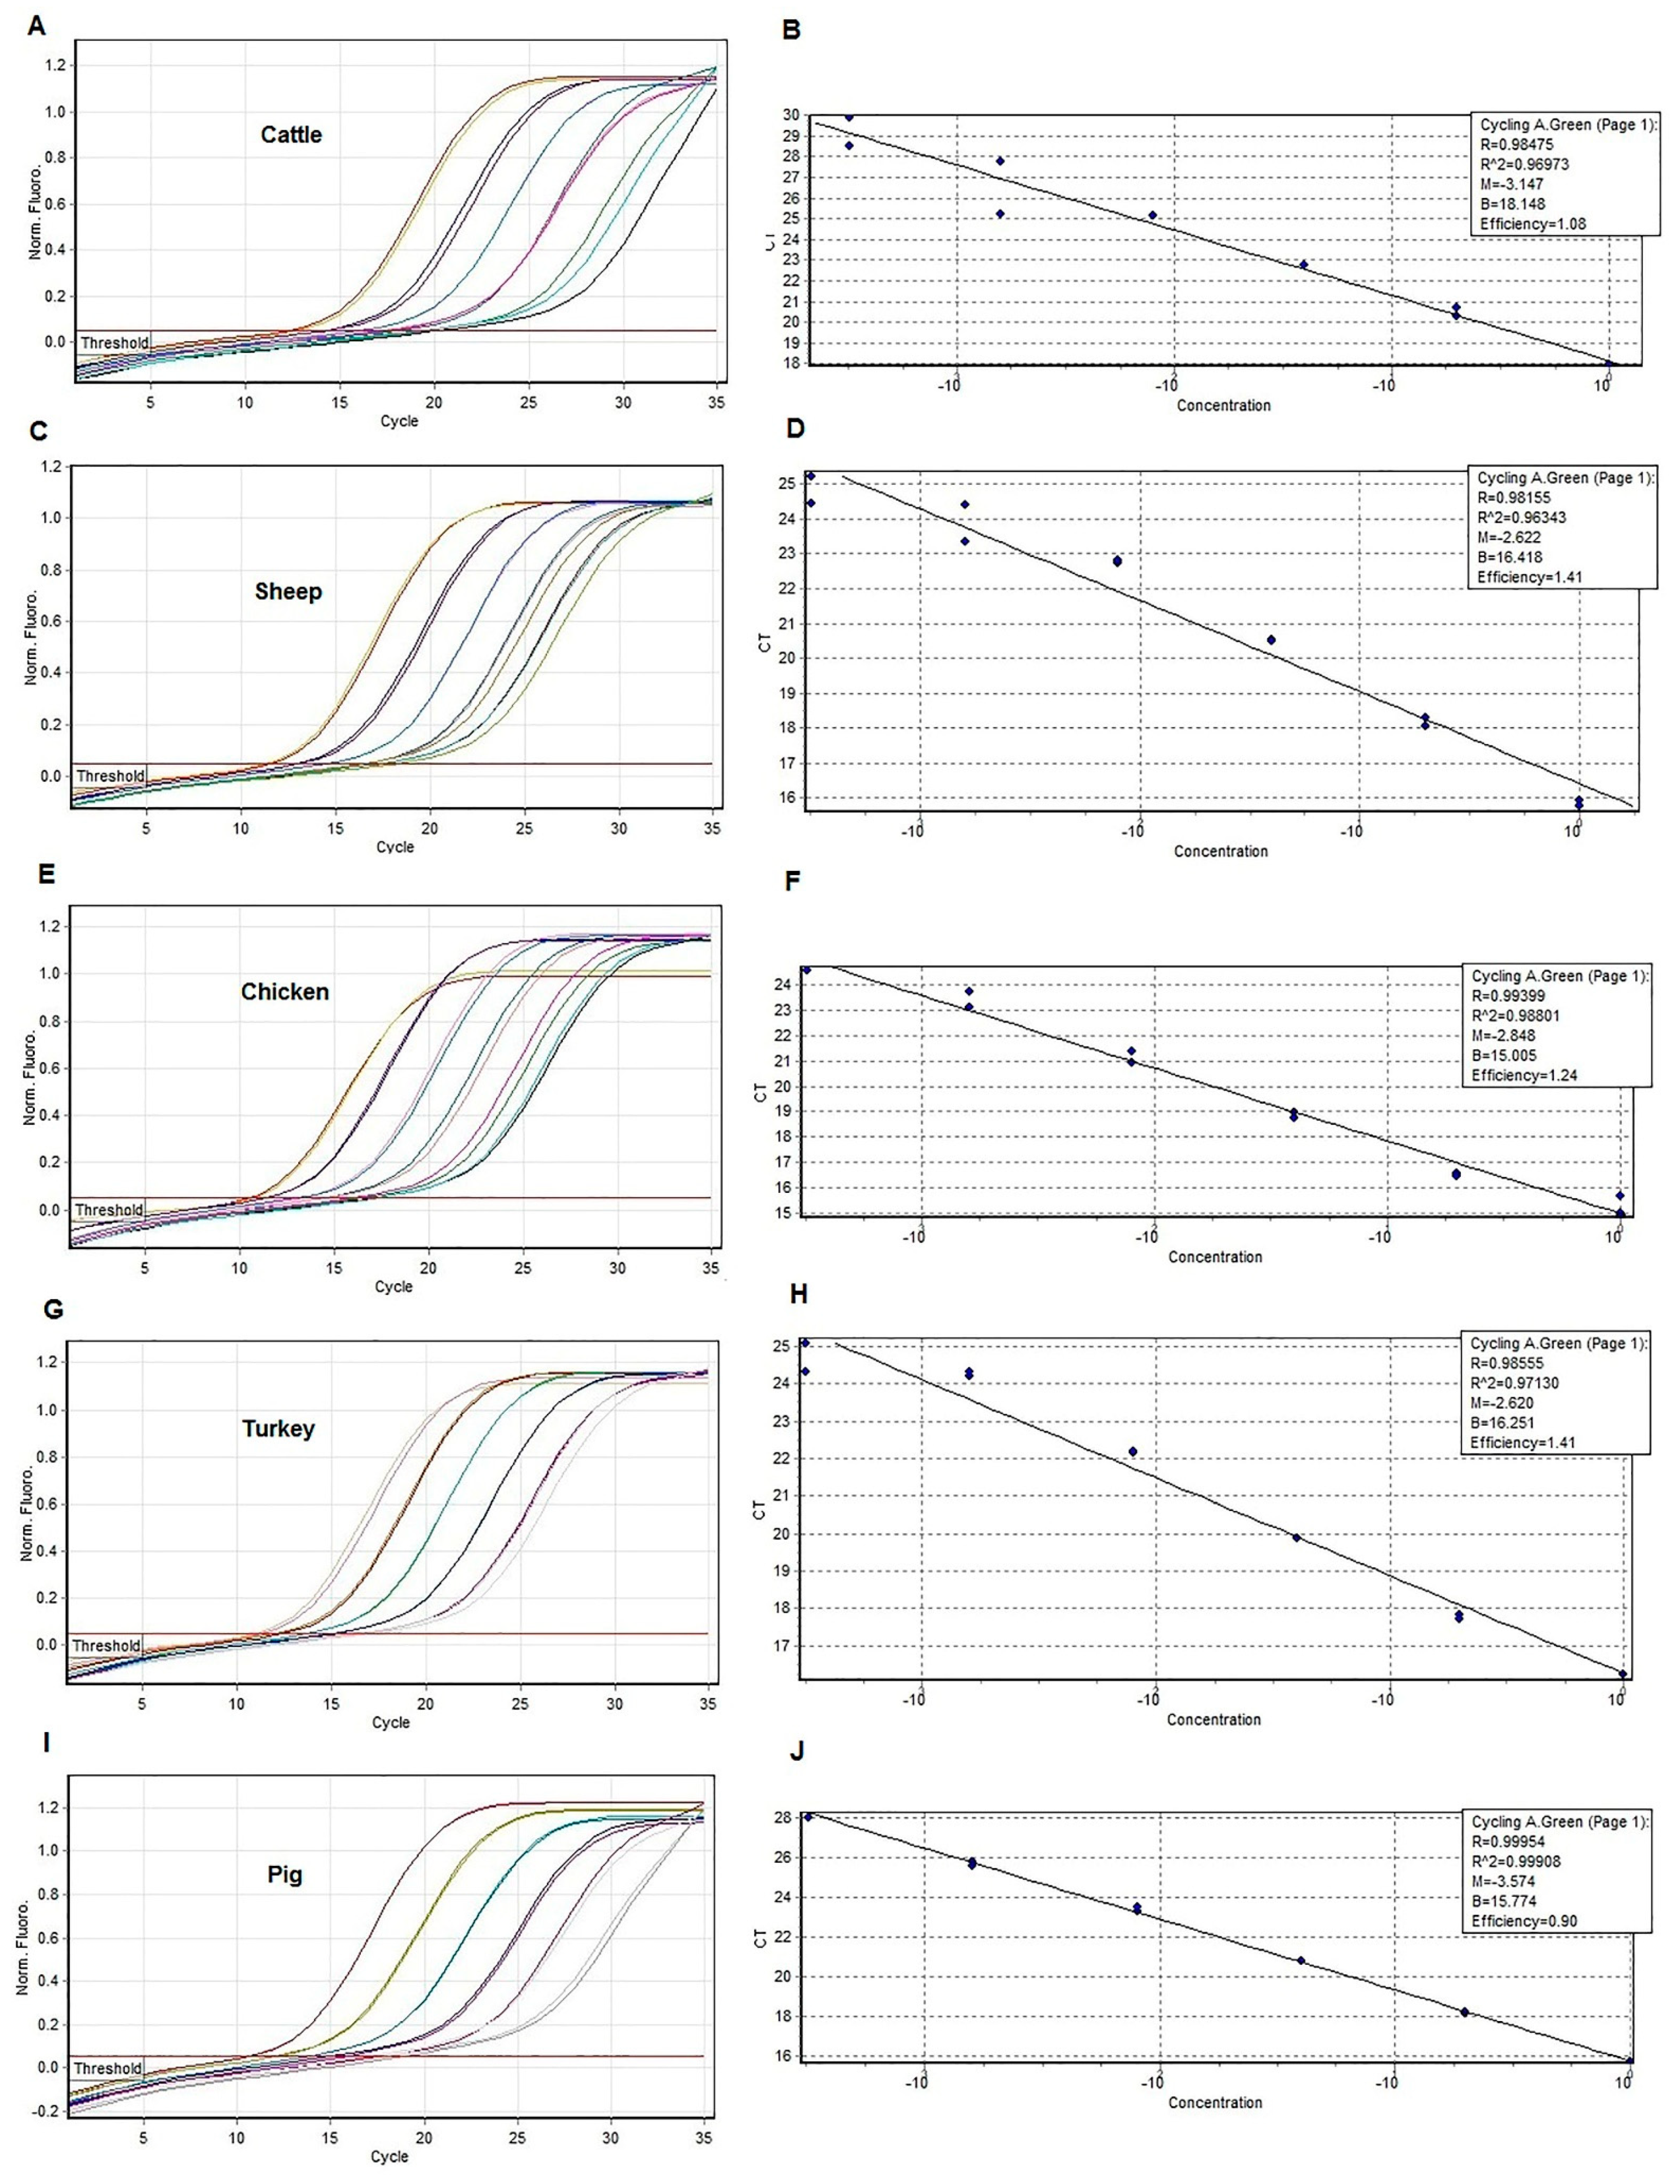
3.2. Amplification of Species-Specific Cytochrome b Fragments by Real-Time PCR Assay with HRM Analysis

The real-time quantitative PCR (qPCR) assay allowed us to detect the DNA from each species. The amplification plots represent the Ct of each DNA sample. The melting curves, shown in Figure 1B, verify the specificity of PCR products by identifying specific melt peak temperatures (Tm) for each sample (mutton, 82.8 °C; beef, 84.7 °C; chicken, 87.8 °C; turkey meat, 85.7 °C; and pork, 83.8 °C). The HRM plots presented in Figure 1C indicate an apparent shift in temperature, attributed to the specific Tm for each sample.

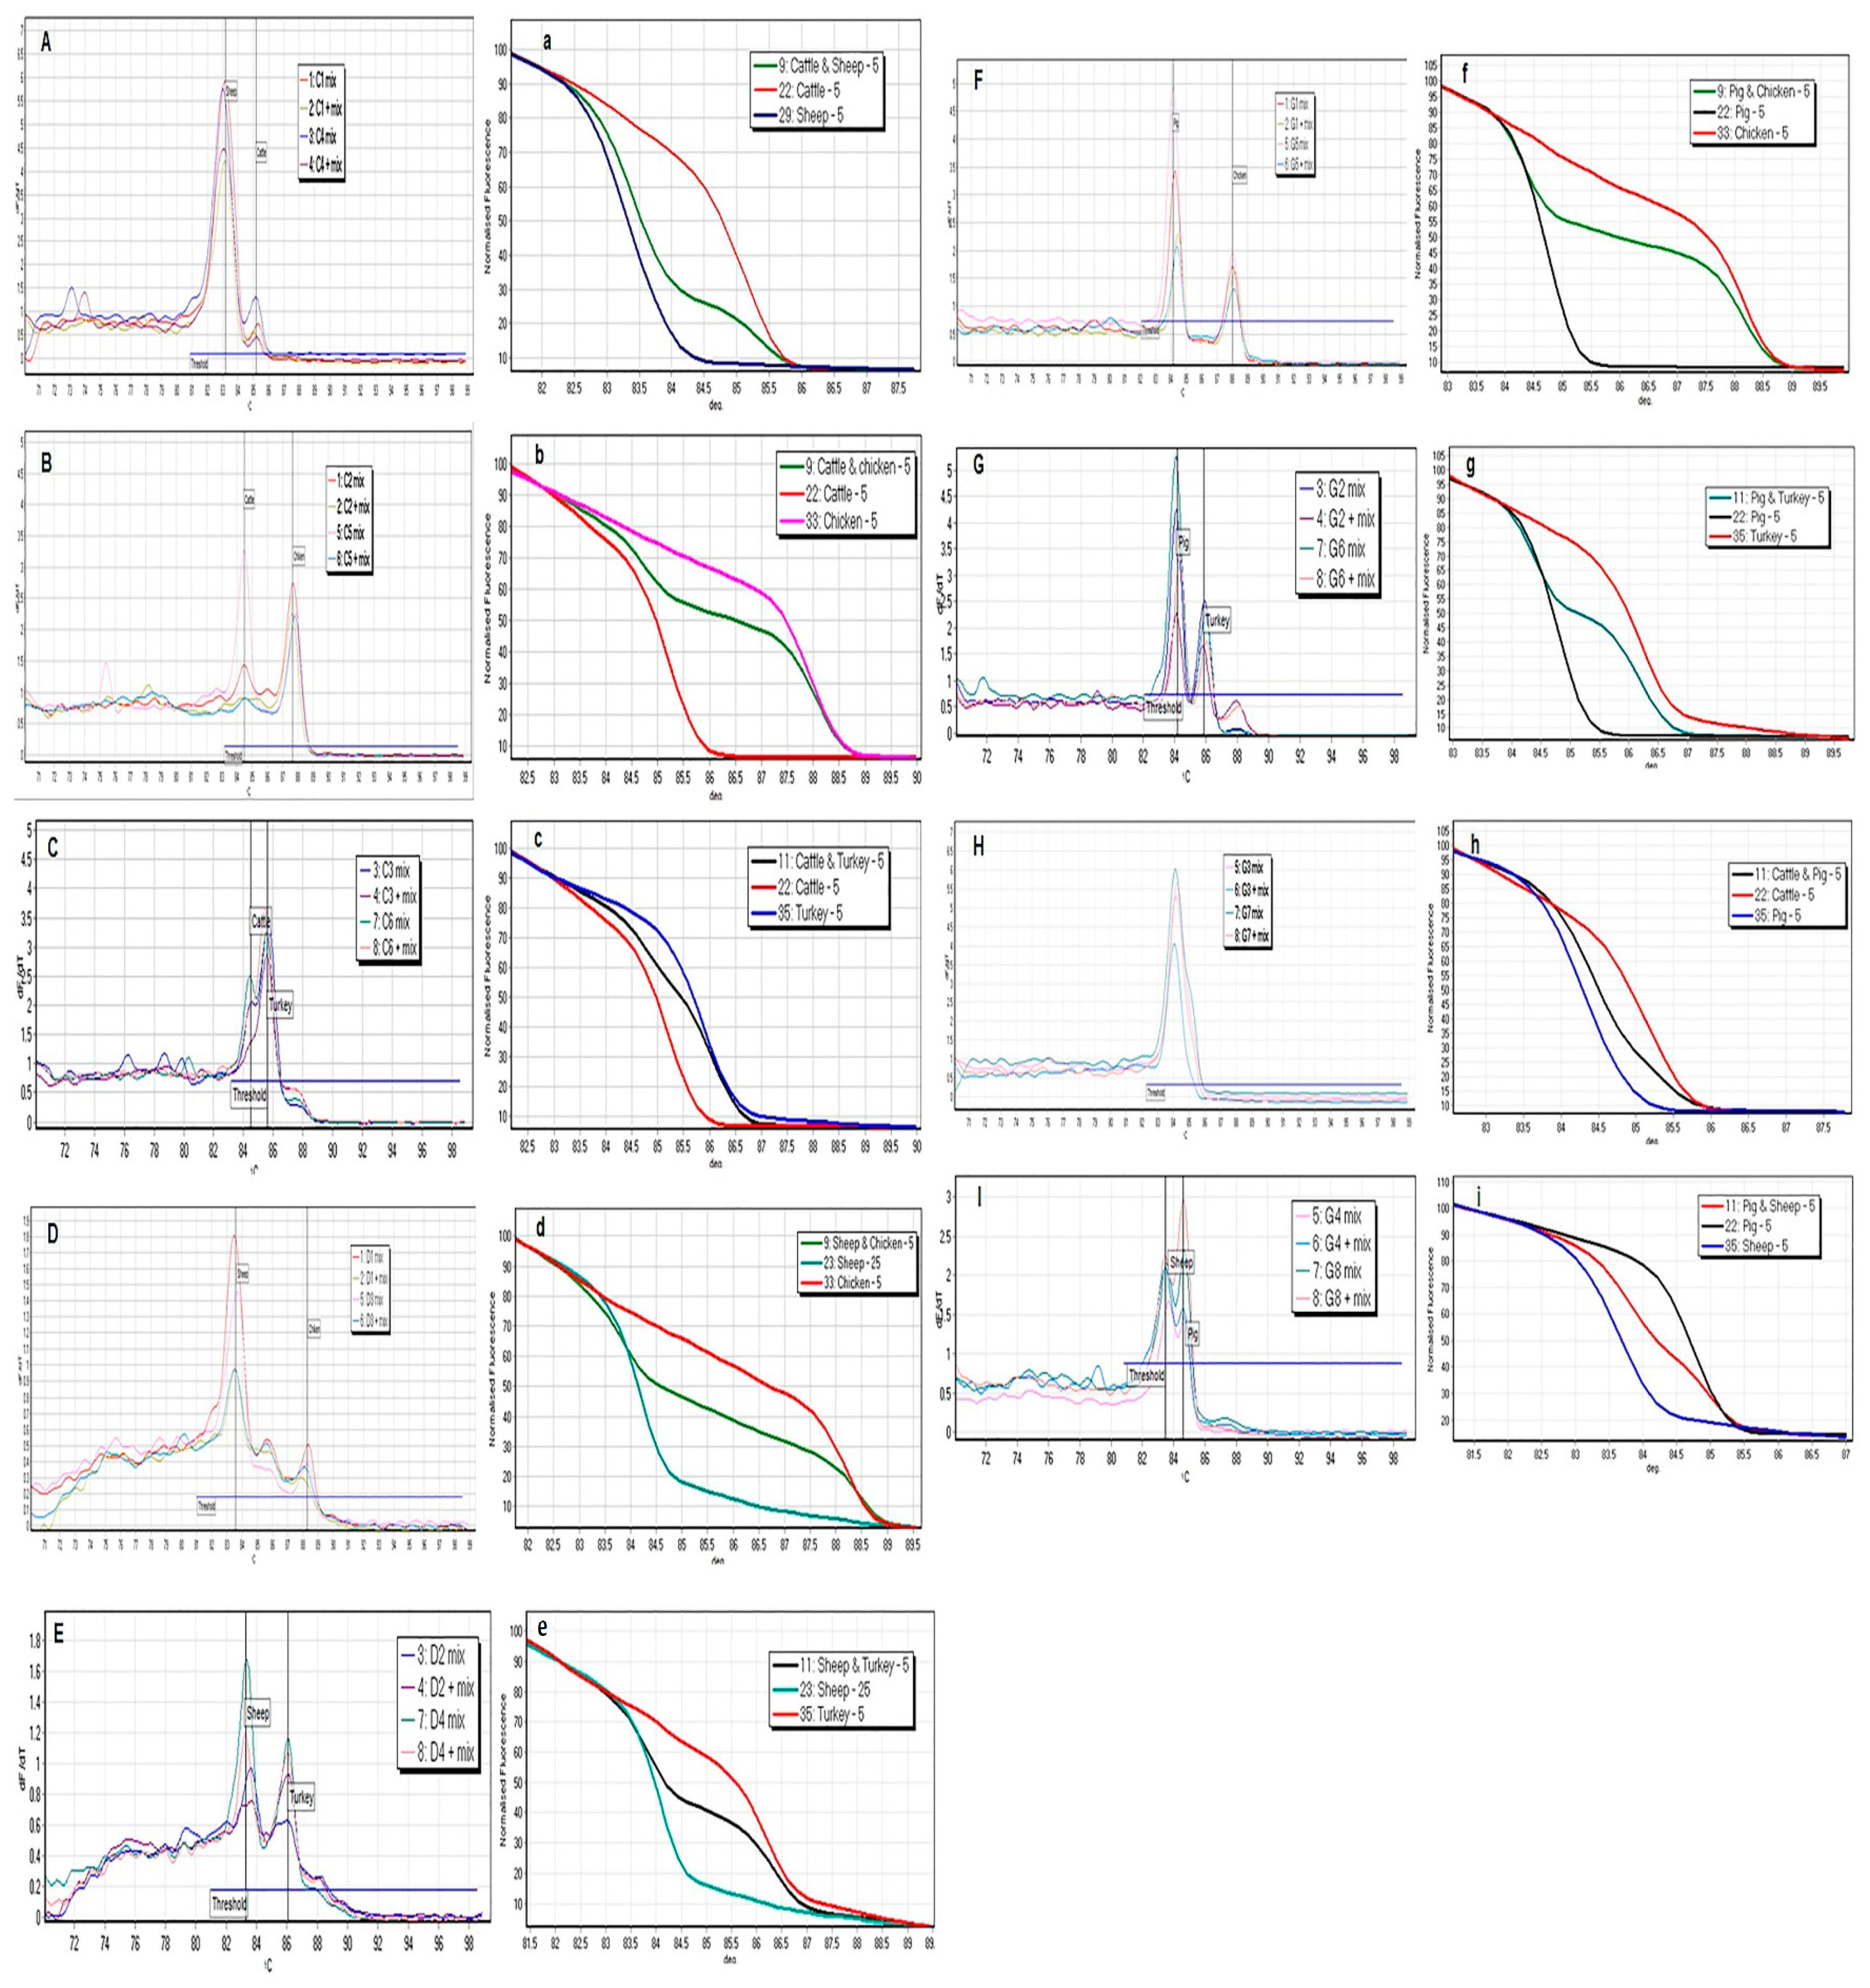
3.3. Identification of Meat Species in the Mixed Samples

The multiplex real-time PCR data show that the species-specific meat DNA in the mixed samples was successfully distinguished, using the qPCR assay with HRM analysis. All mixed samples (including raw or cooked meat with 10% and 20% purity) showed two distinct melting curves with their specific Tm. There was no significant difference between the data related to raw and cooked meat samples. Consistently, the HRM plots for the mixed meat samples exhibited two temperature shifts related to species-specific meat DNA. The results related to the classified groups (listed in Table 2) are indicated in Figure 2.
As shown in Figure 2, the melting curve and HRM analyses confirm that all mixed meat samples containing two different meat species (i.e., beef + mutton, beef + chicken, beef + turkey meat, mutton + chicken, mutton + turkey meat, mutton + pork, pork + chicken, and pork + turkey) showed two different Tm domains, which were indicatives of the related species, without any cross-reactions between species. There was only one exception related to the mixture of pork and beef, showing a single peak on the melting curve rather than two separate peaks.

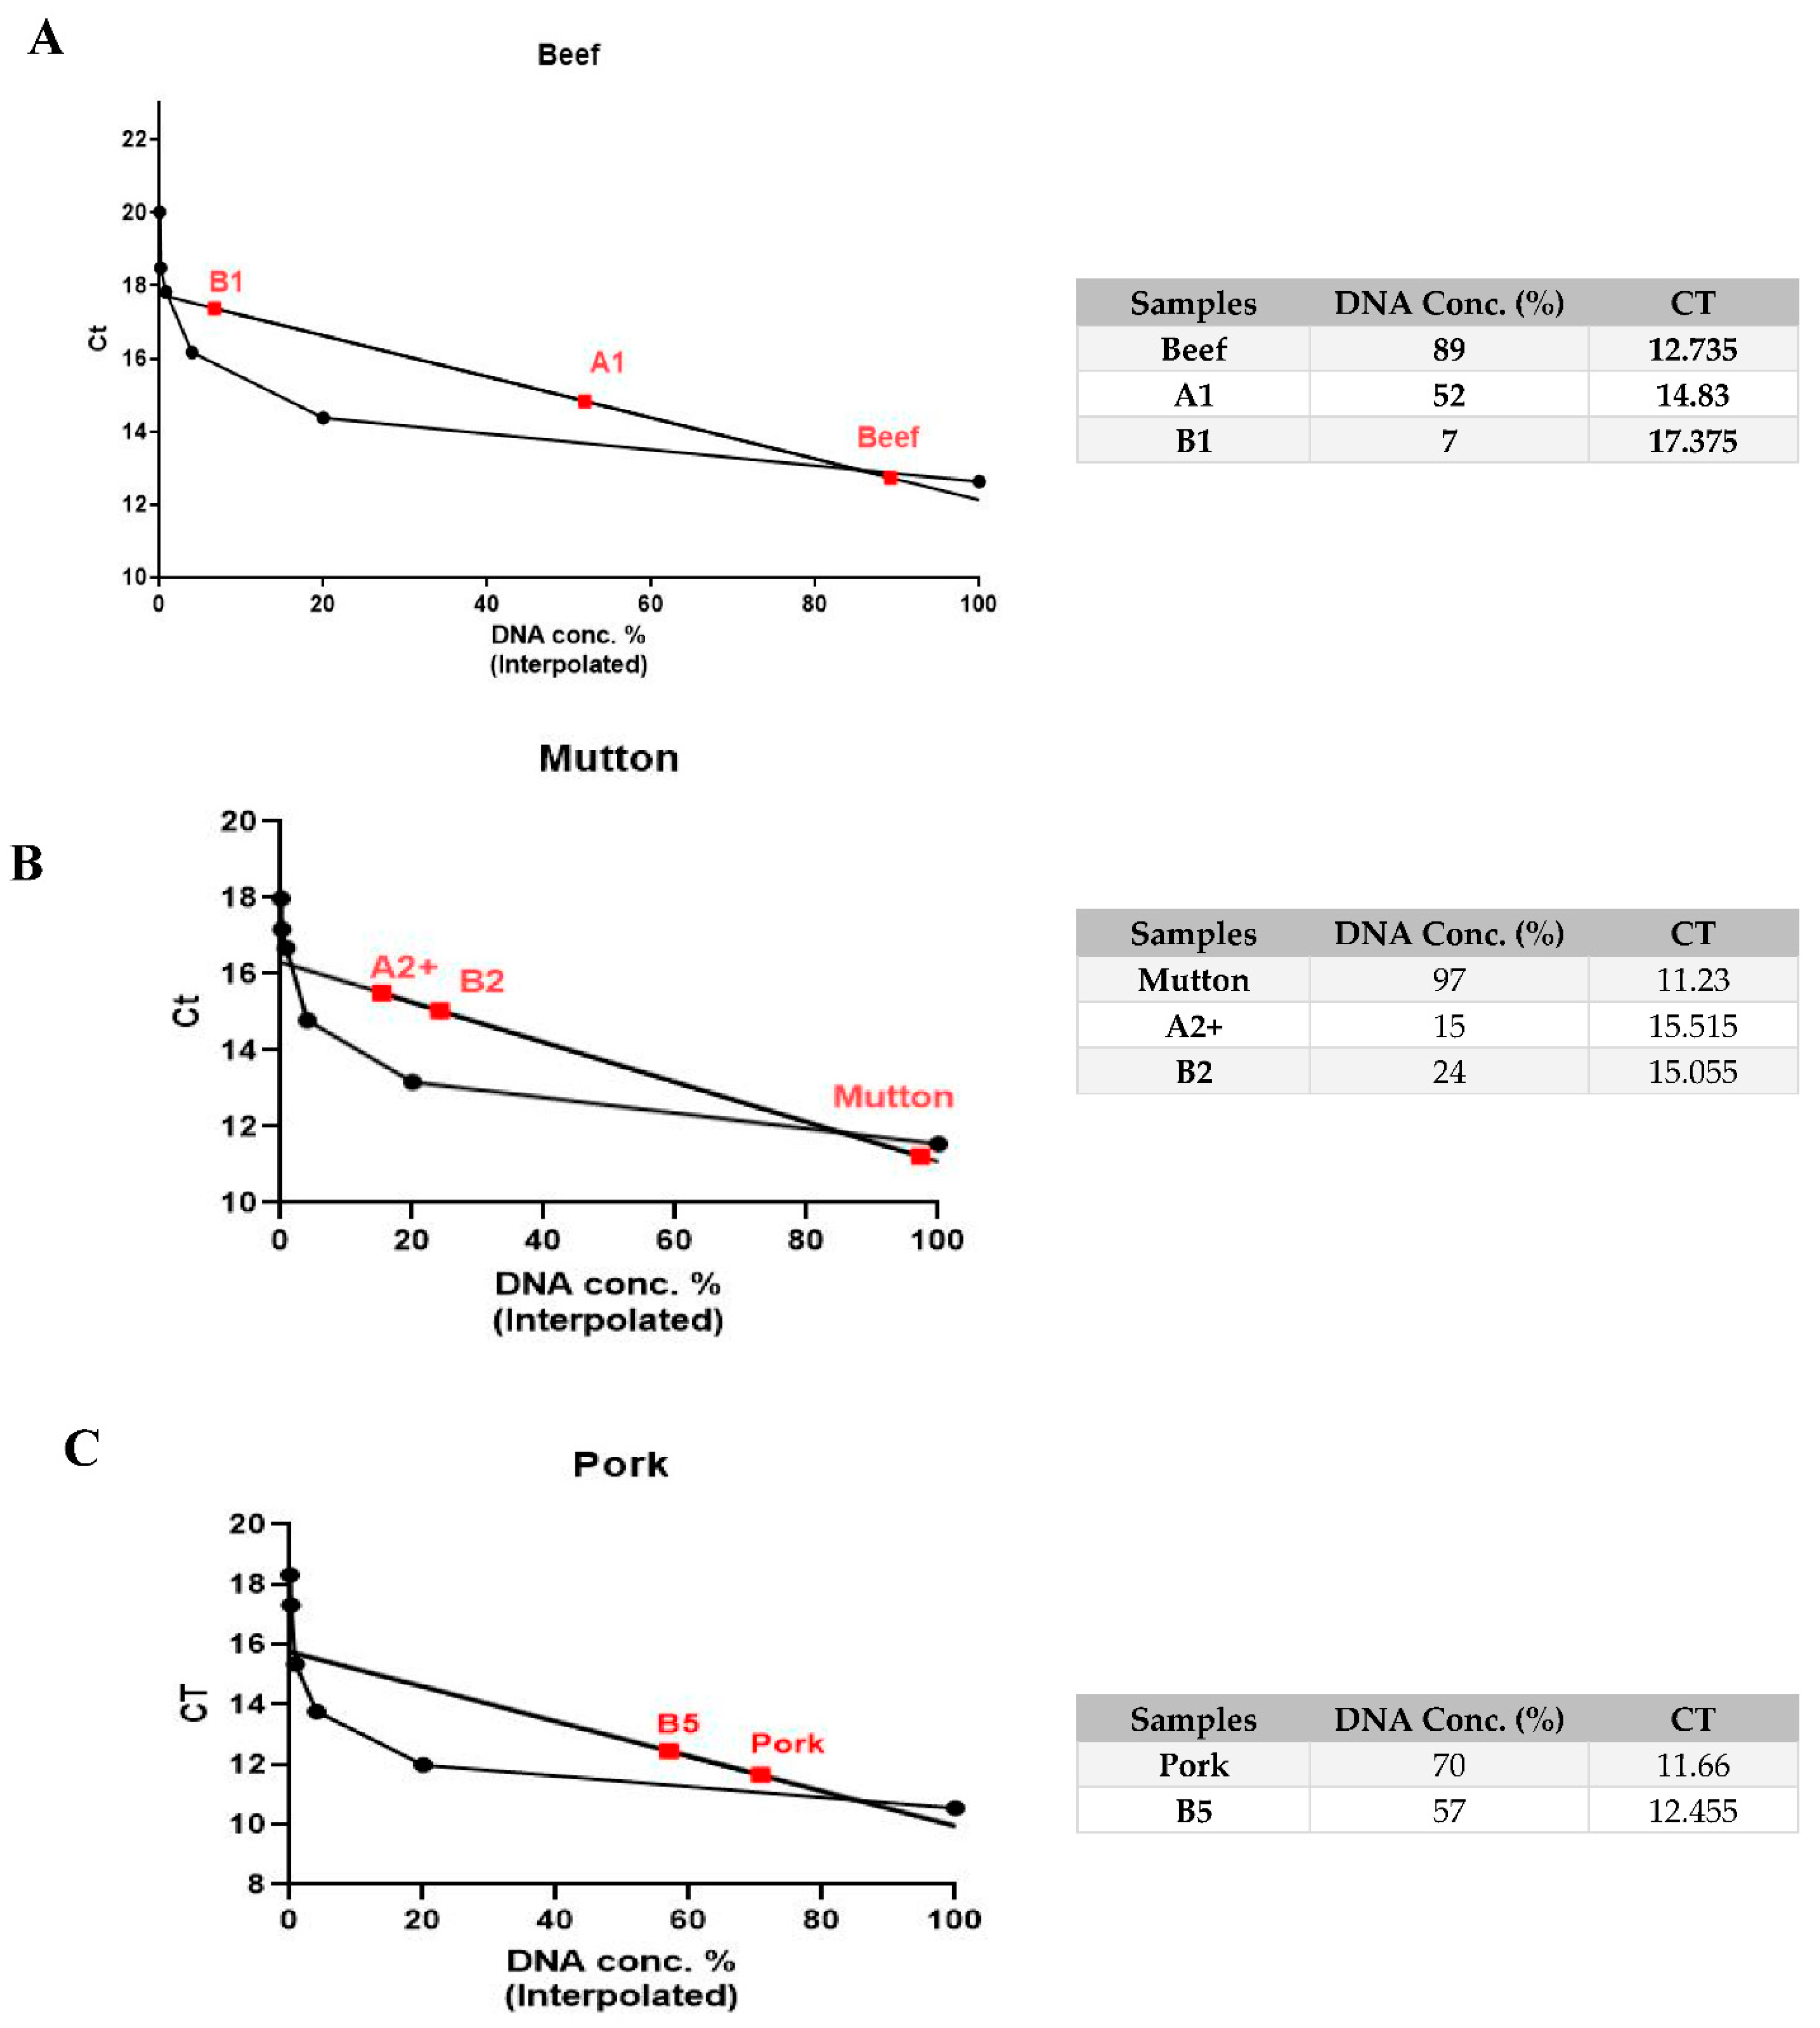
3.4. Quantitative Species-Specific Assessment of Raw and Cooked Minced Meat Samples

As shown in Figure 3, the calibration curve of each meat species was plotted, and parameters, including the correlation slope (M), correlation coefficient (R2), and PCR efficiency (E), were determined for the DNA of each meat species. The average values of each calibration curve were adequately efficient, from which a linear equation was derived. Next, the amounts of meat samples were calculated, using the relevant linear equation. The values of the mentioned parameters were as follows: correlation slope (M) = −3.1, correlation coefficient (R2) = 0.99, and PCR efficiency (E) >1.3. As shown in Figure 4, based on the calibration curves of beef, mutton, and pork samples, the amount of each meat type was calculated using nonlinear regression in the GraphPad (prism 5) software. The obtained amount of mutton was 97%, 24%, and 15% in samples containing 100%, 20%, and 10% (B2 and A2+), respectively, which values are close to the reference values. In other samples, the measured amount of meat showed a somewhat large deviation from what was expected: the obtained amount of beef was 89%, 7%, and 52% in samples composed of 100%, 20%, and 10% beef (B1 and A1), respectively. For pork, the amount of meat was only measurable in two samples—100% pork and 20% (B5), identified as 70% and 57%, respectively. The quantitative analyses were not performed for chicken and turkey samples.

4. Discussion

In recent decades, the species identification of meat-based products has been addressed as an essential issue throughout the world. This issue has become particularly important for people who are not allowed to consume some foods because of their cultural or religious beliefs [21]. Given the significance of meat authentication, a variety of analytical techniques, including liquid chromatography (LC), gas chromatography (GC), tandem mass spectrometry (MS), vibrational spectroscopic techniques (e.g., NIR and mid-infrared spectroscopy), nuclear magnetic resonance spectroscopy (NMR), PCR assays, and enzymatic assays (ELISA), have been developed to determine the ingredients of meat products and to identify adulterations [22]. In the present study, we used the real-time PCR technique with HRM analysis for the authentication of meat species in raw and cooked minced meat samples and to define the meat types in the processed foods. The HRM analysis is a highly sensitive method, allowing for the discrimination of two or more DNA samples in a mixture, based on different Tm values. HRM analysis is known as a powerful detection method for the detection of genetic mutations, SNPs, epigenetic variations, and different pathogens [23,24]. In a recent study, we detected Salmonella typhimurium and Salmonella enteritidis species in contaminated raw eggs using HRM analysis. Thus, the resulting data from that study validated the use of HRM analysis in the detection and discrimination of S. typhimurium and S. enteritidis species with high consistency [25]. In enhancing the sensitivity of HRM’s performance, some HRM-specific dyes are utilized instead of SYBR green. HRM dyes, such as SYTO9 and LCGreen melting dyes, are considered intercalating dyes that can bind specifically and in high amounts (saturating dyes, except SYBR Green) to double-stranded DNA. Previous reports have shown that SYTO9 dye has many advantages over SYBR green, which make it a more suitable dye for real-time PCR and HRM analyses [26,27]. Monis et al. (2005) reported that, contrary to SYBR green, SYTO9 dye is not affected by reaction conditions, including DNA concentration and dye concentration. They demonstrated that the SYTO9 concentration showed no inhibitory effect on PCR and melting curves, readily allowing the detection of multiple amplicons with different Tm in a multiplex PCR reaction, unlike SYBR green dye [28]. Using HRM analysis with SYTO9, we could also determine the species origins of meats in minced meat products, and distinguish the species of two meat types in the meat mixtures. There was only one exception, related to the mixture of pork and beef, with a single peak on the melting curve rather than two separate peaks. This observation might be associated with the Tm proximity of PCR products for beef and pork. On the other hand, the presence of a shoulder on the main peak could indicate the mixture of two different meat species. Our results indicate the sensitivity and specificity of a real-time PCR assay with HRM analysis, and also confirm the cytochrome b gene as a suitable gene target for detecting different species-specific DNA sequences in mixed meat samples, including processed foods containing meat. In this regard, Parchami Nejad et al. (2014) used a species-specific PCR assay to identify any potential frauds in meat products by detecting meat species, using primers for the mitochondrial cytochrome b gene. They could identify poultry residuals in beef sausage using this method [29]. Similar to previous research, our results demonstrate that the cooking process had no adverse effects on PCR efficiency, indicating the efficiency and feasibility of a real-time PCR assay with HRM analysis for examining different types and concentrations of meat samples. Moreover, Pelin Ulca et al. (2013) reported that the species origin of both raw and cooked meat was detectable at 200 °C for 20 min by using PCR [30]. Our results show that the quantitative assay was partly useful in determining the amount of meat in the samples that contained meat from only one animal species, since the obtained values were adequately close to the reference values. In some meat samples, the amount of meat showed a large deviation from our expectation, which might be attributed to some putative technical errors or the high complexity of food processing. Therefore, further refinements may be necessary to achieve more reliable results. Previous studies have also reported that some DNA-based assays may fail to precisely determine the species origin of meat samples due to severe DNA degradation or the high complexity of meat production [31]. In this regard, Raharjo et al. (2019) and Orbayinah et al. (2020), in independent studies, used the TaqMan probe-based real-time PCR method, targeting the ATPase 6 gene and a 153 bp fragment of the mitochondrial D-loop region to identify pork contamination in meat products. Their results indicate the high sensitivity and specificity of species-specific TagMan probes in identifying meat adulteration in food products [32]. Besides meat authentication, recent studies have shown that real-time PCR methods are valid for halal authentication of gelatin. Gelatin, which is mostly derived from porcine bones and hides, is widely used as a pharmaceutical and food ingredient, and is one of the most critical issues in halal research [33]. Since halal food authentication is a serious issue in some populations, including Muslims, the surveillance and rigorous monitoring of the production process of meat-based foods is essential, and must use reliable techniques [34]. Consequently, in regard to the resulting data, it could be concluded that the real-time PCR-HRM assay used in the current study is quite applicable for determining the species-specific meat types in meat products qualitatively. However, critical refinements are needed for the quantitative measurement of the amount of illegal species-specific meat contamination in meat products. On the other hand, due to the increasing proliferation of strategies to evade adulteration detection, there is a critical need to develop more advanced technologies with high specificity and sensitivity for detecting meat contamination in processed foods and meat products.

5. Conclusions

Currently, real-time PCR techniques that rely on specific TaqMan probes or HRM analyses are the most reliable and sensitive methods for the authentication of various meat products, including either raw or cooked minced meat mixtures, processed meat products, and meat-based fast foods. HRM analysis is a highly sensitive technique that allows us to discriminate two or more species types of DNA samples in a meat mixture, based on different Tm values of the amplified species-specific regions of a mitochondrial gene. Therefore, a real-time PCR-HRM assay can be employed as a valid technique in the food industry to authenticate the species origin of a meat product. However, some improvements are needed for more precise evaluations and the detection of even very low amounts of meat species contaminations or impurities in meat products.

Author Contributions

P.G. carried out the experiments and wrote the MS draft; H.A. supervised the work and corrected the manuscript; G.N.B. supervised the work and edited the manuscript; S.A.A.A. supervised the work and analyzed the data and A.M. contributed to this work as the advisor. All authors have read and agreed to the published version of the manuscript.

Funding

This research received no external funding.

Institutional Review Board Statement

Not applicable.

Informed Consent Statement

Not applicable.

Data Availability Statement

The datasets used and/or analyzed during the current study are available from the corresponding author on reasonable request.

Conflicts of Interest

The authors declare no conflict of interest.

References

  1. Pereira, P.M.d.C.C.; Vicente, A.F.d.R.B. Meat nutritional composition and nutritive role in the human diet. Meat Sci. 2013, 93, 586–592. [Google Scholar] [CrossRef] [PubMed] [Green Version]
  2. Bohrer, B.M. Review: Nutrient density and nutritional value of meat products and non-meat foods high in protein. Trends Food Sci. Technol. 2017, 65, 103–112. [Google Scholar] [CrossRef]
  3. Khan, M.I.; Arshad, M.S.; Anjum, F.M.; Sameen, A.; Aneequr, R.; Gill, W.T. Meat as a functional food with special reference to probiotic sausages. Food Res. Int. 2011, 44, 3125–3133. [Google Scholar] [CrossRef]
  4. Kendall, H.; Clark, B.; Rhymer, C.; Kuznesof, S.; Hajslova, J.; Tomaniova, M.; Brereton, P.; Frewer, L. A systematic review of consumer perceptions of food fraud and authenticity: A European perspective. Trends Food Sci. Technol. 2019, 94, 79–90. [Google Scholar] [CrossRef]
  5. Leng, T.; Li, F.; Xiong, L.; Xiong, Q.; Zhu, M.; Chen, Y. Quantitative detection of binary and ternary adulteration of minced beef meat with pork and duck meat by NIR combined with chemometrics. Food Control 2020, 113, 107–203. [Google Scholar] [CrossRef]
  6. Ayaz, Y.; Ayaz, N.D.; Erol, I. Detection of species in meat and meat products using enzyme-linked immunosorbent assay. J. Muscle Foods 2006, 17, 214–220. [Google Scholar] [CrossRef]
  7. Wang, W.; Liu, J.; Zhang, Q.; Zhou, X.; Liu, B. Multiplex PCR assay for identification and quantification of bovine and equine in minced meats using novel specific nuclear DNA sequences. Food Control 2019, 105, 29–37. [Google Scholar] [CrossRef]
  8. von Bargen, C.; Brockmeyer, J.; Humpf, H.-U. Meat Authentication: A New HPLC–MS/MS Based Method for the Fast and Sensitive Detection of Horse and Pork in Highly Processed Food. J. Agric. Food Chem. 2014, 62, 9428–9435. [Google Scholar] [CrossRef]
  9. Böhme, K.; Calo-Mata, P.; Barros-Velázquez, J.; Ortea, I. Review of Recent DNA-Based Methods for Main Food-Authentication Topics. J. Agric. Food Chem. 2019, 67, 3854–3864. [Google Scholar] [CrossRef] [PubMed]
  10. Stamoulis, P.; Stamatis, C.; Sarafidou, T.; Mamuris, Z. Development and application of molecular markers for poultry meat identification in food chain. Food Control 2010, 21, 1061–1065. [Google Scholar] [CrossRef]
  11. Maede, D. A strategy for molecular species detection in meat and meat products by PCR-RFLP and DNA sequencing using mitochondrial and chromosomal genetic sequences. Eur. Food Res. Technol. 2006, 224, 209–217. [Google Scholar] [CrossRef]
  12. Jonker, K.M.; Tilburg, J.J.H.C.; Hägele, G.H.; de Boer, E. Species identification in meat products using real-time PCR. Food Addit. Contam. Part A 2008, 25, 527–533. [Google Scholar] [CrossRef] [Green Version]
  13. Foong, C.M.; Sani, N.A. Identifying of meat species using polymerase chain reaction (PCR). AIP Conf. Proc. 2013, 1571, 680–686. [Google Scholar]
  14. He, H.; Wang, Y.; Qing, Y.; Li, D.; Zhao, X.; Zhu, Q.; Yin, H. Molecular Authentication of Meats from Three Terrestrial Birds Based on Pcr-Rflp Analysis of the Mitochondrial 12S rRNA Gene. Braz. J. Poult. Sci. 2018, 20, 651–656. [Google Scholar] [CrossRef]
  15. Tanabe, S.; Hase, M.; Yano, T.; Sato, M.; Fujimura, T.; Akiyama, H. A real-time quantitative PCR detection method for pork, chicken, beef, mutton, and horseflesh in foods. Biosci. Biotechnol. Biochem. 2007, 71, 3131–3135. [Google Scholar] [CrossRef] [PubMed]
  16. Chen, X.; Lu, L.; Xiong, X.; Xiong, X.; Liu, Y. Development of a real-time PCR assay for the identification and quantification of bovine ingredient in processed meat products. Sci. Rep. 2020, 10, 2052. [Google Scholar] [CrossRef]
  17. Soares, S.; Amaral, J.S.; Oliveira, M.B.P.P.; Mafra, I. A SYBR Green real-time PCR assay to detect and quantify pork meat in processed poultry meat products. Meat Sci. 2013, 94, 115–120. [Google Scholar] [CrossRef] [Green Version]
  18. Dalsecco, L.S.; Palhares, R.M.; Oliveira, P.C.; Teixeira, L.V.; Drummond, M.G.; de Oliveira, D.A.A. A Fast and Reliable Real-Time PCR Method for Detection of Ten Animal Species in Meat Products. J. Food Sci. 2018, 83, 258–265. [Google Scholar] [CrossRef] [PubMed]
  19. Ye, J.; Feng, J.; Liu, S.; Zhang, Y.; Jiang, X.; Dai, Z. Identification of four squid species by quantitative real-time polymerase chain reaction. Mol. Cell. Probes 2016, 30, 22–29. [Google Scholar] [CrossRef] [PubMed]
  20. Mane, B.G.; Mendiratta, S.K.; Tiwari, A.K.; Bhilegaokar, K.N. Detection of Adulteration of Meat and Meat Products with Buffalo Meat Employing Polymerase Chain Reaction Assay. Food Anal. Methods 2012, 5, 296–300. [Google Scholar] [CrossRef]
  21. Erwanto, Y.; Rohman, A.; Arsyanti, L.; Pranoto, Y. Identification of pig DNA in food products using polymerase chain reaction (PCR) for halal authentication-a review. Int. Food Res. J. 2018, 25, 1322–1331. [Google Scholar]
  22. Abbas, O.; Zadravec, M.; Baeten, V.; Mikuš, T.; Lešić, T.; Vulić, A.; Prpić, J.; Jemersic, L.; Pleadin, J. Analytical methods used for the authentication of food of animal origin. Food Chem. 2017, 246, 6–17. [Google Scholar] [CrossRef] [PubMed]
  23. Chua, K.H.; Lim, S.C.; Ng, C.C.; Lee, P.C.; Lim, Y.A.L.; Lau, T.P.; Chai, H.C. Development of High Resolution Melting Analysis for the Diagnosis of Human Malaria. Sci. Rep. 2015, 5, 15671. [Google Scholar] [CrossRef] [PubMed] [Green Version]
  24. Masjedian Jazi, F.; Mirnejad, R.; Piranfar, V.; Amir Mozafari, N.; Zahraei Salehi, T.; Khormali, M.; Sedighi, M.; Irajian, G.R. Real-time PCR and high-resolution melt analysis methods for detection of pathogenic species of Brucella. J. Lab. Med. 2017, 41, 325–331. [Google Scholar] [CrossRef]
  25. Hamed Ahari, S.F. Nariman Sheikhi, Amir Ali Anvar, Saeed Paid. Use of Real-Time PCR and High-Resolution Melting Analysis for Detection and Discrimination of Salmonella typhimurium and Salmonella enteritidis in Contaminated Raw-Egg Samples. J. Food Biosci. Technol. 2021, 11, 59–68. [Google Scholar]
  26. Quyen, T.L.; Ngo, T.A.; Bang, D.D.; Madsen, M.; Wolff, A. Classification of Multiple DNA Dyes Based on Inhibition Effects on Real-Time Loop-Mediated Isothermal Amplification (LAMP): Prospect for Point of Care Setting. Front. Microbiol. 2019, 10, 2234. [Google Scholar] [CrossRef]
  27. Oscorbin, I.P.; Belousova, E.A.; Zakabunin, A.I.; Boyarskikh, U.A.; Filipenko, M.L. Comparison of fluorescent intercalating dyes for quantitative loop-mediated isothermal amplification (qLAMP). Biotechniques 2016, 61, 20–25. [Google Scholar] [CrossRef] [Green Version]
  28. Monis, P.; Giglio, S.; Saint, C. Comparison of SYTO9 and SYBR Green I for real-time polymerase chain reaction and investigation of the effect of dye concentration on amplification and DNA melting curve analysis. Anal. Biochem. 2005, 340, 24–34. [Google Scholar] [CrossRef]
  29. Parchami Nejad, F.; Hosseni, S.E.; Tafvizi, F.; Tajabadi Ebrahimi, M.; Sharifan, A. Fraud identification in beef sausage in Tehran province using mitochondrial genes of animal species. J. Food Hyg. 2014, 4, 81–89. [Google Scholar]
  30. Ulca, P.; Balta, H.; Cağın, I.; Senyuva, H. Meat species identification and Halal authentication using PCR analysis of raw and cooked traditional Turkish foods. Meat Sci. 2013, 94, 280–284. [Google Scholar] [CrossRef]
  31. Spychaj, A.; Mozdziak, P.; Pospiech, E. PCR methods in meat species identification as a tool for the verification of regional and traditional meat products. Acta Sci. Pol. Technol. Aliment. 2009, 8, 5–20. [Google Scholar]
  32. Orbayinah, S.; Hermawan, A.; Sismindari, S.; Rohman, A. Detection of pork in meatballs using probe TaqMan Real-time Polymerase Chain Reaction. Food Res. 2020, 4, 1563–1568. [Google Scholar] [CrossRef]
  33. Hammed, A.; Asiyanbi-Hammed, T.; Idris, M.; Ahmad Fadzillah, N.; Mirghani, M. A Review of Gelatin Source Authentication Methods. Trop. Life Sci. Res. 2018, 29, 213–227. [Google Scholar] [CrossRef]
  34. Salahudin, A.; Syahmi, M.; Zulkepli, S.; Imran, M.; Abd Razak, M.; Ramli, M.A. Issues in Halal Meat Product and Authentication Technology from Islamic Perspectives.pdf. Int. J. Acad. Res. Bus. Soc. Sci. 2017, 7, 1305–1315. [Google Scholar] [CrossRef] [Green Version]
Figure 1. (A) PCR product length of amplified cytochrome b fragment specific for each meat sample. The PCR products of species-specific samples were efficiently amplified and appeared at precise sizes on an agarose gel. The amplicon lengths of species-specific samples are as follows—chicken and turkey: 227 bp; cattle: 274 bp; sheep: 331 bp; pig: 398 bp. The DNA ladder 1 kb was used as a size marker. (B) Specific melting and (C) HRM curves of cytochrome b fragment specific for each species: sheep, 82.8 °C; cattle, 84.7 °C; chicken, 87.8 °C; turkey, 85.7 °C and pig, 83.8 °C. Both melting curves and HRM plots confirmed the specificity of PCR products related to each species-specific meat.
Separations 08 00116 g001
Figure 2. Two distinct melting curves with specific Tm, indicating the presence of two types of meat in the mixed meat samples. (A) Sheep and cattle—peak 1: 83 °C for sheep and peak 2: 85 °C for cattle. (B) Cattle and chicken—peak 1: 84.5 °C for cattle and peak 2: 87.6 °C for chicken. (C) Cattle and turkey—peak 1: 84.5 °C for cattle and peak 2: 85.6 °C for turkey. (D) Sheep and chicken—peak 1: 83.5 °C for sheep and peak 2: 87.8 °C for chicken. (E) Sheep and turkey—peak 1: 83.3 °C for sheep and peak 2: 86 °C for turkey. (F) Pig and chicken—peak 1: 84.4 °C for pig and peak 2: 88 °C for chicken. (G) Pig and turkey—peak 1: 84.1 °C for pig and peak 2: 85.9 °C for turkey. (H) Cattle and pig—a main peak with a mild shoulder at 84.1 °C was observed in a mixture sample of cattle and pig. (I) Sheep and pig—peak 1: 83.4 °C for sheep and peak 2: 84.6 °C for pig. (a) to (i) illustrate HRM plots demonstrating two temperature shifts related to each species-specific meat DNA.
Separations 08 00116 g002
Figure 3. Amplification of serial concentrations of meat DNAs obtained from different species: (A) cattle, (C)B sheep, (E) chicken, (G) turkey and (I) pig. (B,D,F,H,J): Six-point calibration curves of meat DNA including 100, 20, 4, 0.8, 0.16, and 0.032% concentrations were evaluated, and the related parameters, such as correlation slope (M), correlation coefficient (R2) and PCR efficiency (E), for each meat’s DNA were calculated as follows: M = −3.1, R2 = 0.99 and E > 1.3.
Separations 08 00116 g003
Figure 4. A. The calibration curves of (A) beef, (B) mutton, and (C) pork DNA samples. The amounts of DNA in each meat sample were calculated according to the related calibration curves, and are illustrated as red symbols on the curves. The obtained amounts of each meat species are presented in tables.
Separations 08 00116 g004
Table 1. Classification of minced meat samples obtained from five species.
One Species
Species/meatRawCooked
Cattle/beefA1: 10%B1: 20%A1+: 10%B1+: 20%
Sheep/muttonA2: 10%B2: 20%A2+: 10%B2+: 20%
Chicken/ChickenA3: 10%B3: 20%A3+: 10%B3+: 20%
Turkey/TurkeyA4: 10%B4: 20%A4+: 10%B4+: 20%
Pig/porkA5: 10%B5: 20%A5+: 10%B5+: 20%
Table 2. Classification of mixed meat groups containing meats from two species.
The Mixed Meat GroupsPercentageRawCooked
Beef + Mutton10%C1C1+
Beef + Chicken10%C2C2+
Beef + Turkey10%C3C3+
Beef + Mutton20%C4C4+
Beef + Chicken20%C5C5+
Beef + Turkey20%C6C6+
Mutton + Chicken10%D1D1+
Mutton + Turkey10%D2D2+
Mutton + Chicken20%D3D3+
Mutton + Turkey20%D4D4+
Chicken + Turkey10%E1E1+
Chicken + Turkey20%E2E2+
Pig + Chicken10%G1G1+
Pig + Turkey10%G2G2+
Pig + Beef10%G3G3+
Pig + Mutton10%G4G4+
Pig + Chicken20%G5G5+
Pig + Turkey20%G6G6+
Pig + Beef20%G7G7+
Pig + Mutton20%G8G8+
Table 3. Primer sequences designed specifically for cytochrome b gene of different meat types.
SamplesPrimersSequencesAmplicon Tm (°C)Amplicon Size (bp)
Common forward primer5’-CCTCCCAGCTCCATCAAACATCTCATCTTGATGAAA-3’
Beef (Bovine DNA)Reverse primer5’-CTAGAAAAGTGTAAGACCCGTAATATAAG-3’84.7274
Mutton (Sheep DNA)Reverse primer5’-CTATGAATGCTGTGGCTATTGTCGCA-3’82.8331
Chicken (Chicken DNA)Reverse primer5’-AAGATACAGATGAAGAAGAATGAGGCG-3’87.8227
Turkey (Turkey DNA)Reverse primer5’-AAGATACAGATGAAGAAGAATGAGGCG-3’85.7227
Pork (porcine DNA)Reverse primer5’-GCTGATAGTAGATTTGTGATGACCGTA-3’83.8398
Publisher’s Note: MDPI stays neutral with regard to jurisdictional claims in published maps and institutional affiliations.

