Article

A Hybrid MPC-PID Control System Design for the Continuous Purification and Processing of Active Pharmaceutical Ingredients

Department of Chemical and Biochemical Engineering, Rutgers, The State University of New Jersey, Piscataway, NJ 08854, USA
*
Author to whom correspondence should be addressed.
Processes 2014, 2(2), 392-418; https://doi.org/10.3390/pr2020392
Submission received: 19 March 2014 / Revised: 15 April 2014 / Accepted: 18 April 2014 / Published: 23 May 2014

Abstract

:
In this work, a hybrid MPC (model predictive control)-PID (proportional-integral-derivative) control system has been designed for the continuous purification and processing framework of active pharmaceutical ingredients (APIs). The specific unit operations associated with the purification and processing of API have been developed from first-principles and connected in a continuous framework in the form of a flowsheet model. These integrated unit operations are highly interactive along with the presence of process delays. Therefore, a hybrid MPC-PID is a promising alternative to achieve the desired control loop performance as mandated by the regulatory authorities. The integrated flowsheet model has been simulated in gPROMS™ (Process System Enterprise, London, UK). This flowsheet model has been linearized in order to design the control scheme. The ability to track the set point and reject disturbances has been evaluated. A comparative study between the performance of the hybrid MPC-PID and a PID-only control scheme has been presented. The results show that an enhanced control loop performance can be obtained under the hybrid control scheme and demonstrate that such a scheme has high potential in improving the efficiency of pharmaceutical manufacturing operations.

1. Introduction and Objective

An effort is being made by the pharmaceutical industries for the production of QbD (Quality by Design)-based products through a continuous processing scheme. Apart from the several advantages that continuous processing has over batch processing (i.e., reduced labor, higher yield, reduced production cost, etc.), a continuous process allows for the online/inline integration of the monitoring tools and the introduction of efficient feedback control systems. This has the potential for the pharmaceutical industry to maintain the product quality mandated by the regulatory authorities (e.g., United States Food and Drug Administration (FDA)). The FDA has introduced QbD and Process Analytical Technology (PAT) principles, which mandate that the product quality should be built by design at every manufacturing stage [1]. This approach is a promising alternative when compared to the traditional trial-and-error approach, where the quality of the final product is matched with the regulatory guidelines. The application of the required GMP (Good Manufacturing Practices) ensures good end product quality [2]. QbD and PAT principles help reduce the overall time-to-market and cost of healthcare. Therefore, products that conform to quality in accordance to the regulatory guidelines (as dictated by the QbD and PAT principles) can be produced via an efficiently controlled continuous processing framework. The critical quality attributes (CQAs) of a pharmaceutical product depend significantly on purification and processing steps of active pharmaceutical ingredients (APIs). However, due to the different levels of complexity involved, the pharmaceutical processes involving the purification and processing of APIs are still operated with open or limited process control.
The typical challenges associated with industrial process control are the presence of multi-variable process interactions between manipulated and controlled variables, measured and unmeasured disturbances, process delays and several constraints on the input and output variables [3]. Therefore, the model predictive control (MPC) module has been widely used in several process industries (i.e., petroleum refineries, petrochemicals, bulk chemical production, etc.) as an advanced process control strategy [4]. Some of the advantages of MPC over conventional regulatory controllers are that it can be easily adjusted to handle the complex process dynamics; it can efficiently handle the strong interaction among the process variables; it can easily compensate for large process dead time; and it can handle non-square systems and is easier to tune [5,6]. However, MPC requires an accurate process model and a robust optimization scheme, which may be computationally expensive. On the other hand, a proportional-integral-derivative (PID) controller is relatively simpler to design and implement and can be used to control the variables that are comparatively less interactive with the entire process and that result in a lesser process dead time. Therefore, an optimum control strategy is highly desired in which the advantages of both control strategies (i.e., both MPC and PID) can be integrated. A hybrid MPC-PID design will help to optimize the control loop performance, the usage of resources and time.
In this study, a continuous framework for API purification/processing has been developed from first-principles in the form of an integrated flowsheet model. It has been shown previously that a model developed from first-principles demonstrates the actual plant closely, as it can capture a significant amount of the process knowledge [7]. It has been also demonstrated that flowsheet modeling has a high level of accuracy in capturing the dynamics of the actual process [8,9,10]. The flowsheet model developed in this work connects the API purification stages (crystallization, filtration and drying) with a tablet manufacturing unit operation (mixing). Such a model will help in investigating the effect of the physical properties of the API crystals on the downstream processing steps [11]. In reality, unknown disturbances are often experienced in the process inputs/outputs of a plant, which affect the product quality. Therefore, the use of control strategies has been suggested within the PAT guidelines [2] to ensure that the process variable(s) follows the desired trajectory [12]. The importance of process control in continuous manufacturing schemes for pharmaceutical operations has been discussed in detail in the scientific literature [6,13,14]. This flowsheet model can be used for virtual experimental study of the plant, including the design of an efficient control strategy prior to its application in the real plant, which will result in less usage of time and resources.
The authors have previously described a simpler base-level PID-based control scheme and highlighted the need of advanced MPC [13]. The present study is a necessary extension of the previous work and provides a comparative discussion and design of a proposed hybrid MPC-PID control scheme. It has been already shown by Singh et al. [6] (for a downstream tablet manufacturing framework) that a combined MPC-PID approach results in improved control loop performance when compared to PID-only or MPC-only control scheme. In this work, the hybrid scheme has been demonstrated with the aid of an MPC-PID cascade arrangement where the MPC acts in a supervisory mode and the PID is the regulatory slave controller (secondary controller). In a cascade controller set-up, the output of the supervisory controller is used to obtain the set point of the secondary controller, which, in turn, manipulates the final actuator. For example, in the MPC-PID cascade system, the manipulated variables of the MPC become the set points of the underlying PID controllers, executed in a distributed control system (DCS). A cascade control system often proves efficient for pharmaceutical processes [6].

1.1. Objectives

This particular work is focused on the design and analysis of a hybrid MPC-PID control scheme for continuous API purification and processing (i.e., crystallization, filtration and drying) followed by powder mixing. It provides a demonstration of how two or more dependent process variables can be controlled in a cascade loop comprised of both MPC (supervisory/primary controller) and PID (secondary/slave controller). A hybrid control strategy results in an increased process efficiency and optimized use of resources/computational power [6]. The first-principles model, used to develop the control-relevant model, has been previously developed by the authors [10,11]. The specific objectives of this work are as follows:
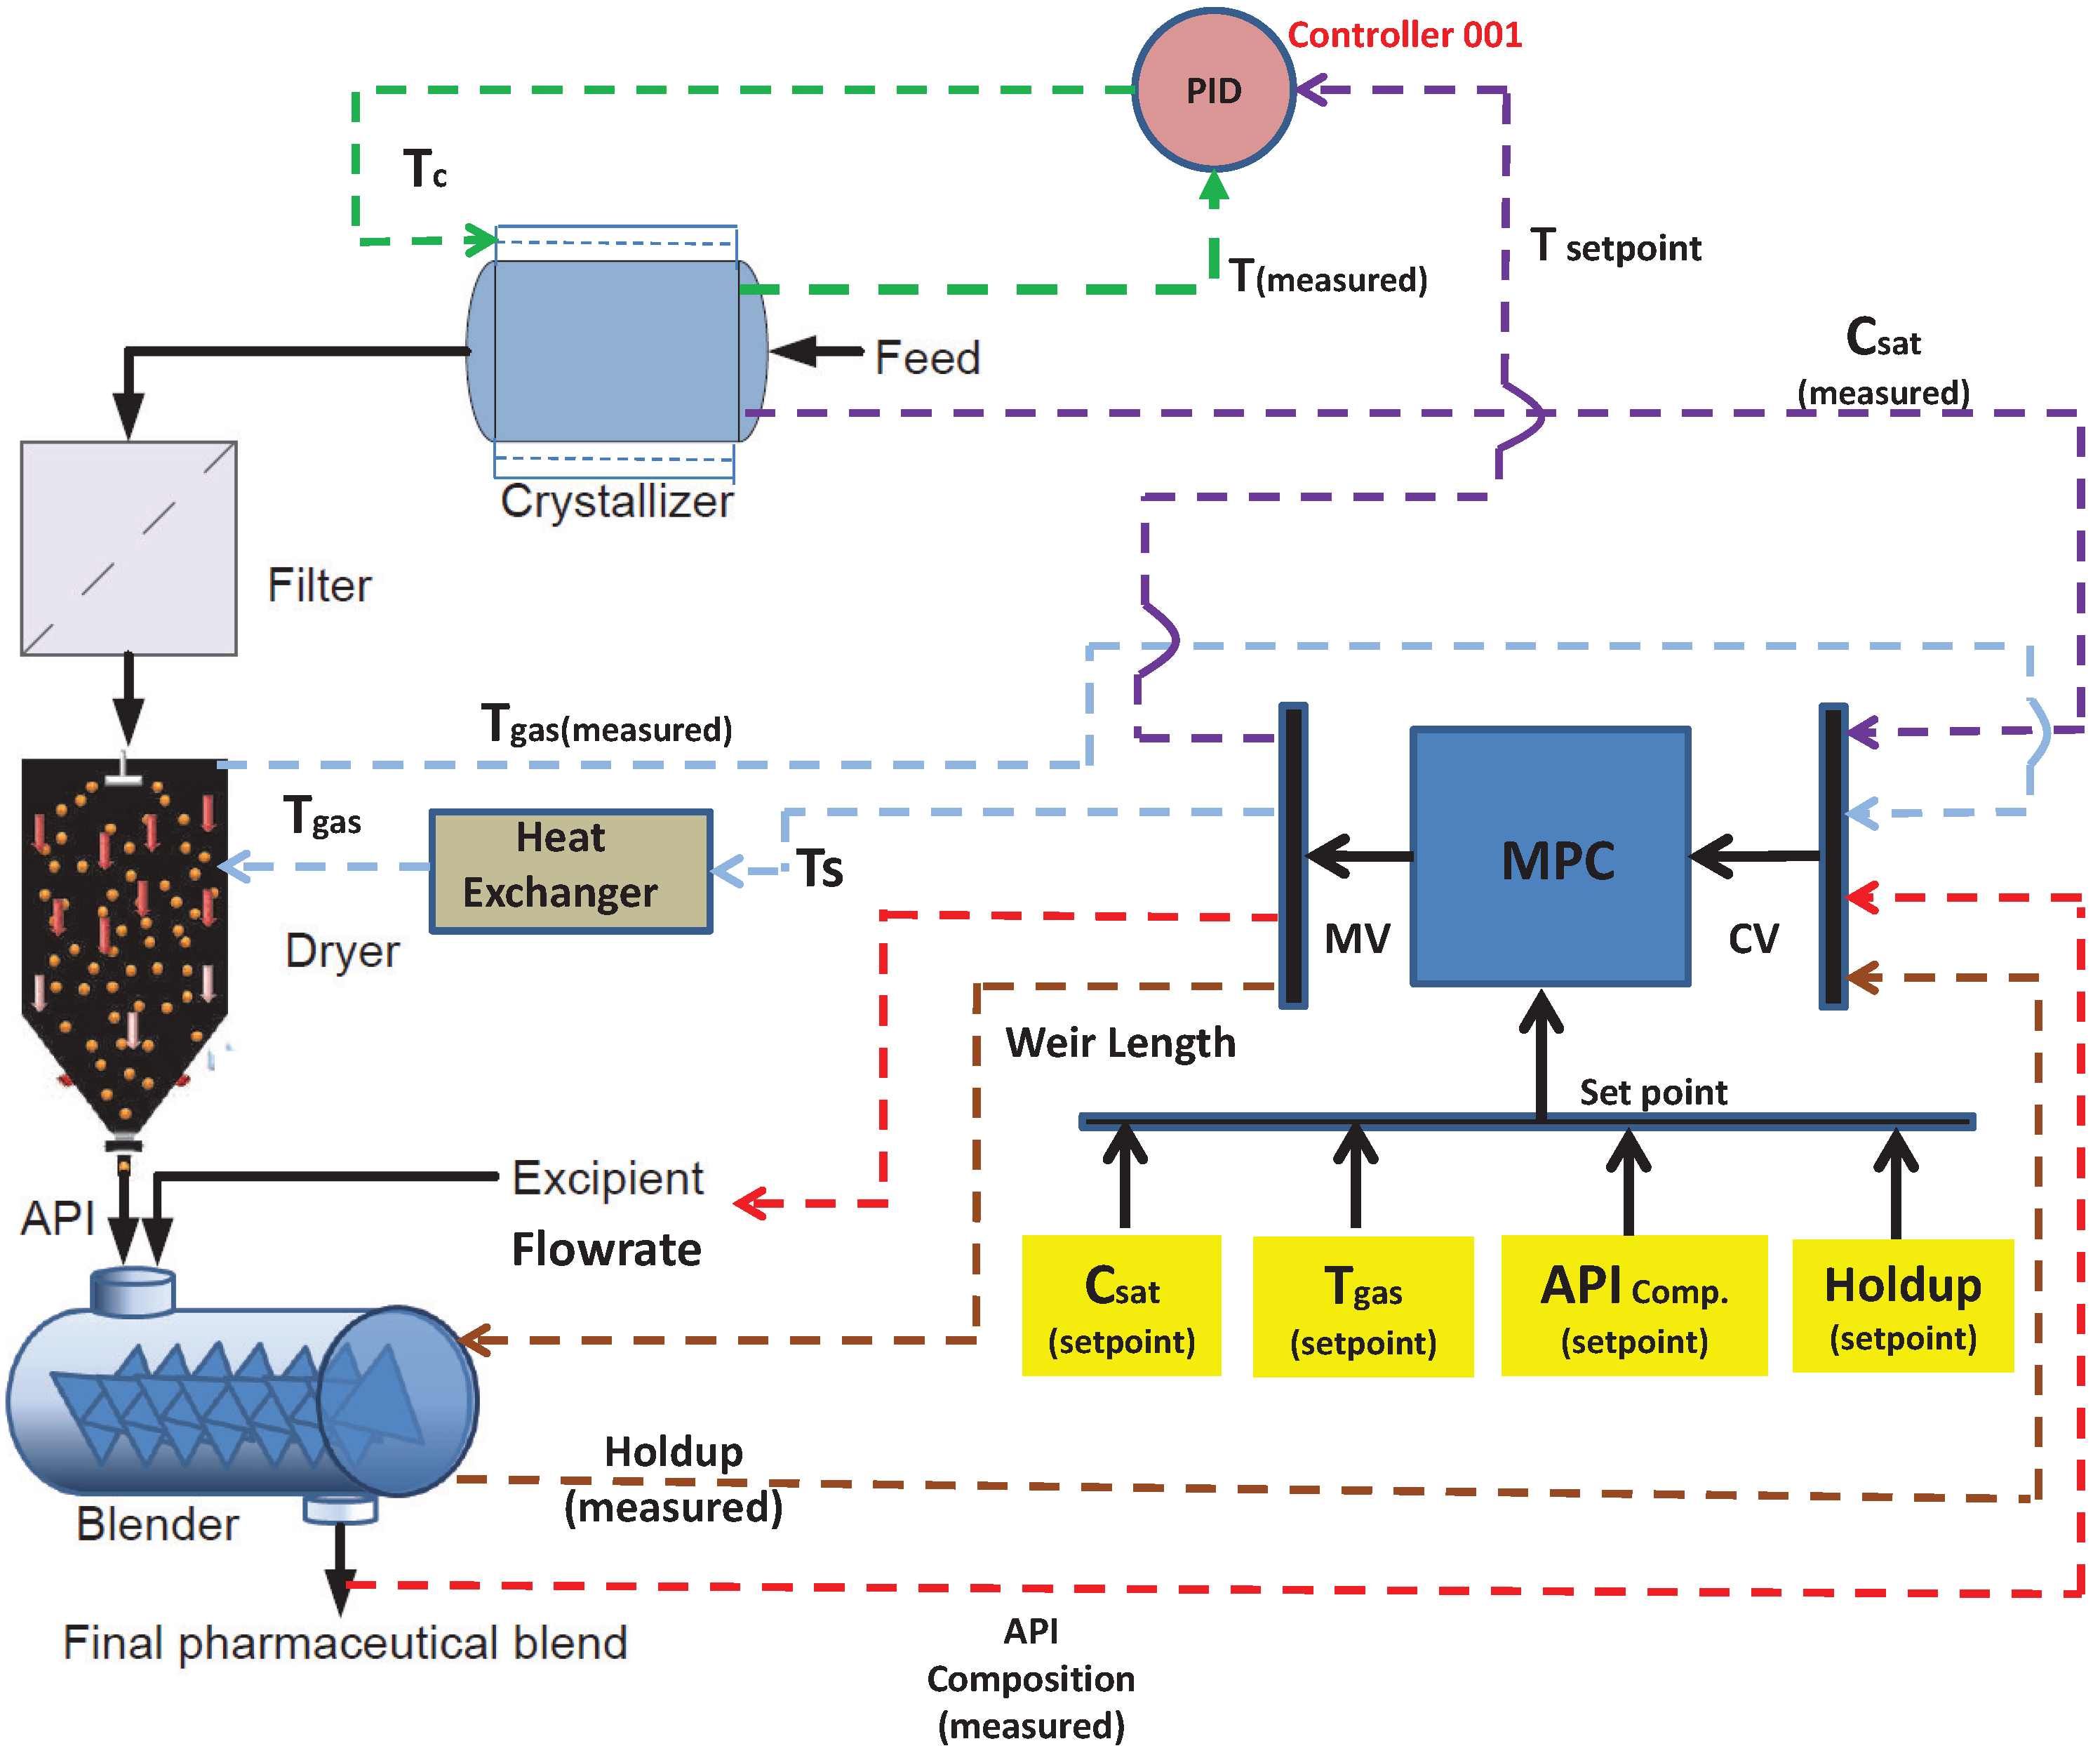
  • Present a system-wide hybrid MPC-PID control scheme.
  • Quantify the importance of a cascade control scheme in case of pharmaceutical unit operations.
  • Present a comparative study between PID-only control and MPC-PID control schemes based on set point tracking and disturbance rejection criteria.

2. Background

MPC consists of a collective set of control algorithms, which explicitly predicts the future state of a process over a predetermined, extended time horizon [15]. These algorithms are used to formulate the optimization objectives, which are to minimize the predicted deviation of the control variable from the specified set point and minimize the control effort in maintaining the control variable at the specified set point. Another element of MPC is the error prediction update, where the prediction error is used to update the future predictions. These basic principles are used to formulate the two schemes of the MPC methodology, known as the dynamic matrix control (DMC) and model algorithmic control (MAC) [3]. Interested readers can refer to the previous literature reported by the authors [6] for a detailed overview of the functioning mechanism of MPC.
Few attempts have been made towards the control of pharmaceutical unit operations (both batch and continuous) in the past few years. For example, Sanders et al. [16] have evaluated a comparative study using PID and MPC methods on an experimentally validated batch wet granulation model. Mesbah et al. have studied the non-linear control aspect of a population balance model-based batch crystallization process [17]. Predictive control of crystal size and shape in a batch crystallization process has been reported in the literature, as well [18]. A detailed review on the application of control engineering in drying technology has been provided by Dufour [19]. Similarly studies related to the application of MPC in various drying operations have been discussed in detail in the literature [20,21]. Hsu et al. [22,23] proposed a control system for a roller compactor. Bardin et al. [24] have provided a discussion on the control of PSD during granulation in batch mode, in a high shear mixer. A review on the control of a fluid bed granulation process has been presented by Burggraeve et al. [25]. Ramachandran and Chaudhury [26] have suggested a control scheme for a continuous drum granulation process. An MPC strategy has been proposed for a wet drum granulation process [27,28,29].
As the motivation of transition towards a continuous mode of operation is in place, several researchers have reported a model-based control and design for continuous processing frameworks. Ramachandran et al. [30] have performed an assessment of control loop performance for a continuous tablet manufacturing framework via direct compaction using a simple PID control strategy. Singh et al. [6,31] have proposed an advanced control scheme using an MPC-PID hybrid approach for the same. Designs of control systems for the continuous tablet manufacturing framework via the roller compaction route [14] and wet granulation route [32] have been reported, as well. The study of various control strategies on the downstream tablet manufacturing process is well documented [33]. This particular work focuses on designing a control strategy for the API purification or processing connected with mixing (a downstream tablet manufacturing operation). Such a framework will allow the operator to have control over the API crystal properties, such that the desired quality of the final pharmaceutical blend can be obtained. Although, plant-wide control schemes (studies conducted on a pilot-plant) describing continuous synthesis and processing of API [34,35,36] have been reported, there is a need for a mechanistic model-based study to be performed. The availability of a mechanistic model representing the actual plant makes it possible to perform various kinds of studies on the model, from a design, optimization and control perspective, prior to its application in the actual plant.
Hybrid control strategies have been suggested as a promising scheme for plant-wide control [37,38,39], but it is yet to be applied in the pharmaceutical industry. Therefore, this work presents a scenario where the control loops have been designed with an advanced control system (MPC) or simple PID control, depending on the complexity of the dynamics.

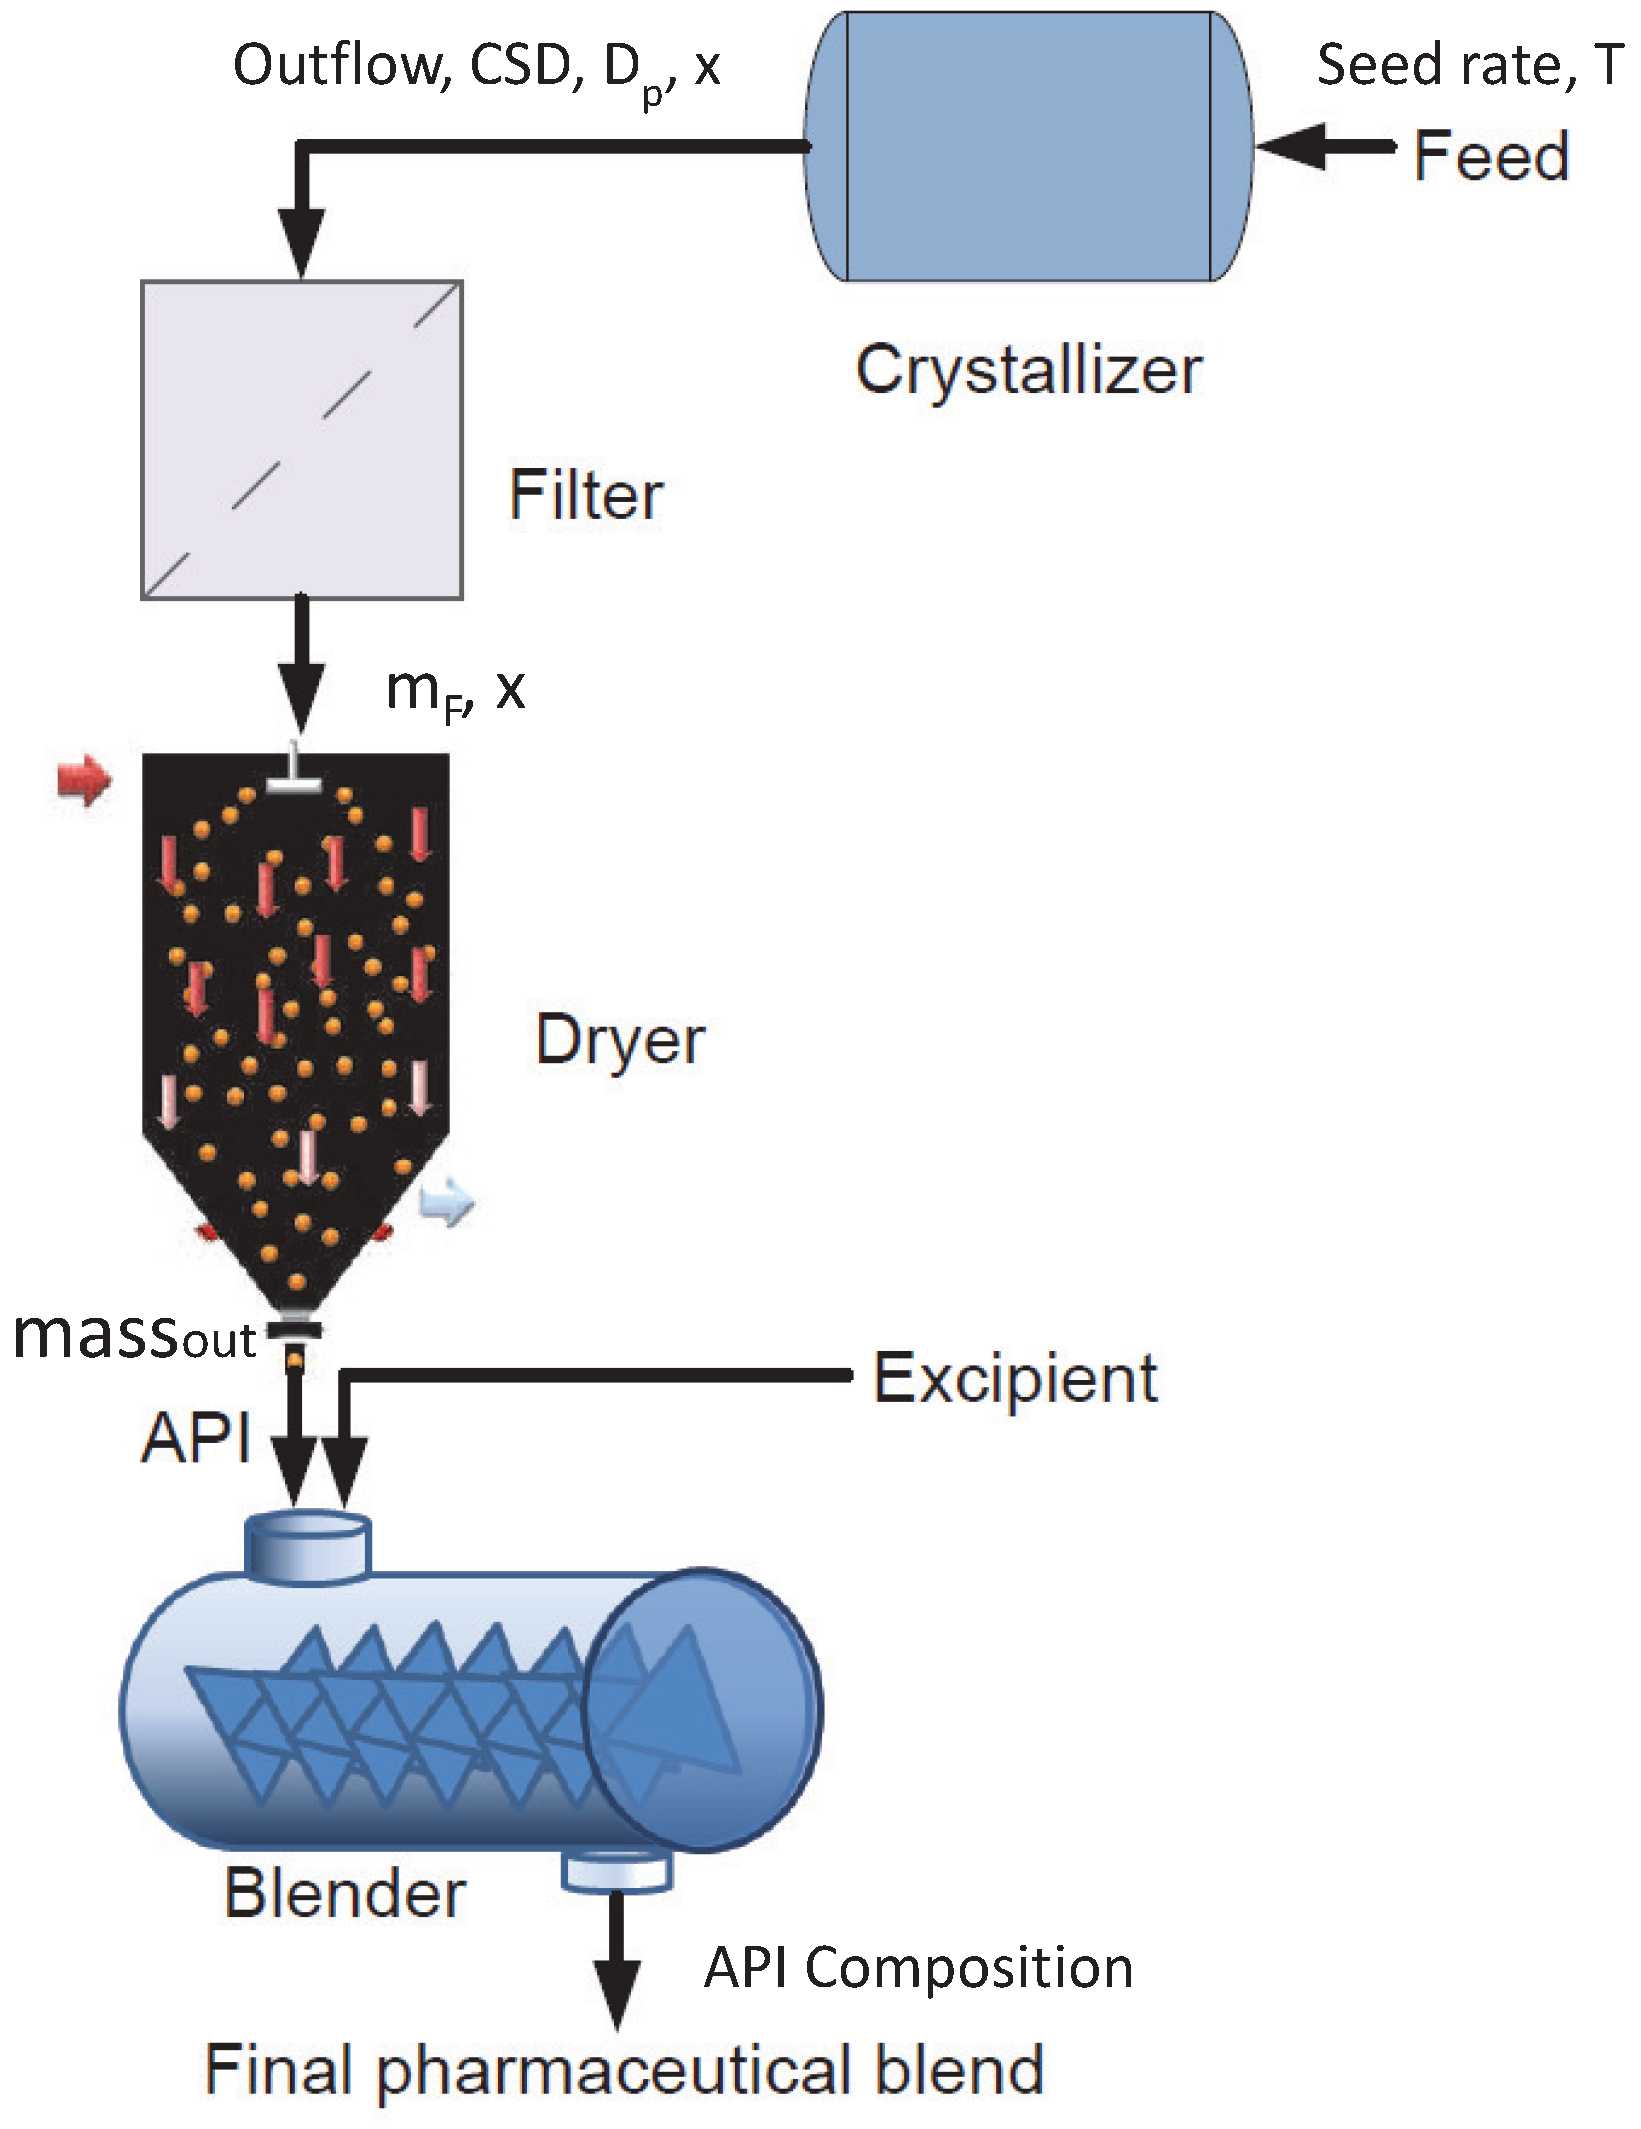
3. Flowsheet Model Description

A brief description of the process has been provided in this section, as the detailed mathematical model has been discussed by the authors elsewhere [10]. The authors have also carried out an optimization study of the same [11]. Figure 1 presents the open loop process flowsheet model. The mathematical equations have been provided as an appendix for the benefit of the reader. The integrated process consists of API crystals being formed during a crystallization operation followed by filtration in order to remove the crystals from the mother liquor. The separated crystals are then sent to the dryer for removal of the surface liquid from the crystals. The dried crystals are then sent to the mixer, where the API is mixed with an excipient to obtain the final pharmaceutical blend. The crystallization model is that of seed-induced cooling crystallization, which has been developed from a population balance equation (PBE). The inputs to the crystallizer are the temperature cooling schedule (T) and seed rate. The outputs of the crystallizer (crystal size distribution (CSD), average diameter ( D p ), liquid content (x) and outlet flow rate of the slurry of the mother liquor and crystals (outflow)) are connected to the filter. The filtration model adapted [40] in this work is for a simple cake filter operating at a constant pressure gradient of 110 kPa (the value has been obtained from an optimization study of the flowsheet [11]). The solid mass or cake mass ( m F ) from the filter is fed to the dryer. For the drying process, a model has been developed, where the liquid is being evaporated from the solid surface (adapted from Mezhericher et al. [41]). The outlet of the dryer (e.g., the flow rate of dried API crystals ( m a s s o u t ) enters the mixer. The mixing model has been developed based on PBE [42]. The mixer rpm has been maintained at 215 (as obtained from the optimization study [11]). One of the critical quality attributes of the final pharmaceutical blend, which has been considered for control in this study, is the fractional API composition.
Figure 1. Pictorial representation of the open loop continuous process.
Processes 02 00392 g001
The control aspects of the crystallization, drying and mixing operations have been discussed, but no control loop has been shown for filtration, because an ideal controller (where the desired set point has been achieved perfectly) has been assumed [13]. In practice, a pressure gauge can be used to measure the pressure gradient across the filtration medium, and the flow of air/exhaust can be adjusted to attain the required pressure gradient [43,44].

3.1. Numerical Technique

The flowsheet model has been developed and simulated in gPROMS™ (London, UK). The PBE developed for the crystallization and mixing model consists of a multi-dimensional hyperbolic partial differential equation (PDE). It has been discretized using a central finite difference scheme followed by integration using an implicit backward differential formula (BDF) technique. Both the discretization and integration have been performed using gPROMS™ built-in functions, which ensure the stability of the overall system and minimal numerical errors and numerical diffusion.
A step change has been given to the manipulated variables in order to obtain the dynamic response of the control variables. A control-relevant transfer function model has been fitted to relate the control and manipulated variables. The control loops have been designed using the Simulink™ (Natick, MA, USA) feature of MATLAB™ (Natick, MA, USA) with the help of built-in PID and MPC controller algorithms. The software computes a linear MPC plant model from the actual Simulink™ model for designing an initial controller.

4. A Systematic Framework for Hybrid Control Design

This section details the steps followed in this work for the design of the hybrid control strategy. Designing a hybrid control scheme should include the identification of the control variables and pairing with suitable actuators, grouping the control variables based on whether MPC or PID is required, the design and implementation of the respective PID and MPC controllers, a performance evaluation and, finally, implementation in the actual plant. The following are the specific steps that have been followed:
  • Identify the critical control variables.
  • Identify suitable actuators or manipulating variables to be paired with the control variables.
  • Obtain the response of the control variables by implementing a step change to the manipulating variables (from the actual flowsheet model, which has been developed in gPROMS™).
  • Fit a transfer function model to relate the control and manipulating variables from the response obtained in the previous step. This has been done using the system identification tool box of MATLAB™.
  • Group the control loops into two categories (i.e., MPC controlled and PID controlled)
  • Design the hybrid MPC-PID control loops in Simulink™.
  • Evaluate the performance of the designed control system in terms of set point tracking and disturbance rejection ability.

5. Design Strategy of the Control System

This section provides the details on the selection of the control variables, the pairing with the suitable actuators and the design of the MPC and PID controllers. The performance comparison and the final design of the control strategy will be provided later in the Results and Discussion section.

5.1. Selection of the Control Variables and Pairing with Suitable Actuators

As mentioned earlier, any flowsheet model is a highly interactive system. In such a system, most of the process variables may have an effect on one another. However, it may not be possible to control each and every one of them. Therefore, only those variables have been selected that have shown a considerable effect on the overall process performance. The control variables have been decided based on a sensitivity study conducted by the authors previously [11,13]. Table 1 lists the control variables and the chosen actuators for each unit operation.
Table 1. List of control and manipulated variables for each unit operation. API, active pharmaceutical ingredient.
ProcessControl variableActuators (Manipulating variable)
CrystallizationTemperature cooling scheduleCoolant temperature
Saturation concentration
DryingDrying gas temperatureSuper-heated steam temperature
BlendingAPI compositionExcipient flow rate
HoldupWeir height
The cooling temperature schedule is the critical process variable in the case of crystallization operation. The solubility (or saturation concentration) of a solute depends on the operating temperature, and it reduces with a decrease in temperature. Therefore, a cascade control scheme (consisting of a slave and master controller) has been considered for crystallization. The saturation concentration has been controlled with the help of a master controller. The actuator of the master controller is the operating temperature that has been controlled by the slave controller. Therefore, the output of the master controller provides the set point to the slave controller. The actuator for the slave controller is cooling the water temperature (passed through the coolant jacket around the crystallizer). The cascade loop has been demonstrated with the aid of a hybrid MPC-PID design, where MPC is the supervisory controller and used to control the saturation concentration. PID is the secondary controller used to control the operating temperature. A cascade control loop has been shown to have an enhanced performance over single-loop control in many instances [14]. For example, under certain scenarios (e.g., when a large dead time is involved; or when a disturbance affects an intermediate variable that has a considerable influence on the main control variable; or the gain of the secondary process and the actuator is nonlinear), it is difficult to control the main control variable efficiently without controlling the intermediate variables. It is possible to control the intermediate variables, as well, with the help of the cascade control loop, which indicates that the overall performance will be better than a single-loop control system.
The control variable in case of drying is the drying gas temperature. Air has been considered as the drying gas in this case. Air at atmospheric temperature can be heated up to a desired temperature in a heat exchanger using super-heated steam and then sent to the dryer. The actuator in the case of drying is the super-heated steam temperature.
There are two control variables of interest in the case of the mixer (i.e., fractional API composition of the final pharmaceutical blend and holdup). Mixer holdup is an important control variable, as it has been known to have a considerable effect on the product RSD (relative standard deviation, which is used to quantify the uniformity of the final mixed product) [45]. It has been seen that both the cooling temperature schedule (of the crystallization operation) and the excipient flow rate has a considerable effect on the API composition. The cooling temperature schedule affects the API composition, as it governs the crystal growth rate, which, in turn, changes the outlet flow rate of the crystals. The holdup has been controlled by manipulating the weir length. It should be noted that the effect of the weir length on the holdup has been determined by running DEM simulations of the mixing operation. Several DEM simulations of the mixer have been run by varying the weir length (i.e., 10 mm, 30 mm and 50 mm). In EDEM™ (Edinburgh, UK) (DEM Solutions), a commercial blender (Gericke GCM250 (tm)) with impeller blades in alternating forward and backward orientation has been simulated. The length and diameter of the mixer are 330 mm and 100 mm, respectively. A feed rate of 0.018 kg/s and an impeller speed of 250 rpm have been maintained. A normal particle size distribution with a mean radius of 1 mm with 5% standard deviation has been used. Each simulation has been run for 50 seconds. More details on the DEM simulation can be obtained from Sen et al. [46]. The DEM simulations have been post-processed to obtain the mean residence time of the particles within the mixer. The holdup has been calculated from the input flow rate and the mean residence time. A transfer function has been fitted to relate the holdup with the weir length.

5.2. Design of Controller

PID is the most commonly used controller in the manufacturing industry, because of its simplicity (ease of implementation and use). There are three important tuning parameters for a PID controller (i.e., gain ( K c ), reset time/integral time ( τ I ) and rate/derivative term ( τ D )). The difference between the set point and measured control variable at any time point is the error ( ϵ ( t ) ). In the PID-only design scheme of the flowsheet model, five PID controllers have been used (two PID controllers for the cascade arrangement in case of crystallization operation, one PID controller for the drying gas temperature, one PID controller for the API composition and one PID controller for the holdup). The controller parameters have been tuned using the Ziegler-Nichols tuning technique, which is a heuristic approach [47].
An advanced MPC consisting of four inputs and four outputs has been designed for the API separation and purification process using the MPC toolbox of MATLAB™. The MPC is based on the optimization of an objective function within a moving horizon; therefore, it is also called the receding horizon scheme. The formulated MPC objective function is given in the Appendix, which consists of the weighted square sum of control variable deviations, the weighted squared sum of controller adjustments and the weighted squared sum of manipulated variable deviations. As required for MPC, a linear time-invariant (LTI) model has been first developed in Simulink using a detailed process model, and then, this model has been imported to the MPC toolbox for MPC configuration and design. MPC uses the developed linear model to generate the future process response within a prediction horizon, and through optimization, it generates the actuator signal within a control horizon. The prediction horizon ( P ) and control horizon ( M ) have been decided, such that the difference is significantly greater than the ratio of the maximum process delay ( t d m a x ) and the control interval ( t ) ( P - M > > t d m a x / t ) , as suggested in the scientific literature [6]. The MPC performance depends significantly on its tuning parameters, which are output weights, input weights and rate weights. The output weight decides which control variable needs to be given more weightage over the others, the input weights help to maintain the actuator at a nominal value for consistent performance, and rate weights decide the step size of the control action. Increasing the rate weight leads to smaller steps of controller action, and therefore, better process performance, but at the expense of higher computational power and optimization time. The MPC tuning parameters have been tuned using the optimization-based method (integral of time absolute error (ITAE) [47]) available within the optimization toolbox of MATLAB™. After MPC configuration, the closed-loop performance has been assessed for set point tracking and disturbance rejection before importing the designed MPC to the Simulink™-based process flowsheet model, which conceptually represents the virtual manufacturing plant where the PID-based slave controller is already implemented. The performance of the hybrid MPC-PID scheme is then evaluated for set point tracking and disturbance rejection. After satisfactory performance, the inputs and outputs of the process model can be easily switched with the plant inputs and outputs through the MATLAB OPC toolbox, as shown by Singh et al. [32].
In the hybrid MPC-PID scheme, one MPC block replaces four PID controllers and connects four input and output variables through a single control block, and only one PID controller has been retained as the slave controller in the cascade arrangement, as designed for the crystallization operation. Therefore, there are 15 PID parameters to be tuned in total in the case of the PID-only scheme; whereas only three PID parameters need to be tuned in the case of the hybrid scheme.

6. Results and Discussion

The results of the hybrid MPC-PID control scheme are detailed in this section. The performance of the hybrid scheme is also compared with the performance of a basic regulatory PID-only control scheme. The comparison study has been performed on the basis of set point tracking and the disturbance rejection ability of the control system. A step change has been given to the set points of the control variables in order to study the set point tracking ability of the controllers. Disturbances in the form of a sinusoidal function ( A . s i n ( t / 10 ) ) have been introduced to the controller input signal for the disturbance rejection study. The intensity of the structural disturbances is 5% of the set point. The control limit has been considered to be 2% more or less than the set point (as suggested in the scientific literature [14]). The results have been reported for 2000 s (approximately 33 min). It should be noted that measurement noise has been taken into consideration while studying the set point tracking ability of the controller. However, measurement noise has not been added separately while studying the disturbance rejection. The assumption is that the disturbance consists of the sensing noise, as well as noise due to other unknown and known factors. The controller performance has been quantified by calculating the ITAE using Equation (1). While evaluating the performance of a controller, it is important to know the absolute error over the entire period of the control action (in order to know how the controller behavior is over time). Absolute error is the magnitude of the exact difference between the set point and the measured value. The integral of time square error (ITSE) can also be considered; however, it is less sensitive compared to ITAE. Similarly, the integral of the absolute error (IAE) or the integral of the squared error (ISE) can also be used. However, ITAE produces smaller oscillations compared to IAE and ISE, and it also includes the “time” term [48]. Therefore, ITAE has been chosen as the criterion of comparison.
I T A E = 0 t t | ( s e t p o i n t - m e a s u r e d v a r i a b l e ) | d t
Figure 2. Pictorial representation of the closed-loop continuous process. PID (proportional-integral-derivative); MPC (model predictive control); MV (manipulated variable/actuator); CV (control variable).
Processes 02 00392 g002

6.1. Control System Design

In this section, a pictorial representation of the developed control system is presented. A hybrid MPC-PID cascade control loop has been proposed for crystallization. The other control variables (i.e., drying gas temperature, API composition and holdup) have been controlled via MPC only. Figure 2 is the integrated process along with the control loops. The control loop for the crystallization step is a cascade arrangement. C s a t is measured and fed to the MPC block, which generates the set point for the cooling schedule ( T s e t p o i n t ) for the PID (Controller 001). The slave controller controls the temperature cooling schedule (T) by manipulating the temperature of the cooling water ( T c ) flowing through the cooling jacket. The drying gas temperature ( T g a s ) is measured and fed to the MPC block, which generates the control signal by manipulating the super-heated steam temperature ( T s ), which heats the air in a heat exchanger. The hot air is then sent to the dryer. The API composition at the mixer outlet is measured and fed to the MPC block, which manipulates the excipient flow rate to maintain the API composition at a desired set point. The holdup has been controlled by the MPC block by manipulating the weir length. Table 2 lists the controller tuning parameters. In the case of PID (Controller 001), a high value of the reset time signifies a low value of the integral term. Therefore, only the proportional and derivative terms are the most effective in this case. It can be seen that the output weights (MPC parameter) of all the control variables is one, which means that the same weightage has been given to all the control variables. The value of the rate weight for every control variable is 0.1. It should be noted that in case of the MPC, the control interval is 1 s, the prediction horizon is 10 s and the control horizon is 2 s.
Table 2. List of controller tuning parameters.
PID parameters
Control loopGain ( K c ) Reset Time ( τ I ) Rate ( τ D )
Crystallization (slave loop)−0.1662.95 × 10 4 s1.09 × 10 4 s
MPC parameters
Control loopInput WeightRate WeightOutput Weight
Crystallization (master loop)00.11
Drying00.11
Mixing (API composition)00.11
Mixing (holdup)00.11
Figure 3. Hybrid MPC-PID performance of the saturation concentration.
Processes 02 00392 g003
In the case of the crystallization process, saturation concentration is the control variable for the master controller. The output of the master controller (temperature cooling schedule) provides the set point to the slave controller, which controls the cooling temperature schedule by manipulating the coolant temperature (passed through the coolant jacket around the crystallizer). The slave controller has been retained as a simple regulatory PID (which controls the temperature cooling schedule) and MPC acts as the master controller (which controls the saturation concentration). Therefore, the output of MPC (temperature cooling schedule) acts as the set point for the slave controller. In the case of the cooling crystallization, the operating temperature of the system is decreased, so that the saturation concentration or the solubility decreases and the solute precipitates out of the solution to form crystals. Therefore, the set point for the saturation concentration has been decreased over time following a linear function. Figure 3 illustrates the saturation concentration. It can be seen from the plot that the controller is able to maintain the variable at the specified set point within the specified control limits. ITAE calculated for saturation concentration is 1.995 × 10 5 .
In the case of the drying operation, the drying gas temperature is the control variable, and the superheated steam temperature is the manipulating variable. The set point has been specified as 500 K. It can be seen from Figure 4 that the controller is able to maintain the drying gas temperature at the desired set point, within the control limits. The ITAE calculated for drying gas temperature is 2.86 × 10 6 .
Figure 4. Hybrid MPC-PID performance of the drying gas temperature.
Processes 02 00392 g004
In the case of the mixing process, two control variables have been considered (API composition and holdup). It has been mentioned before that the temperature cooling schedule affects the API composition of the final mixed product. The manipulating variables for API composition are excipient flow rate and crystallization operating temperature. In the case of holdup, the weir length is the manipulating variable. The set points for API composition and holdup are 0.15 and 6 kg, respectively. Figure 5a,b present the controller performance for API composition and holdup, respectively. It can be seen from the plots that the controller performance is satisfactory. The ITAEs calculated for the API composition and holdup are 1.195 × 10 3 and 4.3 × 10 4 , respectively.
Figure 5. Hybrid MPC-PID performance of the mixing process. (a) API composition; (b) holdup.
Processes 02 00392 g005
The designed control system can be implemented within the manufacturing plant using the systematic implementation methodology previously proposed [49].

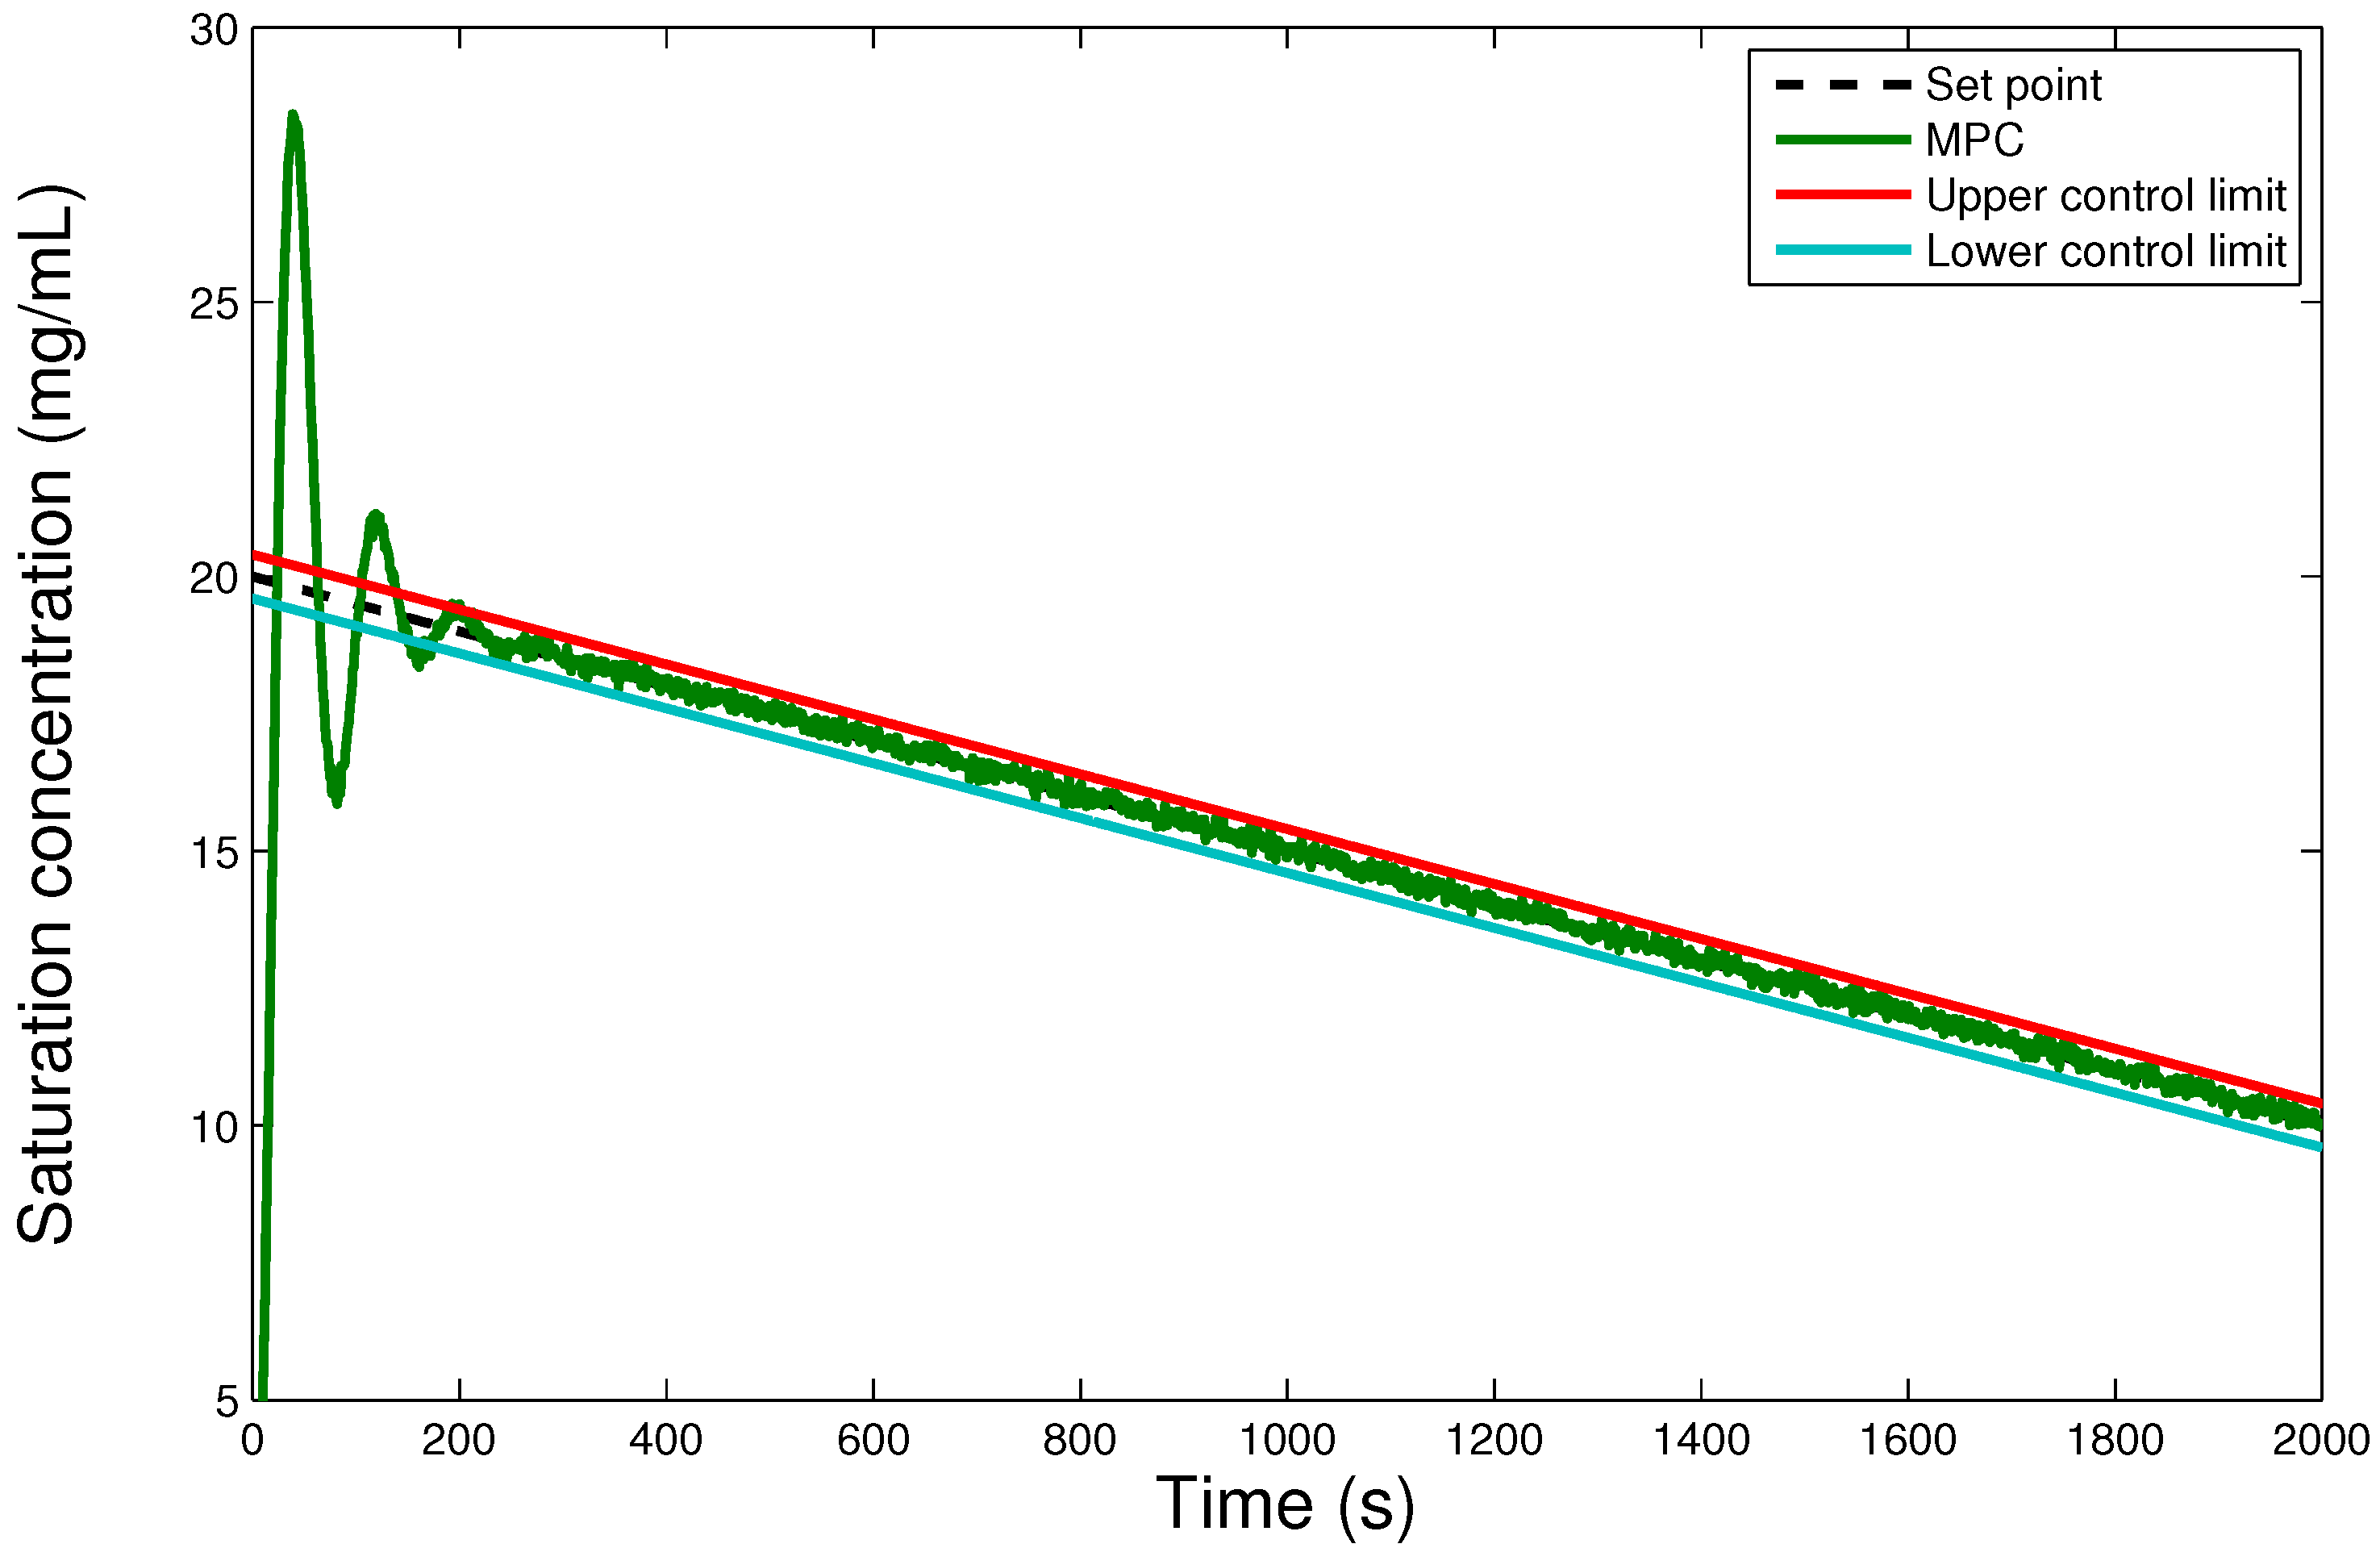
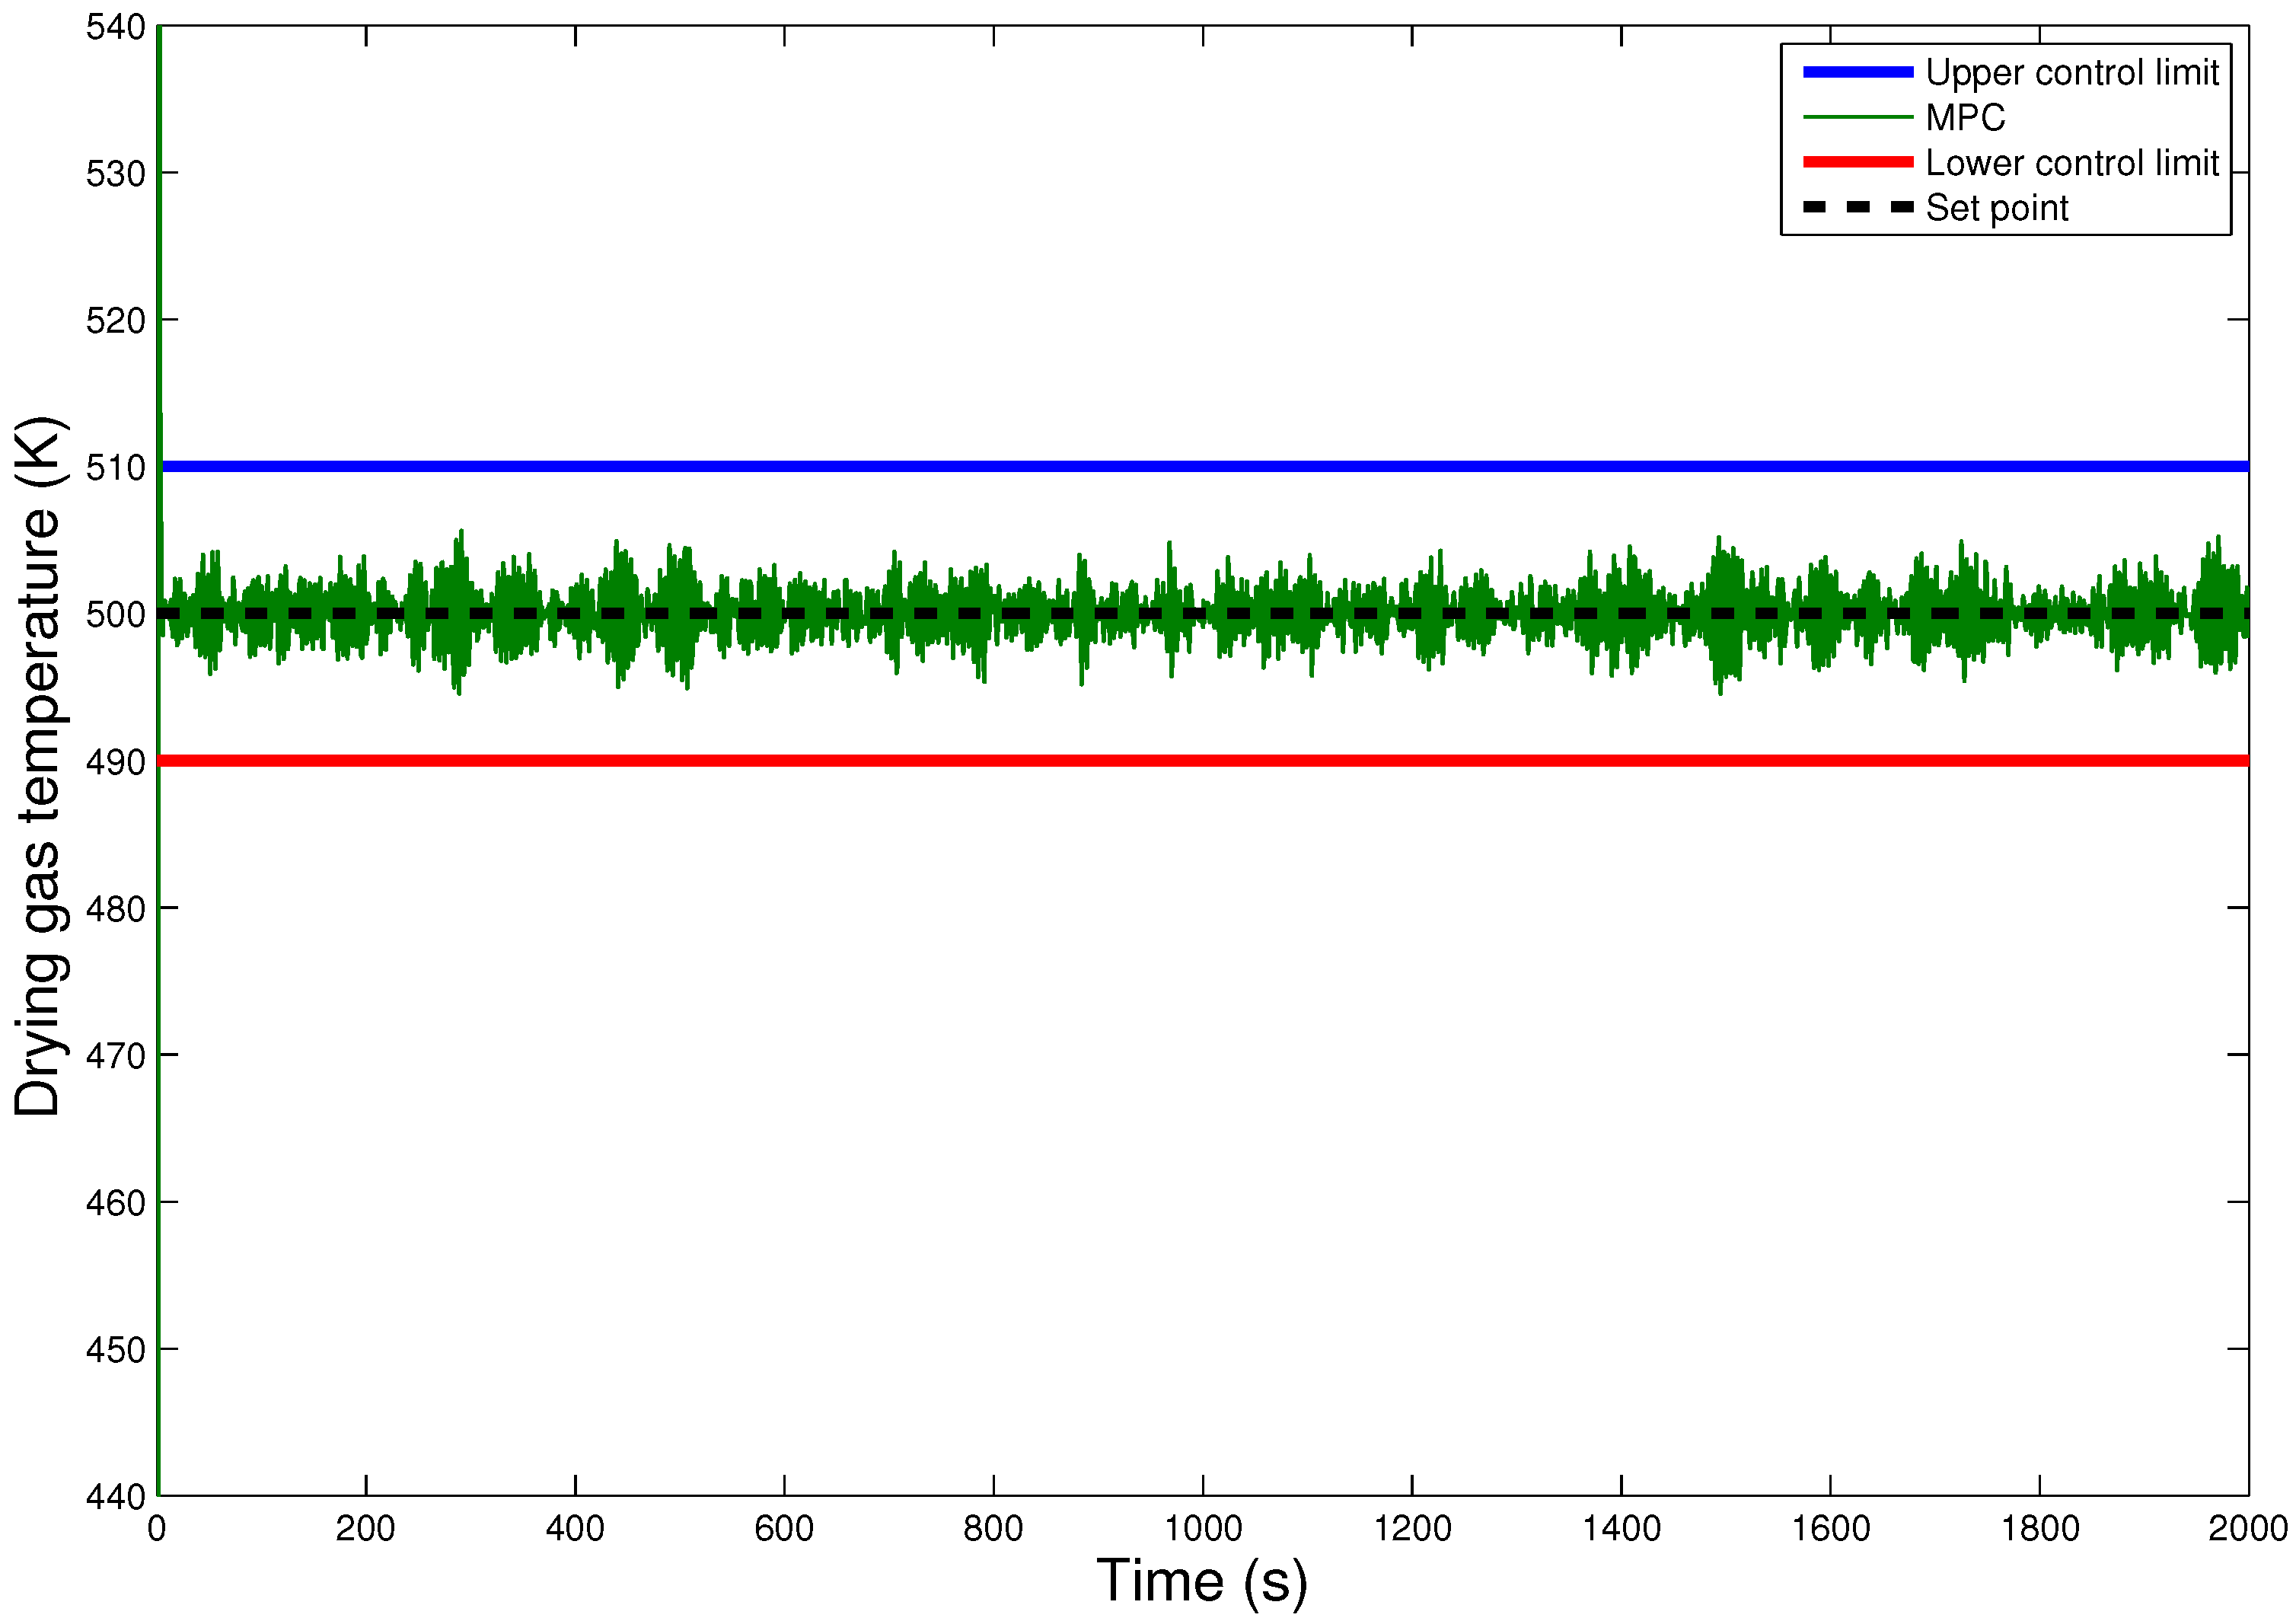
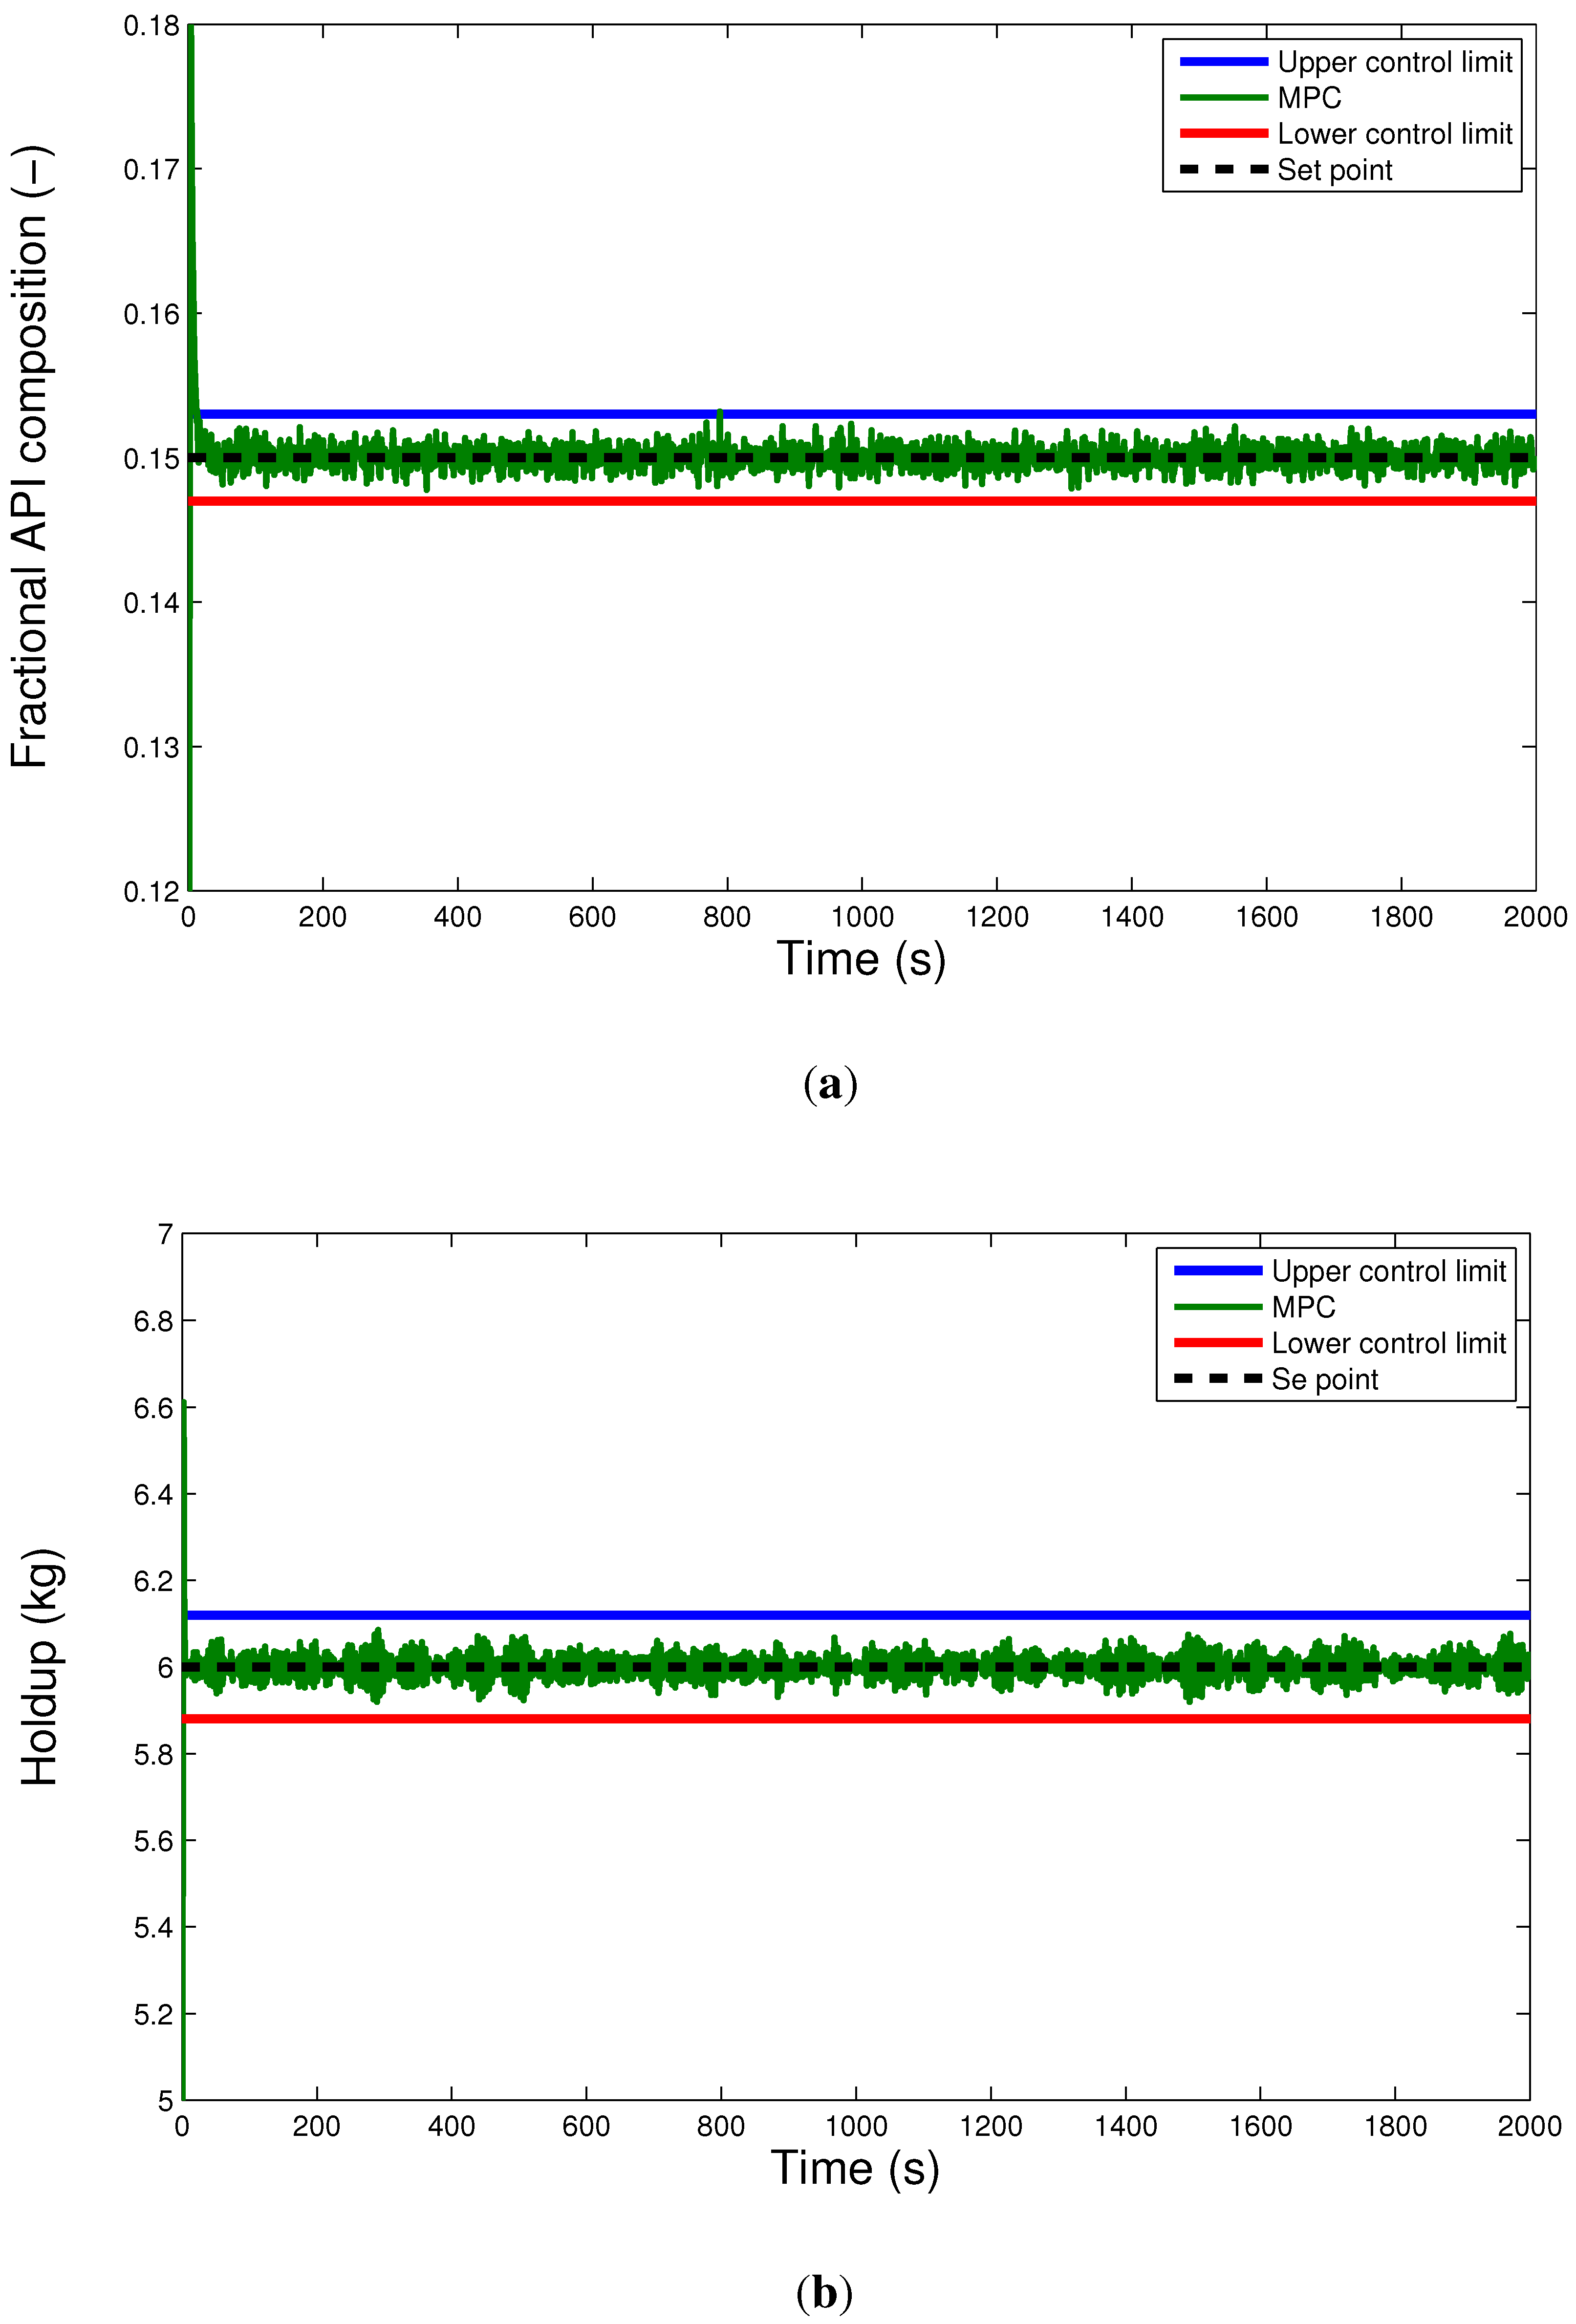
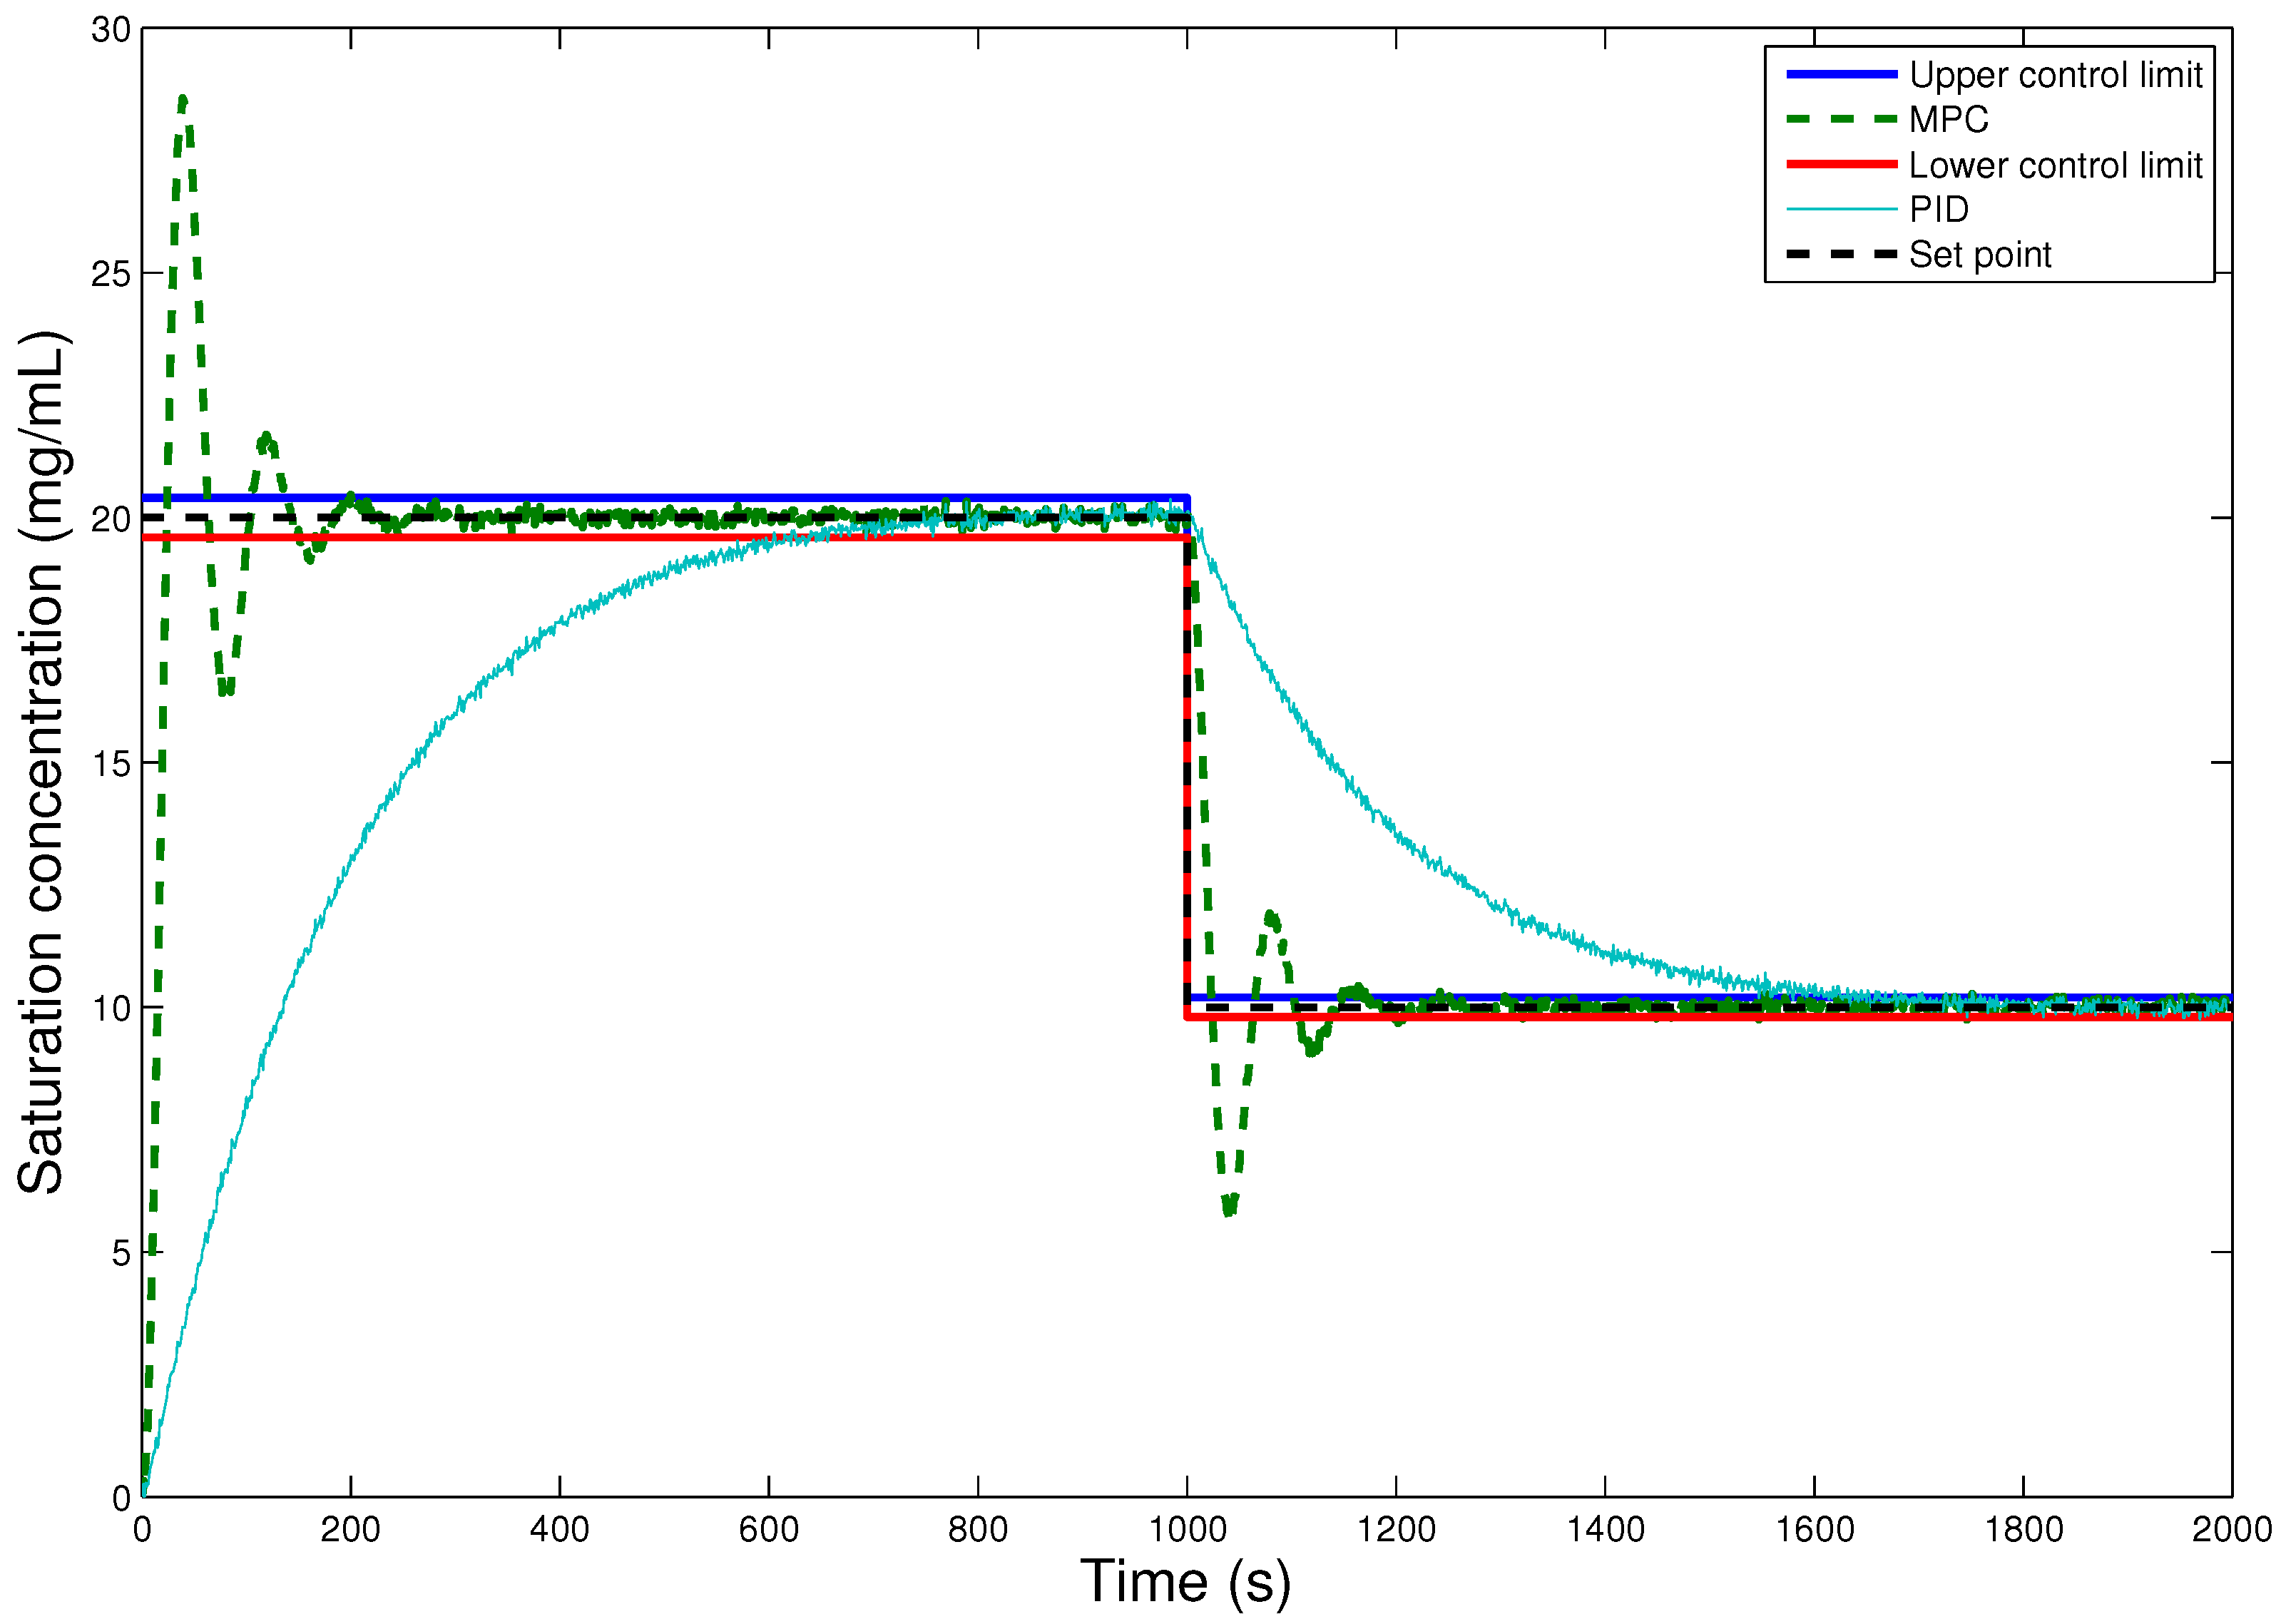
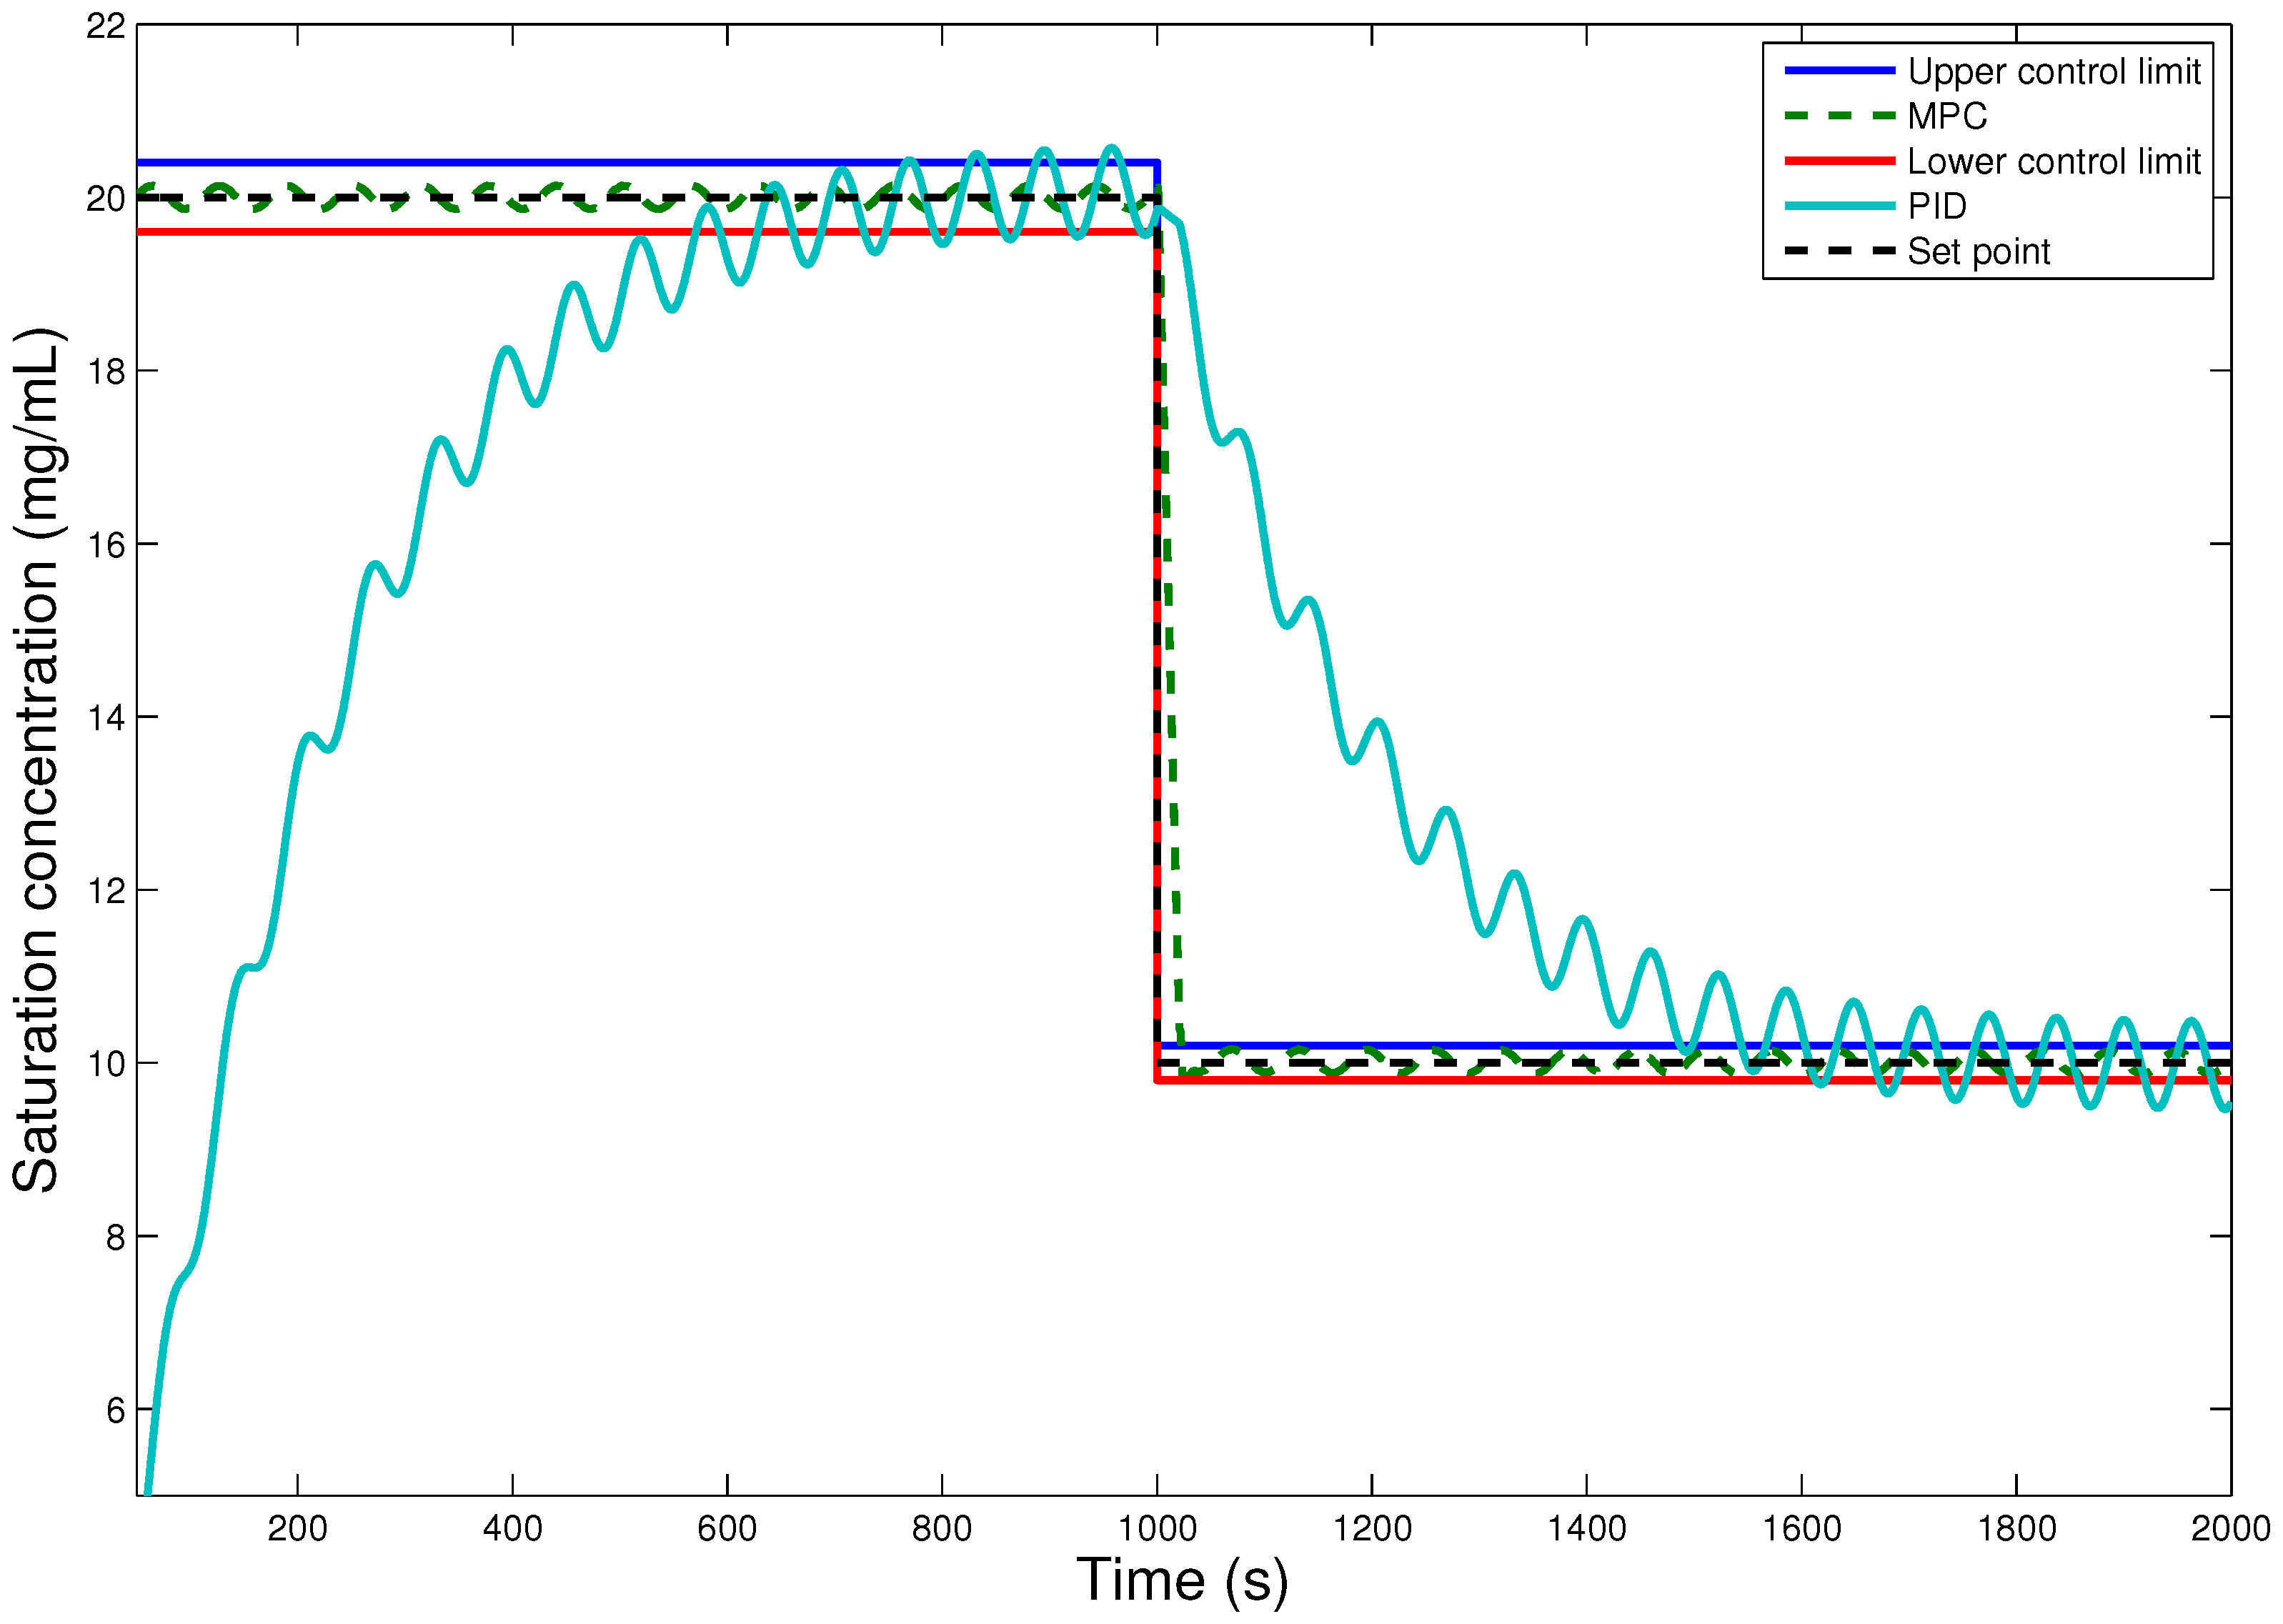
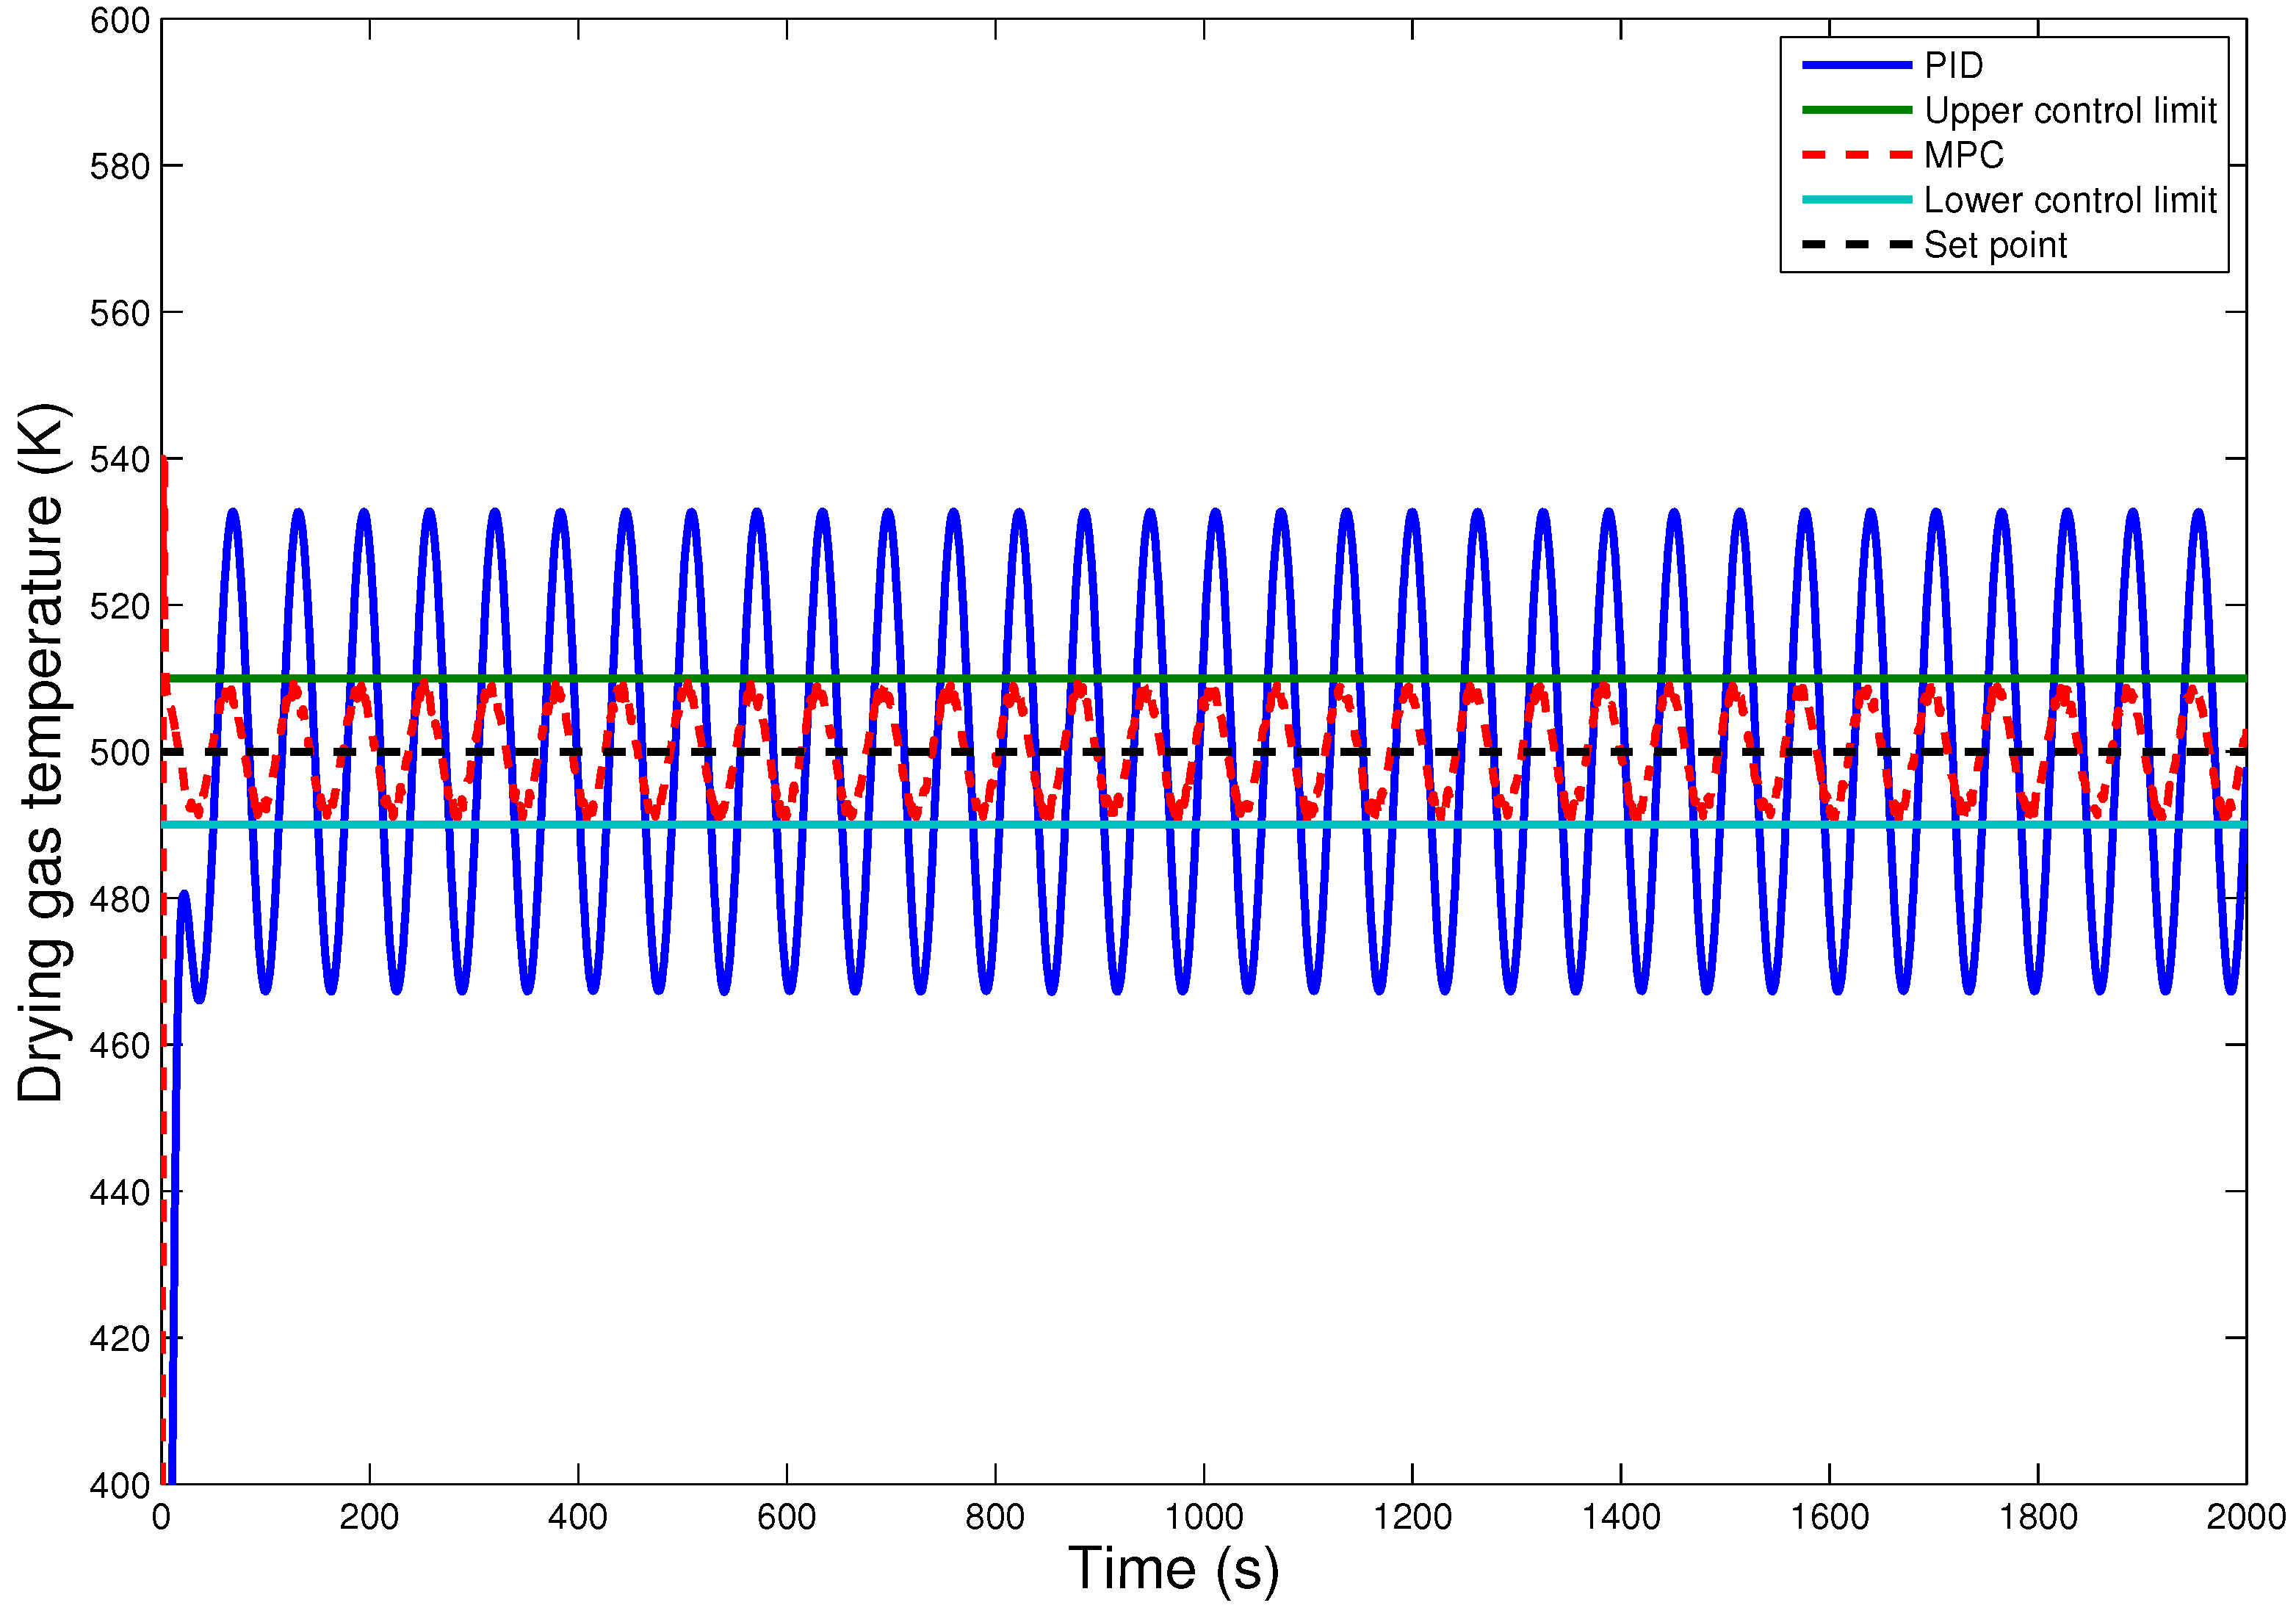
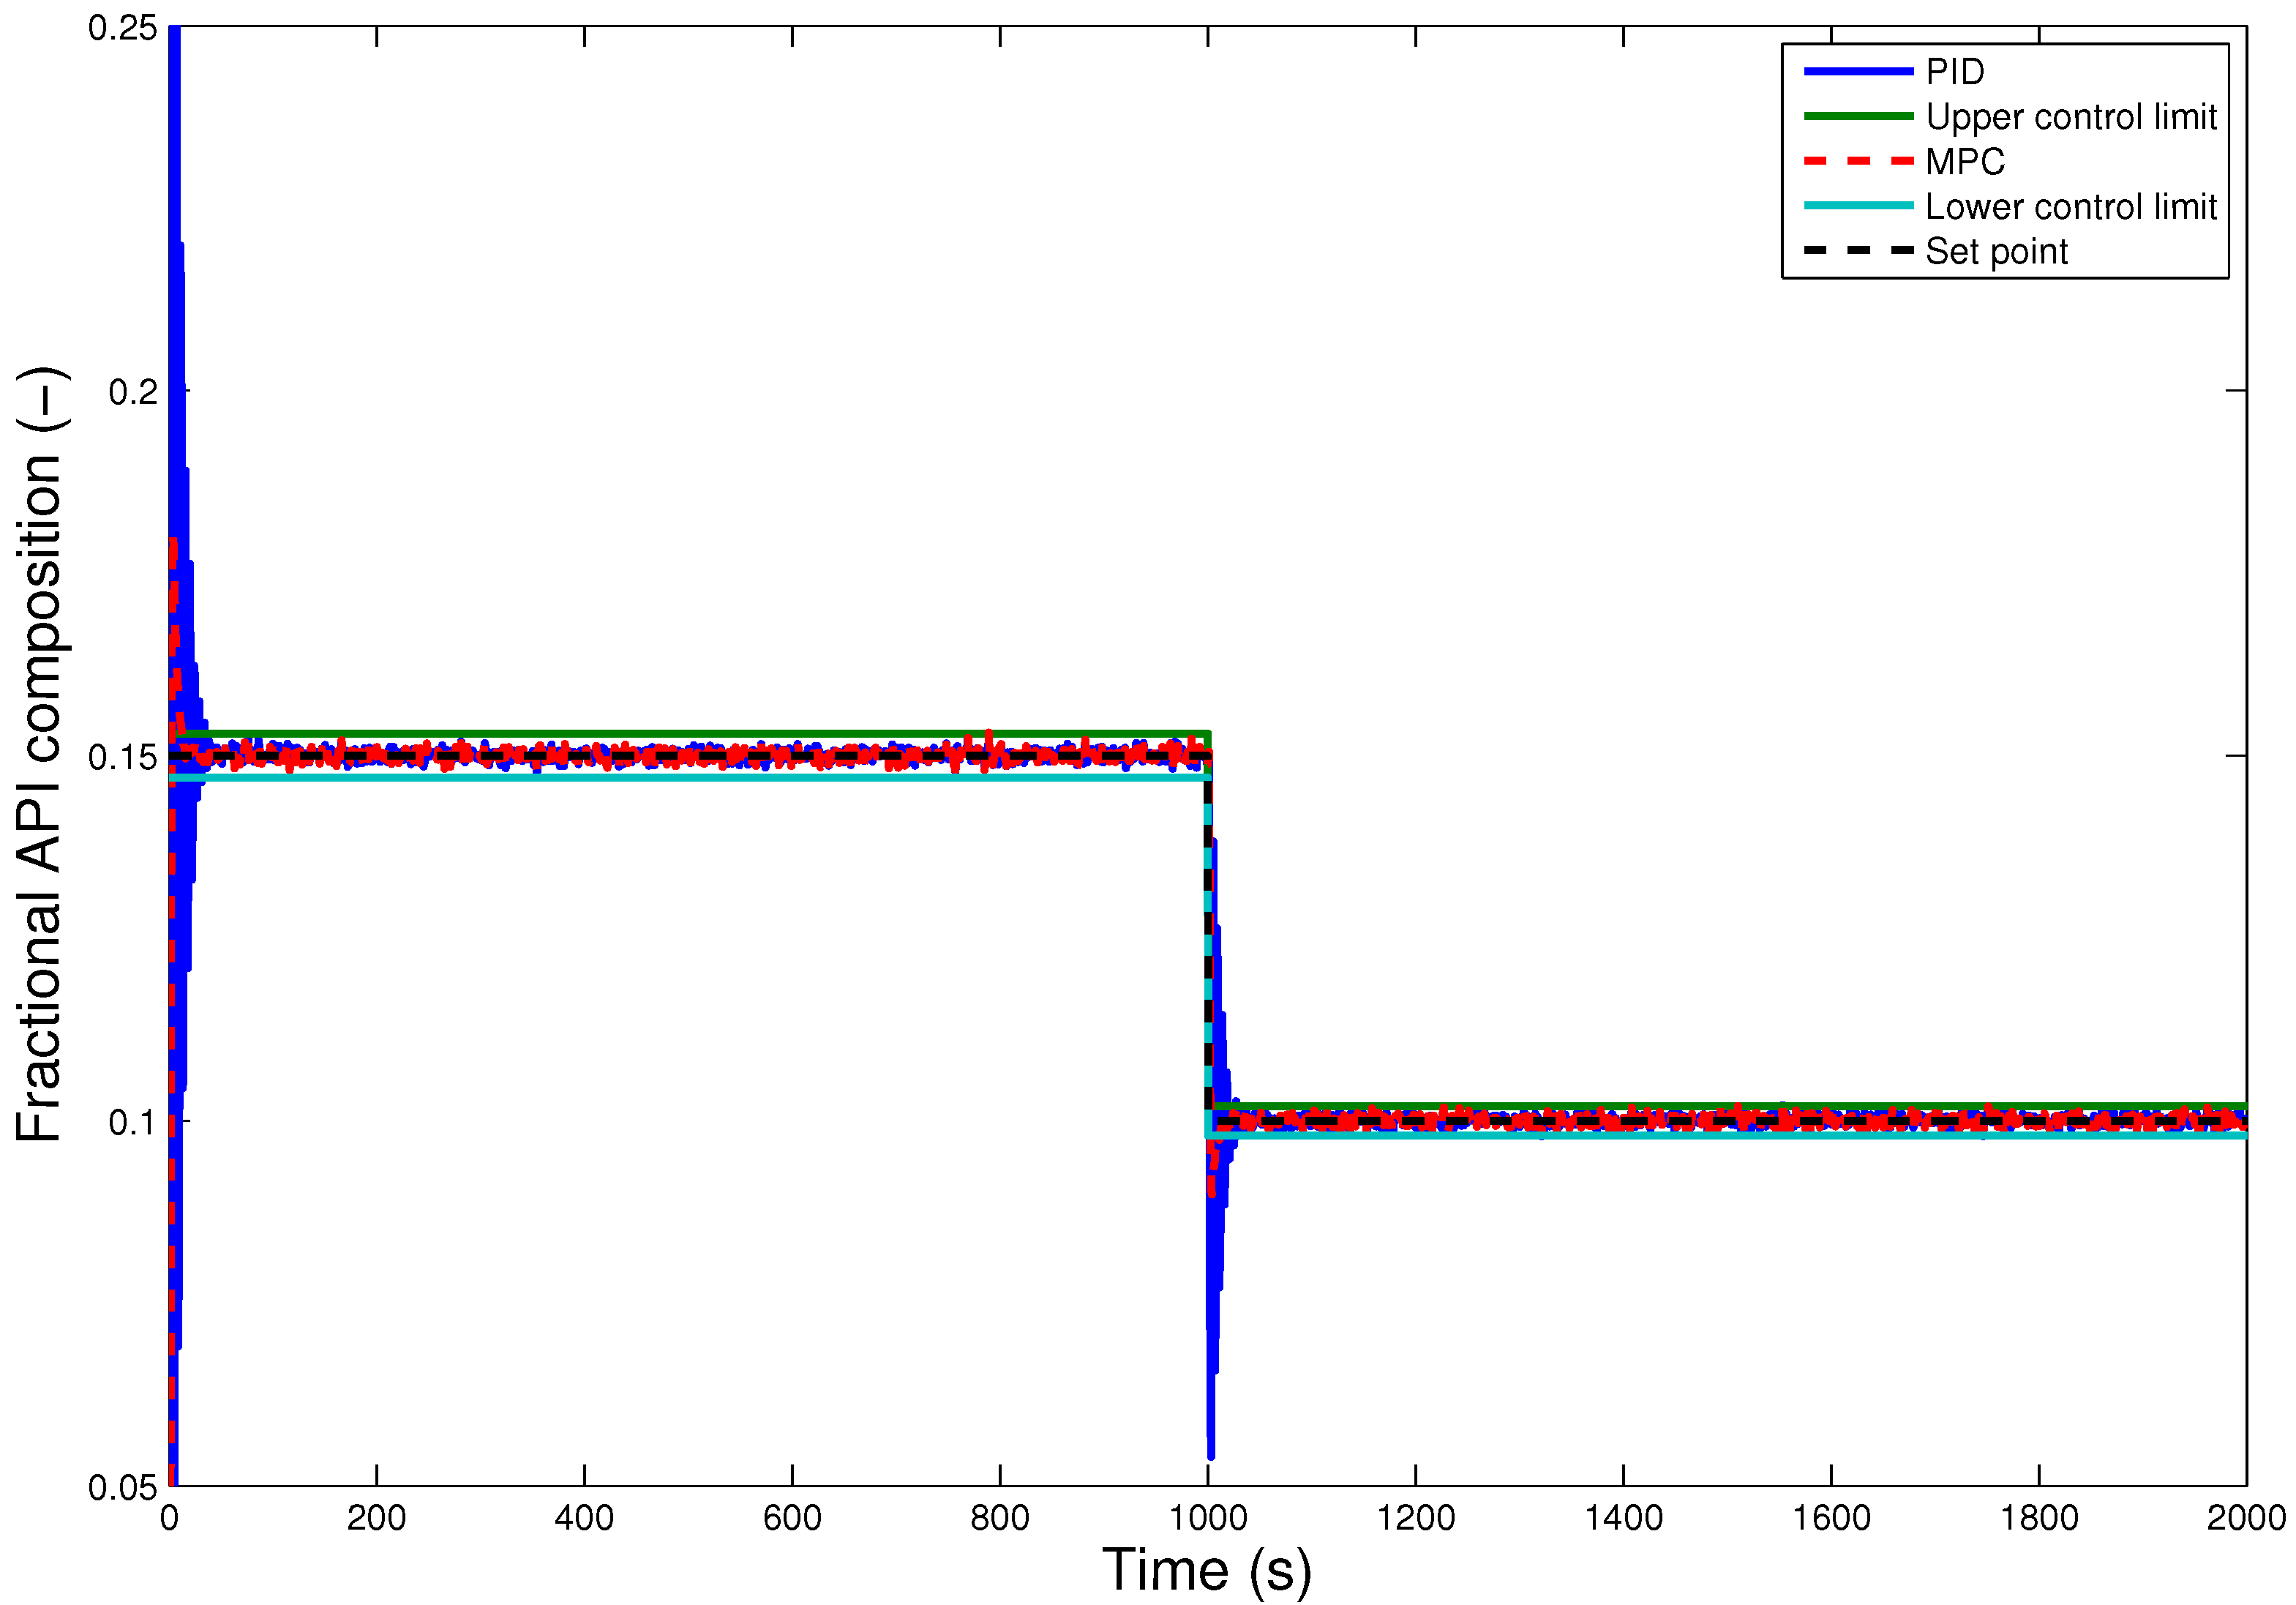
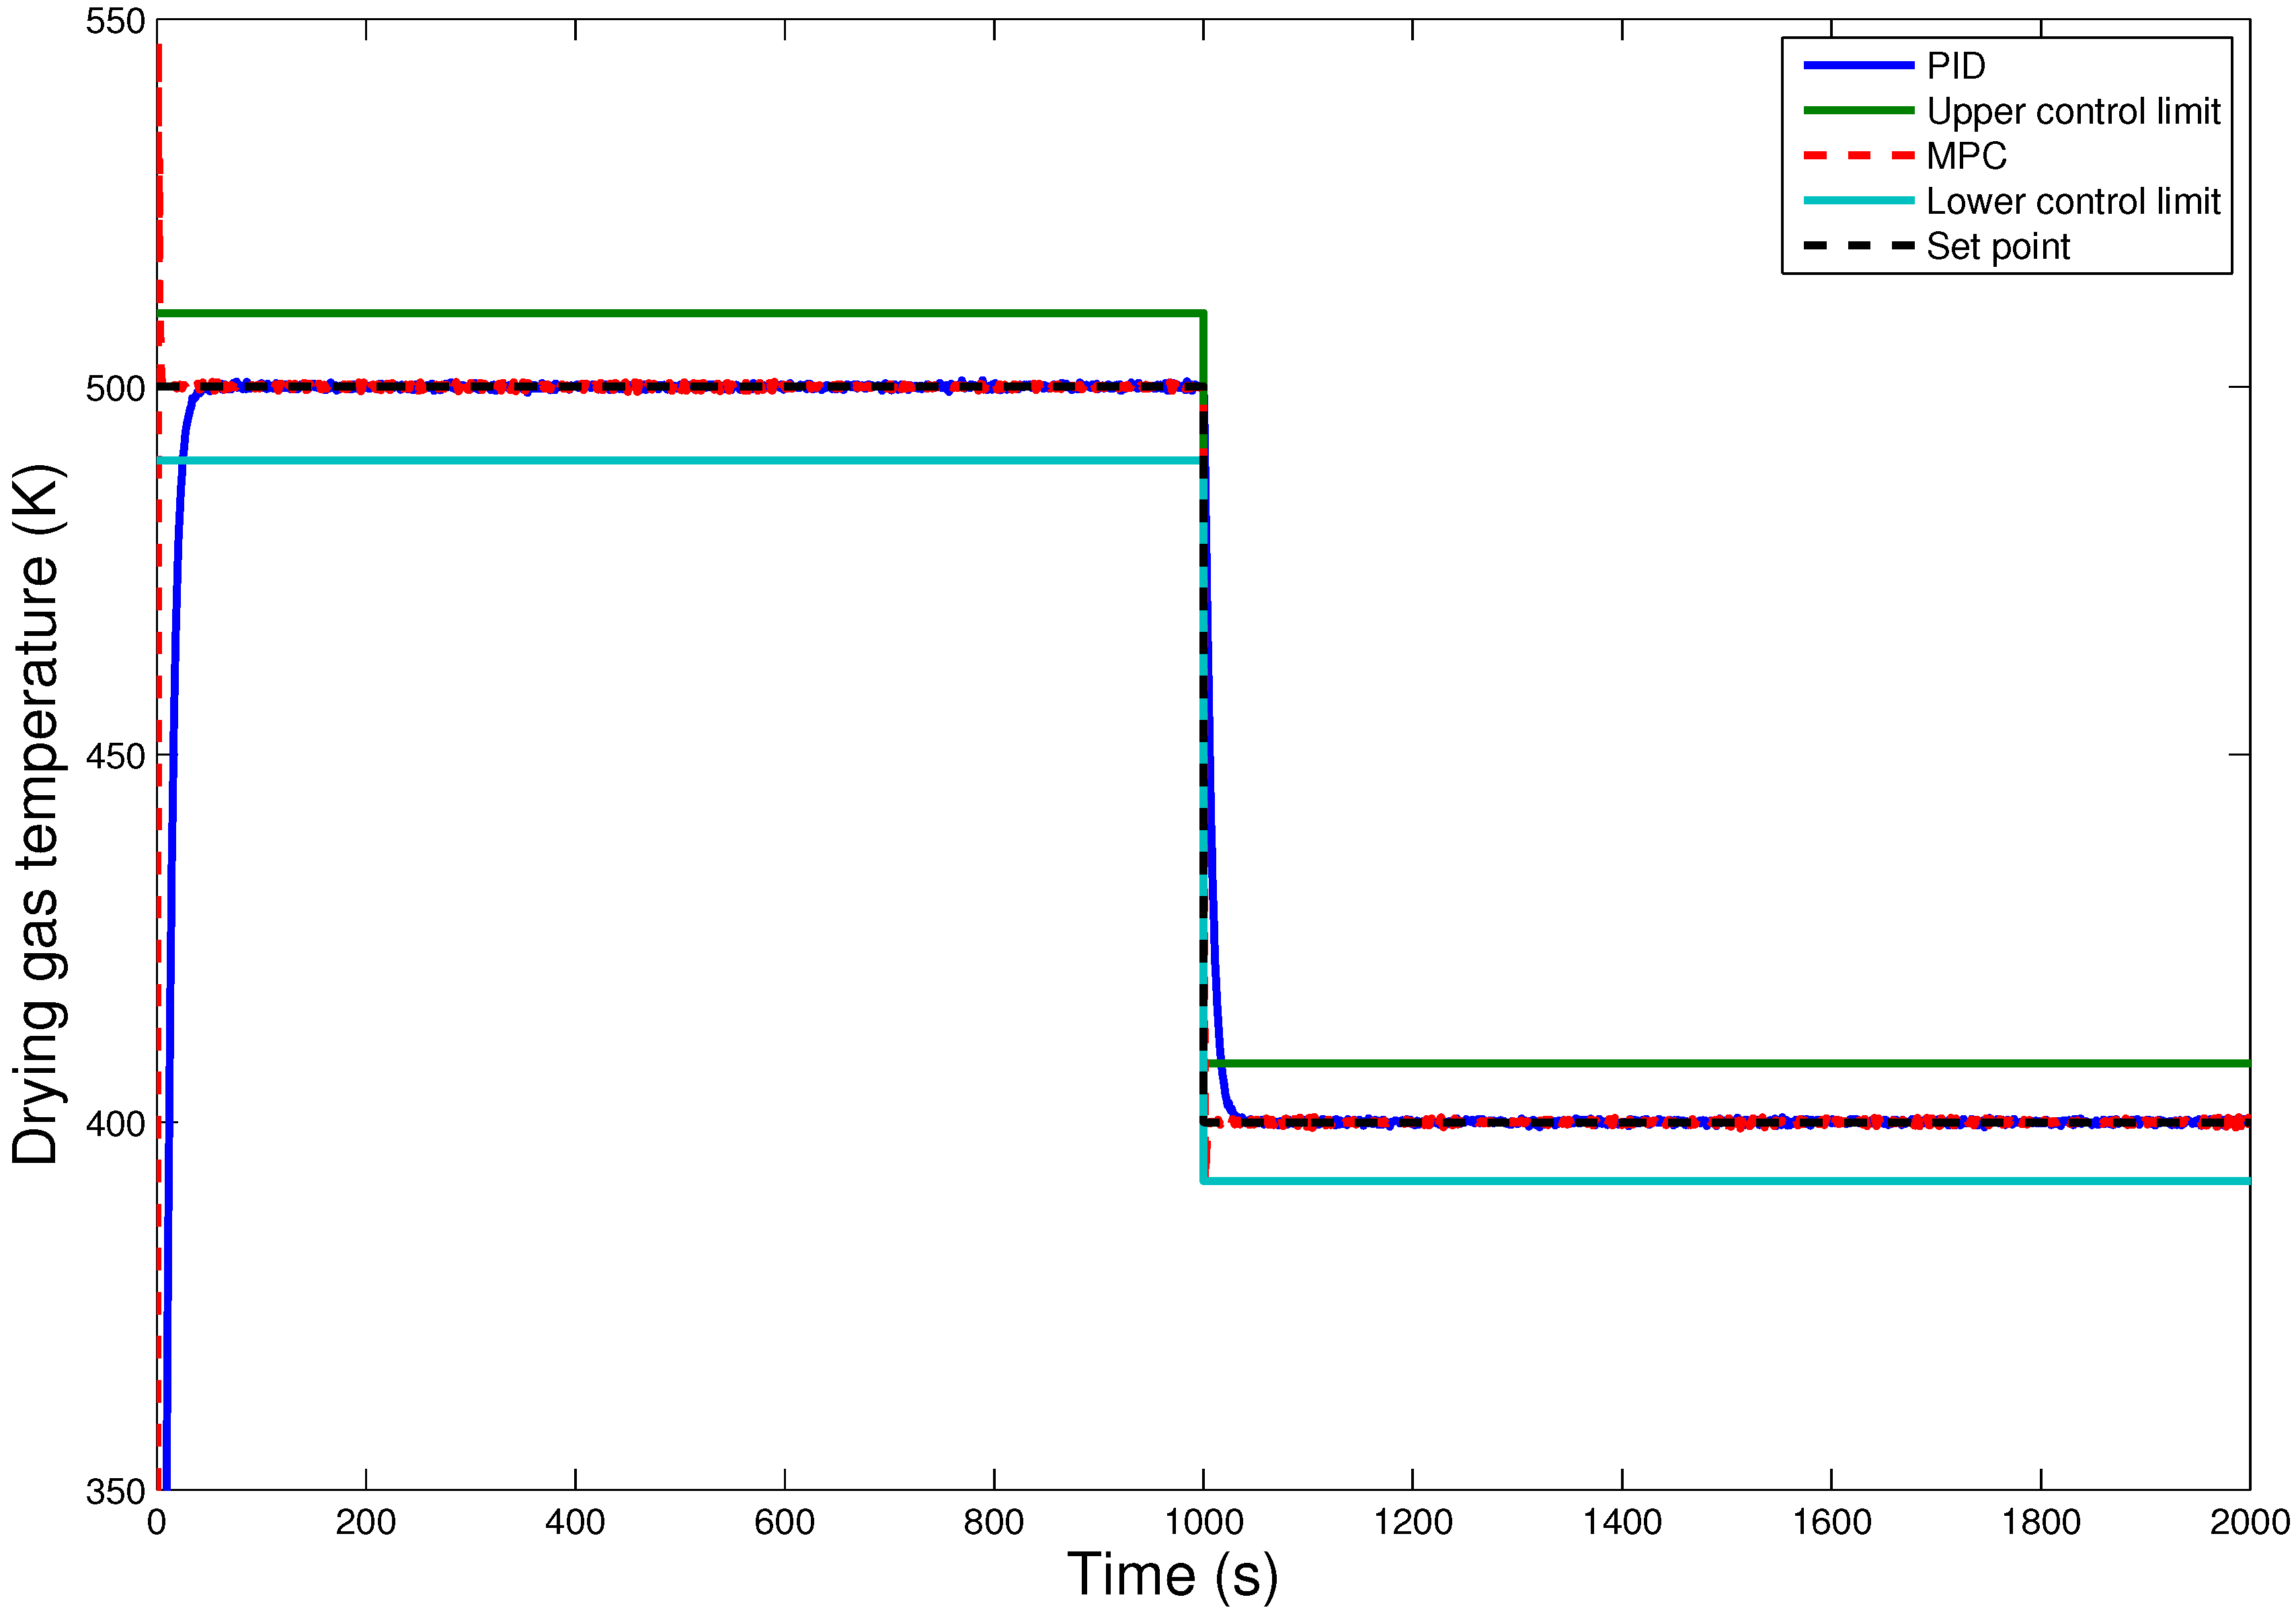
6.2. Comparison of the Hybrid MPC-PID Scheme with PID-only Scheme

In this section, the performance of the MPC-PID hybrid scheme is compared to that of the PID-only scheme, on the basis of the set point tracking and disturbance rejection ability. The ITAE values of the evaluated control loops, for the PID vs. MPC performance, have been listed in Table 3.
Table 3. List of integral time averaged error (ITAE) values for the MPC vs. PID performance assessment.
Set point tracking
Control loopMPC-PIDPID-only
Saturation concentration6.322 × 10 5 2.935 × 10 6
Drying gas temperature7.371 × 10 5 2.068 × 10 6
API composition1.584 × 10 3 1.892 × 10 3
Disturbance rejection
Control loopMPC-PIDPID only
Saturation concentration3.317 × 10 5 4.540 × 10 5
Drying gas temperature1.556 × 10 7 6.193 × 10 7
In the case of the crystallization process, two PID controllers (PID-PID) have been considered (one is the master controller, and the other is the slave controller), and their performance has been evaluated with respect to the MPC-PID design. Figure 6 presents the responses of both MPC-PID and PID-PID. It can be seen from the plot that the response of the MPC-PID stabilizes faster compared to PID-PID. The response of the PID controller is sluggish in this case. Although, there is overshoot present initially in the response of MPC-PID, the decay ratio is high as preferred for an efficient control action, and it can be seen that the controller is able to maintain the control variable within the control limits. The MPC response is that of an under-damped response; however, the oscillations decrease over time, and the response stabilizes within first 250 s (approximately four minutes). The ITAEs calculated for MPC-PID and PID-PID are 6.322 × 10 5 and 2.935 × 10 6 , respectively, which means that the performance of the hybrid MPC-PID scheme is better than that of the cascade PID scheme. Figure 7 presents the disturbance rejection as obtained from both of the schemes. It can be seen from the plot that the disturbance rejection ability of MPC-PID is better than that of PID-PID. MPC-PID is able to reject the disturbances and maintain the control variable within the upper and lower bounds, and on the other hand, PID-PID violates the bounds. The ITAEs calculated in the case of disturbance rejection for MPC-PID and PID-PID are 3.317 × 10 5 and 4.540 × 10 5 , respectively. Based on these observations, it can be concluded that a cascade control loop with the MPC-PID is more efficient than the PID-PID.
Figure 6. Controller performance evaluation for the set point tracking of the saturation concentration.
Processes 02 00392 g006
Figure 7. Disturbance rejection ability of controllers for the saturation concentration.
Processes 02 00392 g007
Figure 8 presents the performance of PID-only and MPC-only in the case of drying. A step change has been given to the set point. It can be seen that the response of the PID is sluggish, and it takes more time to stabilize compared to the MPC. Although, MPC has an overshoot present initially, it has a lesser settling time (the time it takes to reach the set point) compared to the PID. The ITAEs calculated for the MPC and PID are 7.371 × 10 5 and 2.068 × 10 6 , respectively. Similarly disturbances in the form of sinusoidal functions have been introduced to the controller input signal. Figure 9 presents the performance of both PID and MPC in the presence of disturbances. It can be seen from the plot that the MPC handles the disturbances much more effectively compared to the PID. MPC is able to keep the control variable within the control limits, whereas in the case of PID, the bounds are violated. The ITAEs calculated in the case of disturbance rejection for MPC and PID are 1.556 × 10 7 and 6.193 × 10 7 , respectively. Therefore, it is evident that the MPC results in improved performance compared to the PID.
Figure 8. Controller performance evaluation for the set point tracking of the drying gas temperature.
Processes 02 00392 g008
Figure 10 shows the performance of the PID and MPC with API composition as the control variable. It can be seen that the response of the PID is oscillatory with a large overshoot. On the other hand, MPC stabilizes much faster (with a lesser settling time) compared to the PID. The ITAEs calculated for MPC and PID are 1.584 × 10 3 and 1.892 × 10 3 , respectively. Similarly, the control loop for holdup has been evaluated, and it has been seen that the MPC gives a better performance compared to the PID.
Figure 9. The disturbance rejection ability of controllers for the drying gas temperature.
Processes 02 00392 g009
Figure 10. Controller performance evaluation for the set point tracking of the API composition.
Processes 02 00392 g010

7. Conclusions

An advanced hybrid MPC-PID control system has been developed for the continuous purification and processing of APIs. The performance of the hybrid control scheme has been compared with the basic level of PID-based control system. The hybrid scheme has been demonstrated to be an efficient and optimal control strategy in the case of API purification steps, as followed by the pharmaceutical industry. A cascade loop has been demonstrated for the control of the crystallization operation. The mathematical model of the entire process has been developed from first-principles, which presents a mechanistic description of the process and establishes a connection between the API purification/processing and downstream tablet manufacturing steps. The designed control system is able to track the step change in set points and reject unknown disturbances. Future work will involve validating the proposed control design followed by its implementation in an actual plant.

Acknowledgments

This work is supported by the National Science Foundation Engineering Research Center on Structured Organic Particulate Systems, through Grant NSF-ECC 0540855.

Nomenclature

SymbolDescriptionUnits
AcArea of heat transferm2
B0Primary nucleation termparticles/(m3/s)
bKinetic parameter for crystallizationDimensionless
CSolute concentration in crystallizationmoles/m3
CsatSaturation concentration of solutemoles/m3
CpwSpecific heat constant for waterJ/K
DpCrystal diameterμm
FParticle densityparticles/m3
G1Growth ratem/s
G2Growth ratem/s
g1Kinetic parameter for crystallizationDimensionless
g2Kinetic parameter for crystallizationDimensionless
kg1Kinetic parameter for crystallizationm/s
kg2Kinetic parameter for crystallizationm/s
kbKinetic parameter for crystallizationparticles/(m3/s)
L1Internal coordinate for length of solidm
L2Internal coordinate for length of solidm
L3Internal coordinate for length of liquidm
MwCooling water flow ratekg/s
TTemperature (cooling schedule)Kelvin
TcTemperature of cooling waterKelvin
TinInlet temperature of waterKelvin
UOverall heat transfer coefficientW/(m2·K)
ϵPorosity of the cakeDimensionless
ρavgAverage density of wet particleskg/m3
ρsDensity of solidkg/m3
PFilter pressure differencekPa
μFluid viscositykg/(m·s)
αSpecific cake resistancem/kg
AFilter surface aream2
CFConcentration of solutes in slurrymoles/m3
cMass of solute deposited on filter per unit volume of filtratekg/m3
mFMass of wet cakekg
mcMass of dry cakekg
mvRate of evaporation during dryingkg/s
NaAvogadro numberDimensionless
RmFilter medium resistance1/m
VFiltrate volumem3
VpParticle volumem3
AsArea of heat transferm2
CpsSpecific heat capacityJ/(kg·K)
CpsteamSpecific heat constant for steamJ/K
kMass transfer coefficientm/s
hfgSpecific heat of evaporationJ/kg
hHeat transfer coefficientW/(M2·K)
TsTemperature of steamKelvin
TpTemperature of particleKelvin
TgDrying gas temperatureKelvin
Tin-steamInlet temperature of steamKelvin
massoutOutlet flow rate of API crystals from dryerkg/s
MsSteam flow ratekg/s
NuNusselt’s NumberDimensionless
PrPrandtl NumberDimensionless
ReReynolds NumberDimensionless
ShSherwood NumberDimensionless
UOverall heat transfer coefficientW/(m2·K)
xpLiquid content of solid particleDimensionless
xeqlLiquid content of solid particle at equilibriumDimensionless
nCounter for number of componentsDimensionless
nmaxMaximum number of components-
tTimes
VfForward axial velocitym/s
VbBackward axial velocitym/s
VrRadial velocitym/s
xSpatial coordinate in axial direction-
xmaxMaximum number of axial compartments-
ySpatial coordinate in axial direction-
ymaxMaximum number of radial compartments-
yAPIFractional API composition at mixer outletDimensionless
yavgAverage spatial composition of component Amoles/m3
yiComposition of component A in i-th compartmentmoles/m3

Appendix: Process Model Integrated with the Hybrid MPC-PID Scheme

The equations used for developing the mathematical model for each unit operation of the flowsheet have been listed.

Crystallizer

In this study, a 2D population balance model considering growth in two directions has been implemented for the crystallization process, as shown below.
F ( L 1 , L 2 , t ) t + ( G 1 ( L 1 , t ) F ( L 1 , L 2 , t ) ) L 1 + ( G 2 ( L 2 , t ) F ( L 1 , L 2 , t ) ) L 2
= B 0 ( C , t ) δ ( L 1 ) δ ( L 2 ) + I n f l o w - O u t f l o w
The growth and the nucleation terms can be written as:
G 1 = k g 1 C - C s a t C s a t g 1
G 2 = k g 2 C - C s a t C s a t g 2
B 0 = k b C - C s a t C s a t b
Another internal coordinate ( L i q ( L e q ) ) is added to the PBE, which tracks the amount of liquid present in the crystals based on the works of Miki et al. [50]. Considering the width of the crystal to be L 1 , the equivalent length of the crystal can be expressed as:
L e q ( L 1 , L 2 ) = ( 6 π × L 1 2 L 2 ) 1 3
L i q ( L e q ) = 2 × 10 - 5 L e q 2 - 3 × 10 - 9 L e q + 10 - 13
The mass balance equation can be written as shown in the equation below [51]:
d C d t = - ρ c 0 0 F ( L 1 , L 2 , t ) ( 2 G 1 ( L 1 L 2 - L 1 2 ) + G 2 L 1 2 ) d L 1 d L 2
Since this is a case of cooling crystallization, the temperature cooling schedule can be expressed as a function of time. C s a t has been expressed as a function of temperature. The expression has been obtained by fitting experimental data as obtained from Bristol-Myers Squibb Co., New Brunswick, NJ, USA.
C s a t = 2 . 7357 T - 40 . 925
The heat transfer between the coolant and crystallizer can be represented as:
U A c ( T - T c ) = M w C p w ( T c - T i n )

Filtration Process

The main design equations of the cake filter are as follows (adapted from McCabe et al. [40]):
d V ( L 1 , L 2 , L 3 , t ) d t = A 2 Δ P μ ( α ( L 1 , L 2 , L 3 , t ) c V ( L 1 , L 2 , L 3 , t ) + R m A )
c and α can be found as:
c = C F 1 - ( m F m c - 1 ) C F / ρ s
α ( L 1 , L 2 , L 3 , t ) = 150 ( 1 - ϵ ( L 1 , L 2 , L 3 , t ) ) D p ( L 1 , L 2 , L 3 , t ) ϵ ( L 1 , L 2 , L 3 , t ) 3 ρ s
Assuming that there are no solid particles present in the filtrate, the mass of the wet cake deposited on the septum is given as:
m F ( L 1 , L 2 , L 3 , t ) = F ( L 1 , L 2 , L 3 , t ) V p ( L 1 , L 2 , L 3 , t ) ρ s N a

Drying Process

For the drying process, a model has been developed, where the liquid is being evaporated from the solid surface (adapted from Mezhericher et al. [41])
The change in particle diameter with time can be represented as:
d D p ( L 1 , L 2 , L 3 , t ) d t = - m v ( L 1 , L 2 , L 3 , t ) ρ l 2 π D p ( L 1 , L 2 , L 3 , t ) 2
The temperature profile of the particle can be given as shown below:
h f g m v ( L 1 , L 2 , L 3 , t ) + c p s ρ a v g ( L 1 , L 2 , L 3 , t ) V p ( L 1 , L 2 , L 3 , t ) d T p ( L 1 , L 2 , L 3 , t ) d t
= h ( T g - T p ( L 1 , L 2 , L 3 , t ) ) 2 π D p ( L 1 , L 2 , L 3 , t ) 2
The evaporation rate can be calculated as:
m v ( L 1 , L 2 , L 3 , t ) = k ( L 1 , L 2 , L 3 , t ) ( x p - x e q l ) 2 π D p ( L 1 , L 2 , L 3 , t ) 2
The heat and mass transfer coefficients are given below:
h ( L 1 , L 2 , L 3 , t ) = S h ( L 1 , L 2 , L 3 , t ) D v D p ( L 1 , L 2 , L 3 , t )
k ( L 1 , L 2 , L 3 , t ) = N u ( L 1 , L 2 , L 3 , t ) k g D p ( L 1 , L 2 , L 3 , t )
such that Nusselt’s number is given as:
N u ( L 1 , L 2 , L 3 , t ) = ( 2 + 0 . 6 R e ( L 1 , L 2 , L 3 , t ) 1 2 P r 1 3 ) ( 1 + ( C p v * ( T g - T p ) / h f g ) ) - 0 . 7
and Sherwood number is given as shown in Equation (23).
S h ( L 1 , L 2 , L 3 , t ) = ( 2 + 0 . 6 R e ( L 1 , L 2 , L 3 , t ) 1 2 S c 1 3 ) ( 1 + ( C p v * ( T g - T p ) / h f g ) ) - 0 . 7
The outflow from the dryer is given as shown below:
m a s s o u t ( L 1 , L 2 , L 3 , t ) = m F ( L 1 , L 2 , L 3 , t ) - m v ( L 1 , L 2 , L 3 , t ) * F ( L 1 , L 2 , L 3 , t ) * N a
The heat transfer between the air and superheated steam can be represented as:
U A s ( T s - T g a s ) = M s t e a m C p s t e a m ( T s - T i n - s t e a m )

Mixer

The mixing model has been assumed to be independent of the size change, based on previous work [52]. Hence, the internal coordinates have been dropped from the population balance model. The PBM for the mixer can be written as:
t F ( z , t ) + z F ( z , t ) d z d t = 0
The above equation can be written in multi-dimensional form, as shown below:
t F ( n , x , y , t ) + x F ( n , x , y , t ) d x d t + y F ( n , x , y , t ) d y d t
= I n f l o w - O u t f l o w
The mass balance of a single component can be simplified according to the equation given below:
F ( n , x , y , t ) t = V f [ F n , x - 1 , y , t - F n , x , y , t ] Δ x + V b [ F n , x + 1 , y , t - F n , x , y , t ] Δ x
+ V r [ F n , x , y + 1 , t + F n , x , y - 1 , t - 2 F n , x , y , t ] Δ y
The properties of the final blend from the mixer output have been presented in terms of mean API composition ( y A P I ) relative standard deviation (RSD).
y A P I = y = 1 y m a x F ( A P I , x m a x , y , t ) n = 1 n m a x y = 1 y m a x F ( n , x m a x , y , t )

MPC-PID Controller Equations

The equation for PID controller (slave loop of crystallization) is given below:
T c ( t ) = K c ( S e t P o i n t ( t ) - T ( t ) ) + K c τ I 0 t ( S e t P o i n t ( t ) - T ( t ) ) d t
+ K c τ D d ( S e t P o i n t ( t ) - T ( t ) ) d t + c s
where K c is gain, τ I is reset time and τ D is the rate or derivative term.
The MPC equation can be represented as given below:
O B J = i = 1 P j = 1 n y ( w j y [ y j s e t ( k + i ) - y j ( k + i ) ] ) 2 + i = 1 M j = 1 n u ( w j Δ u Δ u j ( k + i - 1 ) ) 2
+ i = 1 M j = 1 n u ( w j u u j ( k + i - 1 ) - u ¯ j ) 2
where the first summation term represents the weighted squared sum of control variable deviations ( S y ( k ) ) ; the second summation term represents the weighted squared sum of controller adjustments ( S Δ u ( k ) ) ; the third summation term represents the weighted squared sum of manipulated variable deviations ( S u ( k ) ) ; k is the current sampling interval; (k+i) is the future sampling interval within the prediction horizon; y j are the control variables ( i . e . , C s a t , T g a s , y A P I , h o l d u p ); y j s e t are the set points of each control variable; u j are the actuators ( i . e . , T , T s , F ( e x c i p i e n t , x m a x , y , t ) , w e i r l e n g t h ); P is the number of control intervals in the prediction horizon; n y is the number of plant outputs ( n y = 4 ); M is the number of intervals in the control horizon; n u is the number of manipulated variables ( n u = 4 ); w j y is the weight for output j (the accuracy with which each output must track its set point can be adjusted with the help of the output weight); w j Δ u is the rate weight for output j (increasing this weight forces the controller to make smaller and more cautious adjustments); w j u is the input weight (this weight helps to avoid large deviation from the nominal value of the actuators) and u ¯ j is the nominal value for input j.

Conflicts of Interest

The authors declare no conflict of interest.

References

  1. Food and Drug Administration. Guidance for Industry. Q8 Pharmaceutical Development; U.S. Food and Drug Administration: Rockville, MD, USA, 2006.
  2. Food and Drug Administration. Guidance for Industry. PAT-A Framework for Innovative Pharmaceutical Development, Manufacturing and Quality Assurance; U.S. Food and Drug Administration: Rockville, MD, USA, 2004.
  3. Ogunnaike, B.A.; Ray, W.H. Process Dynamics, Modeling, and Control; Oxford University Press: New York, NY, USA, 1994. [Google Scholar]
  4. Richalet, J. Industrial applications of model based predictive control. Automatica 1993, 29, 1251–1274. [Google Scholar] [CrossRef]
  5. Garcia, C.E.; Prett, D.M.; Morari, M. Model predictive control: Theory and practice-A survey. Automatica 1989, 25, 335–348. [Google Scholar] [CrossRef]
  6. Singh, R.; Ierapetritou, M.; Ramachandran, R. System-wide hybrid MPC-PID control of a continuous pharmaceutical tablet manufacturing process via direct compaction. Eur. J. Pharm. Biopharm. 2013, 85, 1164–1182. [Google Scholar] [CrossRef] [PubMed]
  7. Pantelides, C.C.; Renfro, J.G. The online use of first-principles models in process operations: Review, current status and future needs. Comput. Chem. Eng. 2013, 51, 136–148. [Google Scholar] [CrossRef]
  8. Boukouvala, F.; Niotis, V.; Ramachandran, R.; Muzzio, F.; Ierapetritou, M.G. An integrated approach for dynamic flowsheet modeling and sensitivity analysis of a continuous tablet manufacturing process: An integrated approach. Comput. Chem. Eng. 2012, 42, 30–47. [Google Scholar] [CrossRef]
  9. Boukouvala, F.; Chaudhury, A.; Sen, M.; Zhou, R.; Mioduszewski, L.; Ierapetritou, M.G.; Ramachandran, R. Computer-aided flowsheet simulation of a pharmaceutical tablet manufacturing process incorporating wet granulation. J. Pharm. Innov. 2013, 8, 11–27. [Google Scholar] [CrossRef]
  10. Sen, M.; Chaudhury, A.; Singh, R.; John, J.; Ramachandran, R. Multi-scale flowsheet simulation of an integrated continuous purification-downstream pharmaceutical manufacturing process. Int. J. Pharm. 2013, 445, 29–38. [Google Scholar] [CrossRef] [PubMed]
  11. Sen, M.; Rogers, A.; Singh, R.; Chaudhury, A.; John, J.; Ierapetritou, M.G.; Ramachandran, R. Flowsheet optimization of an integrated continuous purification-processing pharmaceutical manufacturing operation. Chem. Eng. Sci. 2013, 102, 56–66. [Google Scholar] [CrossRef]
  12. Gnoth, S.; Jenzsch, M.; Simutis, R.; Luubert, A. Process analytical technology (PAT): Batch-to-batch reproducibility of fermentation processes by robust process operational design and control. J. Biotechnol. 2007, 132, 180–186. [Google Scholar] [CrossRef] [PubMed]
  13. Sen, M.; Singh, R.; Ramachandran, R. Simulation-based design of an efficient control system for the continuous purification and processing of active pharmaceutical ingredients. J. Pharm. Innov. 2014. [Google Scholar] [CrossRef]
  14. Singh, R.; Ierapetritou, M.; Ramachandran, R. An engineering study on the enhanced control and operation of continuous manufacturing of pharmaceutical tablets via roller compaction. Int. J. Pharm. 2012, 438, 307–326. [Google Scholar] [CrossRef] [PubMed]
  15. Dougherty, D.; Cooper, D. A practical multiple model adaptive strategy for single-loop MPC. Control Eng. Pract. 2003, 11, 141–159. [Google Scholar] [CrossRef]
  16. Sanders, C.F.W.; Hounslow, M.J.; Doyle, F.J., III. Identification of models for control of wet granulation. Powder Technol. 2009, 188, 255–263. [Google Scholar] [CrossRef]
  17. Mesbah, A.; Nagy, Z.K.; Huesman, A.E.M.; Kramer, H.J.M.; van den Hof, P.M.J. Nonlinear model-based control of a semi-industrial batch crystallizer using population balance modeling framework. IEEE Trans. Control Syst. Technol. 2012, 20, 1188–1201. [Google Scholar] [CrossRef]
  18. Kwon, J.S.; Nayhouse, M.; Christofides, P.D.; Orkoulas, G. Protein crystal shape and size control in batch crystallization: Comparing model predictive control with conventional operating policies. Ind. Eng. Chem. Res. 2014, 53, 5002–5014. [Google Scholar] [CrossRef]
  19. Dufour, P. Control engineering in drying technology: Review and trends. Dry. Technol. 2006, 24, 889–904. [Google Scholar] [CrossRef]
  20. Daraoui, N.; Dufour, P.; Hammouri, H.; Hottot, A. Model predictive control during the primary drying stage of lyophilisation. Control Eng. Pract. 2010, 18, 483–494. [Google Scholar] [CrossRef]
  21. Pisano, R.; Fissore, D.; Barresi, A.A. Freeze drying cycle optimization using model predictive control techniques. Ind. Eng. Chem. Res. 2011, 50, 7363–7379. [Google Scholar] [CrossRef]
  22. Hsu, S.; Reklaitis, G.V.; Venkatasubramanian, V. Modeling and control of roller compaction for pharmaceutical manufacturing. Part I: Process dynamics and control framework. J. Pharm. Innov. 2010, 5, 14–23. [Google Scholar] [CrossRef]
  23. Hsu, S.; Reklaitis, G.V.; Venkatasubramanian, V. Modeling and control of roller compaction for pharmaceutical manufacturing. Part II: Control and system design. J. Pharm. Innov. 2010, 5, 24–36. [Google Scholar] [CrossRef]
  24. Bardin, M.; Knight, P.C.; Seville, J.P.K. On control of particle size distribution in granulation using high shear mixers. Powder Technol. 2004, 140, 169–175. [Google Scholar] [CrossRef]
  25. Burggraeve, A.; Monteyne, T.; Vervaet, C.; Remon, J.P.; Beer, T.D. Process analytical tools for monitoring, understanding, and control of pharmaceutical fluidized bed granulation: A review. Eur. J. Pharm. Biopharm. 2013, 83, 2–15. [Google Scholar] [CrossRef] [PubMed]
  26. Ramachandran, R.; Chaudhury, A. Model-based design and control of continuous drum granulation processes. Chem. Eng. Res. Design 2011, 90, 1063–1073. [Google Scholar] [CrossRef]
  27. Gatzke, E.P.; Doyle, F.J. Model predictive control of a granulation system using soft output constraints and prioritized control objectives. Powder Technol. 2001, 121, 149–158. [Google Scholar] [CrossRef]
  28. Long, C.E.; Polisetty, P.K.; Gatzke, E.P. Deterministic global optimization for non-linear model predictive control of hybrid dynamic systems. Int. J. Rob. Nonlin. Control 2007, 17, 1232–1250. [Google Scholar]
  29. Pottmann, M.; Ogunnaike, B.A.; Adetayo, A.A.; Ennis, B.J. Model-based control of a granulation process. Powder Technol. 2000, 108, 192–201. [Google Scholar] [CrossRef]
  30. Ramachandran, R.; Arjunan, J.; Chaudhury, A.; Ierapetritou, M.G. Model-based control loop performance assessment of a continuous direct compaction pharmaceutical processes. J. Pharm. Innov. 2012, 6, 249–263. [Google Scholar] [CrossRef]
  31. Singh, R.; Ierapetritou, M.; Ramachandran, R. Hybrid advanced control of flexible multipurpose continuous tablet manufacturing process via direct compaction. Comput. Aid. Chem. Eng. 2013, 32, 757–762. [Google Scholar]
  32. Singh, R.; Barrasso, D.; Chaudhury, A.; Sen, M.; Ierapetritou, M.; Ramachandran, R. Closed-loop feedback control of a continuous pharmaceutical tablet manufacturing process via wet granulation. J. Pharm. Innov. 2014. [Google Scholar] [CrossRef]
  33. Singh, R.; Sahay, A.; Oka, S.; Liu, X.; Ramachandran, R.; Ierapetritou, M.; Muzzio, F. Online monitoring, advanced control and operation of robust continuous pharmaceutical tablet manufacturing process. BioPharma Mag. Asia 2013, 2, 18–23. [Google Scholar]
  34. Benyahia, B.; Lakerveld, R.; Barton, P.I. A plant-wide dynamic model of a continuous pharmaceutical process. Ind. Eng. Chem. Res. 2012, 51, 15393–15412. [Google Scholar] [CrossRef]
  35. Lakerveld, R.; Benyahia, B.; Braatz, R.D.; Barton, P.I. Model-based design of a plant-wide control strategy for a continuous pharmaceutical plant. AIChE J. 2013, 59, 3671–3685. [Google Scholar] [CrossRef] [Green Version]
  36. Lakerveld, R.; Benyahia, B.; Heider, P.L.; Zhang, H.; Braatz, R.D.; Barton, P.I. Averaging level control to reduce off-spec material in a continuous pharmaceutical pilot plant. Processes 2013, 1, 330–348. [Google Scholar] [CrossRef] [Green Version]
  37. Pregelj, B.; Gerksic, S. Hybrid explicit model predictive control of a nonlinear process approximated with a piecewise affine model. J. Process Control 2010, 20, 832–839. [Google Scholar] [CrossRef]
  38. Zhu, G.; Henson, M.A.; Ogunnaike, B.A. A hybrid model predictive control strategy for nonlinear plant-wide control. J. Process Control 2000, 10, 449–458. [Google Scholar] [CrossRef]
  39. Song, C.; Wu, B.; Li, P. A hybrid model-based optimal control method for nonlinear systems using simultaneous dynamic optimization strategies. J. Process Control 2012, 22, 852–860. [Google Scholar] [CrossRef]
  40. Mccabe, W.L.; Smith, J.C.; Harriott, P. Unit Operations of Chemical Engineering; McGraw-Hill: New York, NY, USA, 2001. [Google Scholar]
  41. Mezhericher, A.; Levy, A.; Borde, I. Modelling of particle breakage during drying. Chem. Eng. Process. 2008, 47, 1404–1411. [Google Scholar] [CrossRef]
  42. Sen, M.; Singh, R.; Vanarase, A.; John, J.; Ramachandran, R. Multi-dimensional population balance modeling and experimental validation of continuous powder mixing processes. Chem. Eng. Sci. 2012, 80, 349–360. [Google Scholar] [CrossRef]
  43. Robles, A.; Ruano, M.V.; Ribes, J.; Ferrer, J. Advanced control system for optimal filtration in submerged anaerobic MBRs (SAnMBRs). J. Membr. Sci. 2013, 430, 330–340. [Google Scholar] [CrossRef]
  44. Peiris, R.H.; Budman, H.; Moresoli, C.; Legge, R.L. Fouling control and optimization of a drinking water membrane filtration process with real-time model parameter adaptation using fluorescence and permeate flux measurements. J. Process Control 2013, 23, 70–77. [Google Scholar] [CrossRef]
  45. Hammond, A.; Smith, M. The role of PAT, condition monitoring and adaptive control in delivering QbD. In Proceedings of the AIChE Annual Meeting, Pittsburg, PA, USA, 28 October–2 November 2012.
  46. Sen, M.; Dubey, A.; Singh, R.; Ramachandran, R. Mathematical development and comparison of a hybrid PBM-DEM description of a continuous powder mixing process. J. Powder Technol. 2013. [Google Scholar] [CrossRef]
  47. Stephanopoulos, G. Chemical Process Control; Prentice-Hall, Inc.: Englewood Cliffs, NJ, USA, 2006. [Google Scholar]
  48. Schultz, W.C.; Rideout, V.C. Control system performance measures: Past, present and future. IRE Trans. Autom. Control 1961, AC-6, 22–35. [Google Scholar] [CrossRef]
  49. Singh, R.; Sahay, A.; Muzzio, F.; Ierapetritou, M.; Ramachandran, R. Systematic framework for onsite design and implementation of the control system in continuous tablet manufacturing process. Comput. Chem. Eng. 2014. [Google Scholar] [CrossRef]
  50. Miki, H.; Terashima, T.; Asakuma, Y.; Maeda, K.; Fukui, K. Inclusion of mother liquor inside KDP crystals in a continuous MSMPR crystallizer. Separ. Purif. Technol. 2005, 43, 71–76. [Google Scholar] [CrossRef]
  51. Gunawan, R.; Fusman, I.; Braatz, R.D. High resolution algorithms for multidimensional population balance equations. AIChE J. 2004, 50, 2738–2749. [Google Scholar] [CrossRef]
  52. Sen, M.; Ramachandran, R. A multi-dimensional population balance model approach to continuous powder mixing processes. Adv. Powder Technol. 2013, 24, 51–59. [Google Scholar] [CrossRef]

