


Abstract
Water treatment plants are essential urban infrastructure with direct implications for public health and everyday life. Data-driven management has received growing attention in drinking water treatment, particularly for optimizing chemical dosing to improve operational efficiency, reduce costs, and ease operator workload. AI-based prediction of coagulant dosage has therefore become an active research topic. Existing studies, however, have focused mainly on model architecture, with less attention to data validity and cost control. In practice, many plants face data-quality problems, including inconsistent dosing records under similar water-quality conditions. Conventional data cleaning may also remove large portions of the dataset, which can weaken model reliability. This study proposes an artificial intelligence (AI) modeling framework for coagulation dosing that handles anomalous data, emphasizes data quality assurance, and combines cost-oriented feedforward prediction with feedback control. A genetic algorithm-optimized backpropagation (GA-BP) neural network was first evaluated on controlled laboratory data and full-scale plant data using the same core model architecture, allowing the effects of model configuration to be separated from those of data quality. Historical plant records were subsequently cleaned through expert-guided validation, approximate time-delay alignment, and turbidity-based classification of operating conditions. Settled-water turbidity was then used as a feedback signal to dynamically adjust subsequent coagulant dosage and assess the resulting chemical savings. Changes in the input structure produced only modest improvements in full-scale prediction performance (R2 = 0.53–0.72). In contrast, data cleaning and process-based data organization markedly improved predictive performance, with R2 values increasing to 0.927–0.969. Standalone AI models achieved only moderate dosage reductions, while their integration with real-time turbidity feedback provided the best cost-control performance. The model-based control strategy reduced average coagulant consumption by 10.37%, with a maximum reduction of 21.33% at a settled-water turbidity target of 1.9 nephelometric turbidity units (NTU). Across the evaluated feedback-control scenarios, manual dosing was up to 32.83% higher than the corresponding feedback-controlled dosage. Overall, AI models can fit coagulation-dosing data and predict coagulant dosage with sufficient accuracy, but data quality assurance remains the main factor determining model performance. Effective cost control also requires real-time turbidity-based feedback regulation rather than model outputs alone.
1. Introduction
Data-driven artificial intelligence (AI) technologies have developed rapidly across many industries [1,2,3,4]. As a core part of urban infrastructure, drinking water treatment plants support both domestic life and industrial activities [5,6,7]. Although the water treatment sector was among the first to examine the use of AI [8], successful large-scale implementation remains uncommon. Recent advances in computing have accelerated AI deployment in multiple fields [9]. Improvements in data storage, sensor technologies, and analytical methods have also provided a stronger technical basis for intelligent dosing systems based on machine learning and deep learning, substantially improving the efficiency of data acquisition and processing [10,11,12]. Because AI can improve the operational efficiency of water treatment plants and reduce operating costs, its adoption has become increasingly important for modern water treatment facilities [13].
The performance and operational efficiency of drinking water treatment plants are influenced by several interacting factors, including raw-water quality and its temporal variability, flow rate and hydraulic conditions, process configuration and equipment efficiency, chemical dosing, and the reliability of monitoring and process-control systems. Changes in these factors can affect treatment demand, process stability, energy consumption, and operating costs. Electricity and chemical reagents are two major operating expenses in urban drinking water treatment plants. Electricity is mainly used for pumping, mixing, filtration, backwashing, and sludge handling, whereas chemical dosing directly influences reagent consumption, clarification performance, and residual solids production. Excessive coagulant dosing increases chemical use and sludge generation, while insufficient dosing can reduce clarification efficiency and increase the treatment burden on downstream units. Effective plant operation therefore depends on coordinated management of water-quality conditions, hydraulic loading, energy use, chemical consumption, and treatment performance rather than on optimizing any single factor independently. Coagulation is a central process in drinking water production, and coagulant dosage must be carefully controlled. AI methods, including neural networks, have long received attention for coagulant-dose prediction, resulting in numerous publications and a wide range of predictive models [14,15]. However, these technical advances have rarely been translated into broad industrial application. Practical implementation still faces several key challenges, many of which have not been sufficiently addressed. Models trained on historical data can only capture the patterns of variation present in those data. Because historical records often do not represent optimal process conditions [16,17,18,19,20], this limitation not only constrains cost reduction but also narrows the role of AI to reducing operator workload [21,22]. Accordingly, accurately reproducing historical dosing practices does not necessarily mean that chemical consumption or overall process efficiency has been optimized. As a result, developing models suitable for process control in water treatment plants has become an important research focus [23,24]. In practice, however, the principles governing coagulation have been extensively studied and now form a mature knowledge system, while existing AI networks can already fit relevant data with high accuracy [25,26,27,28,29,30,31]. The main barrier to practical implementation lies in the validity and consistency of operational data, including missing values, anomalous records, inconsistent dosing decisions, sensor errors, and delayed process responses. This remains a central bottleneck that has not been adequately resolved. Previous studies have shown that data quality is critical to model predictive performance [32,33]. For coagulant dosing in water treatment plants, complex factors such as fluctuations in raw water quality, differences among operators, and sensor errors [34,35,36] can cause substantial variation in coagulant dosage even under apparently similar water quality conditions. These issues further limit the predictive capacity of machine learning models in real-world production settings and hinder improvements in dosage-prediction accuracy and cost control. A data validation and remediation framework that can adapt to changes in water quality is therefore needed.
Using a drinking water treatment plant in Xiangtan, China, as a case study, this study examined the data-validity bottleneck in neural-network-based coagulant dosing. A genetic algorithm-optimized backpropagation (GA-BP) neural network was adopted as a representative nonlinear model, with particular attention to how data source, data consistency, and process alignment influenced model performance. Controlled laboratory data were compared with historical full-scale operating data, after which expert evaluation, weak time-delay alignment, turbidity zoning, and dynamic feedback were incorporated sequentially. This framework was used to distinguish limitations arising from model capacity from those associated with invalid or inconsistent operational data. Outlier screening and expert-guided validation improved the reliability of training targets while retaining representative production conditions, and delayed feedback was introduced to reduce residual mismatch between model predictions and actual process behavior during operation. The results indicate that training-data quality and process representativeness have a greater effect on full-scale prediction performance than input-structure refinement alone. These findings support a data-centered approach to intelligent coagulant dosing and cost control in drinking water treatment.
2. Materials and Methods
2.1. Sampling
In this study, model training was conducted using data from laboratory coagulation tests and field sampling at the First Drinking Water Treatment Plant of Xiangtan City, located in Yuhu District, Xiangtan, Hunan Province, China (approximately 27.849° N, 112.889° E). The plant draws raw water from the main channel of the Xiangjiang River and has a design treatment capacity of approximately 1.0 × 10⁵ m3/d. During the study period, the actual daily water-supply capacity was approximately 1.5 × 10⁵ m3/d, corresponding to an average operating flow of approximately 6250 m3/h. The main variables used in the full-scale coagulation-dosing analysis were raw-water turbidity, temperature, pH, total dissolved solids (TDS), total phosphorus (TP), UV254, flow rate, and settled-water turbidity, with coagulant dosage as the prediction target. These variables were selected to capture the combined effects of raw-water quality, hydraulic loading, and treatment response on coagulant demand. At the full scale, coagulant addition was recorded hourly as the volumetric dosing rate of diluted PAC (Hengyang Jianheng Industrial Co., Ltd., Hengyang, China) solution (m3/h), and operational samples were collected at 1 h intervals. Because the PAC was supplied in different production batches, batch-inspection records were incorporated into the dosage calculations to account for batch-to-batch variation. Detailed dosing and sampling procedures are provided in Supplementary Materials Text S1. Each laboratory coagulation condition was tested independently in triplicate, and the reported values represent the means of the three replicate measurements. The selected variables showed different patterns under laboratory and full-scale operating conditions and were subsequently examined during model development and data-validity analysis.
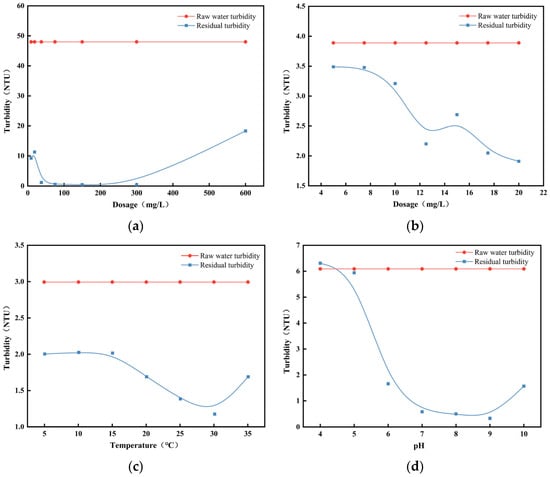
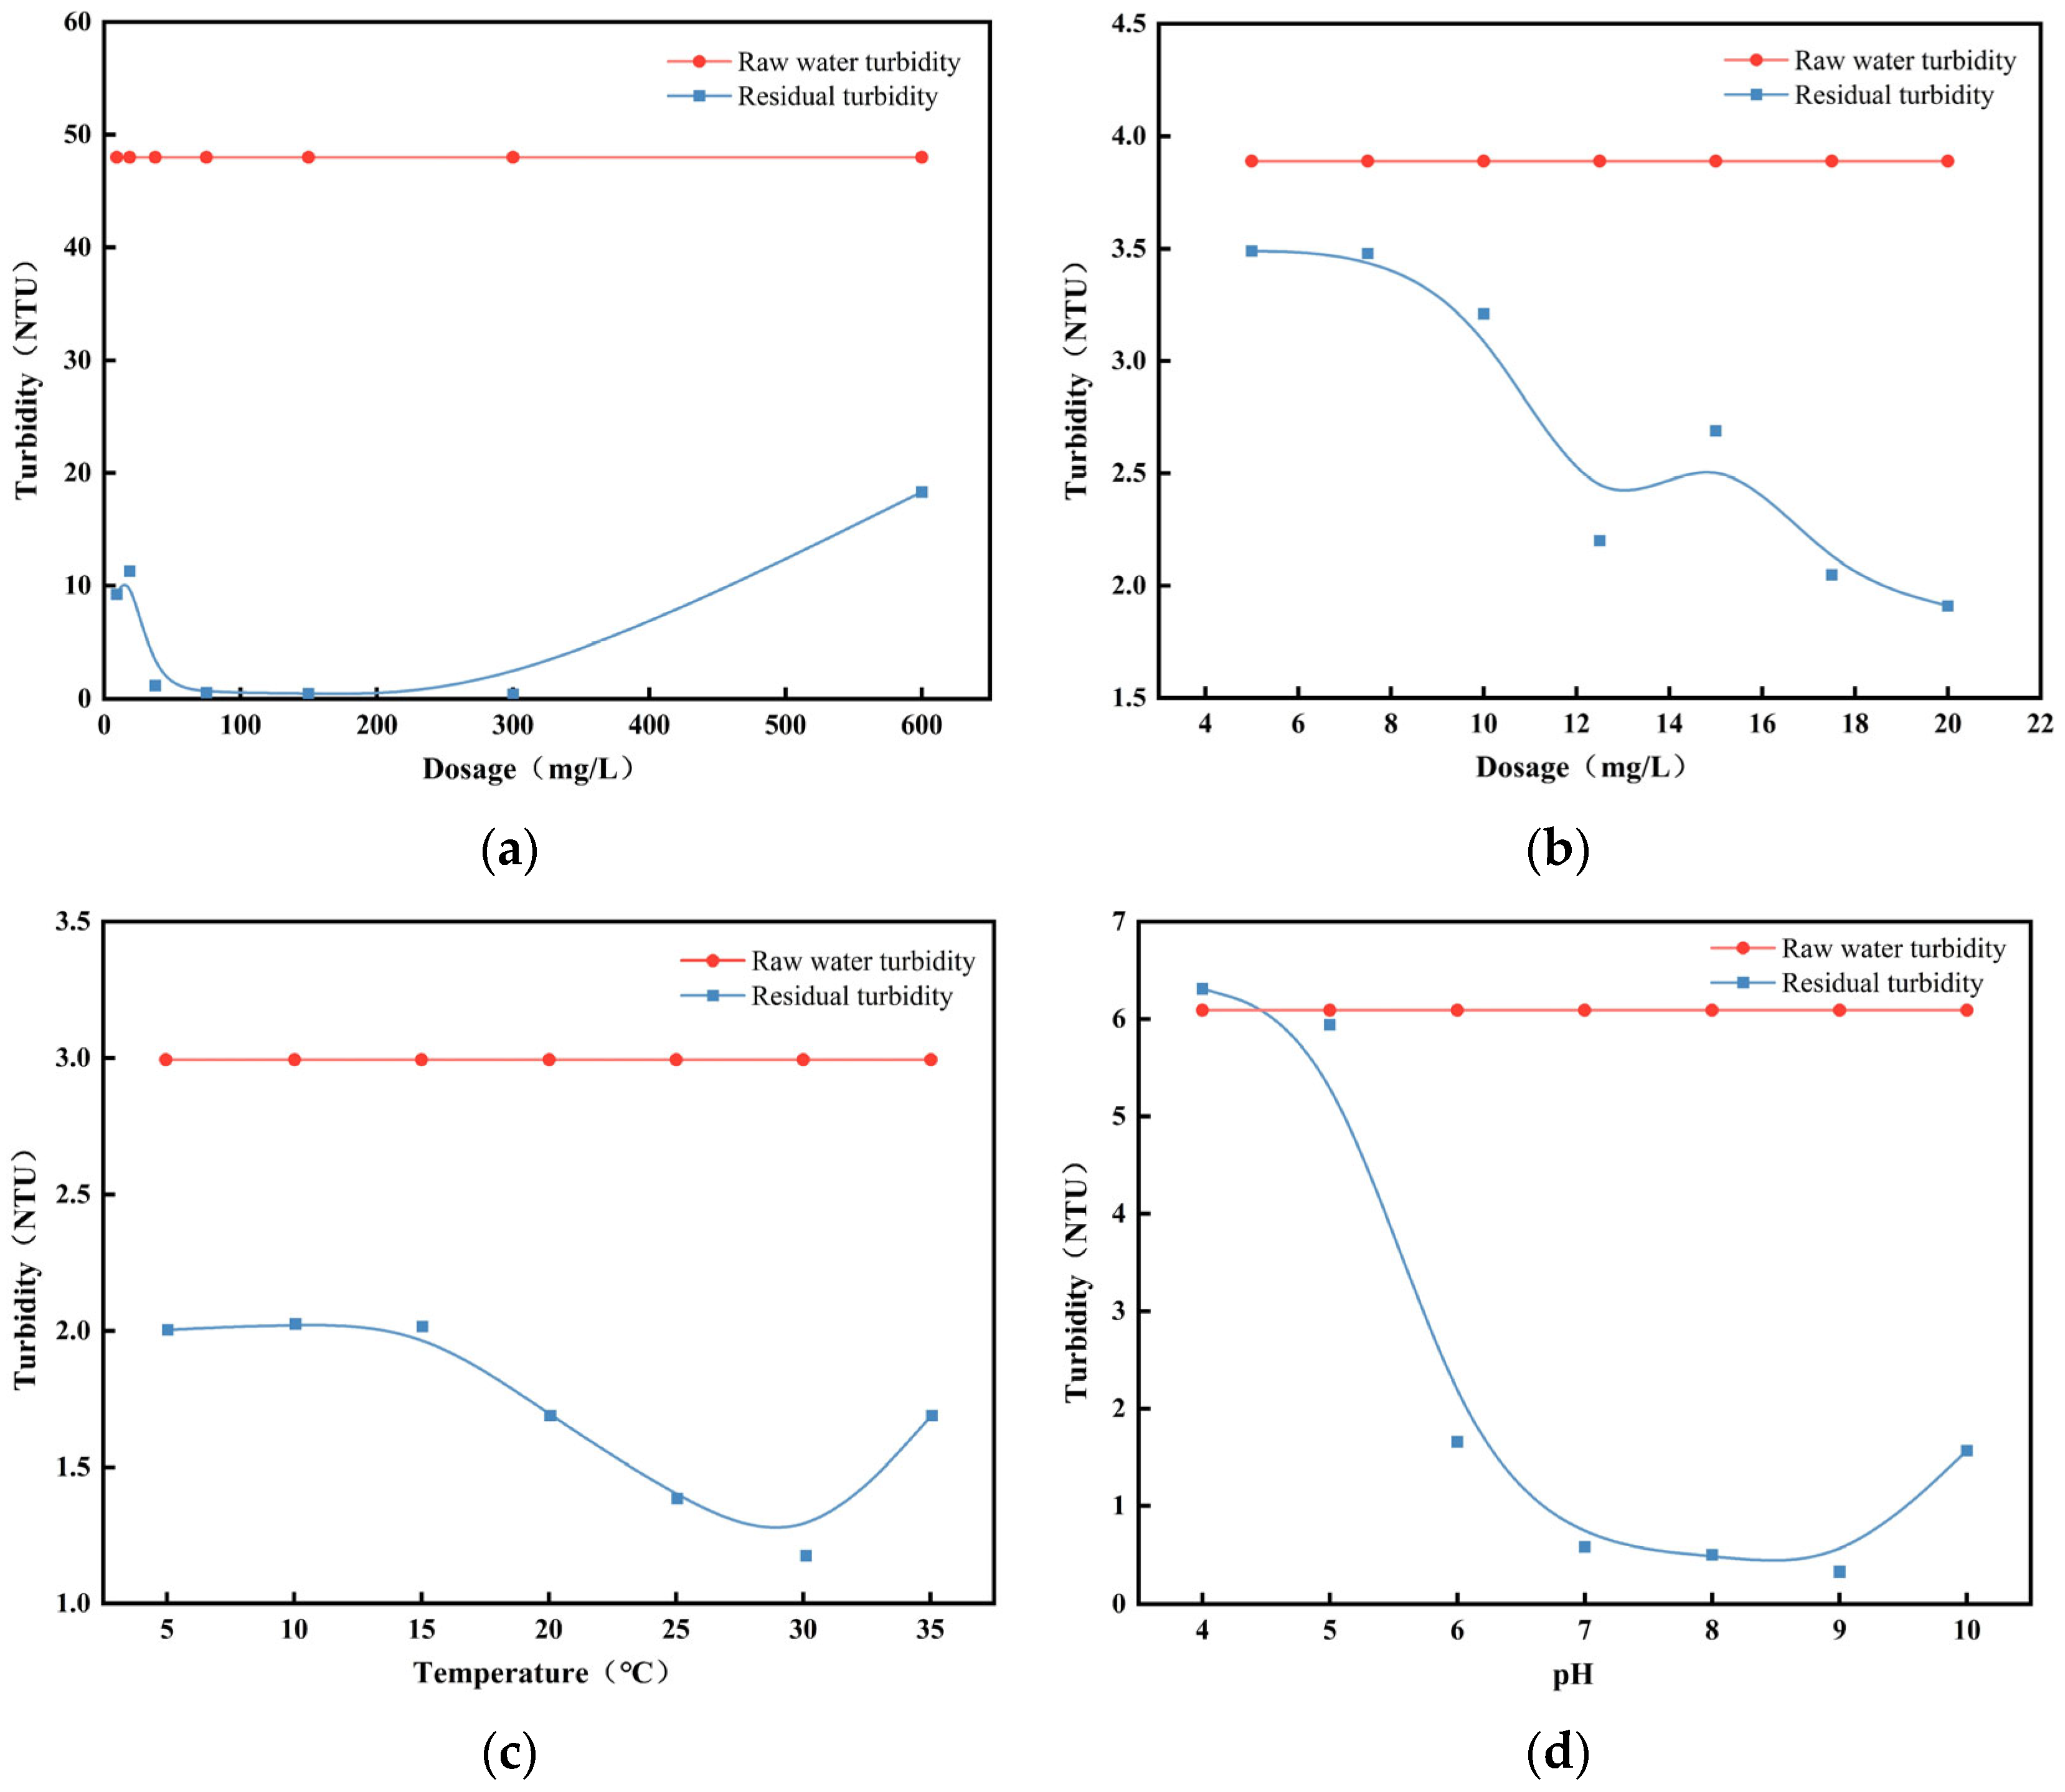
Laboratory results showed that, for high-turbidity water (Figure 1a), residual turbidity decreased as coagulant dosage increased. Excessive dosing, however, destabilized the flocs and increased residual turbidity. Low-turbidity water (Figure 1b) required a lower absolute coagulant dosage but had a wider effective dosing range. In high-turbidity water, residual turbidity decreased rapidly and then increased after overdosing, indicating a narrow optimal dosage window and a strong need for precise dosage control. By contrast, residual turbidity in low-turbidity water decreased gradually and monotonically within 5–20 mg/L, suggesting lower dosage demand and greater operational tolerance. Treatment of high-turbidity water therefore depends on precise dosage control, whereas low-turbidity water requires moderate and sustained dosing while avoiding unnecessary chemical addition. Temperature also strongly affected coagulation performance (Figure 1c), with better flocculation observed at 20–30 °C. The laboratory results further showed that effective coagulation was achieved when the raw- water pH ranged from 7 to 9 (Figure 1d). Residual turbidity decreased markedly as pH increased from 5 to 7 and remained low between pH 7 and 9, indicating favorable coagulation within this range. By contrast, the raw-water pH at the full-scale plant varied over a relatively narrow range and generally remained within this favorable interval. Under these operating conditions, pH provided limited additional information for dosage prediction and was therefore not retained as a priority input variable in the simplified model.
Figure 1.
Relationships between key water-quality parameters and coagulation performance: (a) high-turbidity treatment; (b) low-turbidity treatment; (c) temperature effect; (d) pH effect.
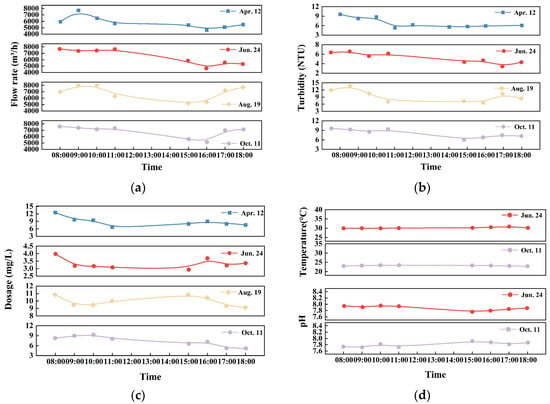
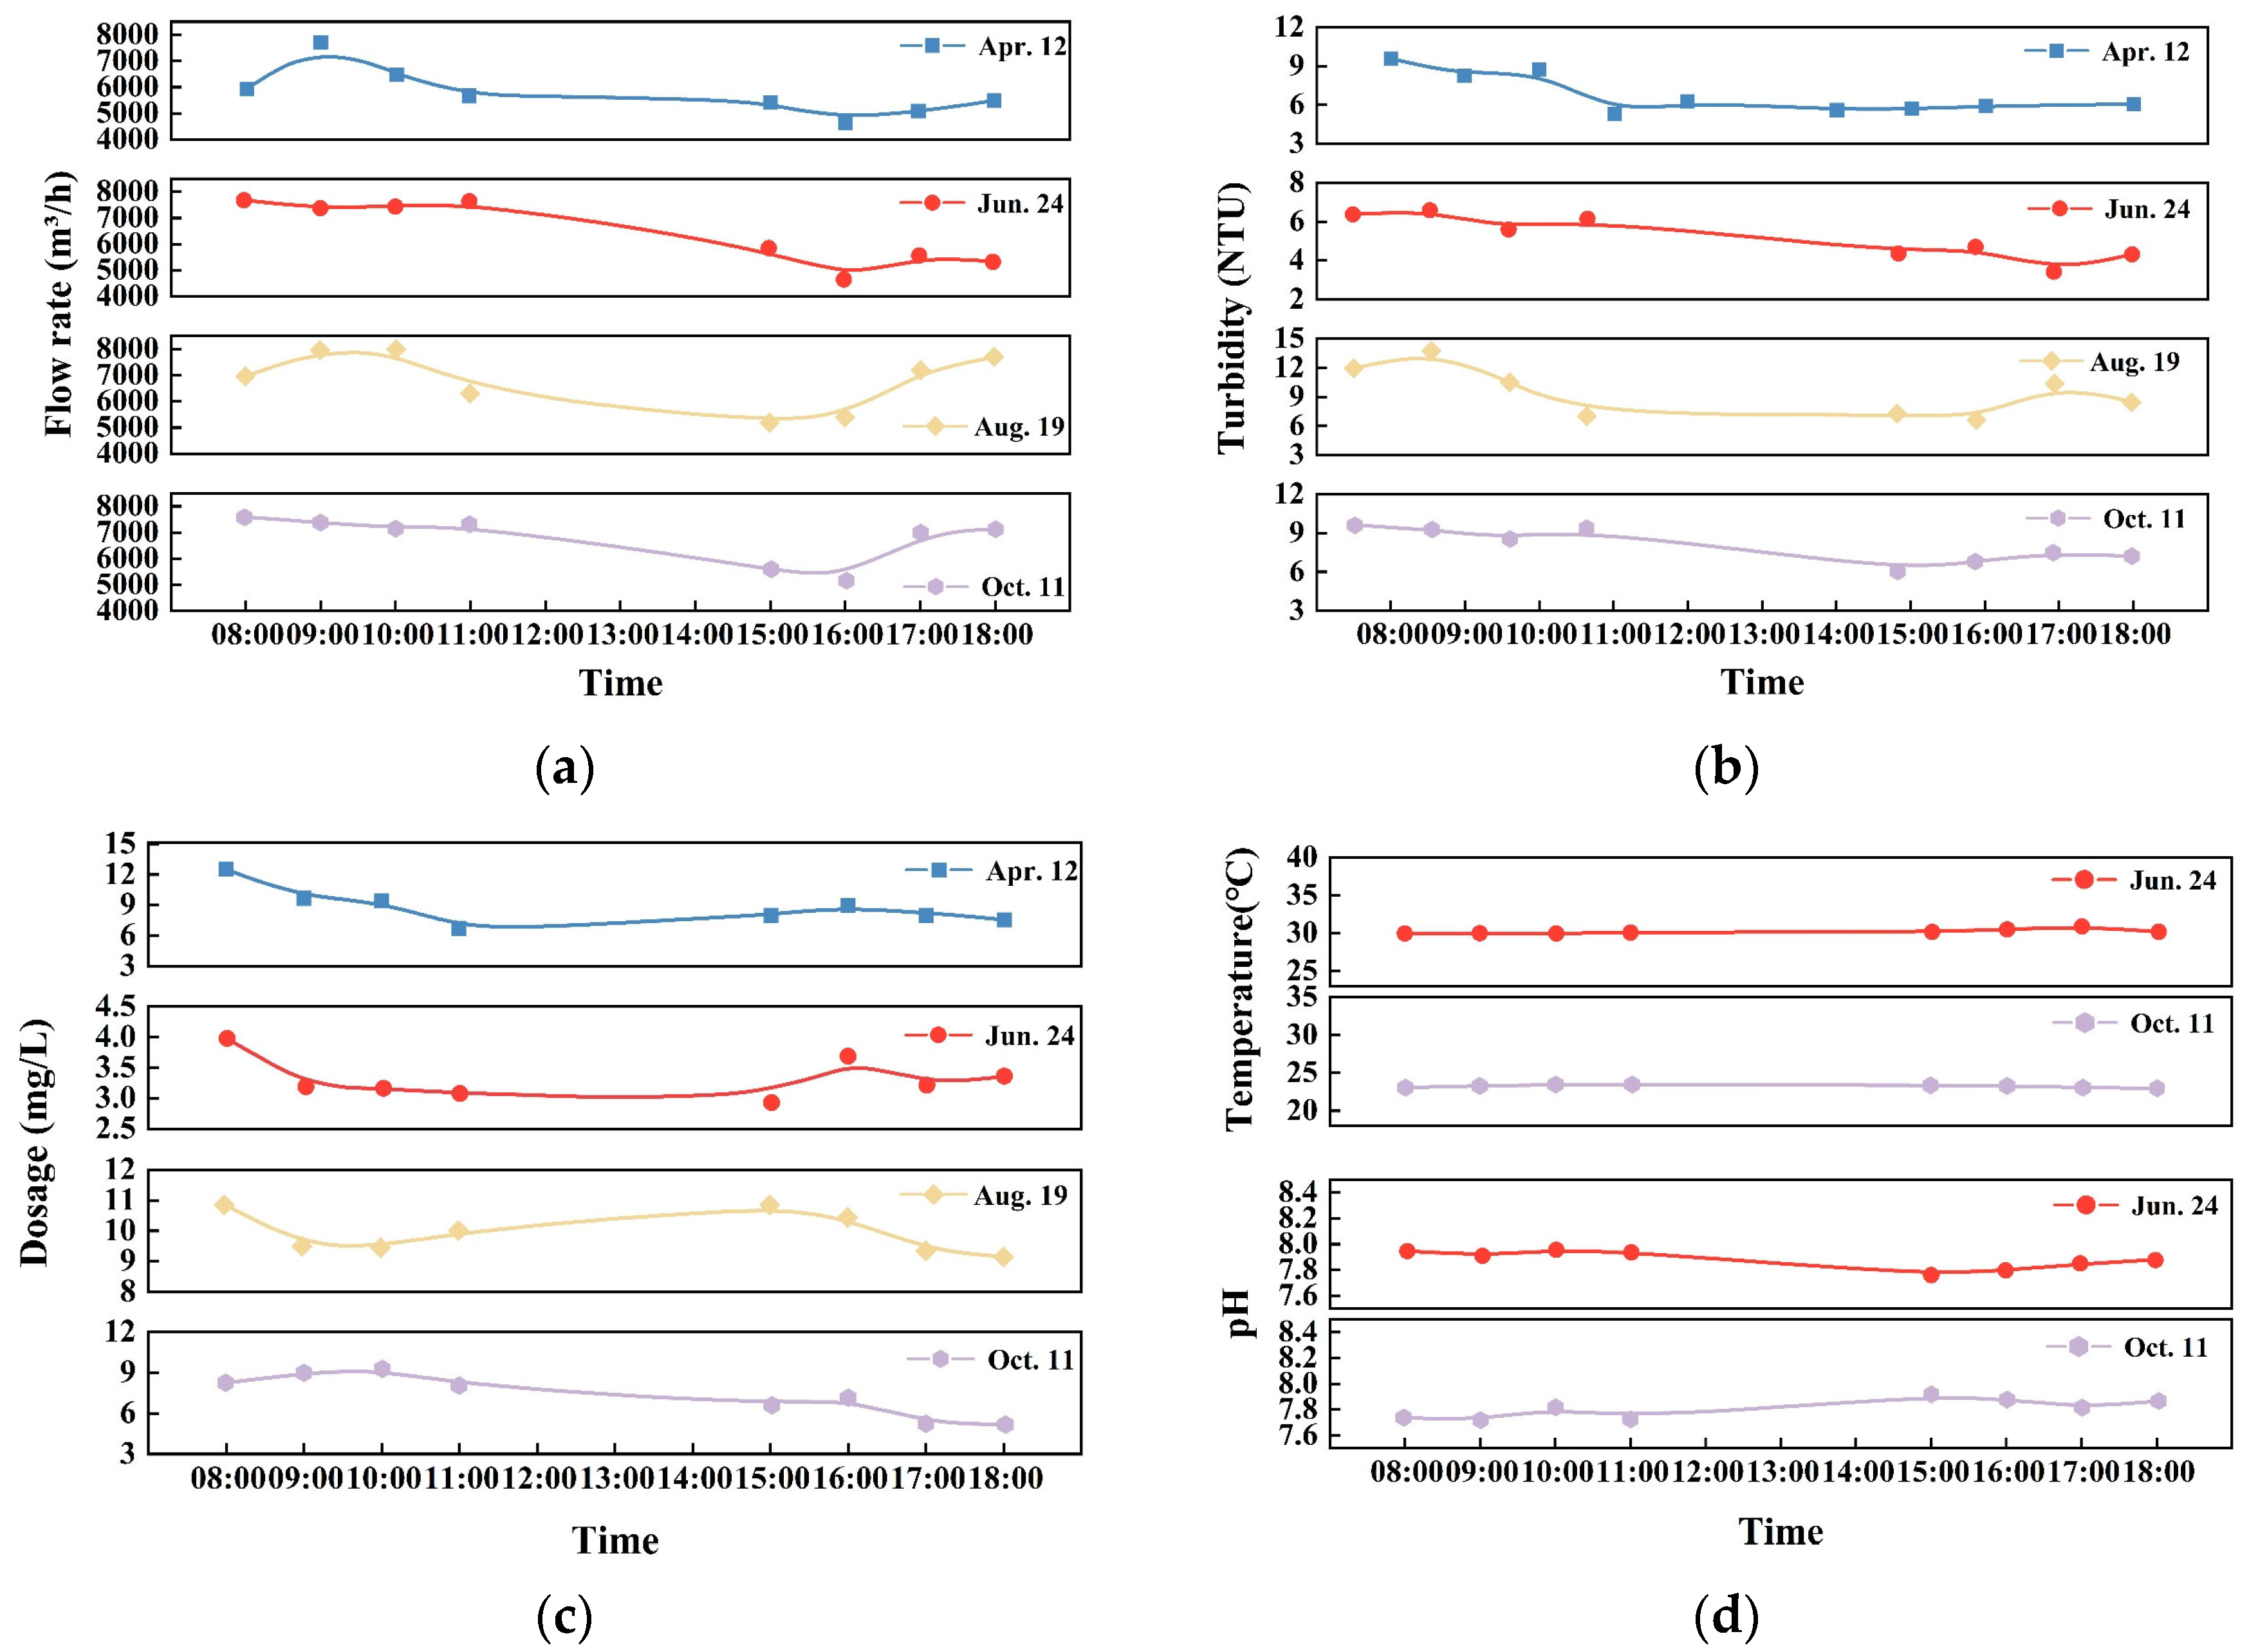
Figure 2 shows typical variations in raw water quality at the water treatment plant. The correlation matrix for water-quality parameters and coagulant dosage in the full-scale plant dataset is provided in Supplementary Materials Table S3, further confirming the multifactor dependence of dosing under plant-scale operation. In general, the chemical properties of water that affect coagulant dosage remain relatively stable over short periods, making flow rate and turbidity the main determinants of dosage. However, some of these parameters, particularly temperature, turbidity, and flow rate, vary seasonally, resulting in different responses to coagulant addition. As shown in Figure 2a, flow rate, raw water turbidity, temperature, and coagulant dosage varied within a single day across different months. pH was not used as a model input because it remained highly stable throughout the monitoring period. Our investigation of pH variation in drinking water treatment plants in China suggested that this finding was not an isolated case. Therefore, developing an effective model for a full-scale water treatment plant is more challenging than developing one under laboratory conditions.
Figure 2.
Daily variation in raw water quality and coagulant dosage at the water treatment plant across different months: (a) flow rate; (b) raw water turbidity; (c) coagulant dosage; (d) temperature and pH.
2.2. Expert Evaluation
Our review showed that a substantial share of the full-scale plant data could not be used directly for model training. Water-quality variables in the treatment plant were recorded through online sensors or manual tests, whereas coagulant dosage was partly determined by operator judgment and current operating conditions. Consequently, similar water-quality states sometimes corresponded to different dosages, and the same dosage was sometimes applied under different water-quality and hydraulic conditions. Although these records were part of the historical dataset, it was often difficult to determine in retrospect which dosage was appropriate or which choice would have been more cost-effective. Such inconsistencies may affect models trained on historical operational data [37,38]. Using the data without validation could therefore cause the model to learn inconsistent dosing practices rather than a stable relationship among water quality, hydraulic conditions, and coagulant demand.
Removing large numbers of historical records through statistical outlier detection alone was also unsuitable as a means of improving model accuracy. Each water-quality record reflected a specific production scenario, and excessive deletion would narrow the coverage of real operating conditions. Expert evaluation was therefore incorporated as a data-validation step before model development. A combined data-quality screening and expert-review procedure was used to identify missing or incomplete records, duplicate or near-duplicate observations, abnormal measurements, flow-related disturbances, and dosing records that were inconsistent with plant operation. Flagged records were assessed based on numerical consistency, water-quality trends, plant operating conditions, and the subsequent settled-water response. Records that were consistent with actual process conditions were retained, whereas those whose operational validity could not be confirmed were excluded from subsequent modeling. Detailed information on the expert-panel composition, evaluation framework, screening criteria, and data-processing procedures is provided in Supplementary Materials Text S2.
2.3. Data Processing
Following the expert-guided data-quality screening described above, the validated operational dataset was further processed for model development. To compare different input schemes, principal component analysis (PCA) was used to construct a composite-factor input scheme. The original water-quality and operational variables were transformed into five principal components [39,40], which were then used as model inputs to reduce information redundancy and multicollinearity. The detailed PCA procedure is provided in Supplementary Materials Text S3, and the analytical methods are described in Supplementary Materials Text S4.
To reduce bias in model training caused by short-term fluctuations in raw water quality, this study introduced the concept of weak time-delay data. In the coagulation–sedimentation process, settled-water quality is influenced not only by the initial coagulation reaction but also by subsequent floc formation, particle aggregation, and sedimentation. At the investigated plant, the actual sedimentation retention time varied from approximately 45 to 90 min because of fluctuations in treatment flow, making it difficult to establish an exact correspondence between instantaneous raw-water conditions and the resulting settled-water response. Under actual operating conditions, raw water quality changes continuously and gradually [41], and slow process responses and delays occur between coagulation reactions and changes in sedimentation effluent quality. As a result, instantaneous raw-water measurements and simultaneous settled-water measurements often do not accurately represent the final treatment outcomes of dosing actions. Therefore, based on plant operating practice and manual dosing experience, settled-water quality measured approximately 1 h after dosing was used as a delayed process-response variable to align historical dosing actions with their subsequent treatment responses. This weak time-delay information was used only during offline model training to improve process-response alignment. During online operation, delayed effluent quality served solely as feedback for subsequent dosage adjustment and was not used as a real-time model input. Thus, future effluent quality was not used to determine the current dosing decision.
2.4. Model Building
To isolate the effects of data configuration and data validity from those associated with model selection, the same GA-BP neural-network framework was used throughout the main comparisons. The model was developed in MATLAB 2010b (The MathWorks, Inc., Natick, MA, USA) to predict coagulant dosage under different input configurations, including single-factor inputs, PCA-derived composite factors, and weak time-delay inputs. It consisted of three layers: an input layer, a hidden layer, and an output layer. For plant-scale modeling, the dataset was randomly divided into training and test subsets at a 7:3 ratio, with the test subset used to assess model generalization. Keeping the core model architecture unchanged allowed differences in predictive performance to be attributed mainly to data source, input representation, and subsequent data remediation. Detailed model parameters are provided in Supplementary Materials Text S5.
Model performance was assessed using several statistical metrics [16], including the coefficient of determination (R2), p-value from the independent-samples t-test (p), root mean square error (RMSE), relative RMSE (RMSE%), model efficiency coefficient (EF), and consistency index (d) [42,43,44]. RMSE was used to quantify prediction error in the original dosage scale, whereas RMSE% was used to express relative error and facilitate comparison across different model configurations. Although R2 was used as the primary metric in this study, complete evaluation results for all indicators are provided in Supplementary Materials Table S8. The Supplementary Materials also provides detailed definitions, mathematical formulations, and comparative analyses of these metrics [45,46].
2.5. Feedback Correction and Dosage Evaluation
The feedback module adjusted the model-predicted dosage based on the delayed response of settled-water turbidity. After the feedforward model generated an initial dosage estimate, the settled-water turbidity measured after the process delay was compared with the selected turbidity control line. If the measured turbidity was below the control line, the dosage for the subsequent step was reduced to avoid unnecessary chemical use. If the measured turbidity exceeded the control line, the dosage was increased to maintain treatment performance. Settled-water turbidity control lines from 1.5 to 1.9 nephelometric turbidity units (NTU) were evaluated in this study. These values served as intermediate control targets for sedimentation effluent and were not intended as finished-water standards. After subsequent filtration and disinfection, the finished water was required to comply with the applicable Chinese Standard for Drinking Water Quality (GB 5749) [47], which specified a turbidity limit of 1 NTU during the study period. The feedback-corrected dosage, total coagulant consumption, and relative excess of manual dosing were then calculated using Equations (1)–(3), respectively.
The corrected dosage is given by:
where denotes the corrected dosage for the next control step, denotes the dosage predicted by the feed-forward model, and ΔDt denotes the feedback correction determined from the deviation between the measured settled-water turbidity and the target control line.
Because chemical addition was recorded as an hourly dosing volume, total coagulant consumption was calculated as:
where Vtot denotes total coagulant consumption, Vt denotes the dosing volume at time t, and n denotes the number of dosing records. To quantify the chemical redundancy of manual operation relative to model-based control, the relative excess of manual dosing was calculated as:
where E denotes the relative excess of manual dosing, Vmanual denotes total coagulant consumption under manual operation, and Vcontrol denotes total coagulant consumption under model-based feedback control.
In this study, jar-test dosage is expressed as a concentration-based dose (mg/L), whereas plant-scale model output refers to the hourly dosing volume of diluted coagulant (m3/h), and cumulative consumption is reported as m3.
3. Results and Discussion
3.1. Model Performance Comparison
The predictive performance of the neural network was evaluated using several statistical indicators. The analysis examined whether alternative input representations improved prediction performance for the same operational dataset, whether the same model architecture performed differently when trained on controlled laboratory data and full-scale plant data, and whether data-oriented remediation yielded greater improvements than refinement of the input structure. The main model performance results are summarized in Table 1, while complete results for the different data-processing and input-configuration strategies are provided in Supplementary Materials Table S9.
Table 1.
Model performance comparison.
3.1.1. Effects of Input Structure and Data Source
Simulation results showed that the single-factor model slightly outperformed the composite-factor model in dosage prediction, with R2 = 0.67, RMSE = 20.76, EF = 0.65, and d = 0.88. The composite-factor model achieved R2 = 0.53, RMSE = 23.96, EF = 0.53, and d = 0.83. Further structural optimization using the same operational dataset produced only marginal gains, indicating that changes in input representation alone did not resolve the field-data limitation. In contrast, when the same GA-BP framework was trained using laboratory data, the model achieved R2 = 0.96, RMSE = 5.43, and EF and d values close to 1. The controlled laboratory dataset therefore supported stable pattern recognition, whereas full-scale operational data substantially reduced model performance (R2 of approximately 0.67 and RMSE > 20). The large difference observed without changing the core model architecture suggests that the consistency and process representativeness of the dataset had a stronger effect on predictive performance than the tested changes in input structure.
The pronounced performance gap between the laboratory and full-scale datasets observed in this study is consistent with the data-dependent variability reported in previous coagulant-dosing studies. Moussouni et al. [48] achieved a test R2 of 0.985 using coagulant doses determined through jar-test optimization, whereas Tochio et al. [49] reported a lower correlation coefficient of 0.872 using full-scale operational records after invalid and anomalous data had been removed. Lin et al. [50] further showed that prediction performance could deteriorate substantially when the operational relationship between water quality and dosage changed. Under an atypical operating regime, the test R2 of a conventional multilayer perceptron (MLP) decreased to 0.15 despite good training performance. In the present study, the R2 of 0.96 obtained with laboratory data is consistent with the high predictive performance reported when dosage targets are well defined and the input–output relationship is relatively stable. By contrast, the R2 decreased to approximately 0.67 for the unremediated plant data, indicating substantially greater inconsistency between measured water-quality conditions and recorded dosage. Importantly, this decline occurred with the GA-BP architecture unchanged, while modifications to the input structure within the same plant dataset produced only limited improvement. These results suggest that the lower predictive performance of the plant model was more closely related to the validity and process representativeness of the training data than to insufficient nonlinear fitting capacity of the neural network.
The test R2 values of the single-factor and synthetic-factor models should be interpreted in the context of full-scale plant operation. The single-factor model achieved an R2 of 0.67, whereas the synthetic-factor model achieved an R2 of 0.53, indicating moderate rather than high predictive reliability before data remediation. The lower performance of the synthetic-factor model suggests that adding more input information did not overcome inconsistencies in the historical relationship between process conditions and treatment response. Similar variation in predictive performance has been reported in full-scale coagulant-dosing studies. Tochio et al. [49] obtained a correlation coefficient of 0.872 using an artificial neural network (ANN) trained on operational plant data, whereas Lin et al. [50] reported that the test R2 of a conventional MLP decreased to 0.15 under an atypical operating regime. In the same study, however, gated recurrent unit and graph attention multivariate time series forecasting models that explicitly incorporated temporal information achieved R2 values of 0.94–0.95. These results suggest that relatively low predictive performance is not necessarily an inherent limitation of full-scale data and that model structure remains important when temporal and process information are properly represented. For the present dataset and the input structures examined, however, the limited improvement obtained by restructuring the inputs, together with the substantial gains after data remediation, indicates that inconsistencies in the operational data and insufficient representation of process relationships were major constraints on prediction performance.
3.1.2. Data Validity in Coagulant Dosing
Recent studies on coagulant-dose prediction have achieved satisfactory performance using a range of machine-learning methods. Bressane et al. compared fuzzy inference, neural networks, random forests, support vector machines, and other approaches, and reported the lowest prediction error for a data-driven fuzzy inference system [51]. Using full-scale water-treatment-plant data, Tochio et al. obtained a correlation coefficient of 0.872 with an ANN [49]. More recent studies using ensemble learning have reported R2 values above 0.96 for tree-based models based using operational water-quality variables [48]. Collectively, these findings show that machine-learning methods can capture the nonlinear relationship between water quality and coagulant demand. Direct comparison of algorithm performance across studies, however, remains difficult because datasets differ substantially in source, plant scale, sampling frequency, target definition, preprocessing, and validation procedures.
The strong performance reported for several ensemble, fuzzy, and temporally structured models also suggests that algorithm choice can substantially affect prediction when informative and internally consistent operational data are available. The present results should therefore not be interpreted as evidence that model architecture is unimportant. Instead, the fixed GA-BP framework used in this study provides a controlled basis for assessing how data organization influences predictive performance without introducing major changes in model complexity.
In this context, the main finding of the present study is not that the GA-BP network outperforms other algorithms, but that its performance changed markedly with the validity of the training data. Laboratory data obtained under controlled conditions provided a relatively consistent relationship among water-quality conditions, coagulant dosage, and treatment response. In contrast, historical plant dosage records reflected operator decisions made under actual production constraints. These recorded dosages do not necessarily represent the process-optimal coagulant demand because they may contain conservative safety margins, delayed adjustments, operator-dependent decisions, sensor errors, and disturbances associated with plant hydraulics. A neural network trained directly on such records may therefore reproduce inconsistent historical operating practices rather than learn a stable relationship between water quality and the actual coagulant requirement.
This interpretation is consistent with broader reviews of data-driven drinking water treatment, which have identified uncertainty in model validity, bias inherited from training data, and persistent challenges in data management and model reproducibility [5,23,52]. These studies support the view that data validity can limit model performance, but they do not establish whether remediation of the dataset used here can improve prediction accuracy. The following sections therefore test this hypothesis by applying process-informed data-remediation and alignment strategies while retaining the same GA-BP architecture. An improvement observed under this controlled comparison would provide within-study evidence that data validity and process organization are important constraints on full-scale coagulant-dosing prediction.
3.2. Data-Quality-Oriented Optimization
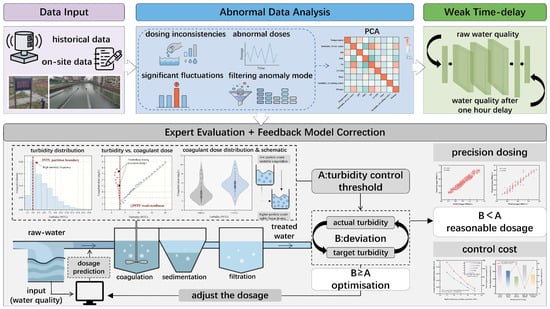
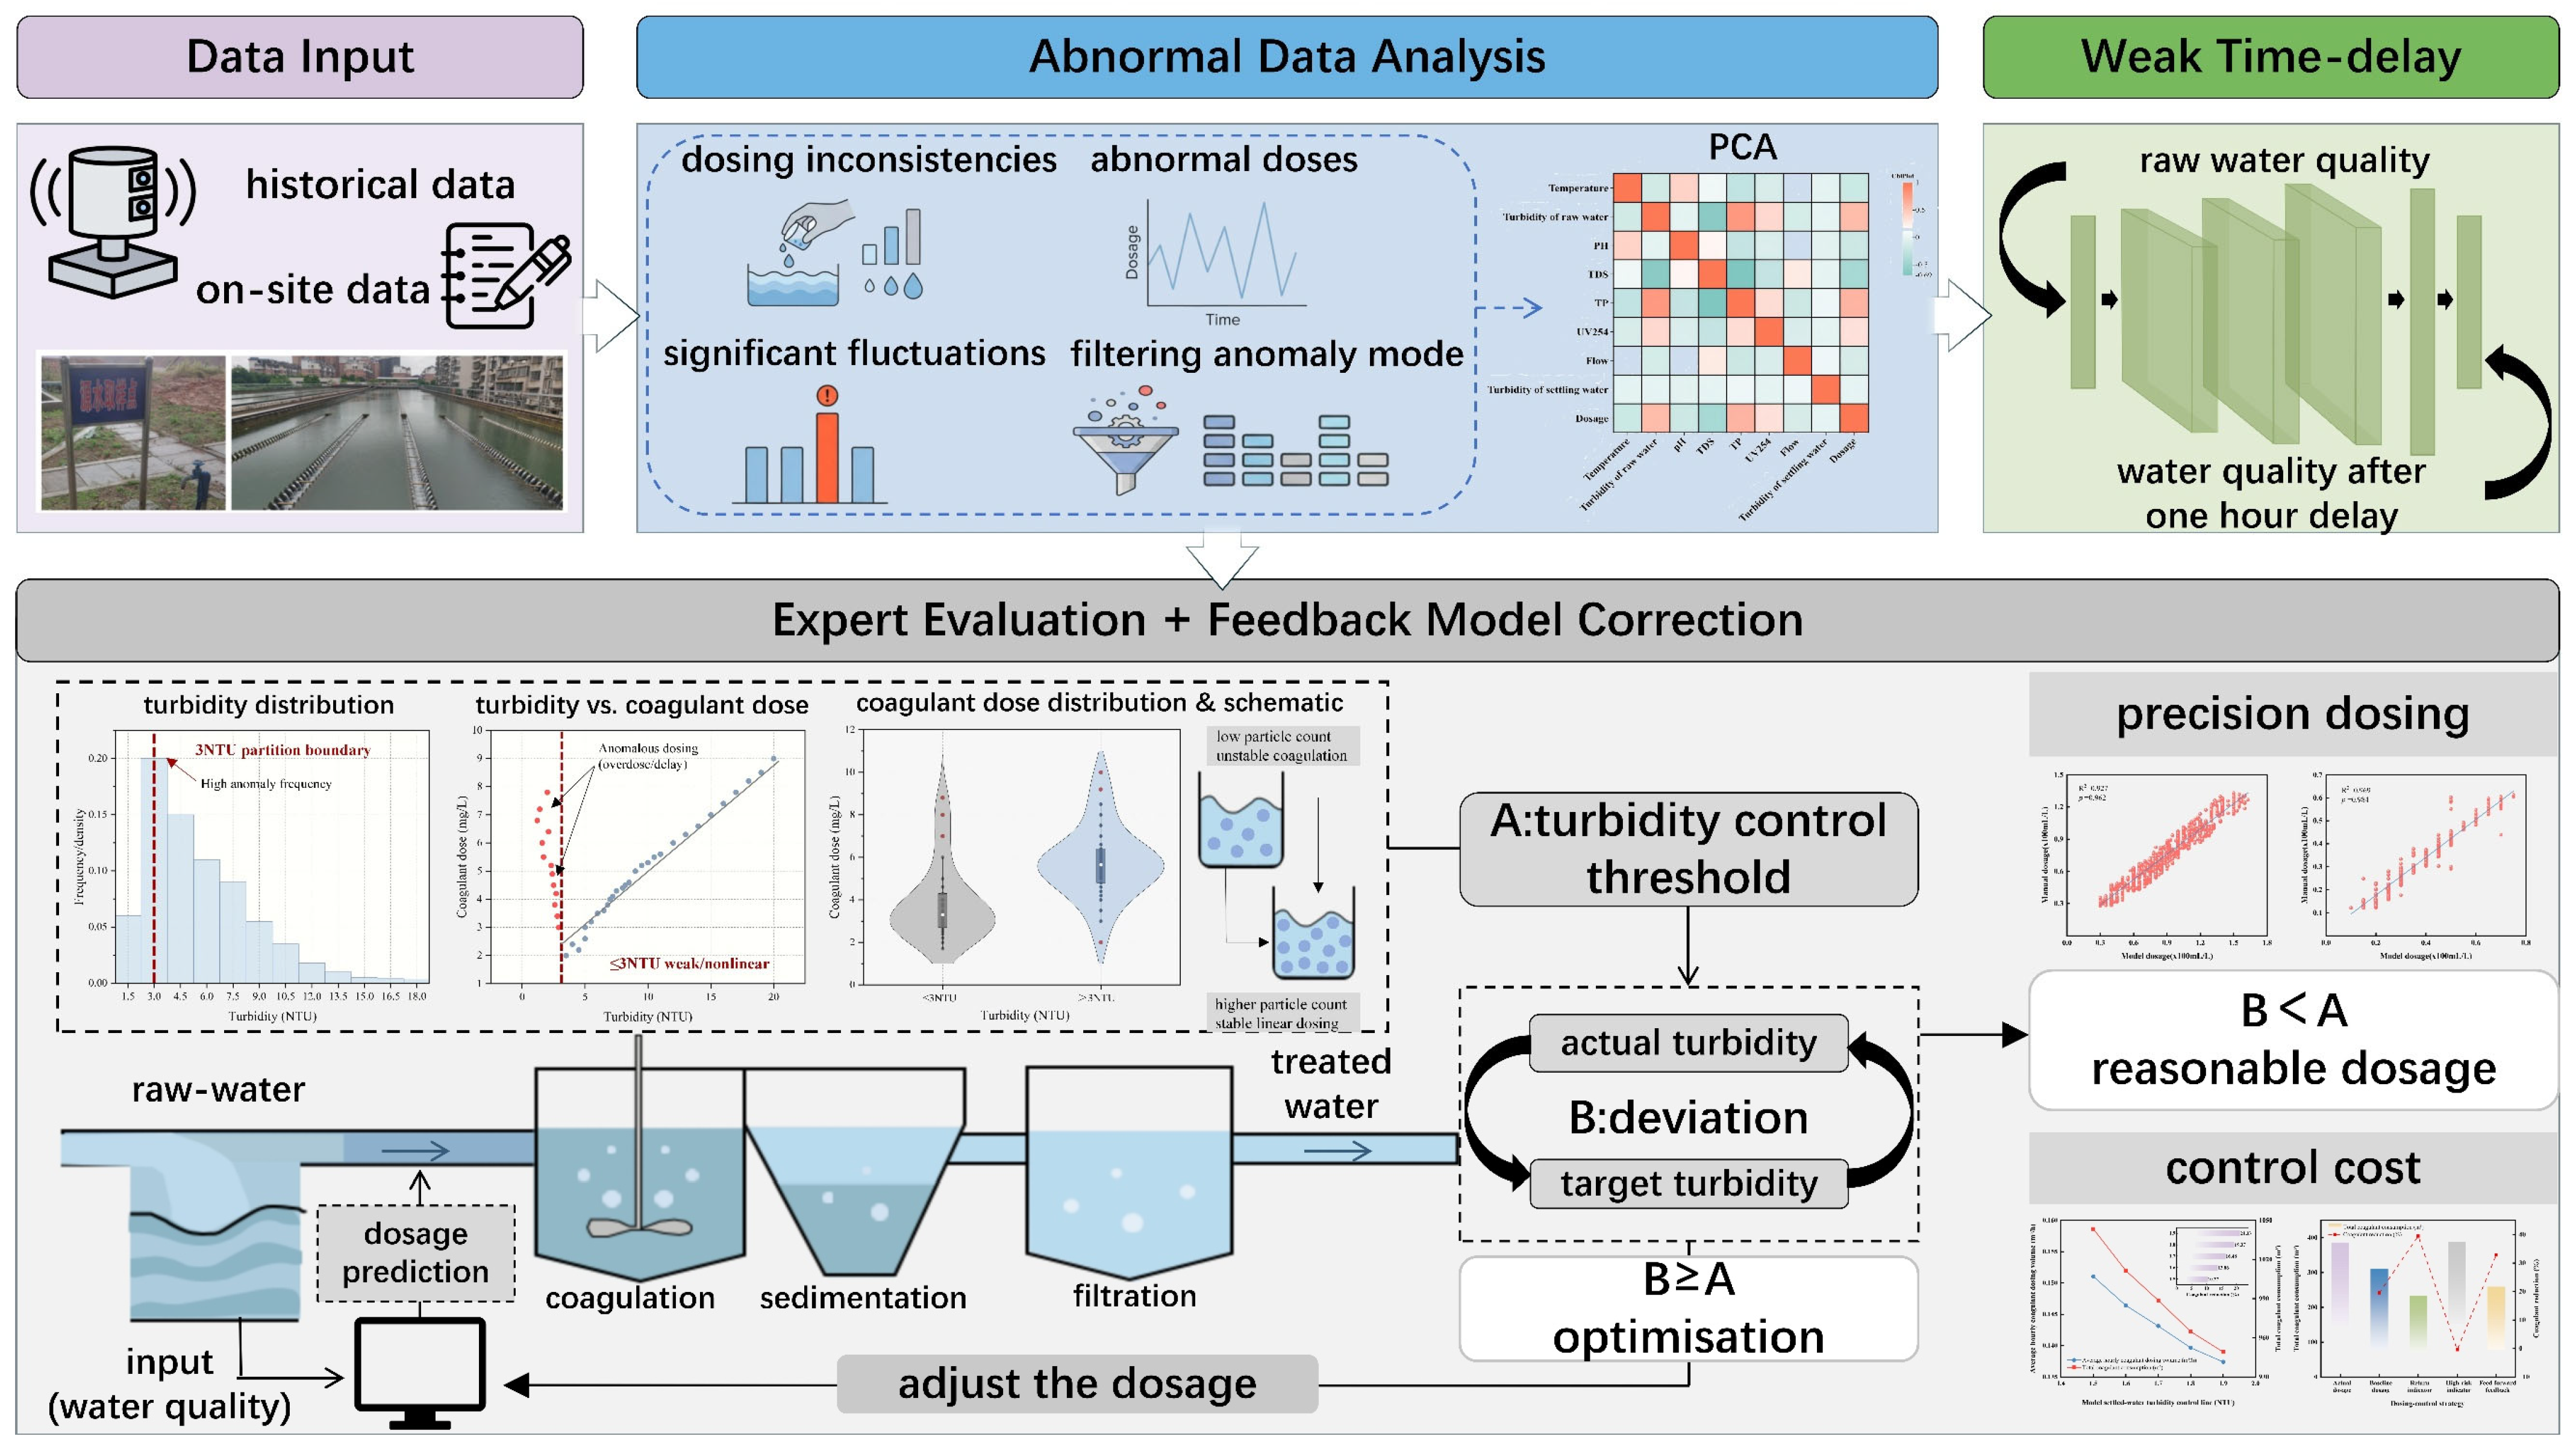
Based on this interpretation, a data-quality-oriented framework was developed in which the main interventions focused on structured data remediation and process alignment rather than increasing model complexity. As shown in Figure 3, the framework combines data preprocessing, expert evaluation, model prediction, process-response alignment, and dynamic feedback within a closed-loop workflow. Historical and on-site records are first screened to establish the initial dataset. Abnormal dosing records and internally inconsistent samples are then assessed against water-quality conditions, plant operation logs, laboratory evidence, and operational experience. The remediated dataset is used to generate an initial dosage estimate, which is subsequently corrected using delayed settled-water turbidity as process feedback. The framework is intended to improve the physical and operational consistency of the input–output relationship before further algorithmic refinement is considered.
Figure 3.
Data-driven framework for coagulant dosage optimization and cost control in water treatment. The figure presents a data-driven framework for optimizing coagulant dosage in water treatment, comprising three stages: Data Input and Preprocessing, Abnormal Data Analysis, and Feedback Model Correction, with the ultimate aim of reducing costs.
3.2.1. Weak Time-Delay Optimization
After data cleaning and removal of abnormal values, a one-hour weak time-delay feature was introduced during preprocessing because raw-water quality in treatment plants usually changes gradually and process responses occur with a lag. This feature smoothed short-term fluctuations in raw-water parameters, reduced noise in the model inputs, and allowed water-quality indicators to better represent the dynamic responses of coagulation and sedimentation.
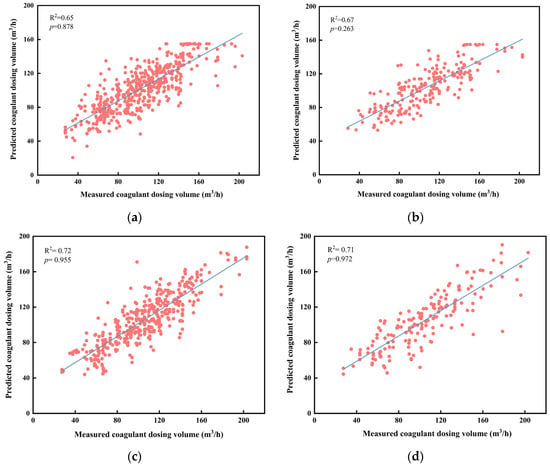
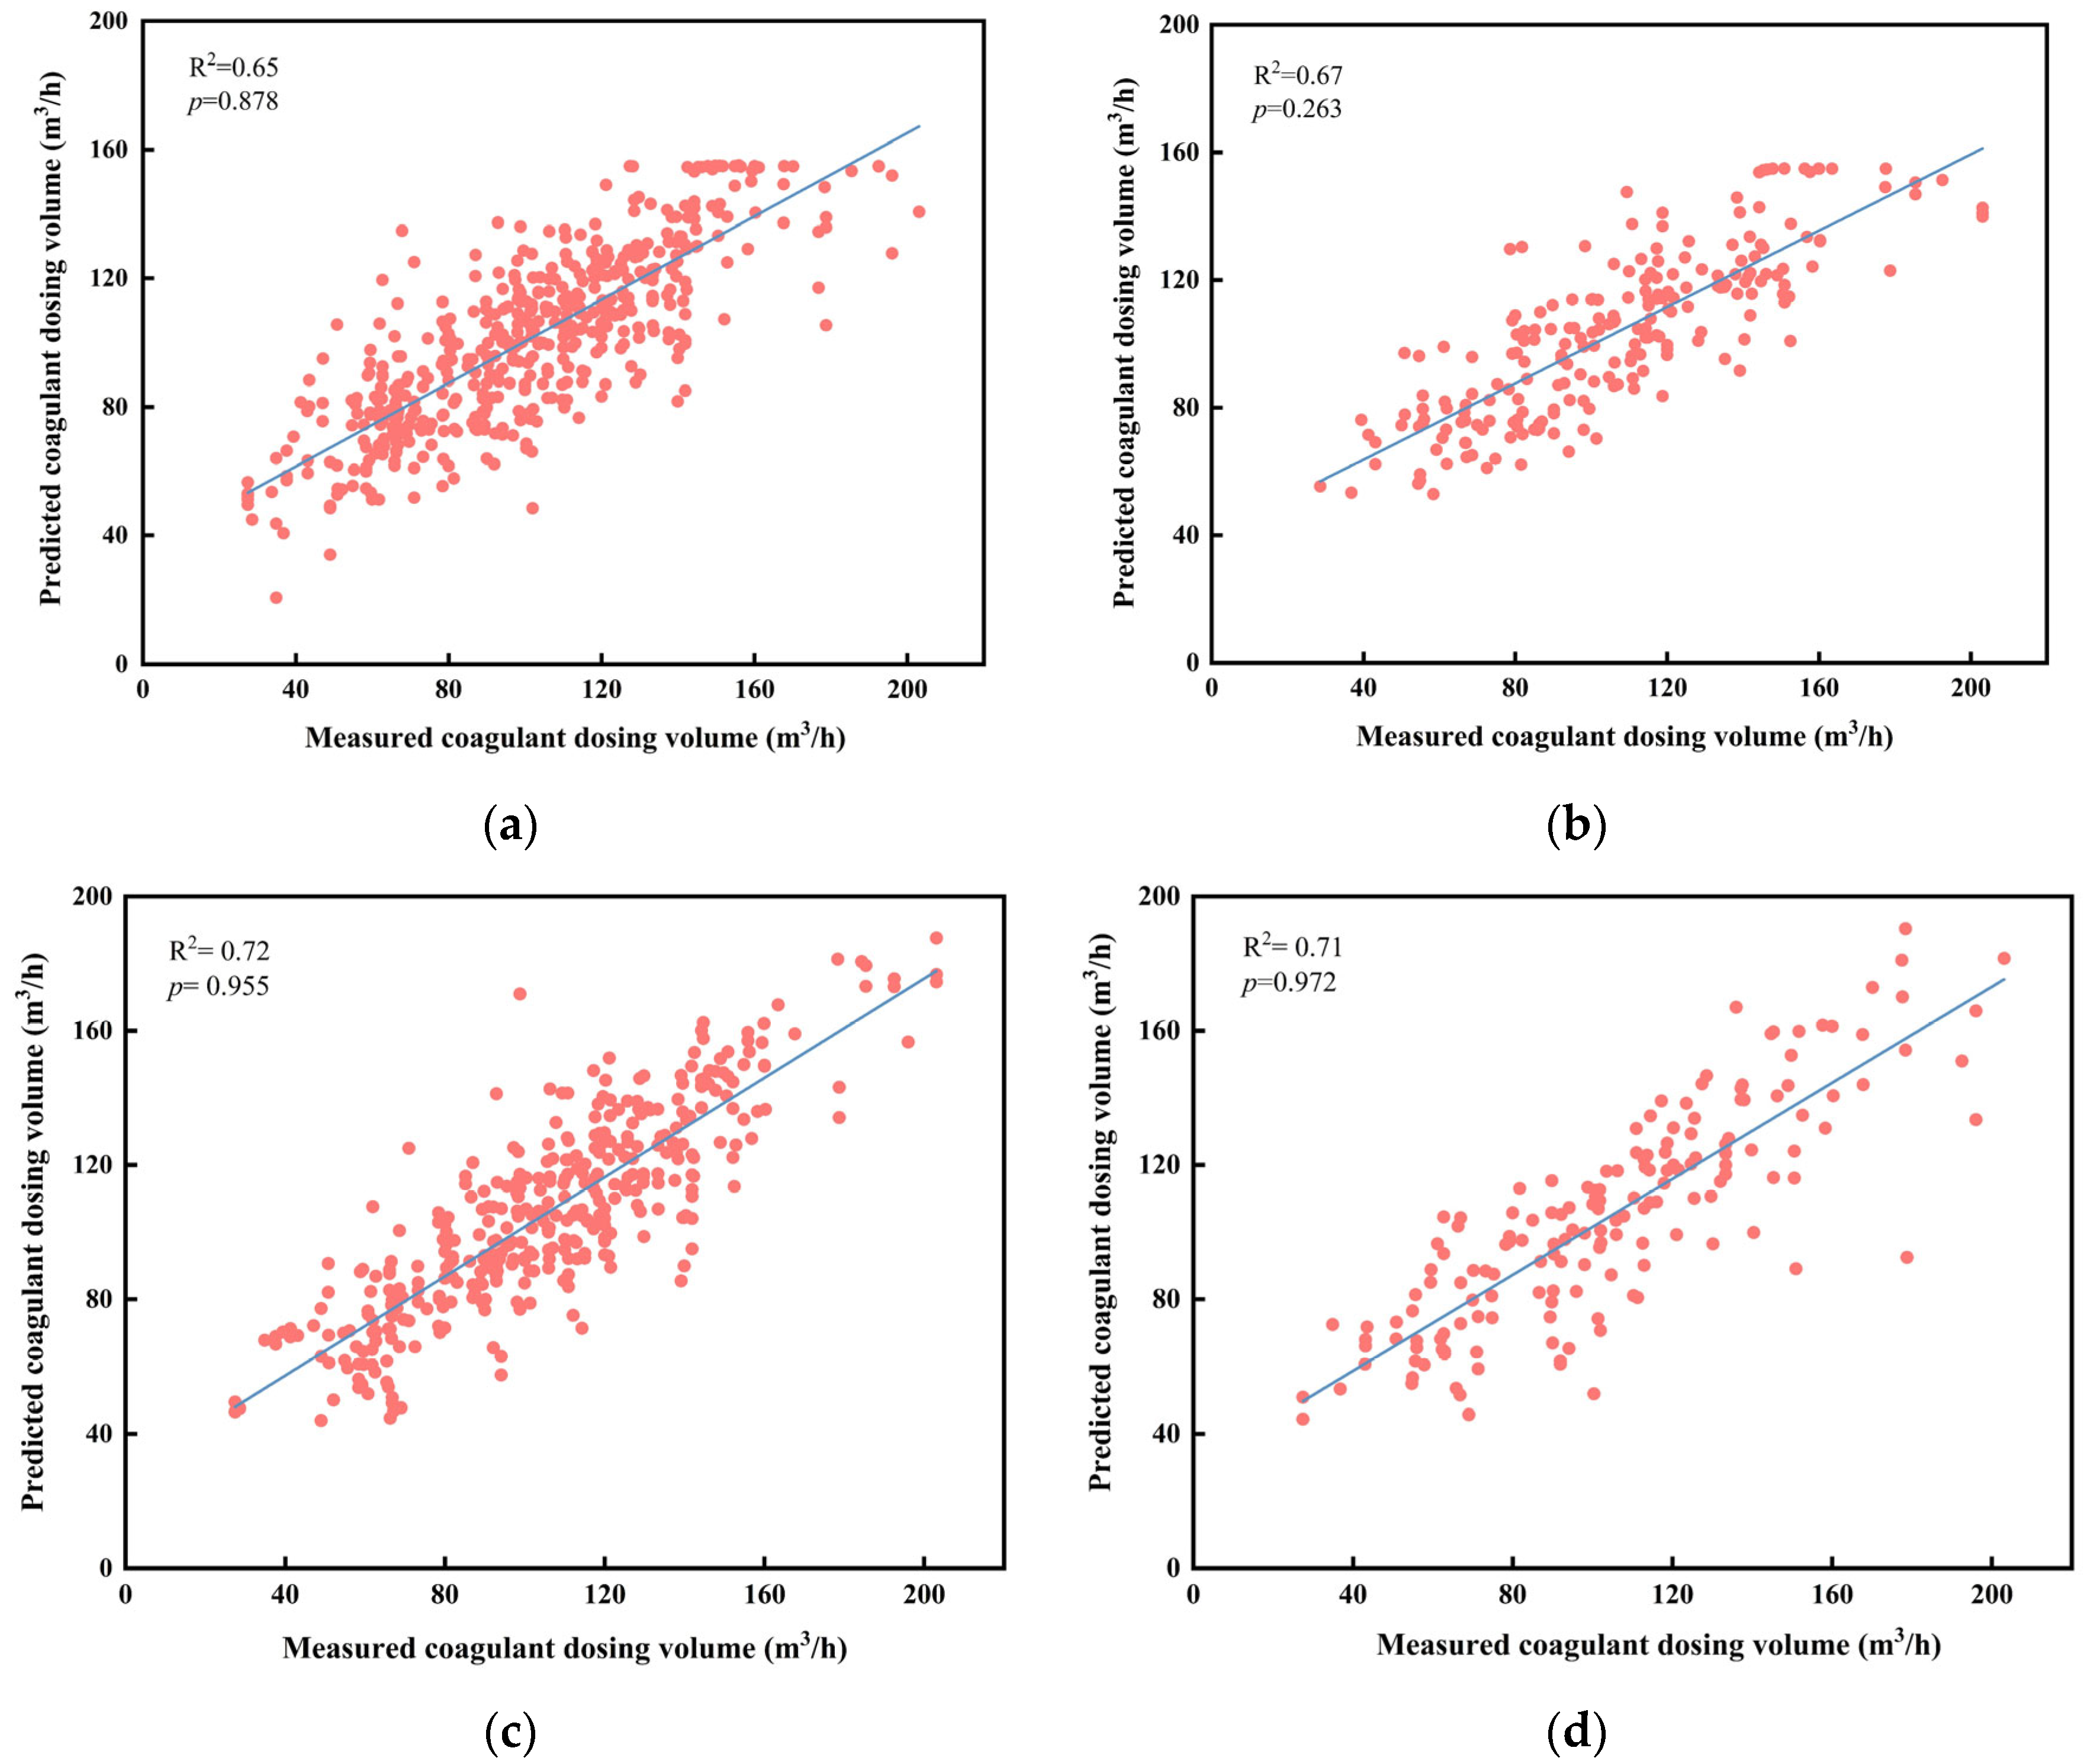
As shown in Figure 4, when the model structure and training parameters were kept unchanged, the inclusion of weak time-delay data improved model performance. R2 increased from 0.67 to 0.72, while the t-test yielded p = 0.972, and EF and d also improved. The concurrent improvement in these metrics indicates that this processing strategy enhanced the model’s explanatory power and internal consistency, allowing the predictions to more closely reflect actual operating behavior. A detailed comparison between the time-delay and weak time-delay models is provided in Supplementary Materials Table S9.
Figure 4.
Effect of weak time-delay processing on model prediction performance: measured versus predicted coagulant dosing volume for (a) training and (b) test sets of the time-delay model, and (c) training and (d) test sets of the weak time-delay model.
The observed improvement is consistent with full-scale studies showing that hydraulic transport and delayed coagulation–sedimentation responses need to be considered when operational data are used for intelligent dosing. Liu et al. [53] corrected the temporal correspondence between process conditions and downstream turbidity by accounting for hydraulic retention in the sedimentation tank, while Wang et al. [54] incorporated historical process states to represent the delayed response of coagulation. These studies show that measurements recorded at the same clock time do not necessarily correspond to the same treatment event, because downstream responses reflect upstream water-quality conditions and dosing actions that occurred earlier in the treatment process. The weak time-delay treatment used in the present study therefore follows the physical sequence of full-scale coagulation and sedimentation and improves the process representativeness of the training data. Unlike approaches that account for temporal dependence through recurrent model structures, the present strategy retains the GA-BP architecture and corrects temporal correspondence directly at the data level. This allows model effects to be distinguished more clearly from data-quality effects and suggests that the improvement in predictive performance results from a more physically consistent organization of the operational records. These findings indicate that temporal alignment is an effective means of improving data quality in full-scale water-treatment modeling, particularly after abnormal records have been screened and the remaining data are organized according to the actual timing of process responses. The magnitude of the improvement was nevertheless modest (R2 = 0.67–0.72), indicating that temporal misalignment explained only part of the prediction error. This contrasts with studies in which explicitly temporal architectures maintained substantially higher predictive accuracy under changing operating conditions [50], suggesting that simple process-response alignment may be insufficient when process dynamics occur over multiple time scales. The remaining performance gap therefore points to additional uncertainty arising from inconsistencies in dosage labels and variation across operating regimes.
3.2.2. Turbidity Zoning and Feedback Correction
To account for differences among operating regimes, this study applied an expert-evaluation-based zoning strategy in which plant data were divided according to turbidity. Statistical analysis and operational experience indicated that abnormal and inconsistent dosing records occurred mainly at turbidity levels below 3 NTU. Under these conditions, low particulate loads and weak coagulation-response signals made dosing decisions more sensitive to safety margins and delayed adjustment, while the relationship between turbidity and coagulant dosage was weak or nonlinear. When turbidity exceeded 3 NTU, however, dosage increased more consistently with turbidity. A threshold of 3 NTU was therefore used to distinguish the two operating regimes, avoiding the need for the model to learn a single relationship from data generated under substantially different process conditions.
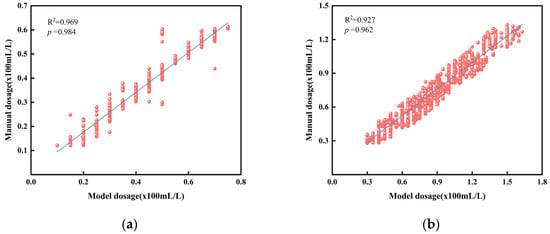
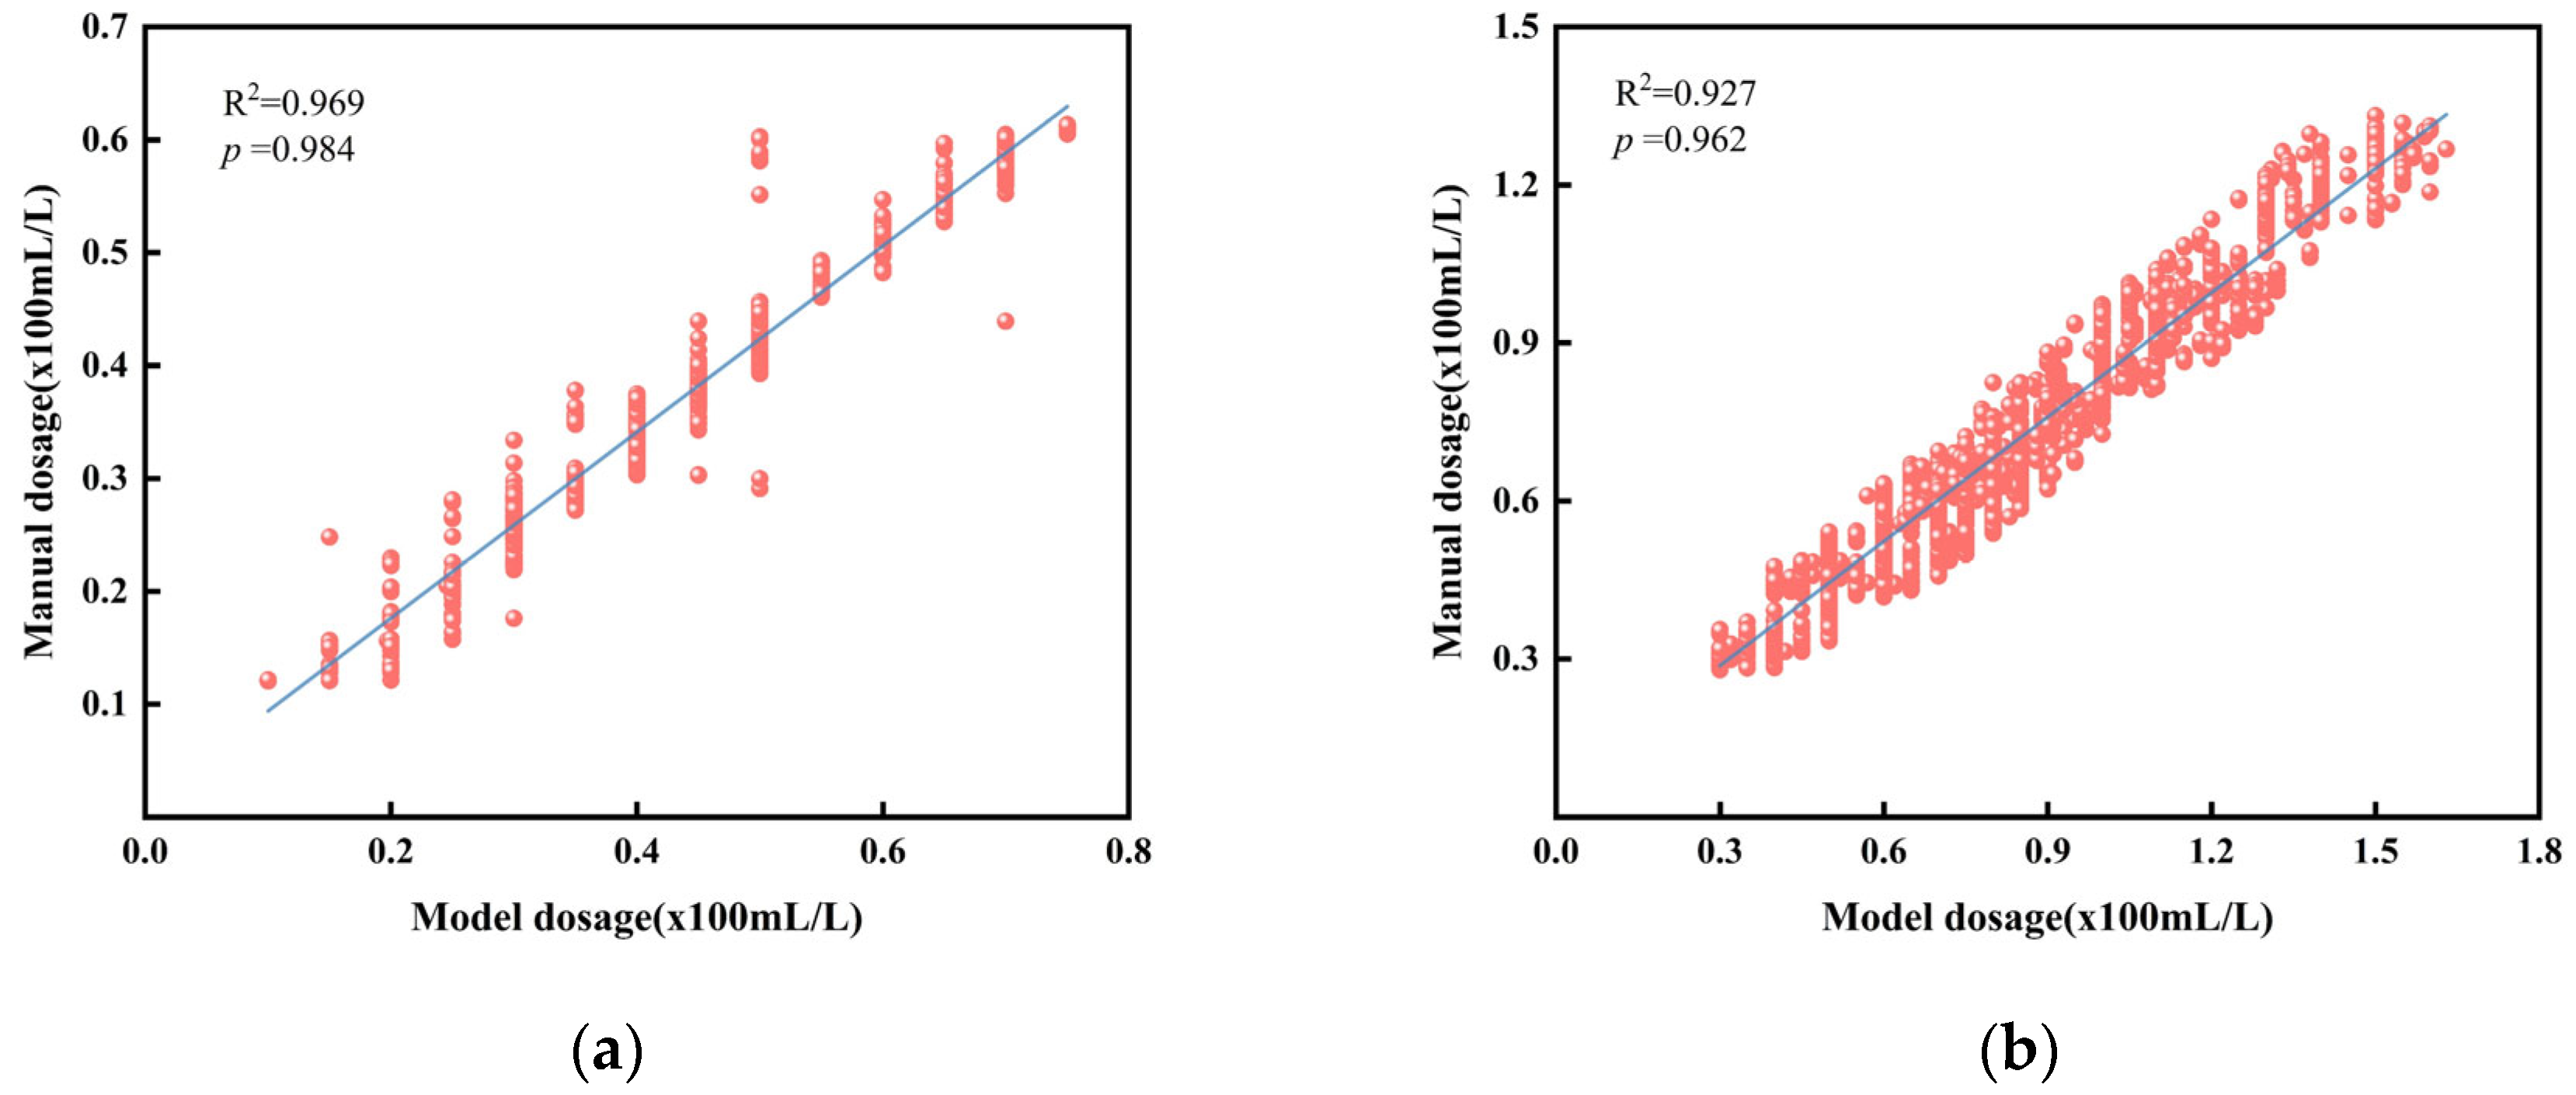
A dynamic feedback mechanism was introduced after turbidity-based partitioning. Without changing the model architecture, the low-turbidity (≤3 NTU) and high-turbidity (>3 NTU) subsets were modeled separately, and delayed settled-water turbidity was used to adjust subsequent dosage decisions. As shown in Figure 5, the fitted curves for both regimes had slopes close to 1. Before these steps, the best feed-forward model achieved only R2 = 0.72 and p = 0.972. After expert evaluation, regime separation, and dynamic feedback were applied, R2 increased to 0.969 and 0.927, with corresponding p values of 0.984 and 0.962 for the low- and high-turbidity regimes, respectively. Because these improvements were achieved without increasing the complexity of the core neural network, the results further indicate that data validity and process-specific organization were major factors governing model performance for the full-scale dataset.
Figure 5.
Feedback-modeling performance for coagulant dosage prediction under turbidity-zoned conditions: (a) measured versus predicted dosage at low turbidity (≤3 NTU); (b) measured versus predicted dosage at high turbidity (>3 NTU).
The improvement obtained after expert evaluation, turbidity zoning, and dynamic feedback is consistent with previous studies showing that process-specific organization of operational data can improve coagulation-model performance. Kim and Parnichkun [55] reported that models developed separately for different raw-water clusters consistently outperformed a single model trained on the entire dataset, suggesting that separating heterogeneous operating conditions can improve the stability of the learned relationship between water quality and coagulant dosage. A similar pattern was observed in the present study. After the plant data were divided at 3 NTU based on distinct dosing characteristics, the model no longer had to represent low- and high-turbidity conditions using a single input–output relationship. The resulting R2 values of 0.969 and 0.927 therefore reflect not only higher predictive accuracy but also greater consistency within each operating regime and better process representativeness of the data used for model training. Wang et al. [56] further showed that incorporating expert knowledge and downstream treatment feedback can improve full-scale coagulant-dosing control, supporting the use of process-response information to improve the reliability of historical operating data. Unlike approaches that incorporate such information through more complex hybrid model structures, the present strategy achieved these improvements while retaining the same core GA-BP architecture. The increase from R2 = 0.72 to 0.969 and 0.927 can therefore be attributed more directly to improvements in the information provided to the model, including more plausible dosage targets through expert evaluation, reduced heterogeneity through turbidity zoning, and closer correspondence between dosing decisions and actual treatment responses through dynamic feedback. These results indicate that organizing full-scale operational data according to distinct process conditions and treatment responses can substantially improve the learnability of the coagulant-dosing relationship without increasing model complexity.
The 3 NTU threshold should, however, be regarded as an operational boundary specific to the investigated plant rather than as a universal criterion for coagulation control. Kim and Parnichkun [55], for example, classified raw-water conditions using multivariable clustering rather than a fixed turbidity threshold, suggesting that more complex water-quality conditions may require multidimensional classification. The turbidity-based zoning used in this study provides a simple and interpretable way to distinguish operating conditions in the present system, but its applicability to other water sources and treatment configurations requires independent evaluation.
3.3. Dosage Control and Cost Reduction
Once the training data had been remediated and the process-response relationship had been better aligned, the next practical question was whether the resulting model could improve chemical-use decisions during continuous operation. With dynamic feedback correction, the intelligent dosing system moved beyond static reproduction of historical dosage patterns and toward adaptive control based on both current water-quality conditions and delayed treatment response. This distinction is important because a high offline fitting metric alone does not demonstrate that the learned dosage relationship is valid under actual operating conditions.
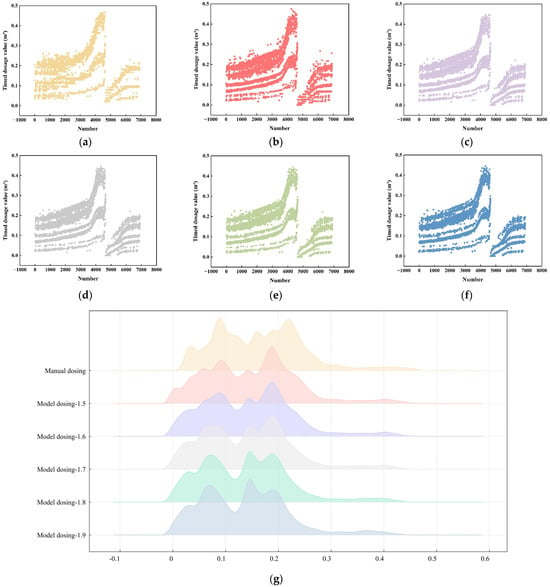
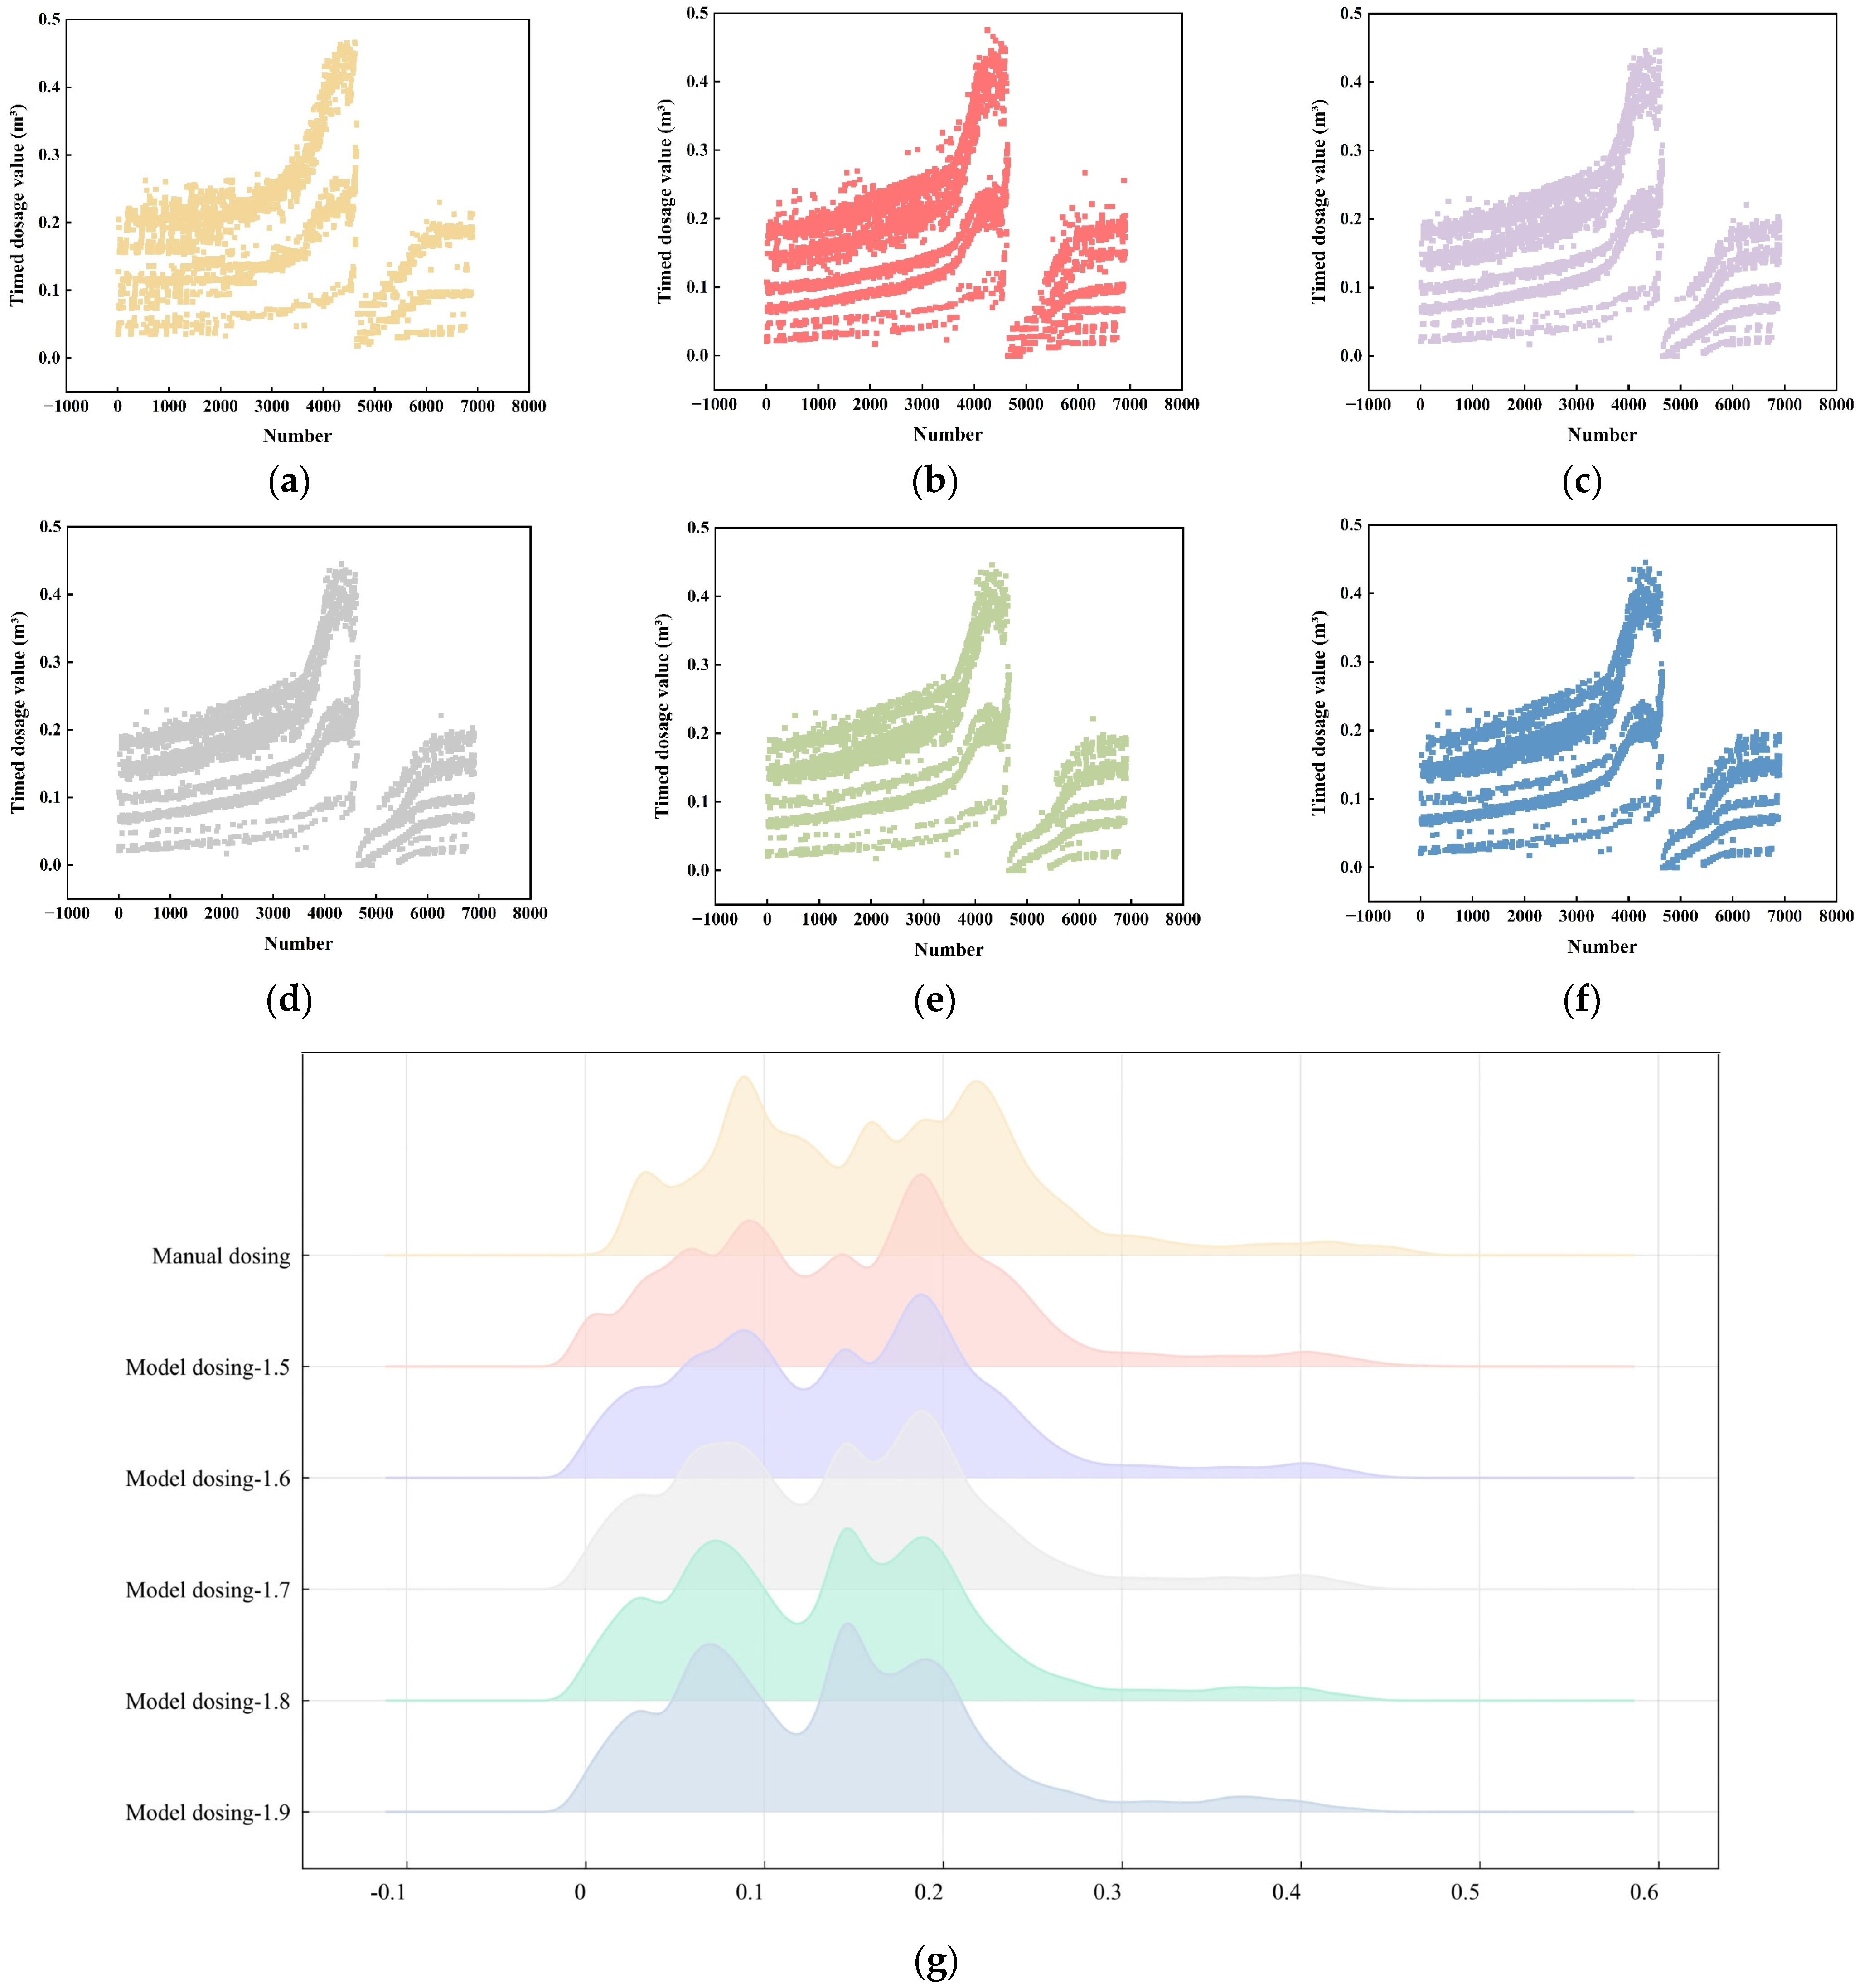
Figure 6 compares manual dosing and model-based dosing from two perspectives. Figure 6a–f focus on the temporal control behavior of dosing. Manual dosing showed abrupt short-term changes and scattered dosage trajectories, indicating that chemical addition was mainly adjusted through delayed operator responses rather than continuous process tracking. By contrast, model-based dosing under settled-water turbidity targets of 1.5–1.9 NTU showed smoother trajectories and clearer dosage gradients across different target levels. This result suggests that the model can translate changes in water quality and turbidity-control requirements into more continuous dosing adjustments, thereby reducing excessive short-term fluctuations and improving process tracking. Figure 6g further evaluates the statistical structure of dosing decisions with temporal ordering excluded. The dispersed and multimodal distribution of manual dosing indicates that multiple dosage levels were used under comparable operating conditions, reflecting operator-dependent practices and inconsistent historical dosing strategies. In contrast, model-based dosing produced a narrower and more concentrated distribution, indicating that the optimized model reduced random dispersion in decision-making and established a more reproducible dosing pattern. Therefore, Figure 6a–f demonstrates improvements in dynamic response and trajectory stability, whereas Figure 6g shows improved decision consistency and reduced dispersion in dosage selection.
Figure 6.
Temporal trends and distributions of coagulant dosage under manual and model-based control: (a) manual dosing; (b–f) model-based dosing at settled-water turbidity targets of 1.5–1.9 NTU; (g) dosage distributions under different control conditions.
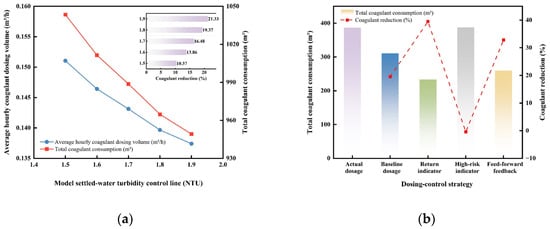
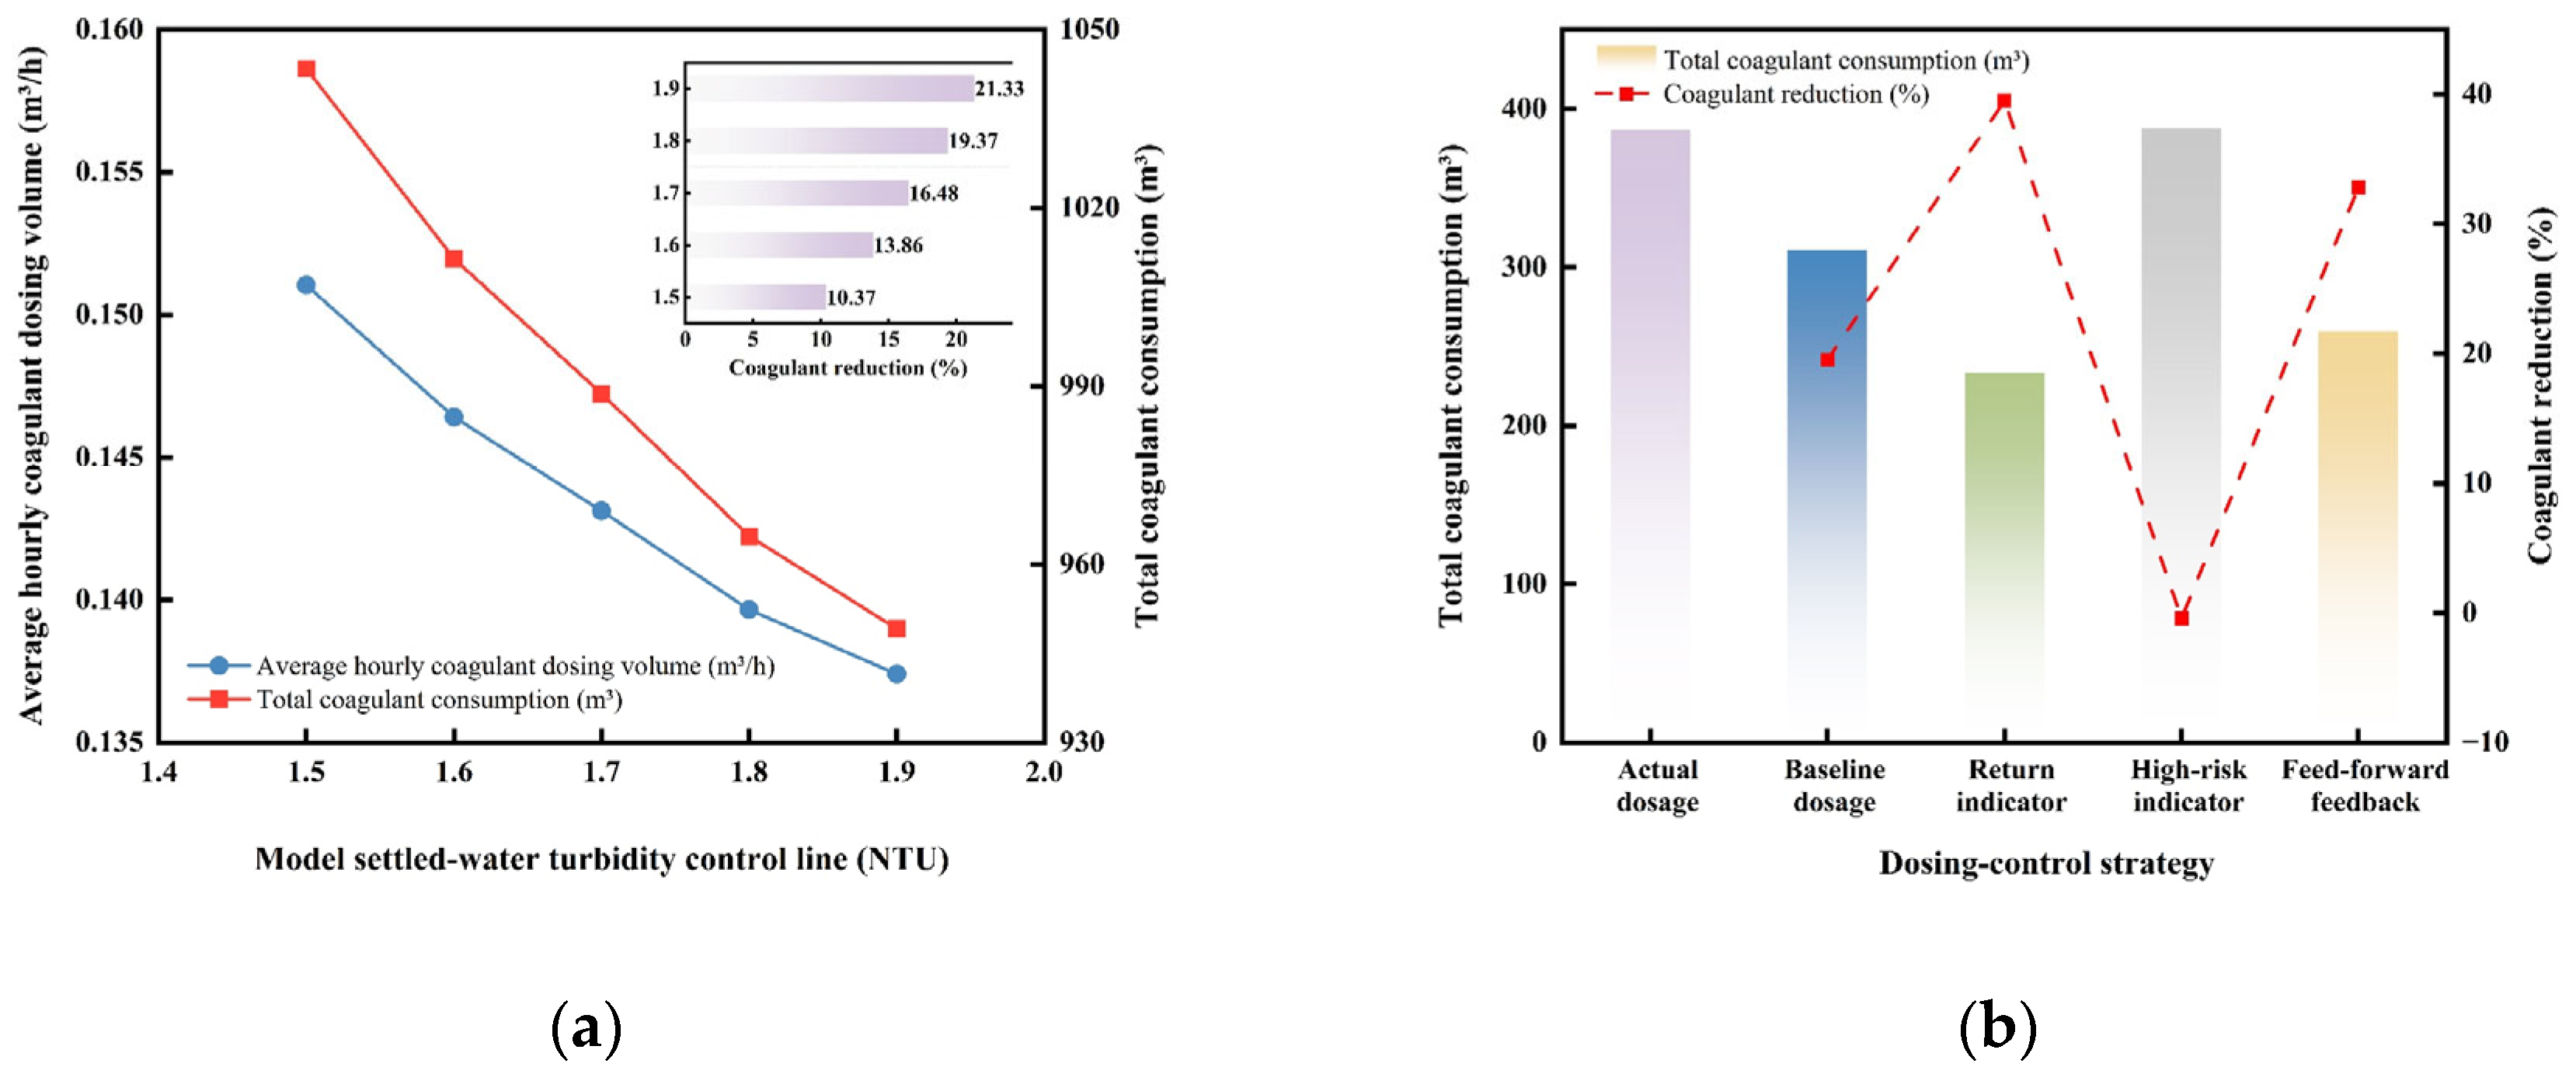
Using the dosing-control results, Figure 7 further evaluates chemical consumption Vtot and operating cost under different control strategies. As the target settled-water turbidity increased within the allowable range, the average dosage under model control remained lower than that under manual operation, and dosage fluctuations were also reduced. Operational validation showed that total chemical consumption Vtot decreased by an average of 10.37% under model control, with the maximum reduction in Vtot reaching 21.33% at a target turbidity of 1.9 NTU. Detailed dosage-control results under different settled-water turbidity targets are provided in Supplementary Materials Table S10. This reduction is comparable to those reported in recent intelligent-dosing studies. Feng et al. [57] estimated an annual coagulant-saving potential of 10.25% using an AutoML-based dosage model, while Li et al. [58] reported a 15.81% reduction in overall chemical dosage during one month of model-assisted operation. Wang et al. [59] achieved PAC reductions of 3.42–8.94% across three full-scale treatment configurations while maintaining stable effluent quality. The average reduction of 10.37% obtained in the present study therefore falls within the range reported for recent data-driven optimization approaches. The close agreement with the 10.25% reduction reported by Feng et al. further suggests that a meaningful portion of routine coagulant use can be reduced by improving the correspondence between water-quality conditions and dosing demand, even without modifying the existing treatment process. Differences in reported chemical-saving rates should not be interpreted as a direct ranking of control strategies, because the studies vary in treatment configuration, operating period, baseline dosing practice, optimization objective, and the definition of chemical saving. Instead, the achievable benefit is likely to depend on both the extent of redundancy in the original dosing practice and the range of variables considered in the optimization.
Figure 7.
Coagulant consumption and reduction under different dosing-control strategies: (a) average hourly dosing volume and total coagulant consumption under settled-water turbidity control lines of 1.5–1.9 NTU; (b) comparison of total coagulant consumption and reduction among different model-assisted dosing-control strategies.
Dynamic feedback further improved the real-time correction capacity of the dosing system. By adjusting the feedback-corrected dosage according to prediction errors and deviations in settled-water turbidity, the system adapted to changing water-quality conditions during continuous operation. The maximum relative excess of manual chemical consumption E reached 32.83%, while dosing stability also improved. Detailed reduction estimates under different model-assisted and feedback-control scenarios are provided in Supplementary Materials Table S11. As shown in Figure 7b, the proposed strategy, which integrates data optimization, expert evaluation, and dynamic feedback, achieved lower total coagulant consumption Vtot and lower operating costs compared with manual operation and model-prediction control. This optimization framework demonstrates the practical value and scalability of data-driven intelligent control for chemical dosing in water treatment and supports the development of more refined and energy-efficient plant operation and management.
4. Conclusions
This study used a fixed GA-BP neural network as a representative nonlinear model to examine a central question in intelligent coagulant dosing: whether prediction performance at full scale is constrained primarily by model configuration or by the validity of operational training data. The same architecture achieved an R2 of approximately 0.96 with controlled laboratory data but only about 0.67 with full-scale plant data before remediation, while alternative input structures provided only limited improvement. This contrast indicates that data consistency, target validity, and process representativeness had a greater effect on model performance than the input-structure refinements examined. The main contribution of this work is therefore not a new neural-network architecture, but a data-centered framework for identifying and correcting limitations in operational data that constrain intelligent dosing.
The results also indicate that structured data remediation is more appropriate than indiscriminate data deletion for full-scale water-treatment applications. Conventional outlier removal may discard valid but infrequent operating conditions, whereas expert-guided evaluation, laboratory evidence, weak time-delay alignment, and regime-specific analysis can reduce the influence of measurement errors, operator-dependent dosing decisions, and process-response mismatch while retaining representative operating conditions. Within this framework, expert evaluation improves the plausibility of historical dosage targets, weak time-delay processing restores temporal correspondence, and turbidity zoning reduces heterogeneity across water-quality regimes. Together, these steps improve the validity of the input–output relationship presented to the neural network before its predictions are used for process control.
Operational verification further showed that feedback from settled-water turbidity is important for converting an offline prediction model into a reliable dosing-control system. Model prediction alone produced only limited improvement in dosing consistency, whereas the closed-loop strategy allowed dosage to be adjusted in response to changing water-quality conditions. Model-based control reduced average coagulant consumption by 10.37%, while manual dosing resulted in up to 32.83% higher consumption under the evaluated feedback-control scenarios. With a consistent unit cost for PAC, the observed reductions correspond to equivalent relative savings in chemical cost, independent of plant-specific procurement conditions and price fluctuations. The 1.5–1.9 NTU range used for feedback control refers to settled-water turbidity at the sedimentation stage rather than finished-water turbidity; subsequent filtration and disinfection are applied before final supply. These findings do not suggest that algorithm selection is unimportant in all water-treatment applications. Rather, they indicate that the validity, temporal alignment, and process representativeness of training data should be established before increasingly complex models are compared. Future work should evaluate the proposed data-validation approach across multiple treatment plants, develop more transferable classifications of water-quality regimes, and reduce reliance on plant-specific expert rules to support broader application of data-validity-centered intelligent dosing.
Supplementary Materials
The following supporting information can be downloaded at: https://www.mdpi.com/article/10.3390/pr14172847/s1, Table S1: Distribution of laboratory flocculation data; Table S2: Characteristics of water parameters; Table S3: Flocculation factor correlation matrix; Table S4: Composition and responsibilities of the expert evaluation panel; Table S5: Classification results of validated full-scale plant data records; Table S6: Principle component as function of water quality factors; Table S7: Statistical results for each factor’s influence on chemical dosing prediction using a time delay model and a weak time delay model; Table S8: Evaluation parameters for prediction of chemical dosing by neural network; Table S9: Model simulation performance analysis table; Table S10: The effect of dosage control; Table S11 Model coagulant dosage reduces evaluation; Figure S1: Plots of coagulant dose as function water quality parameter; Figure S2: (a) Analysis results of factor sensitivity of time-delay network model (b) Analysis results of factor sensitivity of weak time-delay network.
Author Contributions
Conceptualization, G.Z.; methodology, Y.L., H.F. and G.Z.; validation, G.Z.; formal analysis, Y.L.; investigation, H.F.; data curation, H.F.; writing—original draft preparation, Y.L. and H.F.; writing—review and editing, B.H., G.Z. and A.S.H.; visualization, Y.L.; supervision, G.Z.; funding acquisition, G.Z. All authors have read and agreed to the published version of the manuscript.
Funding
This research was funded by the Natural Science Foundation of Hainan Province (No. 526MS0238) and the Natural Science Foundation of Hunan Province of China (No. 2021JJ30272).
Data Availability Statement
The original contributions presented in this study are included in the article. Further inquiries can be directed to the corresponding author.
Conflicts of Interest
The authors declare no other conflicts of interest.
Abbreviations
The following abbreviations are used in this manuscript:
| AI | Artificial intelligence |
| NTU | Nephelometric turbidity unit |
| GA-BP | Genetic algorithm-optimized backpropagation |
| TDS | Total dissolved solids |
| TP | Total phosphorus |
| PCA | Principal component analysis |
| R2 | Coefficient of determination |
| p | p-value from the independent-samples t-test |
| RMSE | Root mean square error |
| RMSE% | Relative RMSE |
| EF | Efficiency coefficient |
| d | Consistency index |
| MLP | Multilayer perceptron |
| ANN | Artificial neural network |
References
- Alam, G.; Ihsanullah, I.; Naushad, M.; Sillanpää, M. Applications of artificial intelligence in water treatment for optimization and automation of adsorption processes: Recent advances and prospects. Chem. Eng. J. 2022, 427, 130011. [Google Scholar] [CrossRef] [Scilit]
- Alvi, M.; Batstone, D.; Mbamba, C.K.; Keymer, P.; French, T.; Ward, A.; Dwyer, J.; Cardell-Oliver, R. Deep learning in wastewater treatment: A critical review. Water Res. 2023, 245, 120518. [Google Scholar] [CrossRef] [Scilit] [PubMed]
- Bagheri, M.; Akbari, A.; Mirbagheri, S.A. Advanced control of membrane fouling in filtration systems using artificial intelligence and machine learning techniques: A critical review. Process Saf. Environ. Prot. 2019, 123, 229–252. [Google Scholar] [CrossRef] [Scilit]
- Rashid, A.B.; Kausik, M.A.K. AI revolutionizing industries worldwide: A comprehensive overview of its diverse applications. Hybrid Adv. 2024, 7, 100277. [Google Scholar] [CrossRef] [Scilit]
- Li, L.; Rong, S.; Wang, R.; Yu, S. Recent advances in artificial intelligence and machine learning for nonlinear relationship analysis and process control in drinking water treatment: A review. Chem. Eng. J. 2021, 405, 126673. [Google Scholar] [CrossRef] [Scilit]
- Safeer, S.; Pandey, R.P.; Rehman, B.; Safdar, T.; Ahmad, I.; Hasan, S.W.; Ullah, A. A review of artificial intelligence in water purification and wastewater treatment: Recent advancements. J. Water Process Eng. 2022, 49, 102974. [Google Scholar] [CrossRef] [Scilit]
- Xue, X.; Cashman, S.; Gaglione, A.; Mosley, J.; Weiss, L.; Ma, X.C.; Cashdollar, J.; Garland, J. Holistic analysis of urban water systems in the Greater Cincinnati region: (1) life cycle assessment and cost implications. Water Res. X 2019, 2, 100015. [Google Scholar] [CrossRef] [Scilit] [PubMed]
- Behera, S.K.; Karthika, S.; Mahanty, B.; Meher, S.K.; Zafar, M.; Baskaran, D.; Rajamanickam, R.; Das, R.; Pakshirajan, K.; Bilyaminu, A.M. Application of artificial intelligence tools in wastewater and waste gas treatment systems: Recent advances and prospects. J. Environ. Manag. 2024, 370, 122386. [Google Scholar] [CrossRef] [Scilit] [PubMed]
- Bellocchi, G.; Rivington, M.; Donatelli, M.; Matthews, K. Validation of biophysical models: Issues and methodologies. A review. Agron. Sustain. Dev. 2010, 30, 109–130. [Google Scholar] [CrossRef] [Scilit]
- Chen, H.; Chen, J.; Ding, J. Data evaluation and enhancement for quality improvement of machine learning. IEEE Trans. Reliab. 2021, 70, 831–847. [Google Scholar] [CrossRef] [Scilit]
- Manjakkal, L.; Mitra, S.; Petillot, Y.R.; Shutler, J.; Scott, E.M.; Willander, M.; Dahiya, R. Connected sensors, innovative sensor deployment, and intelligent data analysis for online water quality monitoring. IEEE Internet Things J. 2021, 8, 13805–13824. [Google Scholar] [CrossRef] [Scilit]
- Chhipi-Shrestha, G.; Mian, H.R.; Mohammadiun, S.; Rodriguez, M.; Hewage, K.; Sadiq, R. Digital water: Artificial intelligence and soft computing applications for drinking water quality assessment. Clean Technol. Environ. Policy 2023, 25, 1409–1438. [Google Scholar] [CrossRef] [Scilit]
- Chen, K.; Wang, H.; Valverde-Pérez, B.; Zhai, S.; Vezzaro, L.; Wang, A. Optimal control towards sustainable wastewater treatment plants based on multi-agent reinforcement learning. Chemosphere 2021, 279, 130498. [Google Scholar] [CrossRef] [Scilit] [PubMed]
- Sharafi, M.; Rezaverdinejad, V.; Behmanesh, J.; Samadianfard, S. Development of long short-term memory along with differential optimization and neural networks for coagulant dosage prediction in water treatment plant. J. Water Process Eng. 2024, 65, 105784. [Google Scholar] [CrossRef] [Scilit]
- Lin, S.; Kim, J.; Hua, C.; Park, M.-H.; Kang, S. Coagulant dosage determination using deep learning-based graph attention multivariate time series forecasting model. Water Res. 2023, 232, 119665. [Google Scholar] [CrossRef] [Scilit] [PubMed]
- Wang, K.-J.; Wang, P.-S.; Nguyen, H.-P. A data-driven optimization model for coagulant dosage decision in industrial wastewater treatment. Comput. Chem. Eng. 2021, 152, 107383. [Google Scholar] [CrossRef] [Scilit]
- Fisher, O.J.; Watson, N.J.; Escrig, J.E.; Witt, R.; Porcu, L.; Bacon, D.; Rigley, M.; Gomes, R.L. Considerations, challenges and opportunities when developing data-driven models for process manufacturing systems. Comput. Chem. Eng. 2020, 140, 106881. [Google Scholar] [CrossRef] [Scilit]
- Sadati, N.; Chinnam, R.B.; Nezhad, M.Z. Observational data-driven modeling and optimization of manufacturing processes. Expert Syst. Appl. 2018, 93, 456–464. [Google Scholar] [CrossRef] [Scilit]
- Roy, M.; Wodo, O. Data-driven modeling of thermal history in additive manufacturing. Addit. Manuf. 2020, 32, 101017. [Google Scholar] [CrossRef] [Scilit]
- Yu, Q.; Tolson, B. How much historical data do we need? The role of data recency and training period length in LSTM-based rainfall-runoff modeling. J. Hydrol. 2026, 668, 135046. [Google Scholar] [CrossRef] [Scilit]
- Rožman, M.; Oreški, D.; Tominc, P. Artificial-intelligence-supported reduction of employees’ workload to increase the company’s performance in today’s VUCA environment. Sustainability 2023, 15, 5019. [Google Scholar] [CrossRef] [Scilit]
- Cannas, V.G.; Ciano, M.P.; Saltalamacchia, M.; Secchi, R. Artificial intelligence in supply chain and operations management: A multiple case study research. Int. J. Prod. Res. 2024, 62, 3333–3360. [Google Scholar] [CrossRef] [Scilit]
- Lowe, M.; Qin, R.; Mao, X. A review on machine learning, artificial intelligence, and smart technology in water treatment and monitoring. Water 2022, 14, 1384. [Google Scholar] [CrossRef] [Scilit]
- Soni, A.; Arora, C.; Kaushik, R.; Upadhyay, V. Evaluating the impact of data quality on machine learning model performance. J. Nonlinear Anal. Optim. 2023, 14, 13–18. [Google Scholar] [CrossRef] [Scilit]
- Liu, J.; Long, Y.; Zhu, G.; Hursthouse, A.S. Application of artificial intelligence in the management of coagulation treatment engineering system. Processes 2024, 12, 1824. [Google Scholar] [CrossRef] [Scilit]
- Liu, Y.; Ramin, P.; Flores-Alsina, X.; Gernaey, K.V. Transforming data into actionable knowledge for fault detection, diagnosis and prognosis in urban wastewater systems with AI techniques: A mini-review. Process Saf. Environ. Prot. 2023, 172, 501–512. [Google Scholar] [CrossRef] [Scilit]
- Fu, G.; Jin, Y.; Sun, S.; Yuan, Z.; Butler, D. The role of deep learning in urban water management: A critical review. Water Res. 2022, 223, 118973. [Google Scholar] [CrossRef] [Scilit] [PubMed]
- Gill, S.S.; Xu, M.; Ottaviani, C.; Patros, P.; Bahsoon, R.; Shaghaghi, A.; Golec, M.; Stankovski, V.; Wu, H.; Abraham, A. AI for next generation computing: Emerging trends and future directions. Internet Things 2022, 19, 100514. [Google Scholar] [CrossRef] [Scilit]
- Gholikandi, G.B.; Delnavaz, M.; Riahi, R. Use of Artificial Neural Network for prediction of coagulation/flocculation process by PAC in water treatment plant. Environ. Eng. Manag. J. (EEMJ) 2011, 10, 1719. [Google Scholar] [CrossRef] [Scilit]
- Kim, J.; Hua, C.; Kim, K.; Lin, S.; Oh, G.; Park, M.-H.; Kang, S. Optimizing coagulant dosage using deep learning models with large-scale data. Chemosphere 2024, 350, 140989. [Google Scholar] [CrossRef] [Scilit] [PubMed]
- Dadebo, D.; Obura, D.; Etyang, N.; Kimera, D. Economic and social perspectives of implementing artificial intelligence in drinking water treatment systems for predicting coagulant dosage: A transition toward sustainability. Groundw. Sustain. Dev. 2023, 23, 100987. [Google Scholar] [CrossRef] [Scilit]
- Gong, Y.; Liu, G.; Xue, Y.; Li, R.; Meng, L. A survey on dataset quality in machine learning. Inf. Softw. Technol. 2023, 162, 107268. [Google Scholar] [CrossRef] [Scilit]
- Wu, X.; Zheng, W.; Xia, X.; Lo, D. Data quality matters: A case study on data label correctness for security bug report prediction. IEEE Trans. Softw. Eng. 2021, 48, 2541–2556. [Google Scholar] [CrossRef] [Scilit]
- Nong, X.; He, Y.; Chen, L.; Wei, J. Machine learning-based evolution of water quality prediction model: An integrated robust framework for comparative application on periodic return and jitter data. Environ. Pollut. 2025, 369, 125834. [Google Scholar] [CrossRef] [Scilit] [PubMed]
- Huang, C.-Y.; Chen, Y.-Y.; Chuang, S.-H.; Hsu, Y.-S.; Wu, R.-S.; Ko, K.-Y. A precise dosing system based on a coagulation reaction model for water treatment. J. Water Process Eng. 2025, 70, 106962. [Google Scholar] [CrossRef] [Scilit]
- Wang, Y.-Q.; Wang, H.-C.; Xiao, Z.-J.; Bu, L.-J.; Li, J.; Feng, X.-C.; Liang, B.; Liu, W.-Z.; Sun, F.-Y.; Zhou, S.-Q. Machine learning strategy secures urban smart drinking water treatment plant through incremental advances. Water Res. 2025, 280, 123541. [Google Scholar] [CrossRef] [Scilit] [PubMed]
- Ahmed, C.M.; Mathur, A. Machine learning for intrusion detection in industrial control systems: Challenges and lessons from experimental evaluation. Cybersecurity 2021, 4, 27. [Google Scholar] [CrossRef] [Scilit]
- Leigh, C.; Alsibai, O.; Hyndman, R.J.; Kandanaarachchi, S.; King, O.C.; McGree, J.M.; Neelamraju, C.; Strauss, J.; Talagala, P.D.; Turner, R.D. A framework for automated anomaly detection in high frequency water-quality data from in situ sensors. Sci. Total Environ. 2019, 664, 885–898. [Google Scholar] [CrossRef] [Scilit] [PubMed]
- Gewers, F.L.; Ferreira, G.R.; Arruda, H.F.D.; Silva, F.N.; Comin, C.H.; Amancio, D.R.; Costa, L.D.F. Principal component analysis: A natural approach to data exploration. ACM Comput. Surv. (CSUR) 2021, 54, 1–34. [Google Scholar] [CrossRef] [Scilit]
- Roy, B.N.; Roy, H.; Rahman, K.S.; Mahmud, F.; Bhuiyan, M.M.K.; Hasan, M.; Bhuiyan, A.-A.K.; Hasan, M.; Mahbub, M.S.; Jahedi, R.M. Principal component analysis incorporated water quality index modeling for Dhaka-based rivers. City Environ. Interact. 2024, 23, 100150. [Google Scholar] [CrossRef] [Scilit]
- Luo, H.; Li, X.; Yuan, F.; Yuan, C.; Huang, W.; Ji, Q.; Wang, X.; Liu, B.; Zhu, G. Application of a new architecture neural network in determination of flocculant dosing for better controlling drinking water quality. Water 2022, 14, 2727. [Google Scholar] [CrossRef] [Scilit]
- Yang, J.; Yang, J.-Y.; Liu, S.; Hoogenboom, G. An evaluation of the statistical methods for testing the performance of crop models with observed data. Agric. Syst. 2014, 127, 81–89. [Google Scholar] [CrossRef] [Scilit]
- Moriasi, D.N.; Gitau, M.W.; Pai, N.; Daggupati, P. Hydrologic and water quality models: Performance measures and evaluation criteria. Trans. ASABE 2015, 58, 1763–1785. [Google Scholar] [CrossRef] [Scilit]
- Sit, M.; Demiray, B.Z.; Xiang, Z.; Ewing, G.J.; Sermet, Y.; Demir, I. A comprehensive review of deep learning applications in hydrology and water resources. Water Sci. Technol. 2020, 82, 2635–2670. [Google Scholar] [CrossRef] [Scilit] [PubMed]
- Chicco, D.; Warrens, M.J.; Jurman, G. The coefficient of determination R-squared is more informative than SMAPE, MAE, MAPE, MSE and RMSE in regression analysis evaluation. Peerj Comput. Sci. 2021, 7, e623. [Google Scholar] [CrossRef] [Scilit] [PubMed]
- Borg, C.K.; Muckley, E.S.; Nyby, C.; Saal, J.E.; Ward, L.; Mehta, A.; Meredig, B. Quantifying the performance of machine learning models in materials discovery. Digit. Discov. 2023, 2, 327–338. [Google Scholar] [CrossRef] [Scilit]
- GB 5749-2022; Standards for Drinking Water Quality. Standardization Administration of China (SAC): Bejing, China, 2022.
- Moussouni, A.; Zeghmar, A.; Benchaiba, L.; Maaliou, A.; Spalevic, V.; Jaufer, L.; Ksibi, M.; Helfer, F.; Kader, S. Ensemble learning-driven optimization of coagulant dosing for drinking water treatment plants using a scalable framework for smart and sustainable process control. Environ. Res. 2025, 288, 123229. [Google Scholar] [CrossRef] [Scilit] [PubMed]
- Tochio, E.L.L.; Do Nascimento, B.C.; Lautenschlager, S.R. Coagulant dosage prediction in the water treatment process. Water Supply 2023, 23, 3515–3531. [Google Scholar] [CrossRef] [Scilit]
- Lin, S.; Kim, J.; Hua, C.; Kang, S.; Park, M.-H. Comparing artificial and deep neural network models for prediction of coagulant amount and settled water turbidity: Lessons learned from big data in water treatment operations. J. Water Process Eng. 2023, 54, 103949. [Google Scholar] [CrossRef] [Scilit]
- Bressane, A.; Goulart, A.P.G.; Melo, C.P.; Gomes, I.G.; Loureiro, A.I.S.; Negri, R.G.; Moruzzi, R.; Reis, A.G.d.; Formiga, J.K.S.; da Silva, G.H.R. A non-hybrid data-driven fuzzy inference system for coagulant dosage in drinking water treatment plant: Machine-learning for accurate real-time prediction. Water 2023, 15, 1126. [Google Scholar] [CrossRef] [Scilit]
- Aliashrafi, A.; Zhang, Y.; Groenewegen, H.; Peleato, N.M. A review of data-driven modelling in drinking water treatment. Rev. Environ. Sci. Bio/Technol. 2021, 20, 985–1009. [Google Scholar] [CrossRef] [Scilit]
- Liu, H.; Chen, Y.; Pan, X.; Zhang, J.; Huang, J.; Lichtfouse, E.; Zhou, G.; Ge, H. Image recognition enhances efficient monitoring of the coagulation-settling in drinking water treatment plants. J. Clean. Prod. 2024, 482, 144251. [Google Scholar] [CrossRef] [Scilit]
- Wang, D.; Chen, L.; Li, T.; Chang, X.; Ma, K.; You, W.; Tan, C. Successful prediction for coagulant dosage and effluent turbidity of a coagulation process in a drinking water treatment plant based on the Elman neural network and random forest models. Environ. Sci. Water Res. Technol. 2023, 9, 2263–2274. [Google Scholar] [CrossRef] [Scilit]
- Kim, C.M.; Parnichkun, M. Prediction of settled water turbidity and optimal coagulant dosage in drinking water treatment plant using a hybrid model of k-means clustering and adaptive neuro-fuzzy inference system. Appl. Water Sci. 2017, 7, 3885–3902. [Google Scholar] [CrossRef] [Scilit]
- Wang, D.; Wang, C.; Liu, J.; Yuan, Y. Hybrid data and knowledge driven approach for determining coagulant dosing in drinking water treatment plants. Environ. Sci. Water Res. Technol. 2025, 11, 1770–1786. [Google Scholar] [CrossRef] [Scilit]
- Feng, L.; Zhang, Y.; Wei, X.; Wang, M.; Niu, Z.; Wang, C. Interpretable prediction of coagulant dosage in drinking water treatment plant based on automated machine learning and SHAP method. J. Water Process Eng. 2025, 75, 107925. [Google Scholar] [CrossRef] [Scilit]
- Li, B.; Liu, L.; Ma, R.; Guo, L.; Jiang, J.; Li, K.; Li, X. Siamese based few-shot learning lightweight transformer model for coagulant and disinfectant dosage simultaneous regulation. Chem. Eng. J. 2024, 499, 156025. [Google Scholar] [CrossRef] [Scilit]
- Wang, P.; Zheng, X.; Xu, S.; Jiang, C.; Huang, X.; An, G.; Lin, J.; Xie, Y.; Shi, B.; Zhuang, X. Interpretable machine learning for coagulant dosage optimization in drinking water treatment plants: A comparative study of distinct process configurations. Sep. Purif. Technol. 2026, 397, 138052. [Google Scholar] [CrossRef] [Scilit]

Disclaimer/Publisher’s Note: The statements, opinions and data contained in all publications are solely those of the individual author(s) and contributor(s) and not of MDPI and/or the editor(s). MDPI and/or the editor(s) disclaim responsibility for any injury to people or property resulting from any ideas, methods, instructions or products referred to in the content. |
© 2026 by the authors. Licensee MDPI, Basel, Switzerland. This article is an open access article distributed under the terms and conditions of the Creative Commons Attribution (CC BY) license.