Article

Investigation on Creep Behavior of Aggregates of Loess by a Discrete Element Method

1
School of Geological Engineering and Geomatics, Chang’an University, Xi’an 710054, China
2
Open Research Laboratory of Geotechnical Engineering, Ministry of Land and Resources, Xi’an 710054, China
3
Tongchuan Natural Resources Bureau, Tongchuan 727031, China
4
Xi’an Building Materials Geological Engineering Survey Institute Co. Ltd., Xi’an 710003, China
*
Author to whom correspondence should be addressed.
Processes 2022, 10(4), 795; https://doi.org/10.3390/pr10040795
Submission received: 8 December 2021 / Revised: 13 January 2022 / Accepted: 28 January 2022 / Published: 18 April 2022
(This article belongs to the Special Issue DEM Simulations and Modelling of Granular Materials)

Abstract

:
In loess the aggregate is the basic structural unit, and its stability is an important factor affecting the composition, water stability and strength of loess. However, due to the difficulty of sample preparation, few scholars have done independent research on it. In this manuscript, a numerical model of aggregate is constructed by the discrete element method. Under the continuous action of certain stress, the uninterrupted development process of sample deformation with time was observed, that is, the creep of aggregate structures. The results show that the creep of aggregates is closely related to the relative movement, rotation and rearrangement of internal structural elements, and the most intuitive mesoscopic evolution of the adjustment process of structural elements is the change of contact number, namely the coordination number. The microscopic parameters and evolutionary characteristics of fabric can reveal the microscopic mechanism behind the macroscopic creep phenomenon. With the creep process, the creep stress is gradually borne by the normal contact force rather than the tangential contact force and has anisotropic characteristics. As a result of creep, the contact points of particles increase, and the interaction between aggregates changes from point contact to overlap contact. The constraint between aggregates increases, and the skeleton tends to be a more stable structure, which can bear a larger load.

1. Introduction

Loess is a yellow or yellowish brown earthy sediment accumulated in the Quaternary, mainly composed of silt particles, rich in carbonate and with macropores, which is widely distributed all over the world [1,2,3]. Loess is a kind of soil with sturdy structure. Owing to its special formation environment, it often displays structural characteristics of undercompaction, multiporosity and weak cementation [4,5]. This unique structure makes it have special engineering properties. The existing research results also show that the engineering properties of loess are controlled by its microstructure and composition characteristics [6,7,8,9,10], such as particle gradation, pore distribution, agglomeration structure, etc.
Aggregate is an independent structural unit in cohesive soil, which is composed of clay particles and debris particles, colloidal particles and clay particles, also known as agglomerations. There are a large number of aggregates in loess, which constitute not only an important part of the loess skeleton structure, but also represent the main component of the loess structure [11] (Figure 1). The size of aggregate structures varies greatly, being mainly divided into multi-level composites such as single particles, sticky groups, micro aggregates and large aggregates. The different arrangement and combination of aggregate structures with different sizes play different roles in soil structure. Micro aggregates and clay clusters can further form large aggregates under certain conditions. Aggregate structures usually have good self-stability and can resist certain external forces. Of course, large aggregates may also be decomposed into small aggregates under the action of a large enough external force. On the one hand, aggregates affect the particle size distribution of loess, on the other hand, they also affect the pore distribution of loess. More importantly, they directly or indirectly affect the engineering geological characteristics of loess [12].
At present, the research on loess strength is more extensive, but research on the creep characteristics of loess is relatively rare. Creep behavior is a process that varies with time. In general, when subjected to a constant load, creep will cause the stress-strain characteristics of soil to change with time [13]. Li et al. [14] studied the creep characteristics of soft soil under different drainage conditions and found that the strain time and strain deviation stress of soil samples were significantly affected by changes in drainage conditions. Xie et al. [15] studied the microstructure of loess-like in the Xi’an area of China by triaxial creep tests, and showed that the size and number of pores of loess-like materials changed before and after creep. Tang et al. [16] proposed a two-element creep model to describe the creep process of loess through rheological triaxial creep tests. Xin et al. [17] carried out kinematic analysis of large landslides in Baoji, China, and believed that the occurrence of landslides was closely related to the creep of the slip zone. Xie et al. [18] designed creep tests under different moisture content to overcome the shortcomings of traditional isochronic stress-strain curve method and steady creep rate tangent method. However, it is still a challenge to study the creep of loess from the microstructure, which is largely unknown.
Aggregates have been extensively applied in the field of soil science [19,20,21,22,23,24,25,26], but few scholars have studied them in the field of engineering geology and soil mechanics. At present, there are usually two methods to study aggregates. One is morphological methods [27,28,29,30], such as scanning electron microscopy (SEM) and computed tomography (CT). In the study of soil mechanics, large-scale testing using such methods is expensive, and it is difficult or even impossible to reflect the change and the failure process of soil samples at the mesoscale. It is even more difficult to extract the mechanical behaviors of agglomerated structures in the test process, such as shear stress and cementing force. The other method is aggregate particle size analysis [26,31,32,33]. The difference between the latter and the conventional soil particle analysis method only lies in the different sample processing methods (for example, dry screening method, wet screening method), this kind of method in sample preparation will basically destroy the original sample, and add some chemical reagents for research, the test results are likely to cause deviations from the actual values. The reason is that the aggregates in soil are greatly affected by pressure, water content and other factors, so it is difficult to prepare samples separately. In recent years, the discrete element method (DEM) has shown application prospects in various fields due to its low cost and controllability [34,35,36,37]. The advantages of the discrete element method (DEM) are the convenience of sampling, the ability to monitor the evolution of stress within samples in a non-destructive manner, and the ability to provide detailed internal information, which cannot be compared with other traditional methods.
In this manuscript, Malan loess from Yan’an is regarded as the object of study. The discrete element method is applied to study the consolidation creep evolution model and its mesoscopic mechanism of loess samples under different working conditions. The results of this study can serve as a better method for studying the distribution and variation of internal stress of creep failure of loess aggregates. At the same time, it has important theoretical and practical significance for perfecting and developing creep theory, preventing and reducing landslide and other disasters, guiding engineering construction in loess region and ensuring the long-term safety and stability of engineering foundations.

2. Experimental Study

2.1. Sample Preparation

The loess samples used in this test were taken from typical aeolian Q3 Malan loess (Figure 2d) exposed in the excavation project of “Cutting Hills and Filling Land” in Yan’an New Area, Shaanxi Province (Figure 2a). The undisturbed loess samples with a depth of 6 m were dug and extracted manually, and any disturbance of the loess samples was avoided as far as possible. Before the test, some loess samples were crushed and dried in an oven at 105 °C. After that, the dried loess samples were passed through a 2 mm standard test screen, and the particle size distribution curve and particle size grading accumulation curve of the screened loess samples were measured by a Bettersize2000 laser particle size analyzer (Figure 2c). Basic physical properties of loess samples were tested in accordance with “Standard for geotechnical testing method” [38], as shown in Table 1. The optimal water content Wop and maximum dry density ρdmax of loess samples were 17.2% and 1.83 g·cm−3 respectively.
As the main component of loess particles, powder particles can be found in SEM in different shapes and sizes, but generally divided into the following four types (Figure 3a): angular particles, sub-angular particles, sub-circular particles and circular particles. Colloidal particles are composed of clay minerals, carbonate, colloidal microcrystals or debris of finer particles (Figure 3b,c). In loess, there are three main effects [12]: ① They are wrapped on the surface of debris particles in the form of “nucleation”: under the effect of “filling and rounding” and “thickening and enlarging”, they aggregate as nucleation on the surface of powder particles to form small single aggregate structure. Viscous particle aggregates mainly include two types: hollow concentric circle viscous particle aggregates and solid concentric circle viscous particle aggregates (Figure 3d). ② It acts as a matrix, filling between particles or between particles and aggregates, and acts as a bond (Figure 3d–f). The single aggregates of the upper level are aggregated to form larger aggregates, which mainly include aggregates composed of multiple coarse particles and aggregates formed by multiple fine particles. The aggregates formed by fine particles can be divided into concentric circles fine particles solid aggregates and concentric circles fine particles hollow aggregates (Figure 3e). ③ Pores are formed between particles and nucleocapsid or between matrix and aggregate (Figure 3d–f). They mainly exist in aggregates with higher aggregation level, which is mostly concentric circle aggregates (Figure 3f). One is concentric circle single-grain aggregates with thickening outer kernels, and the other is concentric circle multi-grain aggregates with continuous aggregation of multiple particles. As a result, the agglomeration structure is almost spherical or ellipsoid in three dimensional space.
As seen from Figure 3, in the loess in silt, clay and the presence of colloidal particles is a prerequisite to aggregate formation, silt, clay and colloidal particles by cement bonds forming sticky groups or aggregate particles. These aggregates are the most basic unit, which by mutual aggregation gather to further reunite into other units, and even the powder together constitute a micro aggregate together, and so on. The formation process of aggregates is a form of loess structural stability process. If the structure of aggregates is unstable, new aggregates will continue to form under the action of water immersion or external forces.

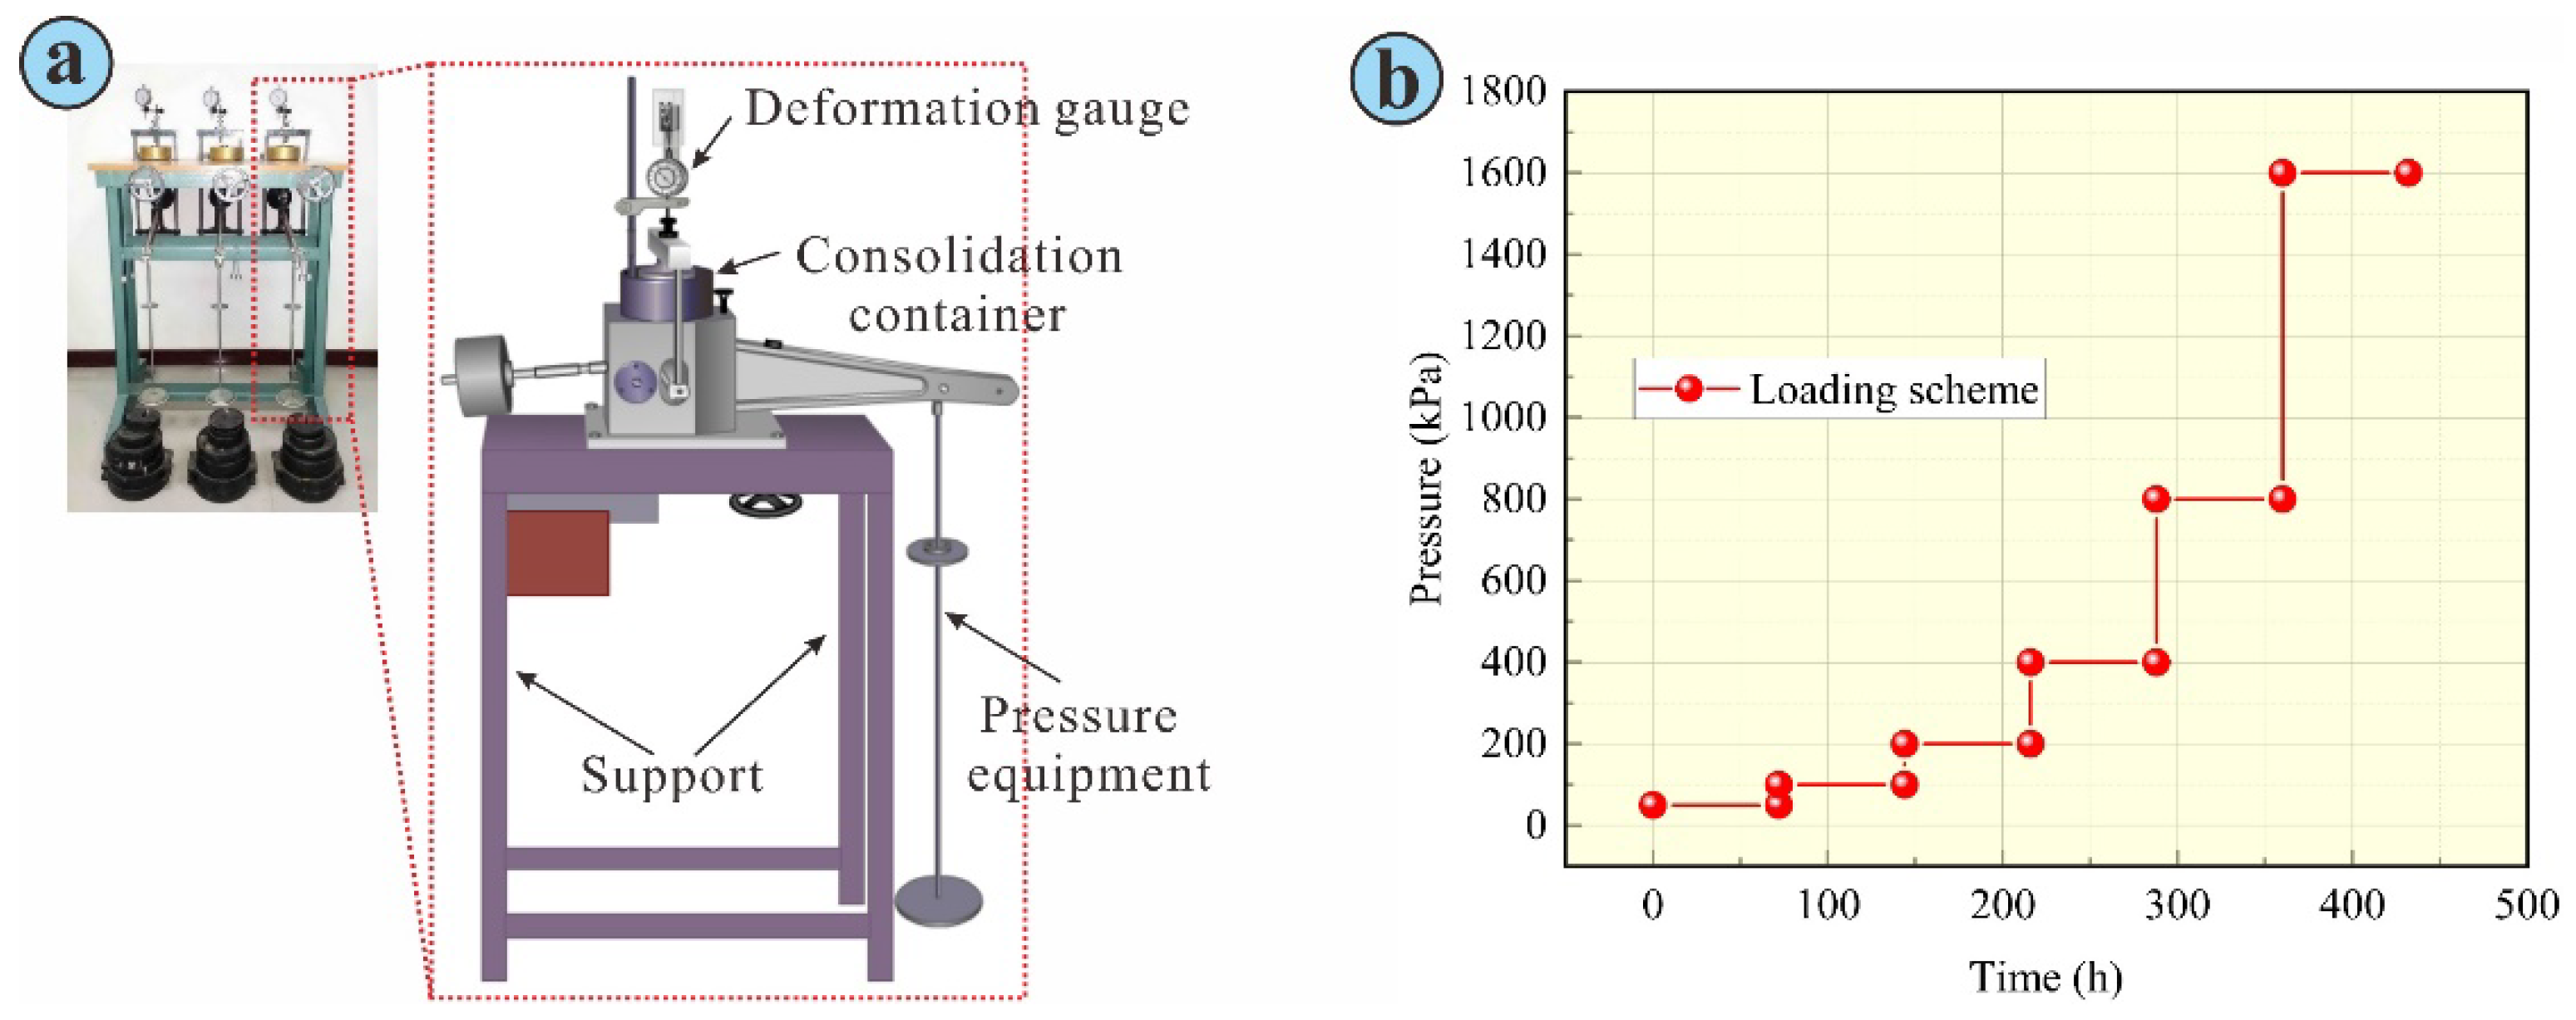
2.2. Consolidation Creep Test

The undisturbed soil sample was placed into the ring knife, and the cross-sectional area of the prepared sample was 30 cm2 and the height was 2 cm. The instrument used in the test was WG-1C triple consolidation instrument (Figure 4a). After the sample is installed, in order to ensure good contact between the sample and the upper and lower parts of the instrument, a prepressure is first applied under 1 kPa pressure. In order to avoid the evaporation of water during the test, wet cotton is used to surround the pressurized cover plate, and water is added regularly to assure the accuracy of the test results. The test adopted a graded loading mode: 50 kPa→100 kPa→200 kPa→400 kPa→800 kPa→1600 kPa. The loading duration of each stage was 72 h. The loading scheme curve is illustrated in Figure 4b.

2.3. Experimental Result

The e-lgt curve of Malan loess is drawn according to the test results, which show that all samples dipslay the phenomenon of secondary consolidation, as seen in Figure 5, as shown in the loess by the inverse S” shape of the e-lgt curve showed and with the change of the overlying load, its degree of performance has a certain difference showing that the consolidation pressure has a certain influence on the second consolidation effect, This is similar to the conclusion of Tang et al. [16]. At the same time, the slope of e-lgt curve decreases gradually with the increase of time at all levels of pressure, indicating that the secondary consolidation effect of Malan loess is time-dependent. In general, Malan loess has a relatively obvious secondary consolidation phenomenon, and the secondary consolidation effect changes with the change of the overburden load. Meanwhile, with the increase of time, the e-lgt curve tends to be infinitely tangential to a certain line parallel to the time axis.

3. DEM Simulation

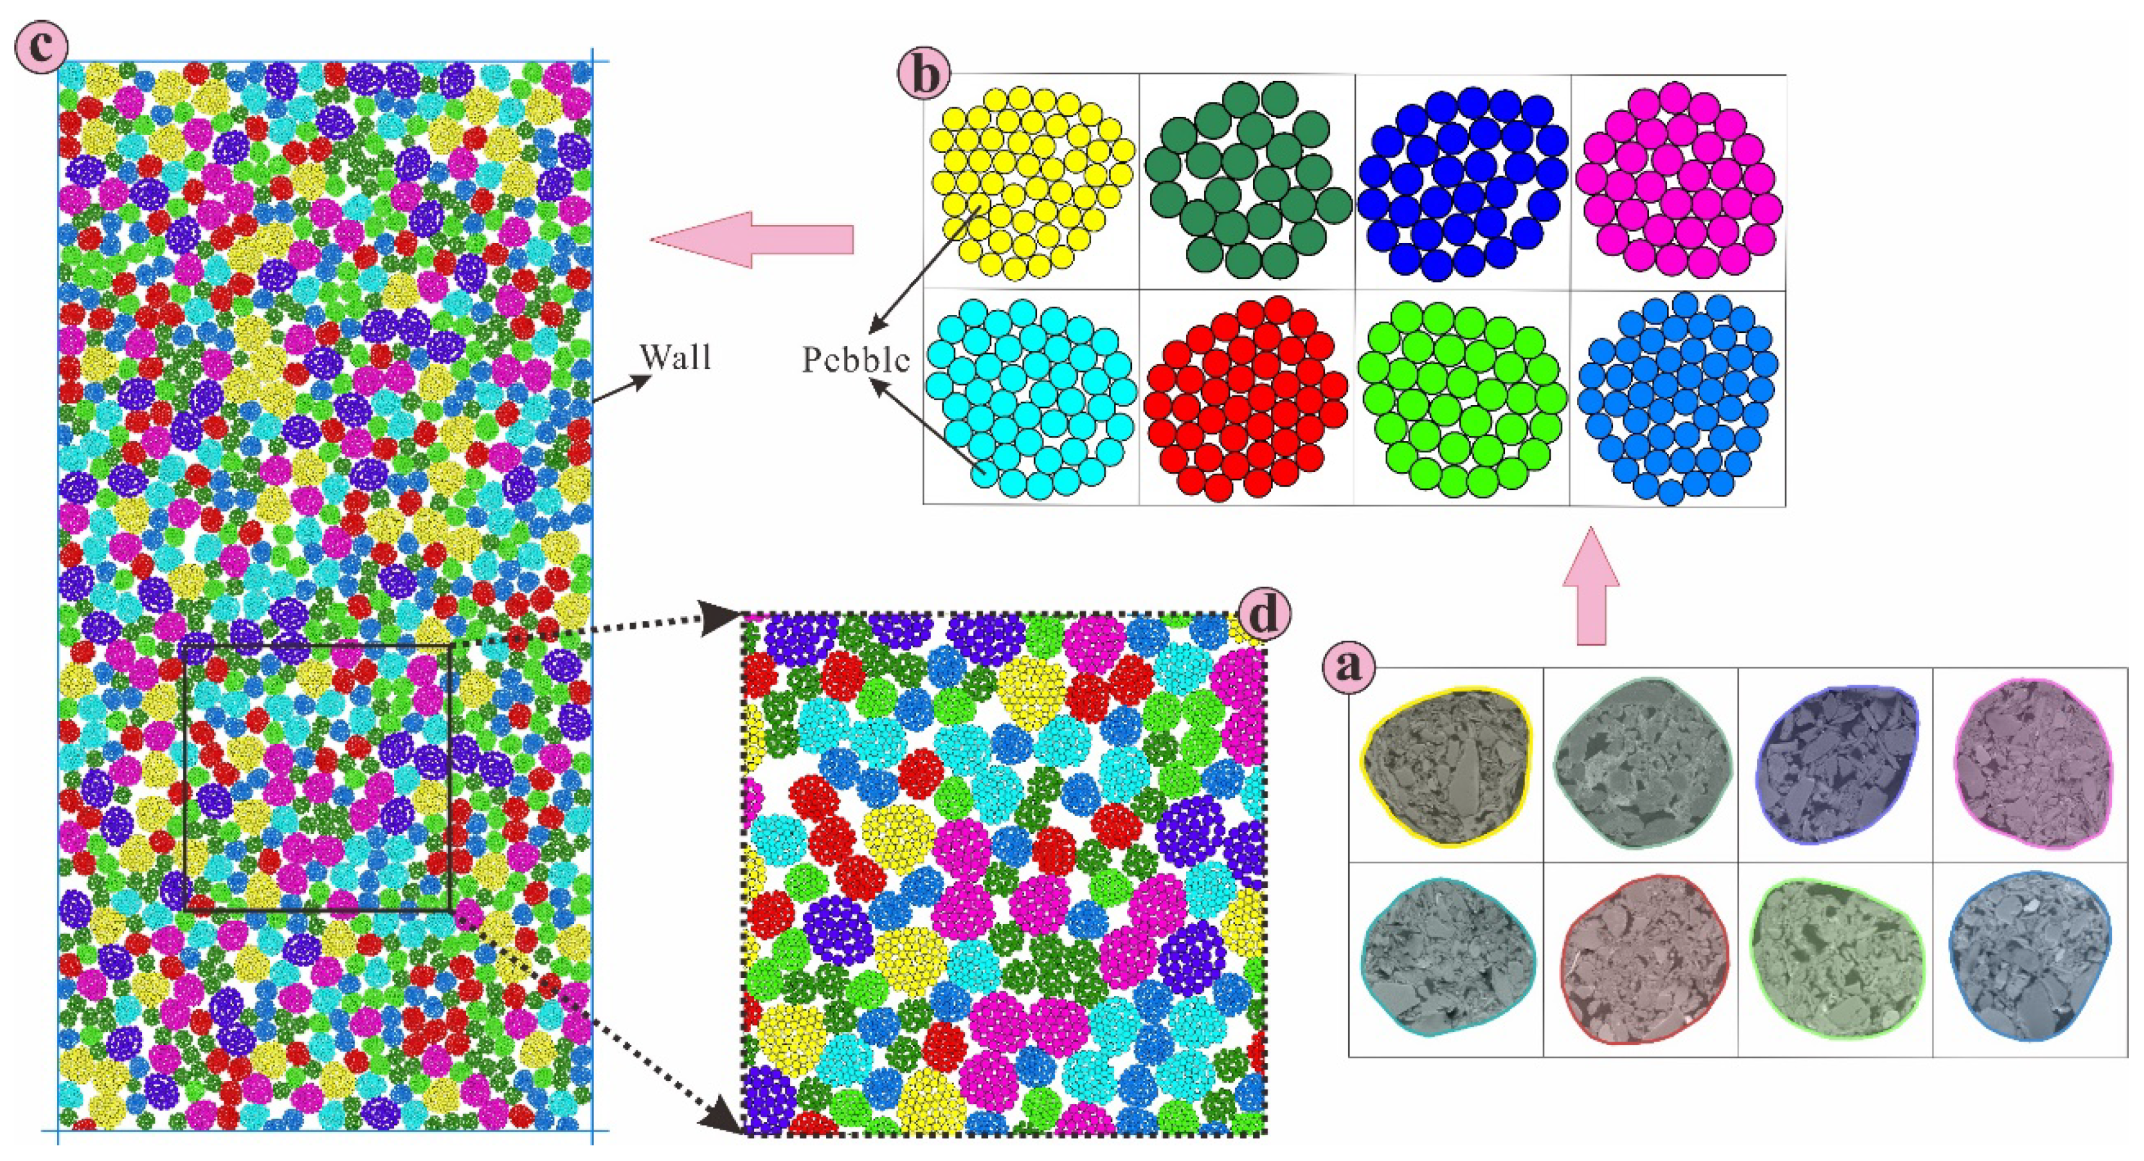
3.1. DEM Model Setup

In this investigation, the famed program PFC2D5.0 [40] is used for the simulation of loess aggregates. Its basic principle is derived from molecular dynamics, which is a numerical simulation technology based on discrete element method to study the movement and interaction of granular media from the perspective of microstructure. PFC models consists of ball, ball, wall entity and contact model. During the whole analysis process, Newton’s second law of motion and the force-displacement rule of contact points are used to calculate alternately, and the whole particle set is iterated and traversed step by step, until the whole physical system reaches the static equilibrium state or the specified calculation time step/state criterion, the cyclic calculation will be terminated. Newton’s second law of motion is used to determine the motion of each particle due to contact and the volumetric forces acting on it, while the force-displacement law is utilized to update the contact forces generated by the relative motion of each contact point. In PFC2D, the wall is the unit used to generate the boundary conditions of the model. The boundary conditions of the displacement and force of the particle aggregate can only be achieved indirectly by applying velocity instead of applying force directly on the wall. The wall’s motion is predetermined, so it doesn’t need to satisfy Newton’s second law of motion, just calculate the contact force based on the force-displacement rule and update its position at each step according to a given speed. This part is not the focus of this paper and will not be described in detail. For more information, please refer to relevant literature [40].
A flexible solid cluster was used to simulate the aggregates, and the specific model was built as follows (Figure 6): Firstly, according to the morphological method, the shape of the aggregate structure was statistically selected from the binarized SEM images of loess (Figure 6a). As mentioned above, the shape of the aggregates was mostly nearly round or oval in two-dimensional space. Then, pebbles are filled in the aggregate graph (Figure 6b), and the pebbles in the aggregate are balanced and randomly distributed in the pre-set wall as a template (Figure 6a), so that the model is built. Pebbles are the main particles that makes up the aggregate. However, the cementing particles in the aggregate are not reflected in the model. Instead, the bonds between particles and particles are used as virtual cements (Figure 7).
In the model, the deformation process of aggregates is replaced by the degradation of intergranular bonds, that is, the failure of the cohesion of cement is represented by the degradation of bonds. In this model, parallel bond Model (PBM) was used only for both in-body contact and inter-body contact [40] (Figure 7a,b). The parallel bonding model is used to describe the constitutive characteristics of intergranular materials filled with sandwich materials or cemented materials in a finite region. It can be imagined as a group of springs with constant normal stiffness and tangential stiffness uniformly distributed in the contact plane. The relative motion of the particle contact position produces forces and torques in the bonded material, which acts on the two bonded particles and is related to the maximum normal and tangential forces at the boundary of the bonded material assembly. Thus, the decay mode of PBM is activated and controlled by stress. If PBM (assuming the i-th contact, denoted as Di) decays to zero, the normal force, shear force and bending moment of the contact will disappear and the parallel bond will break (Figure 7c). Accordingly, these values are set to zero during numeric implementation. This behavior is similar to the creep behavior of loess.

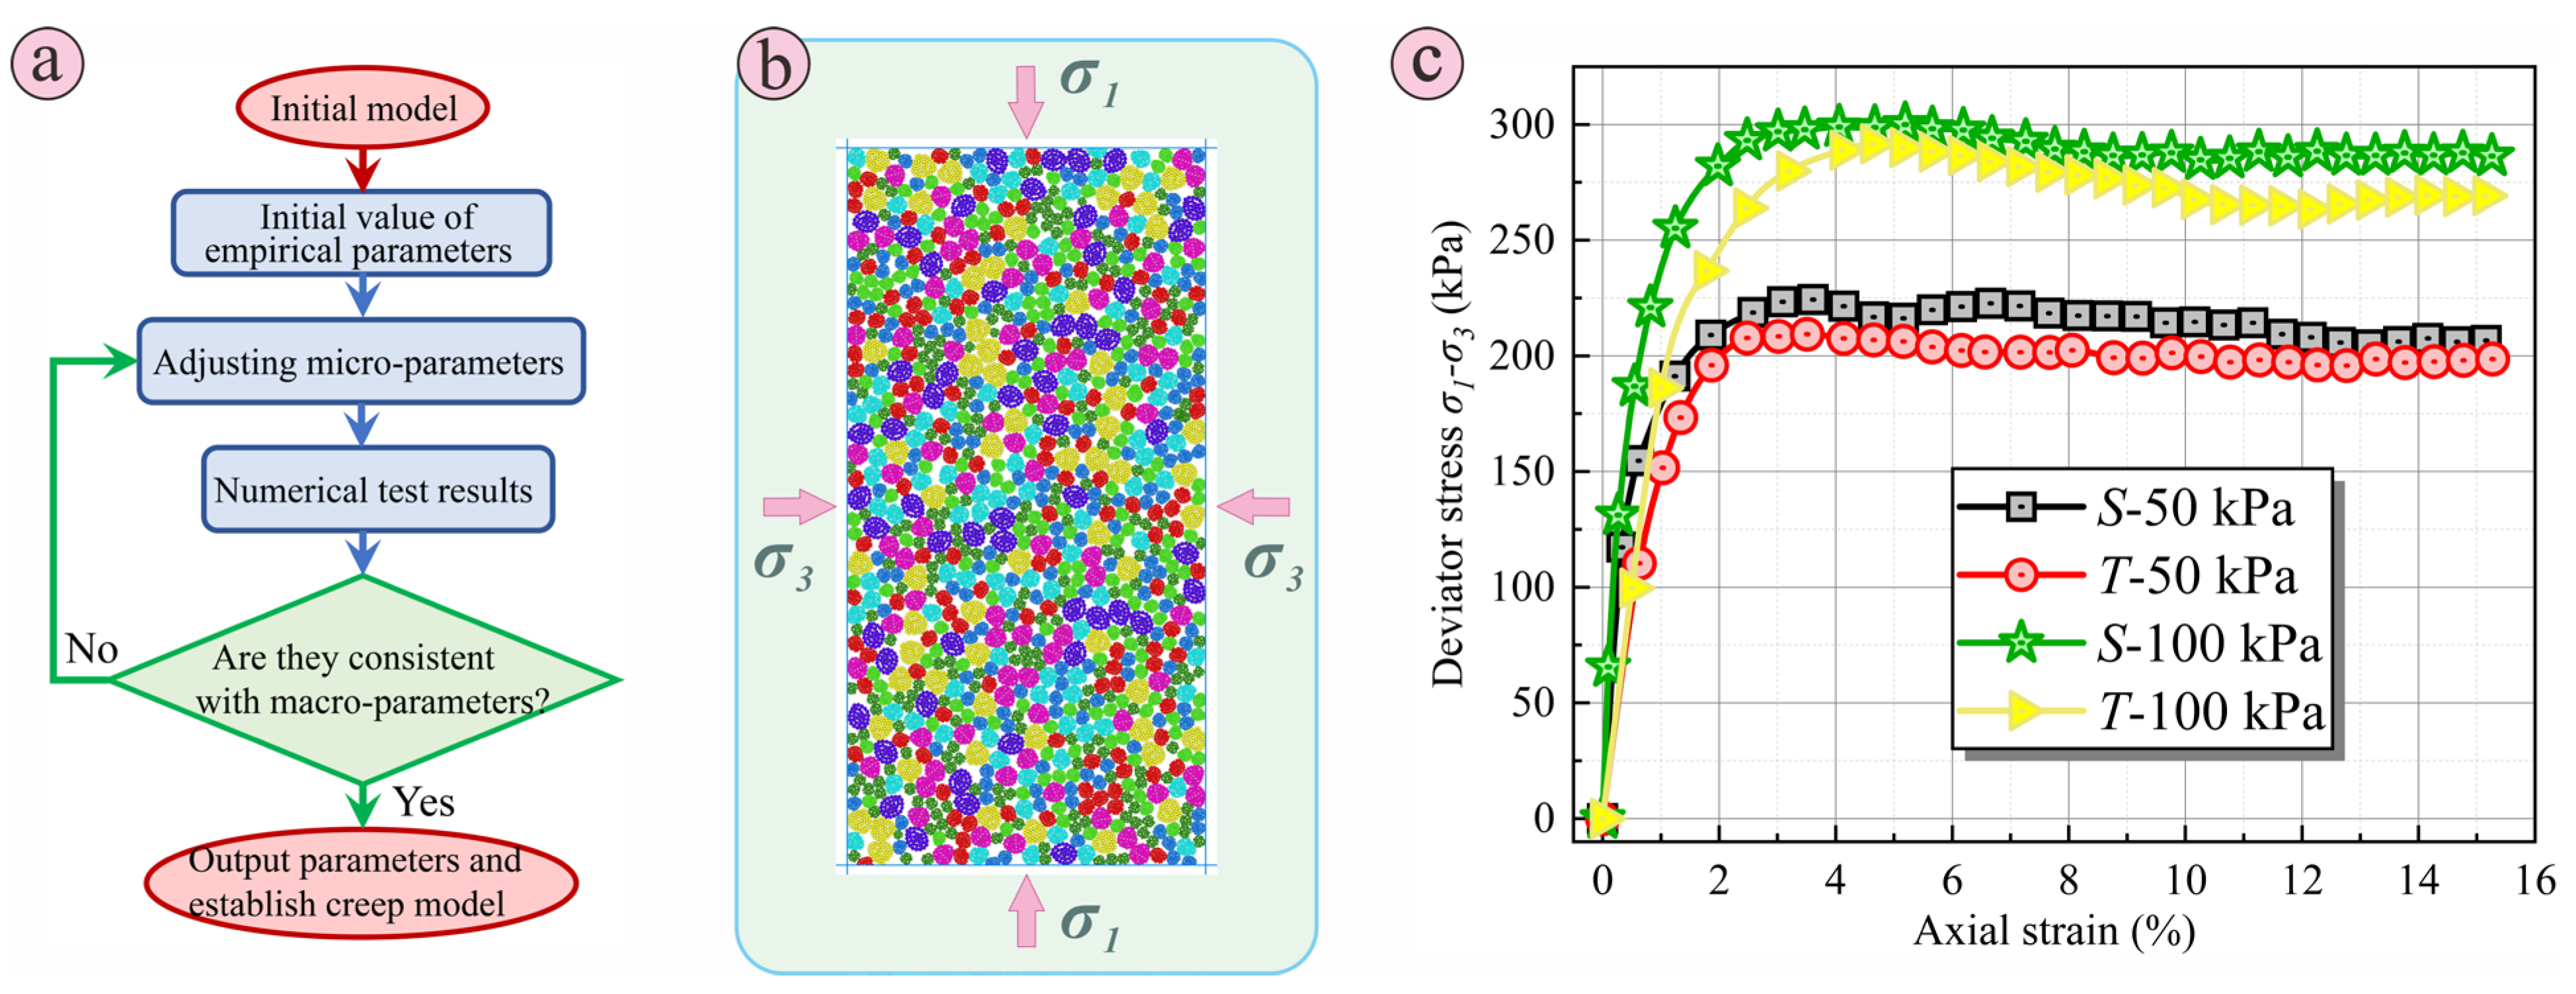
3.2. Calibration of PFC Parameters

The selection of reasonable parameters are the premise of effective numerical simulation experiment. Because of the complexity of the actual soil macroscopic structure, to establish a discrete element model that completely conforms to the features of soil particles is very difficult, because it is difficult to model the elements’ attributes and macro physical and mechanical properties of the material as there are a lot of difficult to control properties, the nonlinear relationship between the factors and demanding simulation approach completely indoor test results are not realistic. “trial and error” is now widely used in the microscopic parameter calibration method of discrete element simulation samples [41]. For the main calibration process (Figure 8a) firstly, the approximate range of mechanical properties of soil was determined based on experience and references, and the standard specimen for biaxial test was designed (Figure 8b). Then, the stress-strain curve obtained was compared and corrected with the results of laboratory test (Figure 8c). If the comparison results showed a large error, the parameters should be continuously adjusted. Finally, the error between the selected parameters and the macroscopic mechanical parameters should be within a reasonable range and be taken as the final result. Although there is a certain gap in the numerical value, the overall law characteristics of the curve are basically the same, which can achieve the expected goal. The parameters finally determined in this test are listed in Table 2, with internal friction angle of 21.6° and cohesion of 27.2 kPa. There may be many reasons for the difference in numerical values, which should be studied in the later stage.

3.3. Creep Numerical Simulation Scheme

In the biaxial creep numerical test, for the discrete element samples prepared, the servo switches on four walls are opened first, and the confining pressure σ3 is used for consolidation, and the confining pressure is kept constant throughout the test. Then, the axial stress is implemented in a constant speed of 4 × 10⁻⁵ m/s during the shear creep stage. When the specimen is loaded to a target value of deviatoric stress (σ1σ3) (σ1 is the larger principal stress on the specimen). The creep process begins at this constant value. Before the creep stage, the microcontact model of the aggregate element was converted to the PBM model by cmat command, and the contact was updated at each time step.
In this study, biaxial creep tests of different deviatoric stress levels (50 kPa, 100 kPa, 150 kPa, 200 kPa, 250 kPa, 300 kPa) were carried out under different confining pressures (150 kPa, 200 kPa, 250 kPa). Each level of vertical load lasted for 12,000 steps, the experiment was terminated after meeting the requirements of the last test step, and the macroscopic deformation results and microscopic mechanical parameters of numerical samples were recorded during the experiment.

4. Results and Discussion

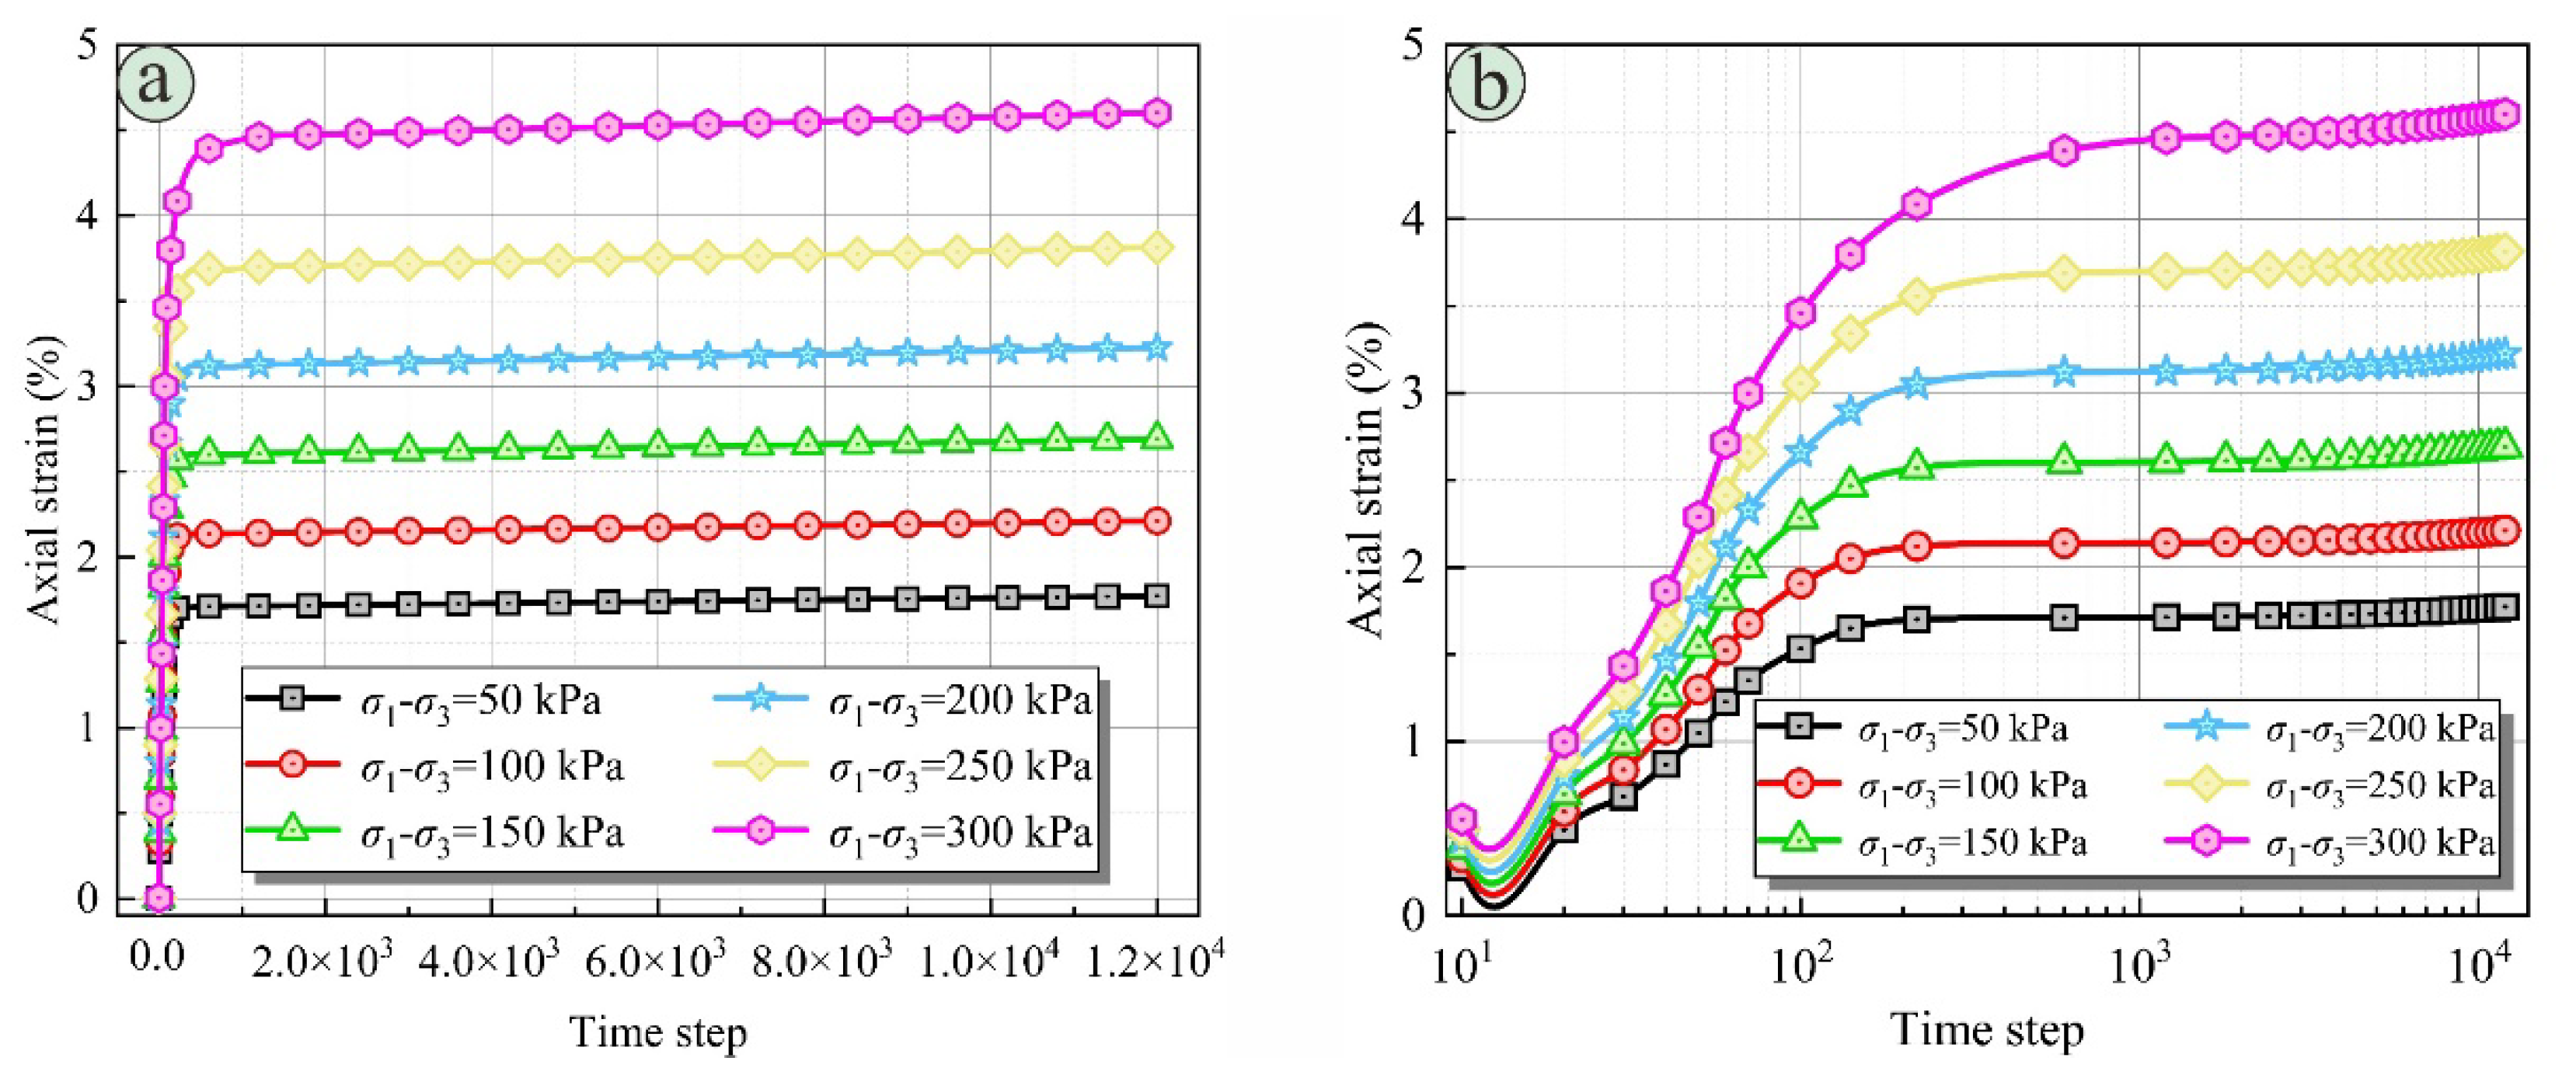
4.1. Analysis of Axial Strain-Time Step Curve

Taking 200 kPa confining pressure as an example, the test results were analyzed. As shown in Figure 9, the axial creep strain changes over time in the biaxial creep numerical test at different deviant stress levels under 200 kPa confining pressure. In Figure 9a, what is interesting is that the axial strain of all samples increases rapidly during the first 1000 time steps. After that, although the fluctuation of curves is not really obvious, and the creep curves all show obvious attenuation creep characteristics and eventually tend to be stable. The results indicate that the deviator stress level has a significant effect on the creep behavior of the sample, and the initial incremental rate and final value increase with the deviator stress level. Numerical samples under the condition of the low level of deviatoric stress deformation and creep time step needed to stabilize than high deviatoric stress level conditions needed shorter time step, analyze the causes, and the deviatoric stress level is low, caused by the shear stress inside the sample deviatoric stress below its initial structure strength, make the sample faster internal structure adjustment, so in a short period of time to achieve basic stable creep, The creep phenomenon is not obvious, but with the increase of deviant stress level, the internal structure adjustment of the sample becomes slow, the final creep value increases, and the creep phenomenon is obvious. The semilogarithmic curve of the axial creep strain as it grows with incremental steps is shown in Figure 9b. It can be seen from the figure that the logarithm of the axial creep strain of the sample under different deviational stress conditions increases nonlinearly. In the logarithmic progression of creep time step, the axial creep strain increases with the increase of deviatoric stress level.

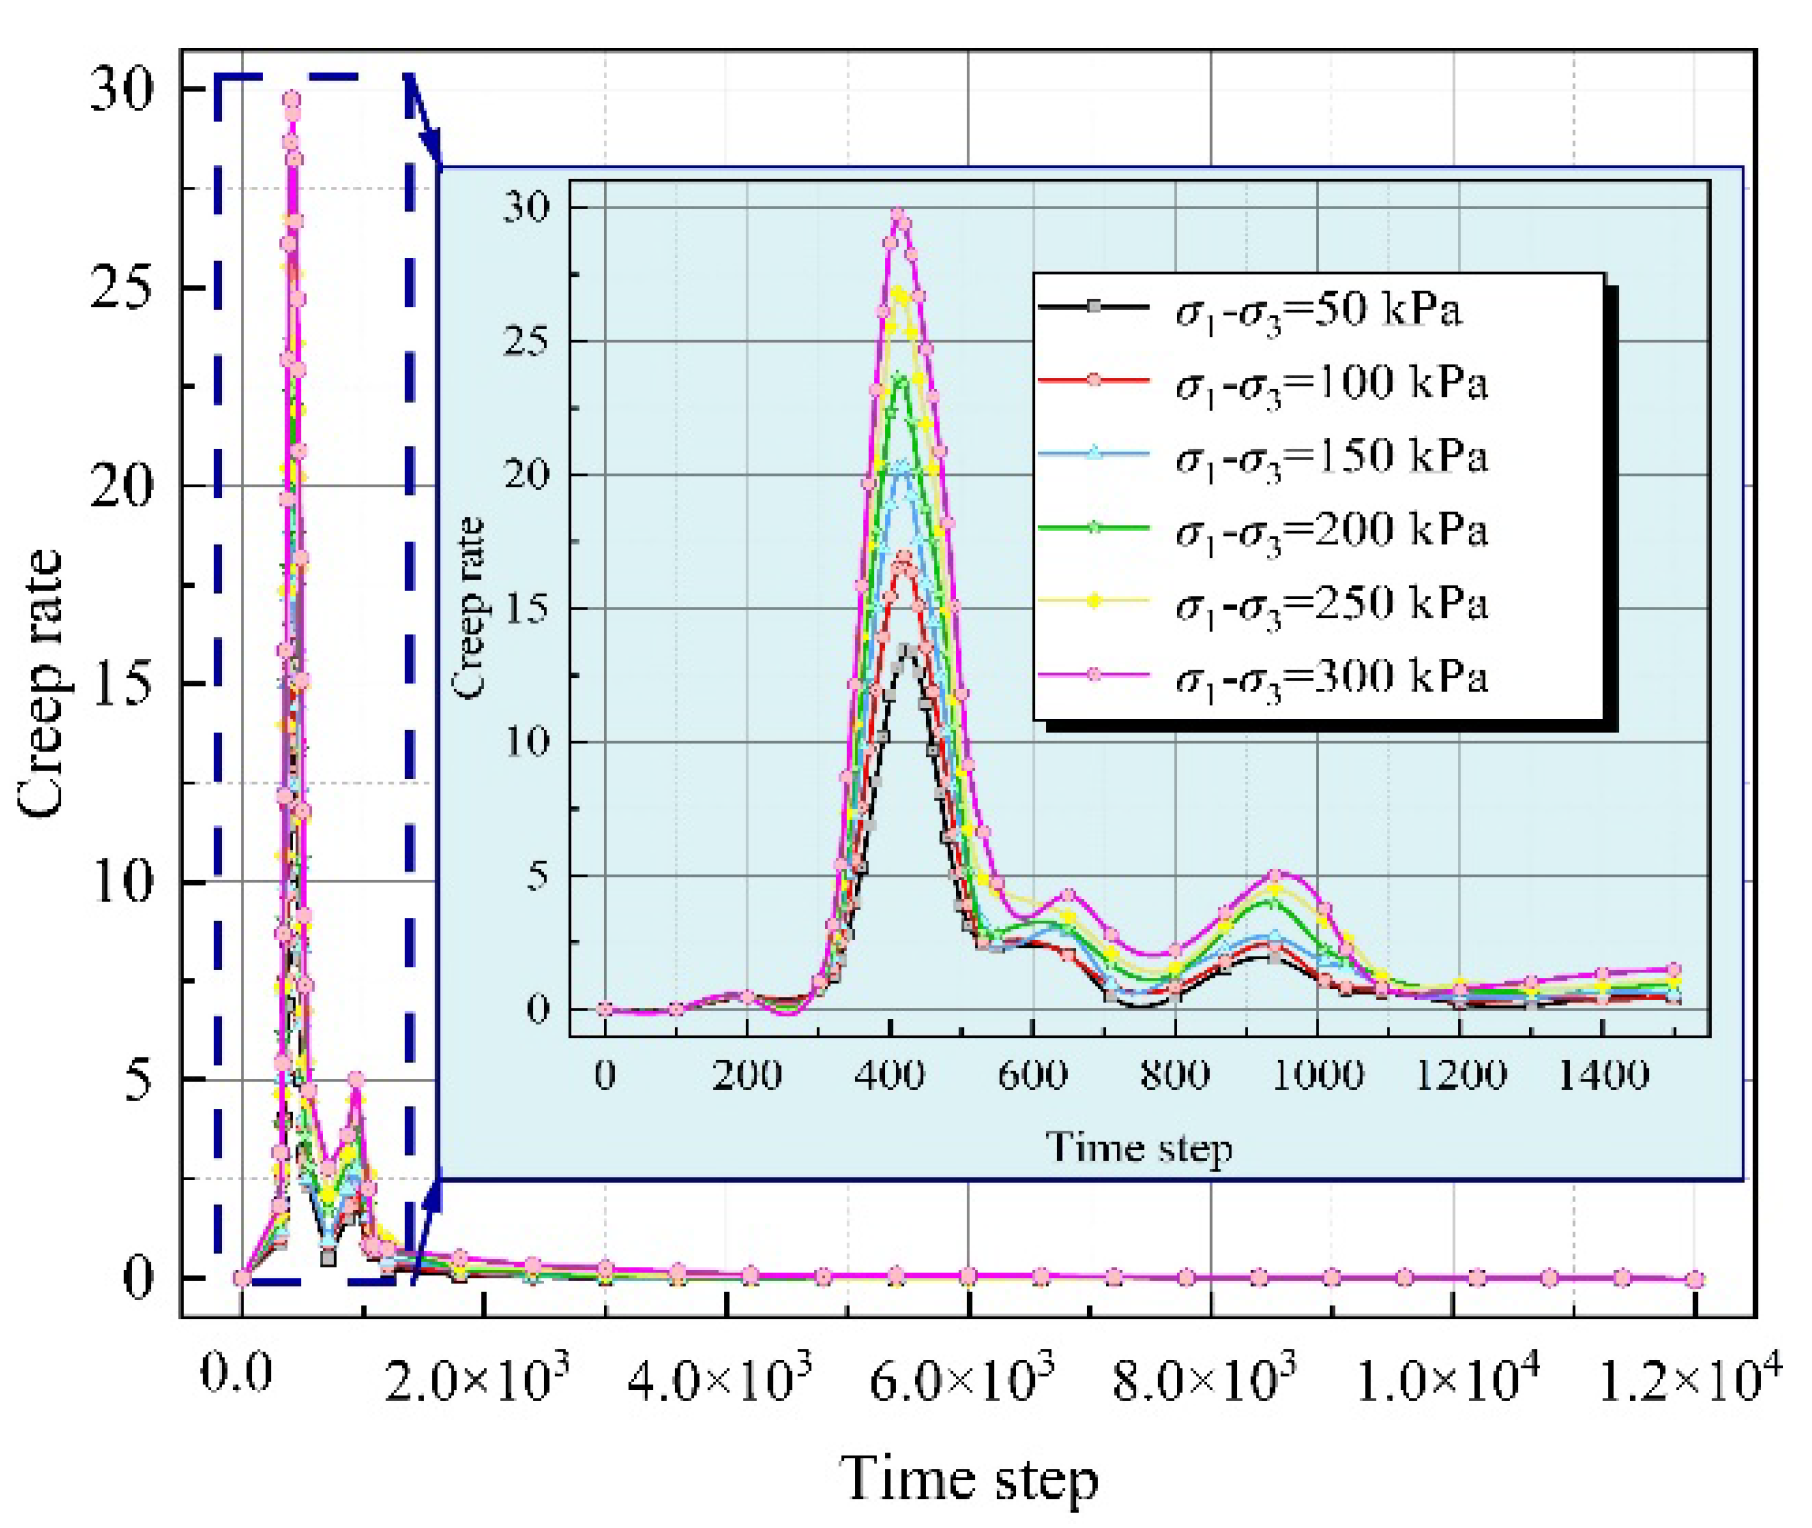
4.2. Variation of Creep Rate with Time Step

Figure 10 shows the whole process curve and local amplification curve of the creep rate developing at any time step under the confining pressure of 200 kPa. It can be observed that all the curves show a similar development trend, that is, they increase rapidly at first, then decrease rapidly after reaching the peak value, until they tend to zero. According to this rule, the creep process can be divided into three stages: initial fast creep, decelerated creep and stable creep. In the initial rapid creep stage, the deformation is contributed by the elastic deformation of the particle element and the plastic deformation caused by the adjustment of the position between the particle elements due to the increase of the load within a short period of time, which is macroscopically manifested as a larger creep rate. In the decelerated creep stage, the stress chain of the particle skeleton tends to be stable, the deformation of the particle element and the deformation caused by the adjustment of the position between the particle elements gradually decreases, and the creep rate decreases continuously from the macroscopic point of view. In the stable creep stage, the skeleton stress chain of particles is basically stable, and the creep characteristics are stable, and the creep rate tends to zero. At the same time, it can be seen from the results that the creep rate increases with the increase of the partial stress applied during the creep process, and the maximum peak creep rate is obtained at the level of 300 kPa deviatoric stress.

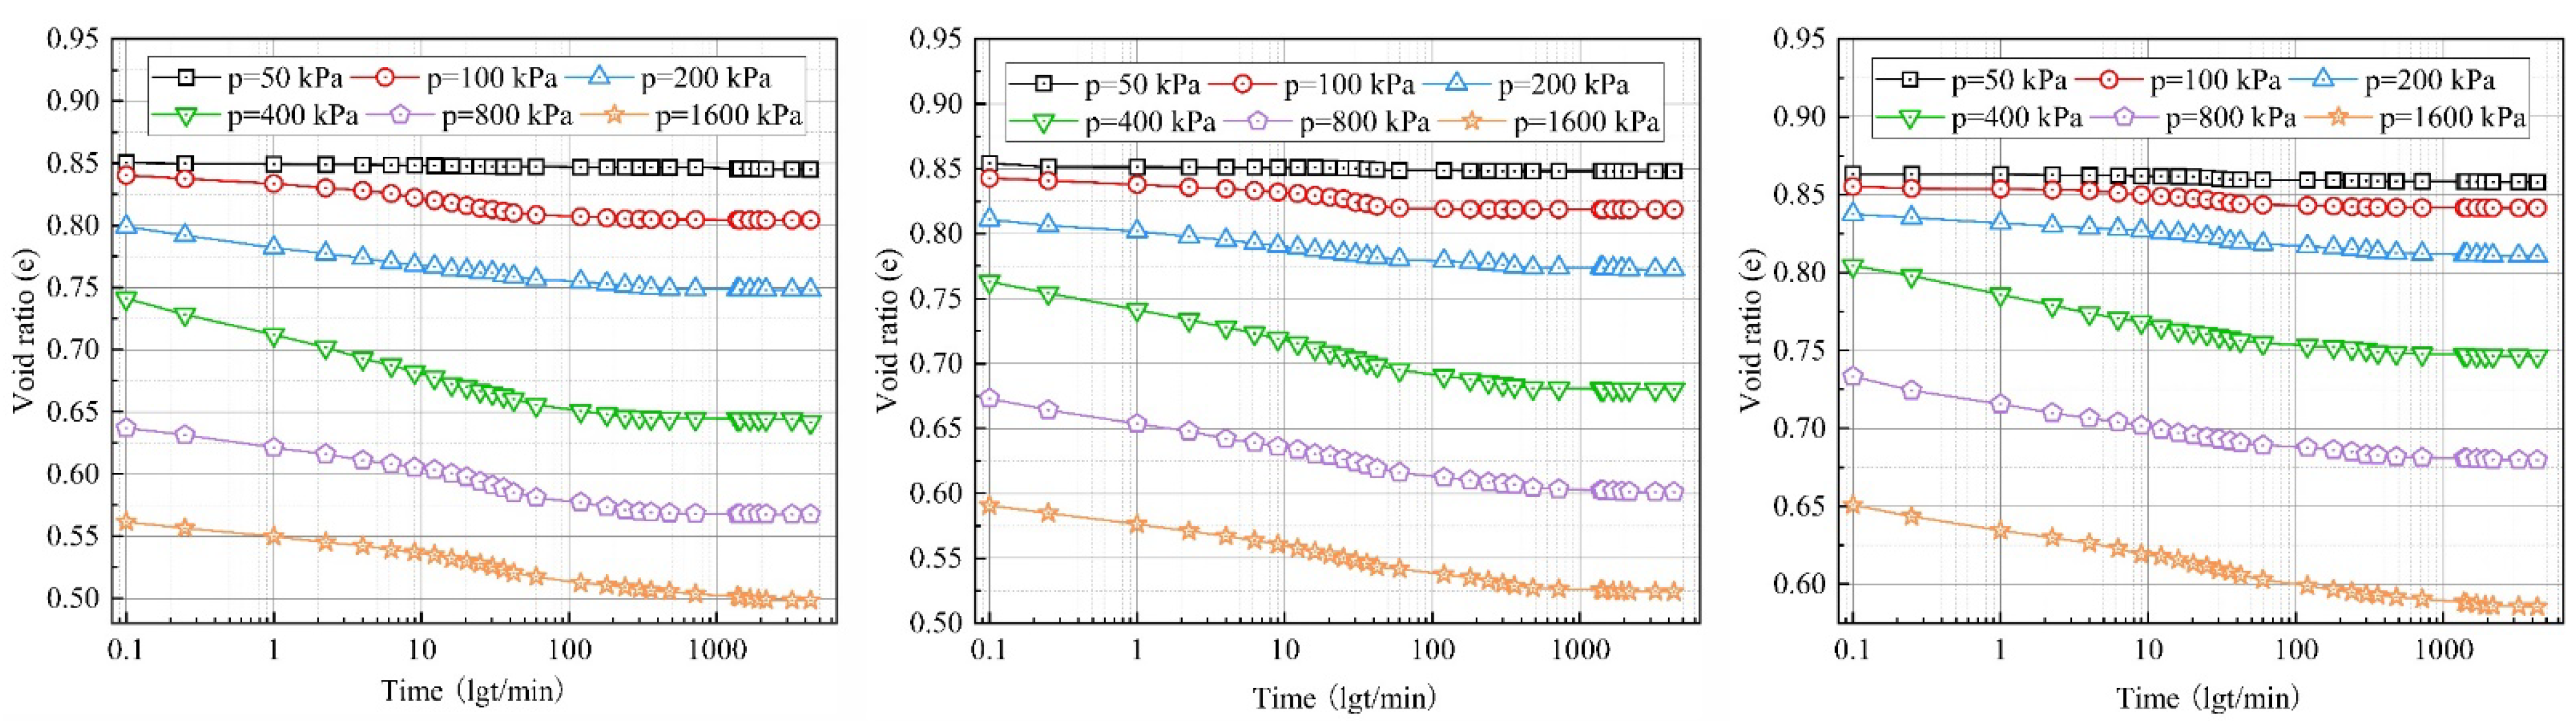
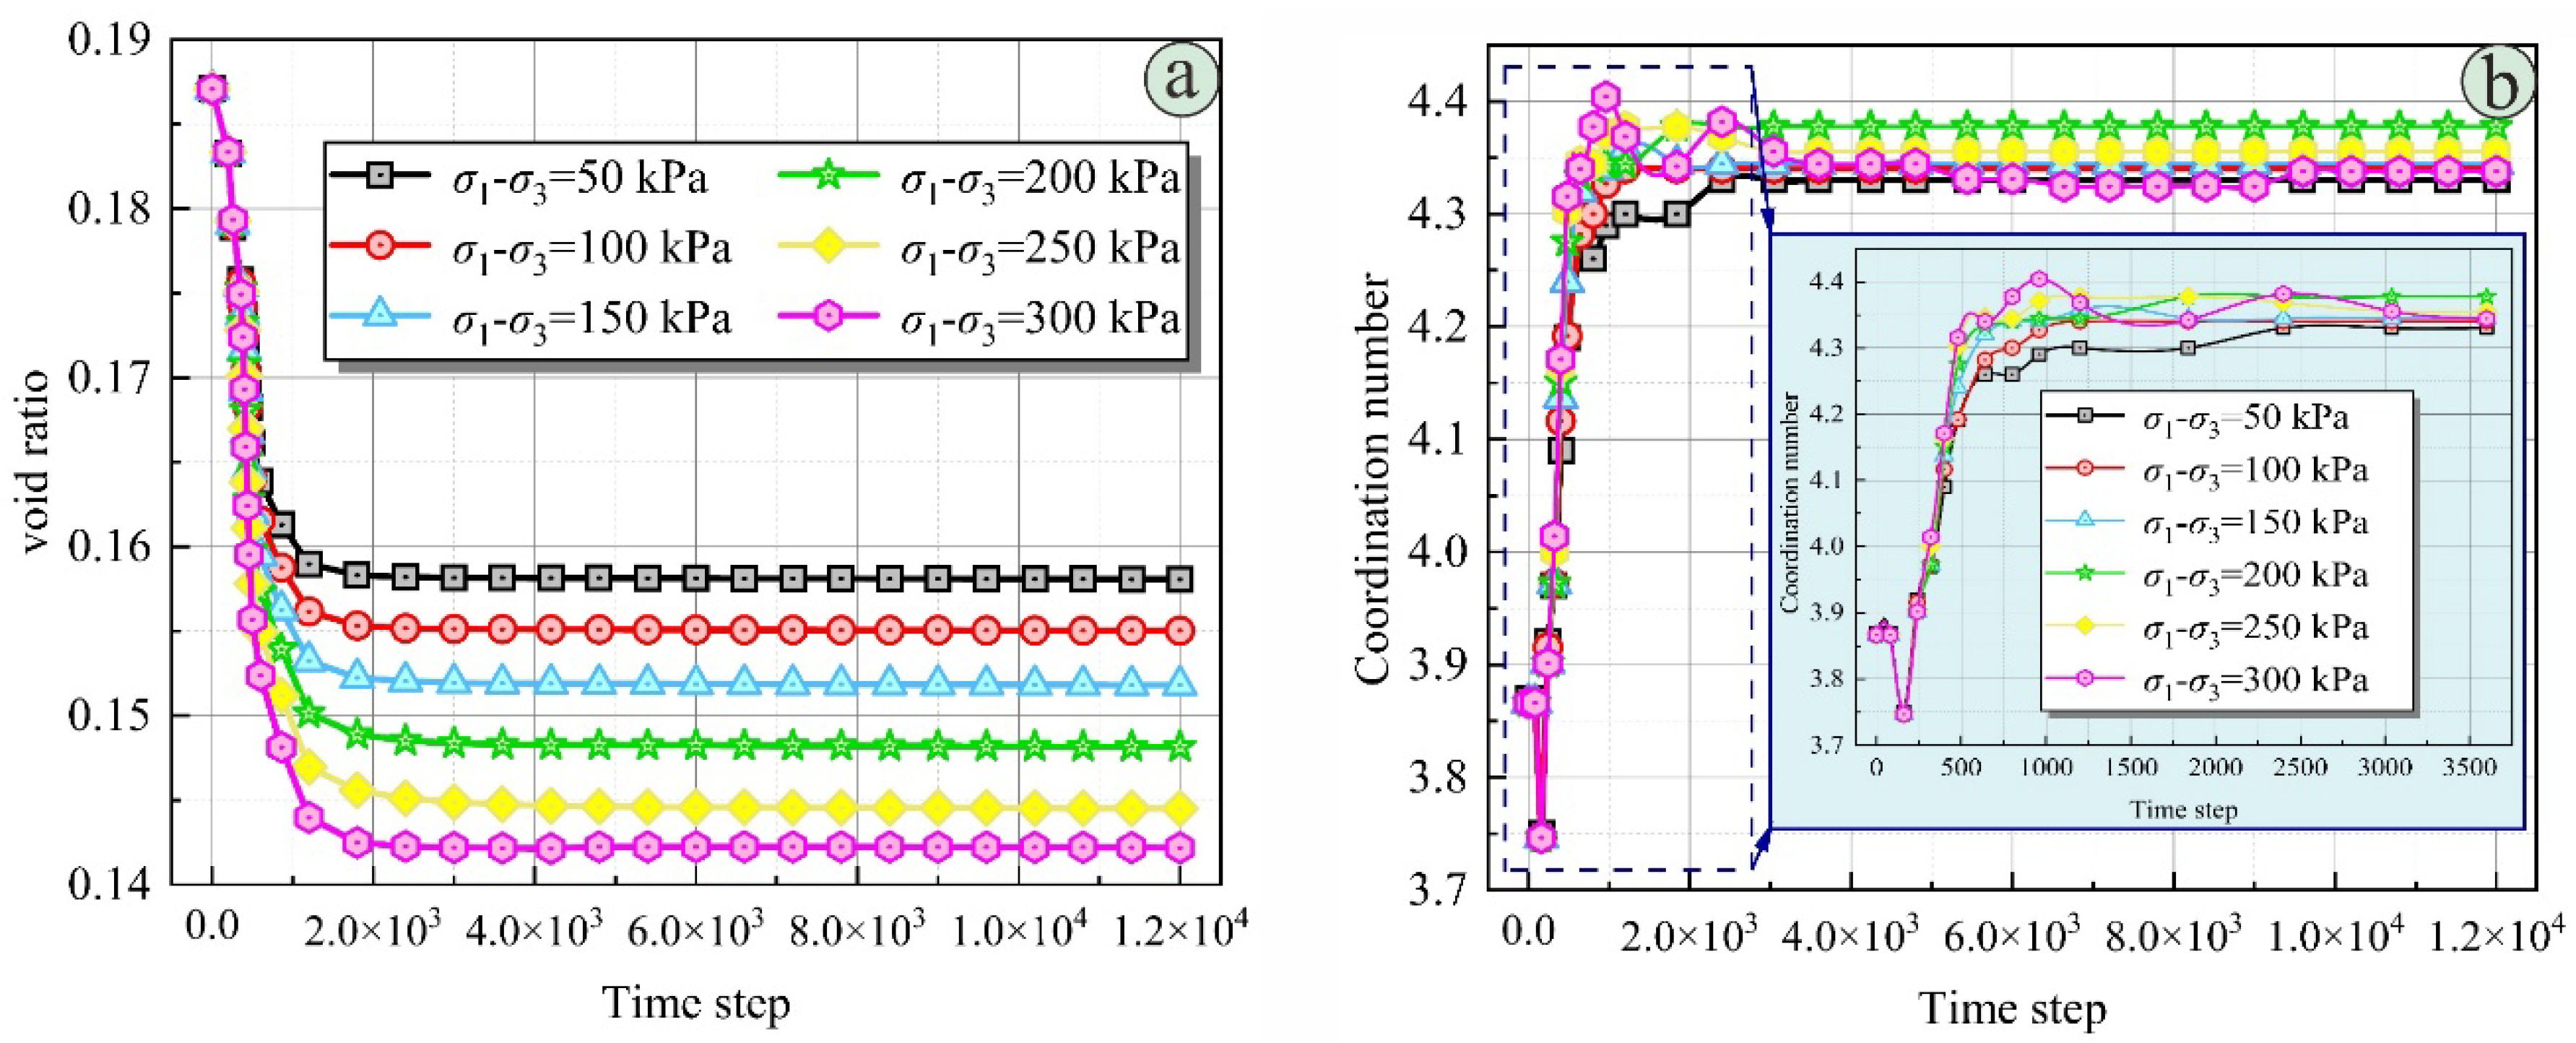
4.3. Variation of Void Ratio and Coordination Number with Time Step

Under different deviatoric stress level, the increase of void ratio at any time step showed “inverse S” type curve, and the void ratio before about 100 time step change little. With the increase of time step, the position of units are continuously adjusted and the amplitude increases, resulting in the continuous filling of pores in aggregates, which shows that the decrease of void ratio is large and continues to increase with time step. The void ratio decreases at a slower rate and eventually tends to be stable. At the same time, it can be seen that the larger the deviatoric stress is, the larger the variation range of the void ratio is, and the smaller its stable value is (Figure 11a).
From the perspective of structural statics, material creep is closely linked to the relative movement, rotation and arrangement and recombination of particle elements inside the sample. The most intuitive macroscopic evolution of such adjustment process of particle elements is the change of particle contact number, namely coordination number, so the change of coordination number must be considered in the microscopic mechanism of creep. Figure 11b shows that the coordination number curve increases at any time step under different deviator stress levels, and then tends to be stable when it reaches a certain value. According to the above analysis, this is mainly caused by changes of particle relative rotation and relative slip amplitude caused by the unbalanced force of the sample. The aggregate units with fewer coordination numbers continue to fill the internal pores of the sample, and the result of the adjustment of the position of the aggregate units makes the pores of the system continue to be filled, the porosity continues to decrease, and the coordination number increases. Due to the large adjustment range at this stage, the macroscopic performance is high creep rate. With the creep process, the contact coordination number of the aggregate element continues to increase, and the relative rotation and mutual slip amplitude of the structural element also decrease, showing a trend of decreasing creep rate at the macro level. When the coordination number of the system reaches a certain value, a stable stress chain is formed between the aggregates, and the positions of the aggregates are only slightly adjusted, which makes the macroscopic deformation rate of the system stable. As a result of creep, the number of contact points between aggregates increases and gradually changes from point contact to overlap contact. The constraint between aggregates increases, and the skeleton tends to be a more stable structure, which can finally bear a larger external load.
As can be seen from the local magnification of Figure 11b, when the deviatoric stress level is higher (>200 kPa) and the time step is greater than 1000, the coordination number oscillates to a certain extent and decreases. Analysis shows that there is caused by dilatancy in the sample under the action of higher unbalance force. The evolution law of coordination number reveals the macroscopic law of triaxial creep test of soil well.

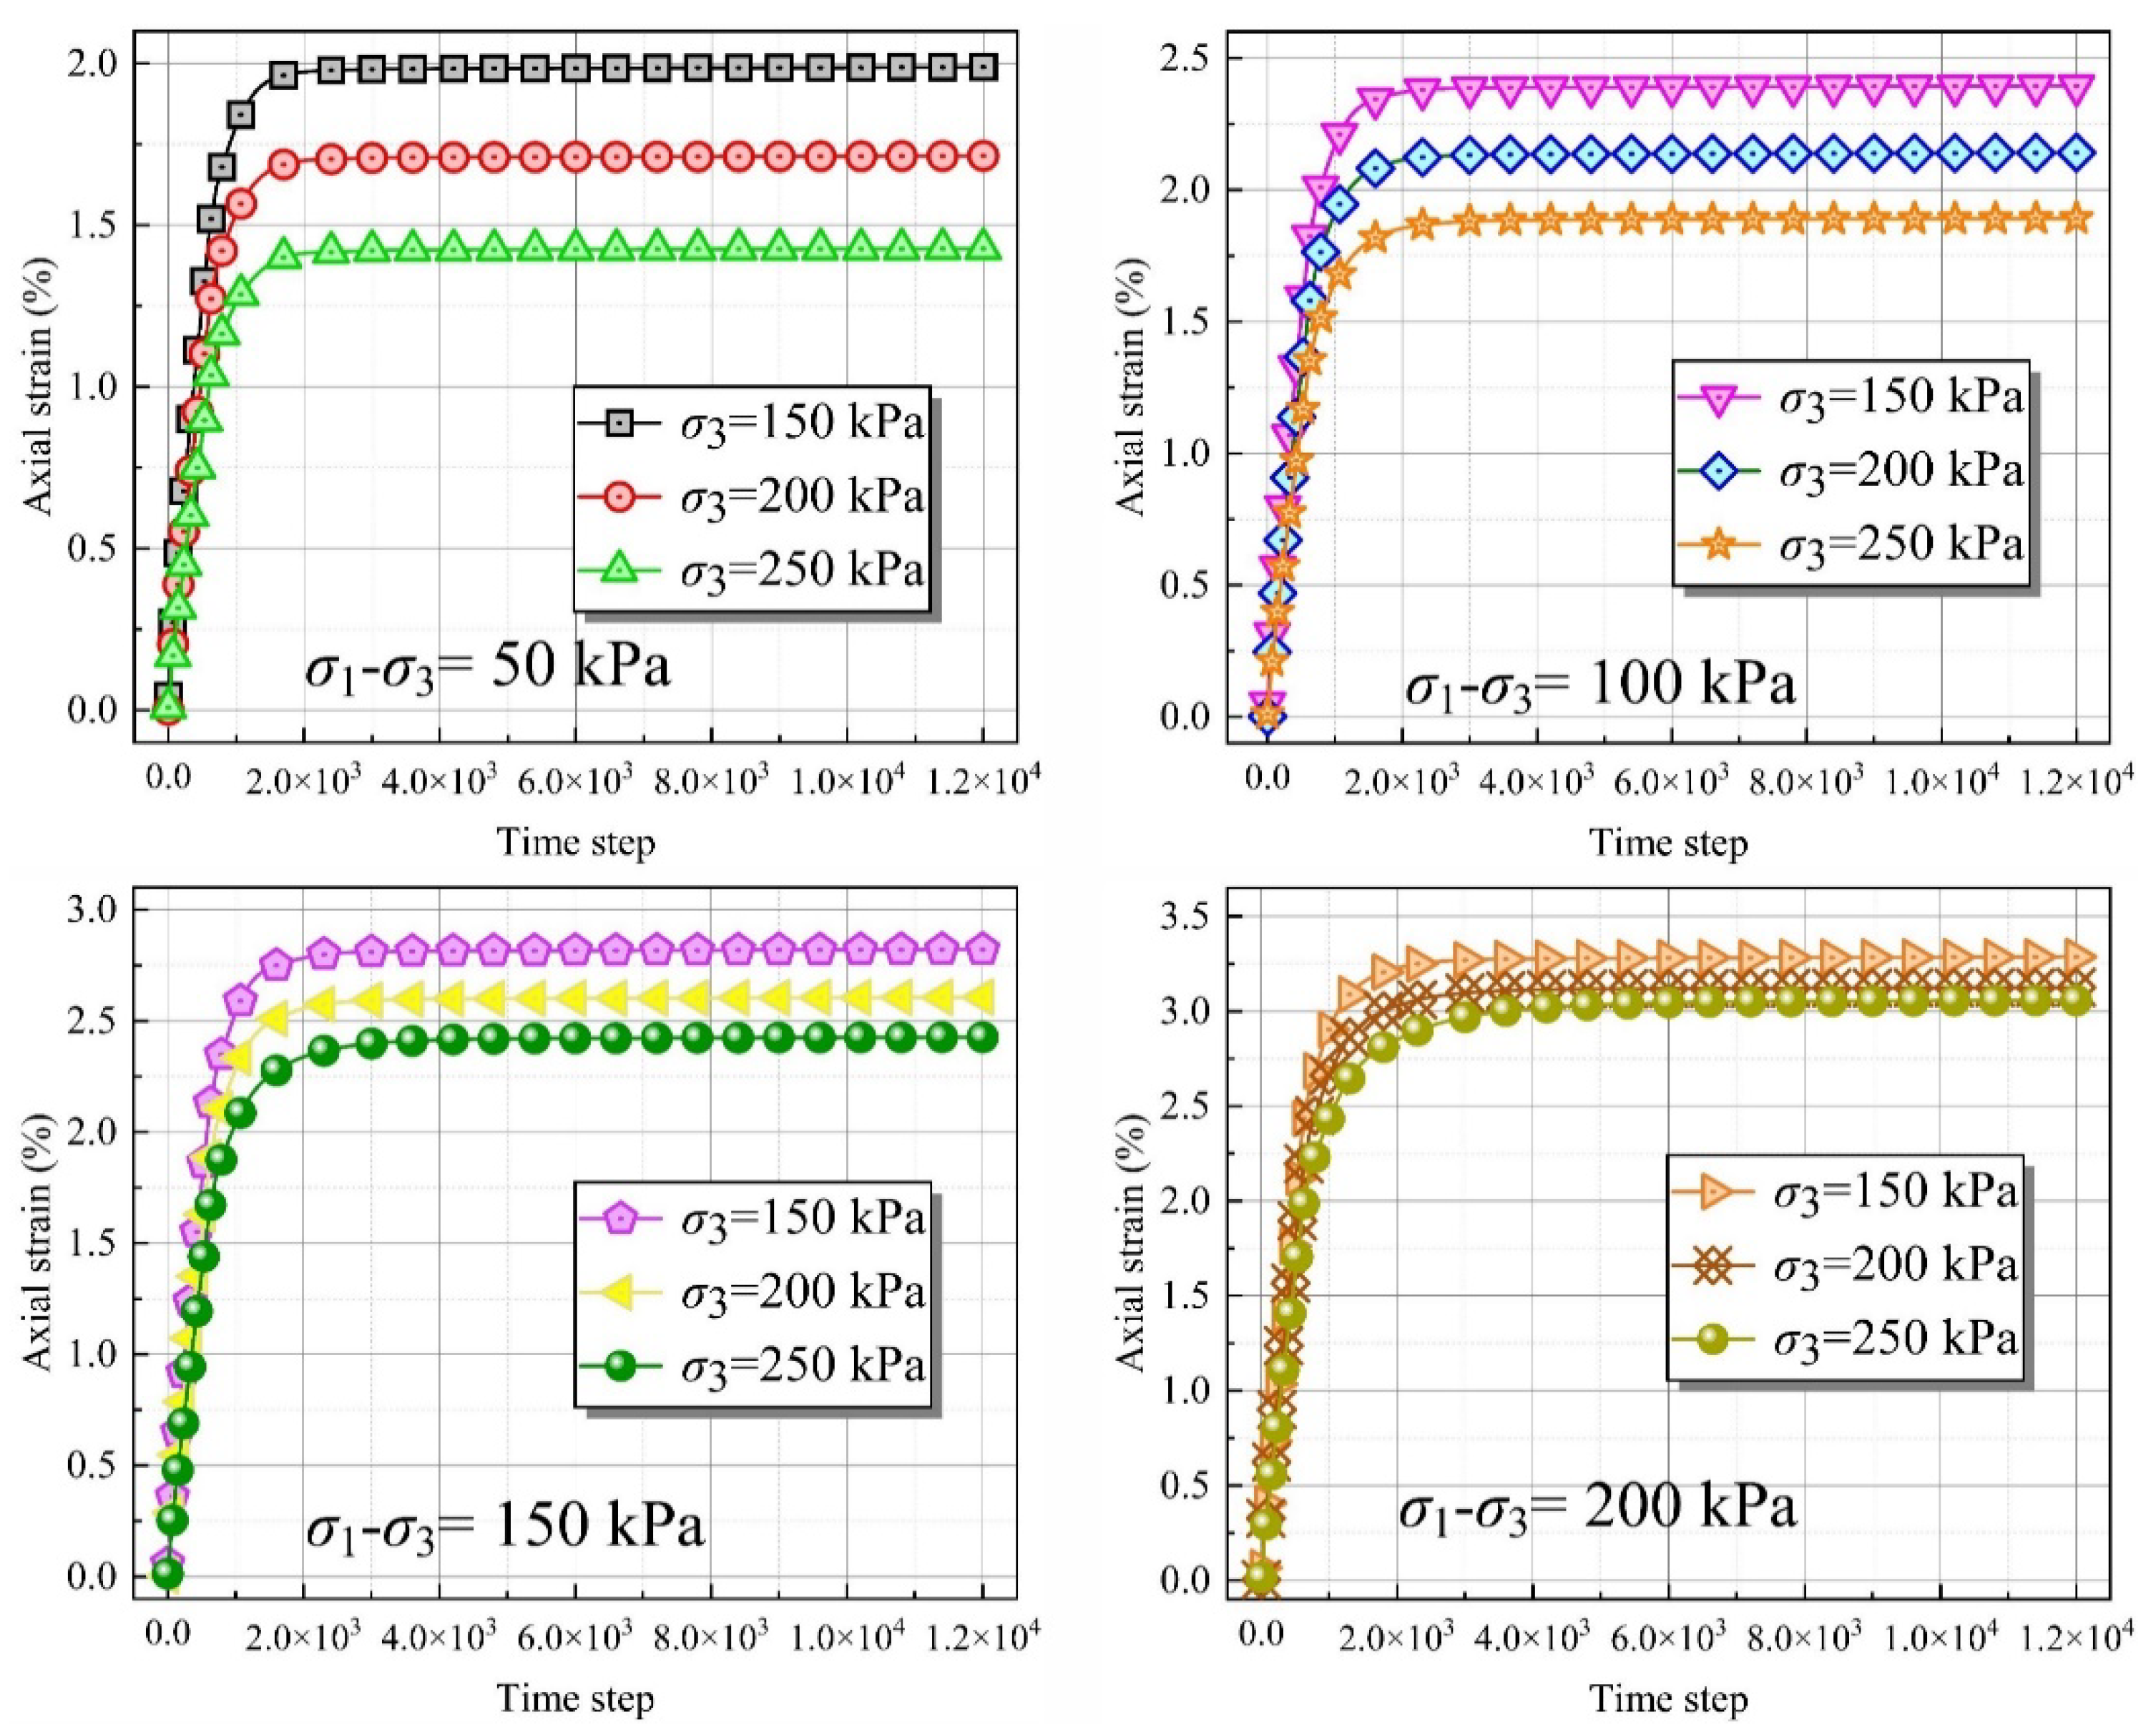
4.4. Effect of Confining Pressure on Creep Properties of Aggregates

In order to investigate the influence of confining pressure level on creep characteristics of numerical samples, creep tests were carried out under different deviatoric stress levels at confining pressures of 150 kPa, 200 kPa and 250 kPa, respectively. According to the analysis in Figure 12, under the same deviatoric stress level, the axial strain of the sample is negatively correlated with the confining pressure. Under the condition of low confining pressure, the deformation of the sample amount is larger, achieve stability and deformation for a long time, this is because under low confining pressure level, the sample is around less pressure, under the effect of partial stress resulted from the shear force of particle unit easy to move around, so the axial strain, the greater the performance for the creep phenomenon is relatively clear, and under the condition of high confining pressure, The combination between particle units of the sample is relatively close and the occluding effect is strong, which makes the aggregate strength higher and the creep phenomenon is not significant compared with the low confining pressure. These characteristics are consistent with the actual engineering situation in loess areas.

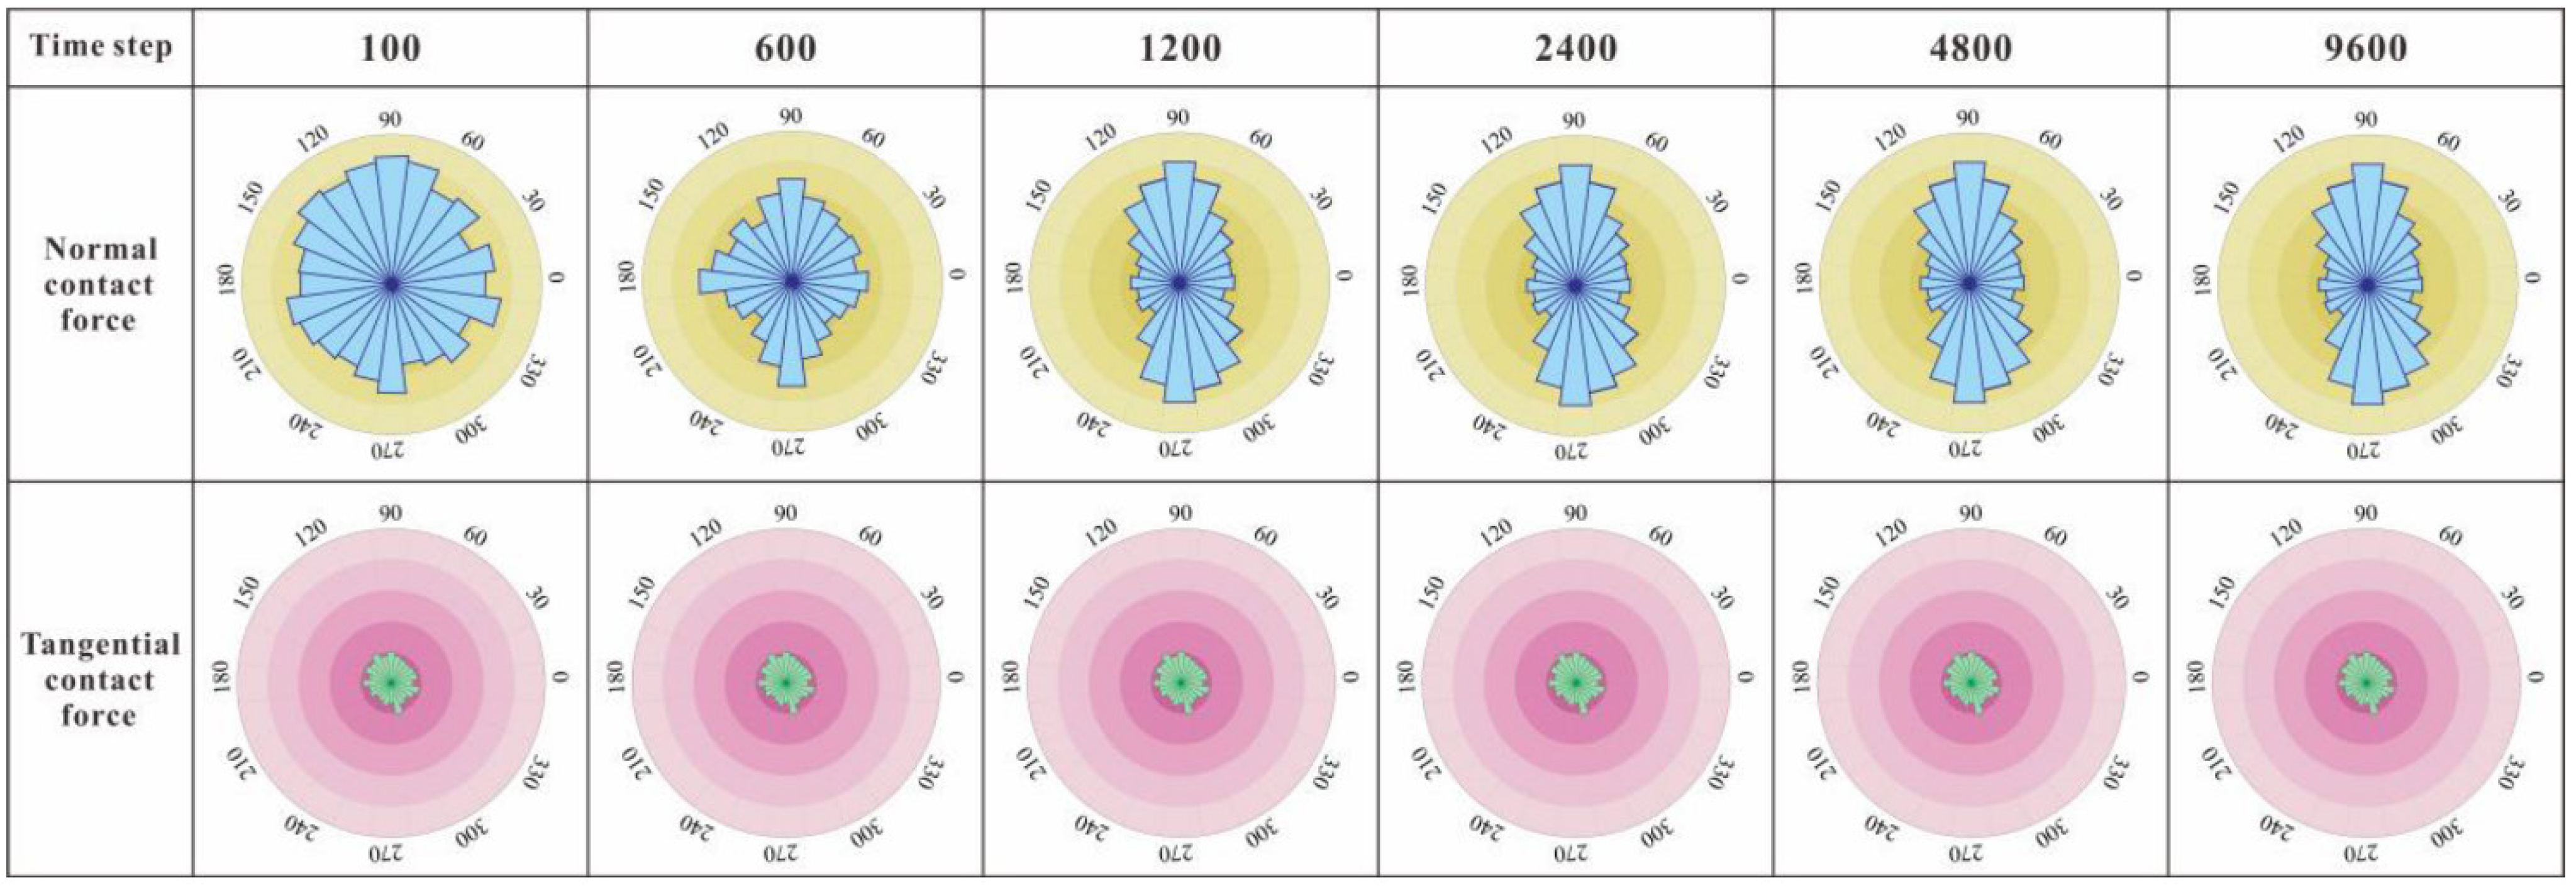
4.5. Micromechanical Evolution of Specimen during Creep

In order to better understand how changes in cohesion between aggregates in the sample affect creep behavior, it is necessary to determine their related changes in direction. As mentioned earlier, cohesion is represented by contact bonds between particles. Figure 13 shows the evolution of the contact normal force and contact tangential force of the numerical sample under the action of 200 kPa confining pressure and 200 kPa axial deviatoric stress. Data revealed that at the beginning of the biaxial creep, samples within normal contact force distribution are isotropic, but with the increase of time step, creep, the normal contact force distribution on the axial deviatoric stress response is, in the vertical direction are arranged advantageously, vertical and horizontal to the ratio of the normal contact force is bigger and bigger, this is because in the process of creep, the granular arches with slender holes along the principal stress direction can survive and gradually dominate, making all the forces tend to be arranged in the vertical direction. This vertical orientation finally makes the internal structure of the sample more stable. The distribution of tangential contact force inside the sample is comparable to that of normal contact force at the initial stage of creep, basically isotropic. With the development of creep, the distribution of tangential contact force presents a symmetrical “petal” shape, and the degree of tangential contact force has a tendency to deepen. Finally, with the stability of creep, the distribution of tangential contact force tends to be stable. Aggregates in a constant process of creep under load at the end of the day is its internal evolution of macroscopic structure, the distribution of evolution of macroscopic contact force is an important part of the macroscopic structure evolution, so in this investigation, the numerical test specimen in the process of biaxial creep internal evolution of macroscopic contact force analysis of well explains the macro creep phenomenon of the soil.

5. Conclusions

The structural change of loess dominates the whole creep response process, which can also be considered as a process of adjusting the meso-fabric to adapt to the changes of the macro-stress state. The aggregates are subjected to loads through contact friction and cohesion. When there is certain external load continuous function of soil mass, the internal parts of stress concentration, the structures form where most weak, and the relative displacement and rearrange the structure, and can reunite in order to make the connection between force and external force balance, the creep process is the internal connection between aggregate of soil hardening softening some aggregate structure of connections, a simultaneous process of both. In this research, a discrete element model based on the structural parameters of loess is established to simulate the macroscopic phenomenon of aggregate creep and the evolution of the underlying microscopic parameters and micromechanical fabric. The main conclusions are summarized as follows:
(1)
The development of axial strain at any time step is characterized by obvious nonlinear, and for the overall attenuation, deformation characteristics, It has three stages: rapid creep, deceleration creep and stable creep, and the time needed to stabilize the deformation and stress size present positive correlation that well reflects this kind of typical structural soil, and loess has strong initial structural strength, The trend of coordination number at any time is basically consistent with axial strain.
(2)
Under the same deviatoric stress level, the axial strain of the sample is negatively correlated with the confining pressure. Due to the increase of confining pressure, the occluding effect of the aggregate unit in the aggregate is enhanced and the structural strength is improved. When the deviatoric stress level is low, the deviatoric stress-axial strain relationship is approximately linear, and the isochronous curve shifts to the strain axis with the increase of deviatoric stress level. With the increase of time step, the deviant stress-time step curve gradually draws closer and the deviation of the strain axis increases, which are caused by the deterioration effect inside the sample becoming more obvious.
(3)
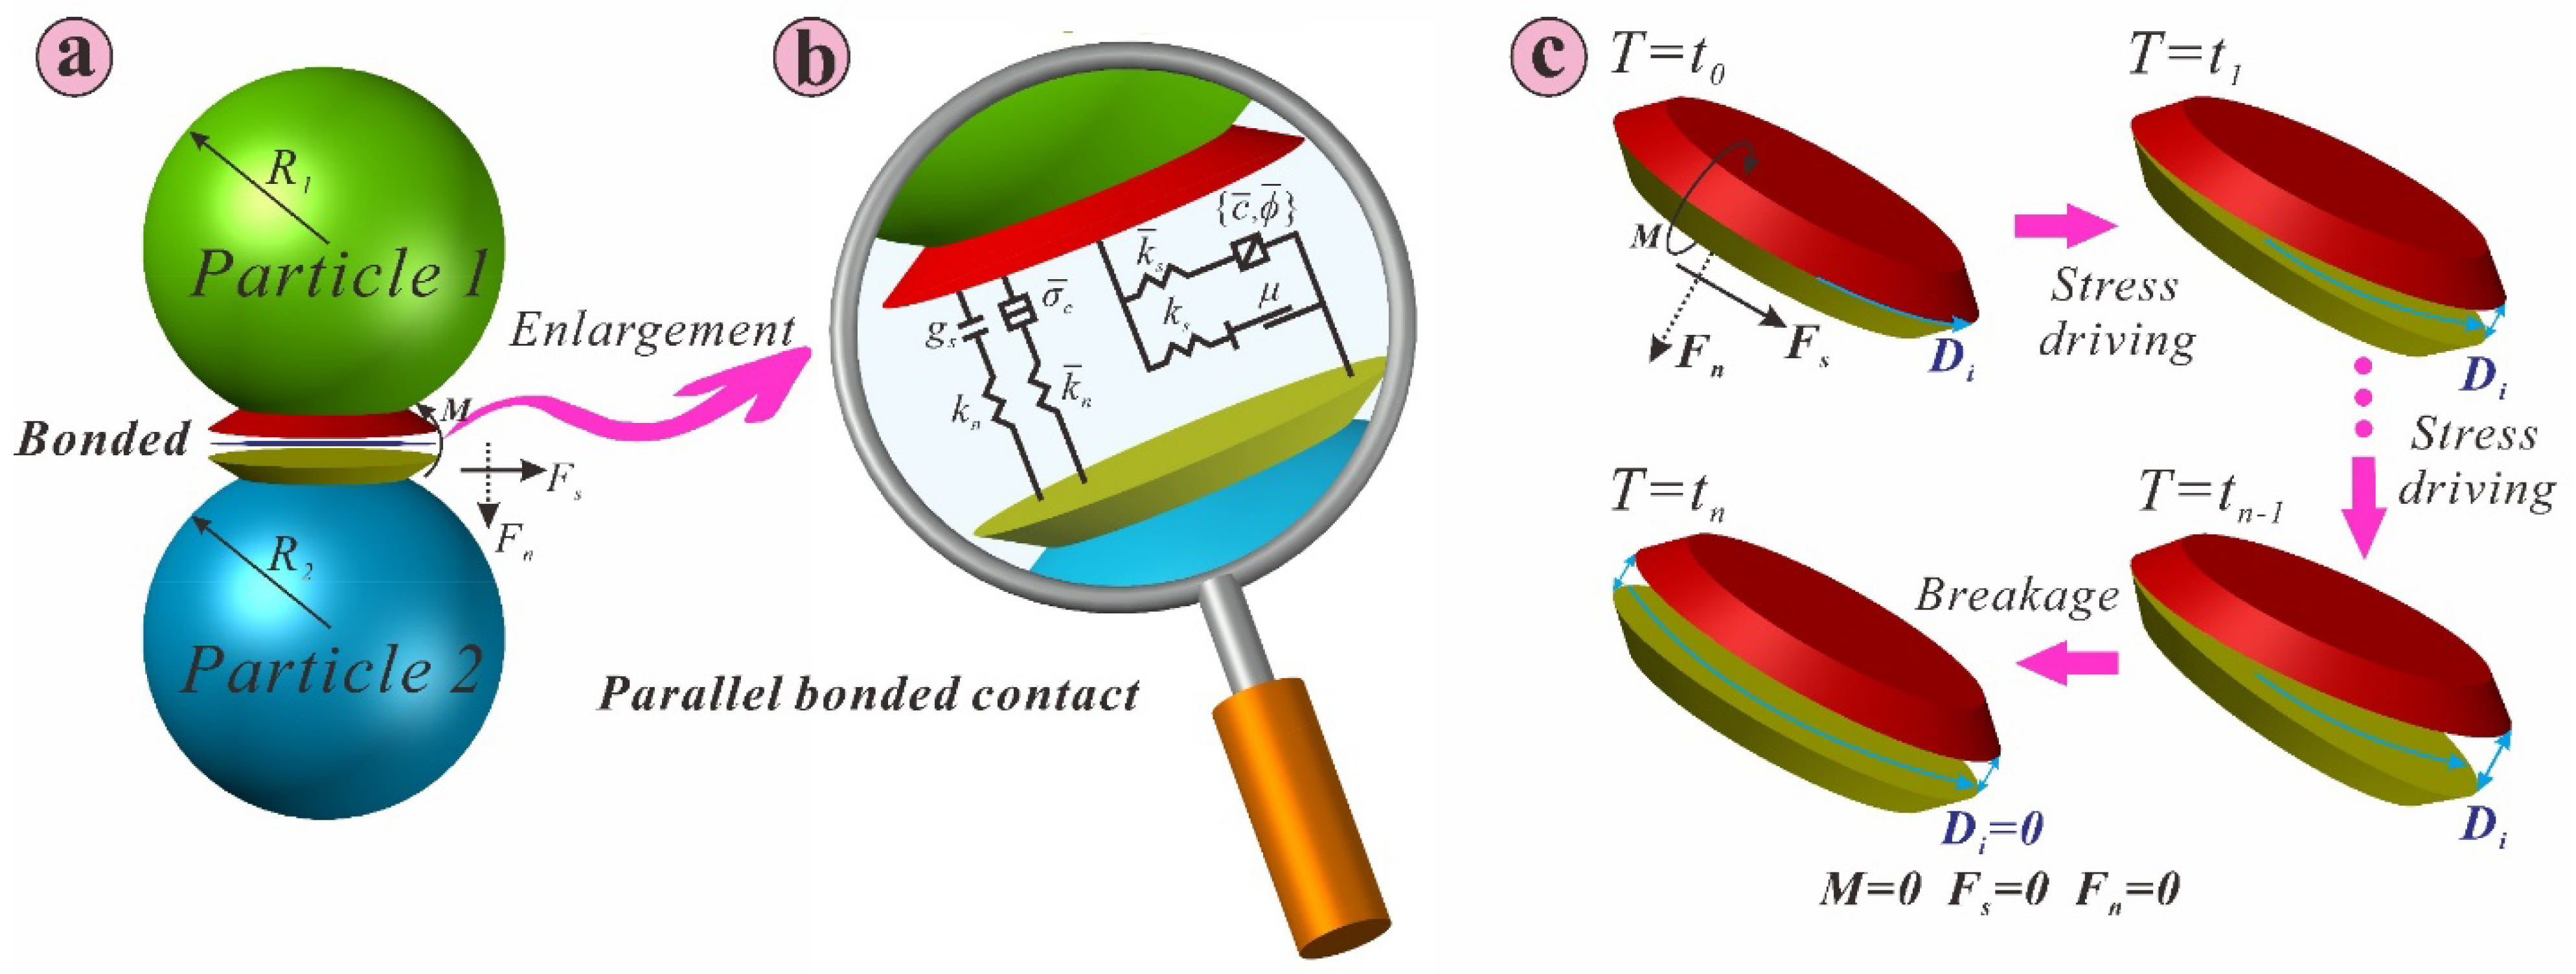
The discrete element model based on loess structural parameters can simulate the macroscopic phenomenon of aggregate creep and the evolution of the underlying mesoscopic parameters and micromechanical fabric. With the creep process, the creep stress is gradually borne by the normal contact force rather than the tangential contact force and has anisotropic characteristics. The microscopic parameters and evolution characteristics of fabric can reveal the microscopic mechanism behind the macroscopic creep phenomenon.
In this numerical test, it was found that the aggregate in the sample had some small cracks in the fine area, and the existing studies showed that particle breakage had a significant impact on the mechanical behavior [42,43]. This is an interesting phenomenon, and our next research will focus on exploring and analyzing this phenomenon in loess.

Author Contributions

Writing—review and editing, J.-Q.S.; software, J.-Q.S.; methodology, X.-A.L.; validation, X.-A.L.; writing—original draft preparation, K.-X.Z.; data processing and mapping, M.-L.B.; data processing and mapping, J.Z. All authors have read and agreed to the published version of the manuscript.

Funding

This research was financially supported by the National Natural Science Foundation of China (Grant Nos.41572264, 41877225).

Institutional Review Board Statement

No ethical approval was required for this study.

Informed Consent Statement

Informed consent was obtained from all subjects involved in the study.

Data Availability Statement

The study did not report any data.

Acknowledgments

The authors would like to sincerely thank the editor as well as the reviewers of this paper, who put forward useful comments that improved the manuscript substantially.

Conflicts of Interest

The authors declare no conflict of interest.

References

  1. Yates, K.; Fenton, C.H.; Bell, D.H. A review of the geotechnical characteristics of loess and loess-derived soils from Canterbury, South Island, New Zealand. Eng. Geol. 2018, 236, 11–21. [Google Scholar] [CrossRef]
  2. Peng, J.; Ma, P.; Wang, Q.; Zhu, X.; Zhang, F.; Tong, X.; Huang, W. Interaction between landsliding materials and the underlying erodible bed in a loess flowslide. Eng. Geol. 2018, 234, 38–49. [Google Scholar] [CrossRef]
  3. Costantini, E.A.; Carnicelli, S.; Sauer, D.; Priori, S.; Andreetta, A.; Kadereit, A.; Lorenzetti, R. Loess in Italy: Genesis, characteristics and occurrence. Catena 2018, 168, 14–33. [Google Scholar] [CrossRef]
  4. Yuan, Z.; Wang, L. Collapsibility and seismic settlement of loess. Eng. Geol. 2009, 105, 119–123. [Google Scholar] [CrossRef]
  5. Juang, C.H.; Dijkstra, T.; Wasowski, J.; Meng, X. Loess geohazards research in China: Advances and challenges for mega engineering projects. Eng. Geol. 2019, 251, 1–10. [Google Scholar] [CrossRef]
  6. Jiang, M.; Zhang, F.; Hu, H.; Cui, Y.; Peng, J. Structural characterization of natural loess and remolded loess under triaxial tests. Eng. Geol. 2014, 181, 249–260. [Google Scholar] [CrossRef]
  7. Wen, B.-P.; Yan, Y.-J. Influence of structure on shear characteristics of the unsaturated loess in Lanzhou, China. Eng. Geol. 2014, 168, 46–58. [Google Scholar] [CrossRef]
  8. Li, P.; Vanapalli, S.; Li, T. Review of collapse triggering mechanism of collapsible soils due to wetting. J. Rock Mech. Geotech. Eng. 2016, 8, 256–274. [Google Scholar] [CrossRef]
  9. Xu, L.; Coop, M.R. Influence of structure on the behavior of a saturated clayey loess. Can. Geotech. J. 2016, 53, 1026–1037. [Google Scholar] [CrossRef]
  10. Ng, C.W.W.; Mu, Q.Y.; Zhou, C. Effects of soil structure on the shear behaviour of an unsaturated loess at different suctions and temperatures. Can. Geotech. J. 2017, 54, 270–279. [Google Scholar] [CrossRef]
  11. Liu, Z.; Liu, F.; Ma, F.; Wang, M.; Bai, X.; Zheng, Y.; Yin, H.; Zhang, G. Collapsibility, composition, and microstructure of loess in China. Can. Geotech. J. 2016, 53, 673–686. [Google Scholar] [CrossRef] [Green Version]
  12. Zheng, Z.; Li, X.-A.; Wang, L.; Li, L.; Shi, J.; Bi, M. A new approach to evaluation of loess collapsibility based on quantitative analyses of colloid-clay coating with statistical methods. Eng. Geol. 2021, 288, 106167. [Google Scholar] [CrossRef]
  13. Karimpour, H.; Lade, P.V. Creep behavior in Virginia Beach sand. Can. Geotech. J. 2013, 50, 1159–1178. [Google Scholar] [CrossRef]
  14. Li, J.X.; Wang, C.M.; Zhang, X.W. Creep properties and micropore changes of soft soil under different drainage conditions. Rock Soil Mech. 2010, 31, 3493–3498. [Google Scholar] [CrossRef]
  15. Xie, X.; Qi, S.; Zhao, F.; Wang, D. Creep behavior and the microstructural evolution of loess-like soil from Xi’an area, China. Eng. Geol. 2018, 236, 43–59. [Google Scholar] [CrossRef]
  16. Tang, H.; Duan, Z.; Wang, D.; Dang, Q. Experimental investigation of creep behavior of loess under different moisture contents. Bull. Eng. Geol. Environ. 2020, 79, 411–422. [Google Scholar] [CrossRef]
  17. Xin, P.; Liang, C.; Wu, S.; Liu, Z.; Shi, J.; Wang, T. Kinematic characteristics and dynamic mechanisms of large-scale landslides in a loess plateau: A case study for the north bank of the Baoji stream segment of the Wei River, China. Bull. Eng. Geol. Environ. 2016, 75, 659–671. [Google Scholar] [CrossRef]
  18. Wang, X.; Wang, J.; Zhan, H.; Li, P.; Qiu, H.; Hu, S. Moisture content effect on the creep behavior of loess for the catastrophic Baqiao landslide. Catena 2020, 187, 104371. [Google Scholar] [CrossRef]
  19. Barthès, B.; Roose, E. Aggregate stability as an indicator of soil susceptibility to runoff and erosion; validation at several levels. Catena 2002, 47, 133–149. [Google Scholar] [CrossRef] [Green Version]
  20. Munkholm, L.; Schjønning, P.; Kay, B. Tensile strength of soil cores in relation to aggregate strength, soil fragmentation and pore characteristics. Soil Tillage Res. 2002, 64, 125–135. [Google Scholar] [CrossRef]
  21. Murungu, F. Effects of seed priming, aggregate size and soil matric potential on emergence of cotton (Gossypium hirsutum L.) and maize (Zea mays L.). Soil Tillage Res. 2003, 74, 161–168. [Google Scholar] [CrossRef]
  22. Reuss, S.; Buhler, D.; Gunsolus, J. Effects of soil depth and aggregate size on weed seed distribution and viability in a silt loam soil. Appl. Soil Ecol. 2001, 16, 209–217. [Google Scholar] [CrossRef]
  23. Nichols, K.A.; Halvorson, J.J. Roles of biology, chemistry, and physics in soil macroaggregate formation and stabilization. Open Agric. J. 2013, 7, 107–117. [Google Scholar] [CrossRef] [Green Version]
  24. Jiao, F.; Wen, Z.-M.; An, S.-S. Changes in soil properties across a chronosequence of vegetation restoration on the Loess Plateau of China. Catena 2011, 86, 110–116. [Google Scholar] [CrossRef]
  25. An, S.; Mentler, A.; Mayer, H.; Blum, W.E. Soil aggregation, aggregate stability, organic carbon and nitrogen in different soil aggregate fractions under forest and shrub vegetation on the Loess Plateau, China. Catena 2010, 81, 226–233. [Google Scholar] [CrossRef]
  26. Amézketa, E. Soil Aggregate Stability: A Review. J. Sustain. Agric. 1999, 14, 83–151. [Google Scholar] [CrossRef]
  27. Li, X.; Li, L. Quantification of the pore structures of Malan loess and the effects on loess permeability and environmental significance, Shaanxi Province, China: An experimental study. Environ. Earth Sci. 2017, 76, 523. [Google Scholar] [CrossRef]
  28. Al Mahbub, A.; Haque, A. X-ray Computed Tomography Imaging of the Microstructure of Sand Particles Subjected to High Pressure One-Dimensional Compression. Materials 2016, 9, 890. [Google Scholar] [CrossRef] [Green Version]
  29. Wei, T.; Fan, W.; Yu, N.; Wei, Y.-N. Three-dimensional microstructure characterization of loess based on a serial sectioning technique. Eng. Geol. 2019, 261, 105265. [Google Scholar] [CrossRef]
  30. Wei, Y.-N.; Fan, W.; Yu, B.; Deng, L.-S.; Wei, T. Characterization and evolution of three-dimensional microstructure of Malan loess. Catena 2020, 192, 104585. [Google Scholar] [CrossRef]
  31. Asano, M.; Wagai, R. Evidence of aggregate hierarchy at micro- to submicron scales in an allophanic Andisol. Geoderma 2014, 216, 62–74. [Google Scholar] [CrossRef]
  32. Al-Kaisi, M.M.; Douelle, A.; Kwaw-Mensah, D. Soil microaggregate and macroaggregate decay over time and soil carbon change as influenced by different tillage systems. J. Soil Water Conserv. 2014, 69, 574–580. [Google Scholar] [CrossRef] [Green Version]
  33. Nie, X.; Li, Z.; Huang, J.; Liu, L.; Xiao, H.; Liu, C.; Zeng, G. Thermal stability of organic carbon in soil aggregates as affected by soil erosion and deposition. Soil Tillage Res. 2018, 175, 82–90. [Google Scholar] [CrossRef]
  34. Jiang, M.; Yan, H.; Zhu, H.; Utili, S. Modeling shear behavior and strain localization in cemented sands by two-dimensional distinct element method analyses. Comput. Geotech. 2011, 38, 14–29. [Google Scholar] [CrossRef]
  35. Lopez, R.D.F.; Larsson, S.; Silfwerbrand, J. Discrete element modelling of rockfill railway embankments. Granul. Matter 2021, 23, 1–14. [Google Scholar] [CrossRef]
  36. Shirinabadi, R.; Moosavi, E.; Gholinejad, M. Application of Distinct Element Method to Analyze the Fracture and In-situ Stress on Wellbore Stability under Triaxial Compression. Indian Geotech. J. 2021, 51, 1384–1398. [Google Scholar] [CrossRef]
  37. Li, H.; Ma, H.; Shi, X.; Zhou, J.; Zhang, H.; Daemen, J.J.K. A 3D Grain-Based Model for Simulating the Micromechanical Behavior of Salt Rock. Rock Mech. Rock Eng. 2020, 53, 2819–2837. [Google Scholar] [CrossRef]
  38. China, Ministry of Water Resources of the People’s Republic of China. Standard for Geotechnical Testing Method; China Planning Press: Beijing, China, 1999. [Google Scholar]
  39. Hong, B.; Li, X.-A.; Wang, L.; Li, L.-C. Temporal variation in the permeability anisotropy behavior of the Malan loess in northern Shaanxi Province, China: An experimental study. Environ. Earth Sci. 2019, 78, 1–12. [Google Scholar] [CrossRef]
  40. PFC2D Particle Flow Code in 2 Dimensions User’s Guide; Itasca Consulting Group Inc.: Minneapolis, MN, USA, 2014.
  41. Huang, Y.-H.; Yang, S.-Q.; Ranjith, P.; Zhao, J. Strength failure behavior and crack evolution mechanism of granite containing pre-existing non-coplanar holes: Experimental study and particle flow modeling. Comput. Geotech. 2017, 88, 182–198. [Google Scholar] [CrossRef]
  42. Wang, P.; Yin, Z.-Y.; Wang, Z.-Y. Micromechanical Investigation of Particle-Size Effect of Granular Materials in Biaxial Test with the Role of Particle Breakage. J. Eng. Mech. 2022, 148, 04021133. [Google Scholar] [CrossRef]
  43. Ovalle, C.; Dano, C.; Hicher, P.-Y.; Cisternas, M. Experimental framework for evaluating the mechanical behavior of dry and wet crushable granular materials based on the particle breakage ratio. Can. Geotech. J. 2015, 52, 587–598. [Google Scholar] [CrossRef] [Green Version]
Figure 1. Aggregate in loess: (a) Single aggregates at 5000 times magnification; (b) At a magnification of 10,000 times, the aggregate has many small size flaps or plate-like viscosities distributed on the surface and inside, and a large number of pores are inlaid inside; (c) The aggregate of different size can be seen in the loess samples with 800 times of grinding image; (d) The aggregate is magnified 1000 times.
Processes 10 00795 g001
Figure 2. Overview of the study site: (a) The location of Yan’an city in Shaanxi Province, China. (b) Engineering Section of Yan’an New Area [39]; (c) Particle size distribution and gradation accumulation curve of loess sample. (d) Section Column Map of Yan’an New Area.
Processes 10 00795 g002
Figure 3. Conceptual model of aggregation hierarchy: (a) Silt in loess; (b) Clay in loess; (c) Colloidal in loess; (d) The first level of aggregate. Silt, clay and colloidal particles form smaller aggregates under physical action, which are mainly small single aggregates. There are two types, one is the aggregate formed by clay and colloidal particles wrapped around silt or sand, and the other is the matrix aggregate formed by clay and colloidal only; (e) The second level aggregate is composed of two smaller aggregates from the previous level to form a larger one; (f) The aggregates with higher aggregation level are almost spherical or ellipsoidal in three dimensional space.
Processes 10 00795 g003
Figure 4. Creep equipment and loading scheme: (a) Consolidation instrument; (b) Loading-time curve.
Processes 10 00795 g004
Figure 5. e-lgt curves of different loess samples.
Processes 10 00795 g005
Figure 6. A full generation process of DEM model: (a) Geometric structure model, the outline of aggregates extracted from the SEM image; (b) Pebbles were used as silt particles to fill the extracted aggregate outline, and served as templates; (c) Intact numerical specimen generated by PFC method. Multi-colors denote various aggregates; (d) Enlarged detail of numerical specimen.
Processes 10 00795 g006
Figure 7. Schematic diagrams of the whole process of the parallel bond diameter attenuation mechanism: (a) Description of the parallel bond contact between two particles. Fn, Fs and M represent the normal force, shear force and bending moment, respectively; (b) Enlarged details of the parallel bond contact, kn, ks, μ denote the normal stiffness, shear stiffness and friction coefficient, respectively. gs is surface gap, which defined as the difference between the contact gap and the reference gap; (c) Attenuation model of the parallel bond diameter over time. ti, i = 0, …, n − 1, n indicates the various moment of deterioration.
Processes 10 00795 g007
Figure 8. Calibration process of the parameters: (a) Flow chart of parameters calibration; (b) Biaxial test; (c) Comparison of experimental and numerical results, S and T denote the results of numerical simulation and test respectively.
Processes 10 00795 g008
Figure 9. Variation of axial strain with time step: (a) Axial strain time step curve under different deviatoric stresses; (b) Axial strain time step semi logarithmic curve under different deviatoric stresses.
Processes 10 00795 g009
Figure 10. Variation of creep rate with time step.
Processes 10 00795 g010
Figure 11. Variation of void ratio and coordination number with time step: (a) Void ratio; (b) Coordination number.
Processes 10 00795 g011
Figure 12. Axial strain-time step curves under different confining pressures at different deviatoric stress levels.
Processes 10 00795 g012
Figure 13. Evolution of the contact normal force and contact tangential force.
Processes 10 00795 g013
Table 1. Basic physical properties of loess.
Nature DensityWater Content (%)Void
Ratio
Liquid Limit
(%)
Plastic Limit
(%)
Particle Composition (%)
Sand
>0.075 mm
Silt
0.005–0.075 mm
Clay
<0.005 mm
1.8616.30.6629.915.911.371.916.8
1.8215.60.7130.216.513.672.513.9
1.8114.90.7229.716.412.572.914.6
Table 2. Parameters used in the DEM simulations.
ParametersValue
Particle density (kg/m3)2500
Inter-particle frictional coefficient,μ0.5
Wall-particle frictional coefficient0
Effective modulus, Ec (Pa)3 × 10⁸
Stiffness ratio (kn/ks)4/3
Tensile strength, σc (Pa)1 × 10⁶
Bond strength, c (Pa)5 × 10⁶
Damping factor0.7
Publisher’s Note: MDPI stays neutral with regard to jurisdictional claims in published maps and institutional affiliations.

