


Use of Digitalisation and Machine Learning Techniques in Therapeutic Intervention at Early Ages: Supervised and Unsupervised Analysis

 ,
,  ,
,  ,
,  and
and (This article belongs to the Section Pediatric Nursing)
Abstract
1. Introduction
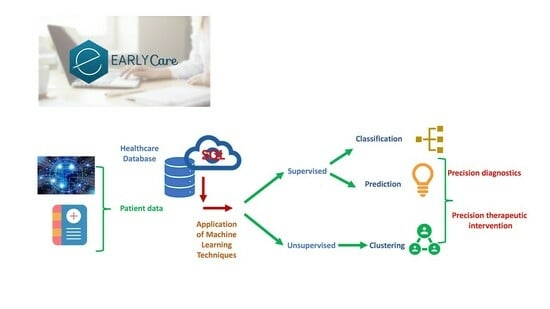
Application of AI and IoT in Early Intervention in CATs and CDIATs
- To analyse the functionality of using supervised machine learning techniques for prediction in the group amenable to early care;
- To analyse the functionality of using supervised machine learning techniques for classification in the group amenable to early care;
- To analyse the functionality of using unsupervised machine learning clustering techniques in the group amenable to early care.
2. Materials and Methods
2.1. Design
2.2. Participants
2.3. Instruments
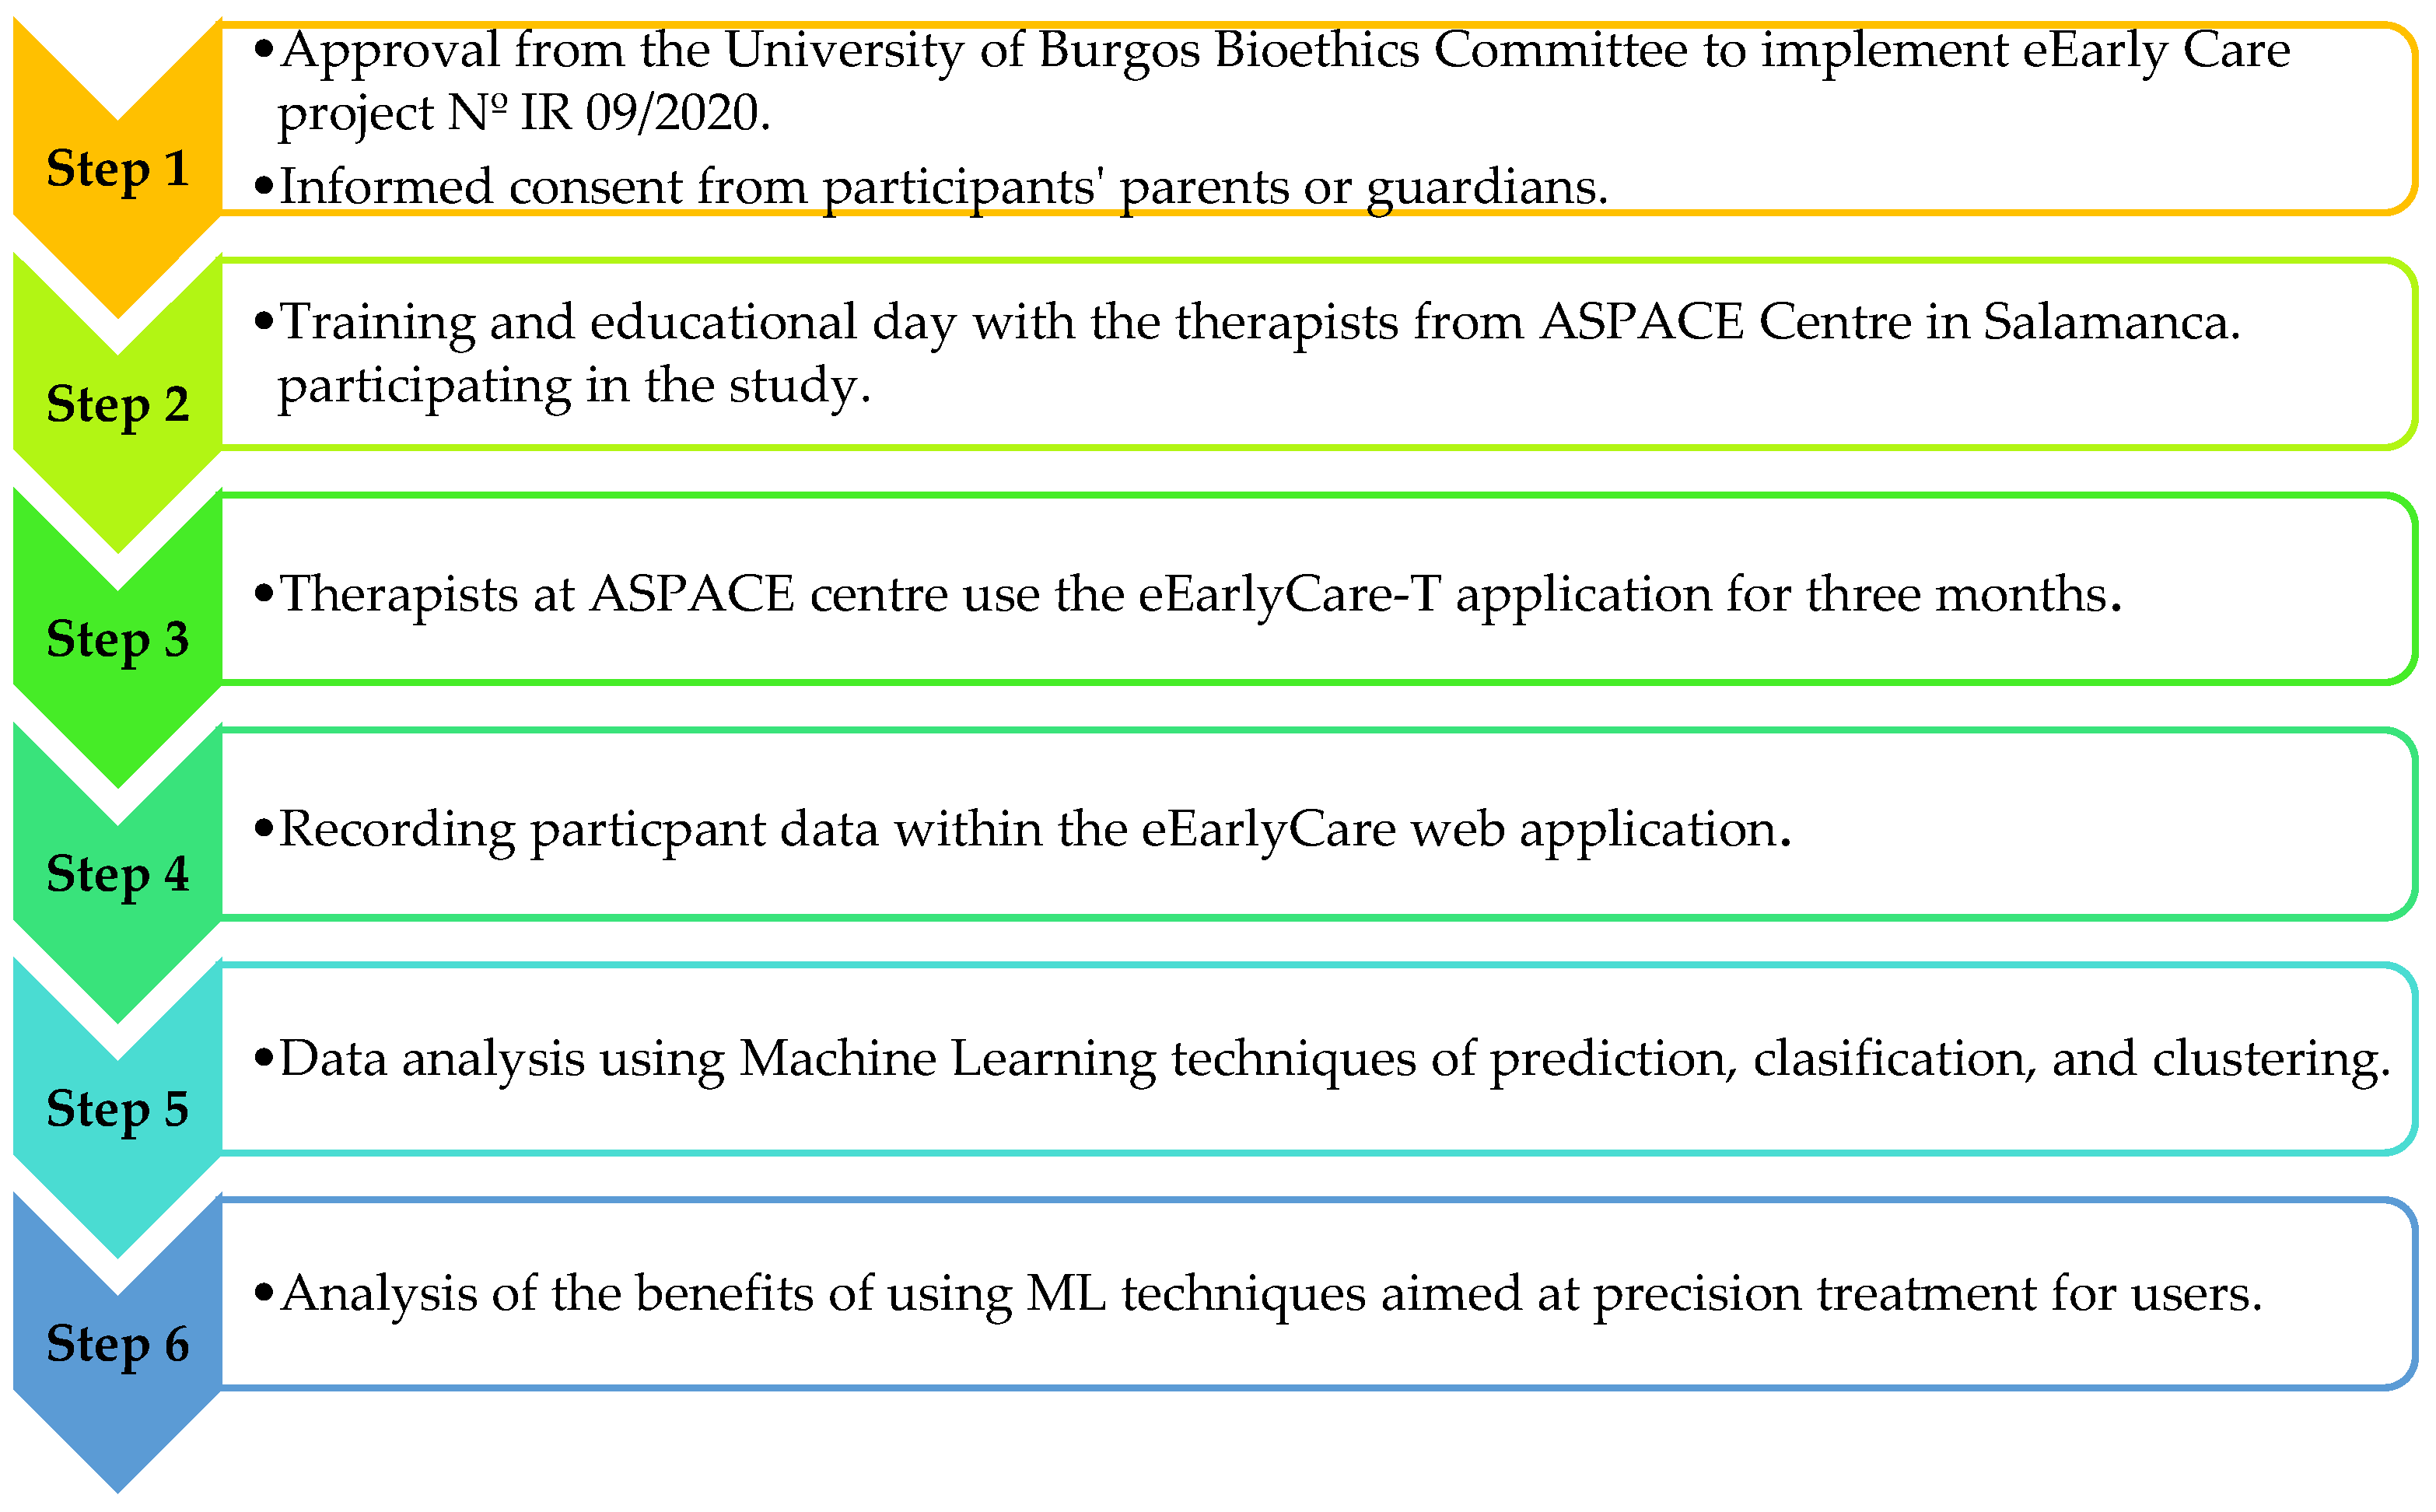
2.4. Procedure
2.5. Data Analysis
3. Results
3.1. Analysing the Functionality of Using Supervised Machine Learning Techniques for Prediction in the Group Amenable to Early Care
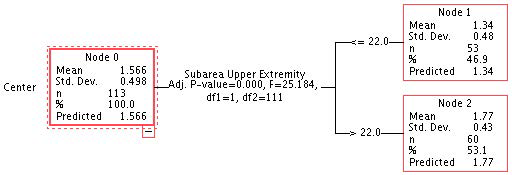
3.2. Analysing the Functionality of Using Supervised Machine Learning Techniques for Classification in the Group Amenable to Early Care
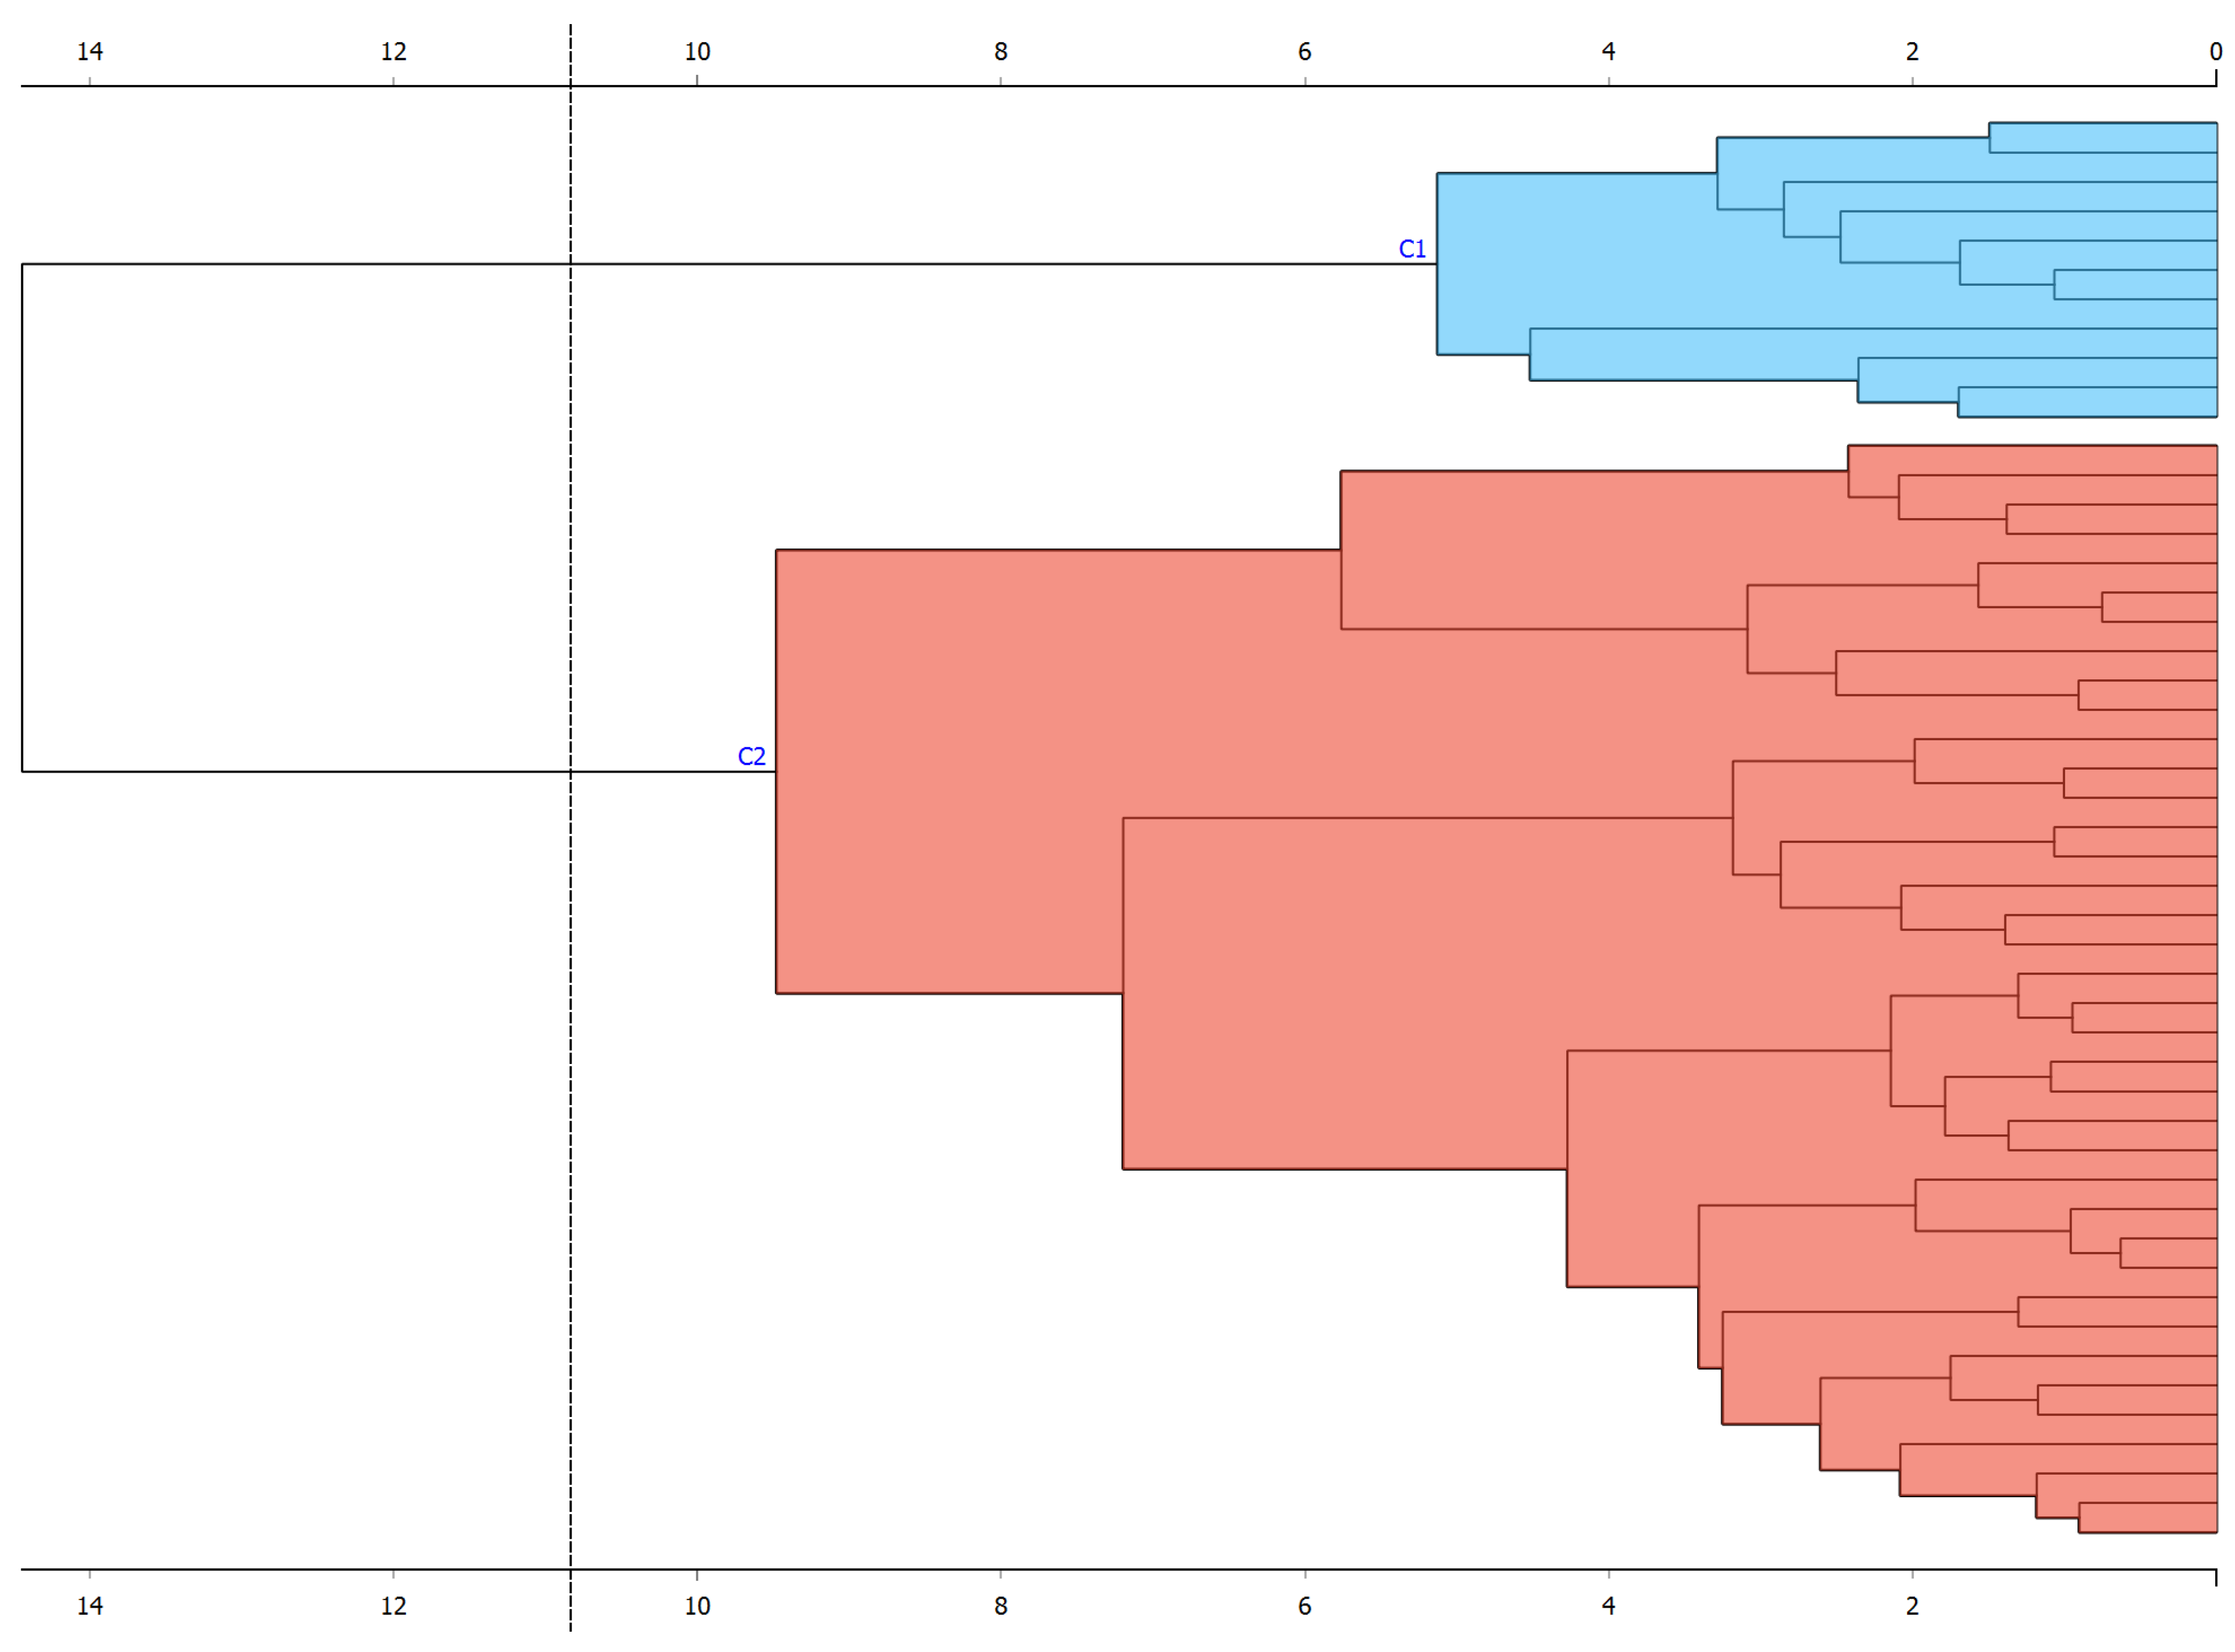
3.3. Analysing the Functionality of Using Unsupervised Machine Learning Clustering Techniques in the Group Amenable to Early Care
4. Discussion
4.1. Limitations of this Study
4.2. Future Lines of Intervention
5. Conclusions
Supplementary Materials
Author Contributions
Funding
Institutional Review Board Statement
Informed Consent Statement
Data Availability Statement
Acknowledgments
Conflicts of Interest
References
- Blackman, J.A. Early Intervention: A Global Perspective. Infants Young Child. 2002, 15, 11–19. [Google Scholar] [CrossRef]
- Peterander, F.; Speck, O.; Pithon, G.; Terrisse, B. Les Tendances Actuelles de L’intervention Précoce en Europe; Mardaga Publishing House: Sprimont, Belgium, 1999. [Google Scholar]
- Federación Estatal de Asociaciones de Profesionales de Atención Temprana (GAT). Libro Blanco Atencion Temprana; Real Patron sobre Discapac: Madrid, Spain, 2005; Available online: http://bit.ly/3zgm2ph (accessed on 2 November 2023).
- Gómez Artiga, A.; Viguer Seguí, P.; Cantero López, M.J. Intervención Temprana: Desarrollo Óptimo de 0 a 6 Años [Early Intervention: Optimal Development from 0 to 6 Years of Age]; Psicología; Pirámide: Madrid, Spain, 2005. [Google Scholar]
- Anderson, R.G. Development of Business Information Systems; Blackwell Scientific Publication: Oxford, UK, 1987. [Google Scholar]
- Anderson, R.G. Information and Knowledge-Based Systems: An Introduction; Prentice Hall: New York, NY, USA, 1992. [Google Scholar]
- Siegler, E.L. The evolving medical record. Ann. Intern. Med. 2010, 153, 671–677. [Google Scholar] [CrossRef] [PubMed]
- Dick, R.S.; Steen, E.B.; Detmer, D.E. The Computer-Based Patient Record: An Essential Technology for Bealth Care; National Academies Press: Washington, DC, USA, 1997. [Google Scholar]
- Aspden, P.; Corrigan, J.M.; Wolcott, J.; Erickson, S.M. Committee on Data Standards for Patient Safety: Achieving a New Standard for Care; Institute of Medicine: Washington, DC, USA, 2004. [Google Scholar] [CrossRef]
- Schiff, G.D.; Bates, D.W. Can electronic clinical documentation help prevent diagnostic errors? N. Engl. J. Med. 2010, 25, 1066–1069. [Google Scholar] [CrossRef] [PubMed]
- Sierra, I.; Díaz-Díaz, N.; Barranco, C.; Carrasco-Villalón, R. Artificial Intelligence-Assisted Diagnosis for Early Intervention Patients. Appl. Sci. 2022, 12, 8953. [Google Scholar] [CrossRef]
- Su, J.; Yang, W. Artificial intelligence in early childhood education: A scoping review. Comput. Educ. Artif. Intell. 2022, 3, 100049. [Google Scholar] [CrossRef]
- Chan, S.; Ding, Z.; Lee, T.-l.; Sze, S.L.; Yang, N.S. Temporal processing deficit in children with attention-deficit/hyperactivity disorder: An online assessment. Digit. Health 2022, 8, 20552076221120325. [Google Scholar] [CrossRef]
- Makhni, S.; Chin, M.H.; Fahrenbach, J.; Rojas, J.C. Equity Challenges for Artificial Intelligence Algorithms in Health Care. Chest 2022, 161, 1343–1346. [Google Scholar] [CrossRef]
- Eloranta, S.; Boman, M. Predictive models for clinical decision making: Deep dives in practical machine learning. J. Intern. Med. 2022, 292, 278–295. [Google Scholar] [CrossRef] [PubMed]
- Alcantud-Marín, F.; Pérez-Bou, J.; Alonso-Esteban, Y. Diagnostic validity of the Merrill Palmer-R Development Scale used in the evaluation of access to Child Development Centers and Early Care. Siglo Cero 2019, 50, 53–73. [Google Scholar] [CrossRef]
- Al-rawashdeh, M.; Keikhosrokiani, P.; Belaton, B.; Alawida, M.; Zwiri, A. IoT Adoption and Application for Smart Healthcare: A Systematic Review. Sensors 2022, 22, 5377. [Google Scholar] [CrossRef]
- Sáiz-Manzanares, M.C. Using Machine Learning Techniques in eEarlyCare Precision Diagnosis and Intervention in 0–6 years Old. In Proceedings of the International Joint Conference 16th International Conference on Computational Intelligence in Security for Information Systems (CISIS 2023) 14th International Conference on EUropean Transnational Education (ICEUTE 2023), Salamanca, Spain, 5–7 September 2023; CISIS ICEUTE 2023; Lecture Notes in Networks and Systems. García Bringas, P., García, H.P., de Pisón, F.J.M., Álvarez, F.M., Lora, A.T., Herrero, Á., Rolle, J.L.C., Quintián, H., Corchado, E., Eds.; Springer: Cham, Switzerland, 2023; Volume 748, pp. 294–305. [Google Scholar] [CrossRef]
- Alotaibi, G.; Awawdeh, M.; Farook, F.F.; Aljohani, M.; Aldhafiri, R.M.; Aldhoayan, M. Artificial intelligence (AI) diagnostic tools: Utilizing a convolutional neural network (CNN) to assess periodontal bone level radiographically—A retrospective study. BMC Oral Health 2022, 22, 399. [Google Scholar] [CrossRef] [PubMed]
- Chen, X.; Cheng, G.; Wang, F.L.; Tao, X.; Xie, H.; Xu, L. Machine and cognitive intelligence for human health: Systematic review. Brain Inform. 2022, 9, 5. [Google Scholar] [CrossRef] [PubMed]
- Ryabko, D. Algorithmic Learning Theory. In Proceedings of the 27th International Conference, ALT 2016, Bari, Italy, 19–21 October 2016; pp. 253–260. [Google Scholar] [CrossRef]
- Maudes, J.; Rodríguez, J.J.; García-Osorio, C.; García-Pedrajas, N. Random feature weights for decision tree ensemble construction. Inf. Fusion 2012, 13, 20–30. [Google Scholar] [CrossRef]
- Arnaiz-González, Á.; Díez-Pastor, J.F.; Rodríguez, J.J.; García-Osorio, C. Instance selection for regression: Adapting DROP. Neurocomputing 2016, 201, 66–81. [Google Scholar] [CrossRef]
- Manickam, P.; Mariappan, S.A.; Murugesan, S.M.; Hansda, S.; Kaushik, A.; Shinde, R.; Thipperudraswamy, S.P. Artificial Intelligence (AI) and Internet of Medical Things (IoMT) Assisted Biomedical Systems for Intelligent Healthcare. Biosensors 2022, 12, 562. [Google Scholar] [CrossRef] [PubMed]
- Parida, P.K.; Dora, L.; Swain, M.; Agrawal, S.; Panda, R. Data science methodologies in smart healthcare: A review. Health Technol. 2022, 12, 329–344. [Google Scholar] [CrossRef]
- Lin, B.; Wu, S. Digital Transformation in Personalized Medicine with Artificial Intelligence and the Internet of Medical Things. Omics J. Integr. Biol. 2022, 26, 77–81. [Google Scholar] [CrossRef]
- Chen, X.; Zhang, R.; Tang, X.; Qian, J. Prediction of Pediatric Sepsis Using a Deep Encoding Network with Cross Features. J. Shanghai Jiaotong Univ. (Sci.) 2022, 29, 131–140. [Google Scholar] [CrossRef]
- Jones, M.N. Big Data in Cognitive Science; Routledge: New York, NY, USA, 2017. [Google Scholar] [CrossRef]
- Zhou, S.; Zhao, J.; Zhang, L. Application of Artificial Intelligence on Psychological Interventions and Diagnosis: An Overview. Front. Psychiatry 2022, 13, 811665. [Google Scholar] [CrossRef]
- Liu, Q.; Vaci, N.; Koychev, I.; Kormilitzin, A.; Li, Z.; Cipriani, A. Personalised treatment for cognitive impairment in dementia: Development and validation of an artificial intelligence model. BMC Med. 2022, 20, 45. [Google Scholar] [CrossRef]
- Alty, J.; Bai, Q.; Li, R.; Lawler, K.; St George, R.J.; Hill, E.; Bindoff, A.; Garg, S.; Wang, X.; Huang, G.; et al. The TAS Test project: A prospective longitudinal validation of new online motor-cognitive tests to detect preclinical Alzheimer’s disease and estimate 5-year risks of cognitive decline and dementia. BMC Neurol. 2022, 22, 266. [Google Scholar] [CrossRef]
- Nichol, B.A.B.; Hurlbert, A.C.; Read, J.C.A. Predicting attitudes towards screening for neurodegenerative diseases using OCT and artificial intelligence: Findings from a literature review. J. Public Health Res. 2022, 11, 22799036221127627. [Google Scholar] [CrossRef]
- Aldhyani, T.H.H.; Alsubari, S.N.; Alshebami, A.S.; Alkahtani, H.; Ahmed, Z.A.T. Detecting and Analyzing Suicidal Ideation on Social Media Using Deep Learning and Machine Learning Models. Int. J. Environ. Res. Public Health 2022, 19, 2635. [Google Scholar] [CrossRef]
- Dey, S.; Chakraborty, P.; Kwon, B.C.; Dhurandhar, A.; Ghalwash, M.; Saiz, F.J.S.; Ng, K.; Sow, D.; Varshney, K.R.; Meyer, P. Human-centered explainability for life sciences, healthcare, and medical informatics. Patterns 2022, 3, 100493. [Google Scholar] [CrossRef]
- Spathis, D.; Perez-Pozuelo, I.; Marques-Fernandez, L.; Mascolo, C. Breaking away from labels: The promise of self-supervised machine learning in intelligent health. Patterns 2022, 3, 100410. [Google Scholar] [CrossRef] [PubMed]
- Dawoud, A.; Ihab Zakaria, Z.; Hisham Rashwan, H.; Braoudaki, M.; Youness, R.A. Circular RNAs: New layer of complexity evading breast cancer heterogeneity. Non-Coding RNA Res. 2023, 8, 60–74. [Google Scholar] [CrossRef] [PubMed]
- Zhu, K.; Wu, J.; Li, G.; Chen, X.; Luo, M.Y. A model and cooperative co-evolution algorithm for identifying driver pathways based on the integrated data and PPI network. Expert Syst. Appl. 2023, 212, 118753. [Google Scholar] [CrossRef]
- Li, J.; Zhang, Y.; Liu, S.; Li, W.; Sun, Y.; Cao, H.; Wang, S.; Meng, J. A network pharmacology integrated pharmacokinetics strategy to investigate the pharmacological mechanism of absorbed components from crude and processed Zingiberis Rhizoma on deficiency-cold and hemorrhagic syndrome. J. Ethnopharmacol. 2023, 301, 115754. [Google Scholar] [CrossRef]
- Sáiz-Manzanares, M.C.; Marticorena-Sánchez, R.; Arnaiz-González, Á. Improvements for Therapeutic Intervention from the Use of Web Applications and Machine Learning Techniques in Different Affectations in Children Aged 0–6 Years. Int. J. Environ. Res. Public Health 2022, 19, 6558. [Google Scholar] [CrossRef]
- Campbell, D.F.; Stanley, J. Diseños Experimentales y Cuasiexperimentales en la Investigación Social; 9a reimp; Amorrortu: Buenos Aires, Argentina, 2005. [Google Scholar]
- Josse, D. Scale of Psychomotor Development of Early Childhood Brunet Lézine-Revised; Psymtéc: Madrid, Spain, 1997. [Google Scholar]
- Newborg, J. Battelle Developmental Inventory Examiner’s Manual; Riverside: Itasca, IL, USA, 2005. [Google Scholar]
- Haley, S.M.; Coster, W.J.; Ludlow, L.H.; Haltiwanger, J.T.; Andrellos, P. The Pediatric Evaluation of Disability Inventory (PEDI), 2nd ed.; Pearson Clinical Assessment: Washington, WA, USA, 2012. [Google Scholar]
- Bluma, M.S.; Shearer, M.S.; Frohman, A.H.; Hilliard, J. Portage Guide to Early Education, 2nd ed.; Cooperative Educational Service Agency: Pewaukee, WI, USA, 1978.
- IBM Corp. SPSS Statistical Package for the Social Sciences (SPSS), Version 28; IBM Corp: Armonk, NY, USA, 2023. [Google Scholar]
- Demšar, J.; Curk, T.; Erjavec, A.; Gorup, Č.; Hočevar, T.; Milutinovič, M.; Možina, M.; Polajnar, M.; Toplak, M.; Starič, A.; et al. Orange: Data Mining Toolbox in Python. J. Mach. Learn. Res. 2013, 14, 2349–2353. Available online: http://jmlr.org/papers/v14/demsar13a.html (accessed on 1 November 2023).


| Techniques | Algorithms That Apply | Use in Health Sciences | Techniques |
|---|---|---|---|
| Supervised ML Techniques | |||
| Classification | |||
| SVM | Based on Vapnik’s theory [21]. In two linearly separated classes, the best boundary between two classes is searched. In non-linear functions, the kernel trick is applied. | Facilitates visual analysis | |
| Discriminant Analysis | Describe whether there are significant differences in x groups and variables. It is a prediction model of a categorical response variable, x, from y classifier variables that are usually continuous. | Detection of proxy variables to adjust a diagnosis or best treatment | Facilitates visual analysis |
| Nearest Neighbour | A non-parametric classification and regression method that estimates the probability density function that an element, x, belongs to a class, Ci. It is known as a lazy technique. The most frequently applied distance is Euclidean. | Can help in grouping types of patients within a pathology in relation to the degree of involvement. May also help in pooling the effectiveness of different types of treatment in different types of patients. | Facilitates visual analysis |
| Decision Tree | An algorithm that detects the influence of a series of variables (independent) on other variables (dependent) in a hierarchical order. It is quick to build, interpretable, and sensitive to small changes. It can construct multiclassifiers [22] and regressors [23]. | Can detect the most effective treatment among the possible treatments or the part of a treatment in a hierarchical order of percentage explained with respect to the results of an intervention. | Facilitates a visual analysis that is highly intuitive. |
| Neural Networks | Computational models that emulate human neural functioning. They include: Multi-layer Perceptron NN. Can solve problems that are not linearly separable. Outputs can be imprecise. Radial-Based Neural Networks. They can construct linear and non-linear approximations. | Used to solve problems of pattern association, image segmentation or data understanding. Time series analysis, image processing, speech recognition, and diagnostics. | Facilitates visual analysis |
| Prediction | |||
| Linear regression | A model used to approximate the relationship between continuous variables, a dependent variable, other independent variables, and an error variable. | Can help predict the effect of a risk factor on the development of a pathology or the effect of a type of treatment on the symptoms and progression of a pathology. Applied to variables that are measured on an interval or ratio scale. | Facilitates visual analysis |
| Logistic regression | A similar model to linear regression that predicts the outcome of a categorical variable with respect to predictor variables. It examines binomially distributed data. | Can help predict the effect of a risk factor on the development of a pathology or the effect of a type of treatment on the symptoms and progression of a pathology. Applied to variables that are measured on a dichotomous scale. | Facilitates visual analysis |
| Unsupervised ML techniques | |||
| Clustering | |||
| k-means | Allows the assignment of an element to a cluster without applying a prior clustering variable. The assignment is made with the closest distance to the centre of that cluster. The disadvantage is that the algorithm tends to form groups of similar sizes. | Allows the determination of groupings of patients without a previously defined independent variable with respect to different measurements in different relevant parameters. | It facilitates a visual analysis that is highly intuitive in this case. |
| k-means ++ | Solve the k-means NP hard problem. To do so, apply a polynomial transformation and then run the cluster centre assignment algorithm. | Allows for a tighter distribution of the grouping of patients without a pre-defined independent variable for different measurements on different relevant parameters. | Facilitates a visual analysis that is highly intuitive in this case. |
| Study Objectives | Data Analysis Tests |
|---|---|
| 1. To analyse the functionality of using supervised machine learning techniques for prediction. | Supervised machine learning prediction technique: linear regression |
| 2. To analyse the functionality of using supervised machine learning for classification. | Supervised machine learning technique for classification: decision tree (CHAID algorithm) Cross-tabulation table |
| 3. To analyse the functionality of using unsupervised machine learning clustering techniques. | Unsupervised machine learning technique: k-means clustering; hierarchical clustering cross-tabulation table principal component analysis (PCA) (elbow method). |
| Group | Node | |||
|---|---|---|---|---|
| 1 | % | 2 | % | |
| n = 53 | n = 60 | |||
| 1 | 35 | 30.97 | 14 | 12.39 |
| 2 | 18 | 15.93 | 46 | 40.71 |
| Total | 53 | 46.90 | 60 | 53.10 |
| FSMS Areas and Sub-Areas | Cluster 1 | Cluster 2 | F | p |
|---|---|---|---|---|
| n = 35 | n = 14 | |||
| Food autonomy | 12 | 29 | 74.16 | <0.001 * |
| Personal care and hygiene | 25 | 56 | 64.21 | <0.001 * |
| Dressing and undressing autonomy | 18 | 52 | 83.52 | <0.001 * |
| Sphincter control | 8 | 24 | 91.45 | <0.001 * |
| Functional mobility | 59 | 133 | 58.48 | <0.001 * |
| Communication and language | 24 | 43 | 21.88 | <0.001 * |
| Task solving in social contexts | 9 | 13 | 4.52 | 0.04 * |
| Interactive and symbolic play | 11 | 26 | 11.28 | <0.001 * |
| Routines in daily life | 3 | 7 | 10.69 | <0.001 * |
| Adaptive behaviour | 11 | 13 | 0.40 | 0.53 |
| Attention | 4 | 5 | 0.47 | 0.50 * |
| Age Group | Cluster | |
|---|---|---|
| 1 n = 35 | 2 n = 14 | |
| 1 | 9 | 1 |
| 2 | 14 | 3 |
| 3 | 6 | 7 |
| 4 | 6 | 3 |
| FSMS Areas and Sub-Areas | Cluster 1 | Cluster 2 | F | p |
|---|---|---|---|---|
| n = 34 | n = 30 | |||
| Food autonomy | 31 | 13 | 109.84 | <0.001 * |
| Personal care and hygiene | 63 | 27 | 141.30 | <0.001 * |
| Dressing and undressing autonomy | 52 | 19 | 145.20 | <0.001 * |
| Sphincter control | 19 | 7 | 33.89 | <0.001 * |
| Functional mobility | 140 | 63 | 135.85 | <0.001 * |
| Communication and language | 39 | 20 | 58.32 | <0.001 * |
| Task solving in social contexts | 10 | 6 | 5.23 | 0.026 * |
| Interactive and symbolic play | 27 | 20 | 2.93 | 0.093 |
| Routines in daily life | 7 | 4 | 7.03 | 0.010 * |
| Adaptive behaviour | 14 | 11 | 1.65 | 0.204 |
| Attention | 5 | 5 | 0.008 | 0.929 |
| Diagnoses Type | Cluster | |
|---|---|---|
| 1 n = 34 | 2 n = 30 | |
| 1 | 4 | 10 |
| 2 | 3 | 6 |
| 3 | 4 | 8 |
| 4 | 2 | 6 |
| 5 | 15 | 0 |
| 6 | 5 | 0 |
| 7 | 1 | 0 |
Disclaimer/Publisher’s Note: The statements, opinions and data contained in all publications are solely those of the individual author(s) and contributor(s) and not of MDPI and/or the editor(s). MDPI and/or the editor(s) disclaim responsibility for any injury to people or property resulting from any ideas, methods, instructions or products referred to in the content. |
© 2024 by the authors. Licensee MDPI, Basel, Switzerland. This article is an open access article distributed under the terms and conditions of the Creative Commons Attribution (CC BY) license (https://creativecommons.org/licenses/by/4.0/).
Share and Cite
Sáiz-Manzanares, M.C.; Solórzano Mulas, A.; Escolar-Llamazares, M.C.; Alcantud Marín, F.; Rodríguez-Arribas, S.; Velasco-Saiz, R. Use of Digitalisation and Machine Learning Techniques in Therapeutic Intervention at Early Ages: Supervised and Unsupervised Analysis. Children 2024, 11, 381. https://doi.org/10.3390/children11040381
Sáiz-Manzanares MC, Solórzano Mulas A, Escolar-Llamazares MC, Alcantud Marín F, Rodríguez-Arribas S, Velasco-Saiz R. Use of Digitalisation and Machine Learning Techniques in Therapeutic Intervention at Early Ages: Supervised and Unsupervised Analysis. Children. 2024; 11(4):381. https://doi.org/10.3390/children11040381
Chicago/Turabian StyleSáiz-Manzanares, María Consuelo, Almudena Solórzano Mulas, María Camino Escolar-Llamazares, Francisco Alcantud Marín, Sandra Rodríguez-Arribas, and Rut Velasco-Saiz. 2024. "Use of Digitalisation and Machine Learning Techniques in Therapeutic Intervention at Early Ages: Supervised and Unsupervised Analysis" Children 11, no. 4: 381. https://doi.org/10.3390/children11040381
APA StyleSáiz-Manzanares, M. C., Solórzano Mulas, A., Escolar-Llamazares, M. C., Alcantud Marín, F., Rodríguez-Arribas, S., & Velasco-Saiz, R. (2024). Use of Digitalisation and Machine Learning Techniques in Therapeutic Intervention at Early Ages: Supervised and Unsupervised Analysis. Children, 11(4), 381. https://doi.org/10.3390/children11040381