
Master Regulators of Epithelial-Mesenchymal Transition and WNT Signaling Pathways in Juvenile Nasopharyngeal Angiofibromas

 ,
,  , and
, and
Abstract
: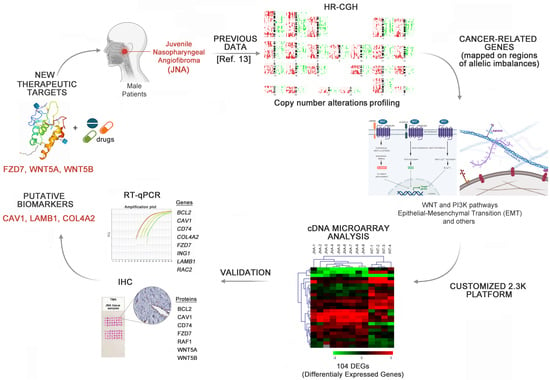
1. Introduction
2. Materials and Methods
2.1. Patients
2.2. RNA Extraction and Screening for the Identification of DEGs by cDNA Microarray Analysis
2.3. Gene Expression Analysis by Quantitative Reverse Transcription Polymerase Chain Reaction (RT-qPCR)
2.4. Tissue Microarray (TMA) Platform and Immunohistochemistry (IHC)
2.5. In Silico Analyses
3. Results
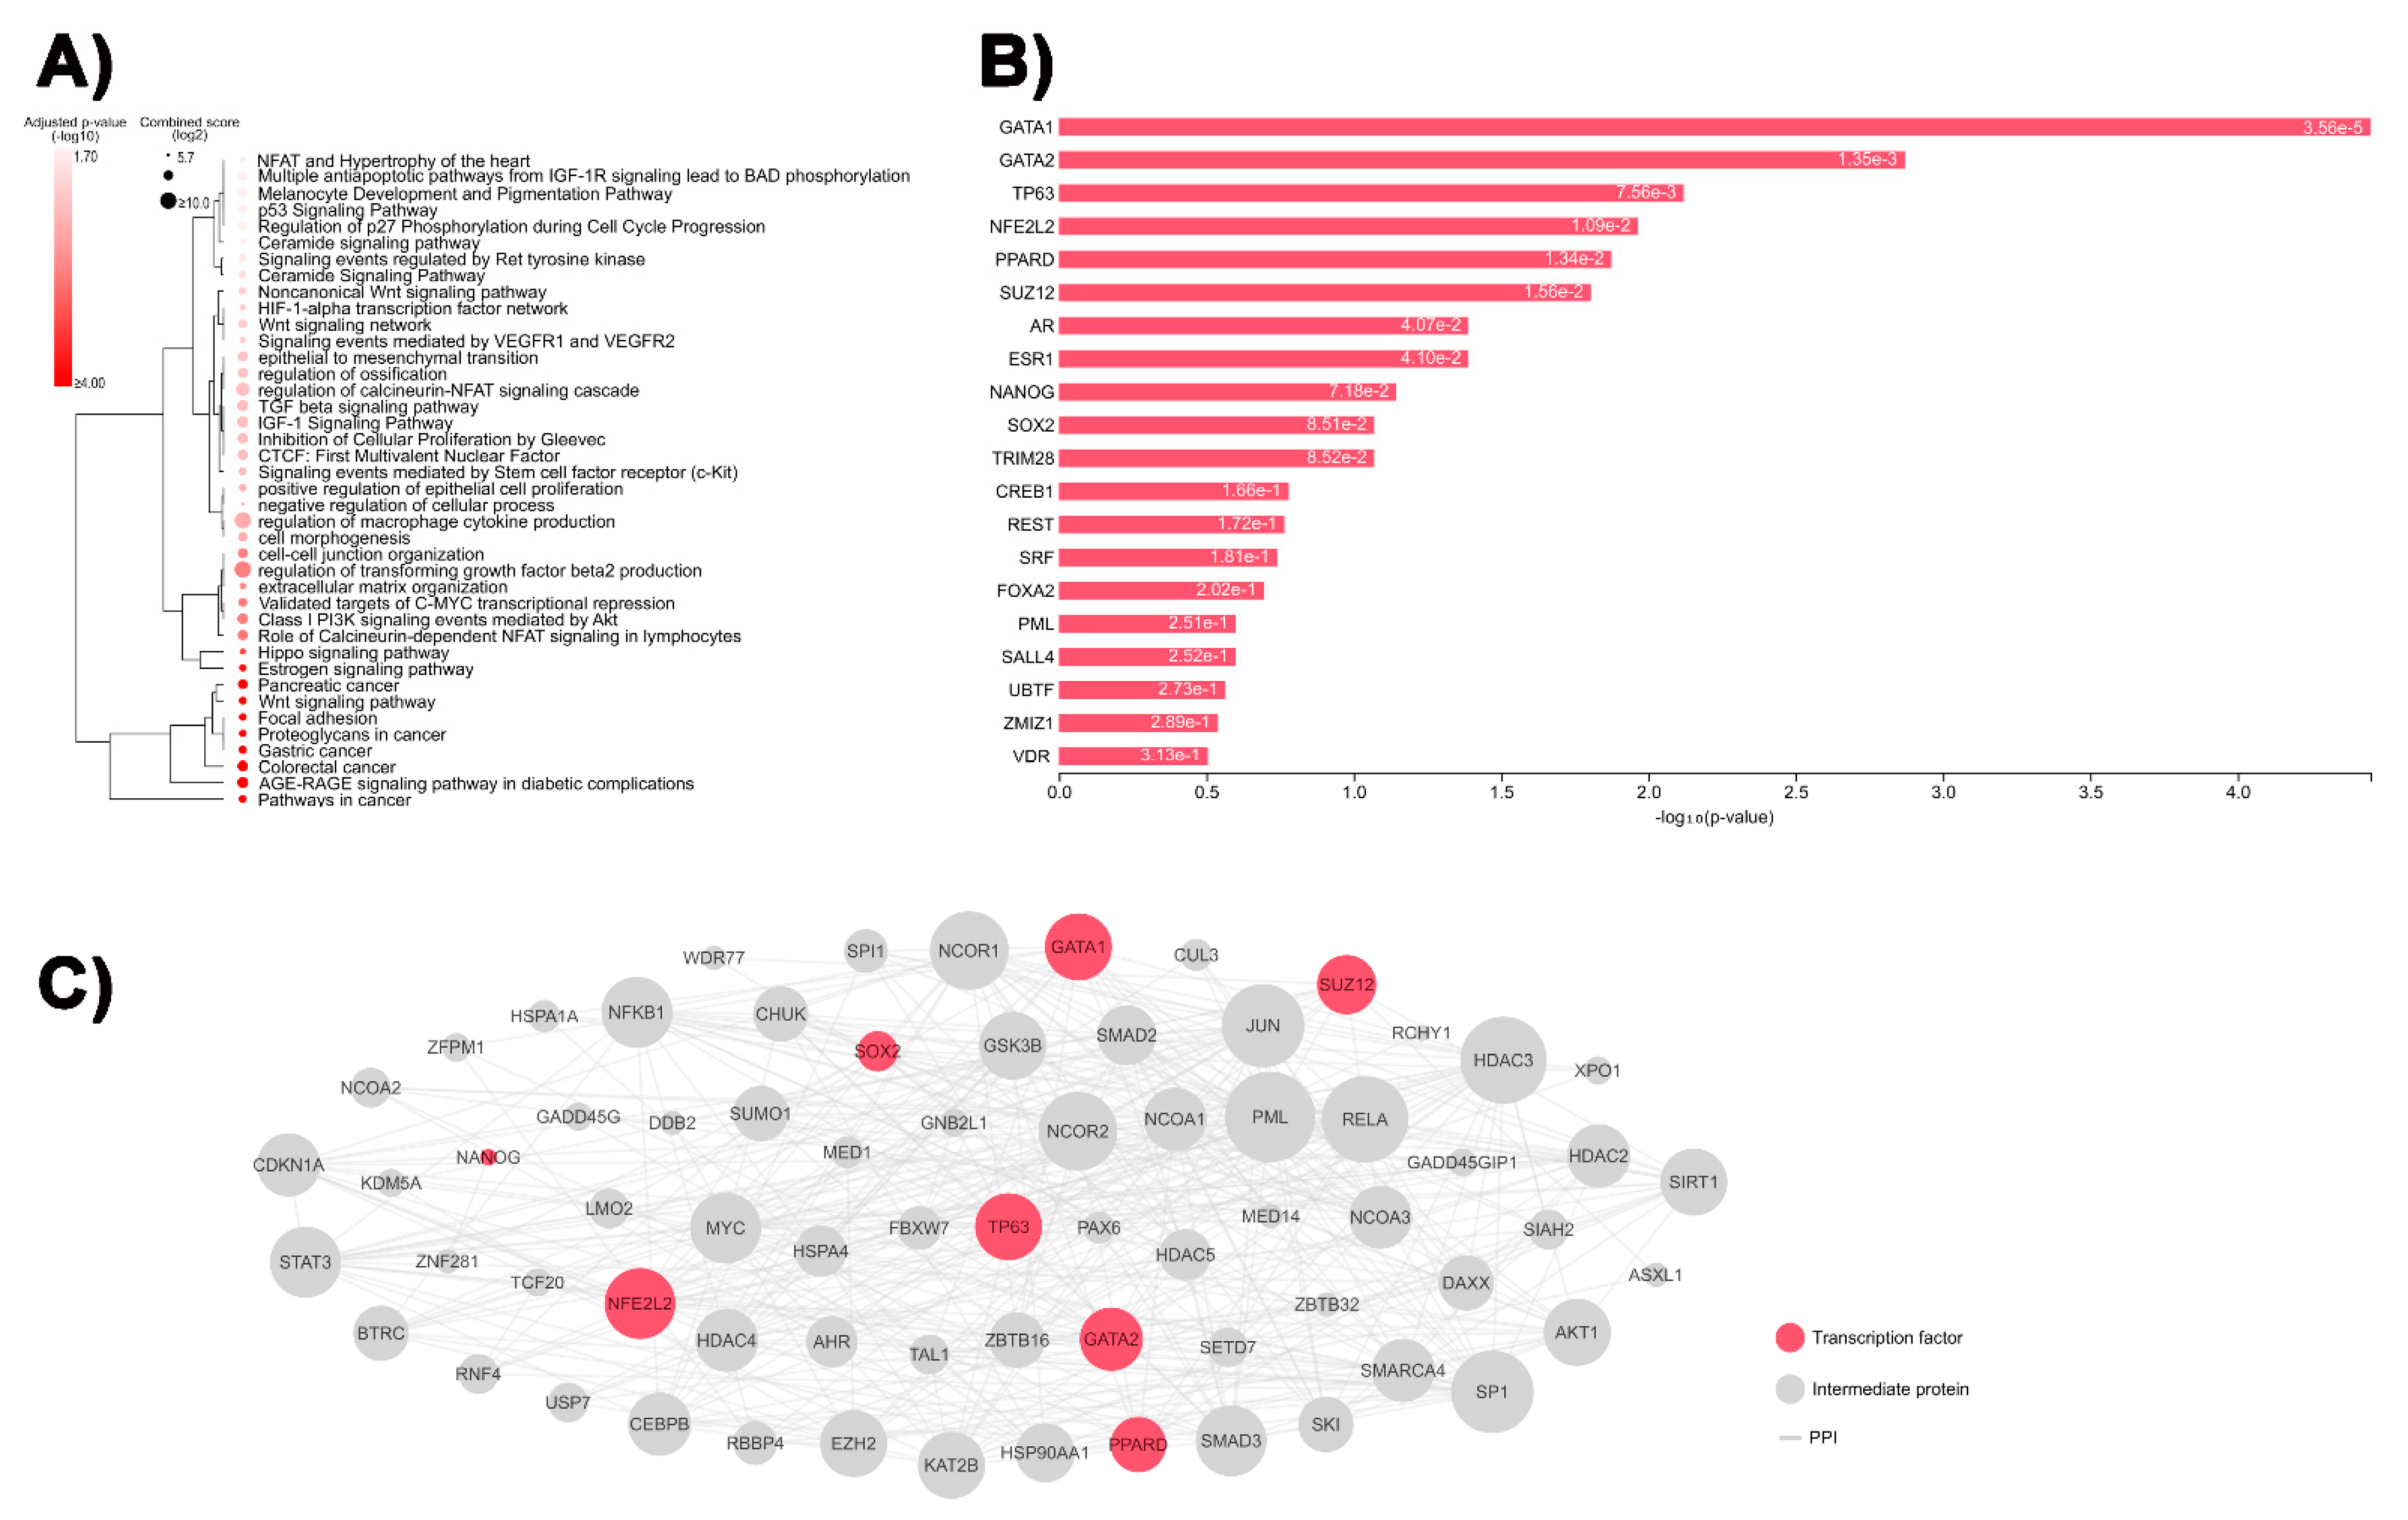
3.1. Identification of DEGs Involved in Tumor-Related Pathways and Biological Processes, and Their Putative Upstream Regulators
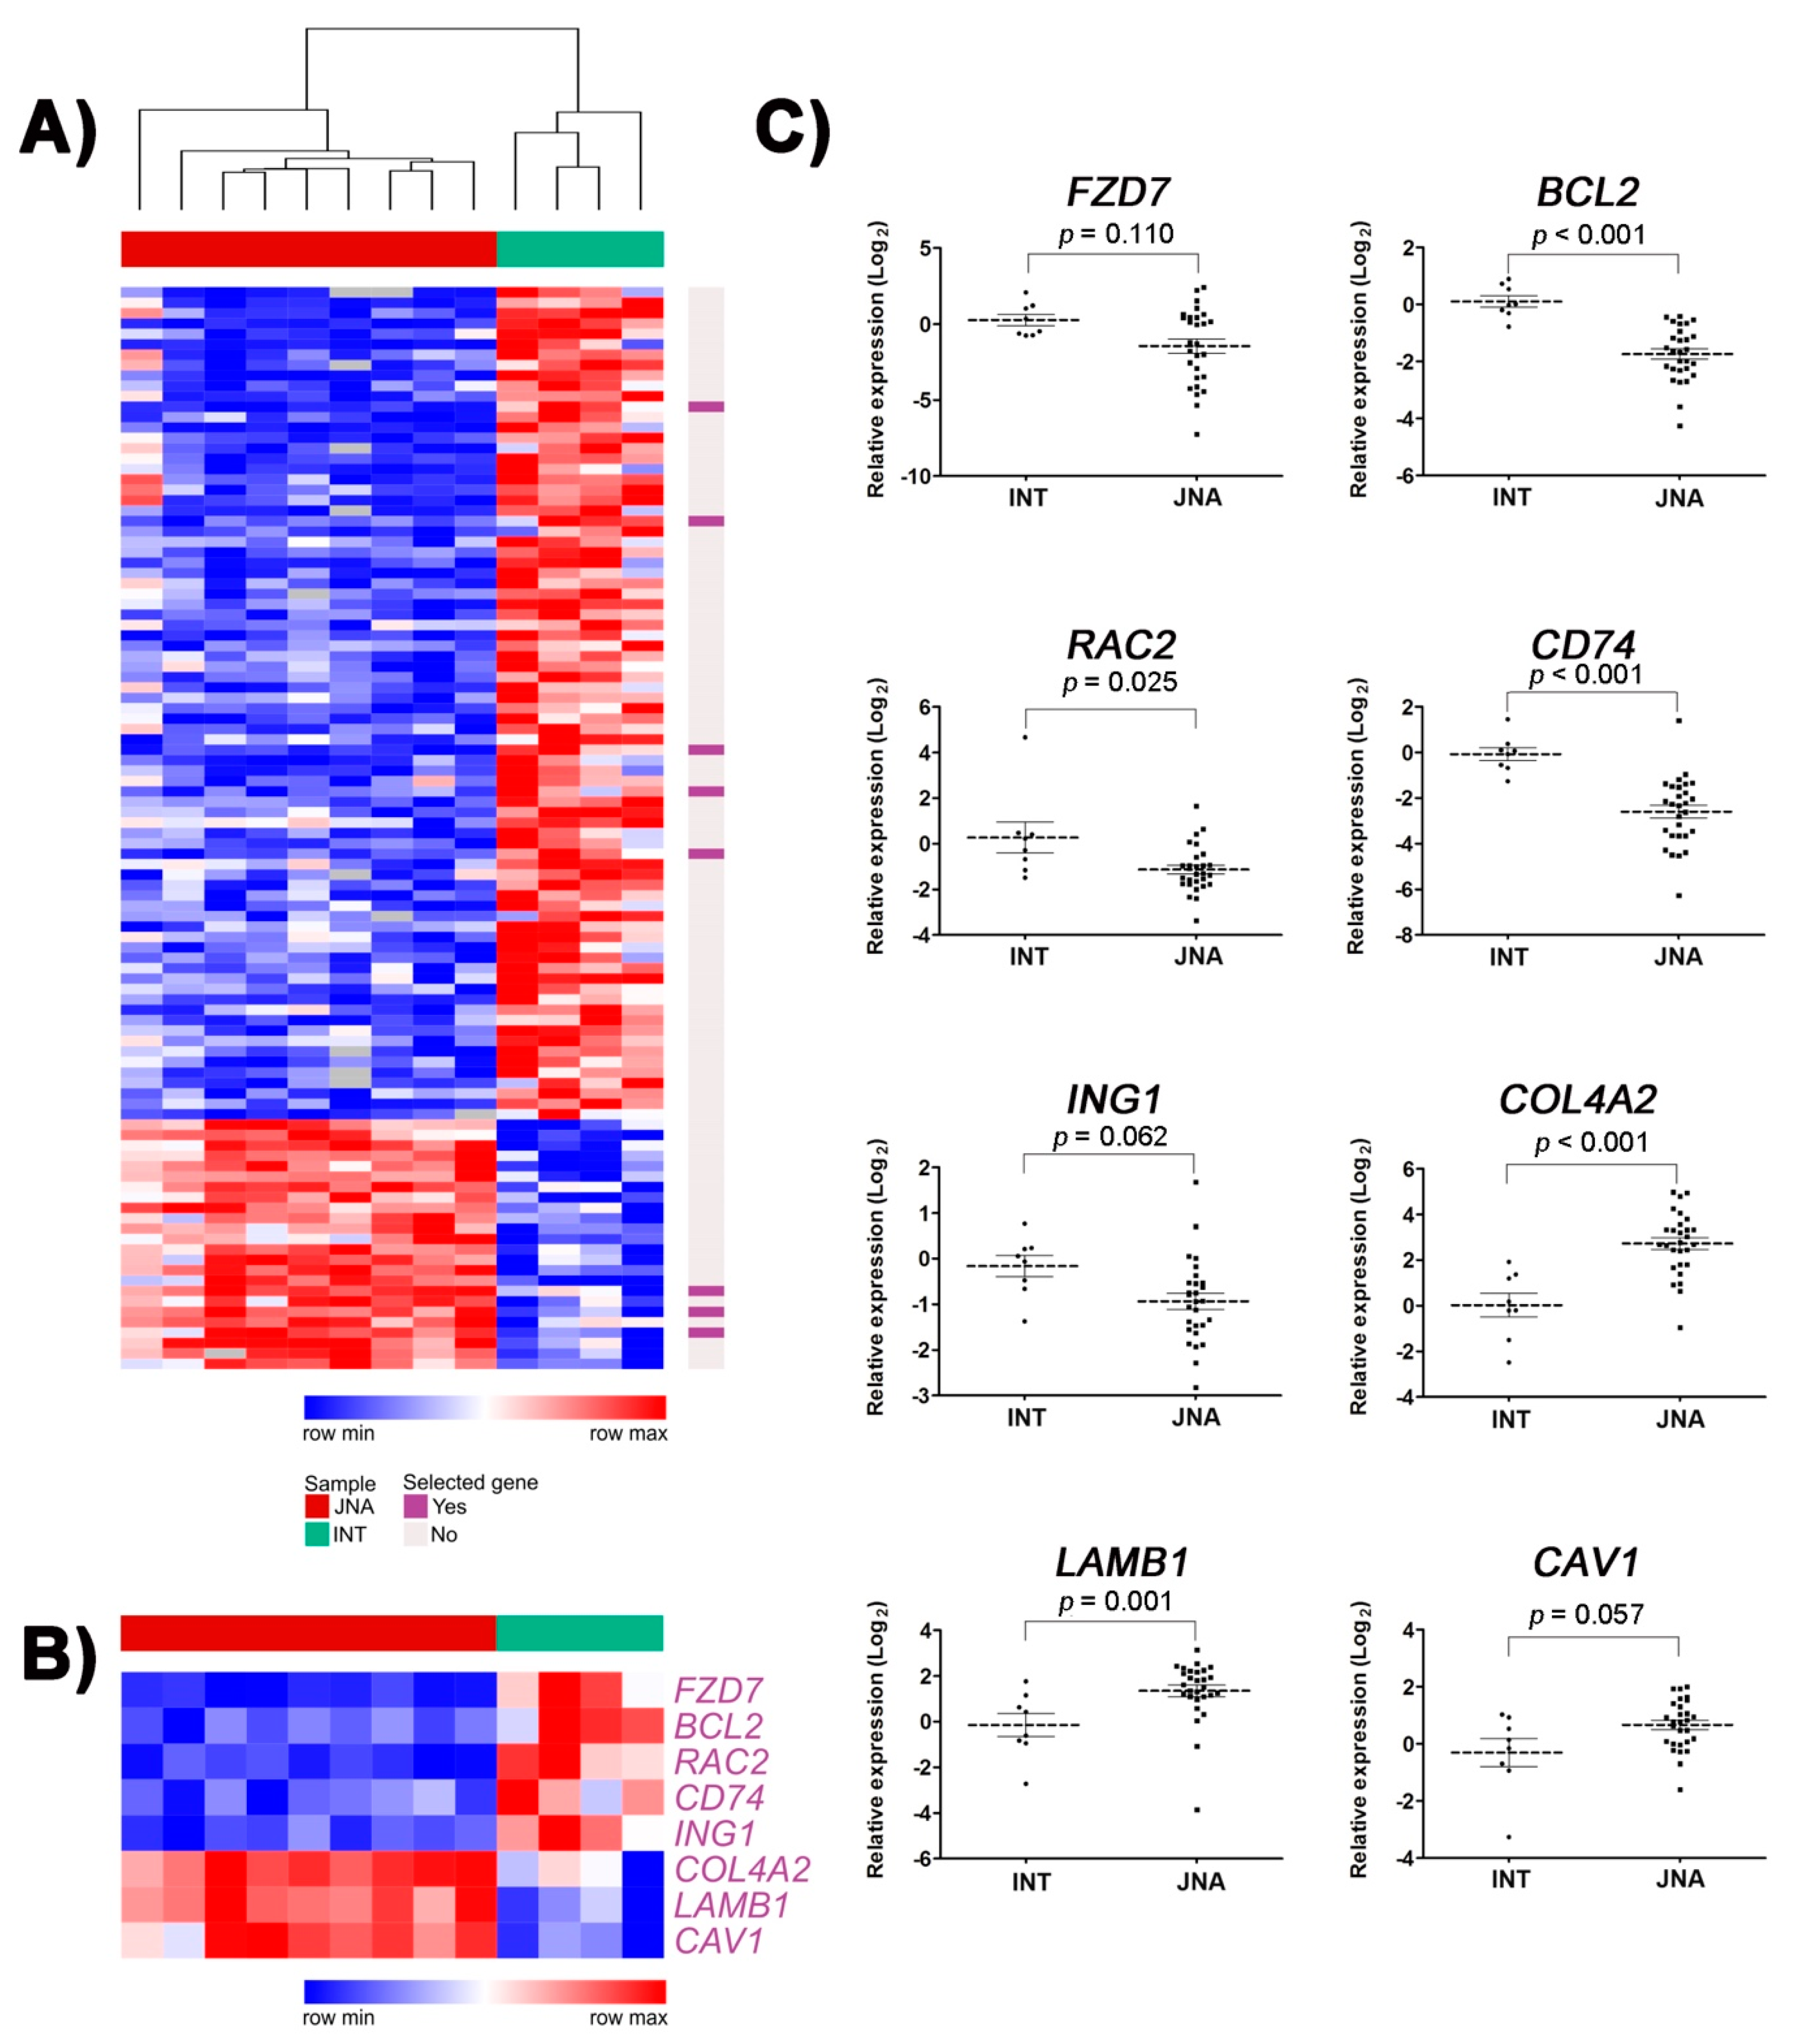
3.2. Validation of Selected DEGs by RT-qPCR
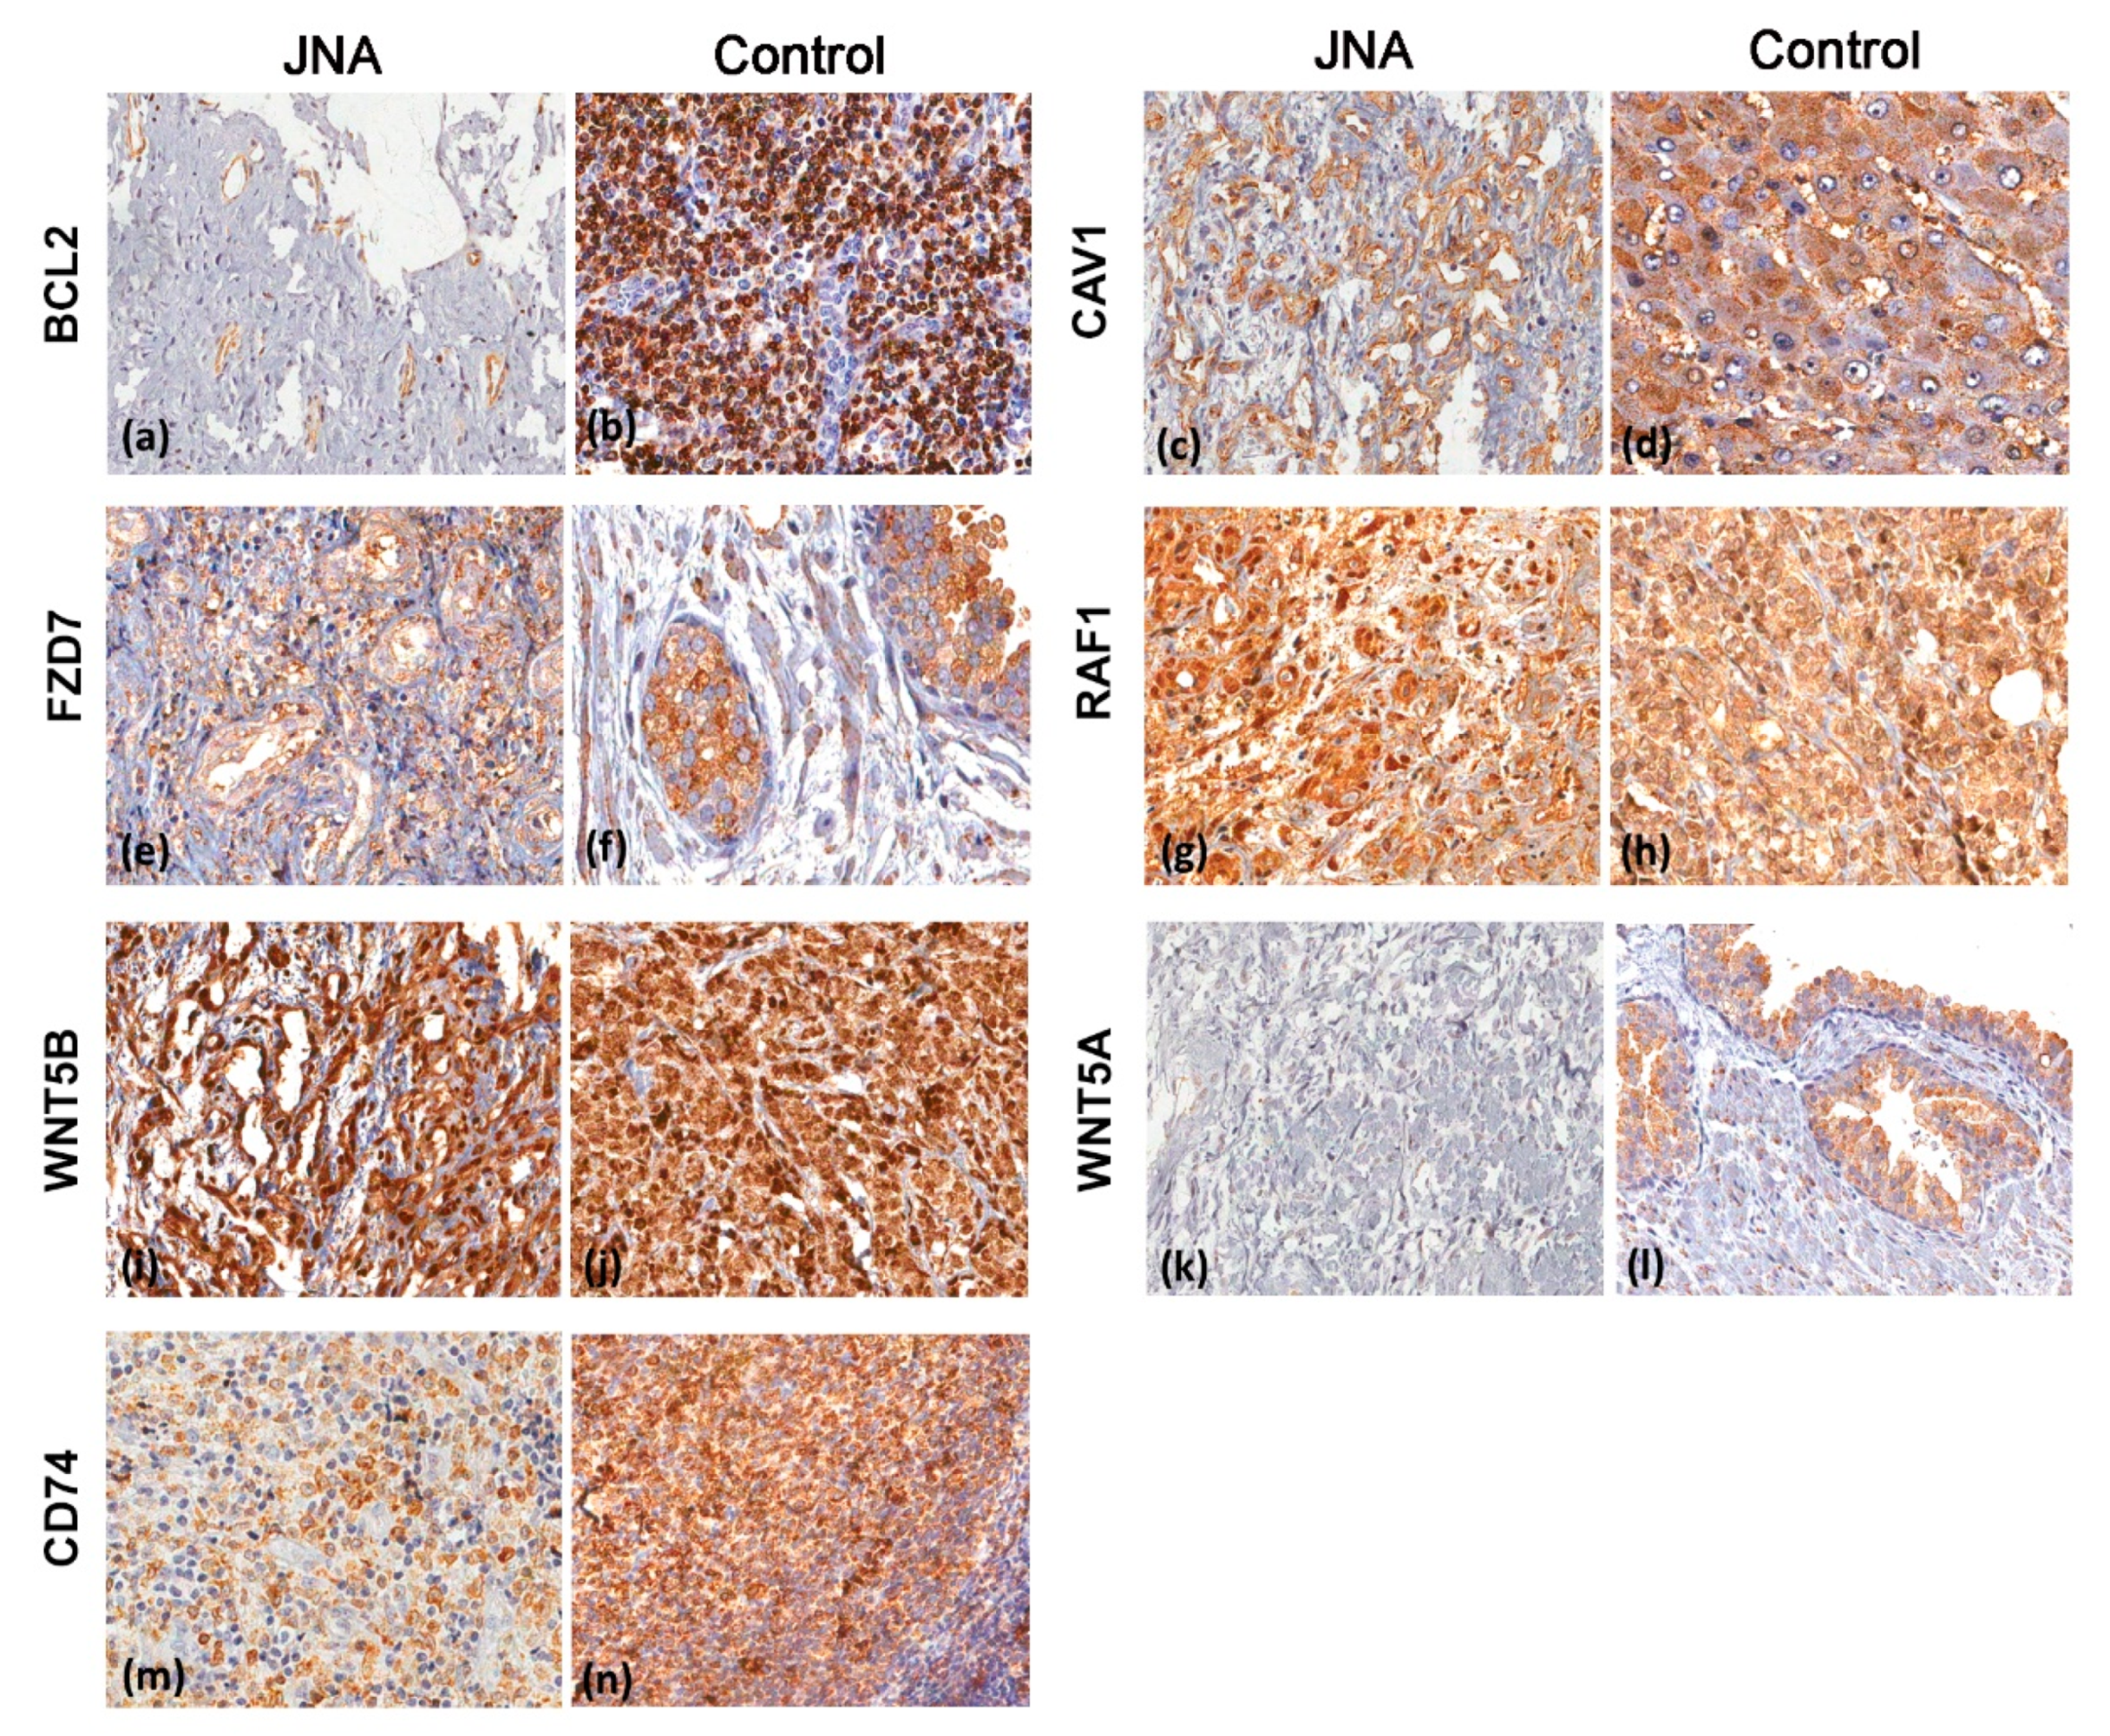
3.3. Immunohistochemistry Analyses
4. Discussion
5. Conclusions
Supplementary Materials
Author Contributions
Funding
Institutional Review Board Statement
Informed Consent Statement
Data Availability Statement
Acknowledgments
Conflicts of Interest
References
- McKnight, C.D.; Parmar, H.A.; Watcharotone, K.; Mukherji, S.K. Reassessing the Anatomic Origin of the Juvenile Nasopharyngeal Angiofibroma. J. Comput. Assist. Tomogr. 2017, 41, 559–564. [Google Scholar] [CrossRef] [PubMed]
- Gołąbek, W.; Szymańska, A.; Szymański, M.; Czekajska-Chehab, E.; Jargiełło, T. Juvenile Nasopharyngeal Angiofibroma with Intracranial Extension—Diagnosis and Treatment. Otolaryngol. Pol. 2019, 73, 1–7. [Google Scholar] [CrossRef] [PubMed]
- Tumours of the nasopharynx. In WHO Classification of Head and Neck Tumours; El-Naggar, A.K.; Chan, J.K.C.; Grandis, J.R.; Takata, T.; Slootweg, P. (Eds.) IARC: Lyon, France, 2017; ISBN 9789283224389. [Google Scholar]
- López, F.; Triantafyllou, A.; Snyderman, C.H.; Hunt, J.L.; Suárez, C.; Lund, V.J.; Strojan, P.; Saba, N.F.; Nixon, I.J.; Devaney, K.O.; et al. Nasal Juvenile Angiofibroma: Current Perspectives with Emphasis on Management. Head Neck 2017, 39, 1033–1045. [Google Scholar] [CrossRef]
- Coutinho-Camillo, C.M.; Brentani, M.M.; Nagai, M.A. Genetic Alterations in Juvenile Nasopharyngeal Angiofibromas. Head Neck 2008, 30, 390–400. [Google Scholar] [CrossRef]
- Dickinson, A.; Xu, M.; Silén, S.; Wang, Y.; Fu, Y.; Sadeghi, M.; Toppinen, M.; Carpén, T.; Hedman, K.; Mäkitie, A.; et al. Newly Detected DNA Viruses in Juvenile Nasopharyngeal Angiofibroma (JNA) and Oral and Oropharyngeal Squamous Cell Carcinoma (OSCC/OPSCC). Eur. Arch. Oto-Rhino-Laryngol. 2019, 276, 613–617. [Google Scholar] [CrossRef] [Green Version]
- Mishra, A.; Sachadeva, M.; Jain, A.; Shukla, N.M.; Pandey, A. Human Papilloma Virus in Juvenile Nasopharyngeal Angiofibroma: Possible Recent Trend. Am. J. Otolaryngol.-Head Neck Med. Surg. 2016, 37, 317–322. [Google Scholar] [CrossRef]
- Mishra, A.; Jaiswal, R.; Amita, P.; Mishra, S.C. Molecular Interactions in Juvenile Nasopharyngeal Angiofibroma: Preliminary Signature and Relevant Review. Eur. Arch. Oto-Rhino-Laryngol. 2019, 276, 93–100. [Google Scholar] [CrossRef]
- Song, X.; Yang, C.; Zhang, H.; Wang, J.; Sun, X.; Hu, L.; Liu, Z.; Wang, D. Hypoxia-Inducible Factor-1α (HIF-1α) Expression on Endothelial Cells in Juvenile Nasopharyngeal Angiofibroma: A Review of 70 Cases and Tissue Microarray Analysis. Ann. Otol. Rhinol. Laryngol. 2018, 127, 357–366. [Google Scholar] [CrossRef] [PubMed] [Green Version]
- Jones, J.W.; Usman, S.; New, J.; Holcomb, A.; Gunewardena, S.; Tawfik, O.; Hoover, L.; Bruegger, D.; Thomas, S.M. Differential Gene Expression and Pathway Analysis in Juvenile Nasopharyngeal Angiofibroma Using RNA Sequencing. Otolaryngol.—Head Neck Surg. 2018, 159, 572–575. [Google Scholar] [CrossRef]
- Pandey, P.; Mishra, A.; Tripathi, A.M.; Verma, V.; Trivedi, R.; Singh, H.P.; Kumar, S.; Patel, B.; Singh, V.; Pandey, S.; et al. Current Molecular Profile of Juvenile Nasopharyngeal Angiofibroma: First Comprehensive Study from India. Laryngoscope 2017, 127, E100–E106. [Google Scholar] [CrossRef] [PubMed]
- Doody, J.; Adil, E.A.; Trenor, C.C.; Cunningham, M.J. The Genetic and Molecular Determinants of Juvenile Nasopharyngeal Angiofibroma: A Systematic Review. Ann. Otol. Rhinol. Laryngol. 2019, 128, 1061–1072. [Google Scholar] [CrossRef]
- Silveira, S.M.; Domingues, M.A.C.; Butugan, O.; Brentani, M.M.; Rogatto, S.R. Tumor Microenvironmental Genomic Alterations in Juvenile Nasopharyngeal Angiofibroma. Head Neck 2012, 34, 485–492. [Google Scholar] [CrossRef]
- Xie, Y.; Su, N.; Yang, J.; Tan, Q.; Huang, S.; Jin, M.; Ni, Z.; Zhang, B.; Zhang, D.; Luo, F.; et al. FGF/FGFR Signaling in Health and Disease. Signal Transduct. Target. Ther. 2020, 5. [Google Scholar] [CrossRef]
- Katoh, M.; Katoh, M. FGF Signaling Network in the Gastrointestinal Tract (Review). Int. J. Oncol. 2006, 29, 163–168. [Google Scholar] [CrossRef] [Green Version]
- Shimokawa, T.; Furukawa, Y.; Sakai, M.; Li, M.; Miwa, N.; Lin, Y.-M.; Nakamura, Y. Involvement of the FGF18 Gene in Colorectal Carcinogenesis, as a Novel Downstream Target of the Beta-Catenin/T-Cell Factor Complex. Cancer Res. 2003, 63, 6116–6120. [Google Scholar]
- Kahn, M. Can We Safely Target the WNT Pathway? Nat. Rev. Drug Discov. 2014, 13, 513–532. [Google Scholar] [CrossRef] [Green Version]
- Schick, B. Genome-Wide Copy Number Profiling Using a 100K SNP Array Reveals Novel Disease-Related Genes BORIS and TSHZ1 in Juvenile Angiofibroma. Int. J. Oncol. 2011, 39, 1143–1151. [Google Scholar] [CrossRef]
- Renkonen, S.; Kankainen, M.; Hagström, J.; Haglund, C.; Monni, O.; Mäkitie, A.A. Systems-Level Analysis of Clinically Different Phenotypes of Juvenile Nasopharyngeal Angiofibromas. Laryngoscope 2012, 122, 2728–2735. [Google Scholar] [CrossRef] [PubMed]
- Nagai, M.A.; Butugan, O.; Logullo, A.; Brentani, M.M. Expression of Growth Factors, Proto-Oncogenes, and P53 in Nasopharyngeal Angiofibromas. Laryngoscope 1996, 106, 190–195. [Google Scholar] [CrossRef] [PubMed]
- Coutinho-Camillo, C.M.; Brentani, M.M.; Butugan, O.; Torloni, H.; Nagai, M.A. Relaxation of Imprinting of IGFII Gene in Juvenile Nasopharyngeal Angiofibromas. Diagn. Mol. Pathol. 2003, 12, 57–62. [Google Scholar] [CrossRef] [PubMed]
- Radkowski, D.; McGill, T.; Healy, G.B.; Ohlms, L.; Jones, D.T. Angiofibroma: Changes in Staging and Treatment. Arch. Otolaryngol.-Head Neck Surg. 1996, 122, 122–129. [Google Scholar] [CrossRef]
- Maschietto, M.; Trapé, A.P.; Piccoli, F.S.; Ricca, T.I.; Dias, A.A.M.; Coudry, R.A.; Galante, P.A.; Torres, C.; Fahhan, L.; Lourenço, S.; et al. Temporal Blastemal Cell Gene Expression Analysis in the Kidney Reveals New Wnt and Related Signaling Pathway Genes to Be Essential for Wilms’ Tumor Onset. Cell Death Dis. 2011, 2, e224. [Google Scholar] [CrossRef]
- Maschietto, M.; de Camargo, B.; Brentani, H.; Grundy, P.; Sredni, S.T.; Torres, C.; Mota, L.D.; Cunha, I.W.; Patrão, D.F.C.; Costa, C.M.L.; et al. Molecular Profiling of Isolated Histological Components of Wilms Tumor Implicates a Common Role for the Wnt Signaling Pathway in Kidney and Tumor Development. Oncology 2008, 75, 81–91. [Google Scholar] [CrossRef]
- Saeed, A.I.; Sharov, V.; White, J.; Li, J.; Liang, W.; Bhagabati, N.; Braisted, J.; Klapa, M.; Currier, T.; Thiagarajan, M.; et al. TM4: A Free, Open-Source System for Microarray Data Management and Analysis. Biotechniques 2003, 34, 374–378. [Google Scholar] [CrossRef] [Green Version]
- Tusher, V.G.; Tibshirani, R.; Chu, G. Significance Analysis of Microarrays Applied to the Ionizing Radiation Response. Proc. Natl. Acad. Sci. USA 2001, 98, 5116–5121. [Google Scholar] [CrossRef] [Green Version]
- Vandesompele, J.; De Preter, K.; Pattyn, F.; Poppe, B.; Van Roy, N.; De Paepe, A.; Speleman, F. Accurate Normalization of Real-Time Quantitative RT-PCR Data by Geometric Averaging of Multiple Internal Control Genes. Genome Biol. 2002, 3, RESEARCH0034. [Google Scholar] [CrossRef] [PubMed] [Green Version]
- Bustin, S.A.; Benes, V.; Garson, J.A.; Hellemans, J.; Huggett, J.; Kubista, M.; Mueller, R.; Nolan, T.; Pfaffl, M.W.; Shipley, G.L.; et al. The MIQE Guidelines: Minimum Information for Publication of Quantitative Real-Time PCR Experiments. Clin. Chem. 2009, 55, 611–622. [Google Scholar] [CrossRef] [Green Version]
- Livak, K.J.; Schmittgen, T.D. Analysis of Relative Gene Expression Data Using Real-Time Quantitative PCR and the 2−ΔΔCT Method. Methods 2001, 25, 402–408. [Google Scholar] [CrossRef] [PubMed]
- Schneider, C.A.; Rasband, W.S.; Eliceiri, K.W. NIH Image to ImageJ: 25 Years of Image Analysis. Nat. Methods 2012, 9, 671–675. [Google Scholar] [CrossRef] [PubMed]
- Kuleshov, M.V.; Jones, M.R.; Rouillard, A.D.; Fernandez, N.F.; Duan, Q.; Wang, Z.; Koplev, S.; Jenkins, S.L.; Jagodnik, K.M.; Lachmann, A.; et al. Enrichr: A Comprehensive Gene Set Enrichment Analysis Web Server 2016 Update. Nucleic Acids Res. 2016, 44, W90–W97. [Google Scholar] [CrossRef] [Green Version]
- Chen, E.Y.; Tan, C.M.; Kou, Y.; Duan, Q.; Wang, Z.; Meirelles, G.; Clark, N.R.; Ma’ayan, A. Enrichr: Interactive and Collaborative HTML5 Gene List Enrichment Analysis Tool. BMC Bioinform. 2013, 14, 128. [Google Scholar] [CrossRef] [Green Version]
- Clarke, D.J.B.; Kuleshov, M.V.; Schilder, B.M.; Torre, D.; Duffy, M.E.; Keenan, A.B.; Lachmann, A.; Feldmann, A.S.; Gundersen, G.W.; Silverstein, M.C.; et al. EXpression2Kinases (X2K) Web: Linking Expression Signatures to Upstream Cell Signaling Networks. Nucleic Acids Res. 2018, 46, W171–W179. [Google Scholar] [CrossRef] [PubMed] [Green Version]
- Pauli, J.; Gundelach, R.; Vanelli-Rees, A.; Rees, G.; Campbell, C.; Dubey, S.; Perry, C. Juvenile Nasopharyngeal Angiofibroma: An Immunohistochemical Characterisation of the Stromal Cell. Pathology 2008, 40, 396–400. [Google Scholar] [CrossRef] [PubMed]
- Nakanishi, H.; Ohsawa, M.; Naka, N.; Uchida, A.; Ochi, T.; Aozasa, K. Immunohistochemical Detection of Bcl-2 and P53 Proteins and Apoptosis in Soft Tissue Sarcoma: Their Correlations with Prognosis. Oncology 1997, 54, 238–244. [Google Scholar] [CrossRef] [PubMed]
- Bhargava, V.; Kell, D.L.; Van De Rijn, M.; Warnke, R.A. Bcl-2 Immunoreactivity in Breast Carcinoma Correlates with Hormone Receptor Positivity. Am. J. Pathol. 1994, 145, 535–540. [Google Scholar]
- Miettinen, M.; Sarlomo-Rikala, M.; Kovatich, A.J. Cell-Type- and Tumour-Type-Related Patterns of Bcl-2 Reactivity in Mesenchymal Cells and Soft Tissue Tumours. Virchows Arch. 1998, 433, 255–260. [Google Scholar] [CrossRef] [PubMed]
- Ola, M.S.; Nawaz, M.; Ahsan, H. Role of Bcl-2 Family Proteins and Caspases in the Regulation of Apoptosis. Mol. Cell. Biochem. 2011, 351, 41–58. [Google Scholar] [CrossRef]
- Deng, Q.; Yoo, S.K.; Cavnar, P.J.; Green, J.M.; Huttenlocher, A. Dual Roles for Rac2 in Neutrophil Motility and Active Retention in Zebrafish Hematopoietic Tissue. Dev. Cell 2011, 21, 735–745. [Google Scholar] [CrossRef] [PubMed] [Green Version]
- Pestonjamasp, K.N.; Forster, C.; Sun, C.; Gardiner, E.M.; Bohl, B.; Weiner, O.; Bokoch, G.M.; Glogauer, M. Rac1 Links Leading Edge and Uropod Events through Rho and Myosin Activation during Chemotaxis. Blood 2006, 108, 2814–2820. [Google Scholar] [CrossRef] [Green Version]
- Mizukawa, B.; Wei, J.; Shrestha, M.; Wunderlich, M.; Chou, F.S.; Griesinger, A.; Harris, C.E.; Kumar, A.R.; Zheng, Y.; Williams, D.A.; et al. Inhibition of Rac GTPase Signaling and Downstream Prosurvival Bcl-2 Proteins as Combination Targeted Therapy in MLL-AF9 Leukemia. Blood 2011, 118, 5235–5245. [Google Scholar] [CrossRef] [Green Version]
- Pei, H.; Guo, Z.; Wang, Z.; Dai, Y.; Zheng, L.; Zhu, L.; Zhang, J.; Hu, W.; Nie, J.; Mao, W.; et al. RAC2 Promotes Abnormal Proliferation of Quiescent Cells by Enhanced JUNB Expression via the MAL-SRF Pathway. Cell Cycle 2018, 17, 1115–1123. [Google Scholar] [CrossRef] [Green Version]
- Liu, Y.; Cheng, G.; Song, Z.; Xu, T.; Ruan, H.; Cao, Q.; Wang, K.; Bao, L.; Liu, J.; Zhou, L.; et al. RAC2 Acts as a Prognostic Biomarker and Promotes the Progression of Clear Cell Renal Cell Carcinoma. Int. J. Oncol. 2019, 55, 645–656. [Google Scholar] [CrossRef] [Green Version]
- Lai, Y.J.; Tsai, J.C.; Tseng, Y.T.; Wu, M.S.; Liu, W.S.; Lam, H.I.; Yu, J.H.; Nozell, S.E.; Benveniste, E.N. Small G Protein Rac GTPases Regulate the Maintenance of Glioblastoma Stem-like Cells in Vitro and in Vivo. Oncotarget 2017, 8, 18031–18049. [Google Scholar] [CrossRef] [PubMed] [Green Version]
- Jiang, Q.; Cheng, L.; Ma, D.; Zhao, Y. FBXL19-AS1 Exerts Oncogenic Function by Sponging MiR-431-5p to Regulate RAF1 Expression in Lung Cancer. Biosci. Rep. 2019, 39, 1–12. [Google Scholar] [CrossRef] [Green Version]
- Wang, Z.-Q.; Milne, K.; Webb, J.R.; Watson, P.H. CD74 and Intratumoral Immune Response in Breast Cancer. Oncotarget 2017, 8, 12664–12674. [Google Scholar] [CrossRef] [Green Version]
- Lawson, D.A.; Kessenbrock, K.; Davis, R.T.; Pervolarakis, N.; Werb, Z. Tumour Heterogeneity and Metastasis at Single-Cell Resolution. Nat. Cell Biol. 2018, 20, 1349–1360. [Google Scholar] [CrossRef] [PubMed]
- Xu, H.; Guo, X.; Sun, Q.; Zhang, M.; Qi, L.; Li, Y.; Chen, L.; Gu, Y.; Guo, Z.; Zhao, W. The Influence of Cancer Tissue Sampling on the Identification of Cancer Characteristics. Sci. Rep. 2015, 5, 15474. [Google Scholar] [CrossRef] [PubMed] [Green Version]
- Farr, L.; Ghosh, S.; Jiang, N.; Watanabe, K.; Parlak, M.; Bucala, R.; Moonah, S. CD74 Signaling Links Inflammation to Intestinal Epithelial Cell Regeneration and Promotes Mucosal Healing. Cell. Mol. Gastroenterol. Hepatol. 2020, 10, 101–112. [Google Scholar] [CrossRef]
- Choi, J.-W.; Kim, Y.; Lee, J.-H.; Kim, Y.-S. CD74 Expression Is Increased in High-Grade, Invasive Urothelial Carcinoma of the Bladder. Int. J. Urol. 2013, 20, 251–255. [Google Scholar] [CrossRef] [Green Version]
- Cheng, R.; Deng, W.; Niu, C.; Li, Y.; Fu, Y. Expression of Macrophage Migration Inhibitory Factor and CD74 in Cervical Squamous Cell Carcinoma. Int. J. Gynecol. Cancer 2011, 21, 1004–1012. [Google Scholar] [CrossRef]
- Zhang, J.-F.; Tao, L.-Y.; Yang, M.-W.; Xu, D.-P.; Jiang, S.-H.; Fu, X.-L.; Liu, D.-J.; Huo, Y.-M.; Liu, W.; Yang, J.-Y.; et al. CD74 Promotes Perineural Invasion of Cancer Cells and Mediates Neuroplasticity via the AKT/EGR-1/GDNF Axis in Pancreatic Ductal Adenocarcinoma. Cancer Lett. 2021, 508, 47–58. [Google Scholar] [CrossRef] [PubMed]
- Liddington, R.C. Mapping out the Basement Membrane. Nat. Struct. Biol. 2001, 8, 573–574. [Google Scholar] [CrossRef]
- Delektorskaya, V.V.; Golovkov, D.A.; Kushlinskii, N.E. Clinical Significance of Levels of Molecular Biological Markers in Zones of Invasive Front-Line of Colorectal Cancer. Bull. Exp. Biol. Med. 2008, 146, 616–619. [Google Scholar] [CrossRef]
- Hlubek, F.; Spaderna, S.; Jung, A.; Kirchner, T.; Brabletz, T. Beta-Catenin Activates a Coordinated Expression of the Proinvasive Factors Laminin-5 Gamma2 Chain and MT1-MMP in Colorectal Carcinomas. Int. J. Cancer 2004, 108, 321–326. [Google Scholar] [CrossRef] [PubMed]
- Jin, J.-S.; Wu, C.-Y.; Lin, Y.-F.; Wang, J.-Y.; Yu, C.-P.; Sheu, L.-F.; Chiang, H.; Tsai, W.-C.; Lee, W.-H. Higher Expression of Epidermal Growth Factor Receptor Is Associated with Extracellular Matrix Metalloprotease Inducer in Colorectal Adenocarcinoma: Tissue Microarray Analysis of Immunostaining Score with Clinicopathological Parameters. Dis. Markers 2006, 22, 309–316. [Google Scholar] [CrossRef] [PubMed] [Green Version]
- Nyström, H.; Naredi, P.; Hafström, L.; Sund, M. Type IV Collagen as a Tumour Marker for Colorectal Liver Metastases. Eur. J. Surg. Oncol. 2011, 37, 611–617. [Google Scholar] [CrossRef] [PubMed] [Green Version]
- Chang, K.C.; Lu, Y.C.; Lin, M.J.; Chen, H.Y.; Jin, Y.T. Desmoplastic Tumour-Associated Stroma versus Neural Tissue in Central Nervous System Metastasis: Effects of Different Microenvironments on Tumour Growth. Histopathology 2011, 59, 31–39. [Google Scholar] [CrossRef] [PubMed]
- Nwosu, Z.C.; Ebert, M.P.; Dooley, S.; Meyer, C. Caveolin-1 in the Regulation of Cell Metabolism: A Cancer Perspective. Mol. Cancer 2016, 15, 71. [Google Scholar] [CrossRef] [PubMed] [Green Version]
- Qian, X.-L.; Pan, Y.-H.; Huang, Q.-Y.; Shi, Y.-B.; Huang, Q.-Y.; Hu, Z.-Z.; Xiong, L.-X. Caveolin-1: A Multifaceted Driver of Breast Cancer Progression and Its Application in Clinical Treatment. Oncol. Targets Ther. 2019, 12, 1539–1552. [Google Scholar] [CrossRef] [Green Version]
- Shaw, H.V.; Koval, A.; Katanaev, V.L. Targeting the Wnt Signalling Pathway in Cancer: Prospects and Perils. Swiss Med. Wkly. 2019, 149, 1–8. [Google Scholar] [CrossRef] [Green Version]
- Prasad, C.P.; Manchanda, M.; Mohapatra, P.; Andersson, T. WNT5A as a Therapeutic Target in Breast Cancer. Cancer Metastasis Rev. 2018, 37, 767–778. [Google Scholar] [CrossRef] [PubMed] [Green Version]
- Harada, T.; Yamamoto, H.; Kishida, S.; Kishida, M.; Awada, C.; Takao, T.; Kikuchi, A. Wnt5b-Associated Exosomes Promote Cancer Cell Migration and Proliferation. Cancer Sci. 2017, 108, 42–52. [Google Scholar] [CrossRef]
- Jiang, S.; Zhang, M.; Zhang, Y.; Zhou, W.; Zhu, T.; Ruan, Q.; Chen, H.; Fang, J.; Zhou, F.; Sun, J.; et al. WNT5B Governs the Phenotype of Basal-like Breast Cancer by Activating WNT Signaling. Cell Commun. Signal. 2019, 17, 109. [Google Scholar] [CrossRef] [Green Version]
- Suthon, S.; Perkins, R.S.; Bryja, V.; Miranda-Carboni, G.A.; Krum, S.A. WNT5B in Physiology and Disease. Front. Cell Dev. Biol. 2021, 9, 1–20. [Google Scholar] [CrossRef]
- Hino, M.; Kamo, M.; Saito, D.; Kyakumoto, S.; Shibata, T.; Mizuki, H.; Ishisaki, A. Transforming Growth Factor-Β1 Induces Invasion Ability of HSC-4 Human Oral Squamous Cell Carcinoma Cells through the Slug/Wnt-5b/MMP-10 Signalling Axis. J. Biochem. 2016, 159, 631–640. [Google Scholar] [CrossRef] [PubMed] [Green Version]
- Deraz, E.M.; Kudo, Y.; Yoshida, M.; Obayashi, M.; Tsunematsu, T.; Tani, H.; Siriwardena, S.B.S.M.; Kiekhaee, M.R.; Qi, G.; Iizuka, S.; et al. MMP-10/Stromelysin-2 Promotes Invasion of Head and Neck Cancer. PLoS ONE 2011, 6, e25438. [Google Scholar] [CrossRef] [PubMed] [Green Version]
- Jung, Y.-S.; Park, J.-I. Wnt Signaling in Cancer: Therapeutic Targeting of Wnt Signaling beyond β-Catenin and the Destruction Complex. Exp. Mol. Med. 2020, 52, 183–191. [Google Scholar] [CrossRef] [Green Version]
- Kuşoğlu, A.; Biray Avcı, Ç. Cancer Stem Cells: A Brief Review of the Current Status. Gene 2019, 681, 80–85. [Google Scholar] [CrossRef]
- Clara, J.A.; Monge, C.; Yang, Y.; Takebe, N. Targeting Signalling Pathways and the Immune Microenvironment of Cancer Stem Cells—A Clinical Update. Nat. Rev. Clin. Oncol. 2020, 17, 204–232. [Google Scholar] [CrossRef] [PubMed]
- Saygin, C.; Matei, D.; Majeti, R.; Reizes, O.; Lathia, J.D. Targeting Cancer Stemness in the Clinic: From Hype to Hope. Cell Stem Cell 2019, 24, 25–40. [Google Scholar] [CrossRef] [Green Version]
- Patel, S.; Alam, A.; Pant, R.; Chattopadhyay, S. Wnt Signaling and Its Significance Within the Tumor Microenvironment: Novel Therapeutic Insights. Front. Immunol. 2019, 10, 2872. [Google Scholar] [CrossRef] [PubMed] [Green Version]
- Säfholm, A.; Leandersson, K.; Dejmek, J.; Nielsen, C.K.; Villoutreix, B.O.; Andersson, T. A Formylated Hexapeptide Ligand Mimics the Ability of Wnt-5a to Impair Migration of Human Breast Epithelial Cells. J. Biol. Chem. 2006, 281, 2740–2749. [Google Scholar] [CrossRef] [PubMed] [Green Version]


| Protein—Number of Cases (%) | |||||||
|---|---|---|---|---|---|---|---|
| Final Score | BCL2 | CAV1 | CD74 | FZD7 | RAF1 | WNT5A | WNT5B |
| Negative | 14 (35.9) | 5 (13.5) | 2 (5.3) | 13 (38.2) | 0 | 29 (78.4) | 1 (2.7) |
| Low | 18 (46.2) | 3 (8.1) | 3 (7.9) | 1 (2.9) | 0 | 3 (8.1) | 0 |
| Moderate | 7 (17.9) | 18 (48.7) | 23 (60.5) | 13 (38.2) | 1 (2.6) | 5 (13.5) | 7 (18.9) |
| Strong | 0 | 11 (29.7) | 10 (26.3) | 7 (20.7) | 38 (97.4) | 0 | 29 (78.4) |
| Total | 39 | 37 | 38 | 34 | 39 | 37 | 37 |
Publisher’s Note: MDPI stays neutral with regard to jurisdictional claims in published maps and institutional affiliations. |
© 2021 by the authors. Licensee MDPI, Basel, Switzerland. This article is an open access article distributed under the terms and conditions of the Creative Commons Attribution (CC BY) license (https://creativecommons.org/licenses/by/4.0/).
Share and Cite
Calanca, N.; Binato, S.M.S.; da Silva, S.D.; Brentani, H.P.; Sennes, L.U.; Pinto, C.A.L.; Domingues, M.A.C.; Fonseca-Alves, C.E.; Rainho, C.A.; Rogatto, S.R. Master Regulators of Epithelial-Mesenchymal Transition and WNT Signaling Pathways in Juvenile Nasopharyngeal Angiofibromas. Biomedicines 2021, 9, 1258. https://doi.org/10.3390/biomedicines9091258
Calanca N, Binato SMS, da Silva SD, Brentani HP, Sennes LU, Pinto CAL, Domingues MAC, Fonseca-Alves CE, Rainho CA, Rogatto SR. Master Regulators of Epithelial-Mesenchymal Transition and WNT Signaling Pathways in Juvenile Nasopharyngeal Angiofibromas. Biomedicines. 2021; 9(9):1258. https://doi.org/10.3390/biomedicines9091258
Chicago/Turabian StyleCalanca, Naiade, Sara Martoreli Silveira Binato, Sabrina Daniela da Silva, Helena Paula Brentani, Luiz Ubirajara Sennes, Clóvis Antonio Lopes Pinto, Maria Aparecida Custódio Domingues, Carlos Eduardo Fonseca-Alves, Claudia Aparecida Rainho, and Silvia Regina Rogatto. 2021. "Master Regulators of Epithelial-Mesenchymal Transition and WNT Signaling Pathways in Juvenile Nasopharyngeal Angiofibromas" Biomedicines 9, no. 9: 1258. https://doi.org/10.3390/biomedicines9091258