

Artificial Extracellular Vesicles Generated from T Cells Using Different Induction Techniques

 ,
,  ,
,  ,
,
Abstract
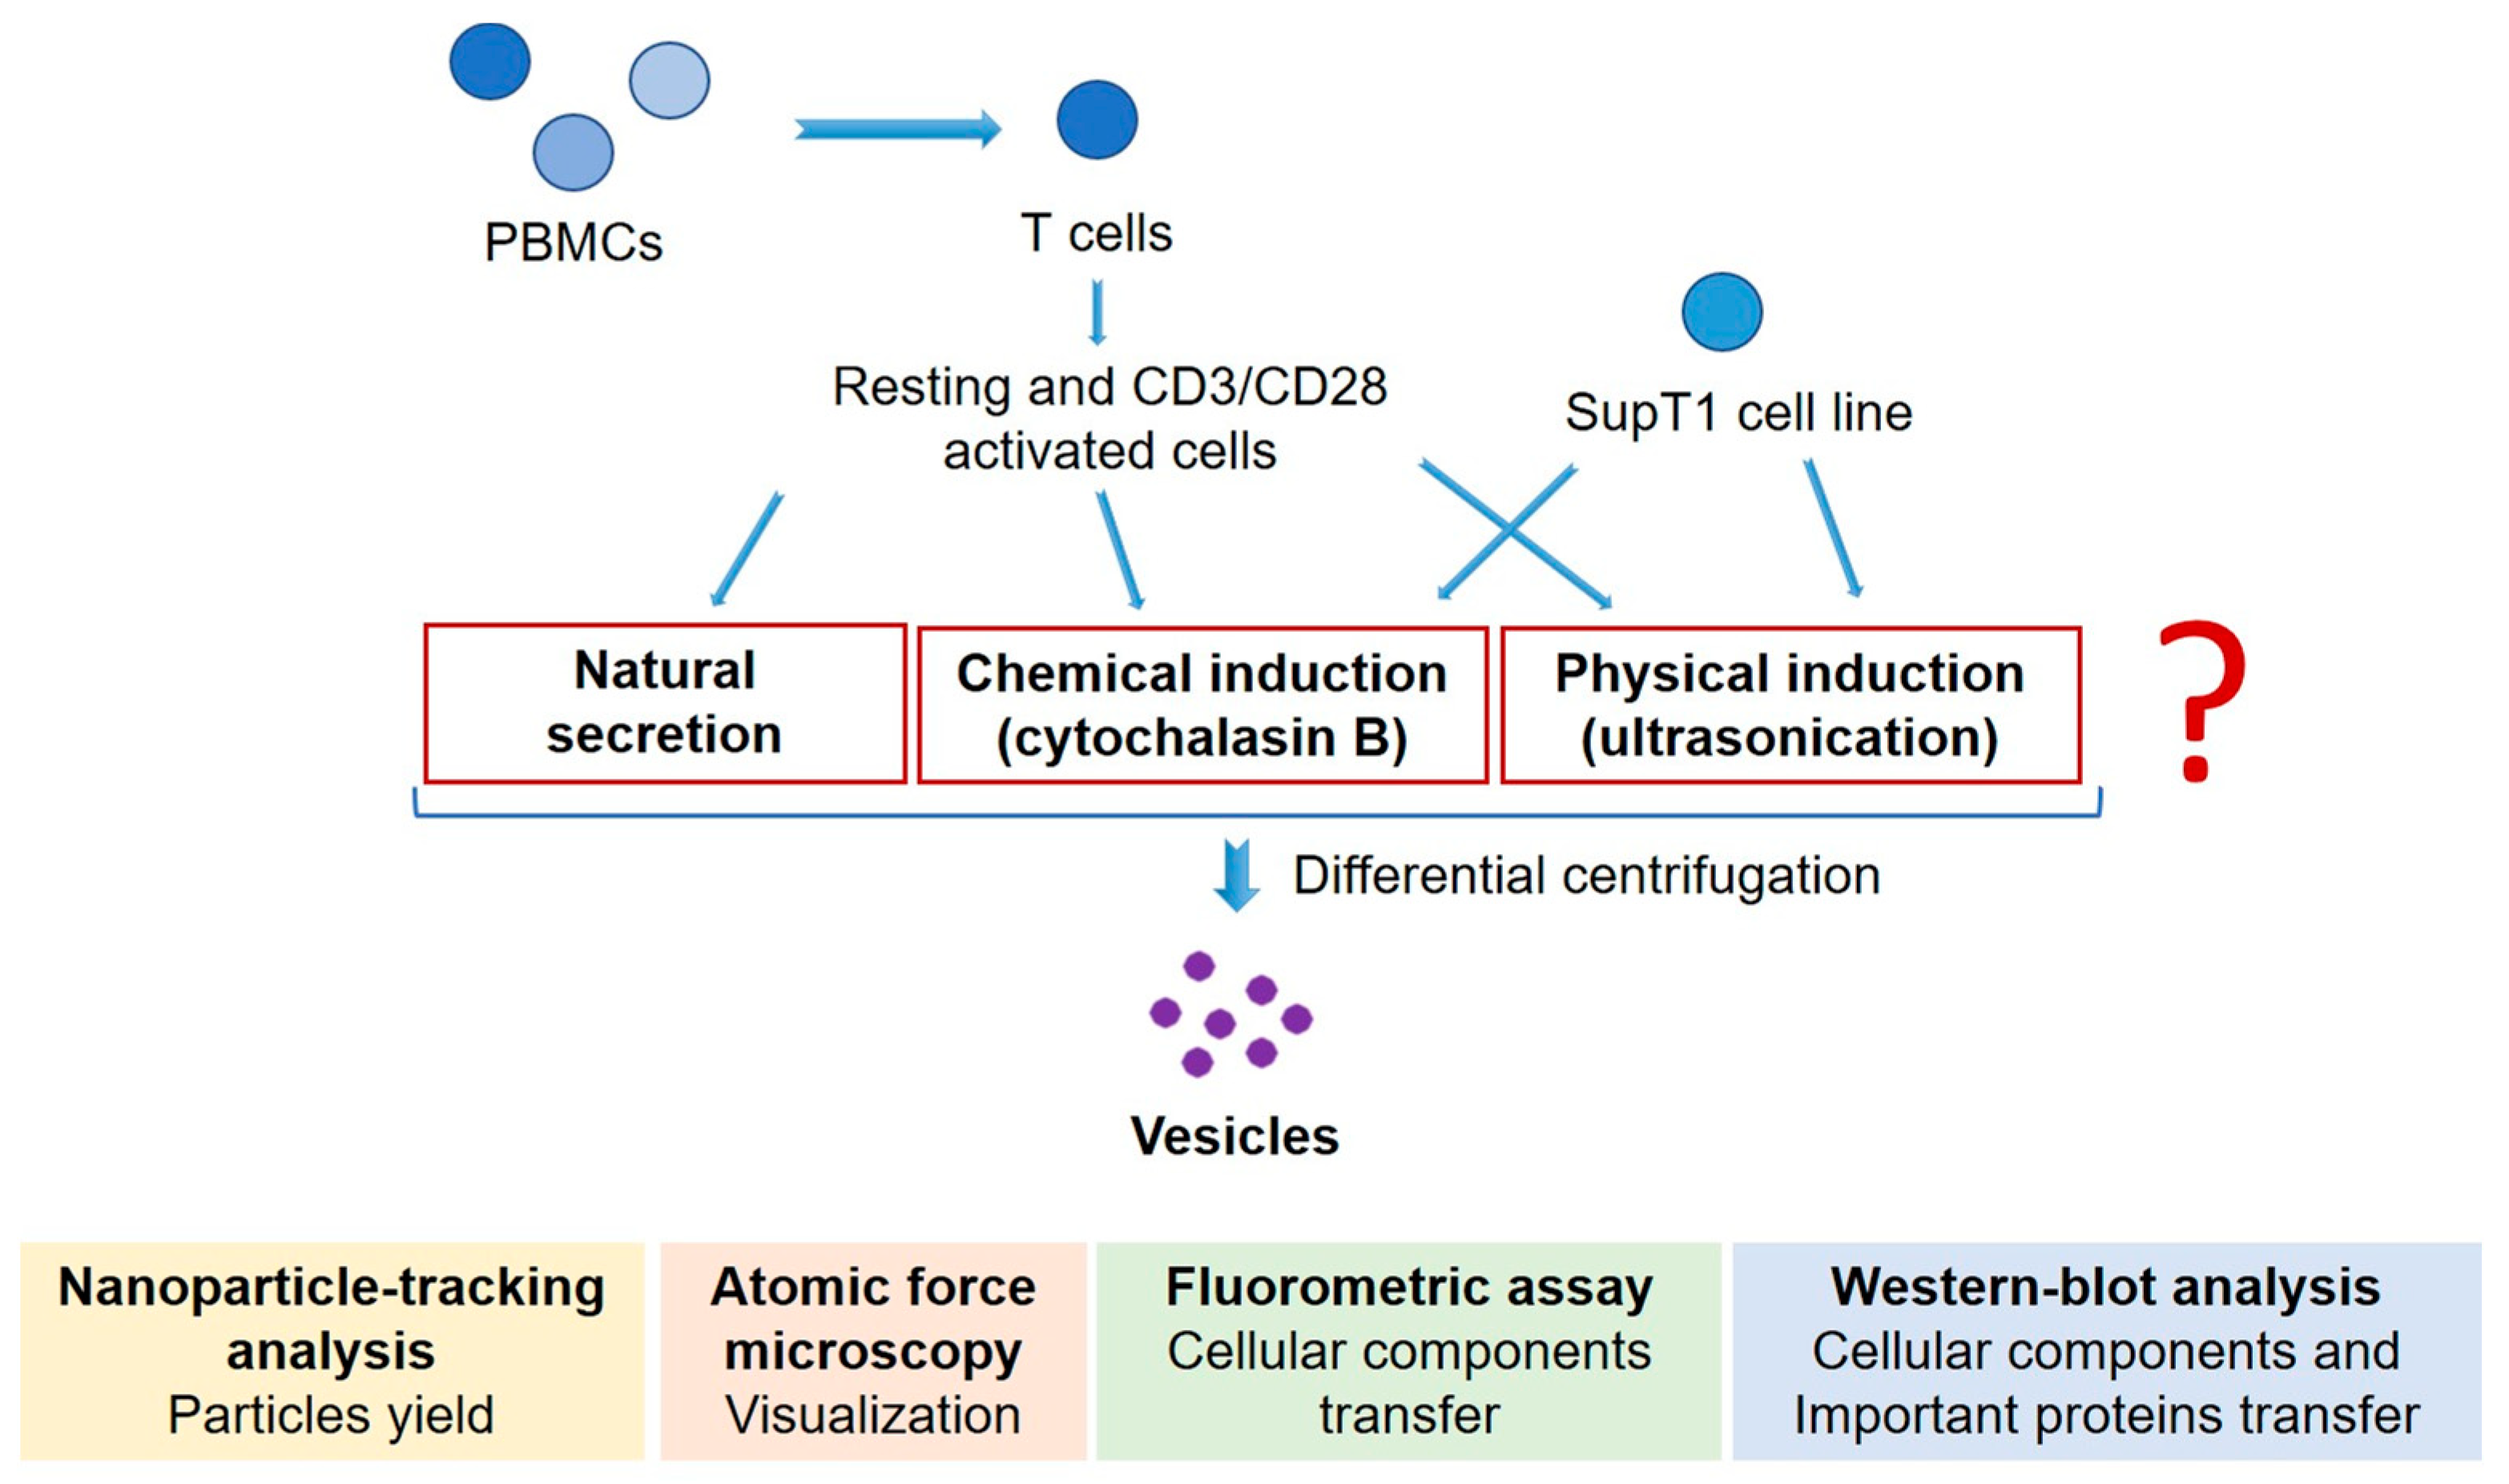
1. Introduction
2. Materials and Methods
2.1. T Cells’ Isolation and Expansion
2.2. SupT1 Cell Culture and Transduction
2.3. MV Induction and Collection
2.4. AV Induction
2.5. MV and AV Isolation
2.6. Nanoparticle Tracking Analysis
2.7. Atomic Force Microscopy
2.8. Total Protein Assay
2.9. Western Blot Analysis
2.10. Fluorometric Assay
2.11. Flow Cytometry
2.12. Statistical Analysis
3. Results
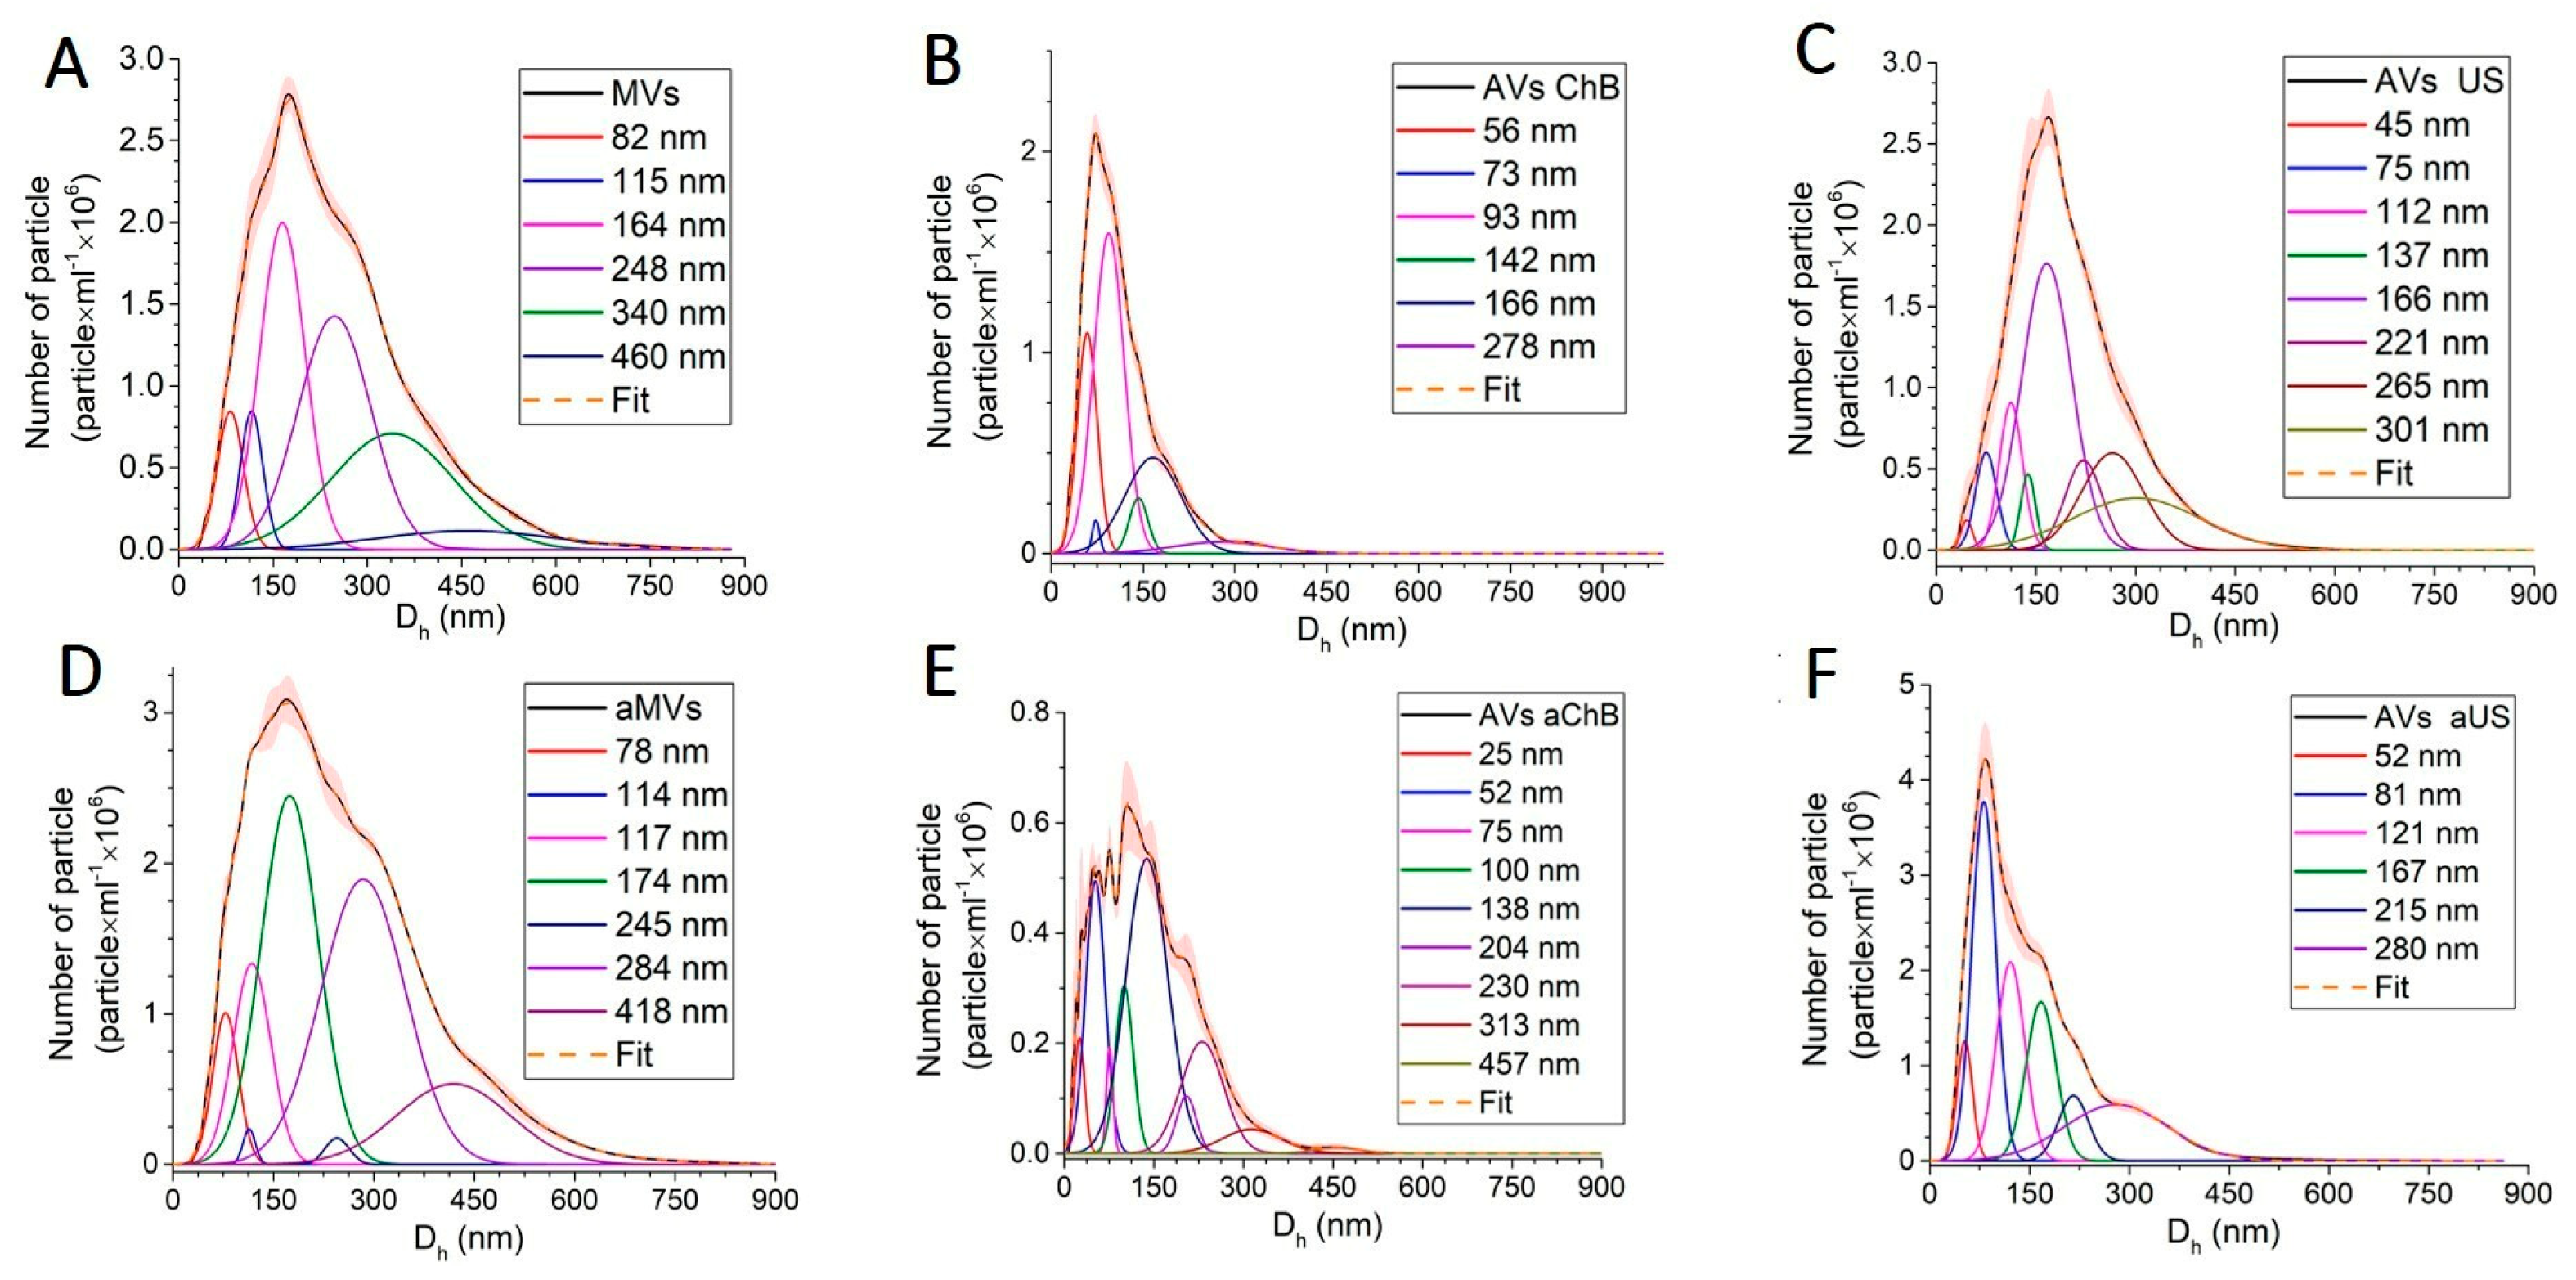
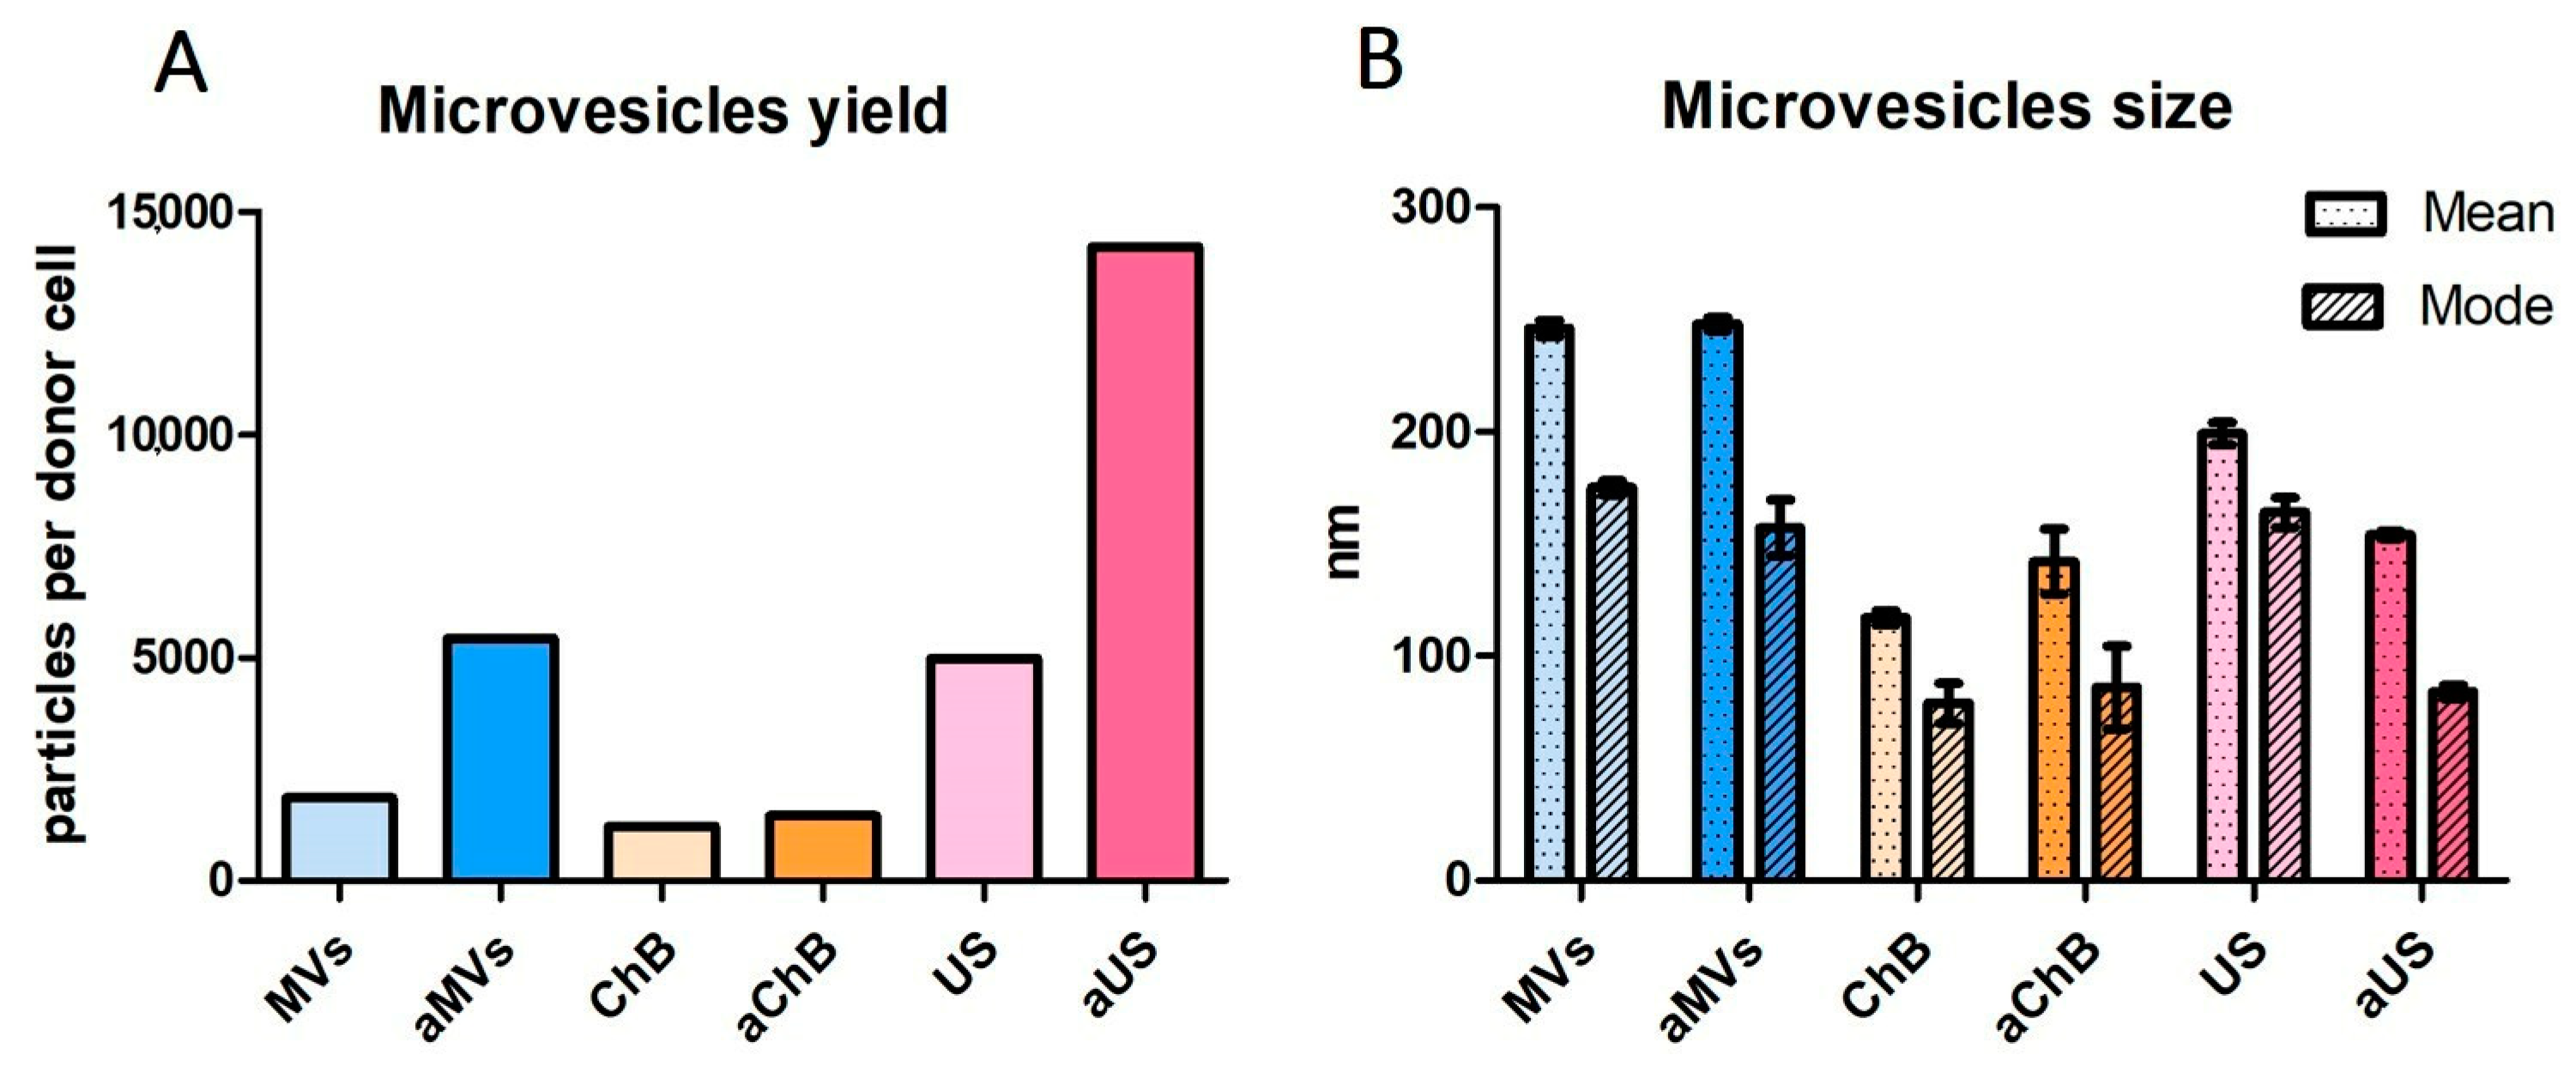
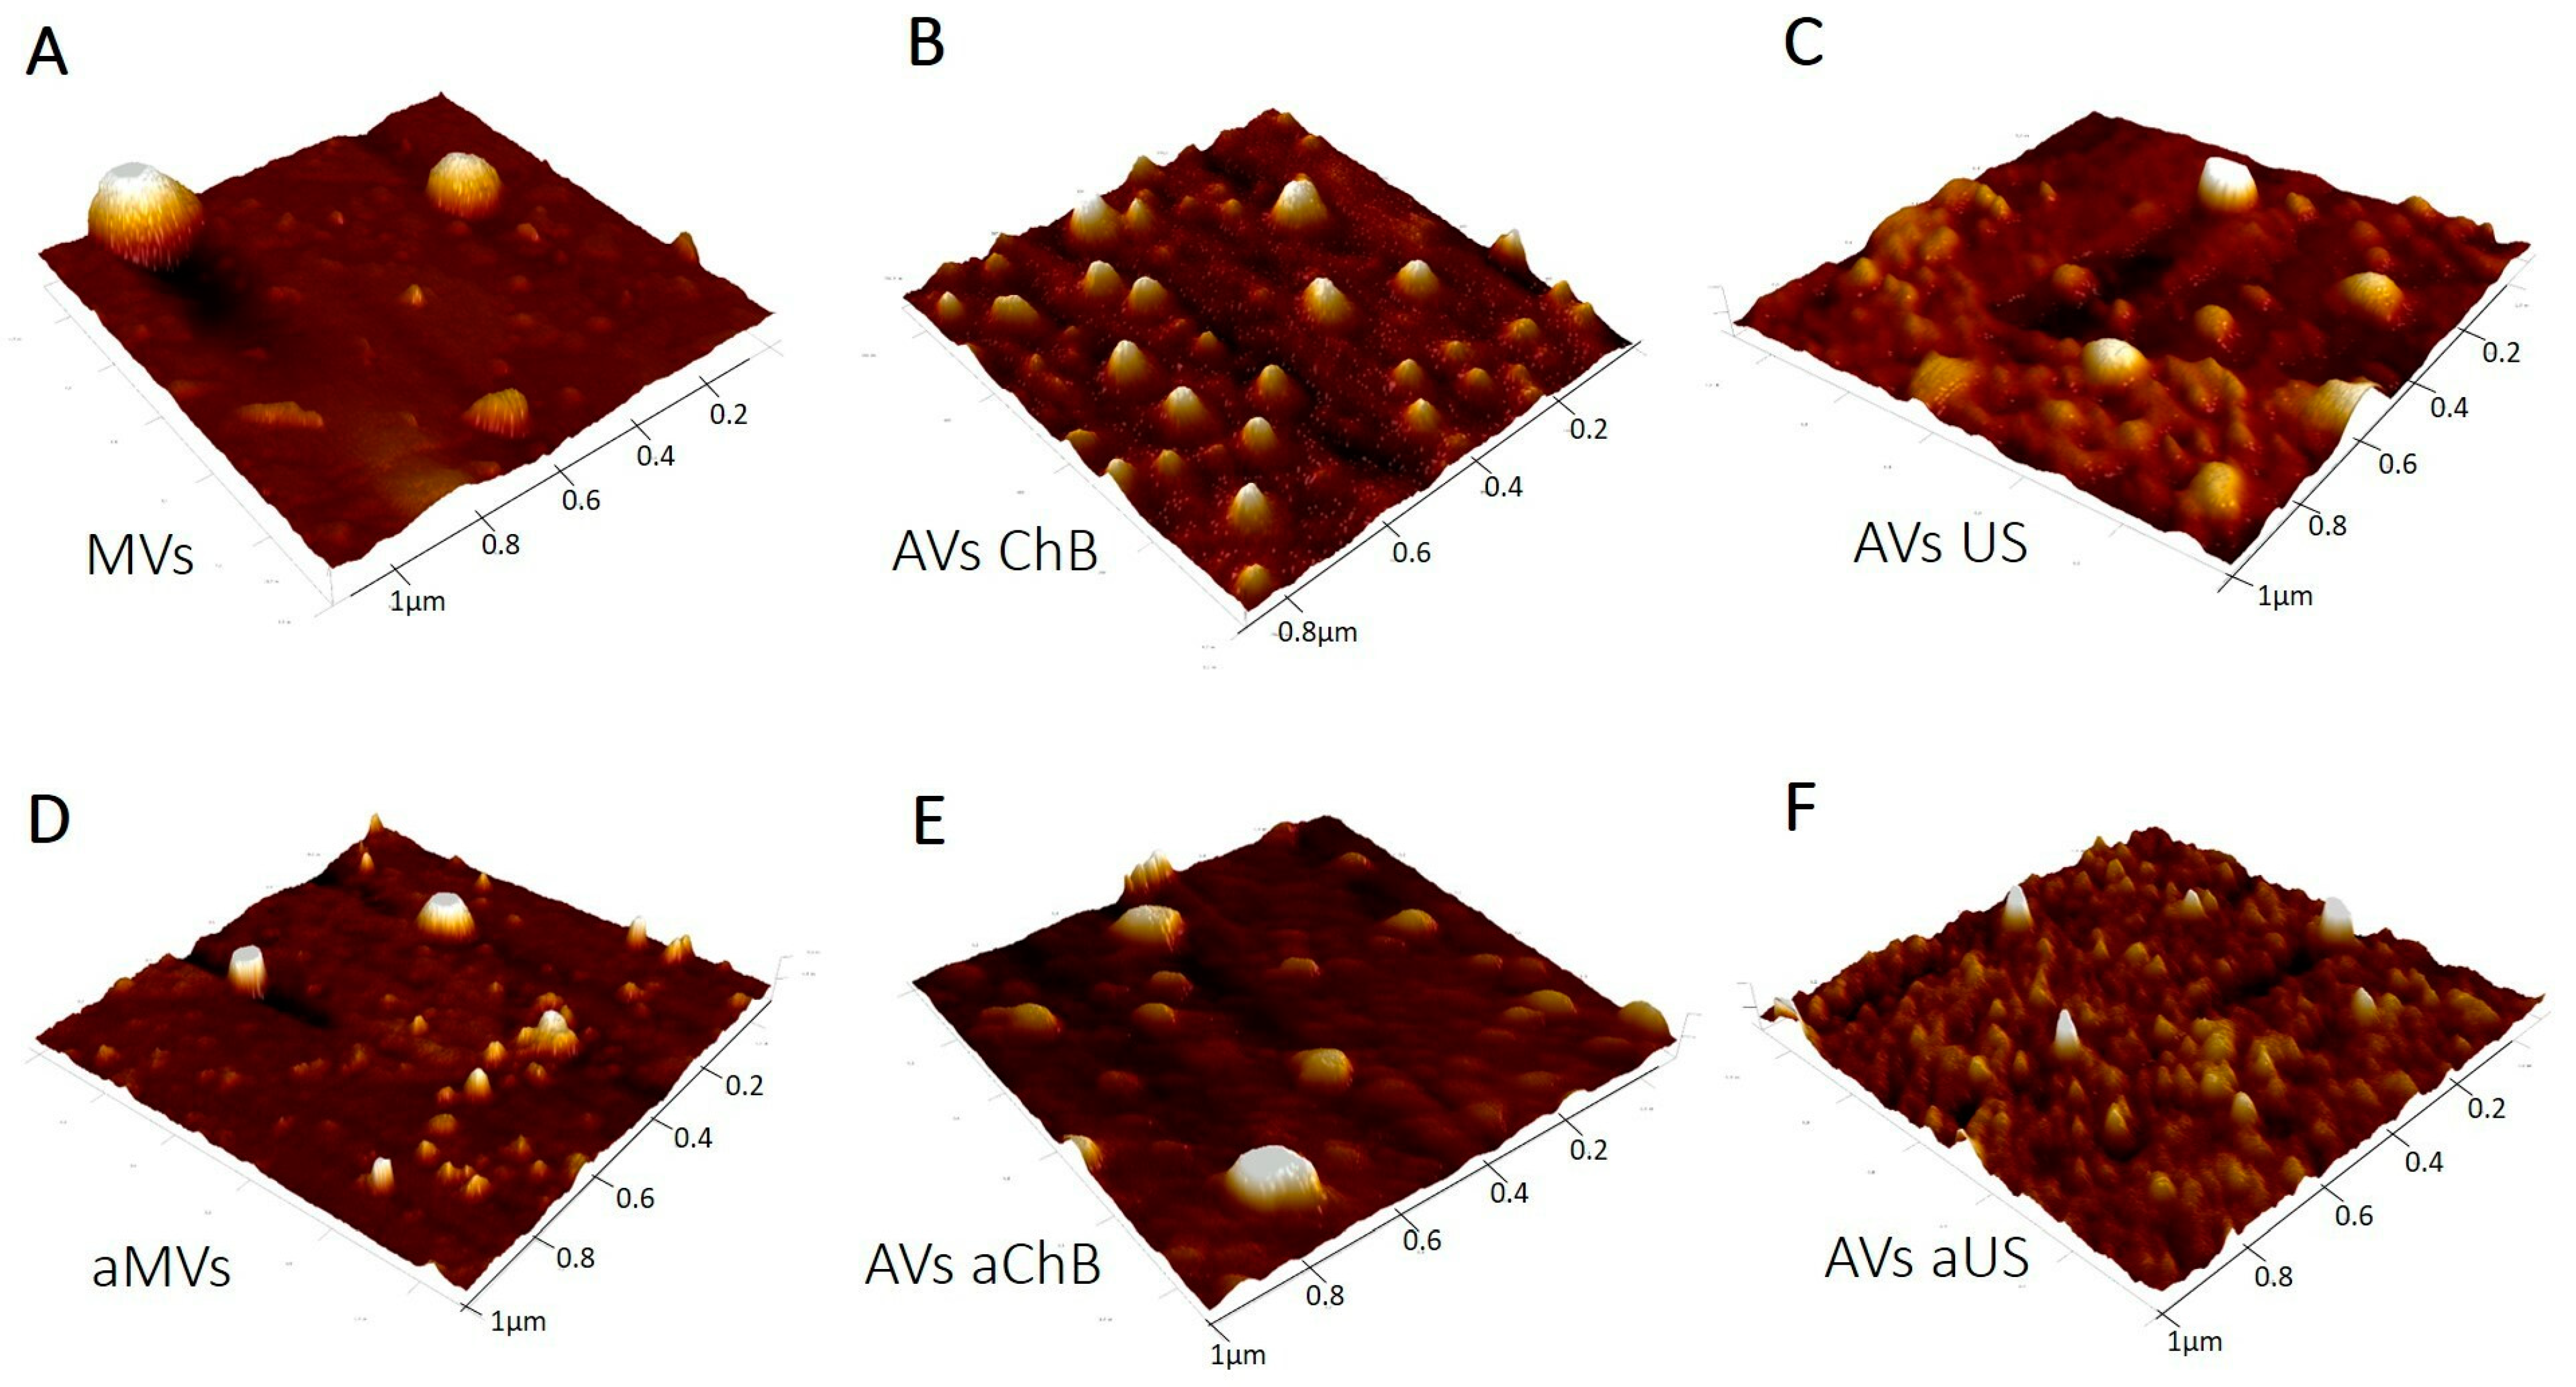
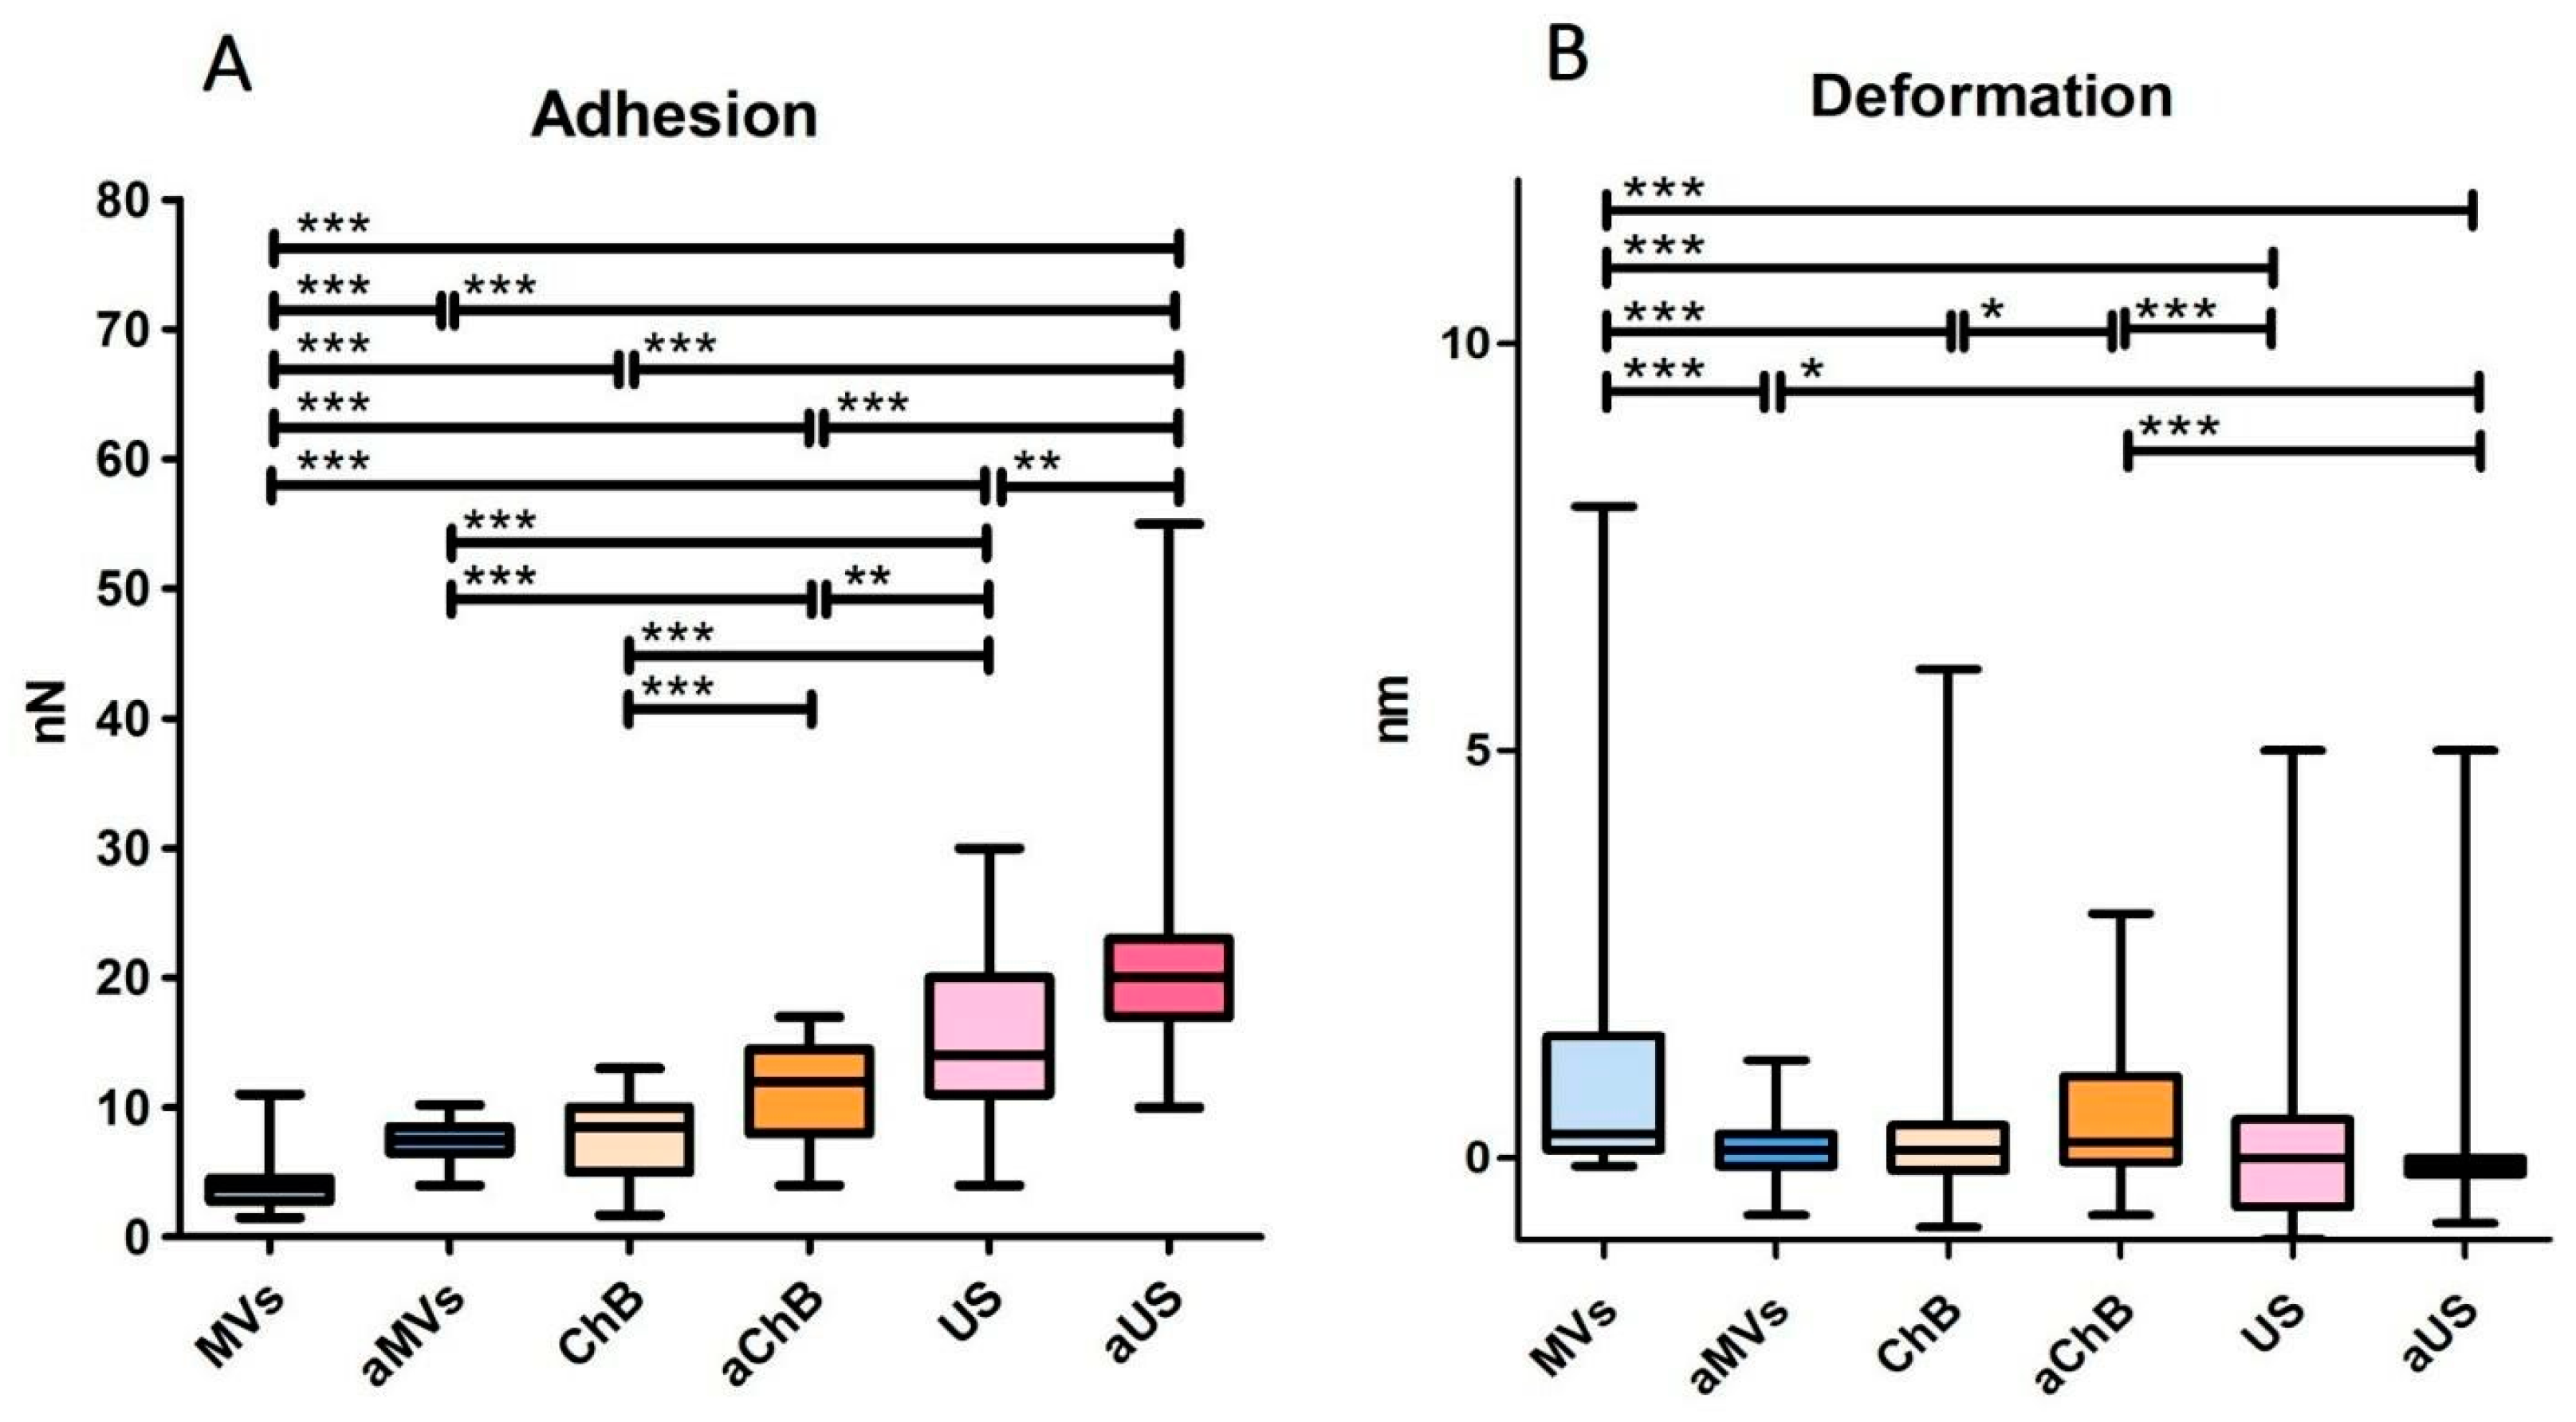
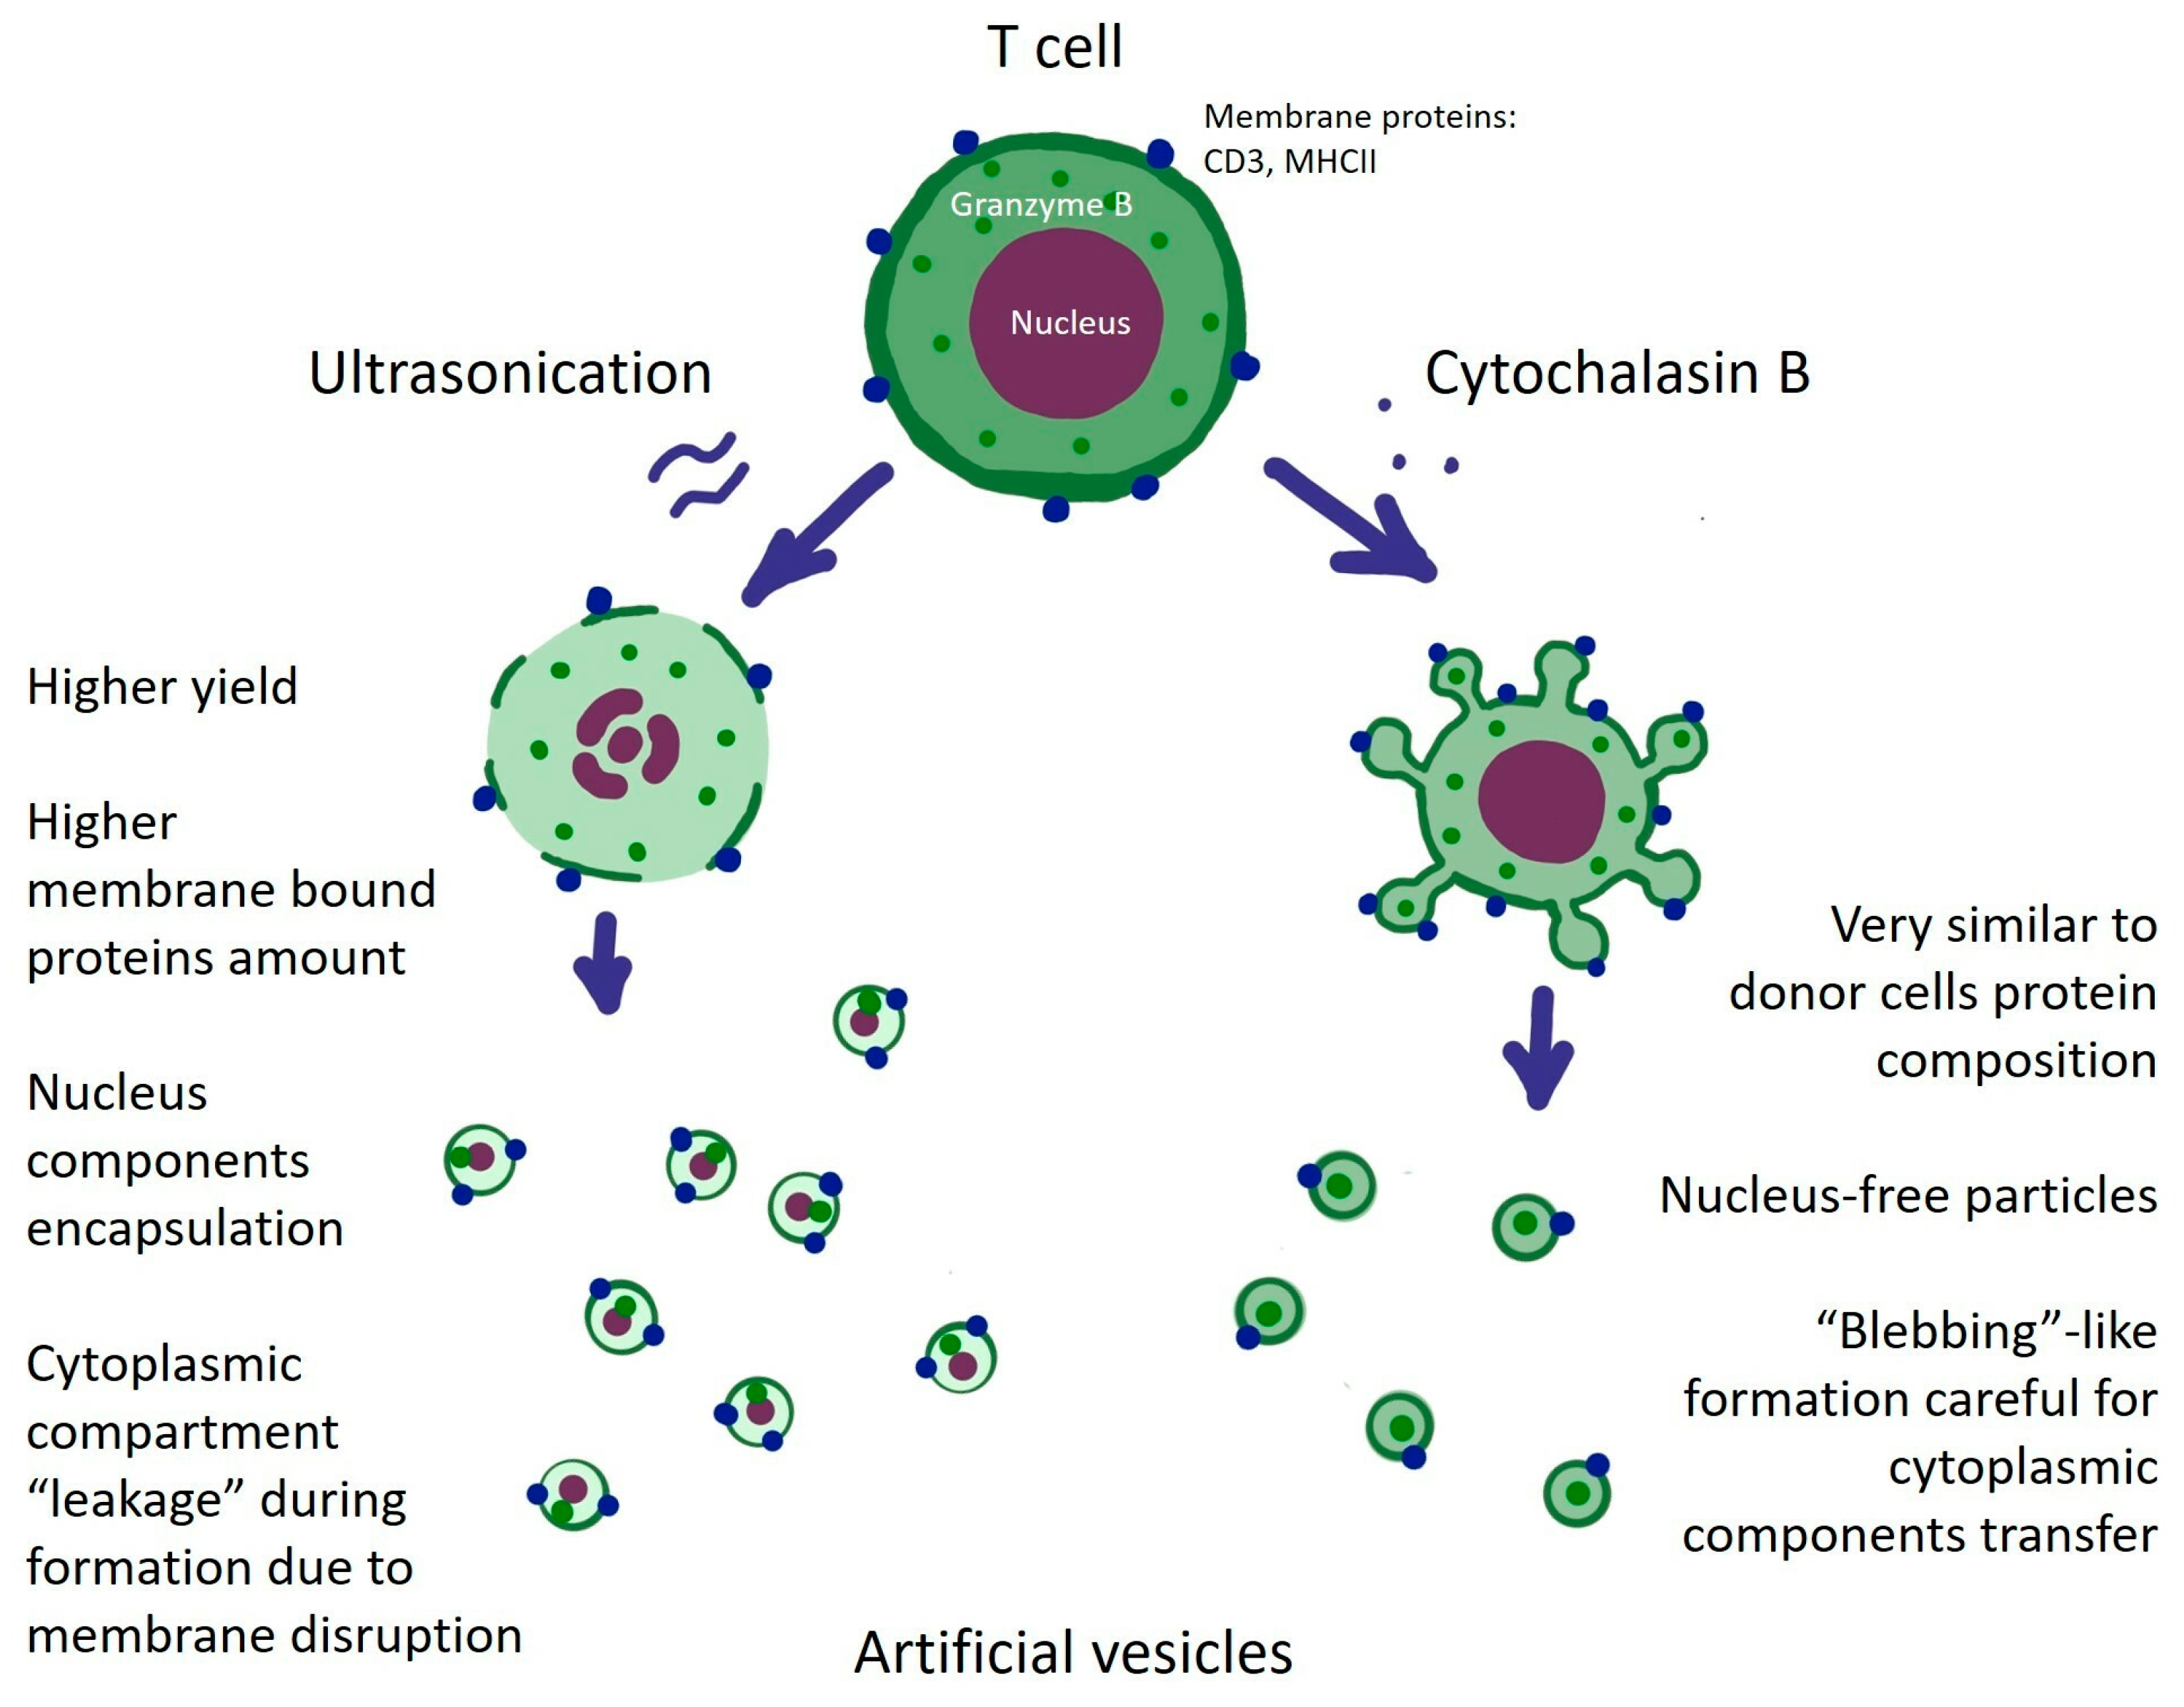
3.1. Cytochalasin B and Ultrasonication Result in T-Cell AVs with Different Yield, Size Distribution, and Mechanical Properties
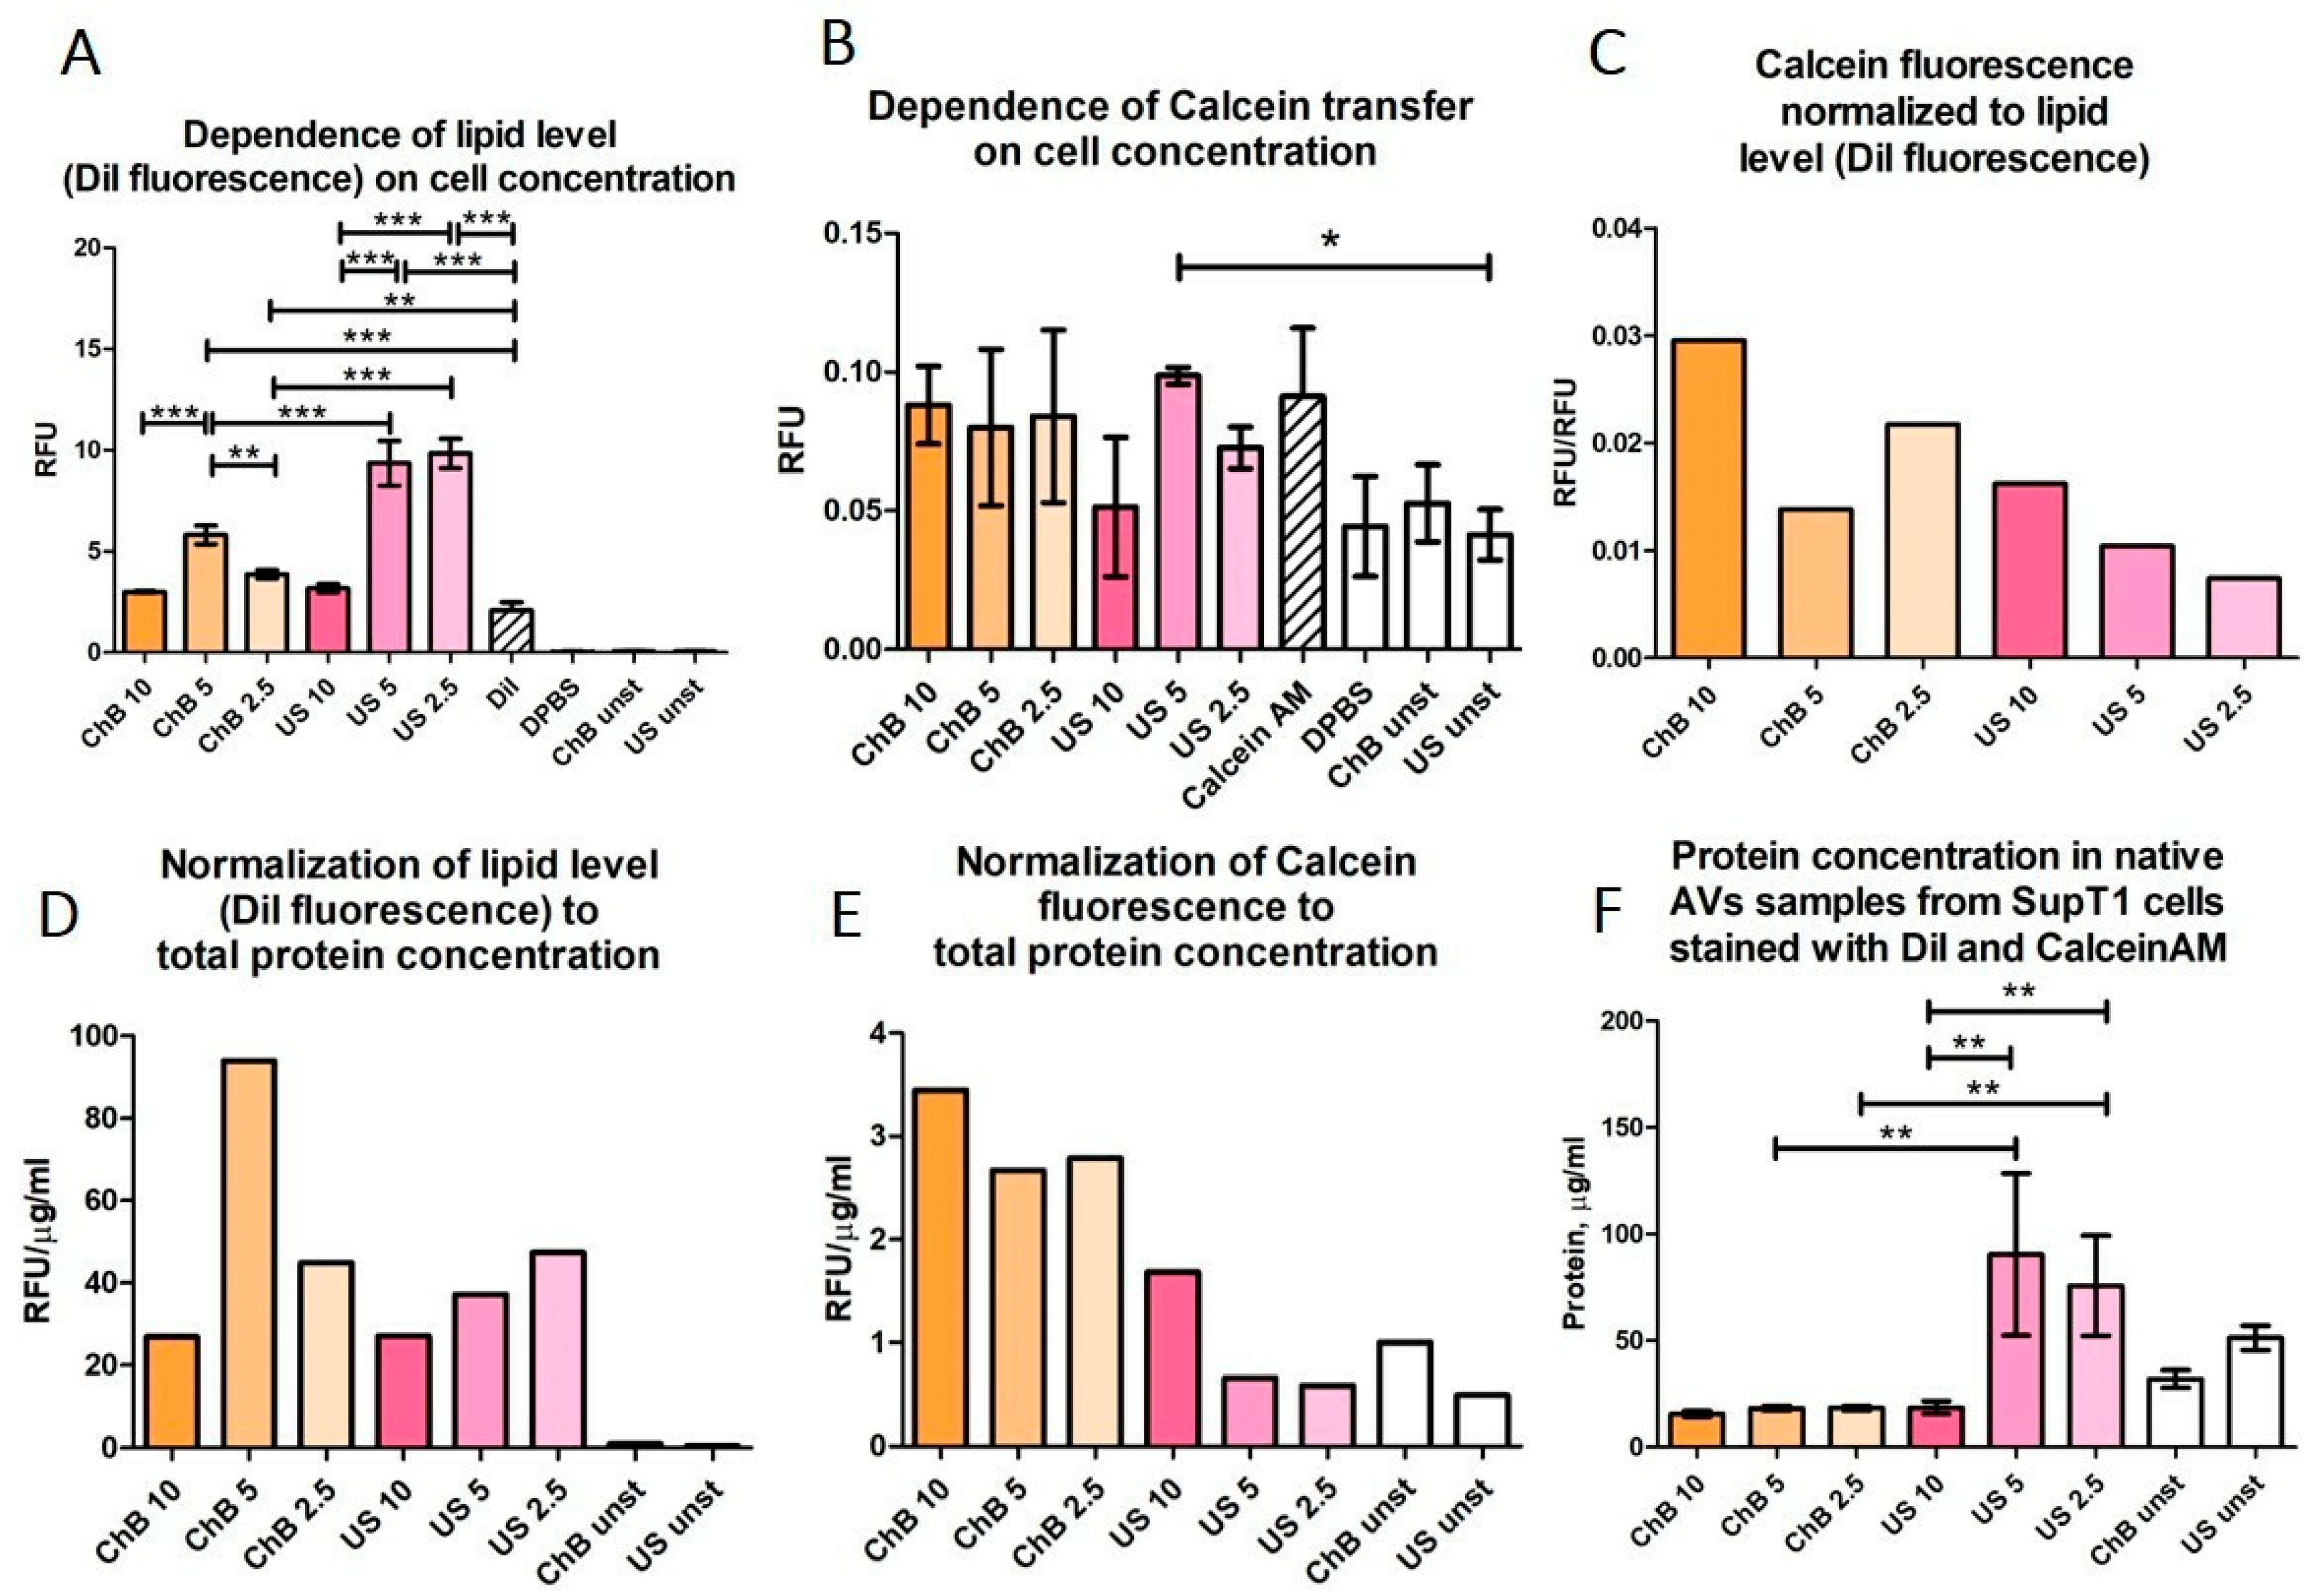
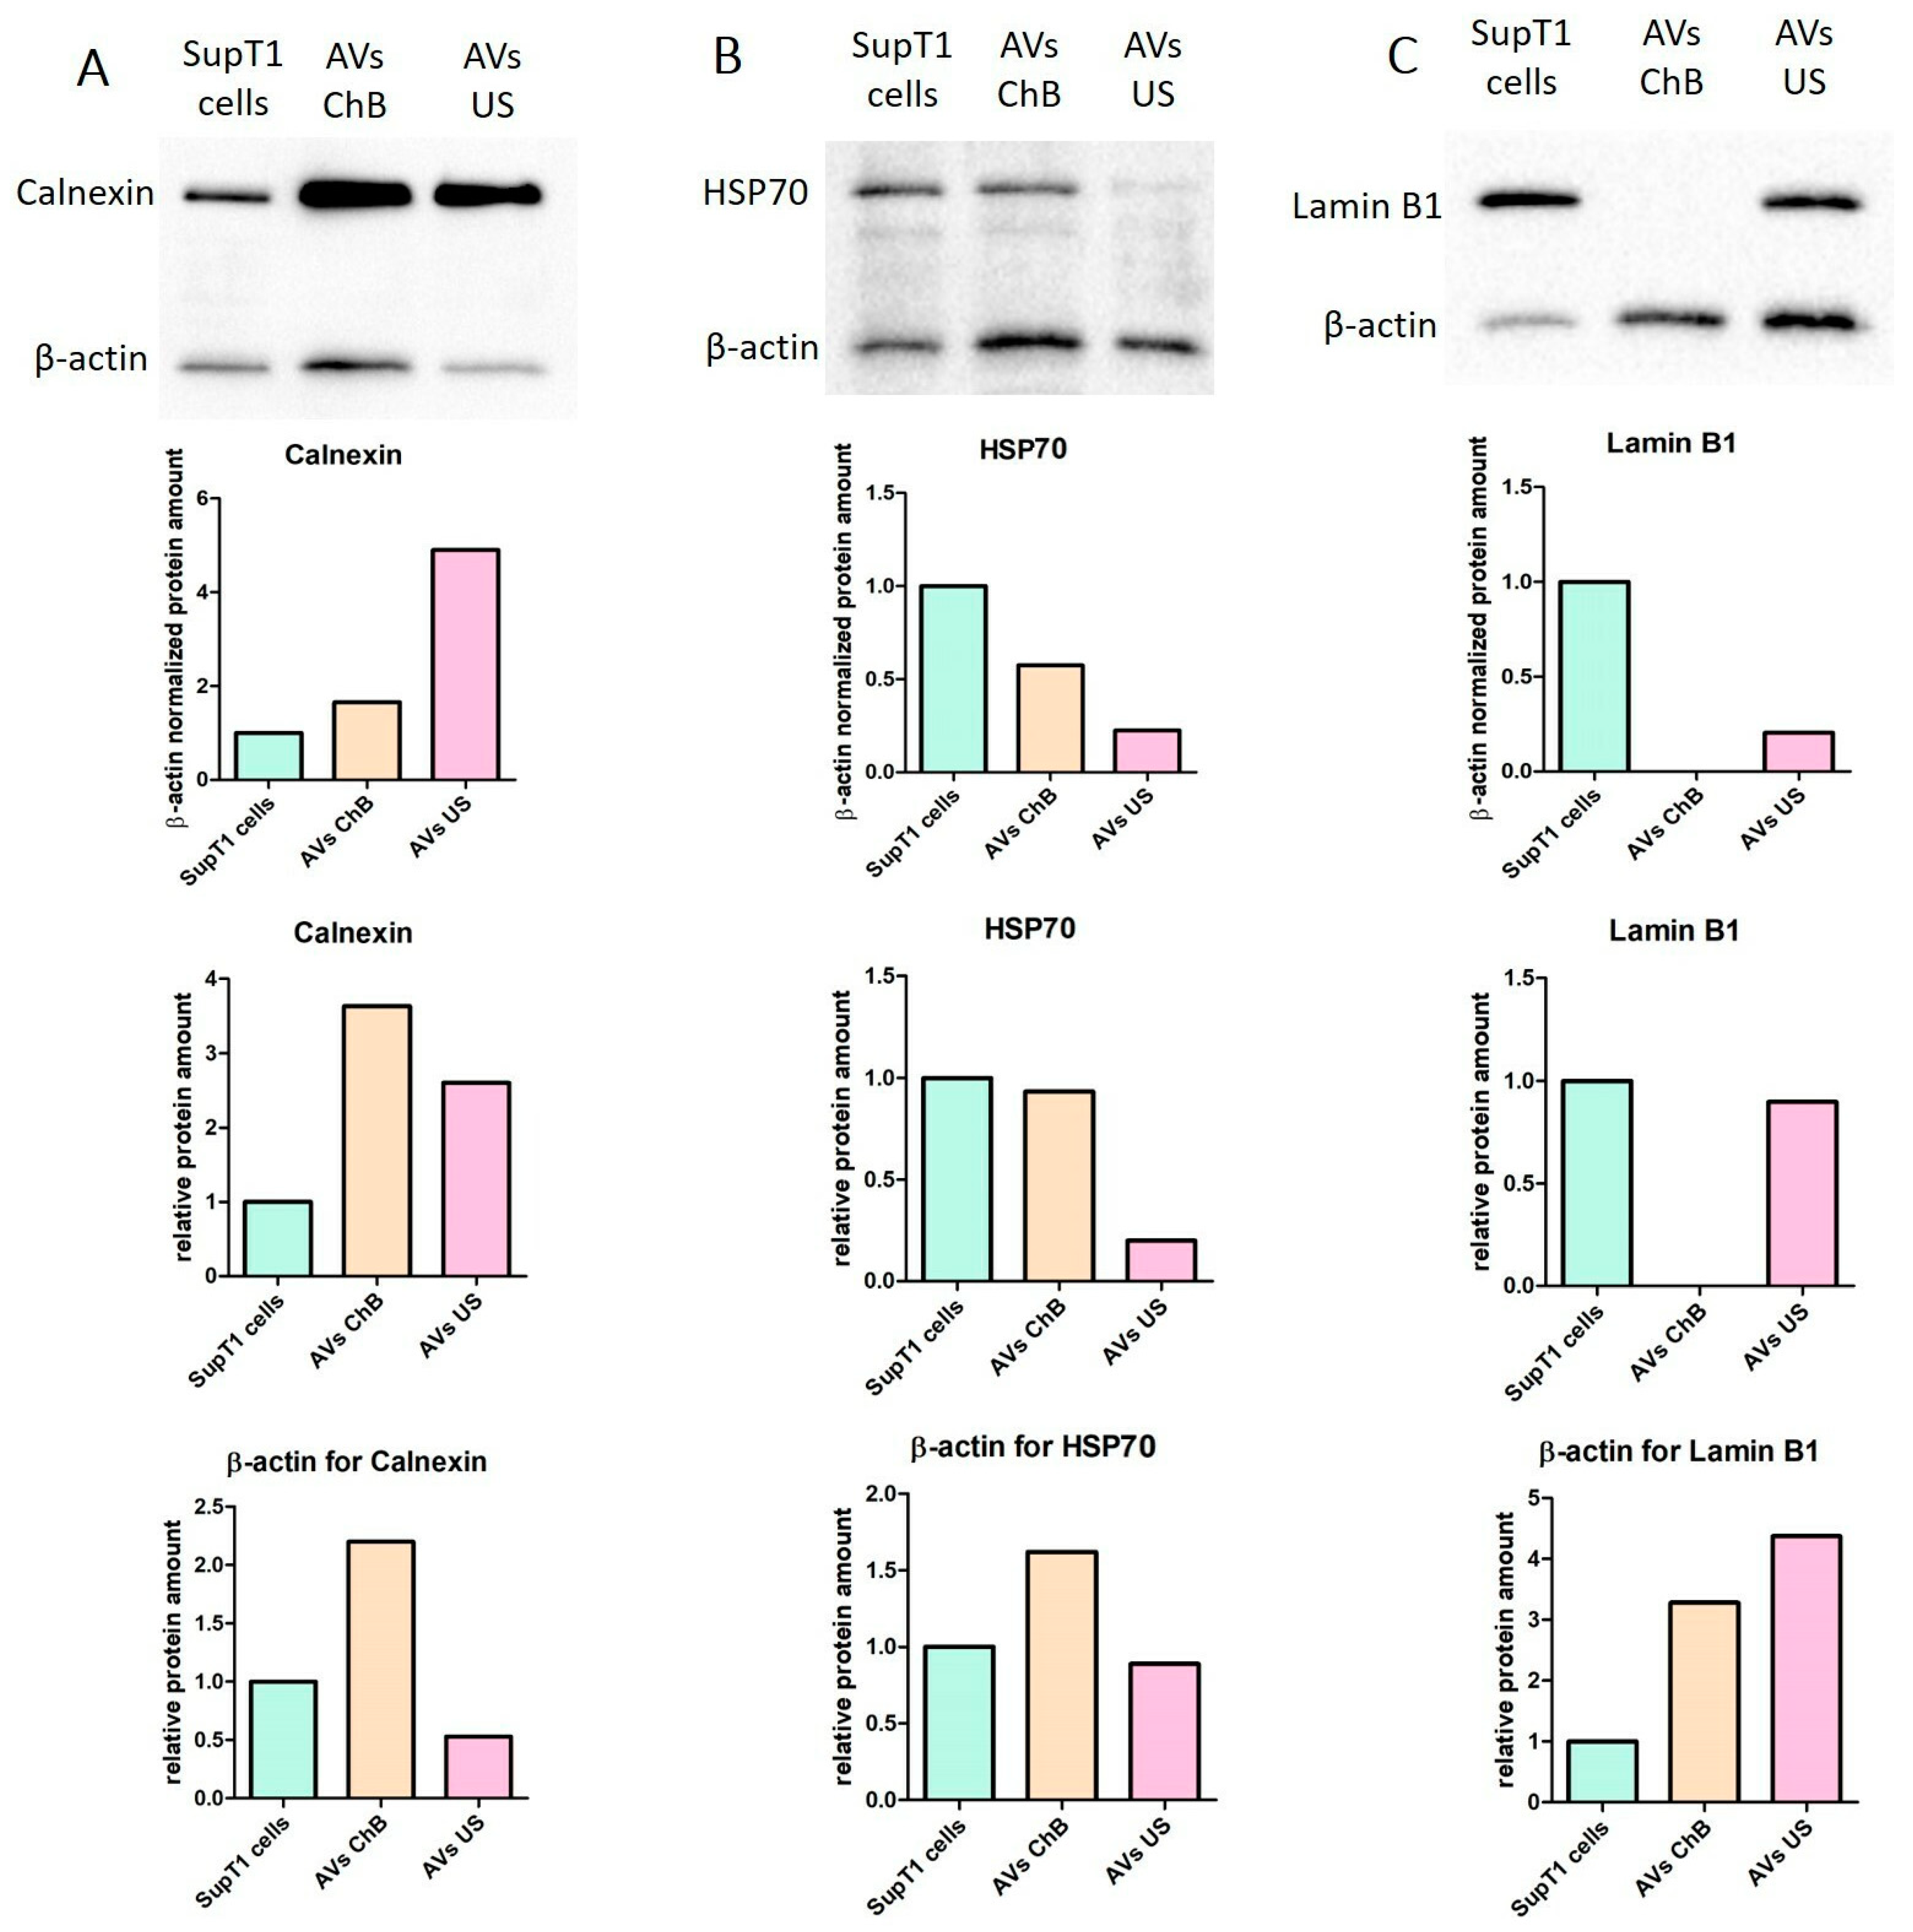
3.2. AVs from SupT1 Cells Contain Various Cellular Components of the Donor Cells
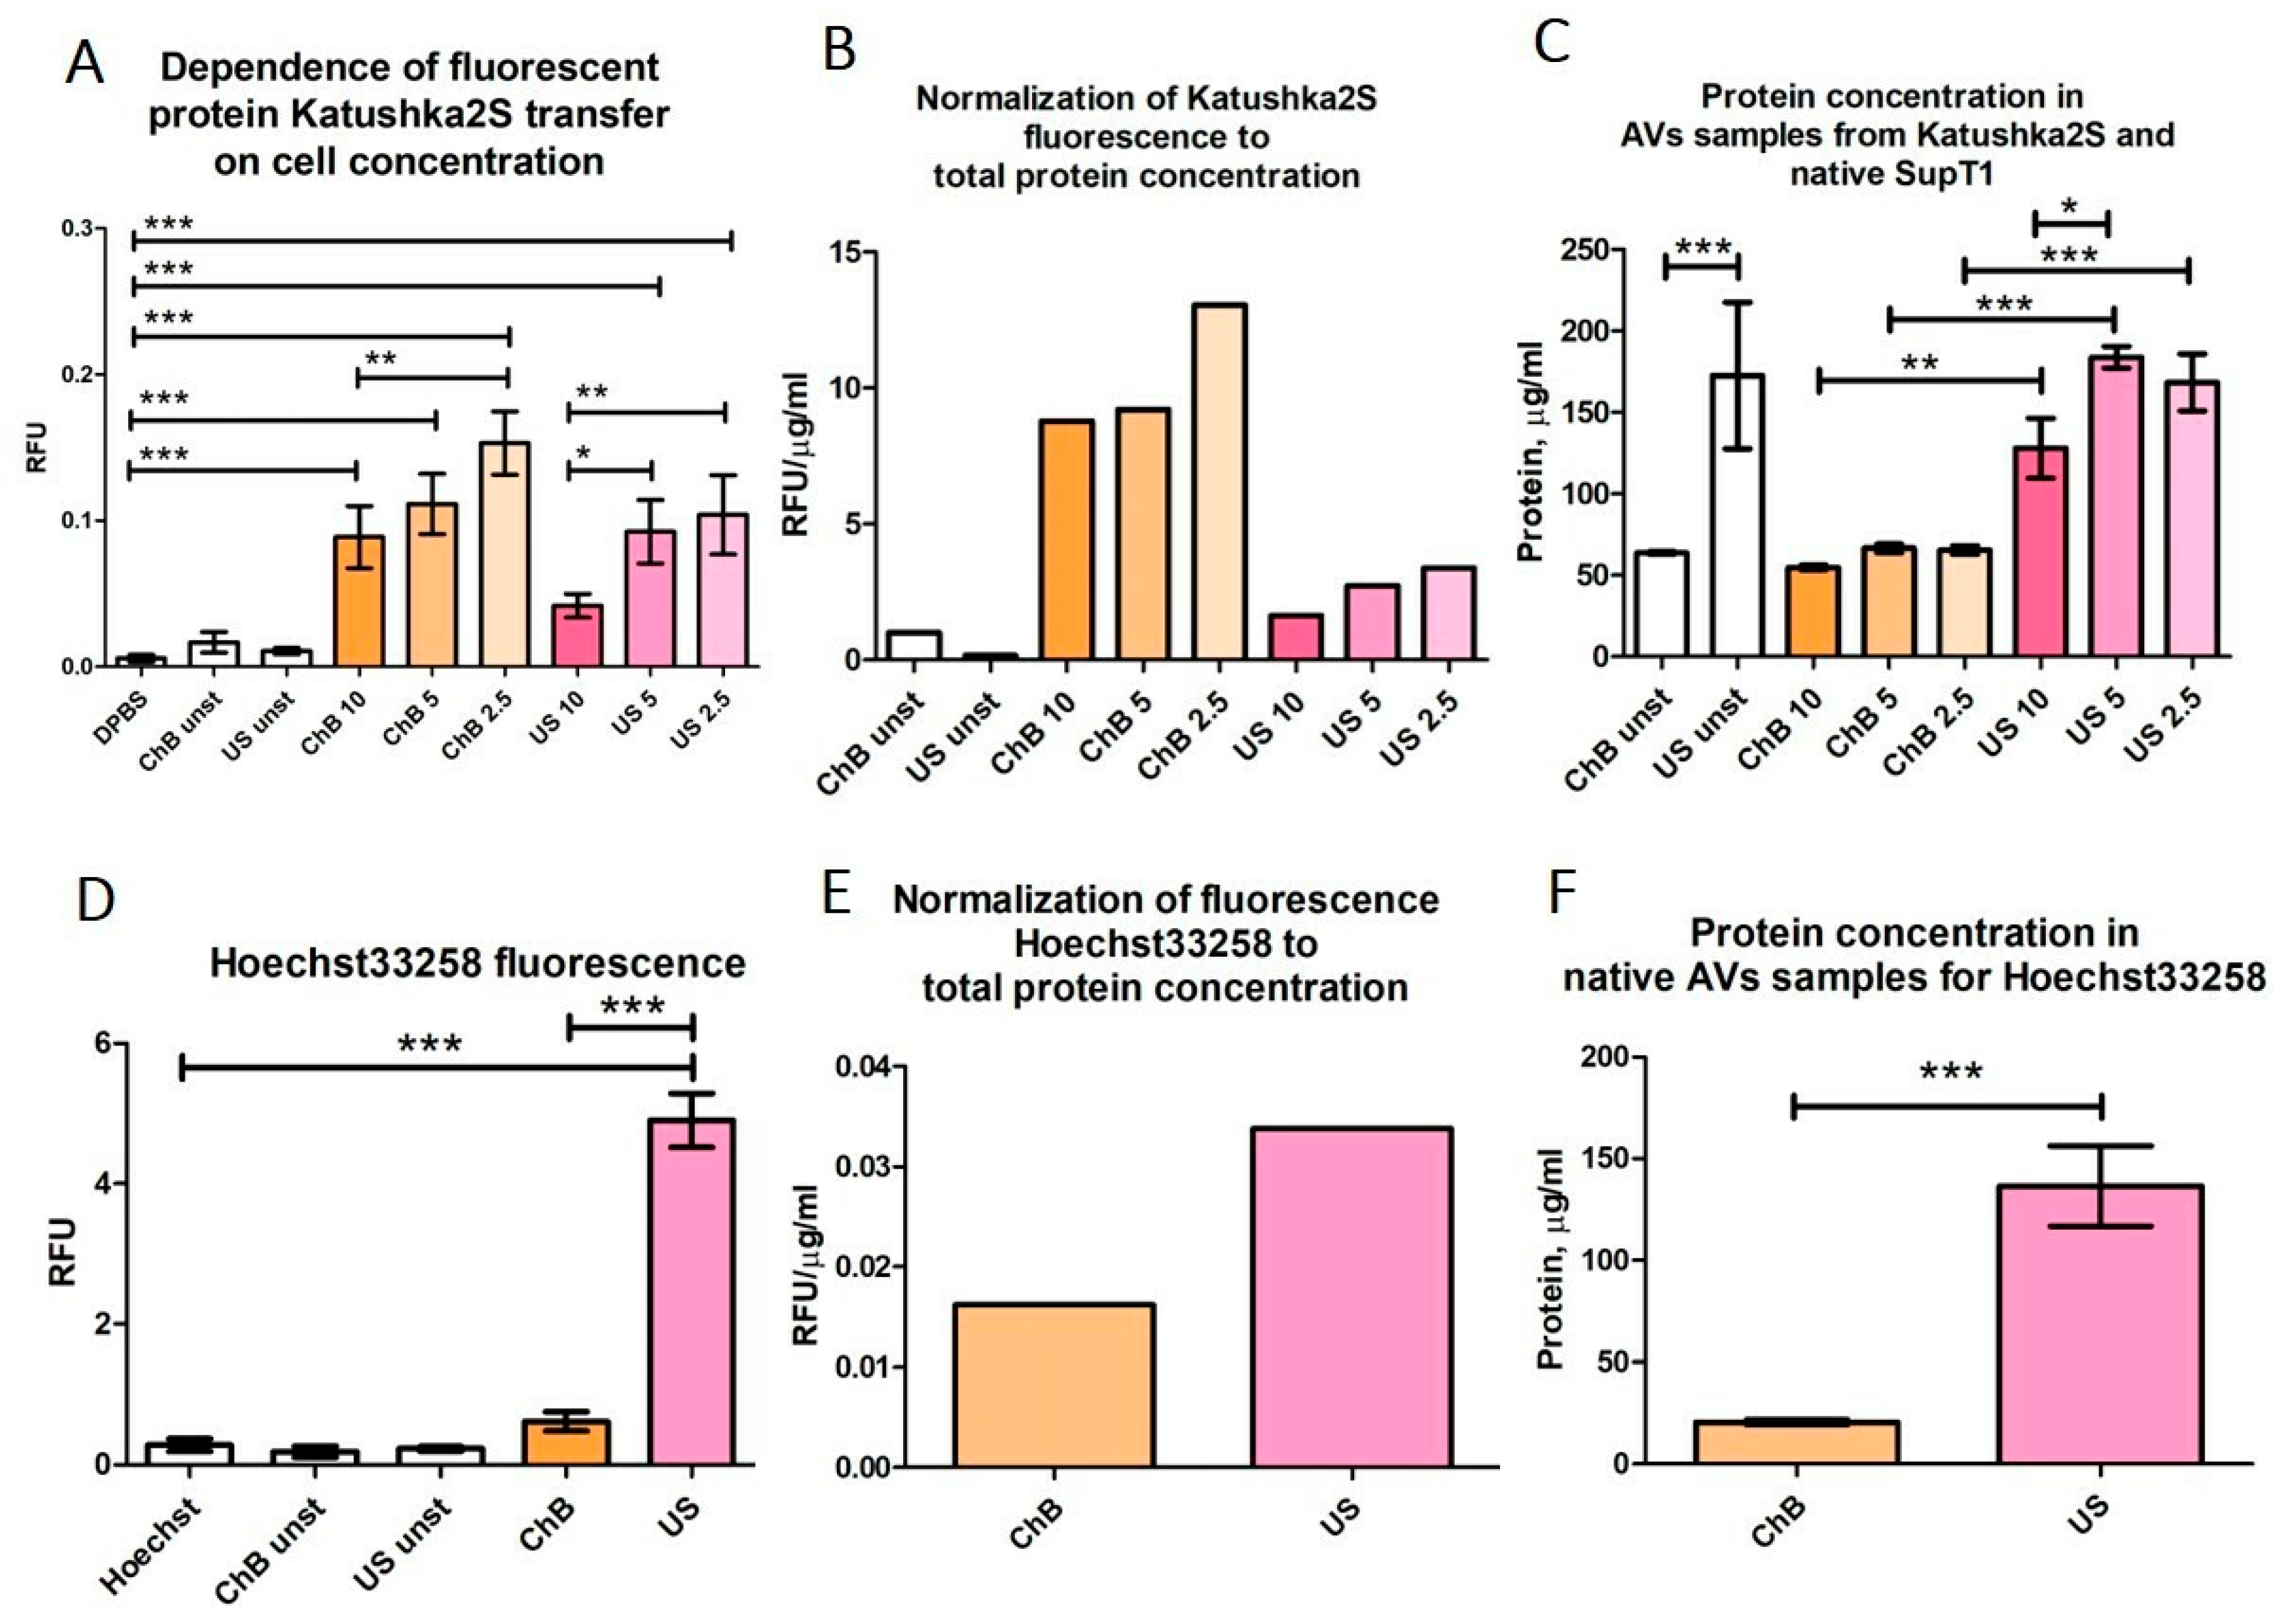
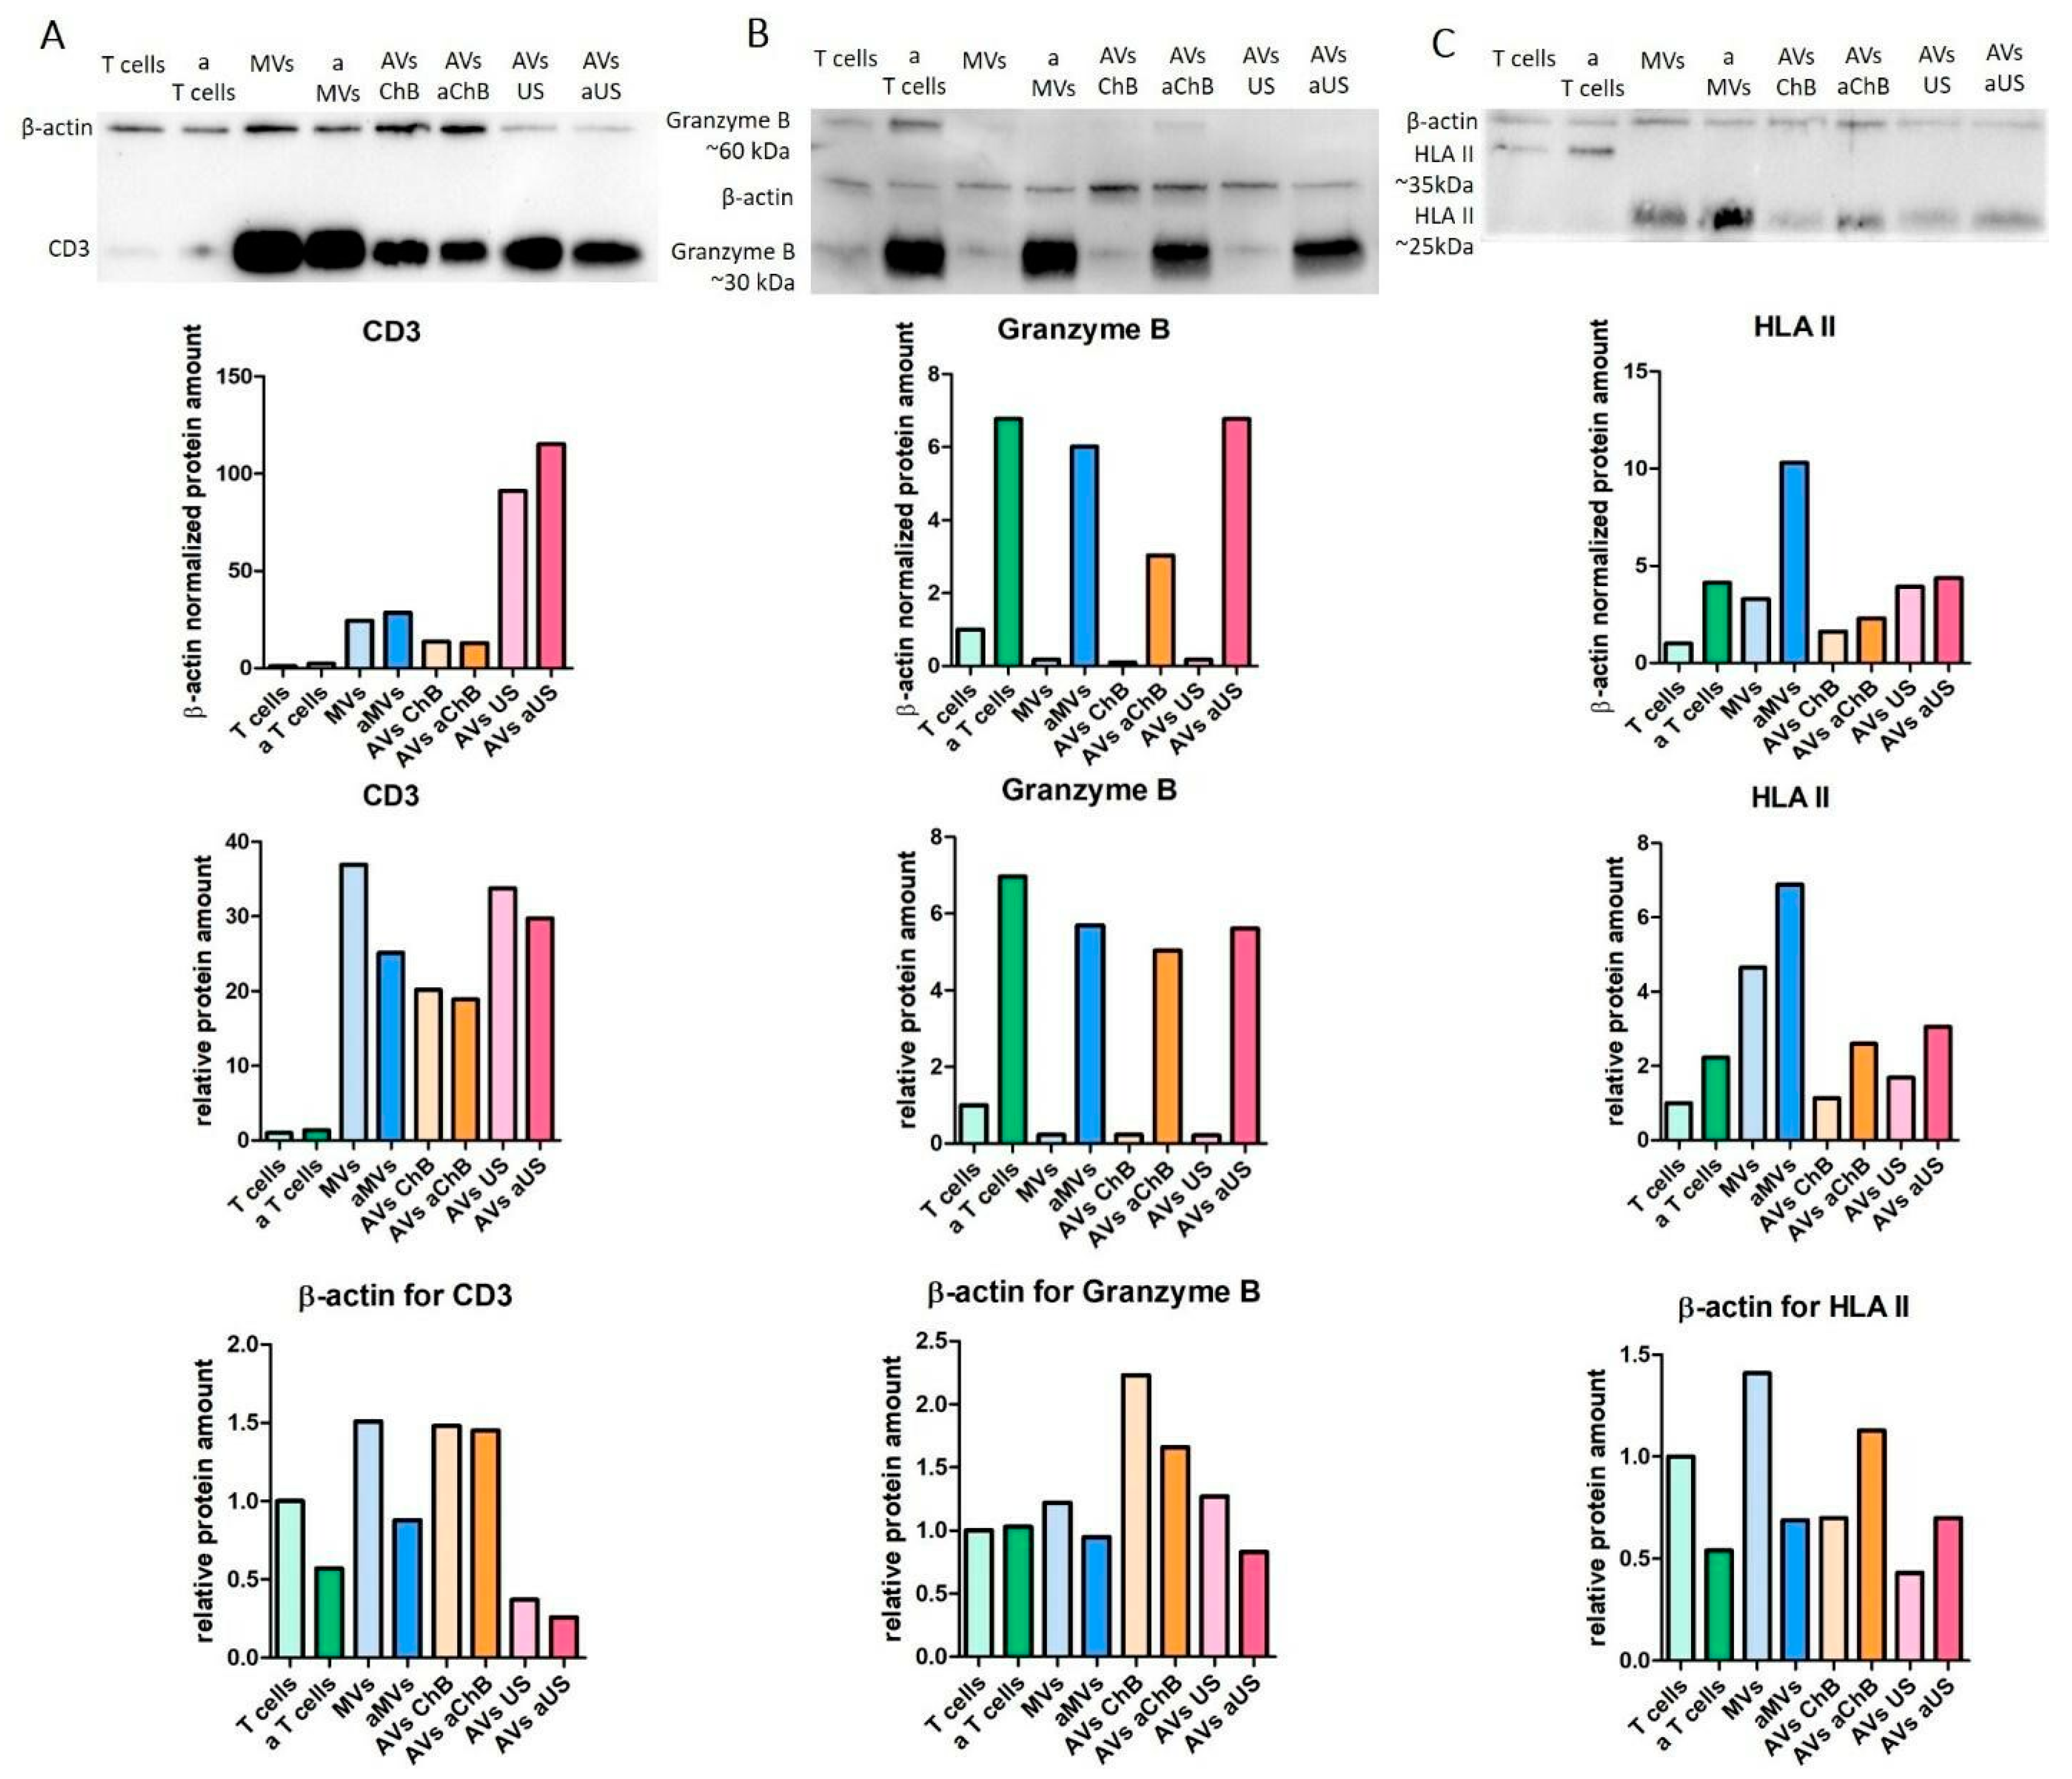
3.3. AVs from Primary T Cells Generated with Cytochalasin B or Ultrasonication Carry Key Functional Proteins
4. Discussion
Supplementary Materials
Author Contributions
Funding
Institutional Review Board Statement
Informed Consent Statement
Data Availability Statement
Conflicts of Interest
References
- Bahmani, L.; Ullah, M. Different Sourced Extracellular Vesicles and Their Potential Applications in Clinical Treatments. Cells 2022, 11, 1989. [Google Scholar] [CrossRef] [PubMed]
- Vergani, E.; Daveri, E.; Vallacchi, V.; Bergamaschi, L.; Lalli, L.; Castelli, C.; Rodolfo, M.; Rivoltini, L.; Huber, V. Extracellular vesicles in anti-tumor immunity. Semin. Cancer Biol. 2022, 86 Pt 1, 64–79. [Google Scholar] [CrossRef] [PubMed]
- Zhang, F.; Guo, J.; Zhang, Z.; Duan, M.; Wang, G.; Qian, Y.; Zhao, H.; Yang, Z.; Jiang, X. Application of engineered extracellular vesicles for targeted tumor therapy. J. Biomed. Sci. 2022, 29, 14. [Google Scholar] [CrossRef] [PubMed]
- Ramos-Zaldívar, H.M.; Polakovicova, I.; Salas-Huenuleo, E.; Corvalán, A.H.; Kogan, M.J.; Yefi, C.P.; Andia, M.E. Extracellular vesicles through the blood-brain barrier: A review. Fluids Barriers CNS 2022, 19, 60. [Google Scholar] [CrossRef] [PubMed]
- Chen, J.; Tan, Q.; Yang, Z.; Jin, Y. Engineered extracellular vesicles: Potentials in cancer combination therapy. J. Nanobiotechnol. 2022, 20, 132. [Google Scholar] [CrossRef] [PubMed]
- Estes, S.; Konstantinov, K.; Young, J.D. Manufactured extracellular vesicles as human therapeutics: Challenges, advances, and opportunities. Curr. Opin. Biotechnol. 2022, 77, 102776. [Google Scholar] [CrossRef] [PubMed]
- Syromiatnikova, V.; Prokopeva, A.; Gomzikova, M. Methods of the Large-Scale Production of Extracellular Vesicles. Int. J. Mol. Sci. 2022, 23, 10522. [Google Scholar] [CrossRef] [PubMed]
- Khannanov, A.; Burmatova, A.; Ignatyeva, K.; Vagizov, F.; Kiiamov, A.; Tayurskii, D.; Cherosov, M.; Gerasimov, A.; Vladimir, E.; Kutyreva, M. Effect of the Synthetic Approach on the Formation and Magnetic Properties of Iron-Based Nanophase in Branched Polyester Polyol Matrix. Int. J. Mol. Sci. 2022, 23, 14764. [Google Scholar] [CrossRef] [PubMed]
- Malloy, A.; Hole, P.; Carr, B. NanoParticle Tracking Analysis. Halo System MRS Online Proc. Libr. 2006, 952, 204. [Google Scholar] [CrossRef]
- Dragovic, R.A.; Gardiner, C.; Brooks, A.S.; Tannetta, D.S.; Ferguson, D.J.; Hole, P.; Carr, B.; Redman, C.W.; Harris, A.L.; Dobson, P.J.; et al. Sizing and phenotyping of cellular vesicles using Nanoparticle Tracking Analysis. Nanomedicine 2011, 7, 780–788. [Google Scholar] [CrossRef]
- Wang, L.; Abhange, K.K.; Wen, Y.; Chen, Y.; Xue, F.; Wang, G.; Tong, J.; Zhu, C.; He, X.; Wan, Y. Preparation of Engineered Extracellular Vesicles Derived from Human Umbilical Cord Mesenchymal Stem Cells with Ultrasonication for Skin Rejuvenation. ACS Omega 2019, 4, 22638–22645. [Google Scholar] [CrossRef] [PubMed]
- Nair, A.; Bu, J.; Rawding, P.A.; Do, S.C.; Li, H.; Hong, S. Cytochalasin B Treatment and Osmotic Pressure Enhance the Production of Extracellular Vesicles (EVs) with Improved Drug Loading Capacity. Nanomaterials 2022, 12, 3. [Google Scholar] [CrossRef] [PubMed]
- Mueller, H.; Butt, H.-J.; Bamberg, E. Force Measurements on Myelin Basic Protein Adsorbed to Mica and Lipid Bilayer Surfaces Done with the Atomic Force Microscope. Biophys. J. 1999, 76, 1072–1079. [Google Scholar] [CrossRef] [PubMed]
- Ma, Y.; Poole, K.; Goyette, J.; Gaus, K. Introducing Membrane Charge and Membrane Potential to T Cell Signaling. Front. Immunol. 2017, 8, 1513. [Google Scholar] [CrossRef] [PubMed]
- Kozlov, G.; Gehring, K. Calnexin cycle—Structural features of the ER chaperone system. FEBS J. 2020, 287, 4322–4340. [Google Scholar] [CrossRef] [PubMed]
- Longshaw, V.M.; Chapple, J.P.; Balda, M.S.; Cheetham, M.E.; Blatch, G.L. Nuclear translocation of the Hsp70/Hsp90 organizing protein mSTI1 is regulated by cell cycle kinases. J. Cell Sci. 2004, 117 Pt 5, 701–710. [Google Scholar] [CrossRef] [PubMed]
- Evangelisti, C.; Rusciano, I.; Mongiorgi, S.; Ramazzotti, G.; Lattanzi, G.; Manzoli, L.; Cocco, L.; Ratti, S. The wide and growing range of lamin B-related diseases: From laminopathies to cancer. Cell Mol. Life Sci. 2022, 79, 126. [Google Scholar] [CrossRef] [PubMed]
- Blanchard, N.; Lankar, D.; Faure, F.; Regnault, A.; Dumont, C.; Raposo, G.; Hivroz, C. TCR Activation of Human T Cells Induces the Production of Exosomes Bearing the TCR/CD3/ζ Complex. J. Immunol. 2002, 168, 3235–3241. [Google Scholar] [CrossRef] [PubMed]
- Afonina, I.S.; Cullen, S.P.; Martin, S.J. Cytotoxic and non-cytotoxic roles of the CTL/NK protease granzyme B. Immunol. Rev. 2010, 235, 105–116. [Google Scholar] [CrossRef]
- Estébanez-Perpiña, E.; Fuentes-Prior, P.; Belorgey, D.; Braun, M.; Kiefersauer, R.; Maskos, K.; Huber, R.; Rubin, H.; Bode, W. Crystal structure of the caspase activator human granzyme B, a proteinase highly specific for an Asp-P1 residue. Biol. Chem. 2000, 381, 1203–1214. [Google Scholar] [CrossRef]
- Holling, T.M.; van der Stoep, N.; Quinten, E.; van den Elsen, P.J. Activated Human T Cells Accomplish MHC Class II Expression Through T Cell-Specific Occupation of Class II Transactivator Promoter III. J. Immunol. 2002, 168, 763–770. [Google Scholar] [CrossRef] [PubMed]
- Serra, P.; Garabatos, N.; Singha, S.; Fandos, C.; Garnica, J.; Solé, P.; Parras, D.; Yamanouchi, J.; Blanco, J.; Tort, M.; et al. Increased yields and biological potency of knob-into-hole-based soluble MHC class II molecules. Nat. Commun. 2019, 10, 4917. [Google Scholar] [CrossRef] [PubMed]

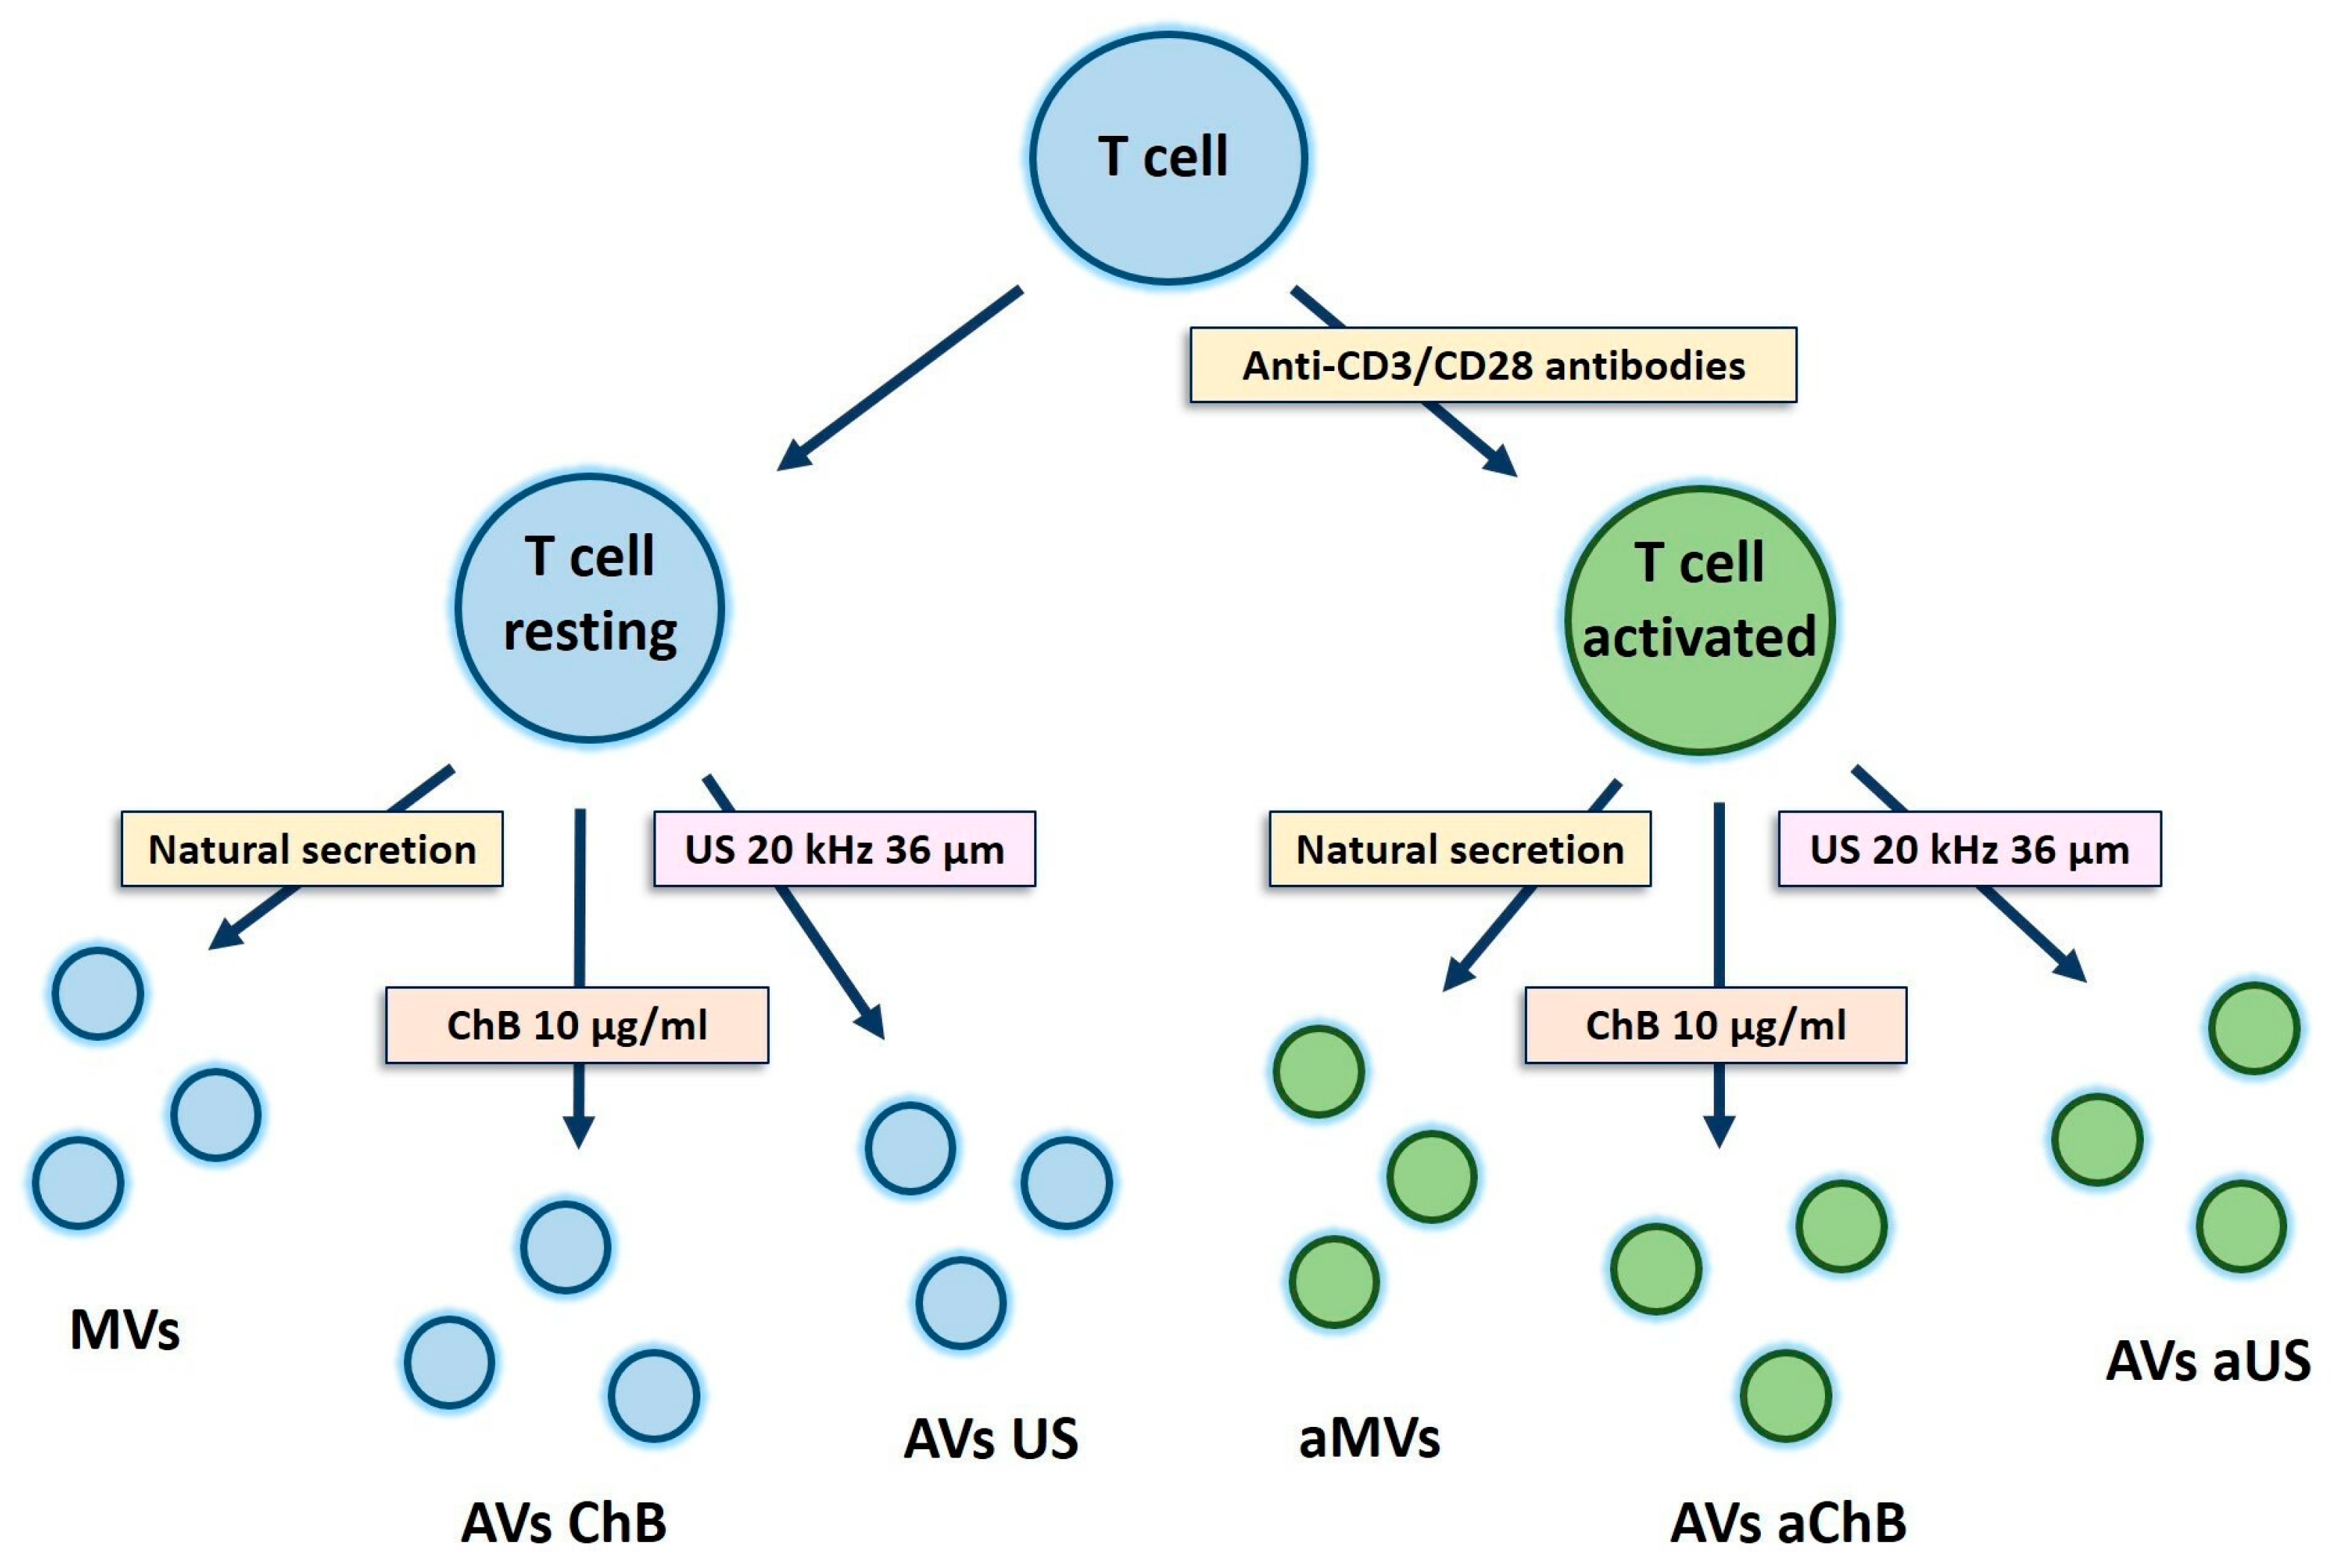
| Cell Source | Method of Induction | Sample Abbreviation |
|---|---|---|
| Resting T cells | No (natural secretion) | MVs (naturally secreted microvesicles) |
| Resting T cells (or SupT1 cells) | Cytochalasin B at 10 µg/mL for 30 min, with vortex | AVs ChB (artificial vesicles generated with cytochalasin B) |
| Resting T cells (or SupT1 cells) | Ultrasonication 20 kHz, amplitude 36 µm, 1 min (0.5 s sonication, 0.5 s pause) | AVs US (artificial vesicles generated with ultrasonication) |
| Activated T cells | No (natural secretion) | aMVs (natural microvesicles from activated T cells) |
| Activated T cells | Cytochalasin B at 10 µg/mL for 30 min, with vortex | AVs aChB (artificial vesicles from activated T cells generated with cytochalasin B) |
| Activated T cells | Ultrasonication 20 kHz, amplitude 36 µm, 1 min (0.5 s sonication, 0.5 s pause) | AVs aUS (artificial vesicles generated from activated T cells with ultrasonication) |
Disclaimer/Publisher’s Note: The statements, opinions and data contained in all publications are solely those of the individual author(s) and contributor(s) and not of MDPI and/or the editor(s). MDPI and/or the editor(s) disclaim responsibility for any injury to people or property resulting from any ideas, methods, instructions or products referred to in the content. |
© 2024 by the authors. Licensee MDPI, Basel, Switzerland. This article is an open access article distributed under the terms and conditions of the Creative Commons Attribution (CC BY) license (https://creativecommons.org/licenses/by/4.0/).
Share and Cite
Zmievskaya, E.A.; Mukhametshin, S.A.; Ganeeva, I.A.; Gilyazova, E.M.; Siraeva, E.T.; Kutyreva, M.P.; Khannanov, A.A.; Yuan, Y.; Bulatov, E.R. Artificial Extracellular Vesicles Generated from T Cells Using Different Induction Techniques. Biomedicines 2024, 12, 919. https://doi.org/10.3390/biomedicines12040919
Zmievskaya EA, Mukhametshin SA, Ganeeva IA, Gilyazova EM, Siraeva ET, Kutyreva MP, Khannanov AA, Yuan Y, Bulatov ER. Artificial Extracellular Vesicles Generated from T Cells Using Different Induction Techniques. Biomedicines. 2024; 12(4):919. https://doi.org/10.3390/biomedicines12040919
Chicago/Turabian StyleZmievskaya, Ekaterina A., Sabir A. Mukhametshin, Irina A. Ganeeva, Elvina M. Gilyazova, Elvira T. Siraeva, Marianna P. Kutyreva, Artur A. Khannanov, Youyong Yuan, and Emil R. Bulatov. 2024. "Artificial Extracellular Vesicles Generated from T Cells Using Different Induction Techniques" Biomedicines 12, no. 4: 919. https://doi.org/10.3390/biomedicines12040919
APA StyleZmievskaya, E. A., Mukhametshin, S. A., Ganeeva, I. A., Gilyazova, E. M., Siraeva, E. T., Kutyreva, M. P., Khannanov, A. A., Yuan, Y., & Bulatov, E. R. (2024). Artificial Extracellular Vesicles Generated from T Cells Using Different Induction Techniques. Biomedicines, 12(4), 919. https://doi.org/10.3390/biomedicines12040919