Proteomics-Based Detection of Immune Dysfunction in an Elite Adventure Athlete Trekking Across the Antarctica

 ,
, 
Abstract
:
1. Introduction
2. Materials and Methods
2.1. Participant
2.2. 28-Week Data Collection
2.3. Proteomics Procedures
2.4. Data Processing
2.5. Statistics
2.6. Protein–Protein Interaction Network Analysis
3. Results
4. Discussion
5. Conclusions
Supplementary Materials
Author Contributions
Funding
Conflicts of Interest
Abbreviations
| ACN | Acetonitrile |
| AGC | Automatic gain control |
| AmBiC | Ammonium bicarbonate |
| APO | Apolipoprotein |
| C5a | Complement 5a |
| C8G | Complement C8 gamma |
| CBG | Cortisol-binding globulin |
| CRP | C-reactive protein |
| DAMP | Danger-associated molecular pattern |
| desARG | Des arginine |
| DIA | Data independent acquisition |
| DIA-NN | Data independent acquisition-neural networks |
| DBS | Dried blood spot |
| FA | Formic acid |
| FDR | False discovery rate |
| GEE | Generalized estimating equation |
| GLMM | Generalized linear mixed models |
| GO | Gene ontology |
| HDL | High density lipoprotein |
| IL-10 | Interleukin-10 |
| LASSO | Least absolute shrinkage and selection operation |
| LDLR | Low density lipoprotein receptor |
| LIMMA | Linear models for microarray data |
| MAC | Membrane attack complex |
| NanoLC-MS/MS | Nano-electrospray ionization liquid chromatography tandem mass spectrometry |
| NFOR | Nonfunctional overreaching |
| OTS | Overtraining syndrome |
| PPI | Protein–protein interaction |
| RAAM | Race Across America |
| sPLSda | Sparse partial least squares discriminant analysis |
| STAT3 | Signal transducer and activator of transcription 3 |
| STRING | Search tool for the retrieval of interacting genes/proteins |
| TDS | Training distress scale |
| TNF-α | Tumor necrosis factor alpha |
| UPLC | Ultraperformance liquid chromatography |
References
- Meeusen, R.; Duclos, M.; Foster, C.; Fry, A.; Gleeson, M.; Nieman, D.; Raglin, J.; Rietjens, G.; Steinacker, J.; Urhausen, A.; et al. Prevention, diagnosis, and treatment of the overtraining syndrome: Joint consensus statement of the European College of Sport Science and the American College of Sports Medicine. Med. Sci. Sports Exerc. 2013, 45, 186–205. [Google Scholar] [CrossRef] [PubMed] [Green Version]
- Aubry, A.; Hausswirth, C.; Louis, J.; Coutts, A.J.; Le Meur, Y. Functional overreaching: The key to peak performance during the taper? Med. Sci. Sports Exerc. 2014, 46, 1769–1777. [Google Scholar] [CrossRef] [PubMed]
- Soligard, T.; Schwellnus, M.; Alonso, J.M.; Bahr, R.; Clarsen, B.; Dijkstra, H.P.; Gabbett, T.; Gleeson, M.; Hägglund, M.; Hutchinson, M.R.; et al. How much is too much? (Part 1) International Olympic Committee consensus statement on load in sport and risk of injury. Br. J. Sports Med. 2016, 50, 1030–1041. [Google Scholar] [CrossRef] [PubMed] [Green Version]
- Nieman, D.C.; Groen, A.J.; Pugachev, A.; Vacca, G. Detection of functional overreaching in endurance athletes using proteomics. Proteomes 2018, 6, 33. [Google Scholar] [CrossRef] [PubMed]
- Szklarczyk, D.; Morris, J.H.; Cook, H.; Kuhn, M.; Wyder, S.; Simonovic, M.; Santos, A.; Doncheva, N.T.; Roth, A.; Bork, P.; et al. The STRING database in 2017: Quality-controlled protein-protein association networks, made broadly accessible. Nucleic Acids Res. 2017, 45, D362–D368. [Google Scholar] [CrossRef] [PubMed]
- Martin, N.J.; Bunch, J.; Cooper, H.J. Dried blood spot proteomics: Surface extraction of endogenous proteins coupled with automated sample preparation and mass spectrometry analysis. J. Am. Soc. Mass Spectrom. 2013, 24, 1242–1249. [Google Scholar] [CrossRef] [Green Version]
- Merritt, E.K.; Nieman, D.C.; Toone, B.R.; Groen, A.; Pugachev, A. Proteomic markers of non-functional overreaching during the Race Across America (RAAM): A case study. Front. Physiol. 2019, 10, 1410. [Google Scholar] [CrossRef]
- Kurgan, N.; Noaman, N.; Pergande, M.R.; Cologna, S.M.; Coorssen, J.R.; Klentrou, P. Changes to the human serum proteome in response to high intensity interval exercise: A sequential top-down proteomic analysis. Front. Physiol. 2019, 10, 362. [Google Scholar] [CrossRef]
- Whitham, M.; Parker, B.L.; Friedrichsen, M.; Hingst, J.R.; Hjorth, M.; Hughes, W.E.; Egan, C.L.; Cron, L.; Watt, K.I.; Kuchel, R.P.; et al. Extracellular vesicles provide a means for tissue crosstalk during exercise. Cell Metab. 2018, 27, 237–251. [Google Scholar] [CrossRef] [Green Version]
- Scoppetta, F.; Tartaglia, M.; Renzone, G.; Avellini, L.; Gaiti, A.; Scaloni, A.; Chiaradia, E. Plasma protein changes in horse after prolonged physical exercise: A proteomic study. J. Proteom. 2012, 75, 4494–4504. [Google Scholar] [CrossRef]
- Hou, D.D.; Zhu, R.Z.; Sun, Z.; Ma, X.D.; Wang, D.C.; Timothy, H.; Chen, W.N.; Yan, F.; Lei, P.; Han, X.W.; et al. Serum proteomics analysis in rats of immunosuppression induced by chronic stress. Scand. J. Immunol. 2016, 84, 165–173. [Google Scholar] [CrossRef] [PubMed] [Green Version]
- Guo, Y.; Li, E. Proteomics analysis of intensive exercise-induced disorders of gametogenesis in the testis using isobaric tags for relative and absolute quantification (iTRAQ) analysis. Reprod. Fertil. Dev. 2018, 30, 1785–1793. [Google Scholar] [CrossRef] [PubMed]
- Balfoussia, E.; Skenderi, K.; Tsironi, M.; Balfoussia, E.; Skenderi, K.; Tsironi, M.; Anagnostopoulos, A.K.; Parthimos, N.; Vougas, K.; Papassotiriou, I.; et al. A proteomic study of plasma protein changes under extreme physical stress. J. Proteom. 2014, 98, 1–14. [Google Scholar] [CrossRef] [PubMed]
- Cywinska, A.; Gorecka, R.; Szarska, E.; Witkowski, L.; Dziekan, P.; Schollenberger, A. Serum amyloid A level as a potential indicator of the status of endurance horses. Equine Vet. J. Suppl. 2010, 38, 23–27. [Google Scholar] [CrossRef]
- Cywinska, A.; Witkowski, L.; Szarska, E.; Schollenberger, A.; Winnicka, A. Serum amyloid A (SAA) concentration after training sessions in Arabian race and endurance horses. BMC Vet. Res. 2013, 9, 91. [Google Scholar] [CrossRef] [Green Version]
- Valle, E.; Zanatta, R.; Odetti, P.; Traverso, N.; Furfaro, A.; Bergero, D.; Badino, P.; Girardi, C.; Miniscalco, B.; Bergagna, S.; et al. Effects of competition on acute phase proteins and lymphocyte subpopulations—Oxidative stress markers in eventing horses. J. Anim. Physiol. Anim. Nutr. 2015, 99, 856–863. [Google Scholar] [CrossRef] [Green Version]
- Casella, S.; Fazio, F.; Russo, C.; Giudice, E.; Piccione, G. Acute phase proteins response in hunting dogs. J. Vet. Diagn. Investig. 2013, 25, 577–580. [Google Scholar] [CrossRef]
- Wakshlag, J.J.; Stokol, T.; Geske, S.M.; Greger, C.E.; Angle, C.T.; Gillette, R.L. Evaluation of exercise-induced changes in concentrations of C-reactive protein and serum biochemical values in sled dogs completing a long-distance endurance race. Am. J. Vet. Res. 2010, 71, 1207–1213. [Google Scholar] [CrossRef]
- Art, T.; Franck, T.; Gangl, M.; Votion, D.; Kohnen, S.; Deby-Dupont, G.; Serteyn, D. Plasma concentrations of myeloperoxidase in endurance and 3-day event horses after a competition. Equine Vet. J. Suppl. 2006, 36, 298–302. [Google Scholar] [CrossRef]
- Serteyn, D.; Sandersen, C.; Lejeune, J.P.; de la Rebière de Pouyade, G.; Ceusters, J.; Mouithys-Mickalad, A.; Niesten, A.; Fraipont, A.; van Erck, E.; Goachet, A.G.; et al. Effect of a 120 km endurance race on plasma and muscular neutrophil elastase and myeloperoxidase concentrations in horses. Equine Vet. J. Suppl. 2010, 38, 275–279. [Google Scholar] [CrossRef]
- Lejeune, J.P.; Sandersen, C.; Votion, D.; Caudron, I.; Vander Heyden, L.; Franck, T.; Ceusters, J.; Mouithys-Mickalad, A.; Niesten, A.; De La Rebière de Pouyade, G.; et al. Effect of intensive exercise on plasmatic neutrophil elastase level in eventing and endurance horses. Equine Vet. J. Suppl. 2010, 38, 12–16. [Google Scholar] [CrossRef] [PubMed]
- Grove, J.R.; Main, L.C.; Partridge, K.; Bishop, D.J.; Russell, S.; Shepherdson, A.; Ferguson, L. Training distress and performance readiness: Laboratory and field validation of a brief self-report measure. Scand. J. Med. Sci. Sports 2014, 24, e483–e490. [Google Scholar] [CrossRef] [PubMed]
- Demichev, V.; Messner, C.B.; Vernardis, S.I.; Lilley, K.S.; Ralser, M. DIA-NN: Neural networks and interference correction enable deep proteome coverage in high throughput. Nat. Methods 2020, 17, 41–44. [Google Scholar] [CrossRef] [PubMed]
- Ritchie, M.E.; Phipson, B.; Wu, D.; Hu, Y.; Law, C.W.; Shi, W.; Smyth, G.K. Limma powers differential expression analyses for RNA-sequencing and microarray studies. Nucleic Acids Res. 2015, 43, e47. [Google Scholar] [CrossRef]
- Rohart, F.; Gautier, B.; Singh, A.; Lê Cao, K.A. MixOmics: An R package for ‘omics feature selection and multiple data integration. PLoS Comput. Biol. 2017, 13, e1005752. [Google Scholar] [CrossRef] [Green Version]
- Friedman, J.; Hastie, T.; Tibshirani, R. Regularization paths for generalized linear models via coordinate descent. J. Stat. Softw. 2010, 33, 1–22. [Google Scholar] [CrossRef] [Green Version]
- Yao, X.; Gordon, E.M.; Figueroa, D.M.; Barochia, A.V.; Levine, S.J. Emerging roles of apolipoprotein E and apolipoprotein A-I in the pathogenesis and treatment of lung disease. Am. J. Respir. Cell Mol. Biol. 2016, 55, 159–169. [Google Scholar] [CrossRef] [Green Version]
- Bach-Ngohou, K.; Nazih, H.; Nazih-Sanderson, F.; Zaïr, Y.; Le Carrer, D.; Krempf, M.; Bard, J.M. Negative and independent influence of apolipoprotein E on C-reactive protein (CRP) concentration in obese adults. Potential anti-inflammatory role of apoE in vivo. Int. J. Obes. Relat. Metab. Disord. 2001, 25, 1752–1758. [Google Scholar] [CrossRef] [Green Version]
- Cunin, P.; Beauvillain, C.; Miot, C.; Augusto, J.F.; Preisser, L.; Blanchard, S.; Pignon, P.; Scotet, M.; Garo, E.; Fremaux, I.; et al. Clusterin facilitates apoptotic cell clearance and prevents apoptotic cell-induced autoimmune responses. Cell Death Dis. 2016, 7, e2215. [Google Scholar] [CrossRef]
- Jenne, D.E.; Tschopp, J. Clusterin: The intriguing guises of a widely expressed glycoprotein. Trends Biochem. Sci. 1992, 17, 154–159. [Google Scholar] [CrossRef]
- Lubbers, R.; van Essen, M.F.; van Kooten, C.; Trouw, L.A. Production of complement components by cells of the immune system. Clin. Exp. Immunol. 2017, 188, 183–194. [Google Scholar] [CrossRef] [PubMed] [Green Version]
- Manthey, H.D.; Woodruff, T.M.; Taylor, S.M.; Monk, P.N. Complement component 5a (C5a). Int. J. Biochem. Cell Biol. 2009, 41, 2114–2117.33. [Google Scholar] [CrossRef] [PubMed]
- Xu, S.; Venge, P. Lipocalins as biochemical markers of disease. Biochim. Biophys. Acta 2000, 1482, 298–307. [Google Scholar] [CrossRef]
- Zabetian-Targhi, F.; Mahmoudi, M.J.; Rezaei, N.; Mahmoudi, M. Retinol binding protein 4 in relation to diet, inflammation, immunity, and cardiovascular diseases. Adv. Nutr. 2015, 6, 748–762. [Google Scholar] [CrossRef] [Green Version]
- Meyer, E.J.; Nenke, M.A.; Rankin, W.; Lewis, J.G.; Torpy, D.J. Corticosteroid-binding globulin: A review of basic and clinical advances. Horm. Metab. Res. 2016, 48, 359–371. [Google Scholar] [CrossRef]
- Gardill, B.R.; Vogl, M.R.; Lin, H.Y.; Hammond, G.L.; Muller, Y.A. Corticosteroid-binding globulin: Structure-function implications from species differences. PLoS ONE 2012, 7, e52759. [Google Scholar] [CrossRef] [Green Version]
- Chao, J.; Li, P.; Chao, L. Kallistatin: Double-edged role in angiogenesis, apoptosis and oxidative stress. Biol. Chem. 2017, 398, 1309–1317. [Google Scholar] [CrossRef]
- Chao, J.; Guo, Y.; Chao, L. Protective role of endogenous kallistatin in vascular injury and senescence by inhibiting oxidative stress and inflammation. Oxid. Med. Cell Longev. 2018, 2018, 4138560. [Google Scholar] [CrossRef]
- Wu, G.; Quek, A.J.; Caradoc-Davies, T.T.; Mazzitelli, B.; Whisstock, J.C.; Law, R.H.P. Structural studies of plasmin inhibition. Biochem. Soc. Trans. 2019, 47, 541–557. [Google Scholar] [CrossRef]
- Cowland, J.B.; Borregaard, N. Granulopoiesis and granules of human neutrophils. Immunol. Rev. 2016, 273, 11–28. [Google Scholar] [CrossRef]
- Yin, C.; Heit, B. Armed for destruction: Formation, function and trafficking of neutrophil granules. Cell Tissue Res. 2018, 371, 455–471. [Google Scholar] [CrossRef] [PubMed]
- Schiopu, A.; Cotoi, O.S. S100A8 and S100A9: DAMPs at the crossroads between innate immunity, traditional risk factors, and cardiovascular disease. Mediators Inflamm. 2013, 2013, 828354. [Google Scholar] [CrossRef] [PubMed] [Green Version]
- Wang, S.; Song, R.; Wang, Z.; Jing, Z.; Wang, S.; Ma, J. S100A8/A9 in inflammation. Front. Immunol. 2018, 9, 1298. [Google Scholar] [CrossRef] [PubMed]
- Shirakawa, K.; Endo, J.; Kataoka, M.; Katsumata, Y.; Yoshida, N.; Yamamoto, T.; Isobe, S.; Moriyama, H.; Goto, S.; Kitakata, H.; et al. IL (Interleukin)-10-STAT3 galectin-3 axis is essential for osteopontin-producing reparative macrophage polarization after myocardial infarction. Circulation 2018, 138, 2021–2035. [Google Scholar] [CrossRef]
- MacKinnon, A.C.; Farnworth, S.L.; Hodkinson, P.S.; Henderson, N.C.; Atkinson, K.M.; Leffler, H.; Nilsson, U.J.; Haslett, C.; Forbes, S.J.; Sethi, T. Regulation of alternative macrophage activation by galectin-3. J. Immunol. 2008, 180, 2650–2658. [Google Scholar] [CrossRef] [Green Version]
- Schwebach, C.L.; Agrawal, R.; Lindert, S.; Kudryashova, E.; Kudryashov, D.S. The roles of actin-binding domains 1 and 2 in the calcium-dependent regulation of actin filament bundling by human plastins. J. Mol. Biol. 2017, 429, 2490–2508. [Google Scholar] [CrossRef] [PubMed]
- Hamey, J.J.; Wilkins, M.R. Methylation of elongation factor 1A: Where, who, and why? Trends Biochem. Sci. 2018, 43, 211–223. [Google Scholar] [CrossRef]
- Wang, J.C.; Lee, J.Y.; Christian, S.; Dang-Lawson, M.; Pritchard, C.; Freeman, S.A.; Gold, M.R. The Rap1-cofilin-1 pathway coordinates actin reorganization and MTOC polarization at the B cell immune synapse. J. Cell Sci. 2017, 130, 1094–1109. [Google Scholar] [CrossRef] [Green Version]
- Li, Y.; Jin, Y.; Liu, B.; Lu, D.; Zhu, M.; Jin, Y.; McNutt, M.A.; Yin, Y. PTENα promotes neutrophil chemotaxis through regulation of cell deformability. Blood 2019, 133, 2079–2089. [Google Scholar] [CrossRef]
- Matsumoto, M.; Hirata, T. Moesin regulates neutrophil rolling velocity in vivo. Cell Immunol. 2016, 304–305, 59–62. [Google Scholar] [CrossRef]
- Feuk-Lagerstedt, E.; Samuelsson, M.; Mosgoeller, W.; Movitz, C.; Rosqvist, A.; Bergström, J.; Larsson, T.; Steiner, M.; Prohaska, R.; Karlsson, A. The presence of stomatin in detergent-insoluble domains of neutrophil granule membranes. J. Leukoc. Biol. 2002, 72, 970–977. [Google Scholar] [PubMed]
- Geyer, P.E.; Holdt, L.M.; Teupser, D.; Mann, M. Revisiting biomarker discovery by plasma proteomics. Mol. Syst. Biol. 2017, 13, 942. [Google Scholar] [CrossRef] [PubMed]

| Gene | UniProt Identifier | Protein Description | Log-Fold Change | p-Value | Adjusted p-Value |
|---|---|---|---|---|---|
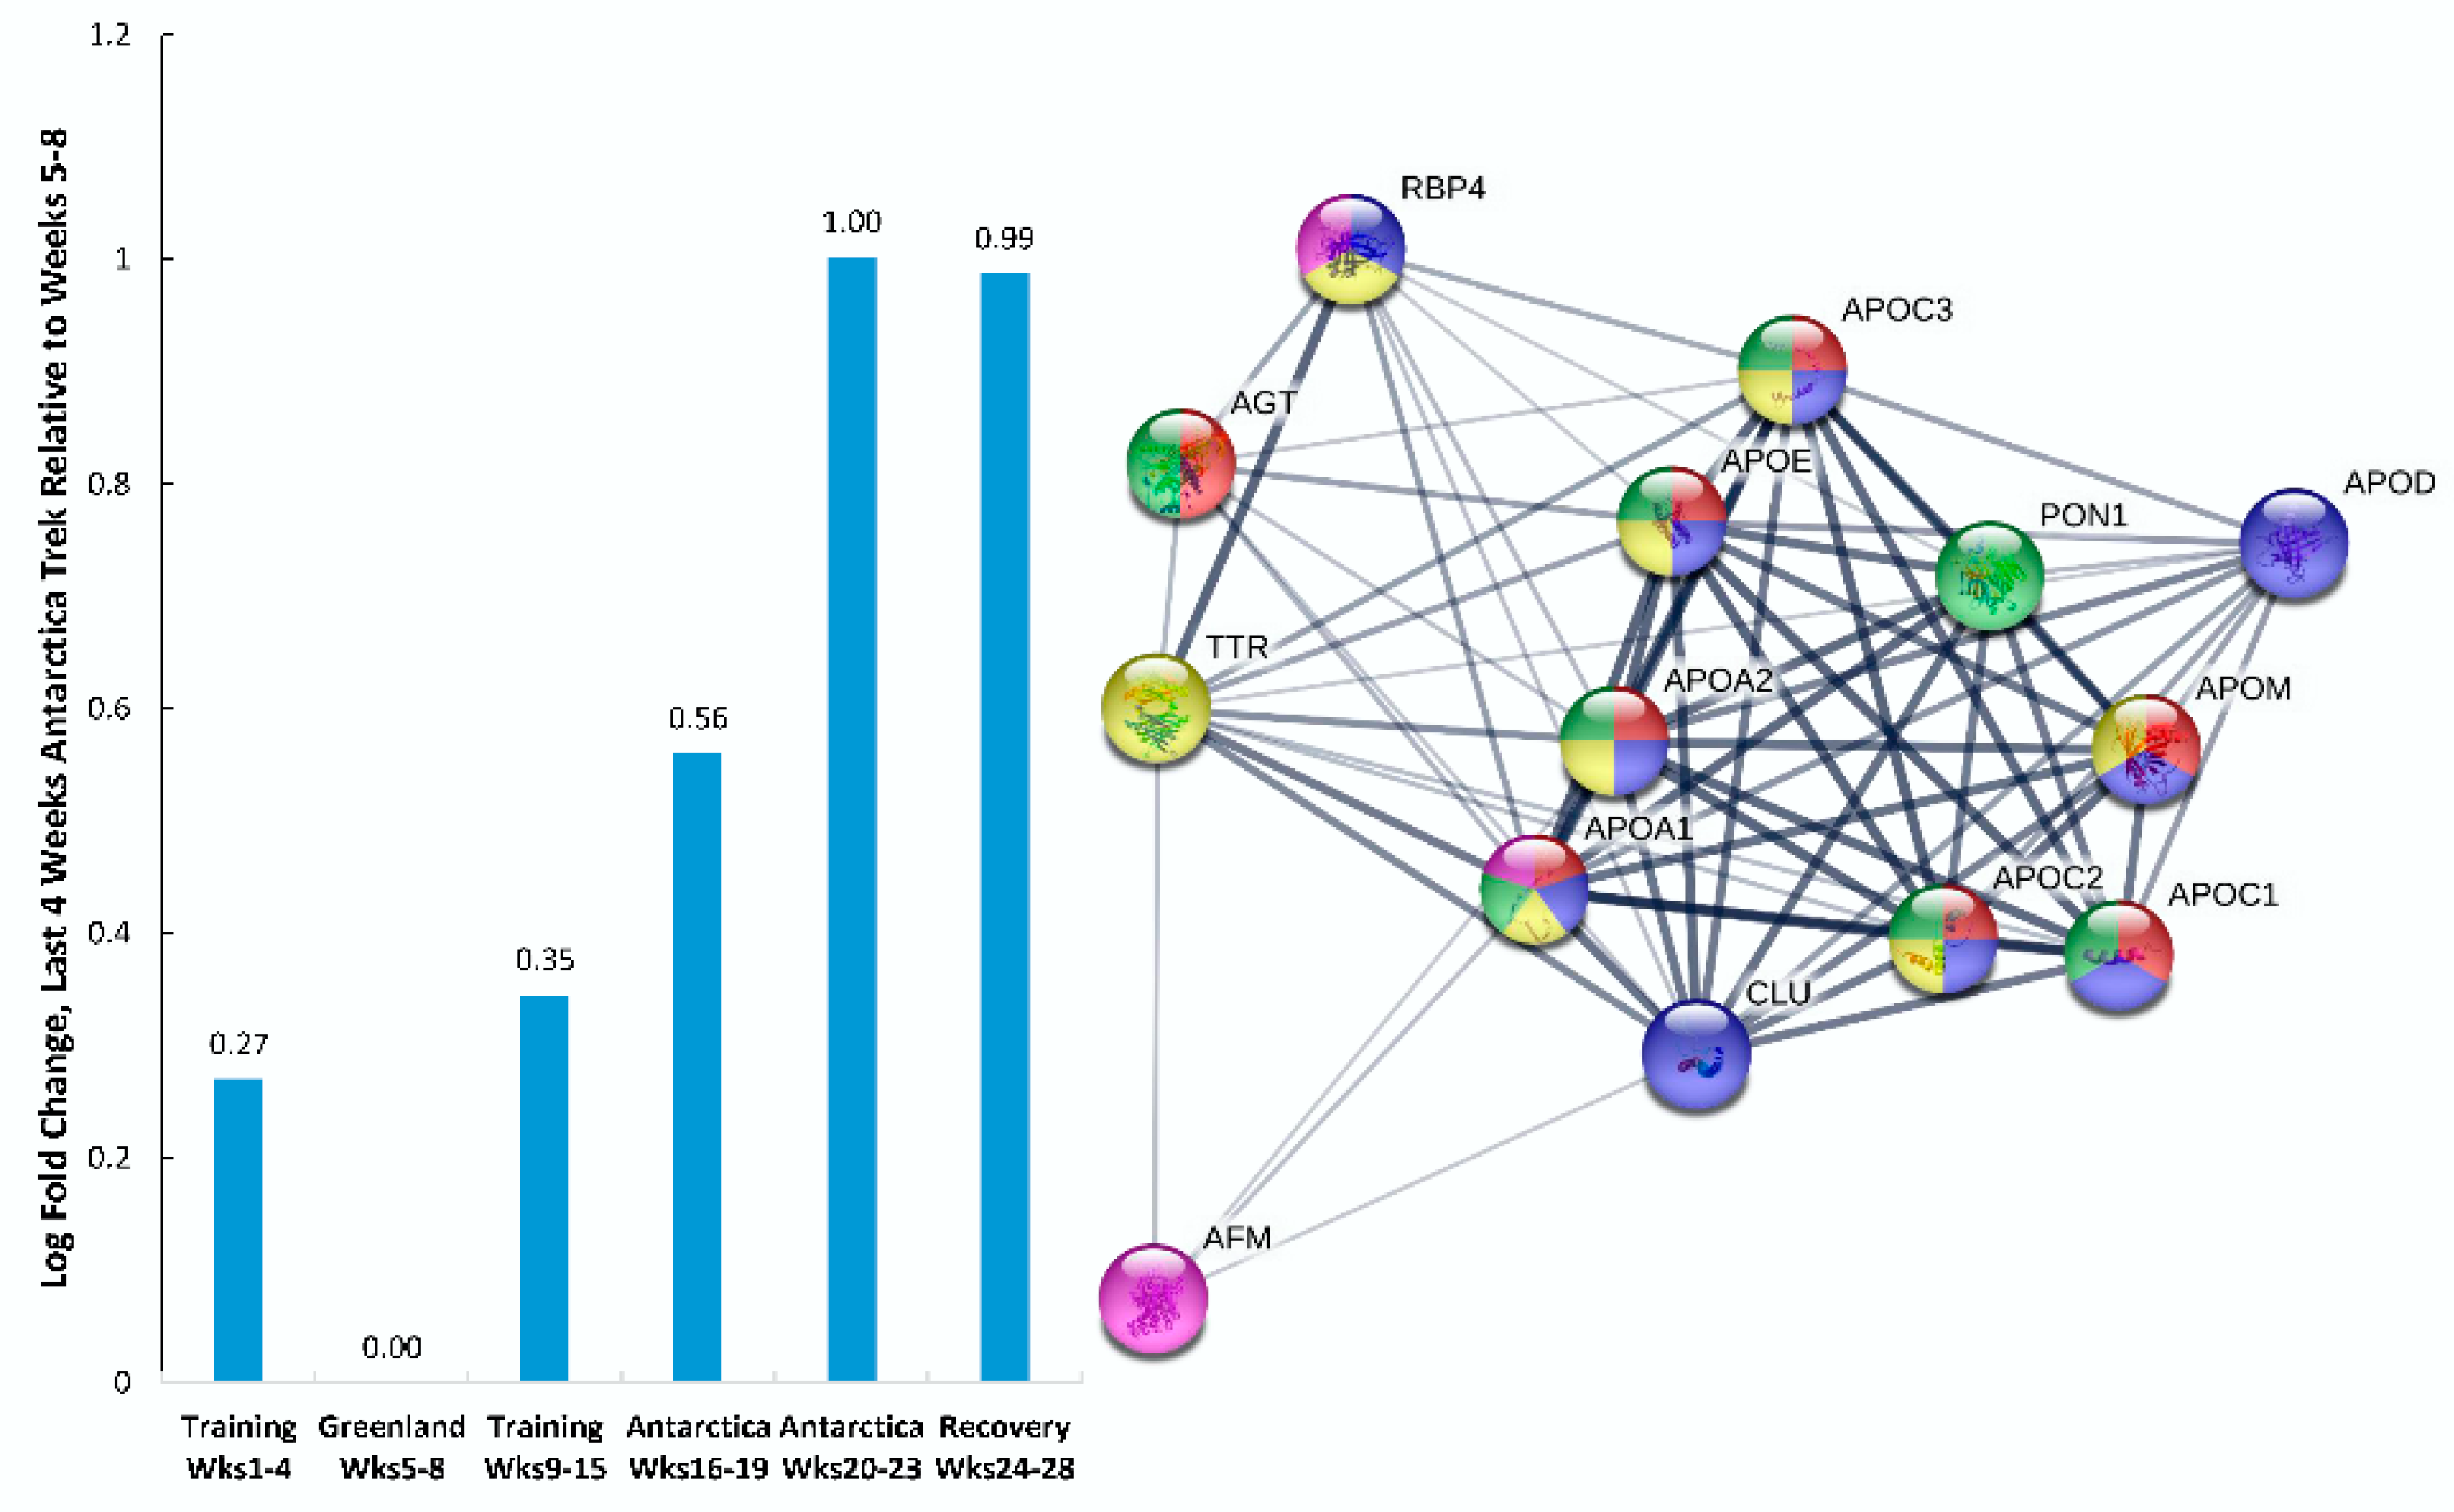
| APOE | P02649 | apolipoprotein E† | 1.856 | 0.000 | 0.000 |
| GPX3 | P22352 | glutathione peroxidase 3† | 1.590 | 0.000 | 0.000 |
| APOC3 | P02656 | apolipoprotein C3† | 1.574 | 0.000 | 0.001 |
| APOD | P05090 | apolipoprotein D† | 1.559 | 0.000 | 0.000 |
| HGFAC | Q04756 | HGF activator† | 1.467 | 0.000 | 0.006 |
| APOC2 | P02655 | apolipoprotein C2† | 1.463 | 0.000 | 0.003 |
| RBP4 | P02753 | retinol binding protein 4† | 1.412 | 0.000 | 0.001 |
| APOM | O95445 | apolipoprotein M† | 0.984 | 0.000 | 0.007 |
| HDHD2 | Q9H0R4 | haloacid dehalogenase like hydrolase domain containing 2† | 0.976 | 0.001 | 0.038 |
| SERPINA4 | P29622 | serpin family A member 4; kallistatin† | 0.971 | 0.002 | 0.038 |
| APOC1 | P02654 | apolipoprotein C1† | 0.970 | 0.000 | 0.003 |
| SERPING1 | P05155 | serpin family G member 1; plasma protease C1 inhibitor† | 0.947 | 0.002 | 0.041 |
| CLNS1A | P54105 | chloride nucleotide-sensitive channel 1A‡ | 0.898 | 0.007 | 0.076 |
| HIST1H3A–J; H3F3A; H3F3B; HIST3H3; HIST2H3A,C,D | P68431; P84243; Q16695; Q71DI3 | histone cluster 1 H3 family member a–j;‡ H3 histone family members 3A,3B; ‡ histone cluster 3 H3; ‡ histone cluster 2 H3 family member a,c,d‡ | 0.897 | 0.006 | 0.074 |
| C8G | P07360 | complement C8 gamma chain† | 0.864 | 0.008 | 0.086 |
| C1R | P00736 | complement C1r† | 0.810 | 0.001 | 0.028 |
| APOA1 | P02647 | apolipoprotein A1† | 0.797 | 0.000 | 0.001 |
| CPN2 | P22792 | carboxypeptidase N subunit 2† | 0.793 | 0.002 | 0.038 |
| CPN1 | P15169 | carboxypeptidase N subunit 1† | 0.763 | 0.002 | 0.041 |
| AGT | P01019 | angiotensinogen† | 0.680 | 0.002 | 0.041 |
| ITIH4 | Q14624 | inter-alpha-trypsin inhibitor heavy chain 4† | 0.648 | 0.001 | 0.033 |
| PLG | P00747 | plasminogen† | 0.621 | 0.000 | 0.017 |
| APOA2 | P02652 | apolipoprotein A2† | 0.603 | 0.000 | 0.019 |
| AFM | P43652 | afamin† | 0.602 | 0.004 | 0.064 |
| PON1 | P27169 | paraoxonase 1† | 0.590 | 0.002 | 0.042 |
| SERPINA6 | P08185 | serpin family A member 6 (cortisol binding globulin) † | 0.585 | 0.001 | 0.034 |
| A1BG | P04217 | alpha-1-B glycoprotein† | 0.577 | 0.001 | 0.038 |
| C5 | P01031 | complement C5† | 0.547 | 0.003 | 0.054 |
| TTR | P02766 | transthyretin† | 0.498 | 0.004 | 0.064 |
| AZGP1 | P25311 | alpha-2-glycoprotein 1, zinc-binding† | 0.468 | 0.006 | 0.075 |
| CLU | P10909 | clusterin† ‡ | 0.439 | 0.002 | 0.038 |
| Gene | UniProt Identifier | Protein Description | Log-Fold Change | p-Value | Adjusted p-Value |
|---|---|---|---|---|---|
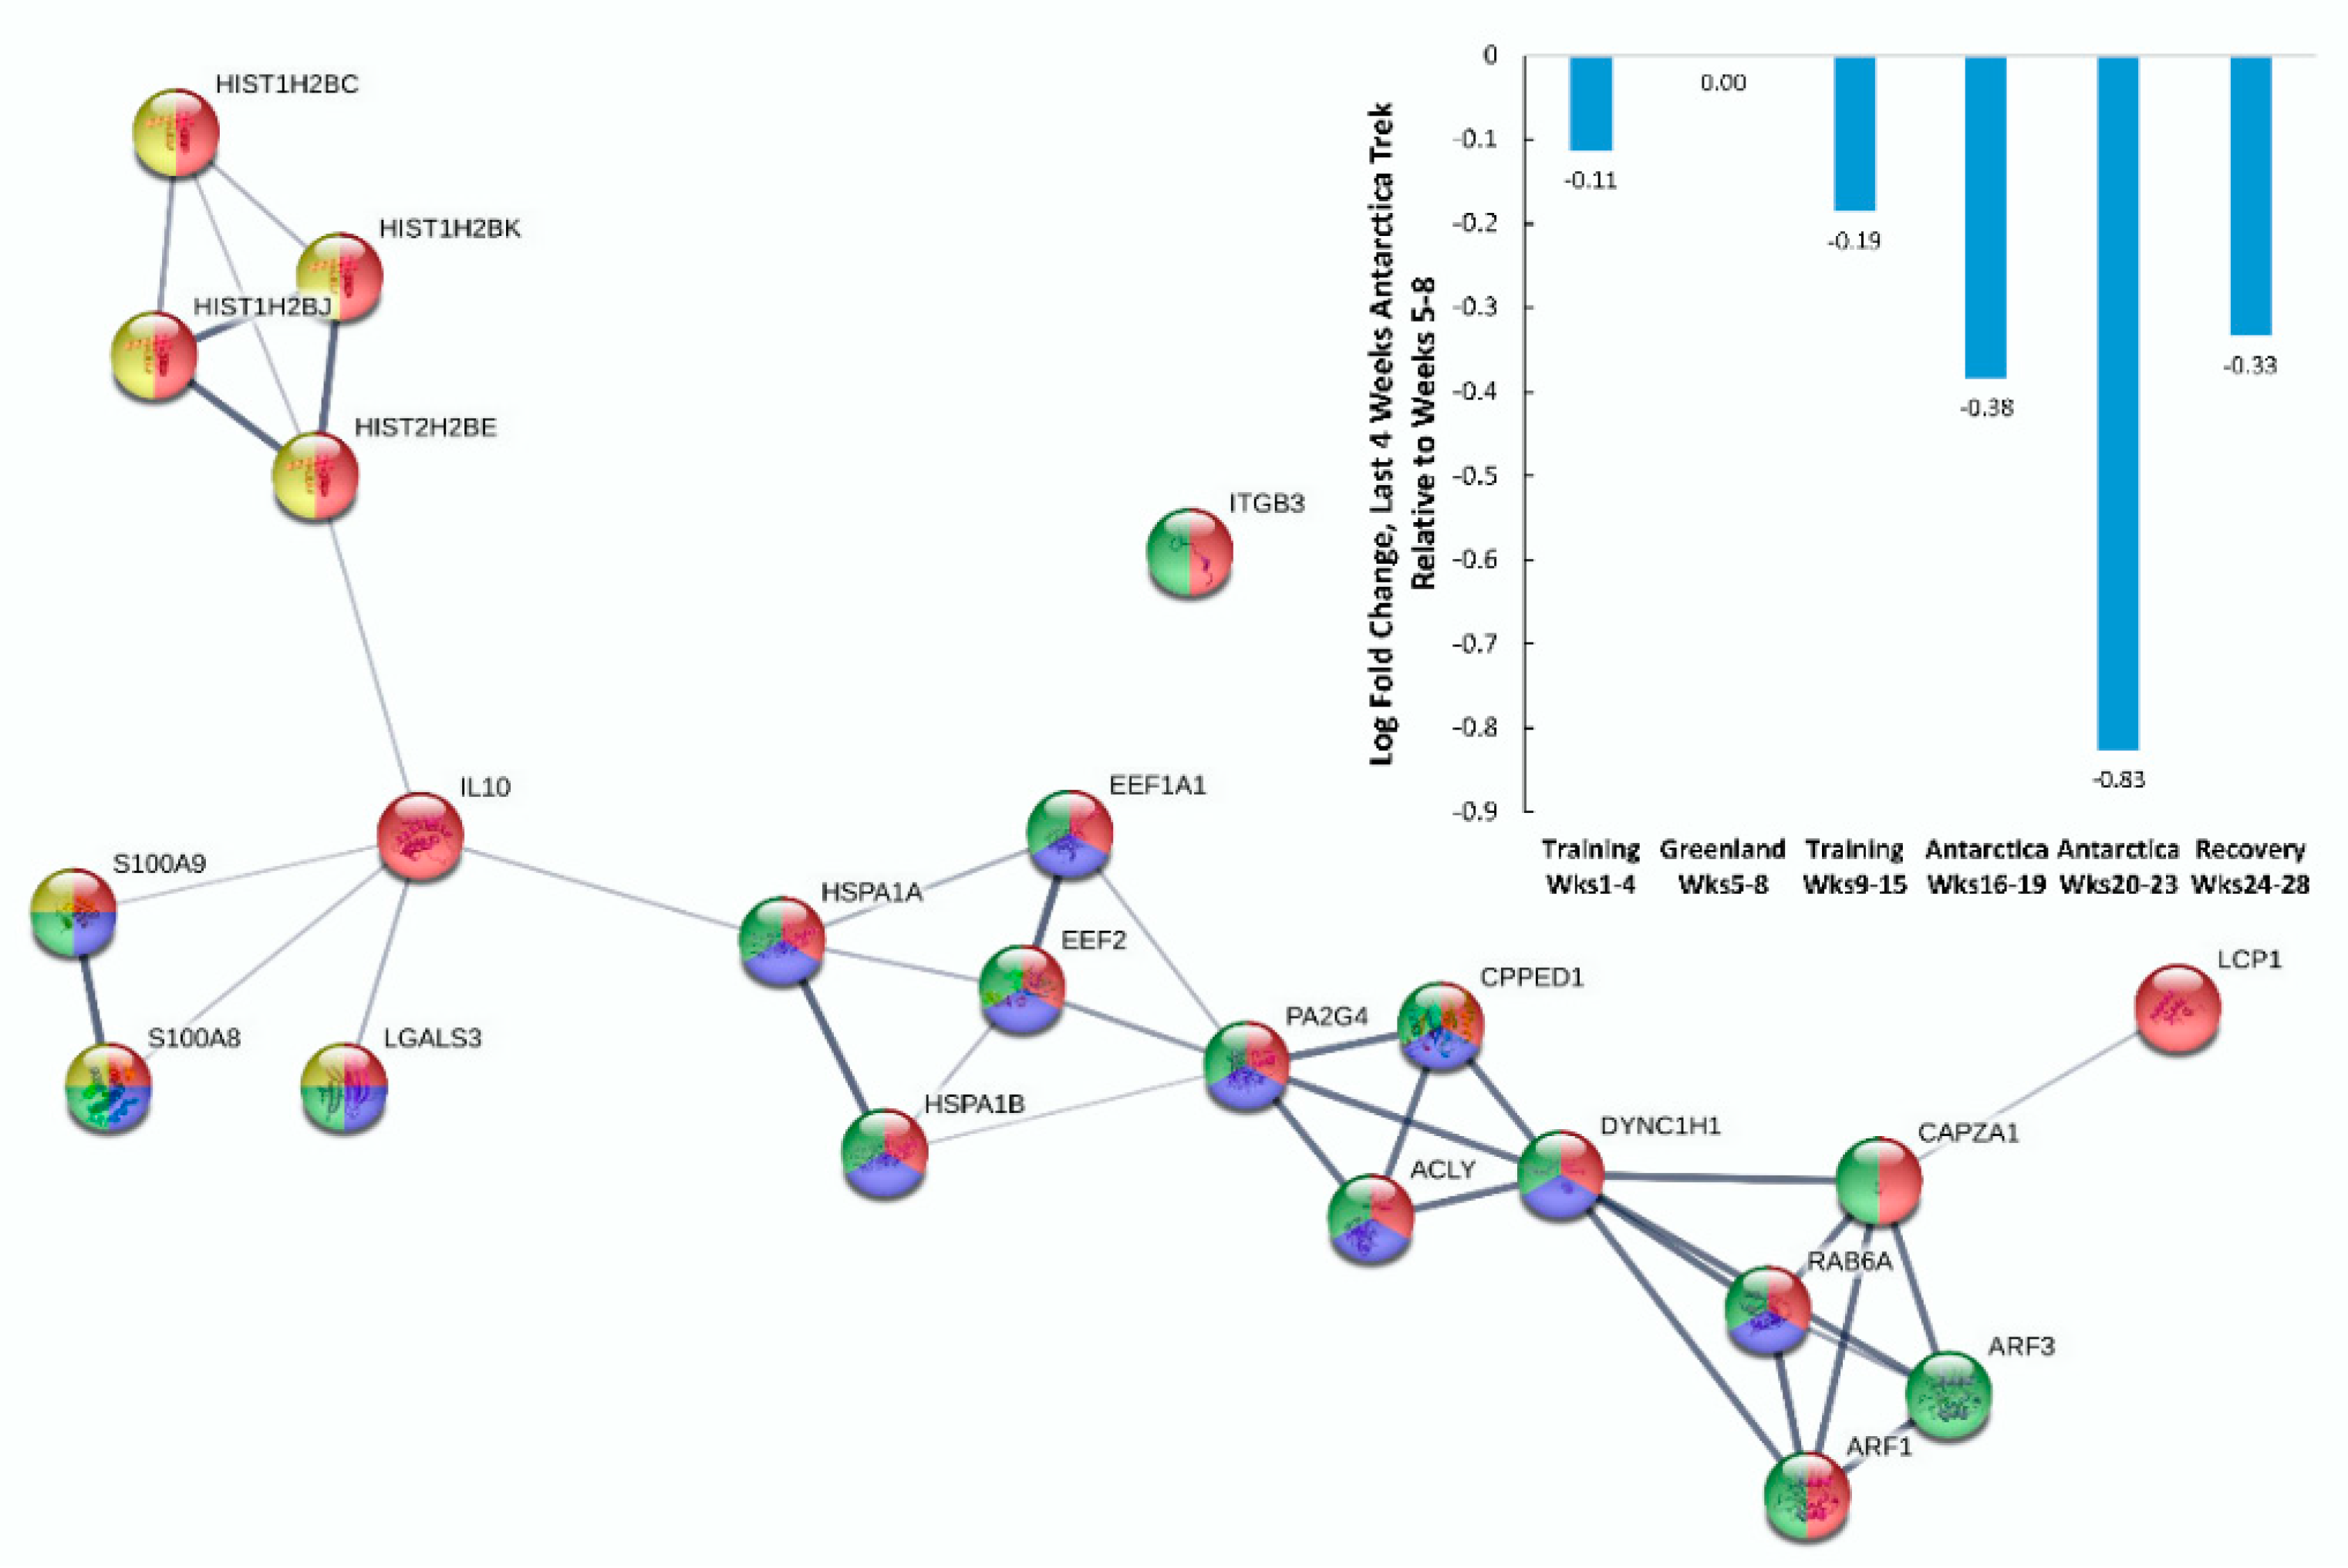
| ACLY | P53396 | ATP citrate lyase‡ | −0.274 | 0.008 | 0.088 |
| YWHAE | P62258 | tyrosine 3-monooxygenase/tryptophan 5-monooxygenase activation protein epsilon‡ | −0.287 | 0.004 | 0.065 |
| ARF1; ARF3 | P61204; P84077 | ADP ribosylation factors 1,3‡ | −0.300 | 0.005 | 0.065 |
| PSMC6 | P62333 | proteasome 26S subunit, ATPase 6‡ | −0.319 | 0.006 | 0.074 |
| PSMD9 | O00233 | proteasome 26S subunit, non-ATPase 9‡ | −0.356 | 0.008 | 0.089 |
| PSMC5 | P62195 | proteasome 26S subunit, ATPase 5‡ | −0.358 | 0.009 | 0.095 |
| PA2G4 | Q9UQ80 | proliferation-associated 2G4‡ | −0.383 | 0.002 | 0.041 |
| HSPA1A; HSPA1B | P08107 | heat shock protein family A (Hsp70) members 1A, 1B‡ | −0.386 | 0.003 | 0.045 |
| XPO7 | Q9UIA9 | exportin 7‡ | −0.392 | 0.006 | 0.076 |
| IL10 | P22301 | interleukin 10† | −0.408 | 0.006 | 0.074 |
| CAPZA1 | P52907 | capping actin protein of muscle Z-line subunit alpha 1† | −0.432 | 0.000 | 0.017 |
| IGLV1-47 | P01700 | immunoglobulin lambda variable 1-47† | −0.447 | 0.005 | 0.065 |
| IGKC | P01834 | immunoglobulin kappa constant† | −0.472 | 0.002 | 0.044 |
| LGALS3 | P17931 | galectin 3†‡ | −0.479 | 0.007 | 0.078 |
| LCP1 | P13796 | lymphocyte cytosolic protein 1‡ | −0.480 | 0.002 | 0.043 |
| CALM1,2,3 | P62158 | calmodulin 1,2,3‡ | −0.484 | 0.002 | 0.038 |
| PCBP1 | Q15365 | poly(rC) binding protein 1‡ | −0.544 | 0.006 | 0.074 |
| AHSP | Q9NZD4 | alpha hemoglobin stabilizing protein†‡ | −0.607 | 0.001 | 0.033 |
| RGS10 | O43665-3 | regulator of G protein signaling 10‡ | −0.744 | 0.003 | 0.051 |
| CPPED1 | Q9BRF8 | calcineurin like phosphoesterase domain containing 1†‡ | −0.773 | 0.003 | 0.052 |
| DHRS11 | Q6UWP2 | dehydrogenase/reductase 11† ‡ | −0.794 | 0.005 | 0.071 |
| ADK | P55263 | adenosine kinase‡ | −0.837 | 0.002 | 0.043 |
| STMN2 | Q93045 | stathmin 2‡ | −0.860 | 0.001 | 0.024 |
| FSCB | Q5H9T9 | fibrous sheath CABYR binding protein†‡ | −0.891 | 0.004 | 0.063 |
| EEF2 | P13639 | eukaryotic translation elongation factor 2‡ | −0.897 | 0.000 | 0.006 |
| YWHAB; YWHAG; YWHAQ | P31946; P61981; P27348 | tyrosine 3-monooxygenase/tryptophan 5-monooxygenase activation protein beta; gamma; theta‡ | −0.897 | 0.006 | 0.074 |
| ITGB3 | P05106 | integrin subunit beta 3‡ | −1.081 | 0.004 | 0.059 |
| RAB6A | P20340-2 | RAB6A, member RAS oncogene family‡ | −1.090 | 0.003 | 0.053 |
| EEF1A1 | P68104; Q5VTE0 | eukaryotic translation elongation factor 1 alpha 1‡ | −1.190 | 0.001 | 0.033 |
| HBM | Q6B0K9 | hemoglobin subunit mu‡ | −1.196 | 0.000 | 0.001 |
| HIST1H2BB-K, M–O | P33778;P62807; P58876;Q93079; P06899;O60814; Q99879;Q99877; P23527;Q16778; Q5QNW6 | histone cluster 1 H2B family members b–k, m–o; ‡ cluster 2 H2B family members e,f‡ | −1.301 | 0.000 | 0.020 |
| CLLU1OS | Q5K130 | chronic lymphocytic leukemia upregulated 1 opposite strand†‡ | −1.303 | 0.002 | 0.040 |
| DYNC1H1 | Q14204 | dynein cytoplasmic 1 heavy chain 1‡ | −1.325 | 0.000 | 0.018 |
| S100A9 | P06702 | S100 calcium binding protein A9† | −1.357 | 0.006 | 0.075 |
| S100A8 | P05109 | S100 calcium binding protein A8† | −1.680 | 0.001 | 0.032 |
© 2020 by the authors. Licensee MDPI, Basel, Switzerland. This article is an open access article distributed under the terms and conditions of the Creative Commons Attribution (CC BY) license (http://creativecommons.org/licenses/by/4.0/).
Share and Cite
Nieman, D.C.; Groen, A.J.; Pugachev, A.; Simonson, A.J.; Polley, K.; James, K.; El-Khodor, B.F.; Varadharaj, S.; Hernández-Armenta, C. Proteomics-Based Detection of Immune Dysfunction in an Elite Adventure Athlete Trekking Across the Antarctica. Proteomes 2020, 8, 4. https://doi.org/10.3390/proteomes8010004
Nieman DC, Groen AJ, Pugachev A, Simonson AJ, Polley K, James K, El-Khodor BF, Varadharaj S, Hernández-Armenta C. Proteomics-Based Detection of Immune Dysfunction in an Elite Adventure Athlete Trekking Across the Antarctica. Proteomes. 2020; 8(1):4. https://doi.org/10.3390/proteomes8010004
Chicago/Turabian StyleNieman, David C., Arnoud J. Groen, Artyom Pugachev, Andrew J. Simonson, Kristine Polley, Karma James, Bassem F. El-Khodor, Saradhadevi Varadharaj, and Claudia Hernández-Armenta. 2020. "Proteomics-Based Detection of Immune Dysfunction in an Elite Adventure Athlete Trekking Across the Antarctica" Proteomes 8, no. 1: 4. https://doi.org/10.3390/proteomes8010004