Article

Large Scale Applications Using FBG Sensors: Determination of In-Flight Loads and Shape of a Composite Aircraft Wing

by
Matthew J. Nicolas
1,†,
Rani W. Sullivan
2,*,† and
W. Lance Richards
3,†
1
Department of Manufacturing Engineering, PACCAR Engine Company, Columbus, MS 39701, USA
2
Department of Aerospace Engineering, Mississippi State University, Mississippi State, MS 39762, USA
3
NASA Engineering and Safety Center, NASA Langley Research Center, Hampton, VA 23681, USA
*
Author to whom correspondence should be addressed.
These authors contributed equally to this work.
Aerospace 2016, 3(3), 18; https://doi.org/10.3390/aerospace3030018
Submission received: 16 May 2016 / Revised: 7 June 2016 / Accepted: 8 June 2016 / Published: 23 June 2016
(This article belongs to the Special Issue Adaptive/Smart Structures and Multifunctional Materials 2016)

Abstract

:
Technological advances have enabled the development of a number of optical fiber sensing methods over the last few years. The most prevalent optical technique involves the use of fiber Bragg grating (FBG) sensors. These small, lightweight sensors have many attributes that enable their use for a number of measurement applications. Although much literature is available regarding the use of FBGs for laboratory level testing, few publications in the public domain exist of their use at the operational level. Therefore, this paper gives an overview of the implementation of FBG sensors for large scale structures and applications. For demonstration, a case study is presented in which FBGs were used to determine the deflected wing shape and the out-of-plane loads of a 5.5-m carbon-composite wing of an ultralight aerial vehicle. The in-plane strains from the 780 FBG sensors were used to obtain the out-of-plane loads as well as the wing shape at various load levels. The calculated out-of-plane displacements and loads were within 4.2% of the measured data. This study demonstrates a practical method in which direct measurements are used to obtain critical parameters from the high distribution of FBG sensors. This procedure can be used to obtain information for structural health monitoring applications to quantify healthy vs. unhealthy structures.

Graphical Abstract

1. Introduction

Structural health monitoring (SHM) refers to the process of observing the structural and/or mechanical responses of a system over time for the purposes of damage detection and characterization. An effective SHM method can increase efficiency, reduce maintenance and inspection costs, and extend the service life of mechanical systems and structures. An overview of literature in the field of optical methods indicates that fiber Bragg grating (FBG) sensor technology is considered a promising and commonly used method for evaluating and monitoring structural system response and damage detection [1].
In the following sections, a general description of FBG technology is given, followed by an overview of large scale applications in which FBGs have been used. Additionally, a case study is presented to demonstrate a practical method in which direct measurements (strains from the high distribution of FBG sensors along the optical fibers) are used to obtain not only the wing shape, but also the out-of-plane or in-flight load distribution. The procedure can be used to obtain information for structural health monitoring applications.

2. Fiber Bragg Grating (FBG) Technology

2.1. FBG Features

FBG technology quickly gained consideration as a measurement and monitoring tool due to its many attributes, such as the extremely small size and light weight of the sensors. A primary benefit of using FBG technology is the multiplexability of the optical sensors that enables the monitoring of a high-density strain distribution using a single fiber [2,3]. In applications that require a large number of sensors, significant cost savings per sensor is realized when compared to the installation cost of conventional foil strain gages. Unlike conventional sensors, FBGs are nonconductive, electrically passive, and immune to electromagnetic interference, enabling their use in environments subject to noise, corrosion, or high voltage [4]. These diminutive sensors can be directly integrated into polymer matrix composite (PMC) structures [5,6] or surface mounted [7] on the test object. FBGs, which have the capability to measure very large strains (>10,000 μm/m), can be used to monitor critical load bearing structures. Also, FBGs have long term stability, good corrosion resistance, and are not distance dependent [8].
In using FBG sensors, there are also issues that must be addressed. FBG sensors have high temperature dependence and at high temperatures, there can be distortion of the optical fibers due to the mismatch in the thermal expansion coefficients of the cladding, core and any coating. In mounting or attaching these sensors, the issue of ingress and egress of the optical fiber are major concerns due to the fragile nature of the fibers [9,10,11]. Additionally, the cost of optical interrogators, used for the measurement of FBGs, can be prohibitive for use on small aircraft. As such, research is ongoing for development of low-cost systems [12].

2.2. Principle of FBG Sensors

A fiber Bragg grating (FBG), first demonstrated by Hill [13], is a type of reflector etched in the core of an optical fiber that reflects particular wavelengths of light and transmits all others, enabling its use as an optical sensor. The center of the fiber is surrounded by a silica cladding with a slightly lower index of refraction than the core (4–9 μm diameter) to enable the formation of a wavelength inside the fiber. Each FBG is defined with a unique wavelength that changes with induced strains. The refractive planes in an FBG are called Bragg planes, which are produced when two opposing light sources interfere constructively. Stretching an FBG (due to mechanical or thermal strain) causes a shift in the sensor’s index of refraction. As illustrated in Figure 1, when a wavelength tunable laser propagates light through an FBG, a narrow bandwidth of the laser is reflected back causing interference, while the remaining is transmitted to the remaining FBGs. The FBG strain is obtained from the Bragg wavelength, λ b , which is in the center of the reflected wavelength range, and can be expressed as [4,5,14]:
λ b =    2 n Λ b
In Equation (1), n is the effective refractive index of the fiber core, and Λ b is the Bragg planes spacing. A shift in the reflected wavelength occurs when a Bragg grating sensor is elongated by an induced strain. Due to temperature change ΔT and strain ε in the fiber direction, the Bragg wavelength shift Δλb can be expressed as [4]:
Δ λ b λ b =    ( 1 - P e ) ε + ( α s   + α f ) Δ T
where λ b is the unstrained Bragg wavelength, Pe is the strain-optic coefficient, α s is the thermal expansion coefficient of the fiber, and α f is the thermal-optic coefficient. Since both temperature and strain influence the reflected wavelength of an FBG, temperature compensation must be introduced for accurate strain measurements.

3. FBG Monitoring of Large Scale Structures

FBG-based systems are enjoying wide usage in a number of industries and applications. The monitoring of structural performance to obtain loads and detect damage is increasingly gaining importance for many applications, particularly in the aerospace industry. Typically, load monitoring is accomplished by measuring local strains and damage detection involves the monitoring of acoustic signals [15].
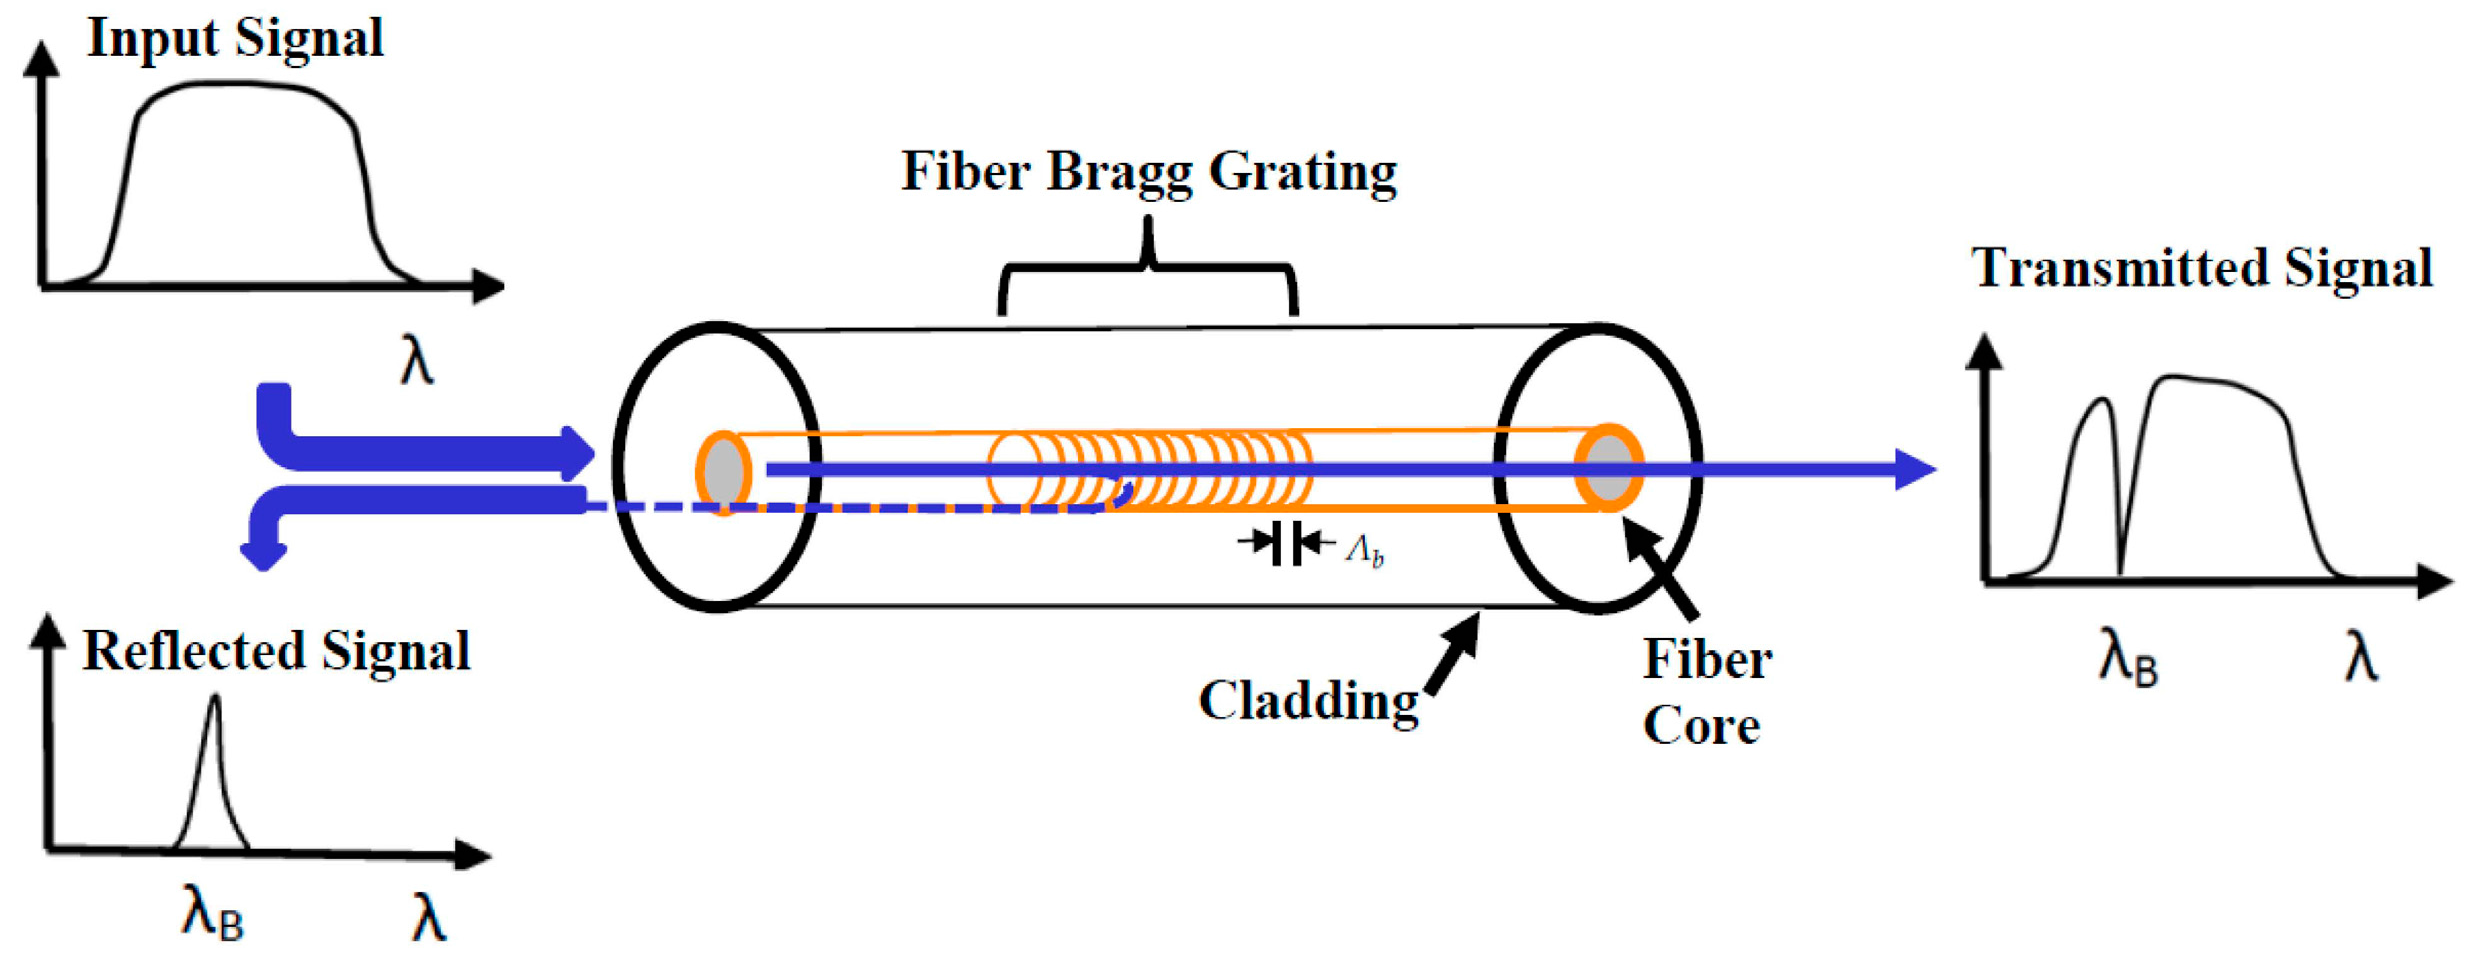
The widest use of FBGs is for measurement of strain, temperature, and pressure. Primarily, the shift in the wavelength or the refractive index is measured by the optical system and the strain ε is computed by Equation (2).
A number of studies deal with large aerospace vehicles and their components and most work involves the monitoring of strain data. The NASA Armstrong Flight Research Center (AFRC) has developed an instrumentation system and analysis techniques that combine to make distributed structural measurements practical for lightweight vehicles. AFRC’s fiber optic strain sensing (FOSS) technology enables a multitude of lightweight, distributed strain measurements [4,7,16]. Motivated by the failure of the unmanned aerial vehicle (UAV) Helios, Richards et al. [4,17] used the spatial resolution and equal spacing of FBGs to monitor the real-time in-flight wing shape of the Ikhana and Global Observer UAVs. Alvarenga et al. [18] also used FBGs on a lightweight UAV to determine the real-time deformation shape. A number of studies performed ground testing on aircraft and obtained measurements through FBGs mounted on the surface of the test structure. Childers et al. [2] performed static loads tests on an advanced composite transport wing to obtain strain measurements from thousands of FBGs and compared these to measurements obtained from electrical foil gages. The high density of measurements revealed structural behavior that is typically obtained from numerical models. Kim et al. [12] used a low speed, low cost FBG interrogator to obtain temperature compensated strain measurements of a full-scale small aircraft wing structure subjected to various temperatures and loading conditions. To develop a real-time UAV SHM system, Gupta et al. [19] investigated a number of issues regarding FBGs such as sensor integration, location, and embedment. They used actual flight test data to monitor the vibration and loads signature during flight conditions. As a part of the European Smart Intelligent Aircraft Structures project, Ciminello et al. [20] developed an in-flight shape monitoring system that uses the chord-wise strain distribution obtained from a network of FBG sensors for an adaptive trailing edge device.
FBG sensors can also be integrated into the test structure. Amano et al. [21] embedded multiplexed-fiber FBG sensors into an aerospace carbon/epoxy advanced grid structure to measure mechanical strains of all ribs to evaluate damage under low-velocity impact loading. Dvorak et al. [22] embedded FBG sensors into the carbon/epoxy spar caps and in the adhesive joints of a glass/epoxy composite wing to monitor strains during a static loads test. Ruzek et al. [23] embedded FBGs in carbon-fiber reinforced plastic (CFRP) fuselage stiffened panels and performed compression after impact tests. The FBG-based system successfully acquired all buckling modes of the CFRP panels.
Other large scale applications include the work by Kim et al. [10] in which FBG sensors were embedded in the adhesive layer joining the spar cap to the shear web of composite wind turbine blades to obtain deflection measurements. FBG-based systems have been used in the structural testing of composite overwrapped pressure vessels (COPVs). Banks et al. [6] embedded FBGs to measure strain distributions in Kevlar COPVs during stress rupture tests. In-situ SHM was performed on filament wound pressure tanks subjected to water pressurization tests using embedded FBGs [24]. Mizutani et al. [25] conducted real-time strain measurements using FBG sensors on a composite liquid hydrogen tank mounted on a reusable rocket vehicle. In other transportation fields, such as the railway market, an FBG-based system has been developed and used on commercial railways to monitor hard and soft impacts on current collectors, enabling the detection of serious defects [26]. In obtaining the strain responses of steel wires in a column support of a subway structure under ground motion, Chen et al. [27] found that FBG sensors performed better than strain gages because the area is under large electromagnetic interferences. Wan et al. [28] analyzed dynamic properties obtained from FBG data in the testing and monitoring of a large scale truss bridge.
FBGs have also been used for damage detection in large scale structures. In particular, carbon fiber polymer matrix composites are used in many advanced aerospace applications; this is primarily due to their high specific strength and stiffness in the fiber direction. However, even with modest loading, CFRPs develop complicated internal damage that can include matrix cracking, delaminations, and fiber breakage [29]. Peña et al. [30] used surface mounted and embedded FBGs in a COPV and developed a strain-measurement-based SHM parameter that can be used to track the COPV structural health throughout loading. Also, acoustic emission is often used as a non-destructive method for early detection of damage. Xiao et al. [15] demonstrated the use of FBGs to simultaneously monitor both strains and acoustic signals for monitoring load and damage in aircraft structures. Mendoza et al. [31,32] reported on the development of a wireless in-flight FBG-based acoustic emission monitoring system known as FAESense™. The strain variations and AE signals were used to verify the occurrence and location of the damage. Betz et al. [33] developed a damage identification system for aerospace structures that uses FBGs to sense ultrasound by obtaining the linear strain component produced by Lamb waves.

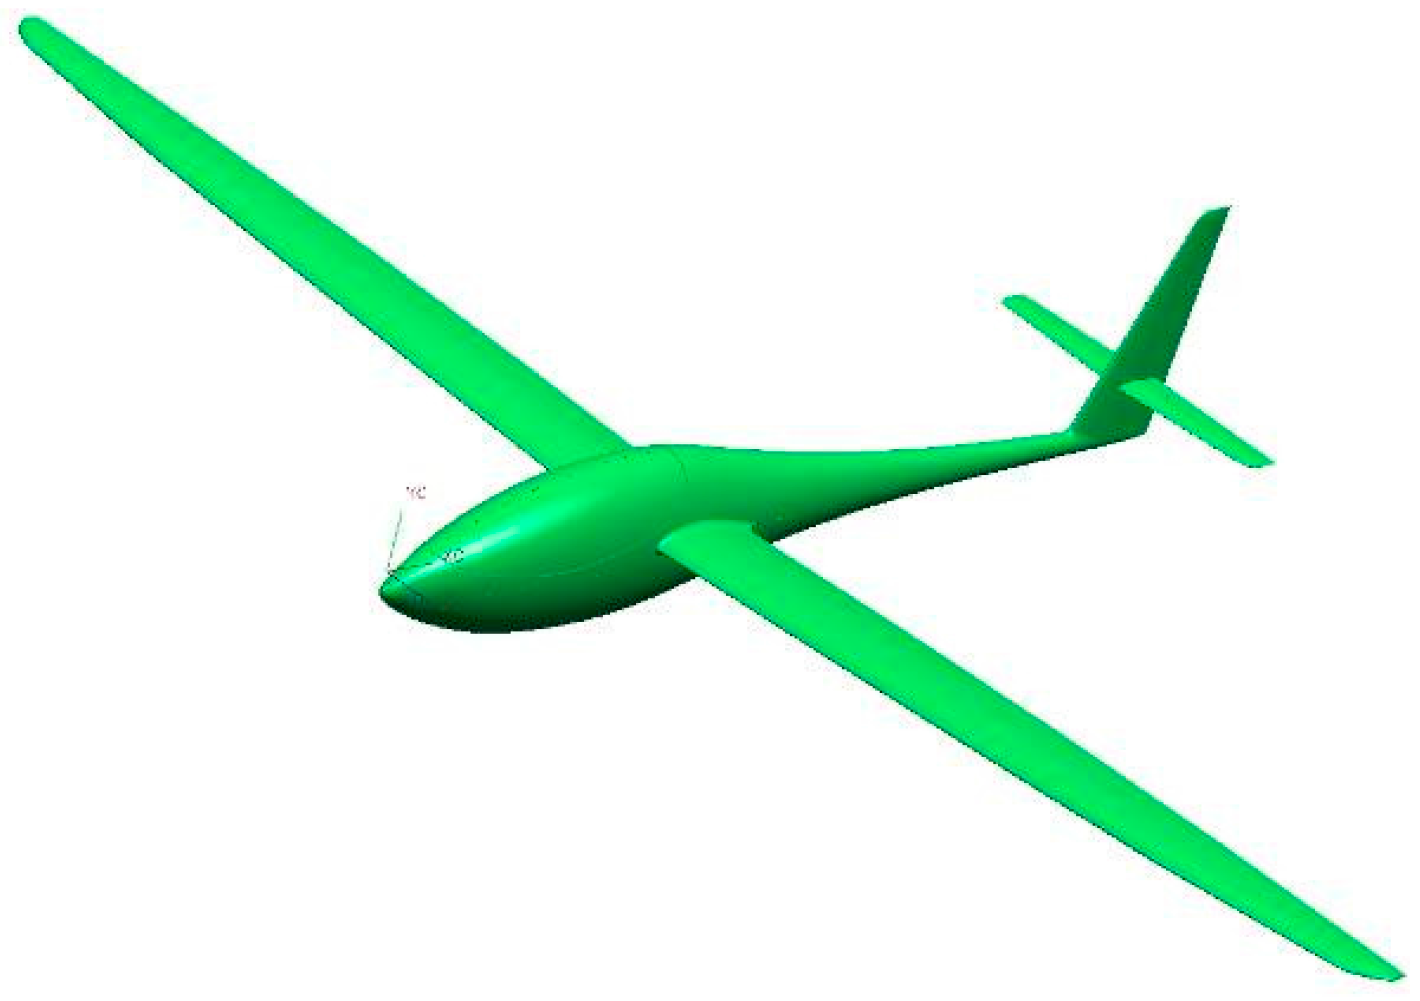
4. Determination of the Wing Shape and In-Flight Loads of an Ultralight Composite Wing

The carbon-composite multi-tapered wing of a sailplane-inspired aircraft (Figure 2) was statically tested and strain measurements from FBGs were used to determine the out-of-plane deflections and loads [7] using the FOSS system [4,16]. The wing was instrumented with two optical fibers along the main spar, one on the upper skin and one on the lower skin. These measurements were compared to four surface mounted strain gages and a displacement sensor. The wing assembly was subjected to distributed loads to simulate an in-flight maneuver using a three-tier whiffletree mechanism that was developed in a previous study [34]. The resulting FBG strain measurements were compared to those obtained from conventional strain gages.

4.1. Description of Composite Wing

The composite wing has a semi-span of 5.5 m, a root chord dimension of 0.74 m, and a maximum airfoil thickness of 0.1 m at the root section. 
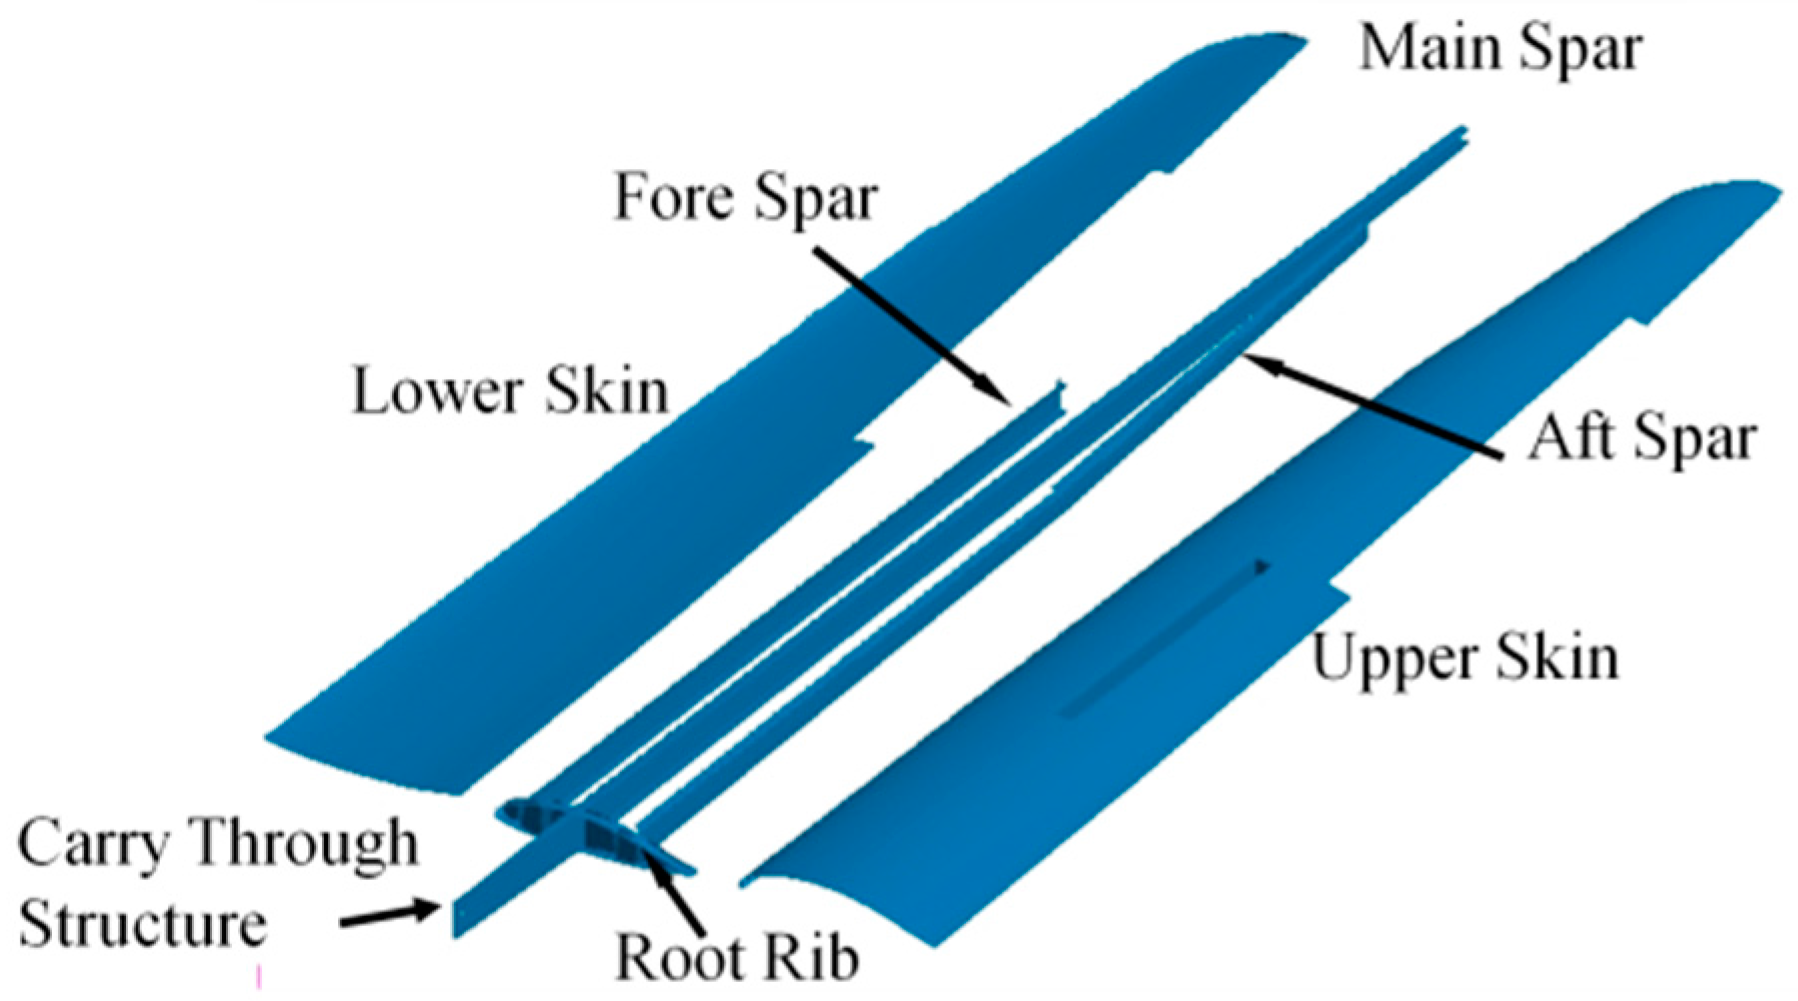
Figure 3 shows the wing’s primary structures, which include the upper and lower skins, a root rib, a fore spar, an aft spar, and a main (center) spar. The main spar protrudes from the root rib to form the carry-through structure into the fuselage. The wing test article does not have aileron or spoiler cut-outs.
All structural components of the wing are fabricated from woven and unidirectional carbon-fiber/epoxy prepregs (Toray composites). The upper and lower skins are sandwich composites with a low density foam core (DIAB Divinycell® HT50, Diab International AB, Helsingborg, Sweden) of thickness 3.175-mm; the engineering properties of the composite materials are given in 
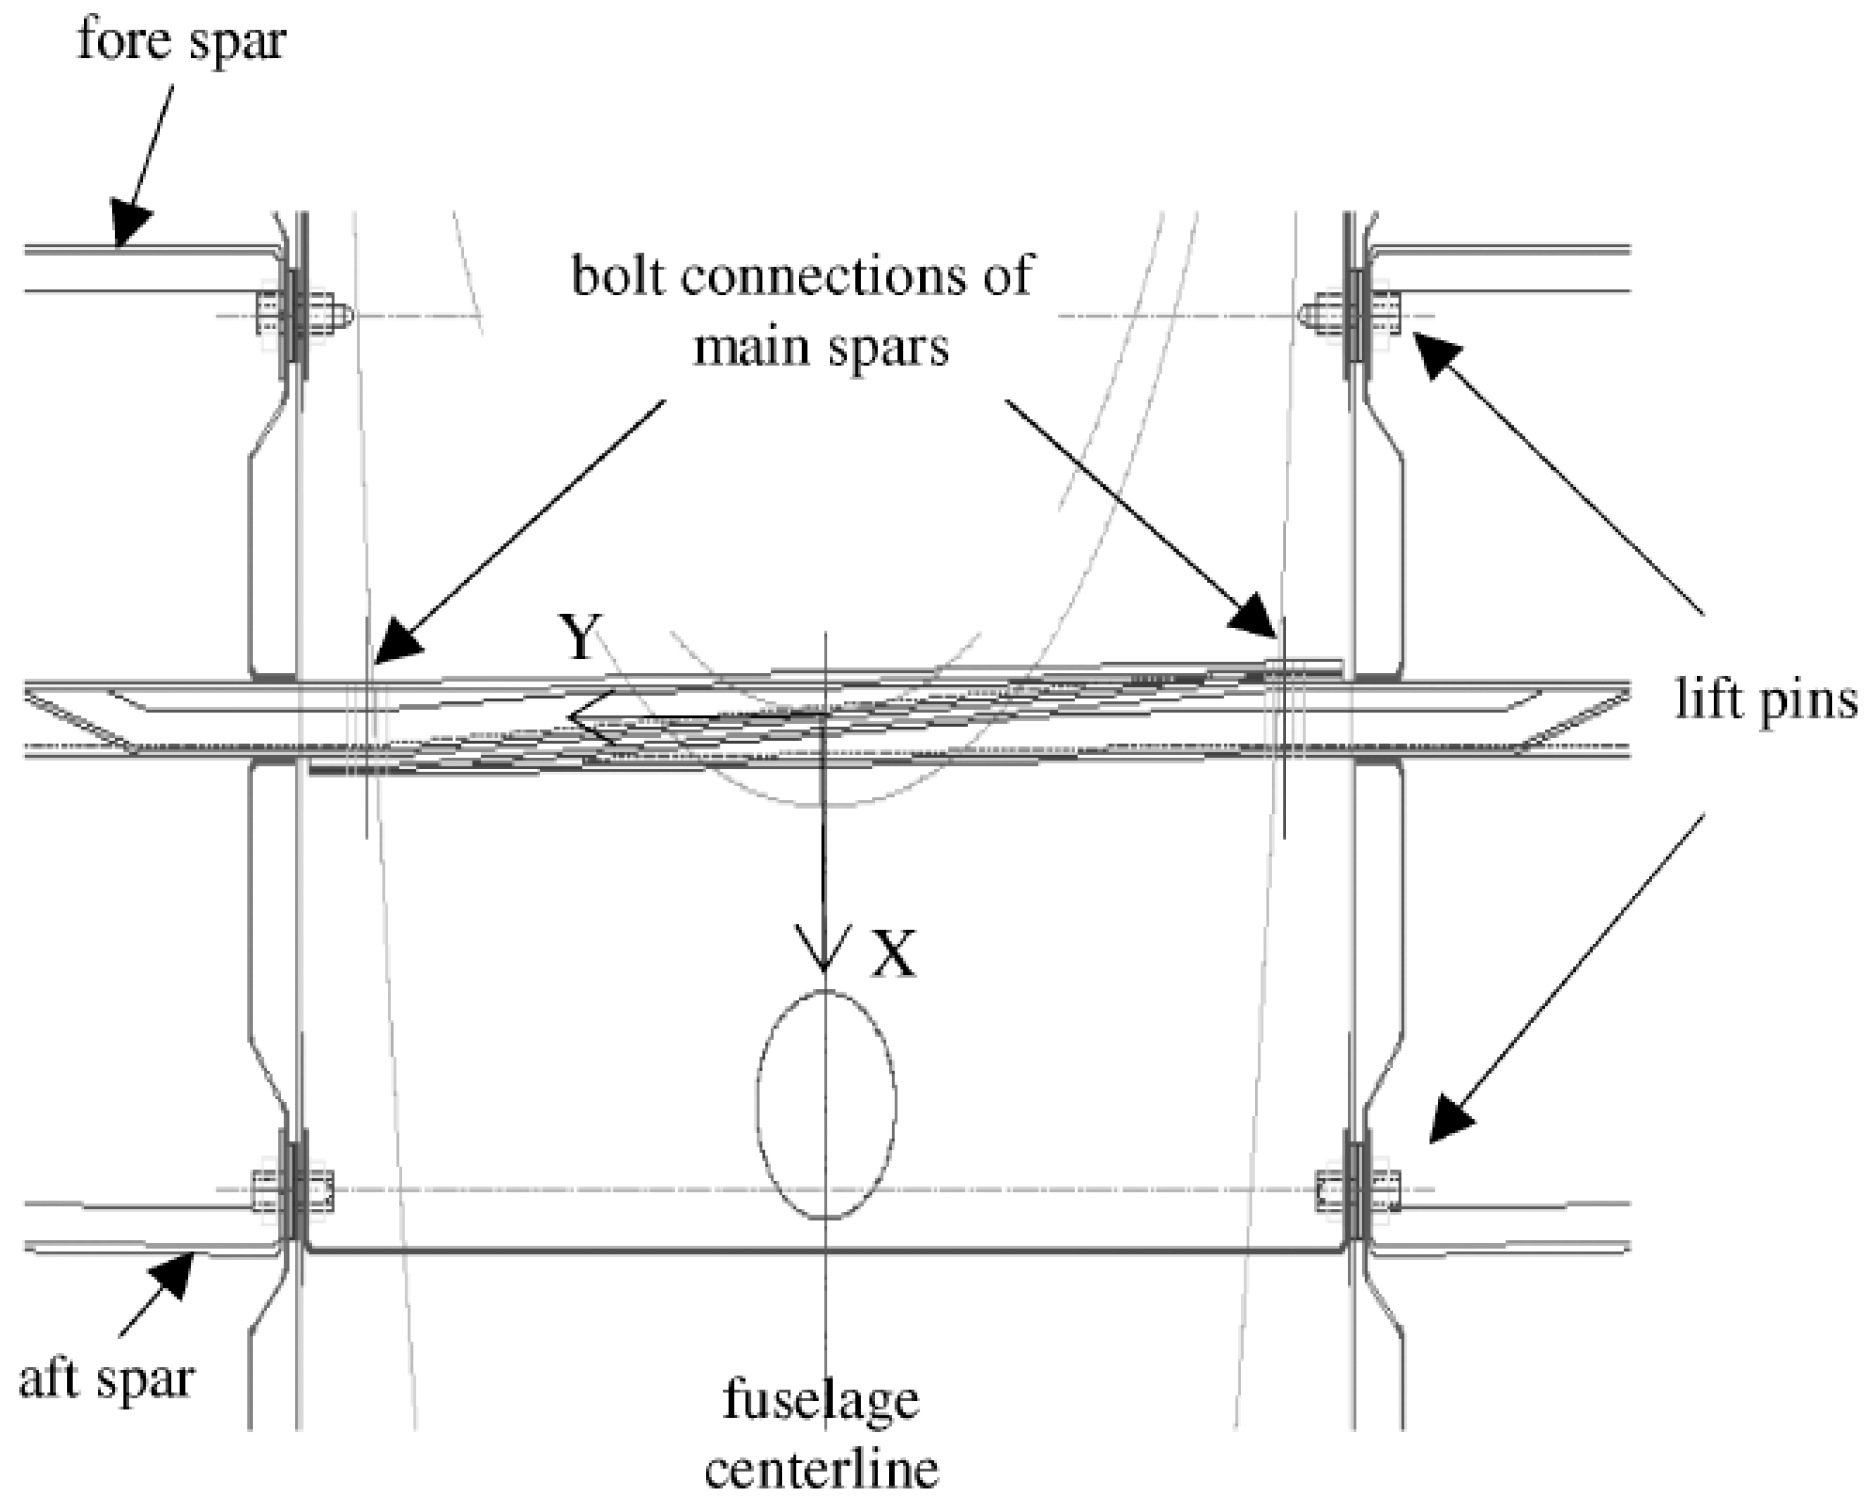
Table 1. The foam core extends over the wing surface to about 40-mm from the leading edge, trailing edge, and side boundaries. All structural components were fabricated separately and oven-cured before being adhesively bonded in an assembly jig. Steel lift pins were mounted to the root rib prior to final assembly to provide shear load transfer from the wing to the fuselage, as seen in Figure 4. Further details regarding the wing structure can be found in Sullivan et al. [34].

4.2. Experimental Setup and Procedure

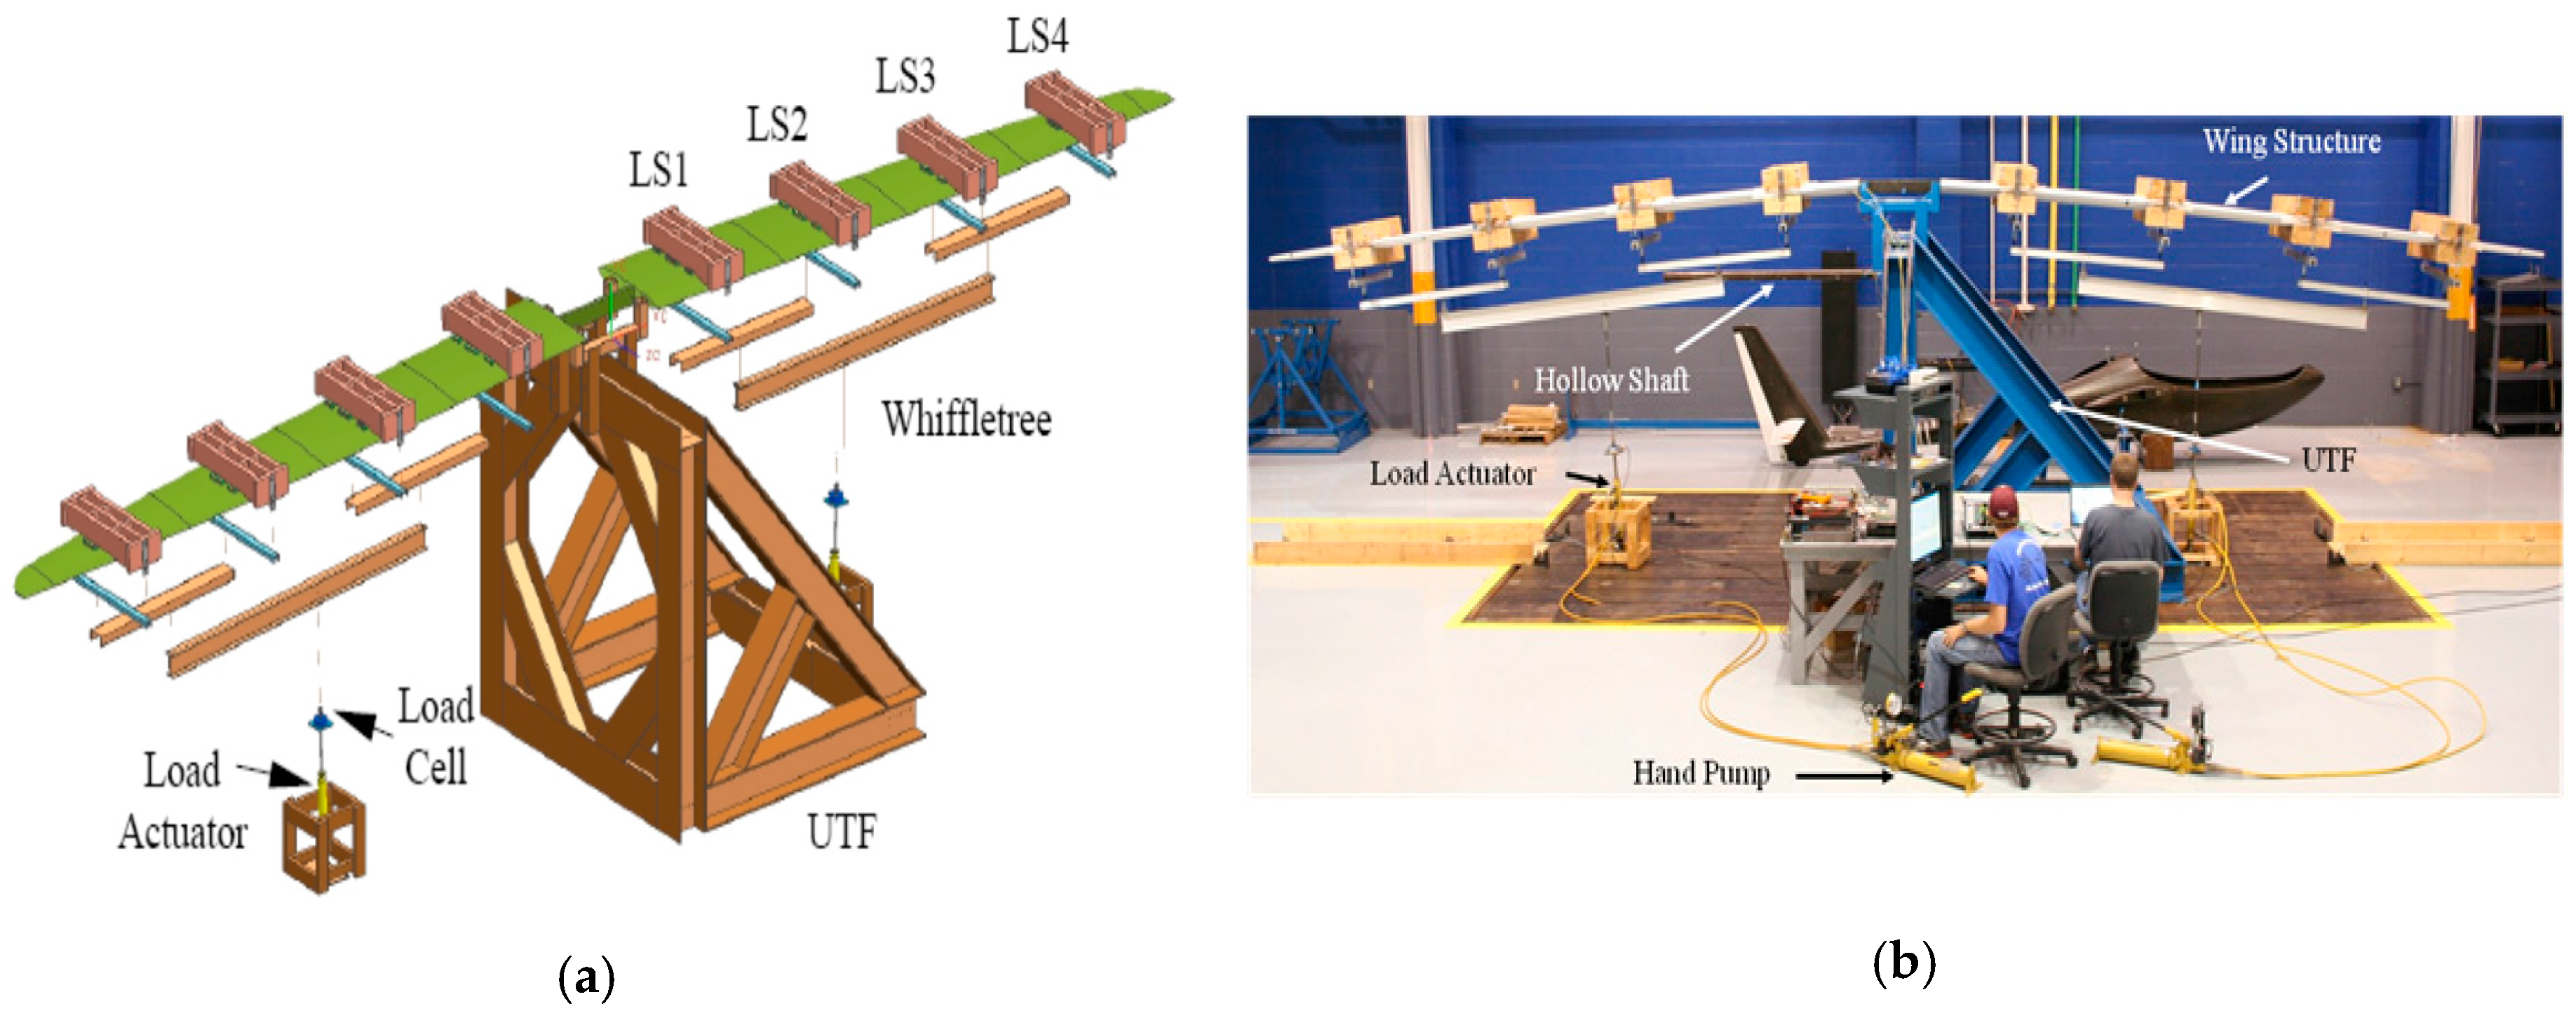
The primary objective of this study was to use the high density of FBG strains to obtain the deflected wing shape and out-of-plane loads for a carbon composite wing subjected to distributed and concentrated loads. A universal test frame (UTF), shown in Figure 5, was used as the support structure for all static test cases.

4.2.1. Wing Loading Methodology

A three-tier whiffletree system was used to simulate an in-flight lift distribution on the wing structure. As illustrated in Figure 5, a saddle fixture that simulated the fuselage-wing connection region was used with the UTF to mount the inverted wing structure for testing. To transfer the load to each wing, four cradles were placed at the span-wise loading stations LS1, LS2, LS3, and LS4. The top and bottom of the cradles were designed to closely match the airfoil shape of the wing. Wood spacers of 25.4-mm thickness were placed under the upper cradles at the spar locations to avoid local damage to the wing skins. The composite wing was sandwiched between the top and bottom cradles to prevent slippage of the cradles and to minimize twisting of the wing during loading. The cradles were bolted together and attached to the first tier of the whiffletree using steel connectors. The second and third levels of the whiffletree consisted of aluminum C-channel sections and an aluminum I-beam, respectively. The load actuator was attached to a floor surface plate using a ball bearing to allow the actuator freedom of rotation during the loading process. The loading was applied by manual pumps that were connected to each actuator.
The loading sequence, consisting of thirteen loading increments included the weight of the wing, each cradle, each tier of the whiffletree, and the five load increments of approximately 222-N, for a total load on the wing of 2269-N, is given in Table 2. After each loading increment, five sets of strain data from the FBG sensors and the strain gages were recorded and the averaged value was used in the calculation of the displacement and wing shape at each load.
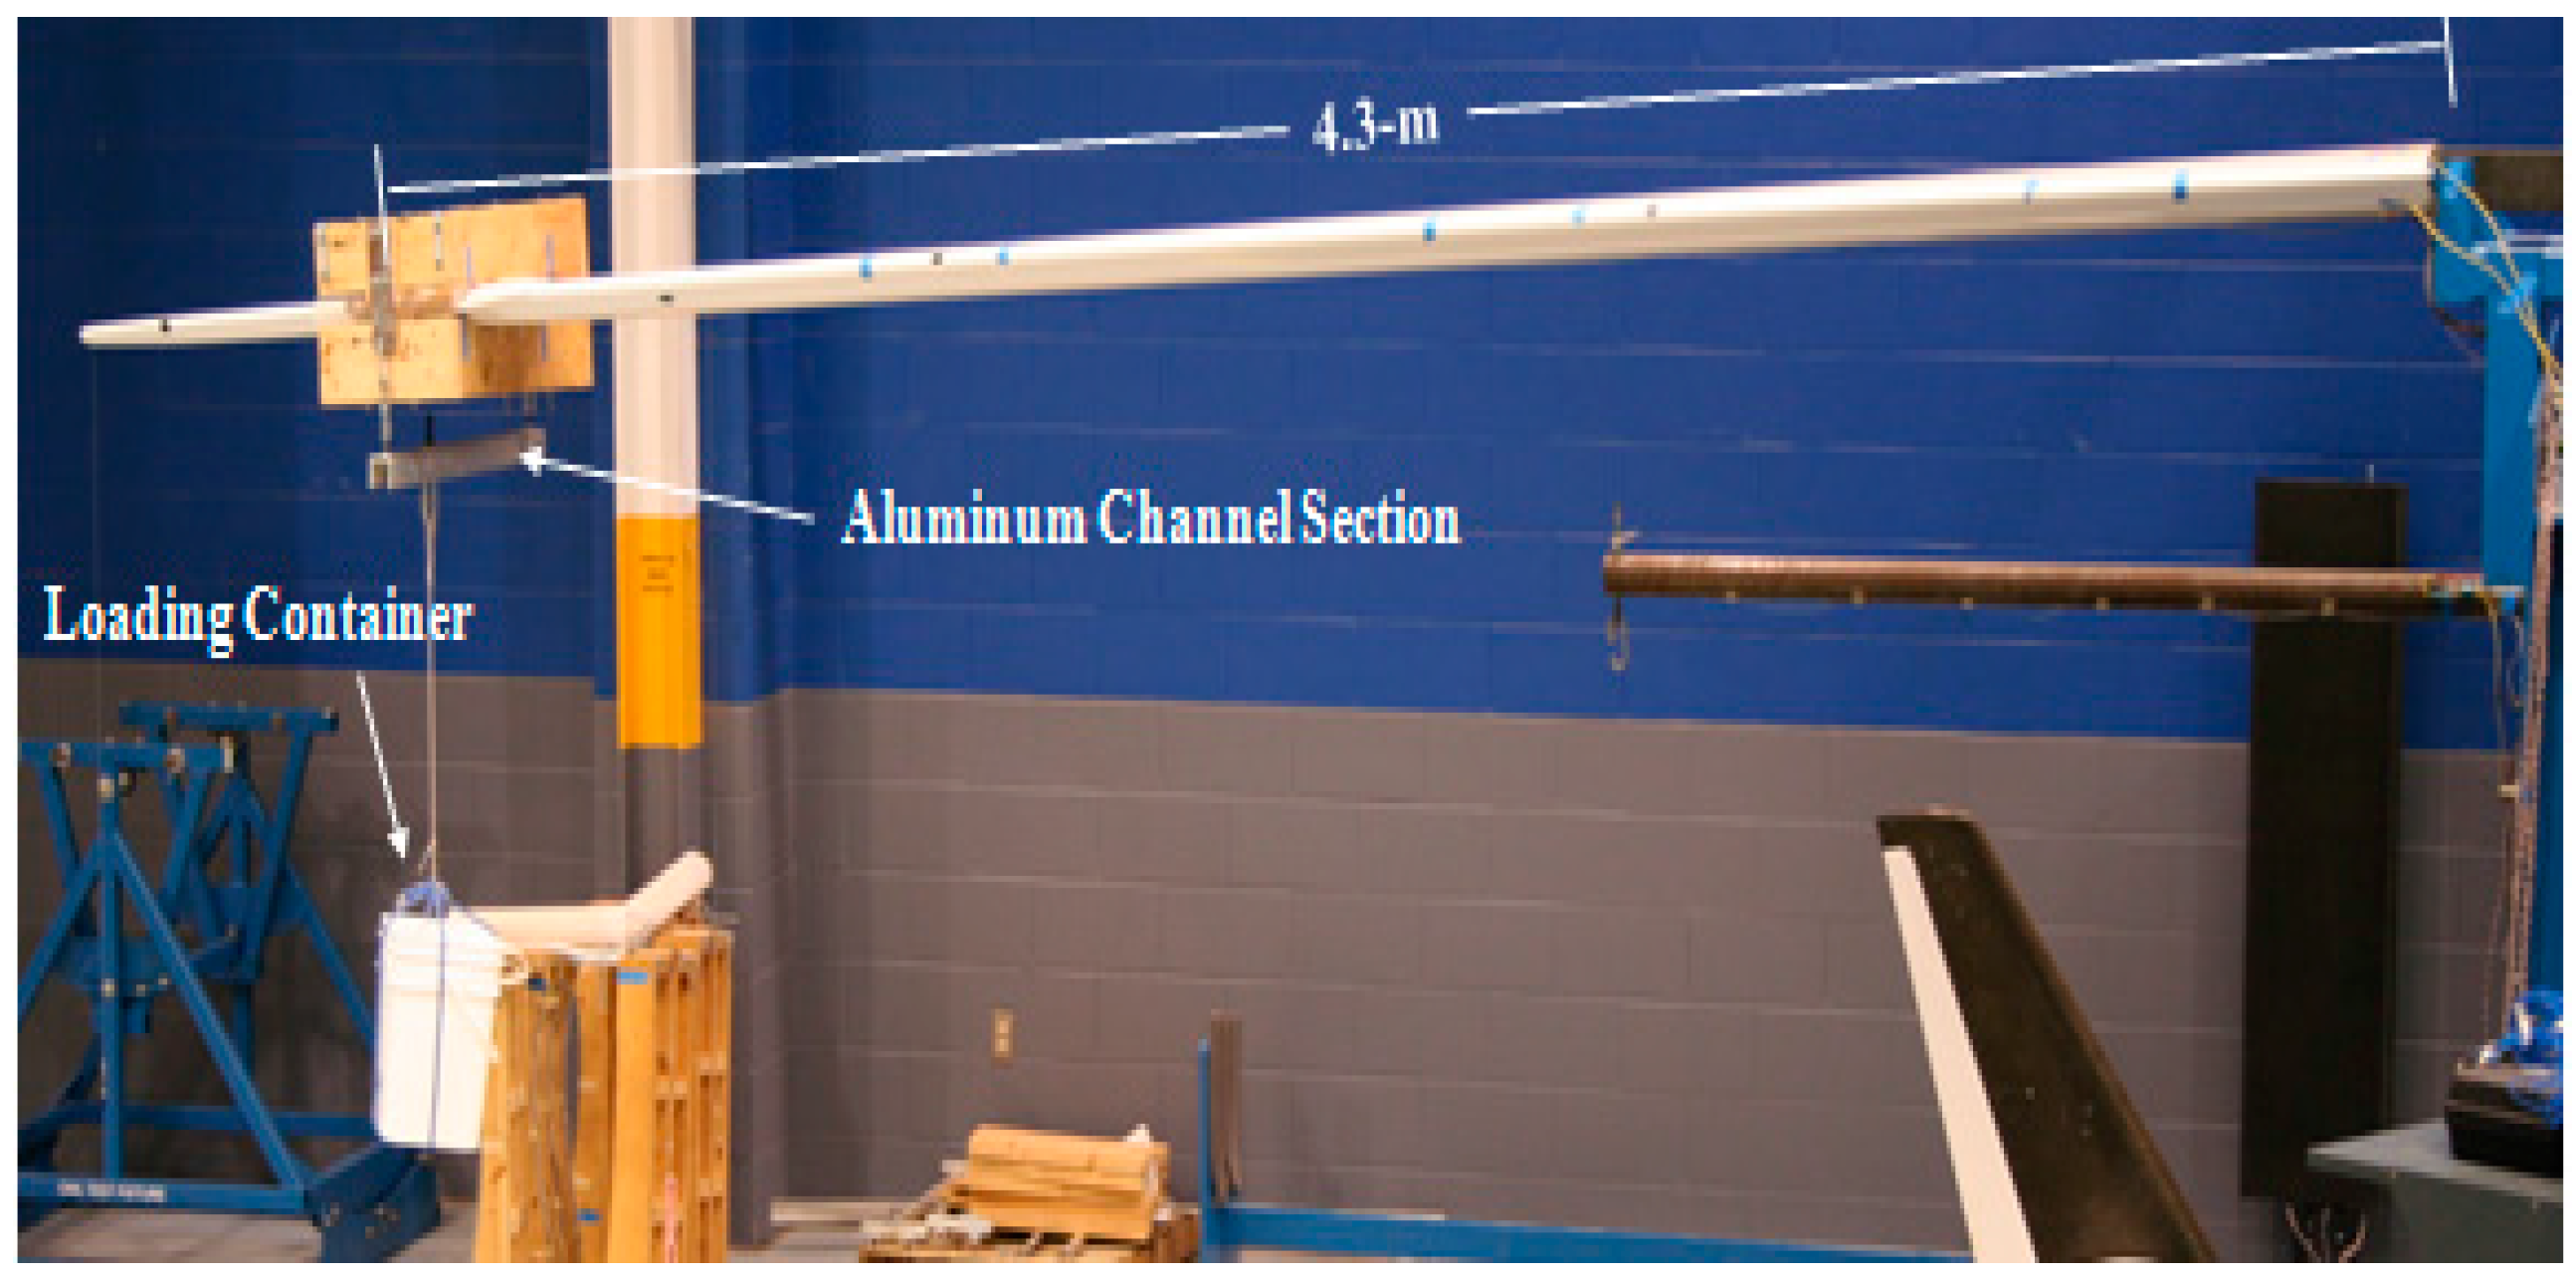
Concentrated loads were applied to the wing at a distance of 4.3-m from the root rib, as shown in Figure 6. These point loads were applied by placing lead weights into a container that was suspended from the center of gravity of the wing by a wooden cradle. Data was acquired after each load increment listed in Table 3.

4.2.2. Wing Instrumentation

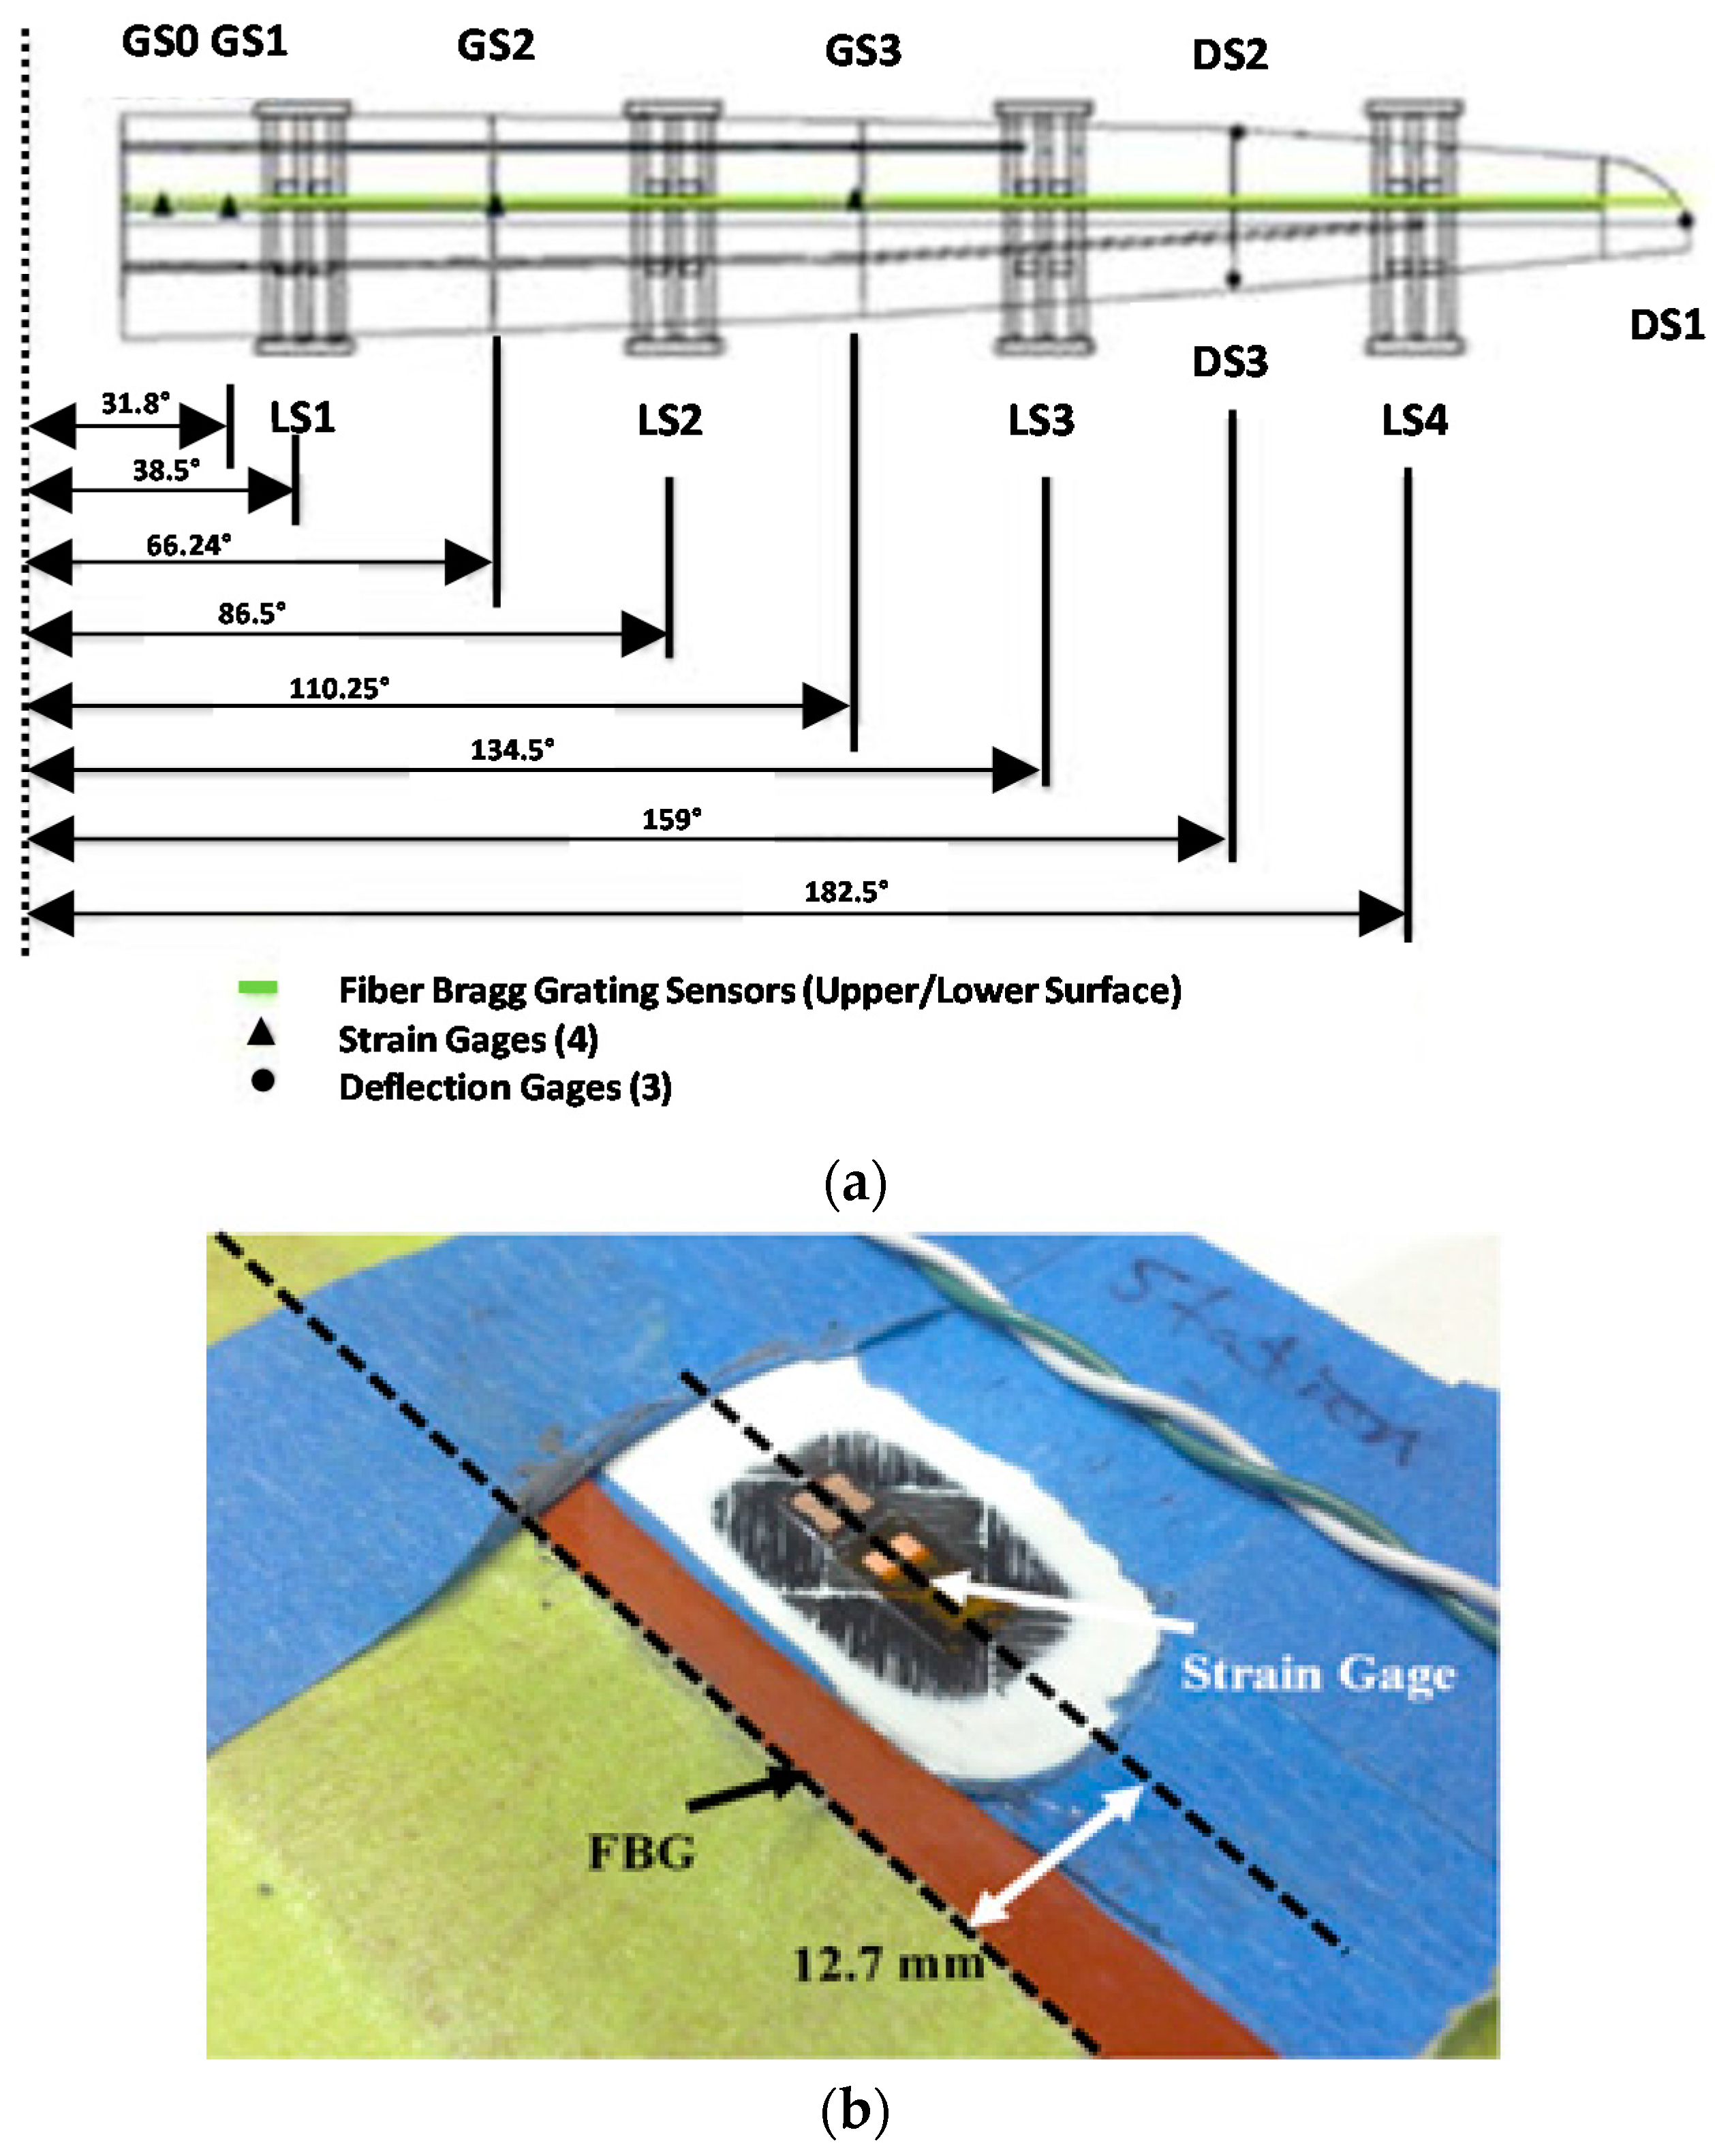
Two continuous optical fibers were affixed to the upper and lower surfaces of the left wing using MasterBond Supreme 33 (Hackensack, NJ, USA) adhesive. The FBG fibers, with a sensor spacing of approximately 12.5-mm, were placed from root to tip along the main spar, resulting in a total of 388 sensors on the upper surface and 390 sensors on the lower surface of the composite wing. Figure 7a shows the location of the sensors on the wing structure. Four general-purpose strain gages (Vishay Measurements CEA-06-125UN-350, Micro-Measurements, Raleigh, NC, USA), with a nominal gage length of 3.175-mm, were installed along the main spar, next to the FBG fiber at the four gage stations GS0, GS1, GS2, and GS3, shown in Figure 7a. The strain gages were placed approximately 12.7-mm from the optical fiber, as shown in Figure 7b. In addition to the FBG sensors and strain gages on the surface of the left wing, both the right and left wings were instrumented with a tip displacement gage (Celesco PT1DC, Chatsworth, CA, USA). As shown in Figure 5, a 50-kN load cell (Interface Advanced Force Measurement Model 1210BXV-50kN, Scottsdale, AZ, USA) was placed between the last tier of the whiffletree mechanism and the hydraulic loading cylinder.
LabVIEW® [35] software was used with a computer data acquisition system to obtain the strains and applied loads at each loading increment. Prior to loading the wings, the strain gages were balanced to a zero mean voltage by adjusting the output voltage from the strain gage amplifiers. Two channels (one for each surface mounted fiber on the wing structure) of an eight channel FOSS system were used to acquire the data from the 778 FBG sensors.

4.3. Out-of-Plane Displacements and Loads Algorithms

The deflection and load algorithms used in this study are based on classical beam theory. It is to be noted that the loading of the composite wing was applied in a manner to minimize all twist, thereby considering only the case of pure bending.

4.3.1. Out-of-Plane Displacements Algorithm

Utilizing the surface strain measurements at multiple equally spaced sensing stations the displacement equation can be expressed using discrete strain measurements as [36,37]:
y i   =   ( Δ L ) 2 6 c [ ( 3 i 1 ) ε 0 + 6 j = 1 i 1 ( i j ) ε j + ε i ] , ( i = 1 , 2 , , n )
where y is the deflection at the strain sensing station i, ΔL is the spacing between strain sensing stations, c is the distance from the neutral axis to the outermost surface, and ε is the strain measured at the 
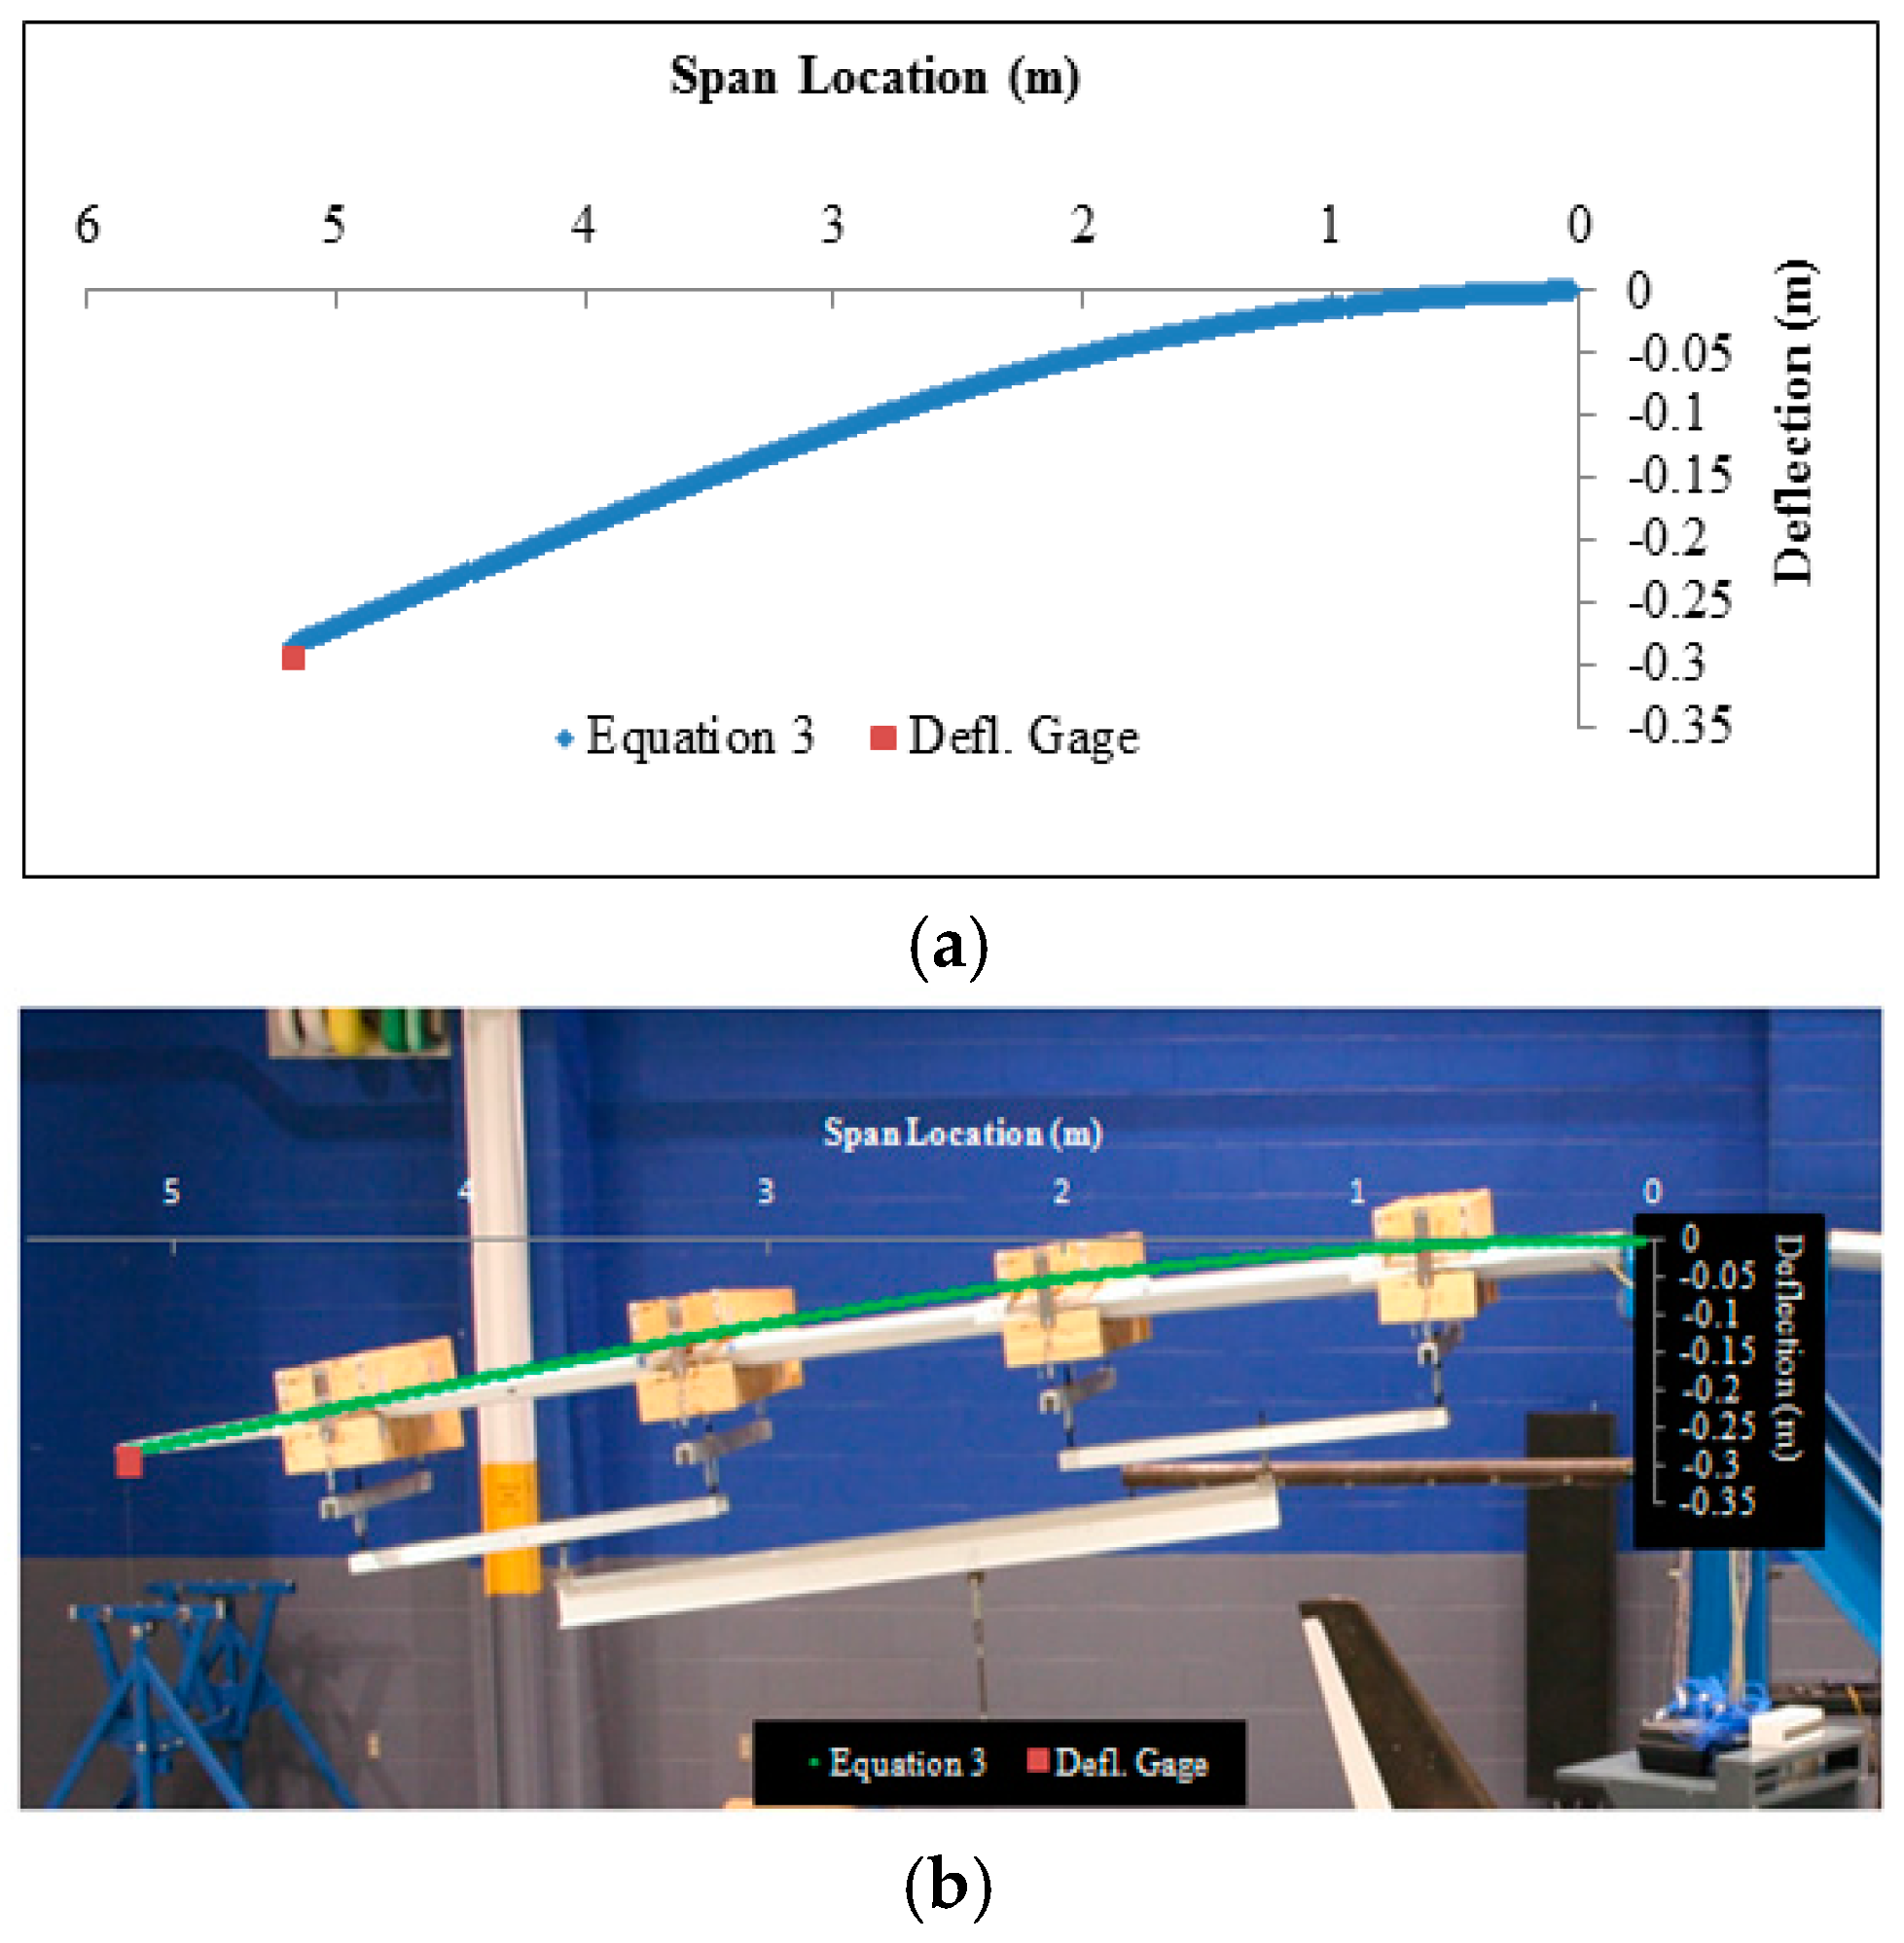
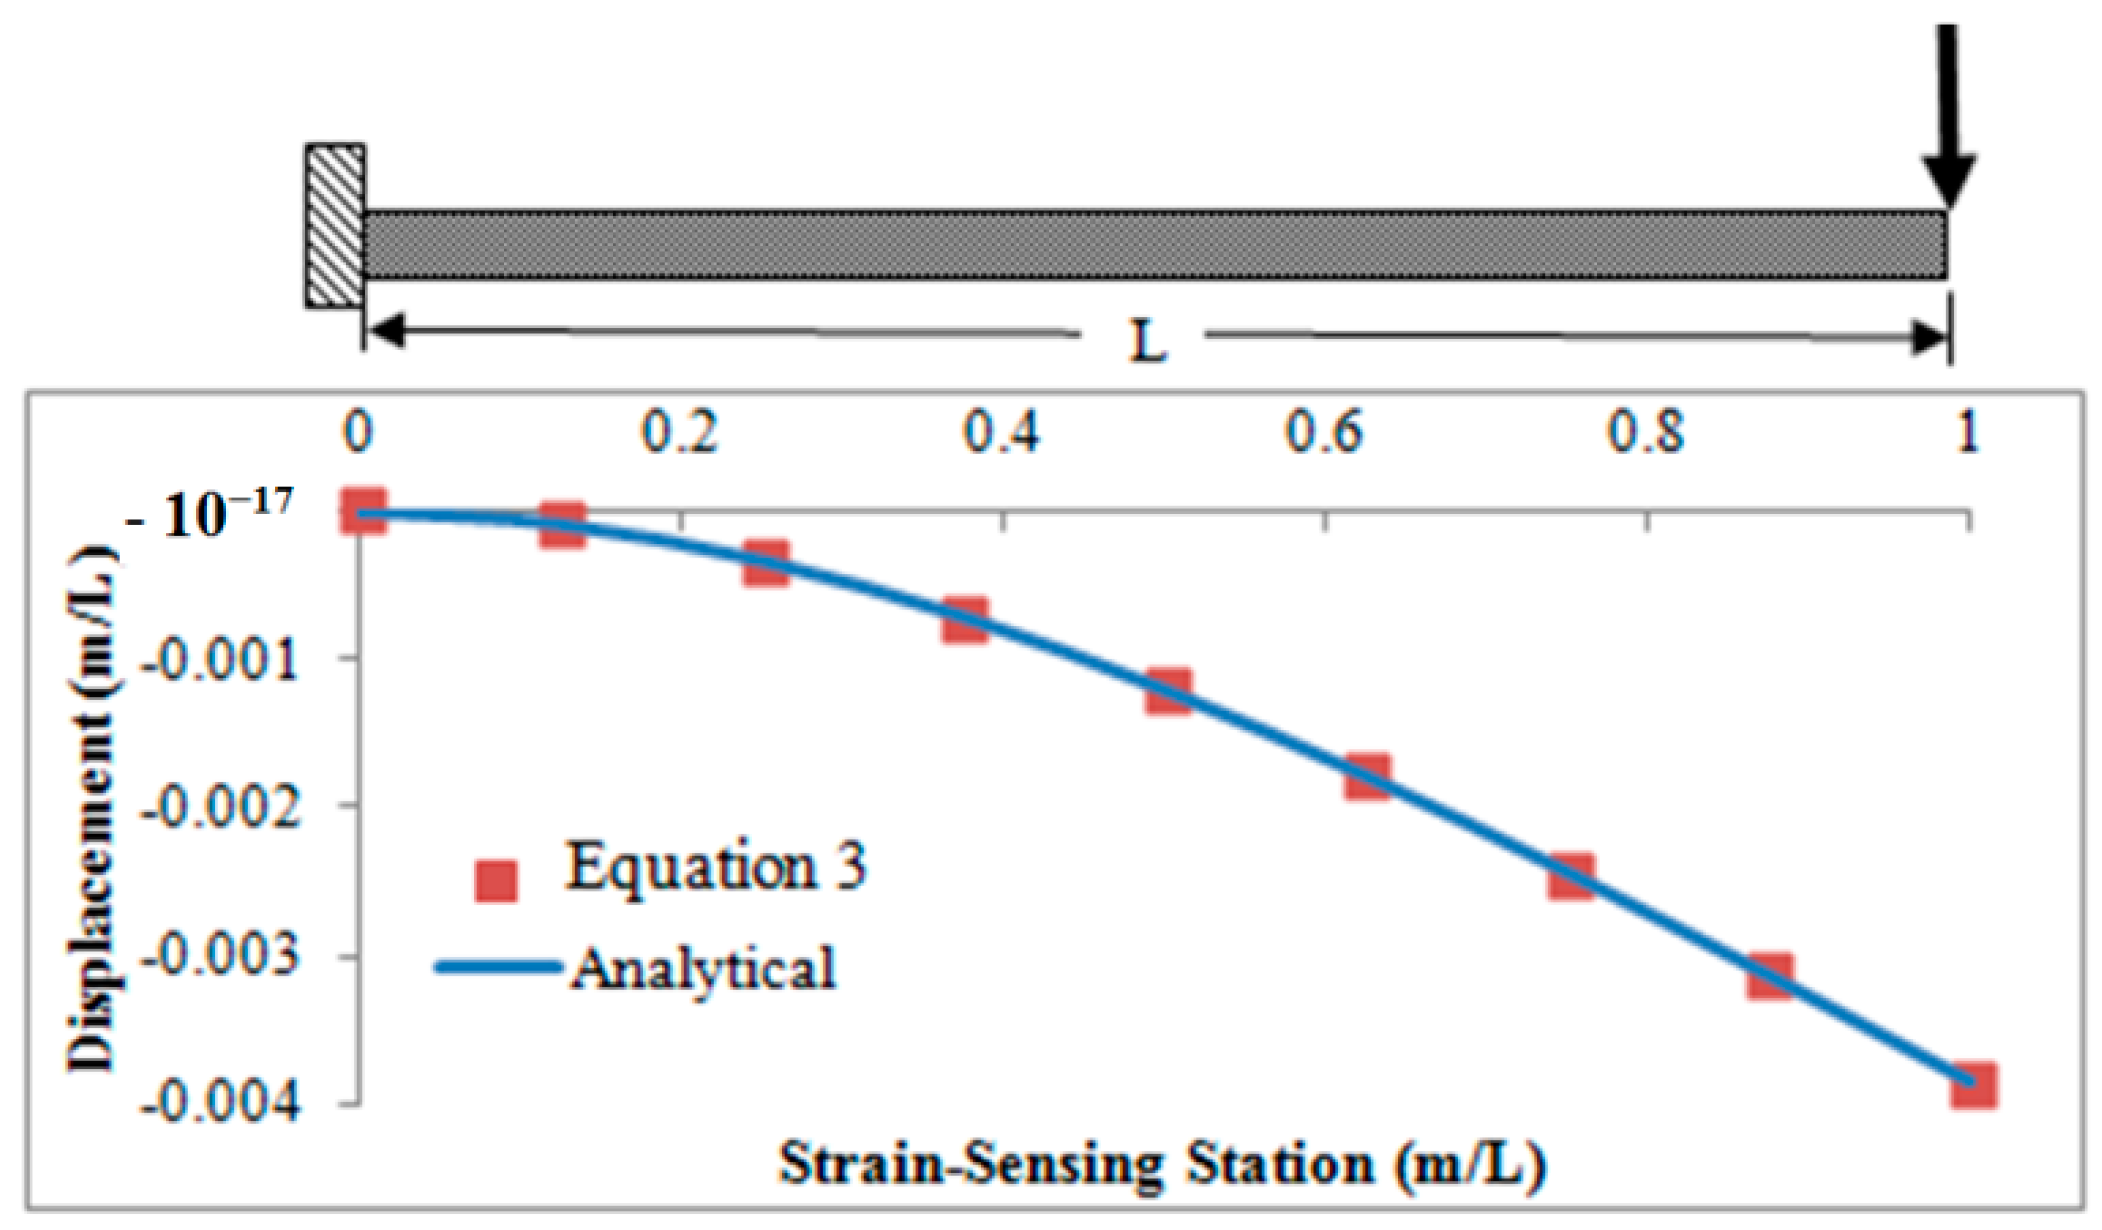
ith FBG. For demonstration, Figure 8 shows the elastic curve of a tip loaded cantilevered beam from classical beam theory and from using Equation (3); using only nine stations (n = 9), excellent agreement is obtained.

4.3.2. Out-of-Plane Loads Algorithm

The loads algorithm, which was used to determine the out-of-plane loads from the in-plane FBG strains, was originally developed by Richards et al. [38] from the classical beam equation for a prismatic beam and later validated by Bakalyar and Jutte [16] on flat monolithic plates. In the present study, the loads algorithm was used for the first time to determine the out-of-plane loads of an air vehicle structure. For completeness, a brief development of the algorithm is given. The bending moment can be written in terms of each FBG strain sensor location i as:
M i   =   ( E I ) i ε i c i
where Mi is the bending moment, εi is the strain, (EI)i is the flexural rigidity, and c is the distance from the neutral axis to the sensor. The moment at each station i can also be determined by taking the moment at each longitudinal location (L − i∆L) using:
M i   = P [ ( L - i Δ L ) ]
and P is the applied load. Using Equation (5) in Equation (4), the flexural rigidity (EI)i at each FBG station is obtained as:
( E I ) i   =   P [ ( L - i Δ L ) ] c i ε i
where L is the length of the beam, i is the sensor station number (i = 1, 2, ···, n), ∆L is the spacing between strain sensors, c is the distance from the neutral axis, and ε is the strain at the ith station. Equation (6) is used to determine the flexural rigidity of a cantilevered beam by obtaining the strain response for a concentrated load at a known location. The flexural rigidity can be used in Equation (4) to determine the bending moment, which is subsequently used to calculate the shear loads Vi from:
V i     Δ M i Δ x i
where xi is the FBG strain sensor locations. The out-of-plane loads Pi are determined using the equilibrium of forces, as:
P i   = Δ V i .

4.4. Results and Discussion

Strain measurements from 778 FBG sensors were used to compute the wing shape and the out-of-plane load per sensor for the concentrated and distributed loading cases. Concentrated loading was used primarily to enable the calculation of the flexural rigidity of the complex wing at each sensor location for subsequent use in the determination of the out-of-plane loads for all test cases. The composite wing was subjected to a distributed loading to simulate an in-flight loading condition.

4.4.1. Concentrated Loading

At each of the 778 FBG sensor locations, the flexural rigidity of the wing section was determined (Equation (6)) and the values computed from each load increment were averaged to obtain the effective flexural rigidity. The strain from the largest concentrated load (468-N) and the effective flexural rigidity (EI)i were used in Equation (4) to determine the bending moment Mi. A linear regression fit of the bending moment data was performed and the results were used to calculate the shear force distribution and subsequently the out-of-plane loads using Equation (8). Table 4 shows the results of the load calculation for an applied load of 468-N; the total computed load is within 1.62% of the applied load. The computed out-of-plane loads for each of the load increments, with one exception, are within 2% of the applied load, as shown in Table 5.

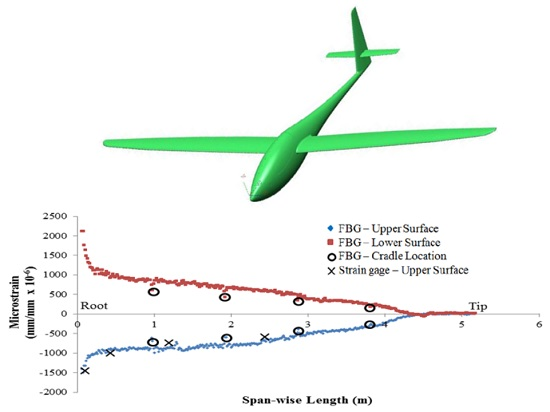
4.4.2. Strains under Distributed Loading

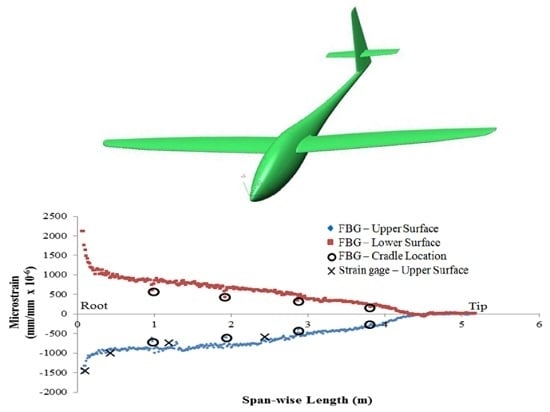
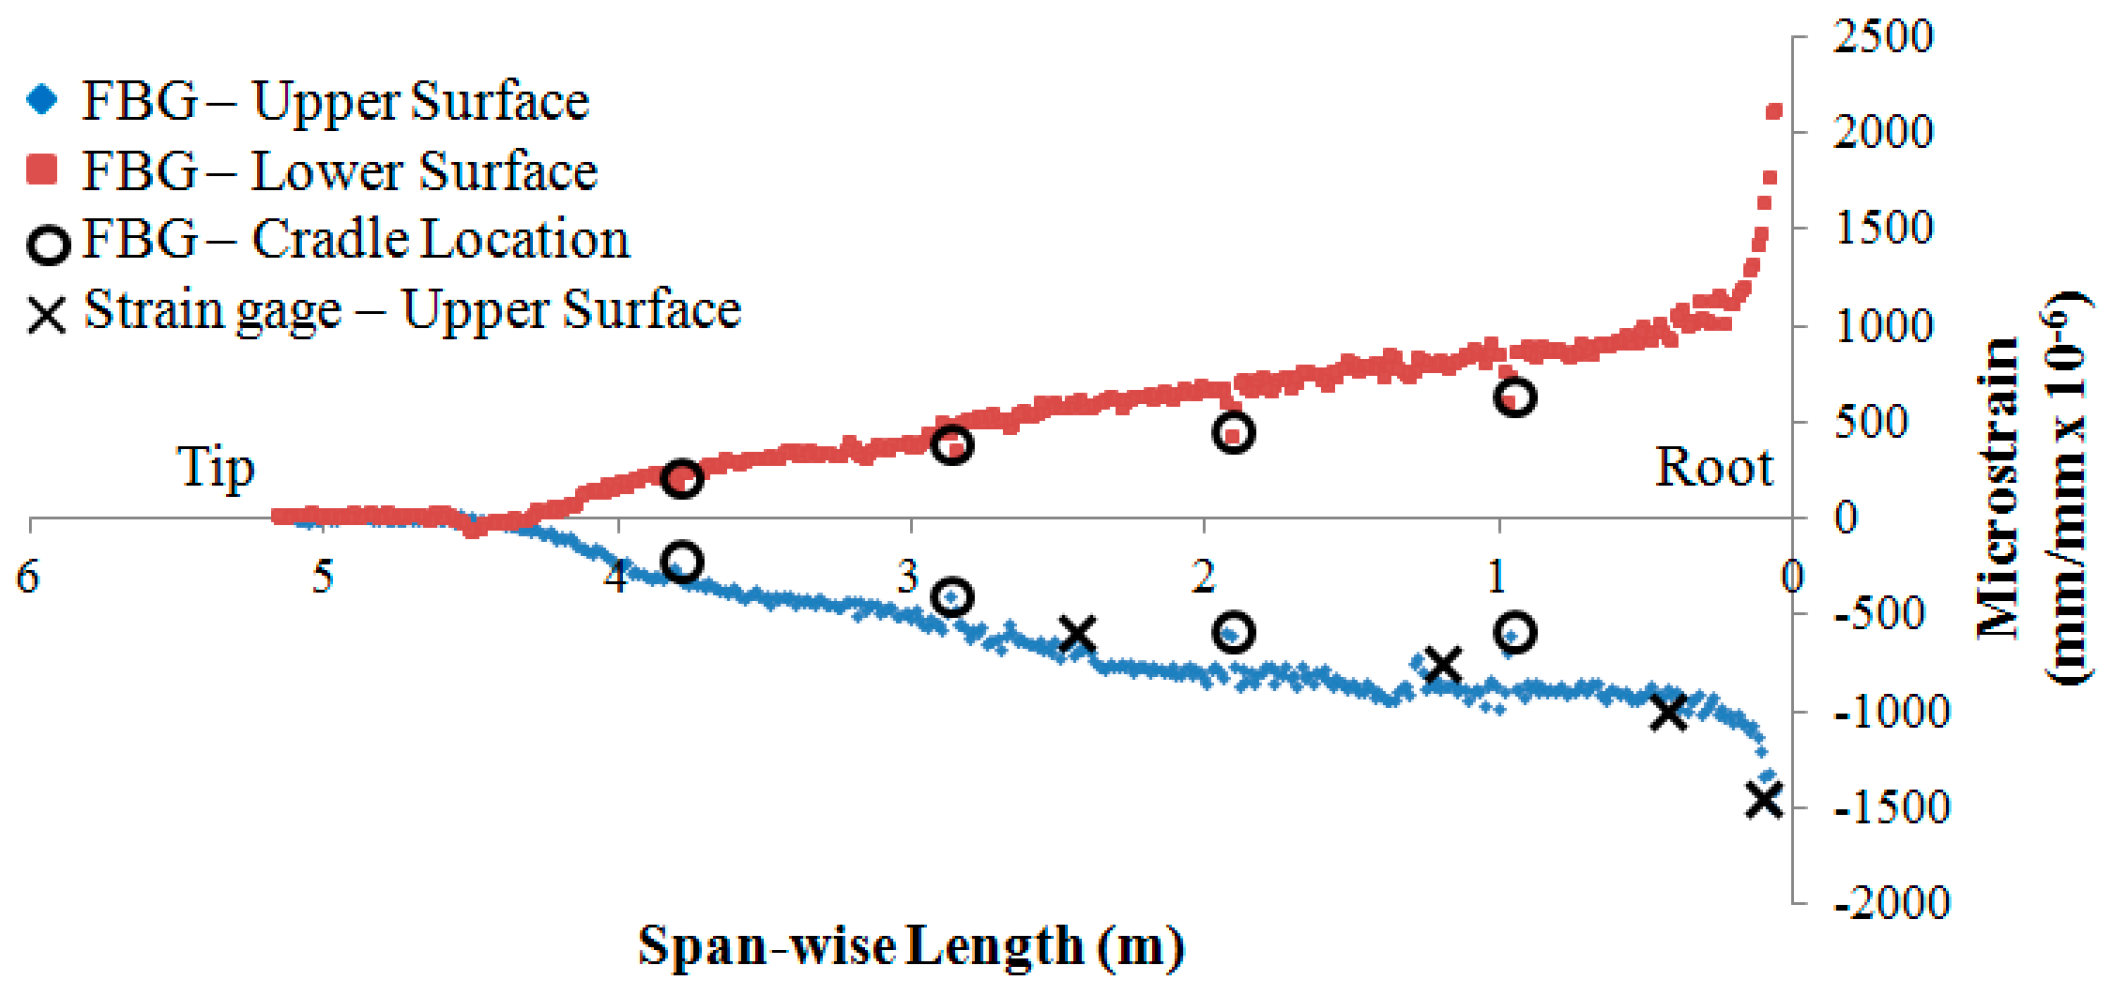
Figure 9 shows the measured strain distribution from the FBG sensors and the strain gages at the maximum resultant load of 2269-N. The measured strains from the strain gages are slightly offset from those obtained from the FBGs; this was expected since the strain gages could not be placed directly on the FBGs and were actually mounted approximately 13-mm from the optical fiber (Figure 7b). Figure 9 shows a generally linear strain distribution along the wing span. Elevated strains are seen close to the wing root, where the load rapidly transitions to the main spar. The high spatial density of the strains from the FBGs also revealed some physical details not normally obtained from conventional strain gages. For example, the locations designated by the open circles in Figure 9 were determined to be locations directly under the cradles.

4.4.3. Deflections under Distributed Loading

The measured FBG strains were used to determine the elastic deflection curve. The wing shape at a resultant whiffletree load of 2269-N (2.27-g) is shown in Figure 10a; for demonstration, the computed elastic curve is superimposed on the deflected wing in Figure 10b. At this loading, the left wing tip deflection was measured to be 0.295-m, resulting in a 3.75% difference from the computed deflection of 0.284-m. Table 6 shows the calculated deflections for several load cases, and the predictions are within 4.2% of the measured data.

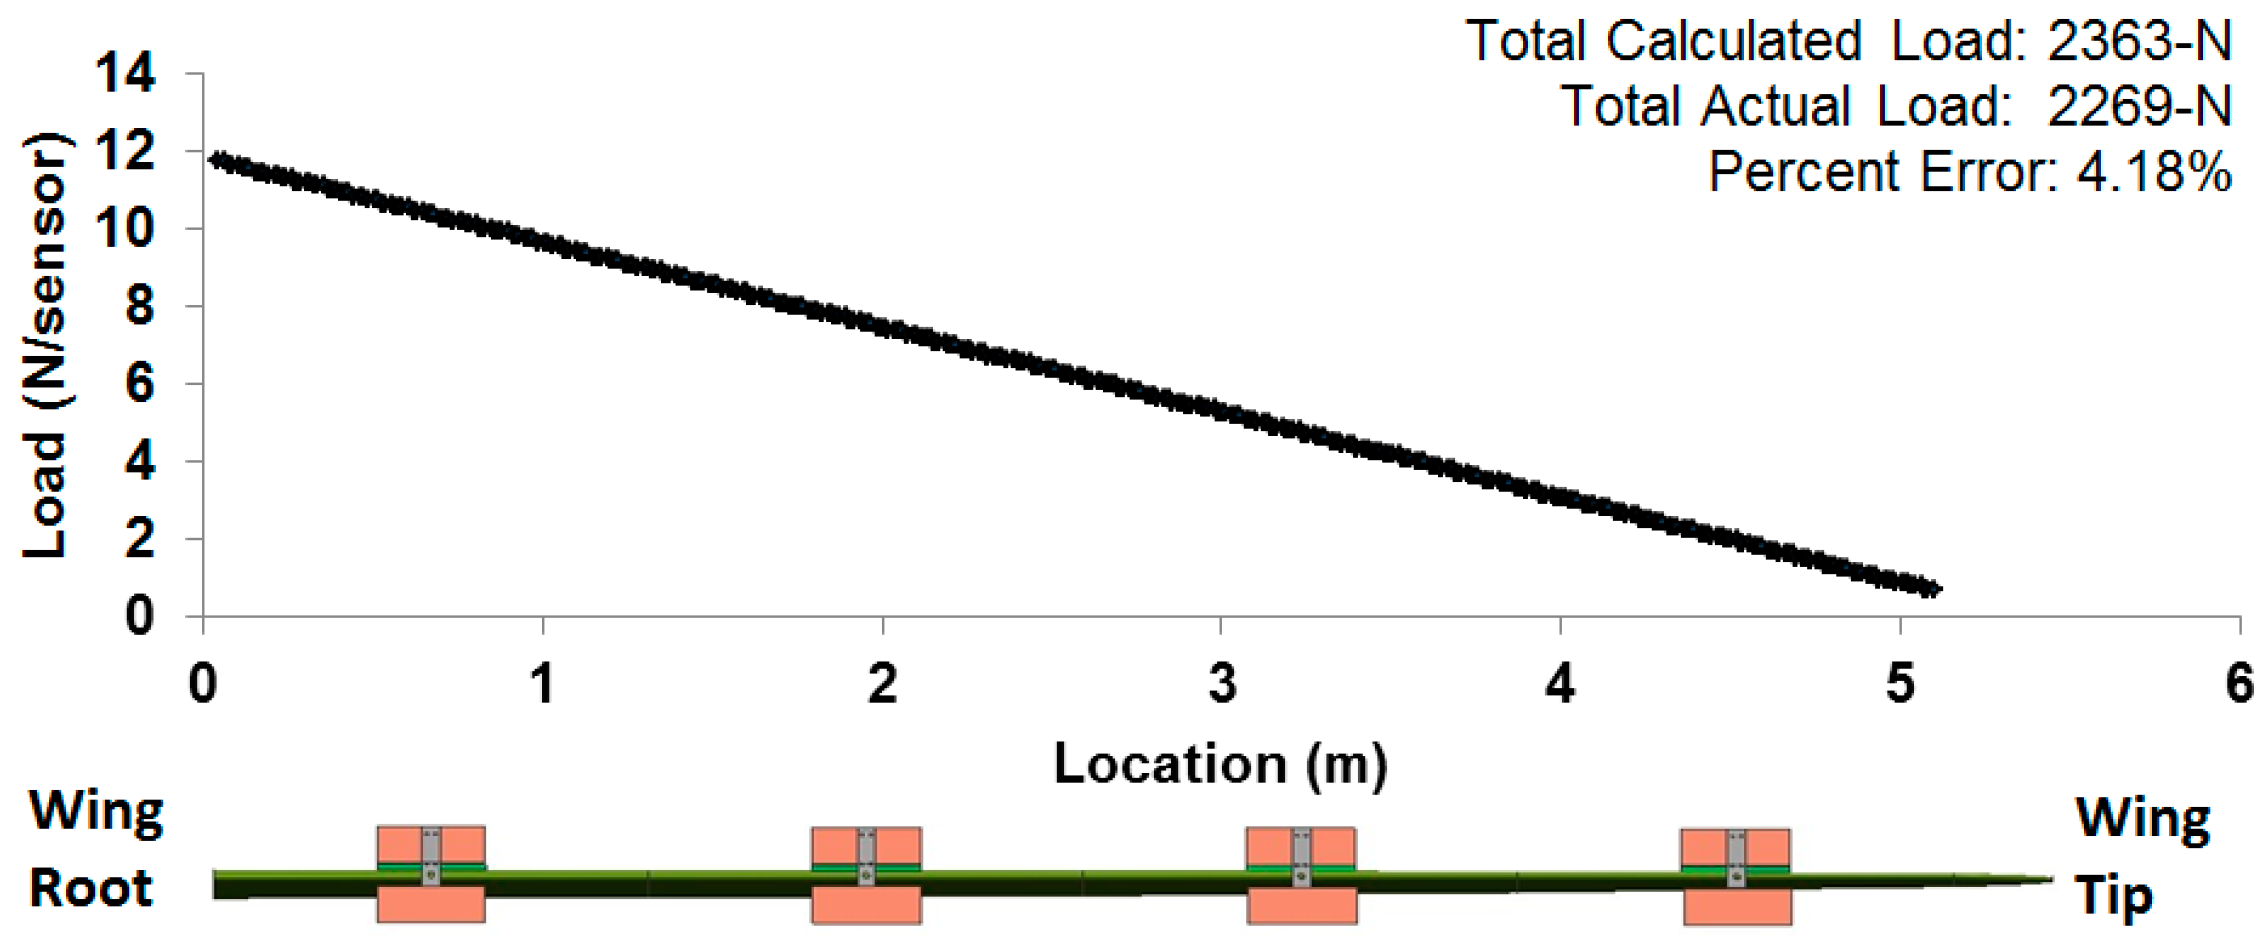
4.4.4. Out-of-Plane Loads under Distributed Loading

The in-plane FBG strain data obtained from the whiffletree (distributed) loading was used to determine the out-of-plane loads. The effective flexural rigidity, determined from the concentrated load case, was used to calculate the bending moment acting on the wing. A third-order polynomial regression was used to obtain the moment as a function of the span-wise location; this was subsequently used to calculate the out-of-plane load per sensor, as shown in Figure 11. Table 7 shows that the computed FBG-based loads are within 4.2% of the measured applied loads.

5. Conclusions

This paper provides an overview of FBG-based sensing for large scale applications, demonstrating the real-world applications and increasing usage of optical fiber measurement methods. These sensors are being used in every industry, particularly for aerospace and civil structures, for measurement and monitoring of strains, temperatures and pressures and for detecting damage. The many attributes of FBG sensors make them ideal for measurement and monitoring applications.
For demonstration of an operational application, a fiber optic strain sensing system was used to obtain a strain distribution over the semi-span of a full scale composite wing subjected to concentrated and distributed loads. The high spatial resolution of the FBG strain measurements enabled the computation of the deflected wing shape and out-of-plane loads of the wing. When compared to conventional foil strain gages, the FOSS system provided a much higher density (every 12.5-mm) of strain measurements, thereby revealing details of the structure under load.

Acknowledgments

The support provided for this study by the NASA Armstrong Flight Research Center (Award No. AERO532 11020161), Raspet Flight Research Laboratory, and the NASA/Mississippi Space Grant Consortium (Award No. 12040456 12070825) is gratefully acknowledged.

Author Contributions

This research was conducted under the guidance of Rani W. Sullivan and W. Lance Richards. Matthew J. Nicolas conducted the experimental study as a graduate research assistant at Mississippi State University. All authors contributed to the writing of this manuscript.

Conflicts of Interest

The authors declare no conflict of interest.

Abbreviations

FBGFiber Bragg Grating
NASANational Aeronautics and Space Administration
UAVUnmanned Aerial Vehicle
FOSSFiber Optic Strain Sensing
CFRPCarbon Fiber Reinforced Plastic
COPVComposite Overwrapped Pressure Vessel
UTFUniversal Test Frame

References

  1. Guo, H.; Xiao, G.; Mrad, N.; Yao, J. Fiber optic sensors for structural health monitoring of air platforms. Sensors 2011, 11, 3687–3705. [Google Scholar] [CrossRef] [PubMed]
  2. Childers, B.A.; Froggatt, M.E.; Allison, S.G.; Moore, T.C.S.; Hare, D.A.; Batten, C.F.; Jegley, D.C. Use of 3000 Bragg grating strain sensors distributed on four eight-meter optical fibers during static load tests of a composite structure. In Proc. SPIE 4332, Proceedings of the Smart Structures and Materials 2001: Industrial and Commercial Applications of Smart Structures Technologies, Newport Beach, CA, USA, 4–8 March 2001; pp. 133–142. [CrossRef]
  3. Kahandawa, G.C.; Epaarachchi, J.; Wang, H.; Lau, K.T. Use of FBG sensors for SHM in aerospace structures. Photonic Sens. 2012, 2, 203–214. [Google Scholar] [CrossRef] [Green Version]
  4. Richards, W.L.; Parker, A.R., Jr.; Ko, W.L.; Piazza, A.; Chan, P. RTO AGARDograph 160: Application of Fiber Optic Instrumentation; NASA Center for AeroSpace Information: Hanover, MD, USA, 2012; Volume 22.
  5. Keulen, C.J.; Yildiz, M.; Suleman, A. Multiplexed FBG and etched fiber sensors for process and health monitoring of 2-&3-D RTM components. J. Reinf. Plast. Compos. 2011, 30, 1055–1064. [Google Scholar]
  6. Banks, C.E.; Grant, J.; Russell, S.; Arnett, S. Strain measurement during stress rupture of composite over-wrapped pressure vessel with fiber Bragg gratings sensors. In Proc. SPIE 6933, Proceedings of the Smart Sensor Phenomena, Technology, Networks, and Systems 2008, San Diego, CA, USA, 10–12 March 2008. [CrossRef]
  7. Nicolas, M.J.; Sullivan, R.W.; Richards, W.L. Fiber Bragg grating strains to obtain structural response of a carbon composite wing. In Proceedings of the ASME 2013 Conference on Smart Materials, Adaptive Structures and Intelligent Systems, Snowbird, UT, USA, 16–18 September 2013. [CrossRef]
  8. Kreuzer, M. Strain Measurement with Fiber Bragg Grating Sensors; S2338-1.0e; HBM GmbH: Darmstadt, Germany, 2006. [Google Scholar]
  9. Kang, H.K.; Park, J.W.; Ryu, C.Y.; Hong, C.S.; Kim, C.G. Development of fibre optic ingress/egress methods for smart composite structures. Smart Mater. Struct. 2000, 9, 149–156. [Google Scholar] [CrossRef]
  10. Kim, S.-W.; Kang, W.-R.; Jeong, M.-S.; Lee, I.; Kwon, I.-B. Deflection estimation of a wind turbine blade using FBG sensors embedded in the blade bonding line. Smart Mater. Struct. 2013, 22, 12. [Google Scholar] [CrossRef]
  11. Betz, D.C.; Staudigel, L.; Trutzel, M.N.; Kehlenbach, M. Structural monitoring using fiber-optic Bragg grating sensors. Struct. Health Monit. 2003, 2, 145–152. [Google Scholar] [CrossRef]
  12. Kim, J.H.; Lee, Y.G.; Park, Y.; Kim, C.G. Temperature-compensated strain measurement of full-scale small aircraft wing structure using low-cost FBG interrogator. In Proc. SPIE 8692, Proceedings of the Sensors and Smart Structures Technologies for Civil, Mechanical, and Aerospace Systems 2013, San Diego, CA, USA, 10–14 March 2013. [CrossRef]
  13. Hill, K.O.; Meltz, G. Fiber Bragg Grating Technology Fundamentals and Overview. J. Lightwave Technol. 1997, 15, 1263–1276. [Google Scholar] [CrossRef]
  14. Kinet, D.; Megret, P.; Goossen, K.; Qiu, L.; Heider, D.; Caucheteur, C. Fiber Bragg Grating Sensors toward Structural Health Monitoring in Composite Materials: Challenges and Solutions. Sensors 2014, 14, 7394–7419. [Google Scholar] [CrossRef] [PubMed]
  15. Xiao, G.; Guo, H.; Mrad, N.; Rocha, B.; Sun, Z. Towards the simultaneous monitoring of load and damage in aircraft structures using fiber Bragg grating sensors. In Proc. SPIE 8421, Proceedings of the OFS2012, 22nd International Conference on Optical Fiber Sensors, 8421BD, Beijing, China, 15–19 October 2012. [CrossRef]
  16. Bakalyar, J.A.; Jutte, C. Validation tests of fiber optic strain-based operational shape and load measurements. In Proceedings of the AIAA (SDM) Structures, Structural Dynamics and Materials Conference, Honolulu, HI, USA, 23–26 April 2012. [CrossRef]
  17. Richards, L.; Parker, A.R.; Ko, W.L.; Piazza, A. Fiber Optic Wing Shape Sensing on NASA‘s Ikhana UAV. In Proceedings of the NAVAIR Meeting, Edwards, CA, USA, 7 Feburary 2008.
  18. Alvarenga, J.; Derkevorkian, A.; Peña, F.; Boussalis, H.; Masri, S.F. Fiber-optic strain senor-based structural health monitoring of an uninhabitated air vehicle. In Proceedings of the International Astronautical Congress, IAC 8, Naples, Italy, 1–5 October 2012; pp. 6636–6641.
  19. Gupta, N.; Augustin, M.J.; Sathya, S.; Sundaram, R.; Prasad, M.H.; Pillai, A.; Gali, S.; Balter, J.; Guedj, P.; Kressel, I.; et al. Flight data from an airworthy structural health monitoring system for an unmanned air vehicle using integrally embedded fiber optic sensors. In Proceedings of the 8th International Workshop on Structural Health Monitoring (IWSHM), Stanford, CA, USA, 13–15 September 2011; pp. 479–486.
  20. Ciminello, M.; Concilio, A.; Flauto, D.; Mennella, F. FBG sensor system for trailing edge chord-wise hinge rotation measurements. In Proc. SPIE 8692, Proceedings of the Sensors and Smart Structures Technologies for Civil, Mechanical, and Aerospace Systems 2013, San Diego, CA, USA, 10–14 March 2013. [CrossRef]
  21. Amano, M.; Okabe, Y.; Takeda, N.; Ozaki, T. Structural health monitoring of an advanced grid structure with embedded fiber bragg grating sensors. Struct. Health Monit. 2007, 6, 309–324. [Google Scholar] [CrossRef]
  22. Dvorak, M.; Had, J.; Ruzicka, M.; Posvar, Z. Monitoring of 3D composite structures using fiber optic Bragg grating sensors. In Proceedings of the 8th International Workshop on Structural Health Monitoring, Stanford, CA, USA, 13–15 September 2011.
  23. Ruzek, R.; Kudrna, P.; Kadlec, M.; Karachalios, V.; Tserpes, K.I. Strain and damage monitoring in CFRP fuselage panels using fiber Bragg grating sensors. Part II: Mechanical testing and validation. Compos. Struct. 2014, 107, 737–744. [Google Scholar] [CrossRef]
  24. Kang, D.R.; Kim, C.D.; Park, S.W.; Rong, C.S.; Kim, C.G. In-situ health monitoring of filament wound pressure tanks using embedded FBG sensors. In Composites Technologies For 2020: Proceedings of the Fourth Asian-Australasian Conference on Composite Materials (ACCM 4); Ye, L., Mai, Y.-W., Su, Z., Eds.; ACCM: Sydney, Australia, 2004; pp. 963–968. [Google Scholar]
  25. Mizutani, T.; Takeda, N.; Takeya, H. On-board strain measurement of a cryogenic composite tank mounted on a reusable rocket using FBG sensors. Struct. Health Monit. 2006, 5, 205–214. [Google Scholar] [CrossRef]
  26. Schröder, K.; Ecke, W.; Kautz, M.; Willett, S.; Unterwaditzer, H.; Bosselmann, T.; Rothhardt, M. Smart current collector—Fibre optic hit detection system for improved security on railway tracks. Meas. Sci. Technol. 2013, 24, 11. [Google Scholar] [CrossRef]
  27. Chen, S.E.; Smith, B.; Wang, P. Fiber Optics Sensing of Stressing and Fracture in Cylindrical Structures. In Topics in Modal Analysis, Volume 7: Proceedings of the 31st IMAC, A Conference on Structural Dynamics; Allemang, R., de Clerck, J., Niezrecki, C., Wicks, A., Eds.; Springer New York: New York, NY, USA, 2014; pp. 287–293. [Google Scholar]
  28. Wan, C.; Hong, W.; Wu, Z.; Sato, T. Testing and monitoring for a large scale truss bridge using long-gauge fiber optic sensors. Key Eng. Mater. 2013, 569–570, 223–229. [Google Scholar] [CrossRef]
  29. Beaumont, P.W.R. The failure of fibre composites: An overview. J. Strain Anal. Eng. Des. 1989, 24, 189–205. [Google Scholar] [CrossRef]
  30. Peña, F.; Strutner, S.M.; Richards, W.L.; Piazza, A.; Parker, A.R. Evaluation of embedded FBGs in composite overwrapped pressure vessels for strain based structural health monitoring. In Proc. SPIE 9059, Proceedings of the Industrial and Commercial Applications of Smart Structures Technologies 2014, San Diego, CA, USA, 9–13 March 2014.
  31. Mendoza, E.; Prohaska, J.; Kempen, C.; Esterkin, Y.; Sun, S. In-flight fiber optic acoustic emission sensor (FAESense) system for the real time detection, localization, and classification of damage in composite aircraft structures. In Proc. SPIE 8720, Proceedings of the Photonic Applications for Aerospace, Commercial, and Harsh Environments IV, Baltimore, MD, USA, 29 April–1 May 2013. [CrossRef]
  32. Mendoza, E.; Prohaska, J.; Kempen, C.; Esterkin, Y.; Sun, S.; Krishnaswamy, S. Fiber optic system for the real time detection, localization, and classification of damage in composite aircraft structures. In Proc. SPIE 9157, Proceedings of the 23rd International Conference on Optical Fibre Sensors, Santander, Spain, 2–6 June 2014. [CrossRef]
  33. Betz, D.C.; Thursby, G.; Culshaw, B.; Staszewski, W.J. Structural damage location with fiber Bragg grating rosettes and Lamb waves. Struct. Health Monit. 2007, 6, 299–308. [Google Scholar] [CrossRef]
  34. Sullivan, R.; Hwang, Y.; Rais-Rohani, M.; Lacy, T. Structural Analysis and Testing of an Ultralight Unmanned-Aerial-Vehicle Carbon-Composite Wing. J. Aircr. 2009, 46, 814–820. [Google Scholar] [CrossRef]
  35. LabView, version 8.0; computer software; L.S. National Instruments Corporation: Austin, TX, USA, 2011.
  36. Ko, W.L.; Richards, W.; Tran, V.T. Displacement Theories for In-Flight Deformed Shape Predictions of Aerospace Structures; Technical Report for NASA Dryden Flight Research Center: Edwards, CA, USA, 1 October 2007.
  37. Ko, W.L.; Richards, W.L. Method for Real-Time Structure Shape-Sensing. U.S. Patent 7,520,176, 21 April 2009. [Google Scholar]
  38. Richards, W.L.; Ko, W.L. Process for Using Surface Strain Measurements to Obtain Operational Loads for Complex Structures. U.S. Patent 7,715,994, 11 May 2010. [Google Scholar]
Figure 1. Principle of fiber Bragg grating (FBG) showing light propagation, reflection and transmission through the core of the fiber.
Aerospace 03 00018 g001
Figure 2. CAD model of a sailplane-inspired air vehicle.
Aerospace 03 00018 g002
Figure 3. Composite wing structural components [34].
Aerospace 03 00018 g003
Figure 4. Top view of the spar/spar and wing/fuselage attachment region [34].
Aerospace 03 00018 g004
Figure 5. (a) Sketch of universal test frame (UTF) for concentrated and distributed loading with the wing loading stations LS1, LS2, LS3 and LS4 [34] and (b) photo of wing structure under whiffletree loading.
Aerospace 03 00018 g005
Figure 6. Concentrated load test of composite wing.
Aerospace 03 00018 g006
Figure 7. (a) Sensor location on the surface of the wing structure and (b) Strain gage location next to optical fiber [7].
Aerospace 03 00018 g007
Figure 8. Displacement curve of a cantilevered beam subjected to a tip load.
Aerospace 03 00018 g008
Figure 9. Strain distribution on the composite wing for a whiffletree resultant load of 2269-N (2.27 g).
Aerospace 03 00018 g009
Figure 10. Wing deflection for a resultant whiffletree load of 2269-N showing the (a) calculated elastic curve using FBG strains and (b) displacement results superimposed on the wing under load.
Aerospace 03 00018 g010
Figure 11. Out-of-plane load per FBG sensor for resultant load of 2269-N.
Aerospace 03 00018 g011
Table 1. Physical and engineering properties of carbon-composite wing materials [34].
Material PropertiesWoven Fabric Toray-T700GUnidirectional Fabric Toray-T700SFoam Core (DIAB Divinycell® HT50)
E11, GPa5.54 × 1011.19 × 1028.50 × 10−2
E22, GPa5.54 × 1019.31 × 100
G12, GPa4.21 × 1004.21 × 100
ν123.00 × 10−23.10 × 10−13.20 × 10⁻¹
ρ, kg/m31.49 × 1031.52 × 1034.95 × 10−1
Table 2. Wing distribution loading profile.
Load StepLoad Increment (N)Total Applied Load (N)
1Wing (155.68)155.68
2Cradle LS1 (142.74)298.42
3Cradle LS2 (147.27)445.69
4Cradle LS3 (151.68)597.37
5Cradle LS4 (156.12)753.49
6Whiffletree Tier 1 (112.09)865.58
7Whiffletree Tier 2 (135.67)1001.25
8Whiffletree Tier 3 (148.94)1150.19
9222.411372.60
10444.821591.54
11667.231837.85
12889.642036.66
131112.052269.45
Table 3. Concentrated loading profile for wing flexural rigidity calculation.
Load StepLoad Increment (N)Total Applied Load (N)
1Cradle LS4 + Channel Section183.82
2Container (8.87)192.69
346.62239.32
446.62285.94
544.40330.34
644.40374.74
744.40419.14
848.84467.98
Table 4. Wing out-of-plane load calculation for the 467.98-N concentrated load.
Location (m)Strain (10−6)c (mm)EI (N·m2)Moment (N·m)Shear (N)Load (N)Applied Load (N)Difference (%)
0.13−498.2649.73245,325.242158475.570.000.000.00
1.03−439.4848.44167,054.171731475.570.000.000.00
1.93−543.2246.51106,469.511303475.570.000.000.00
2.82−506.3543.4763,571.24875.4457.570.000.000.00
3.72−361.3538.3838,359.38447.8475.570.000.000.00
4.62−2.0729.8030,833.9220.18475.57−475.57−467.981.62
Table 5. Concentrated loads: Comparison of applied load and FGB-based calculated out-of-plane load.
Applied Load (N)Calculated Load (N)Difference (%)
−192.70−195.001.19
−239.32−242.111.18
−285.94−290.821.71
−330.34−336.261.79
−374.74−381.171.72
−419.14−428.552.25
−467.98−475.571.62
Table 6. Measured and calculated tip deflection for distributed load case.
Load (N)Measured Tip Deflection (m)Calculated Tip Deflection (m)Difference (%)
1373−0.184−0.1783.02
1592−0.209−0.2052.29
1837−0.241−0.2314.08
2036−0.265−0.2573.23
2269−0.295−0.2843.75
Table 7. Wing distributed loads: Comparison of applied loads and calculated out-of-plane loads.
Applied Load (N)FBG-Based Loads (N)Difference (%)
137013551.1
158916413.2
183518591.3
203321164.1
226923644.2

