Article

Multiyear Rainfall and Temperature Trends in the Volta River Basin and their Potential Impact on Hydropower Generation in Ghana

1
Department of Energy and Environmental Engineering, University of Energy and Natural Resources, P. O. Box 214, Sunyani, Ghana
2
Department of Mechanical Engineering, University of Ibadan, Ibadan, Nigeria
3
School of Graduate Studies, University of Energy and Natural Resources, P. O. Box 214, Sunyani, Ghana
4
Department of Science, Technology, Engineering & Public Policy (STEaPP), University College London, London WC1E 6BT, UK
5
Office of the Pro-Vice Chancellor, University of Energy and Natural Resources, P. O. Box 214, Sunyani, Ghana
6
Earth Observation Research and Innovation Centre, University of Energy and Natural Resources, P. O. Box 214, Sunyani, Ghana
*
Author to whom correspondence should be addressed.
Climate 2016, 4(4), 49; https://doi.org/10.3390/cli4040049
Submission received: 2 May 2016 / Revised: 8 September 2016 / Accepted: 19 September 2016 / Published: 12 October 2016
(This article belongs to the Special Issue Impact of Climate Change on Water Resources)

Abstract

:
The effects of temperature and rainfall changes on hydropower generation in Ghana from 1960–2011 were examined to understand country-wide trends of climate variability. Moreover, the discharge and the water level trends for the Akosombo reservoir from 1965–2014 were examined using the Mann-Kendall test statistic to assess localised changes. The annual temperature trend was positive while rainfall showed both negative and positive trends in different parts of the country. However, these trends were not statistically significant in the study regions in 1960 to 2011. Rainfall was not evenly distributed throughout the years, with the highest rainfall recorded between 1960 and 1970 and the lowest rainfalls between 2000 and 2011. The Mann-Kendall test shows an upward trend for the discharge of the Akosombo reservoir and a downward trend for the water level. However, the discharge irregularities of the reservoir do not necessarily affect the energy generated from the Akosombo plant, but rather the regular low flow of water into the reservoir affected power generation. This is the major concern for the operations of the Akosombo hydropower plant for energy generation in Ghana.

1. Introduction

The demand for power as a result of population growth, rapid economic development, and urbanization has increased over the past decade in Africa. Hydropower remains the dominant source for the increasing electricity demand for the expanding industries and service sectors in the African continent. Until 1998, most of Ghana’s electricity was produced from two hydropower plants at Akosombo and Kpong. The recent commission of the third hydroelectric plant—Bui Power Authority—in 2013 is considered crucial for supplementing peak power requirements needed in the country. However, estimates suggest that Ghana has a resource potential of an additional 2000 MW of hydropower. About 1205 MW is expected to be produced from proven large hydro sources while the rest will come from medium to small scale plants. Climate change is one of the defining challenges to sustainable hydropower generation in Africa. Notwithstanding the existing challenges of climate variability, West Africa has great domestic hydropower energy potential, which could be harnessed to provide the much needed energy in an affordable and secure manner to support the socio-economic development of the region.
Climatic variability can be described as the annual difference in values of specific climatic variables within averaging periods (e.g., a 30-year period). These climatic variations have unexpected impacts on the frequency and intensity of precipitation and temperature distributions and patterns for many regions of the world. Spatial and temporal variations of precipitation and temperature may be influenced by changes in land cover [1,2], land use [3], and climate [4]. Also, the influences of large dams and human water use for food and energy production may have significant impacts on surrounding climate and precipitation patterns [5,6]. Hydropower generation is solely dependent on water and because evaporation dominates the water balance and governs the availability of water resources in arid and semi-arid areas [7,8], small changes in land use, precipitation, and temperature can lead to large changes in surface water flows [9] which in one way or another can affect the production of hydropower. The Intergovernmental Panel on Climate Change (IPCC) in its fifth assessment report (AR5) concluded that climate change is occurring faster than earlier reported [10]. Many future climate scenarios also point to the fact that the climate is changing rapidly globally [11].
Besides human changes to the water cycle by land and water uses (Jaramillo and Destouni, 2015) [12], temperature and precipitation are the essential components of weather systems that drive climate change effects and significantly affect the available water resources for hydropower generation. Therefore, it is very important to understand the impact of climate variability on hydropower generation in order to develop suitable mitigation measures since temperature and rainfall are highly variable spatially and temporarily at different local and regional scales. In this study, rainfall and temperature changes as recorded in 22 stations in Ghana are examined during the 1960–2011-time scale; additionally, the discharge and water level irregularities between 1965 and 2014 are also examined. The purpose of this paper is also to assess the potential impact of temperature and rainfall changes on hydropower generation.

2. Materials and Methods

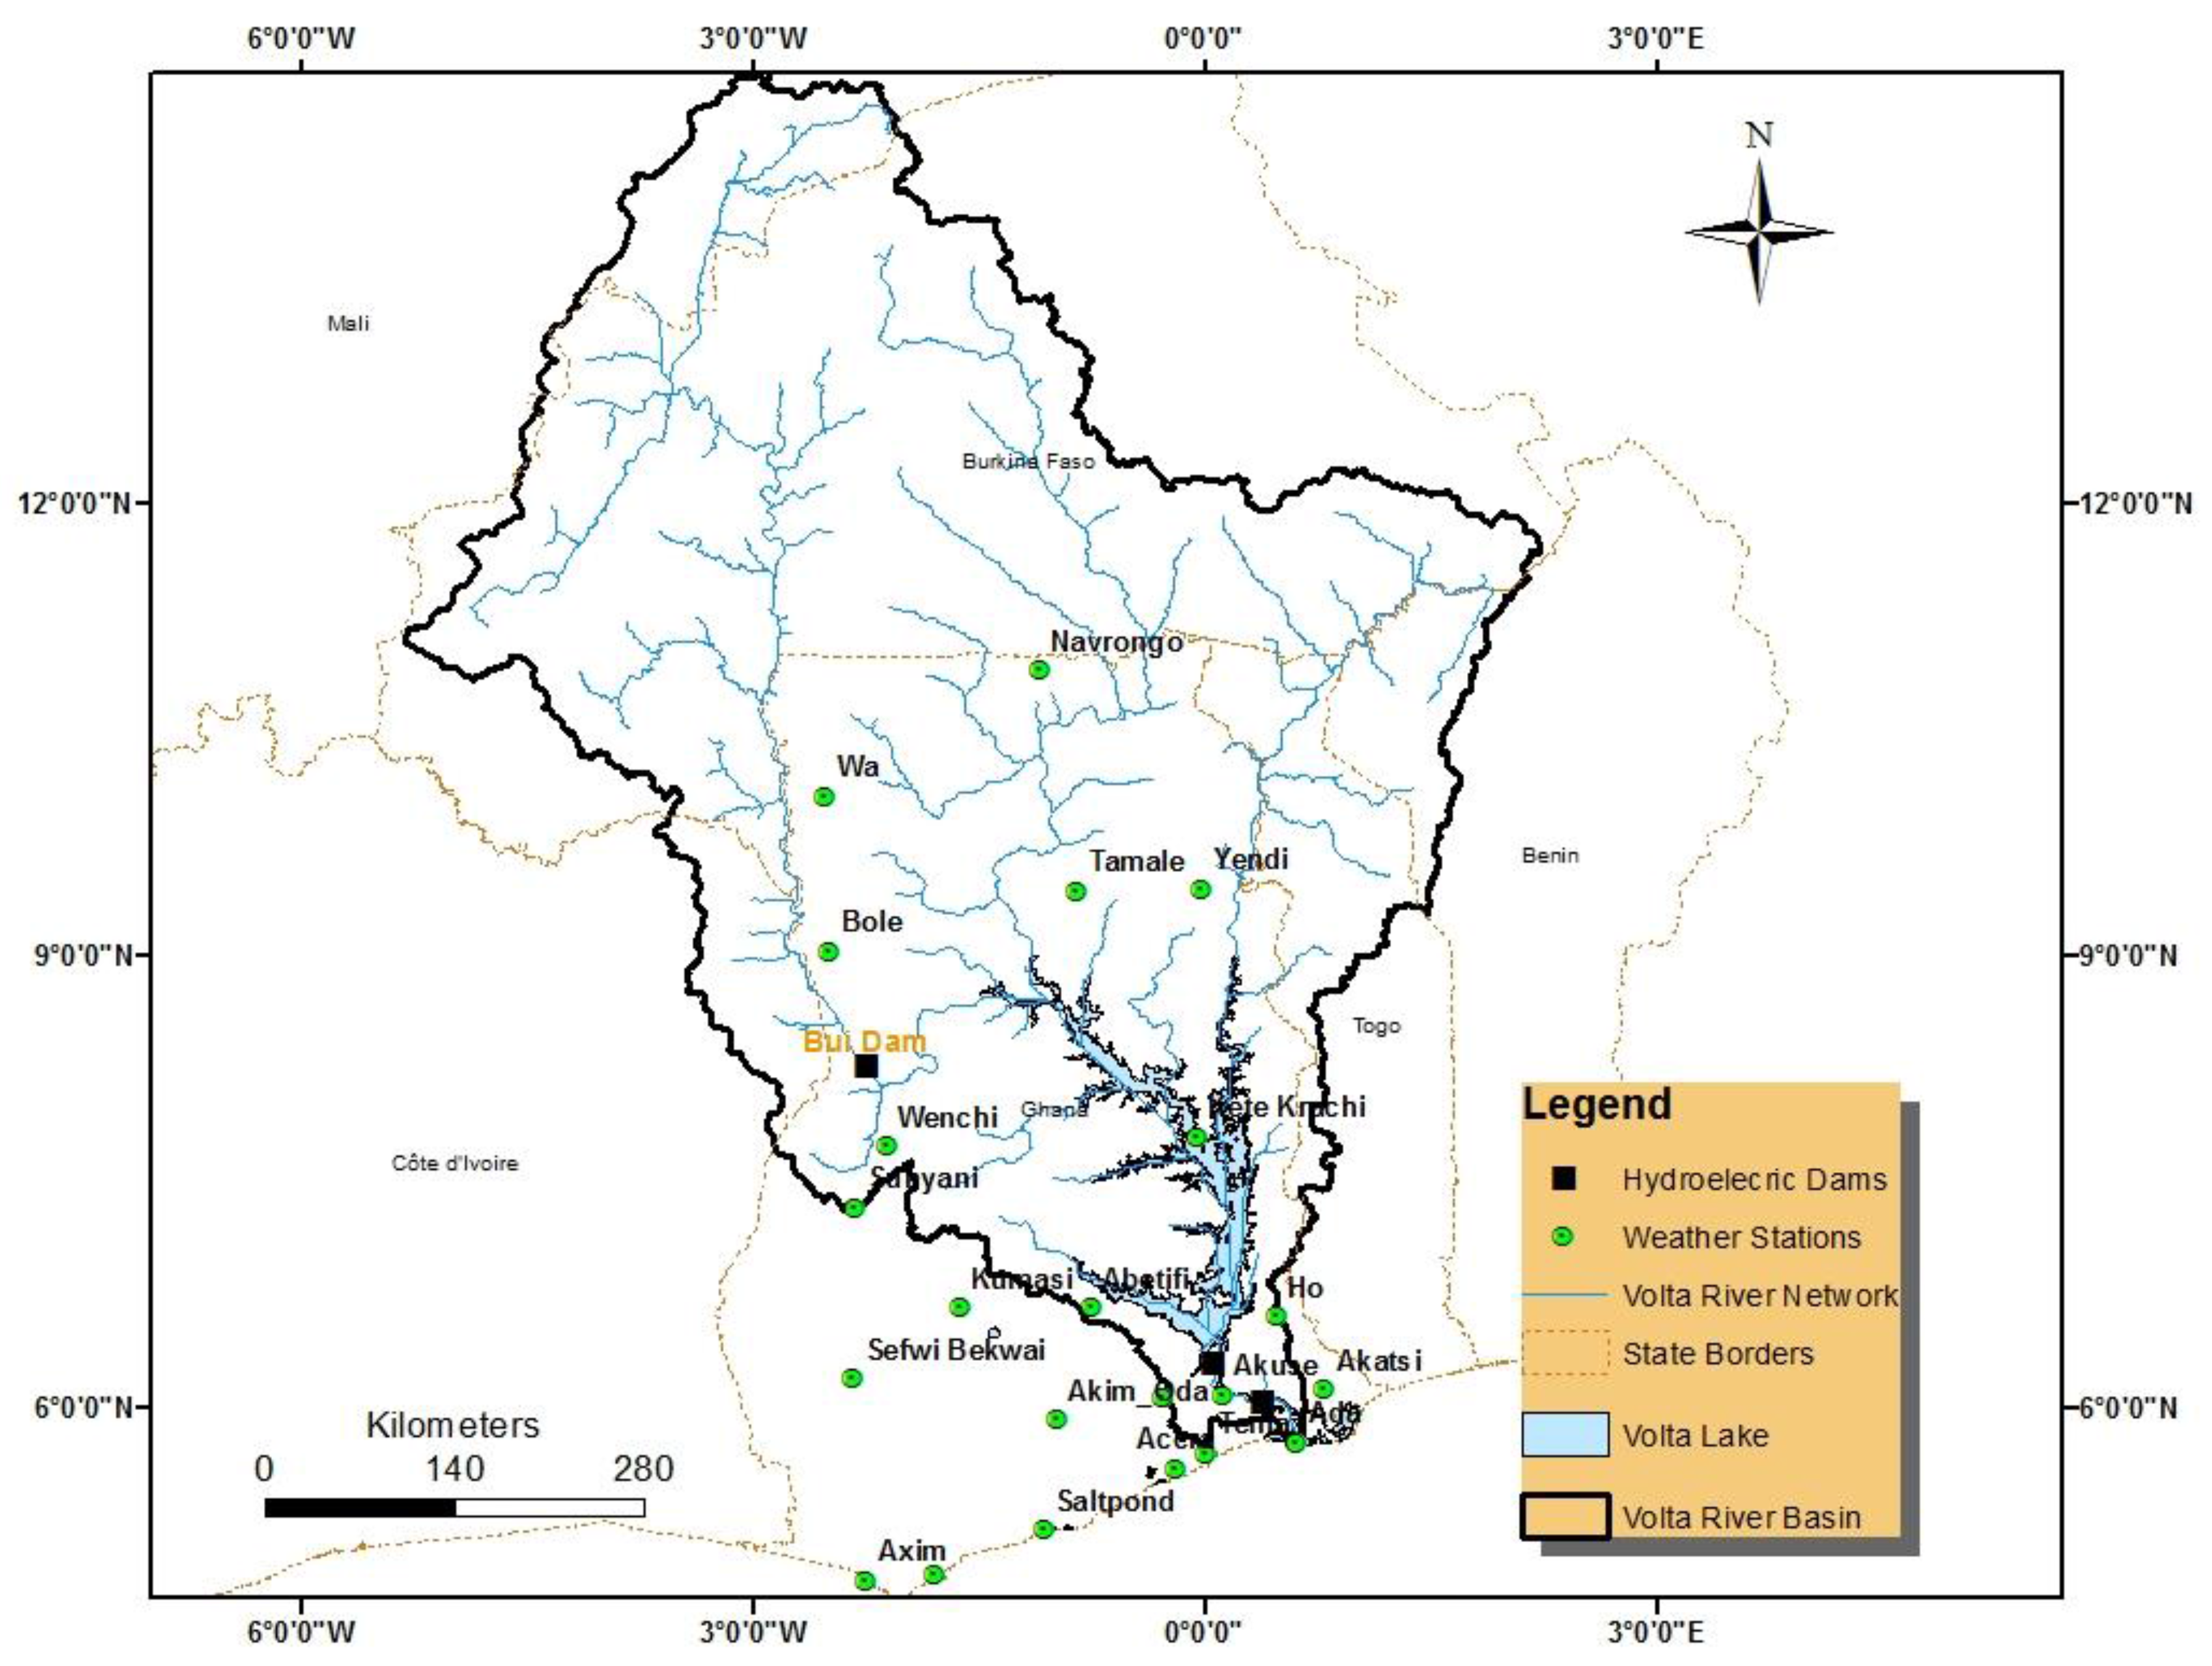
2.1. Data Collection

Figure 1 shows the locations of weather stations that provided measurements which were used in order to understand the climate variability of rainfall within the country. Rainfall and temperature data from the various stations across Ghana and their trend over a period from 1960 to 2011 were analyzed to assess the climate variability. The data for the annual Akosombo plant discharge irregularities and the water levels of the Akosombo dam from 1965–2014, as well as the Akosombo energy production data, were also collected from the Volta River Authority (VRA). The runoff data from 1936–1984 was obtained from [13].

2.2. Data Quality Control

The serially complete dataset was created using the normal ratio method. The method has been originally used by [14]. Since then, the method has been widely used to reconstitute the climatological missing data [15,16]. The method is applied by estimating the missing climate data PA at station A as a function of the normal monthly or annual data of the station under question and those of the neighboring stations for the period of missing data at the station under question.
P A = i = 1 n NR A NR i * P i n
where Pi is the data at surrounding stations, NRA is the normal monthly or seasonal data at station A, NRi is the normal monthly or seasonal data at station i, and n is the number of surrounding stations whose data are used for estimation. The missing data percentages of the stations considered in the study are reported in Table 1.

2.3. Mann-Kendall Test

In this study, the annual rainfall and temperature data for the 22 stations were obtained from the Ghana Meteorological Agency (GMA). The trend test of these stations was performed using the Mann Kendall (MK) non-parametric test to determine the significance of the observed trends. The Mann-Kendall test is a statistical test widely used for the analysis of trends in climatologic and hydrologic time series [17]. One advantage of this test is that the data need not conform to any particular distribution. The second advantage of the test is its low sensitivity to abrupt breaks due to non-homogeneous time series [18]. The Mann-Kendall test is applicable in cases when the data values xi of a time series can be assumed to obey the model:
x i = f ( t i ) + ε i
where f(t) is a continuous monotonic increasing or decreasing function of time and the residuals ε i can be assumed to be from the same distribution with zero mean value. It is therefore assumed that the variance of the distribution is constant in time. In this test, the null hypothesis of no trend (i.e., H0) has been assumed. The observations (xi) are randomly ordered in time, against the alternative hypothesis, H1, where there is an increasing or decreasing monotonic trend. In this test, the number of annual values in the studied data series is denoted by ‘n’. If ‘n’ is at least 10, the normal approximation test is used. However, if the data values are less than 10, the Mann-Kendall test statistic S is calculated using the formula
S = k = 1 n 1 j = k + 1 n   sgn ( x j x k )
where xj and xk are the annual values in years j and k, j > k, respectively, and
sgn ( x j x k ) = { 1 0 1 if   x j x k > 0 if   x j x k = 0 if   x j x k < 0
If n is 9 or less, the absolute value of S is compared directly to the theoretical distribution of S derived by Mann and Kendall. The two-tailed test is used for four different significance levels α: 0.1, 0.05, 0.01, and 0.001. At a certain probability level H0 is rejected in favour of H1 if the absolute value of S equals or exceeds a specified value Sa/2, where Sa/2 is the smallest S which has the probability less than α/2 to appear in case of no trend. A positive value of S indicates an upward trend whereas a negative value indicates a downward trend. The significance level 0.001 means that there is a 0.1% probability that the values xi are from a random distribution and with that probability we make a mistake when rejecting the H0 of there not being a trend. However, if there are several tied values (i.e., equal values) in the time series, it may reduce the validity of the normal approximation when the number of data values is close to 10. First, the variance (S) is computed by the following equation which takes into account that ties may be present.
VAR ( S ) = 1 18 [ n ( n 1 ) ( 2 n + 5 ) p = 1 q ( t p 1 ) ( 2 t p + 5 ) ]
Here q is the number of tied groups and tp is the number of data values in the pth group. The values of S and VAR(S) are used to compute the test statistics Z as follows:
Z = { S 1 Var ( S ) 0   S + 1 Var ( s ) if   S > 0 if   S = 0 if   S < 0
The presence of a statistically significant trend is evaluated using the Z value and here the statistic Z has a normal distribution. Significance level α is used for testing either an upward or downward monotone trend (a two-tailed test). If Z appears greater than Zα/2 where α depicts the significance level, then the trend is considered to be significant. The value for Zα/2 is obtained from the standard normal cumulative distribution tables for the significance levels (α) 0.001, 0.01, 0.05, and 0.1 [19].

2.4. Sen’s Slope Estimator

Theil-Sen’s slope estimator (Qmed) results from consideration of all possible combinations of data pairs within the whole data set [20]. A positive value of Qmed indicates an “upward trend” (increasing values with time), while a negative value of Q indicates a “downward trend” [21]. If a linear trend is present in a time series, then the true slope (change per unit time) can be estimated by using a simple non-parametric procedure developed by [22]. This means that linear model f(t) can be described as:
f ( t ) = Qt + B
where Q is the slope and Bis a constant. To derive an estimate of the slope Q, the slopes of all data pairs are calculated as:
Q i = x j x k j k   ,   i = 1 , 2 , , N ,   j > k
If there are n values xj in the time series, we get as many as N = n ( n 1 ) / 2 slope estimates Qi. The Sen’s estimator of slope is the median of these N values of Qi. The N values of Qi are ranked from the smallest to the largest and the Sen’s estimator is
Q = { Q N + 1 2 ( Q N 2 + Q N + 2 2 ) if   N   is   odd if   N   is   even
A 100 ( 1 α ) % two-sided confidence interval about the slope estimate is obtained by the non-parametric technique based on the normal distribution. The method is valid for n as small as 10 unless there are many ties [23]. At first we compute
C a = Z 1 α 2 VAR ( S )
where Z 1 α 2 is obtained from the standard normal distribution and VAR(S) has been defined in Equation (5). Next M 1 = ( N C a ) / 2 and M 2 = ( N + C a ) / 2 are computed. The lower and upper limits of the confidence interval, Qmin and Qmax, are the M1th largest and the (M2 + 1)th largest of the N ordered slope estimates Qi. If M1 and/or M2 are not whole numbers, the respective limits are interpolated. To obtain an estimate of B the n values of differences xi − Qti are calculated. The median of these values gives an estimate of B [24]. The estimates for the constant B of lines of the 99% and 95% confidence intervals are calculated by a similar procedure.

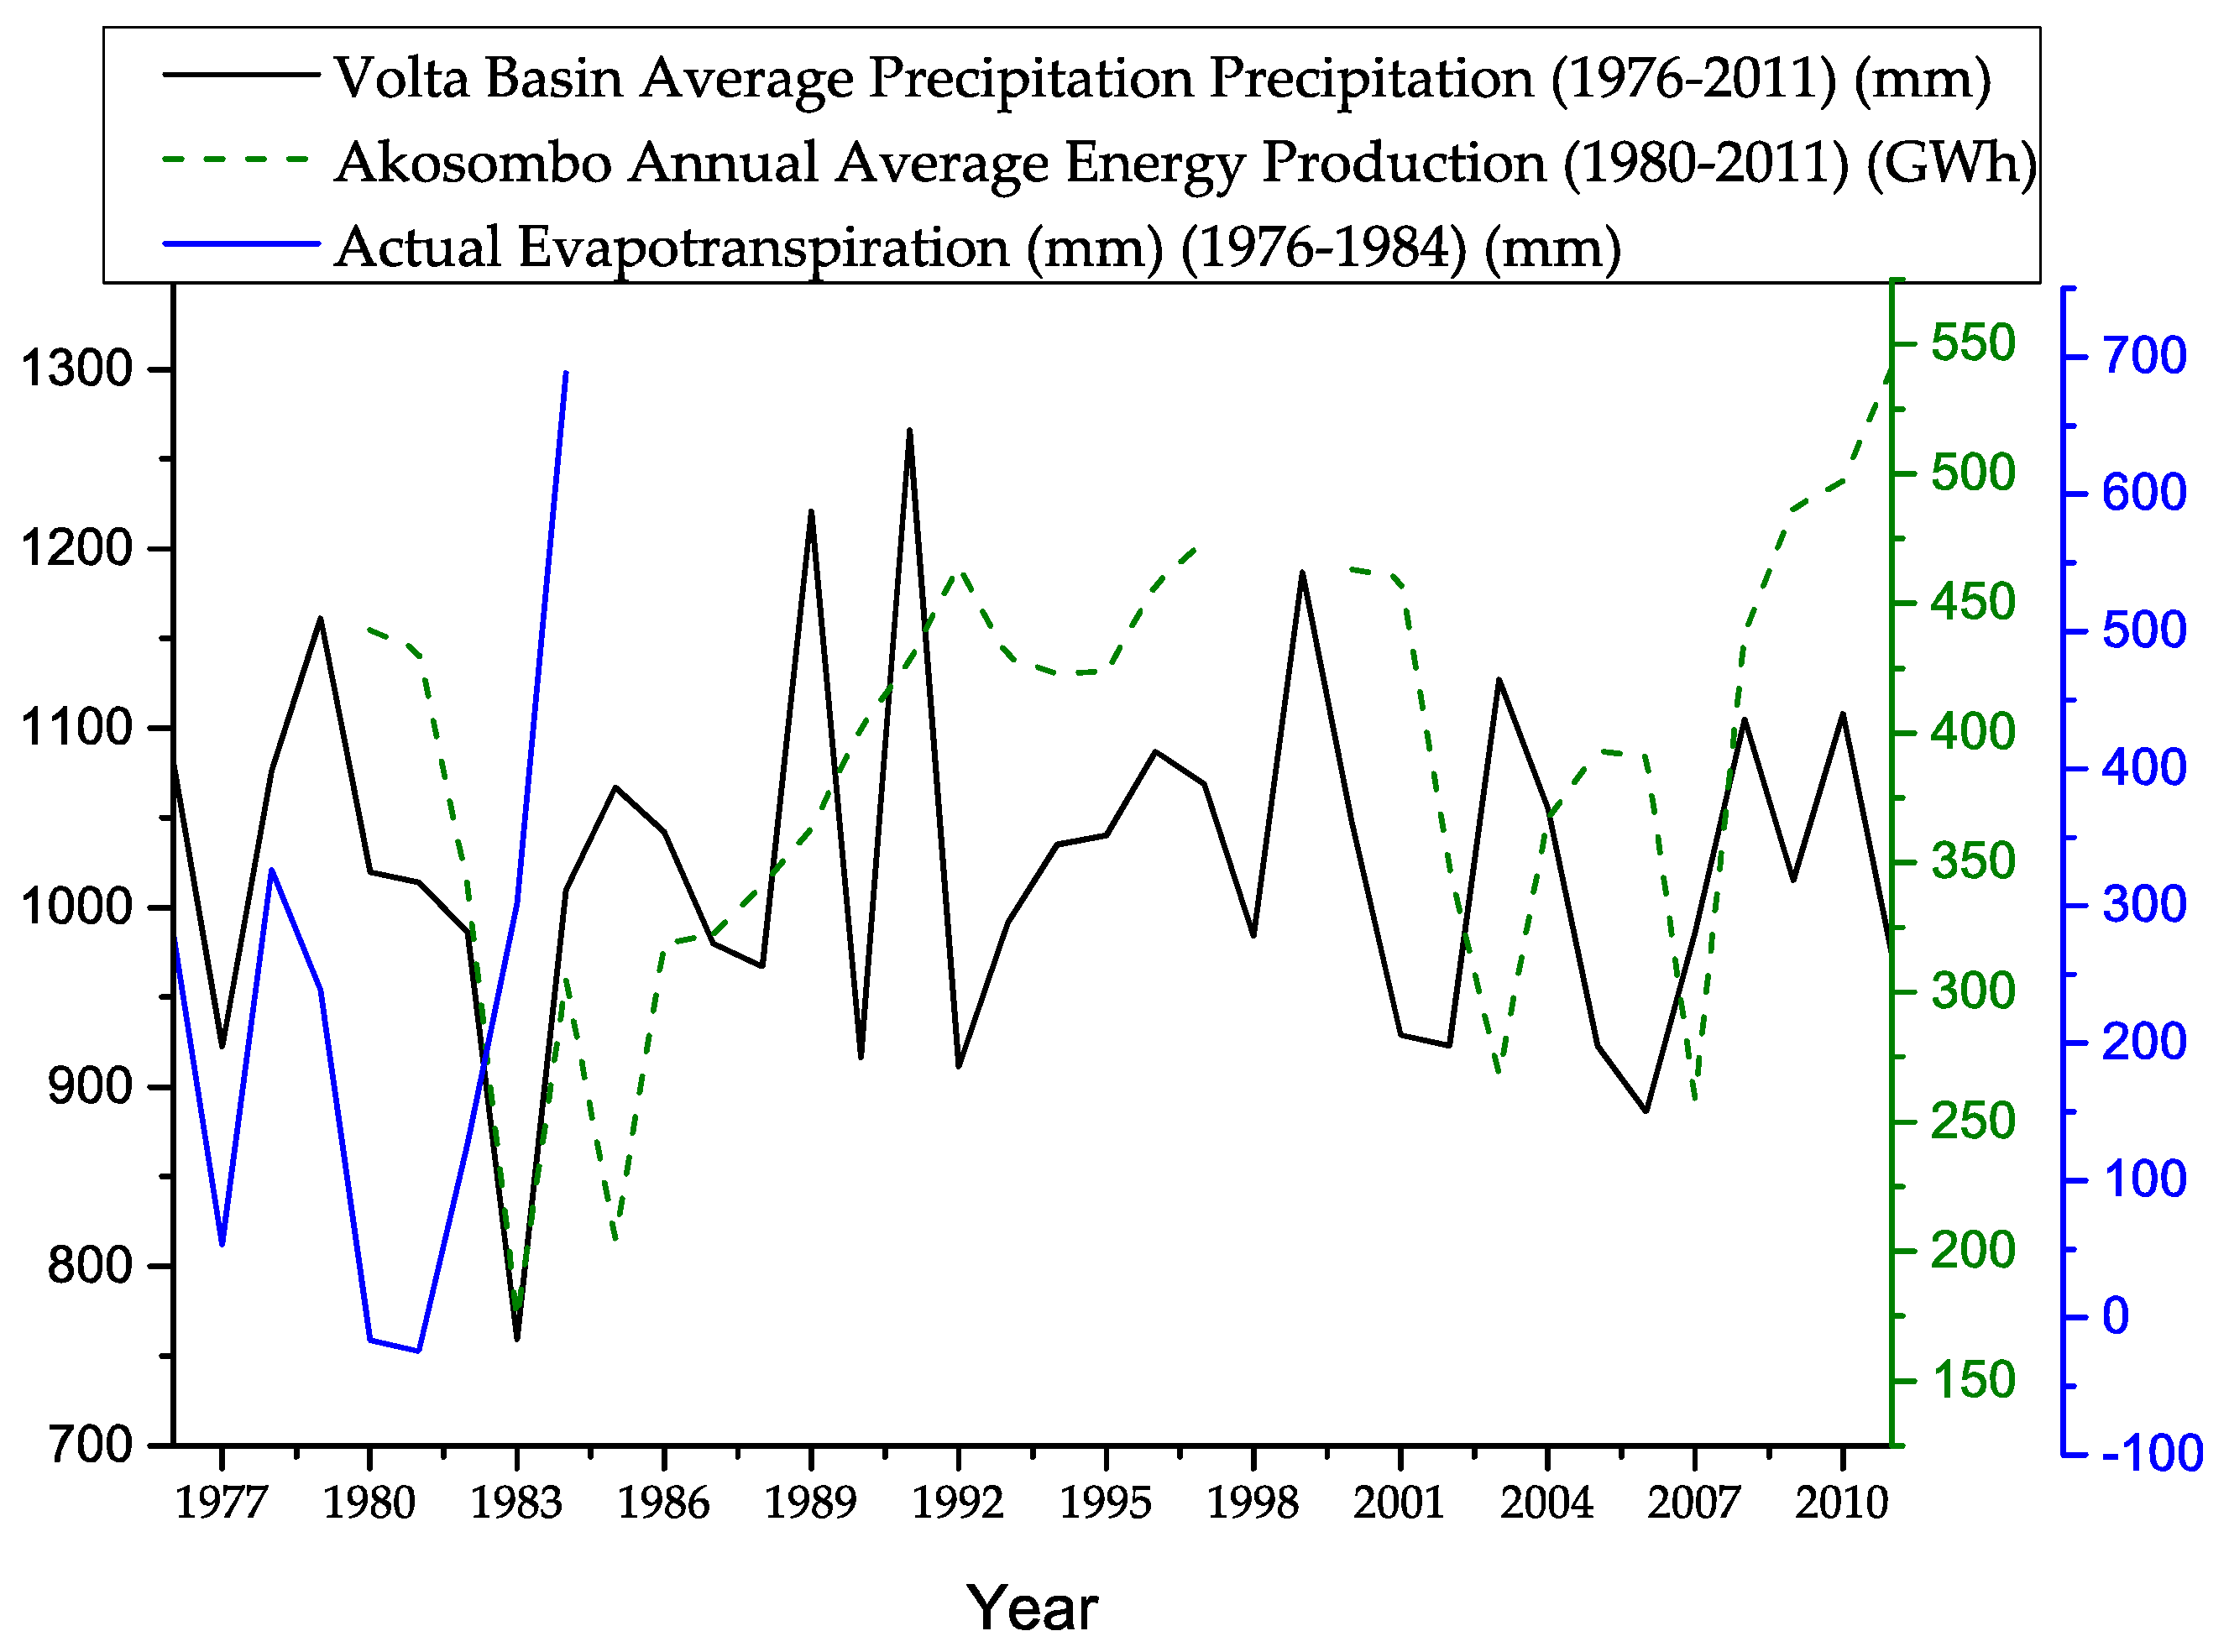
2.5. Volta Basin Average Precipitation, Temperature, and Actual Evapotranspiration (AET)

For the spatial consideration of rainfall, the Thiessen method [25] was used to estimate the average value representative of the Volta Basin. The Inverse Distance Weighting (IDW) approach was considered for mapping the spatial distribution of the annual average precipitation, and minimum and maximum temperature. The Actual Evapotranspiration (AET) was estimated based on the Equation (11) as
AET = P R Δ S
With P: precipitation, R: runoff, and ΔS: change in water storage (ΔS). However, for long term average estimate, Δ S   0 on the hydrological basin scale [5,26]. The study of AET is important since it determines how much water will stay in the reservoir. If AET is higher than expected, then evaporation will occur at the surface of the reservoir and will therefore reduce the volume of water in the reservoir. This is why it is important to know the trend in AET or AET/P.

3. Results and Discussions

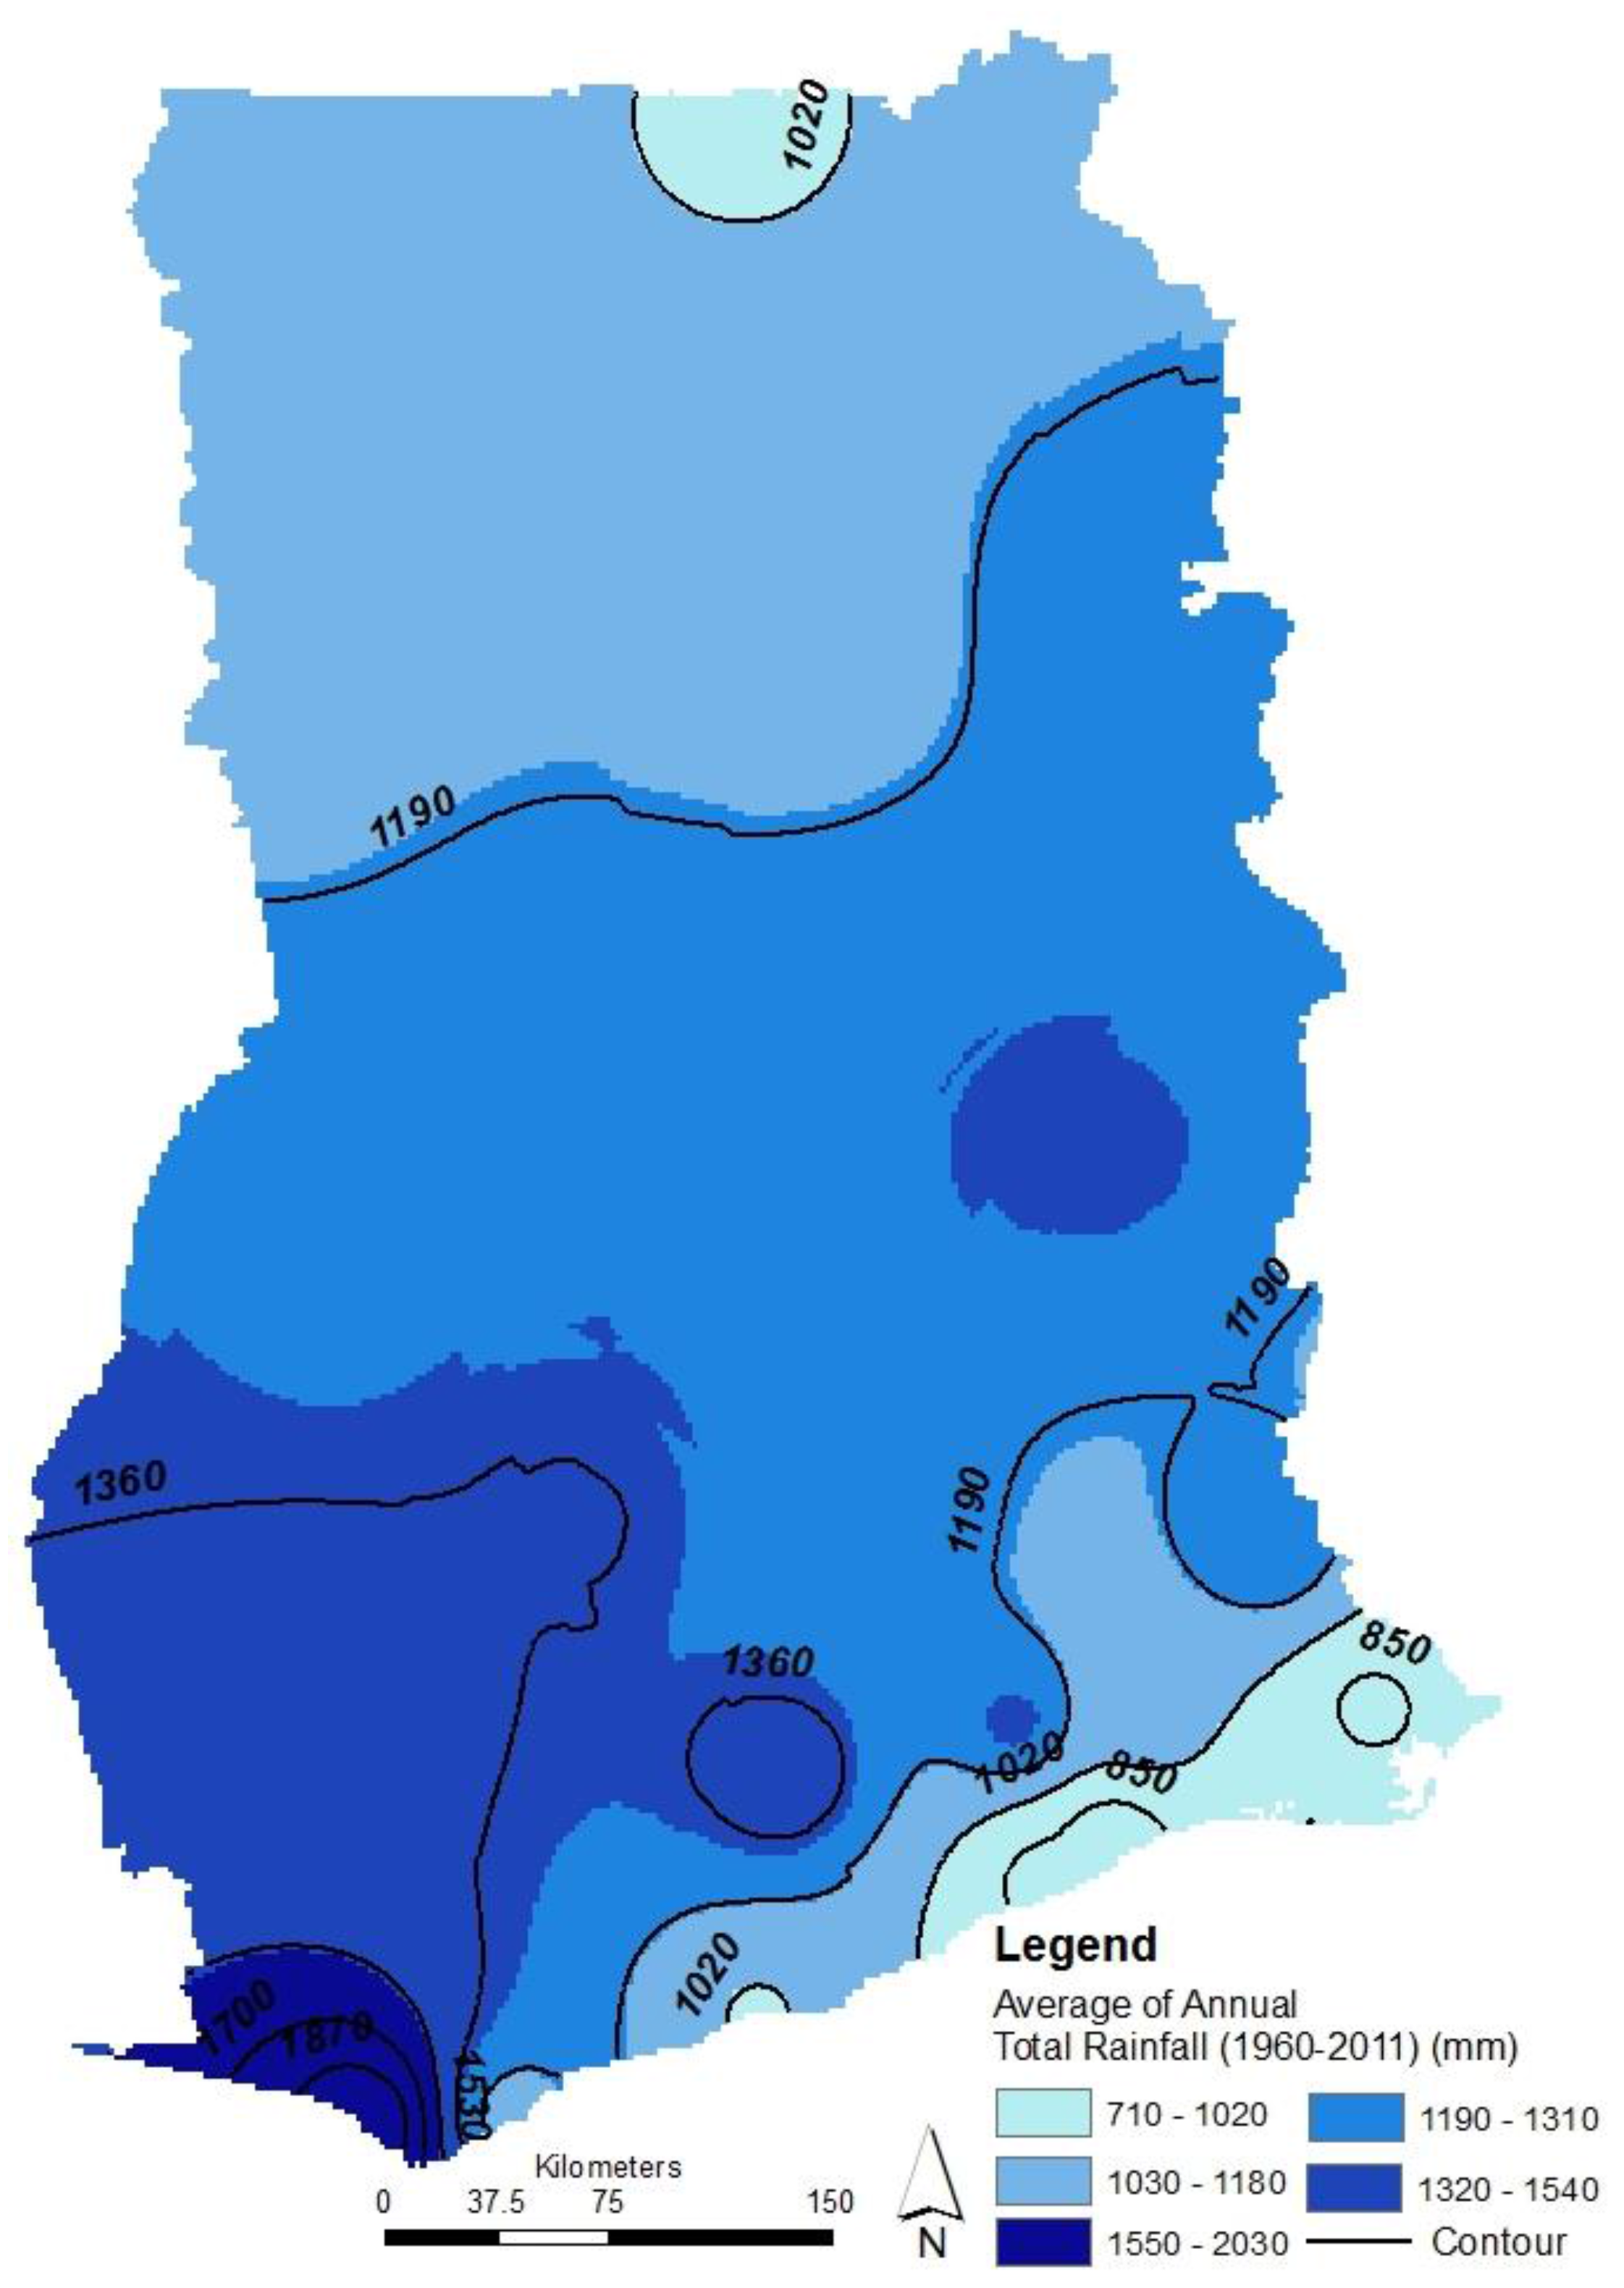
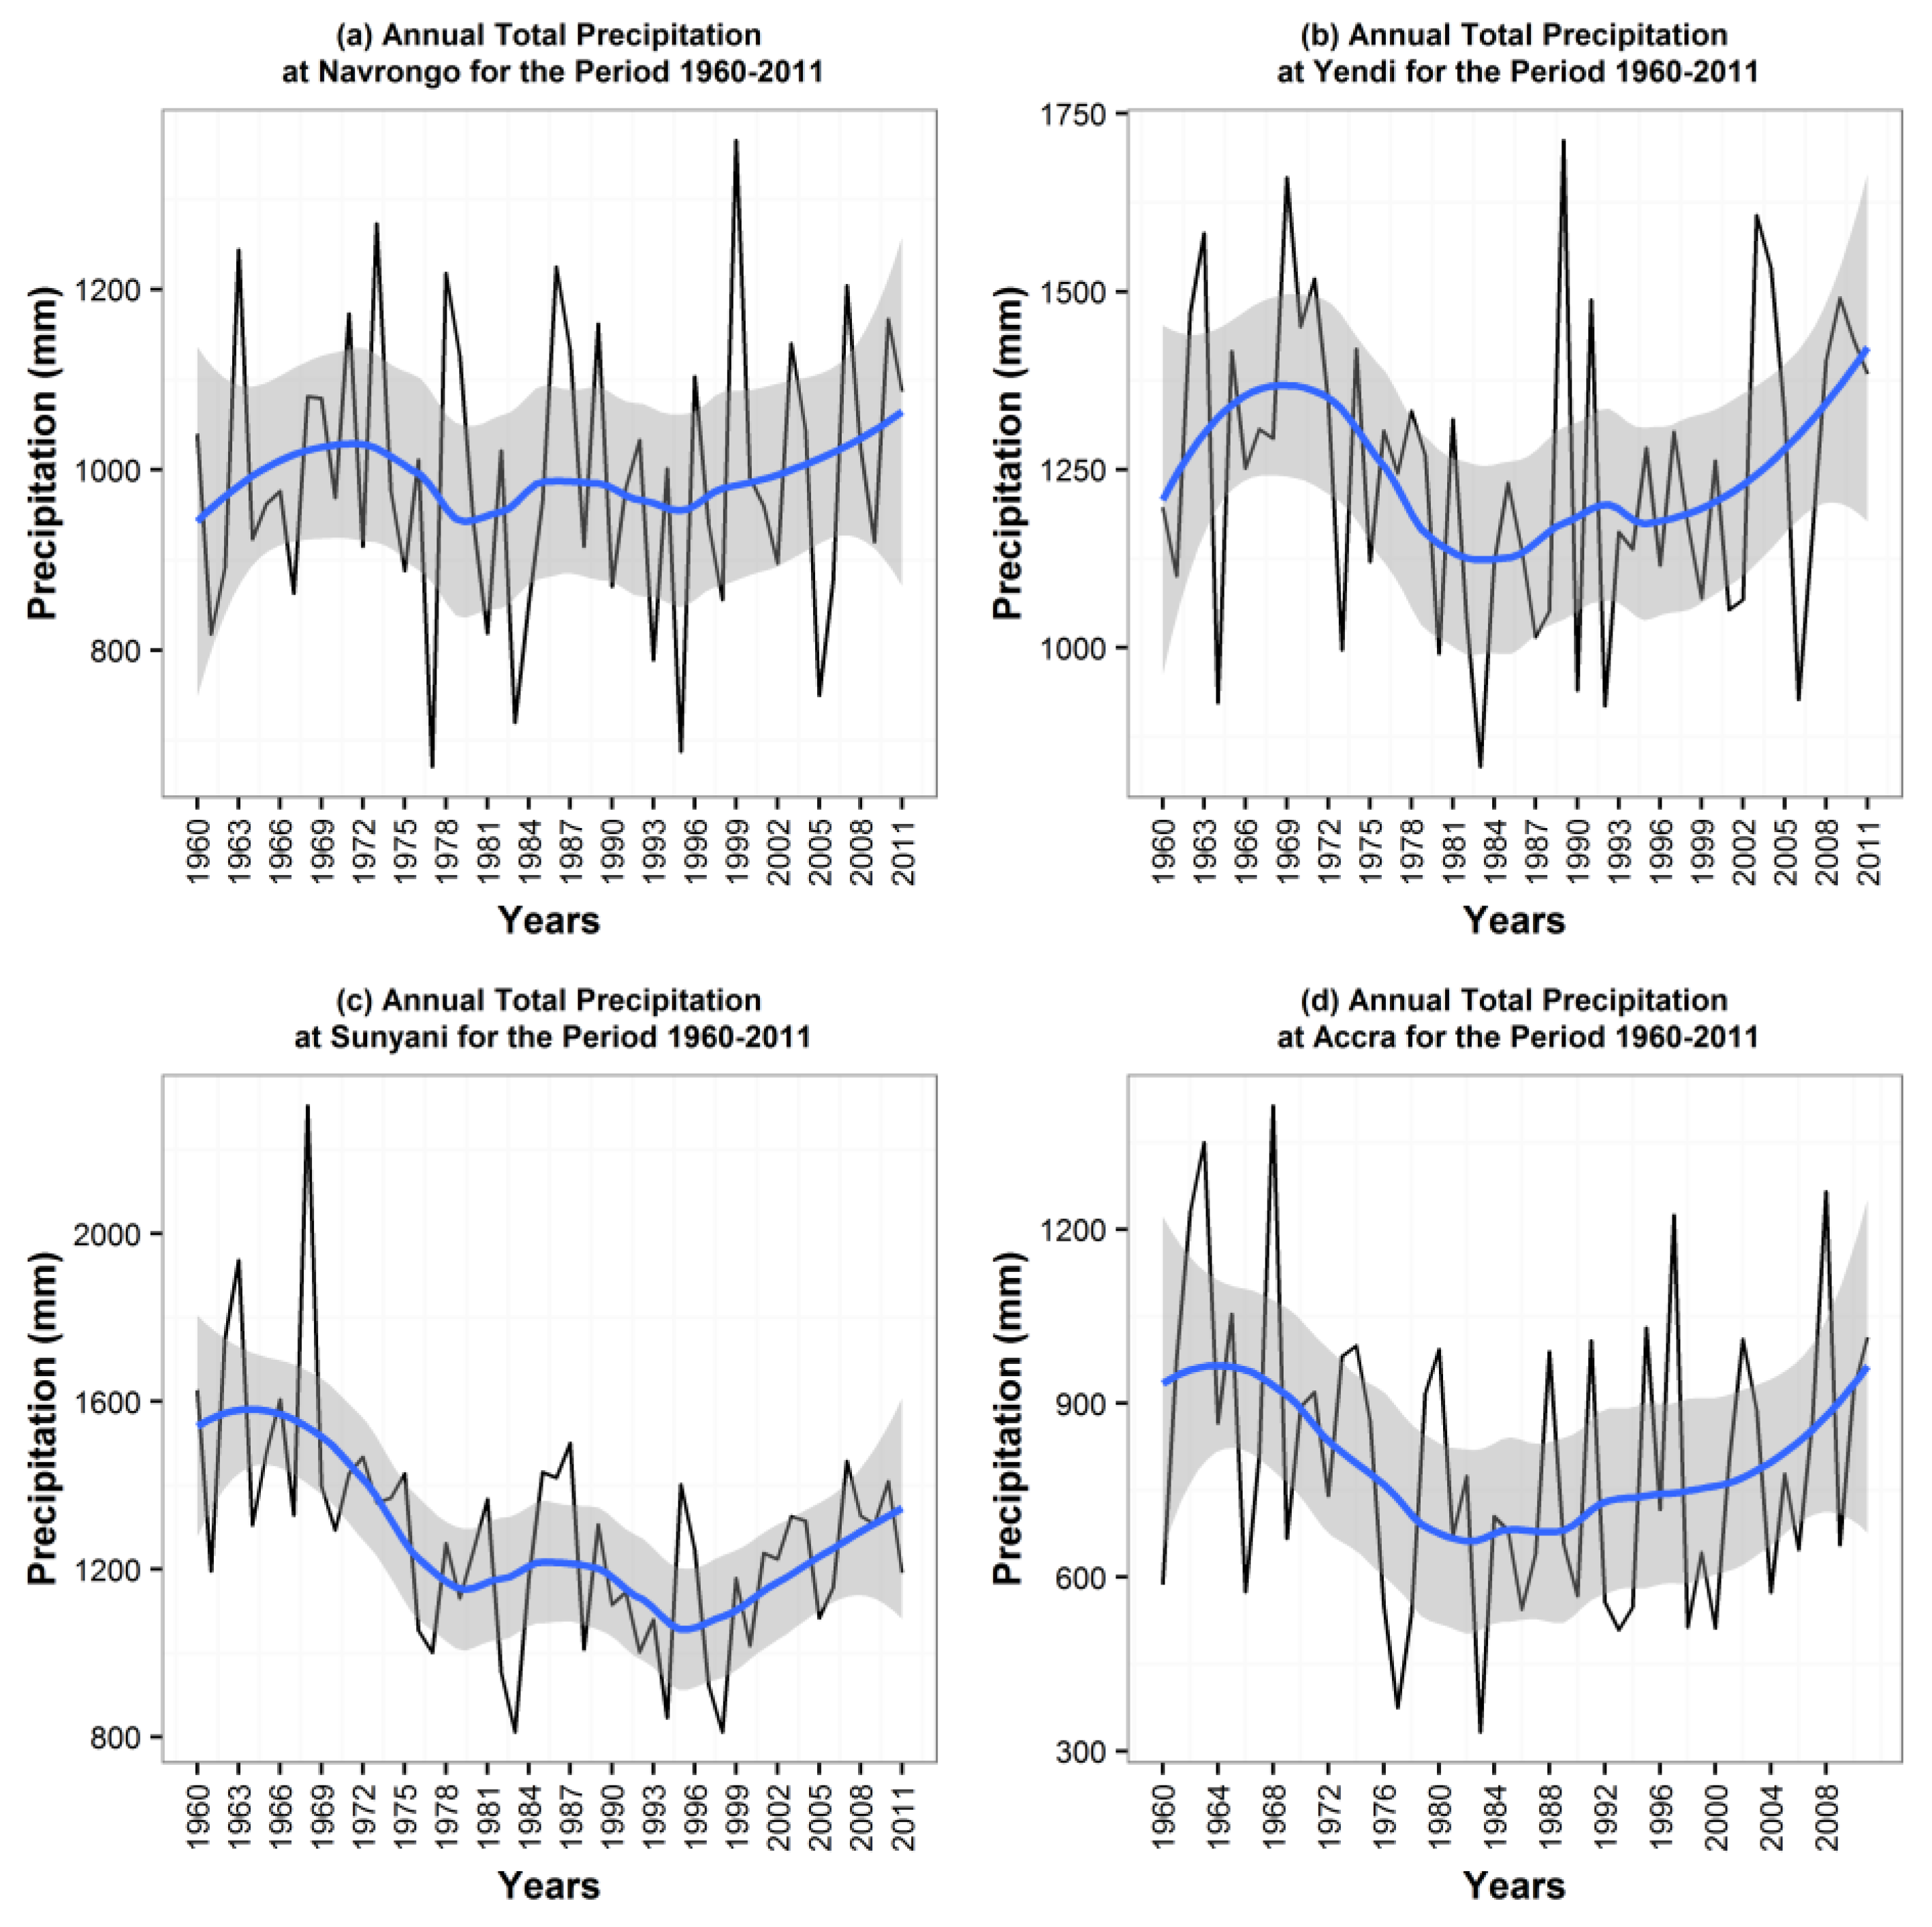
3.1. Rainfall Variability in Ghana (1960–2010)

The results from the study show that the highest annual rainfall recorded for all the 22 stations between 1960 and 2011 was 4000 mm. Such a rainfall was recorded in Kumasi, Kete Krachi, and Bole. However, Kumasi and Bole showed a downward trend, but not statistically significant while Kete Krachi showed no trend (Table 2). The lowest rainfall recorded was 200 mm at the Accra and Tema stations. The annual data for all the stations indicate that the highest rainfall (4000 mm) was recorded between 1960 and 1970 with few isolated high rainfall distributions occurring at some years across the stations. There was, however, a decrease (i.e., 8%–56%) shown in rainfall pattern in the 22 stations between 1970 and 2011. The lowest and highest decrease in rainfall in three sites were recorded respectively in Wenchi and Tema. Also, there were considerable variations in the annual rainfall patterns in some situations or geographic locations. The lowest variation occurred between 1980 and 1990 for stations like Tema, Accra, and Ada.
Figure 2 shows the spatial distribution of annual precipitation from 1960 to 2011. The annual average precipitation in Ghana varies between 710 mm and 2030 mm. The Inverse Distance Weighting interpolation suggests that the highest precipitation occurs around the south-west part of the country (1550 mm–2030 mm) and the lowest precipitation (710 mm–1020 mm) occurs around the extreme south-west and extreme north of the country. The northern and some parts of the southern of Ghana experience average annual precipitation amounts of 1030 mm to 1180 mm while a large part of the central part of the country from west to east experiences average annual precipitation of 1190 mm to 1310 mm.
The trends and the slope estimations of the rainfall data show that most of the stations experienced decreasing annual rainfall amount. Figure 3 shows that 16 stations out of the 22 appearing in this study presented a decreasing trend and 5 out of 16 stations revealed an upward trend. Only the Kete Krachi statistical test showed no trend, although not all the trend tests were significant, Akuse (Zs = −2.943, Qmed = −5.967) and Sunyani (Zs = −2.723, Qmed = −6.167) were significant at the 99% confidence interval and Axim (Zs = −1728, Qmed = −7,744) was significant at the 90% confidence interval. Although the distribution in the basin is erratic, Figure 3 shows that most of the southern region of Ghana experienced a substantial decrease in annual in rainfall amount. In general, rainfall was not evenly distributed throughout the years in the stations studied. This has adverse effects on hydropower generation because the availability of water in the reservoir is the main lifeblood for energy generation. The erratic rainfall pattern in the country is directly affecting the electricity supply in Ghana. There were several reported cases between 2000 and 2011 of power rationing as a result of the low Akosombo dam levels [27,28]. Temporal variation of rainfall in four selected stations is depicted in Figure 4.
Figure 5 shows the potential evapotranspiration (PET) and the P/PET index of the Volta Basin with P the mean annual precipitation. The data was derived based on the Global Aridity and PET Database [29]. The PET represents the atmospheric water demand and aridity index (AI) expresses the precipitation availability over the atmospheric water demand. The long term average of PET and P/PET (1950–2000) gives an idea on the climatic conditions and the potential water losses in, around, and over the Volta Lake. The figure shows that the average PET over Volta Lake varies between 1339 mm/year and 1890 mm/year.

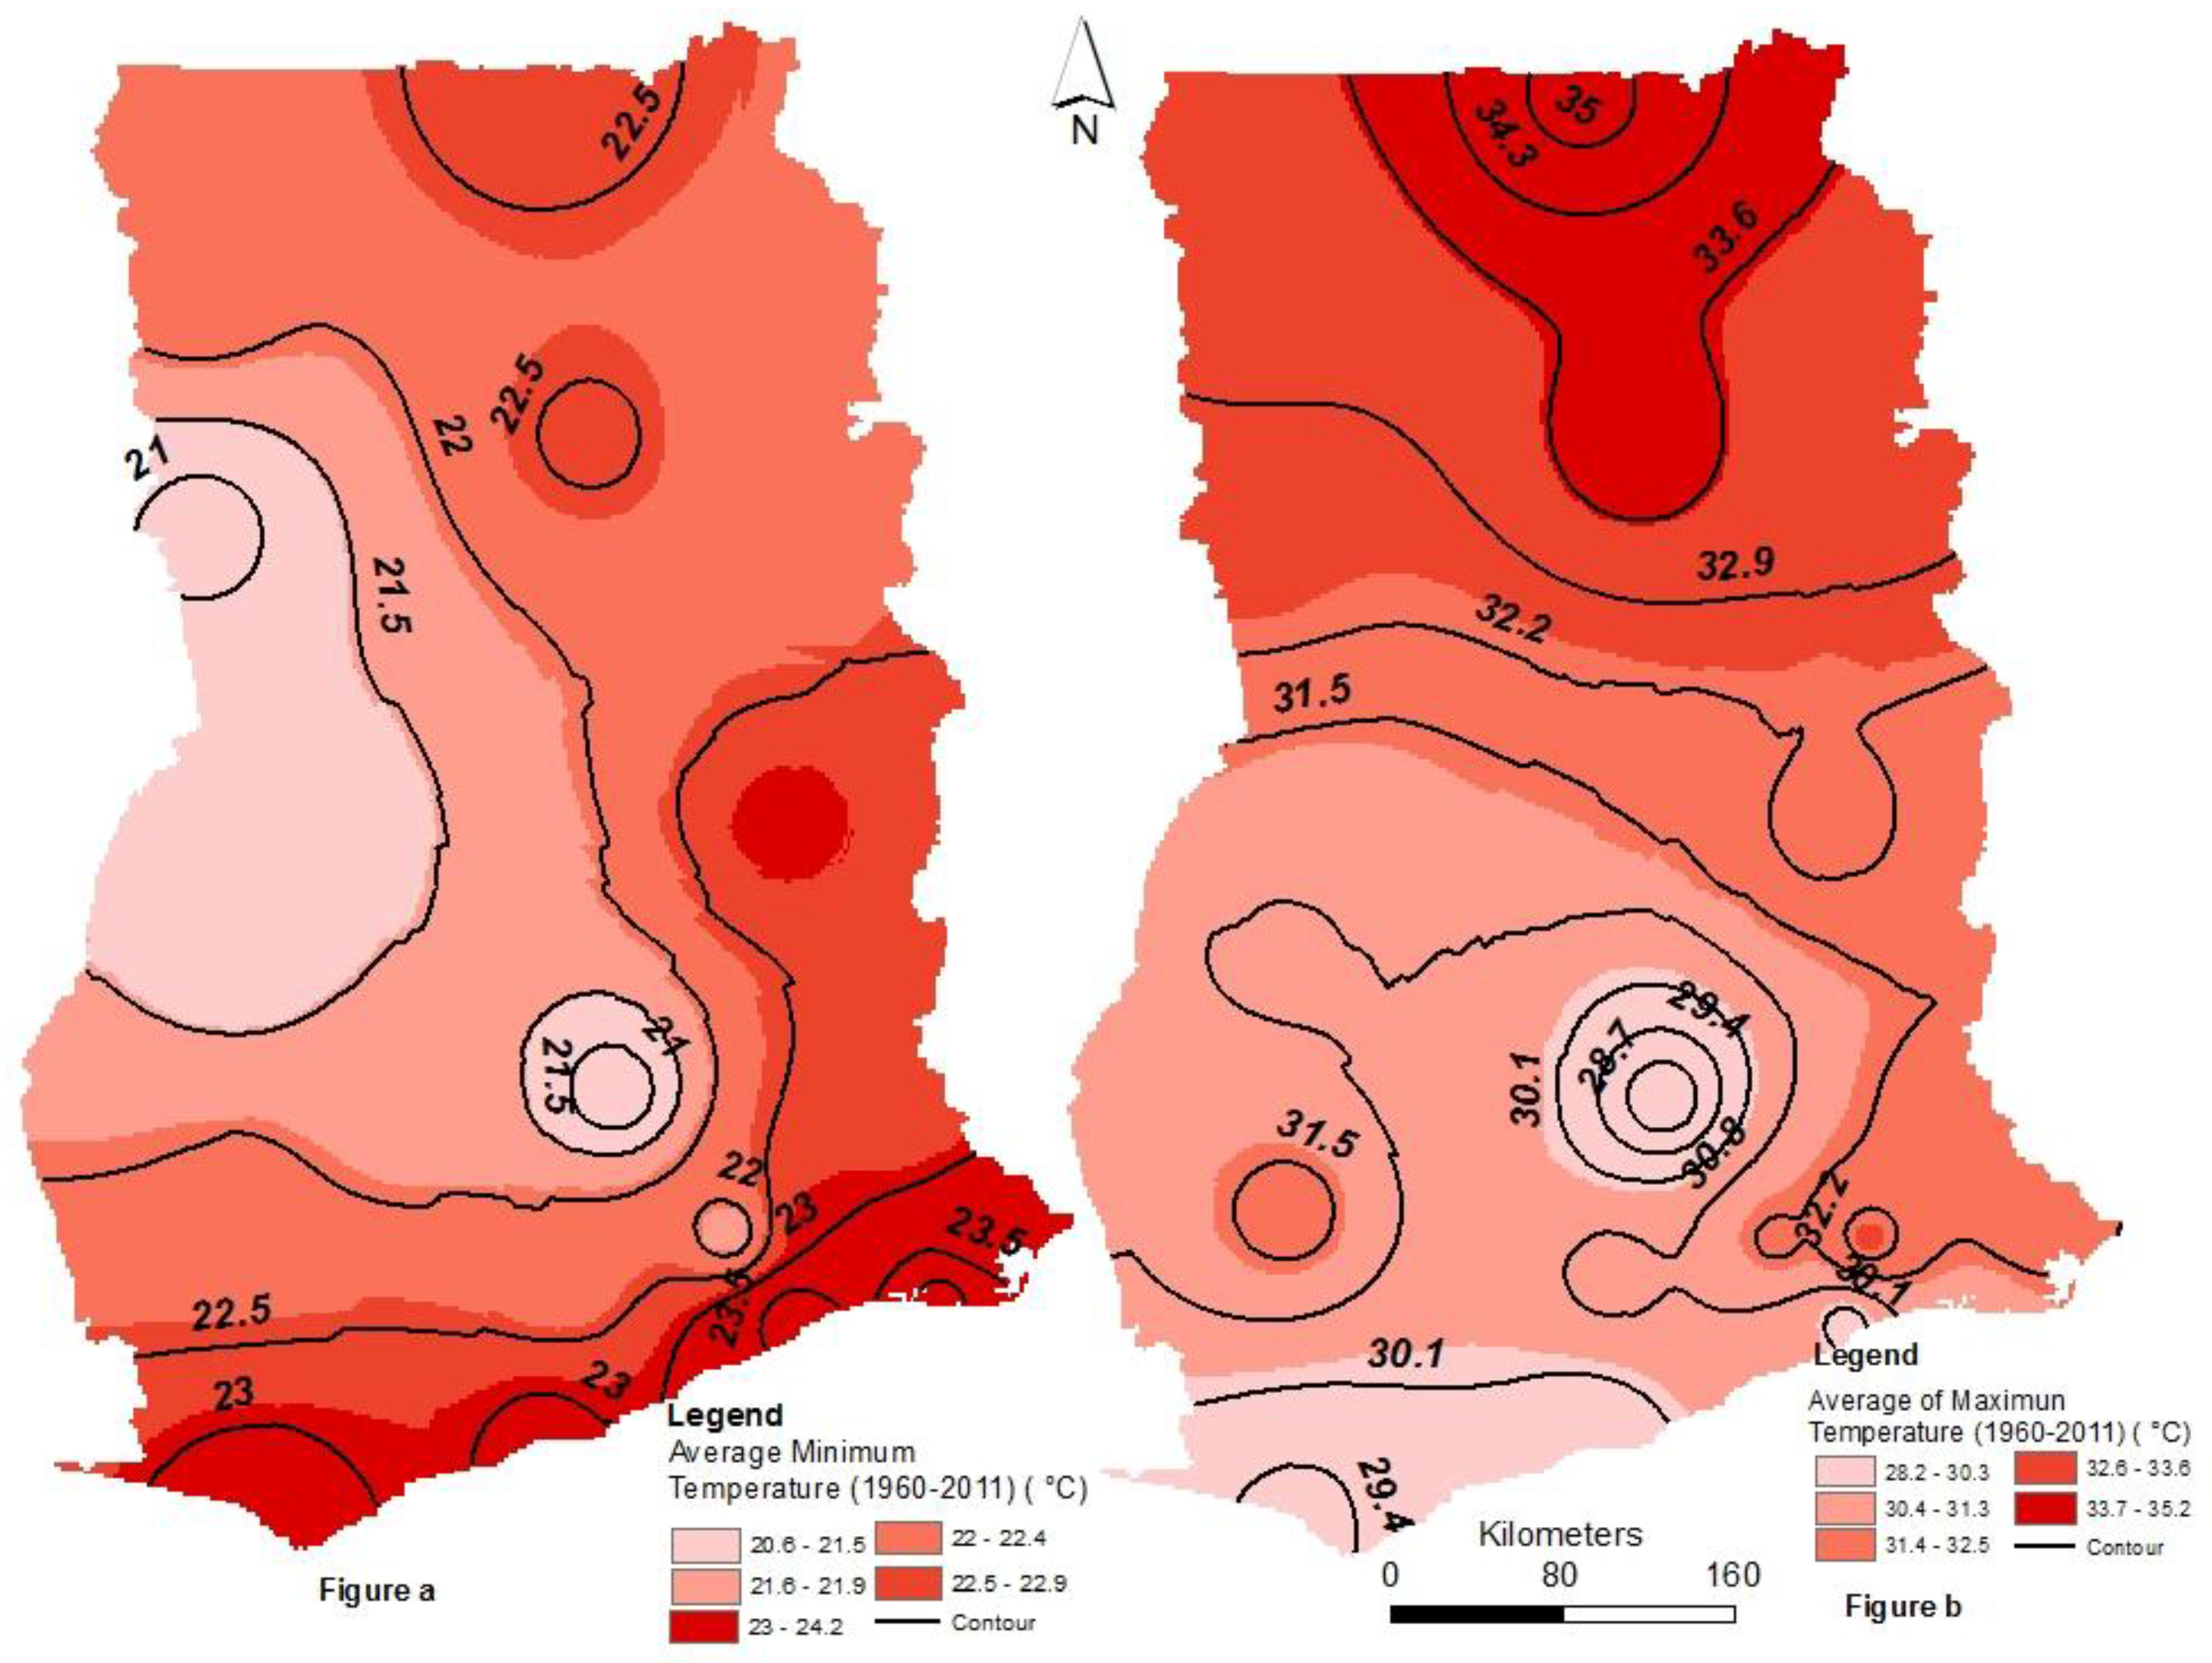
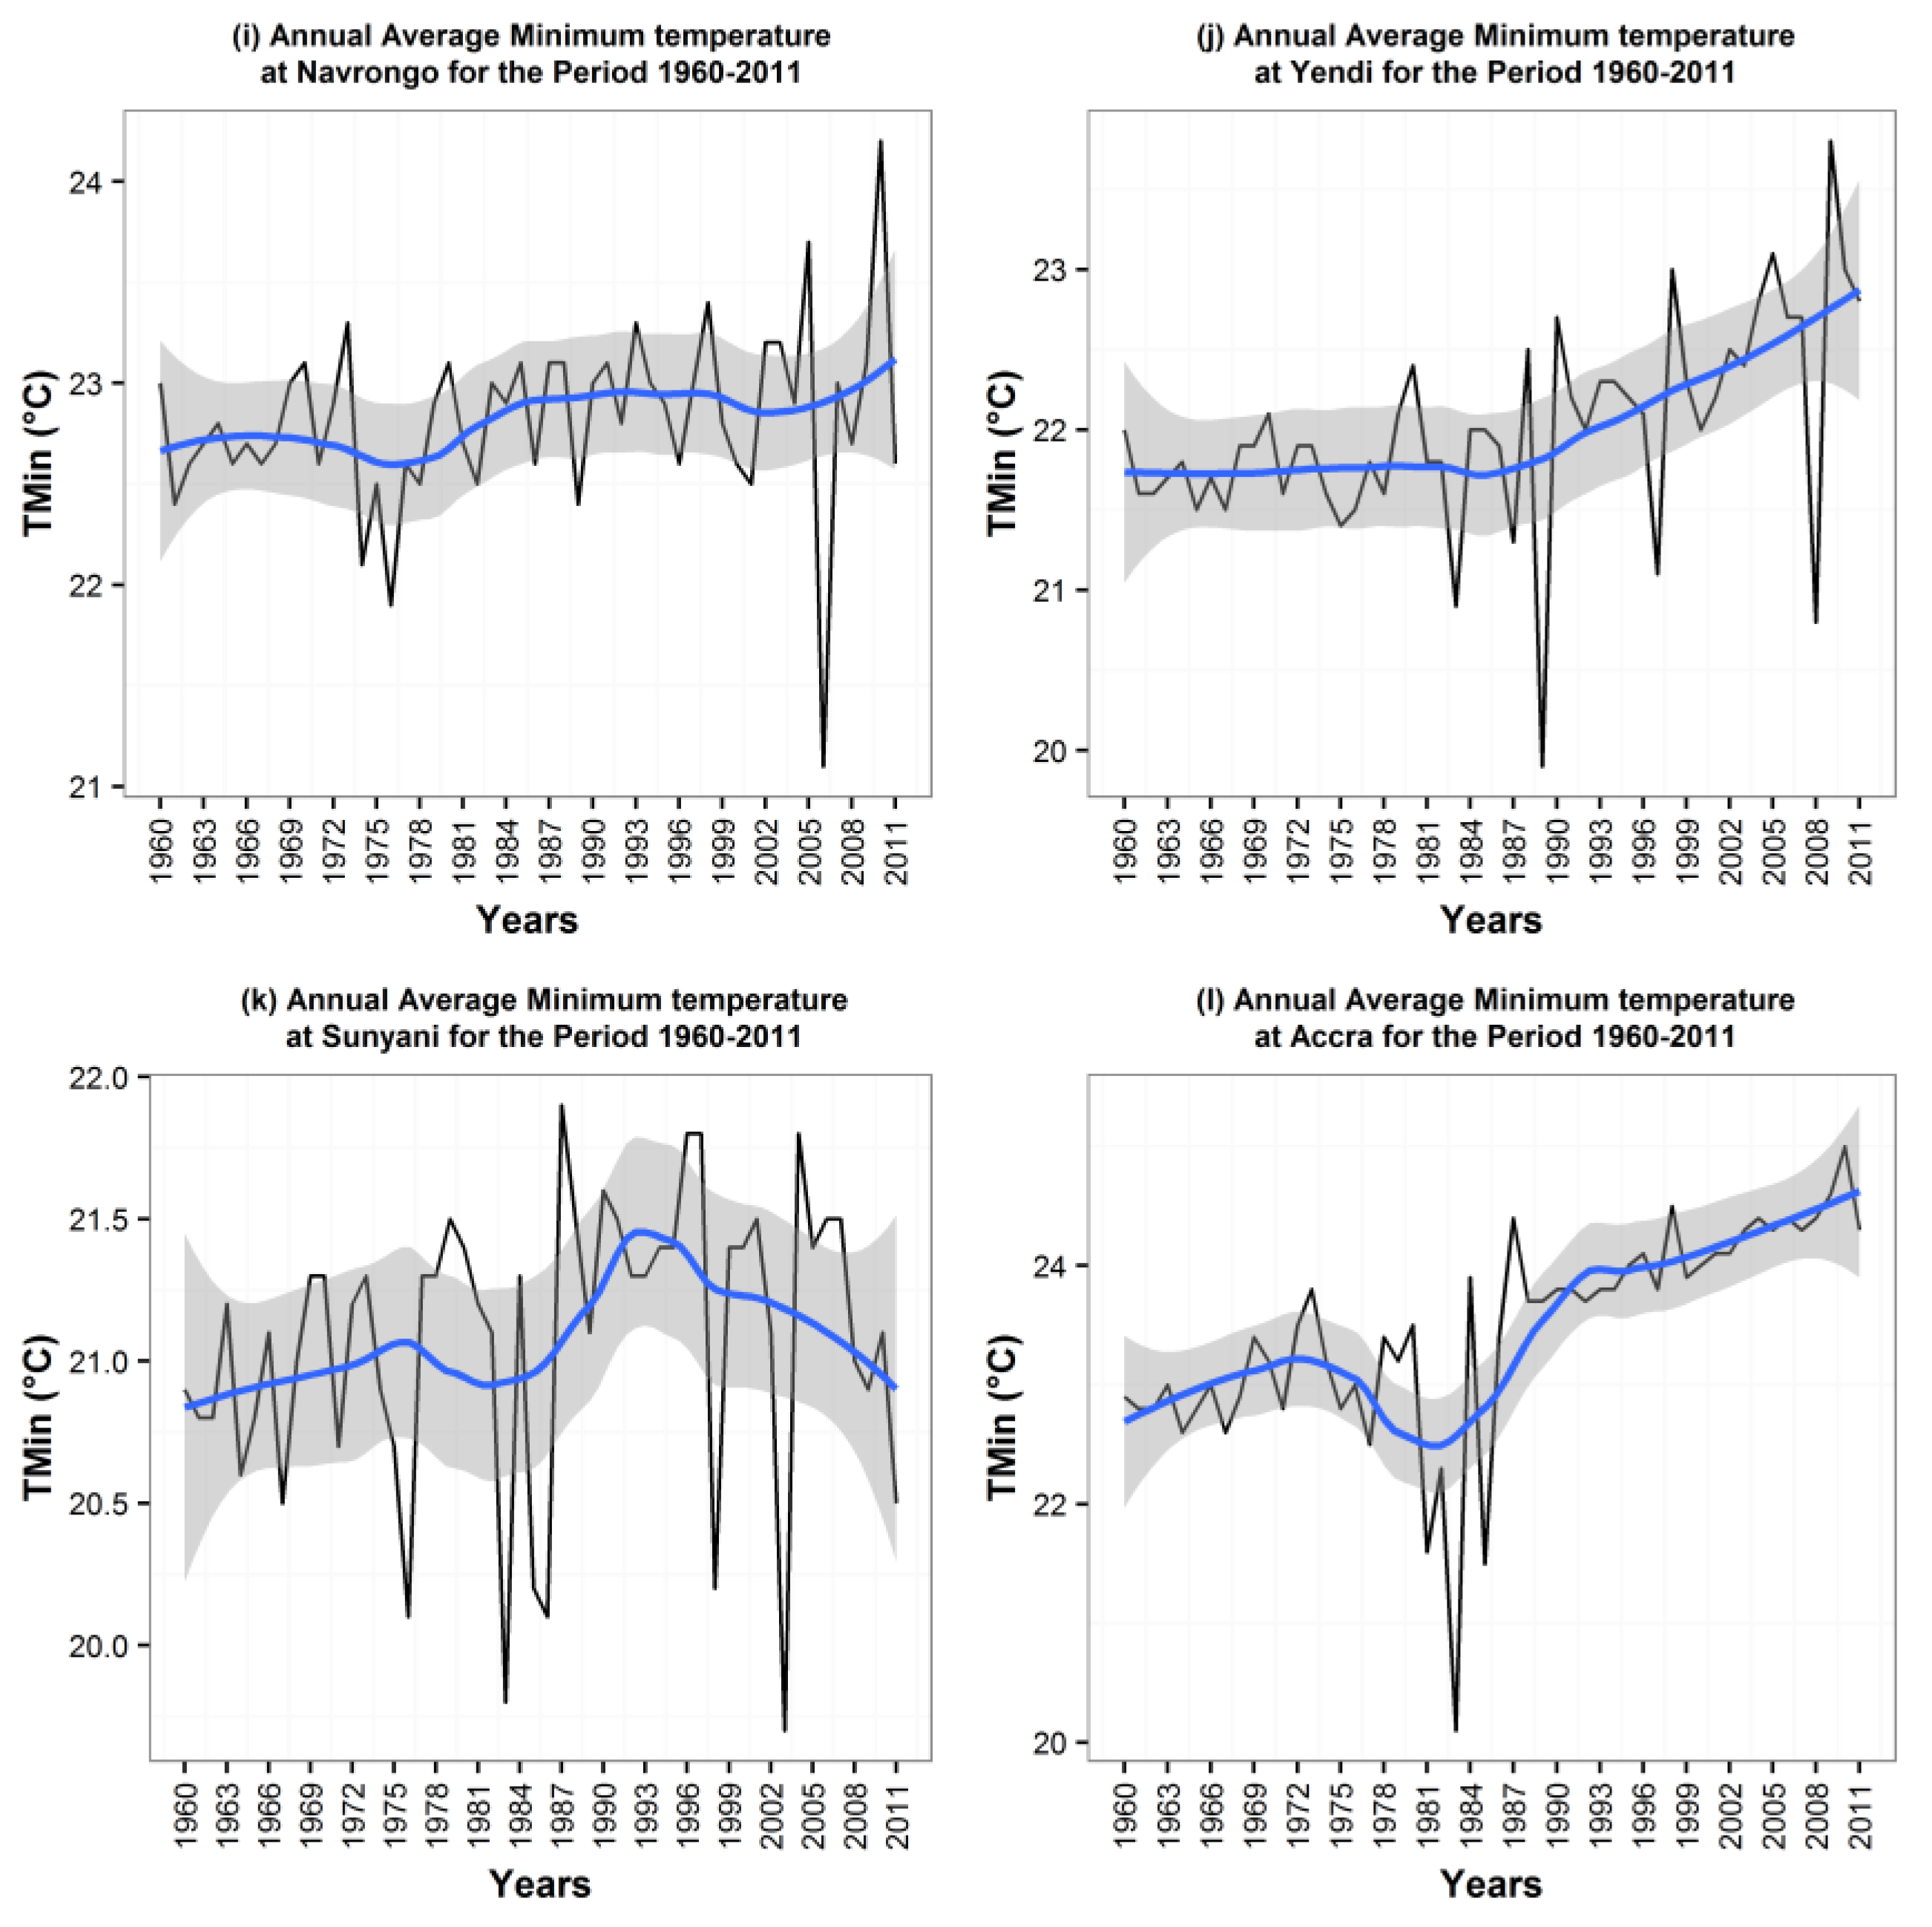
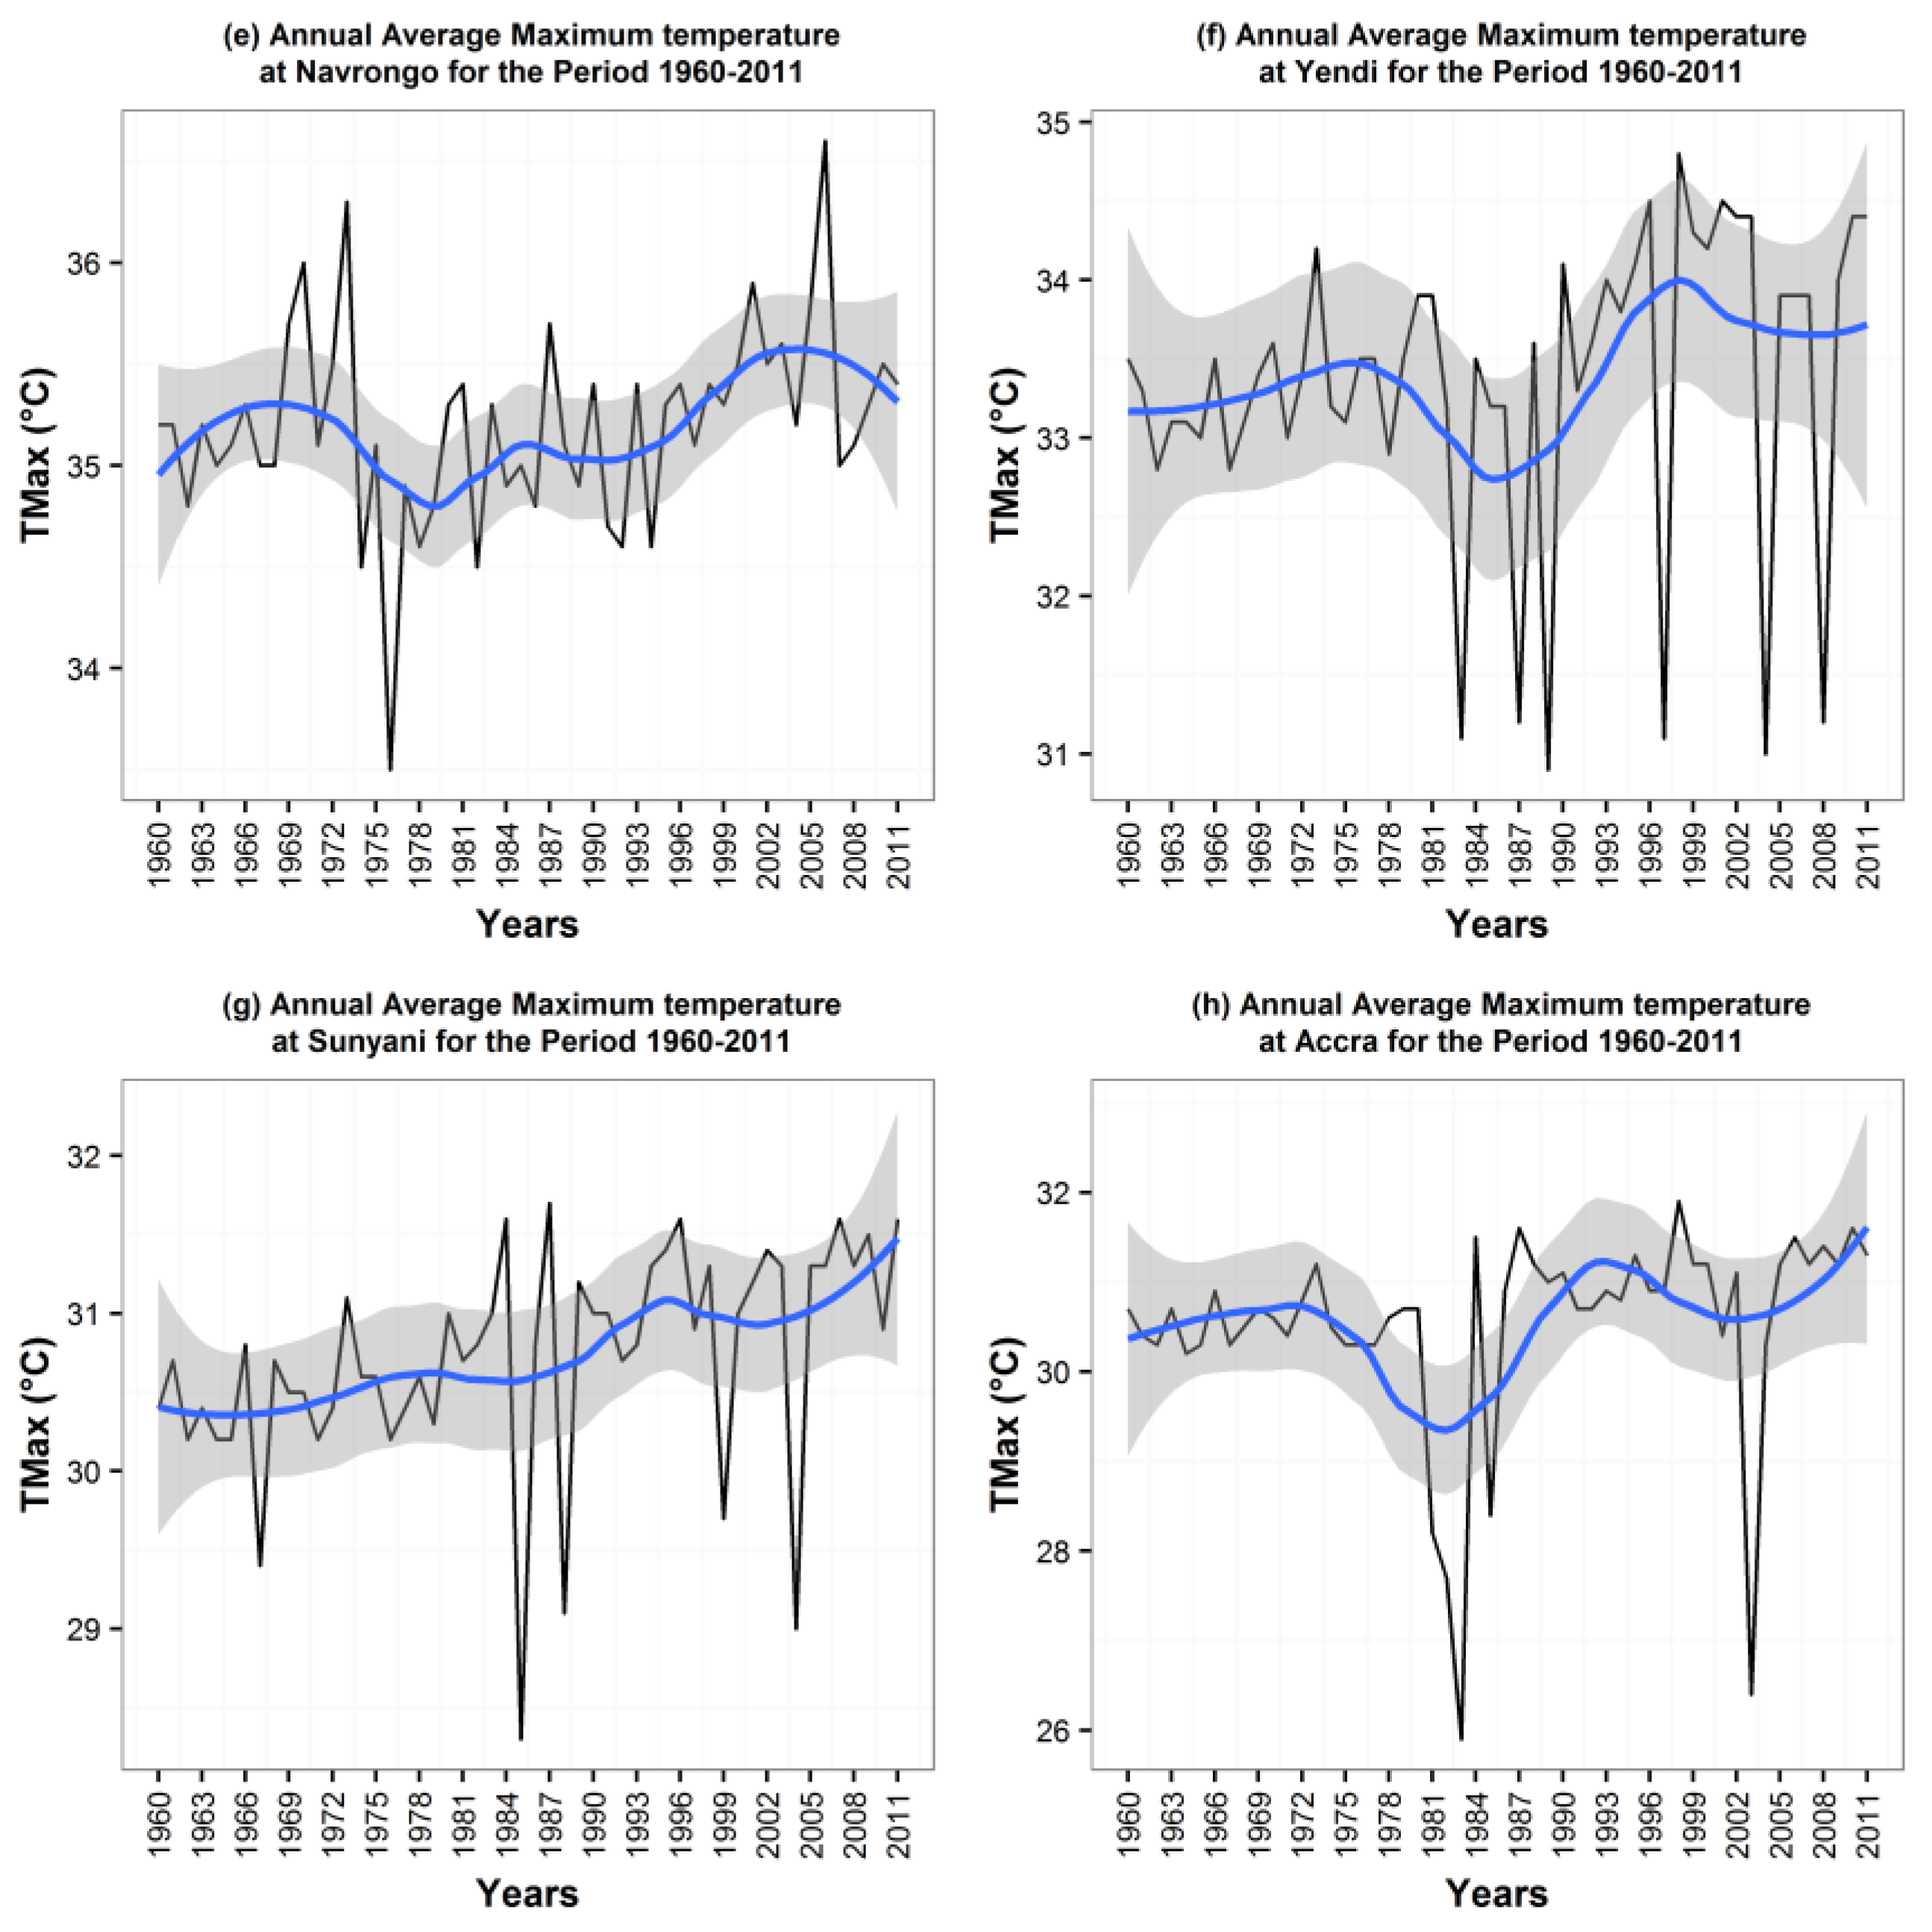
3.2. Temperature Variability in Ghana (1960—2011)

The findings (i.e., Figure 6 and Figure 7, and Table 2) from the study show increases in temperature in all the various stations studied, which have resulted in higher evaporation of water bodies. However, these may not be compensated due to the declining rainfall trend, especially between 1970 and 2011. Against this background, there were still instances of decreasing annual minimum and maximum temperatures between 1970 and 1980 in some of the stations such as Axim, Accra, Wa, Saltpond and Ho. Higher temperature and lower rainfall due to climate variability will influence water flow and extend dry season spells in the study regions. The rise in temperature, especially in a tropical climate, will increase evaporation from water and soil surfaces and transpiration from plants leading to drought. The annual minimum and maximum temperature trend for almost all the stations was positive, although the results are not statistically significant. The annual temperatures in the study regions were relatively high throughout the period of 1960–2011 and this has serious impacts on the hydrological cycle which significantly affects hydropower generation.
The average minimum annual temperature in Ghana varies between 20 °C and 24 °C. The spatial interpolation of the minimum temperature (Figure 8a) shows the highest values around the coastal line and the extreme north of Ghana while the lowest minimum temperatures are recorded around the central and the mid-west part of the country. The maximum annual average temperature in Ghana varies between 28 °C and 36 °C. The spatial interpolation of maximum temperature (Figure 8b) suggests that the highest maximum temperature values are measured in the northern part of the country while the lowest maximum temperature values are found around the coastal line.
Changes in temperature patterns may have effects on river systems which may affect hydroelectric production [30,31]. The increase in atmospheric temperature has been unprecedented in the past 25 years with eleven out of the twelve warmest years occurring between 1995 and 2006 [32]. In Ghana, climate change is being experienced through the rise in temperatures and unpredictable rainfall across all ecological zones [33].
Historical data reveals that rainfall was mostly high in the 1960s but decreased to low levels in the latter part of 1970s and early 1980s. This decline in rainfall patterns still prevails in recent times, and by using 20 years of data it was observed that temperatures in all zones in Ghana are rising, and that rainfall has been reducing and becoming increasingly erratic [34]. The impact of climate change is projected to be severe in Ghana, though there will be fluctuations in both annual temperatures and precipitation, hence increasing levels of uncertainty for conducting climate sensitive development planning. Based on the projection by [35], the trend for temperature over the period of 2010 to 2050 indicates warming in all regions of Ghana, with the highest temperature in the Northern, Upper East, and Upper West regions. The region with the lowest temperature is the Brong Ahafo region. These predictions are based on the various climate scenarios as developed in [34]. For instance, based on the scenario, it has been predicted that temperatures in the three regions of the north will rise by 2.1–2.4 °C by 2050. whereas the predicted rise in the Ashanti, Western, Eastern, Central, and Volta regions will be 1.7–2.0 °C, and that of the Brong Ahafo region will be 1.3–1.6 °C.

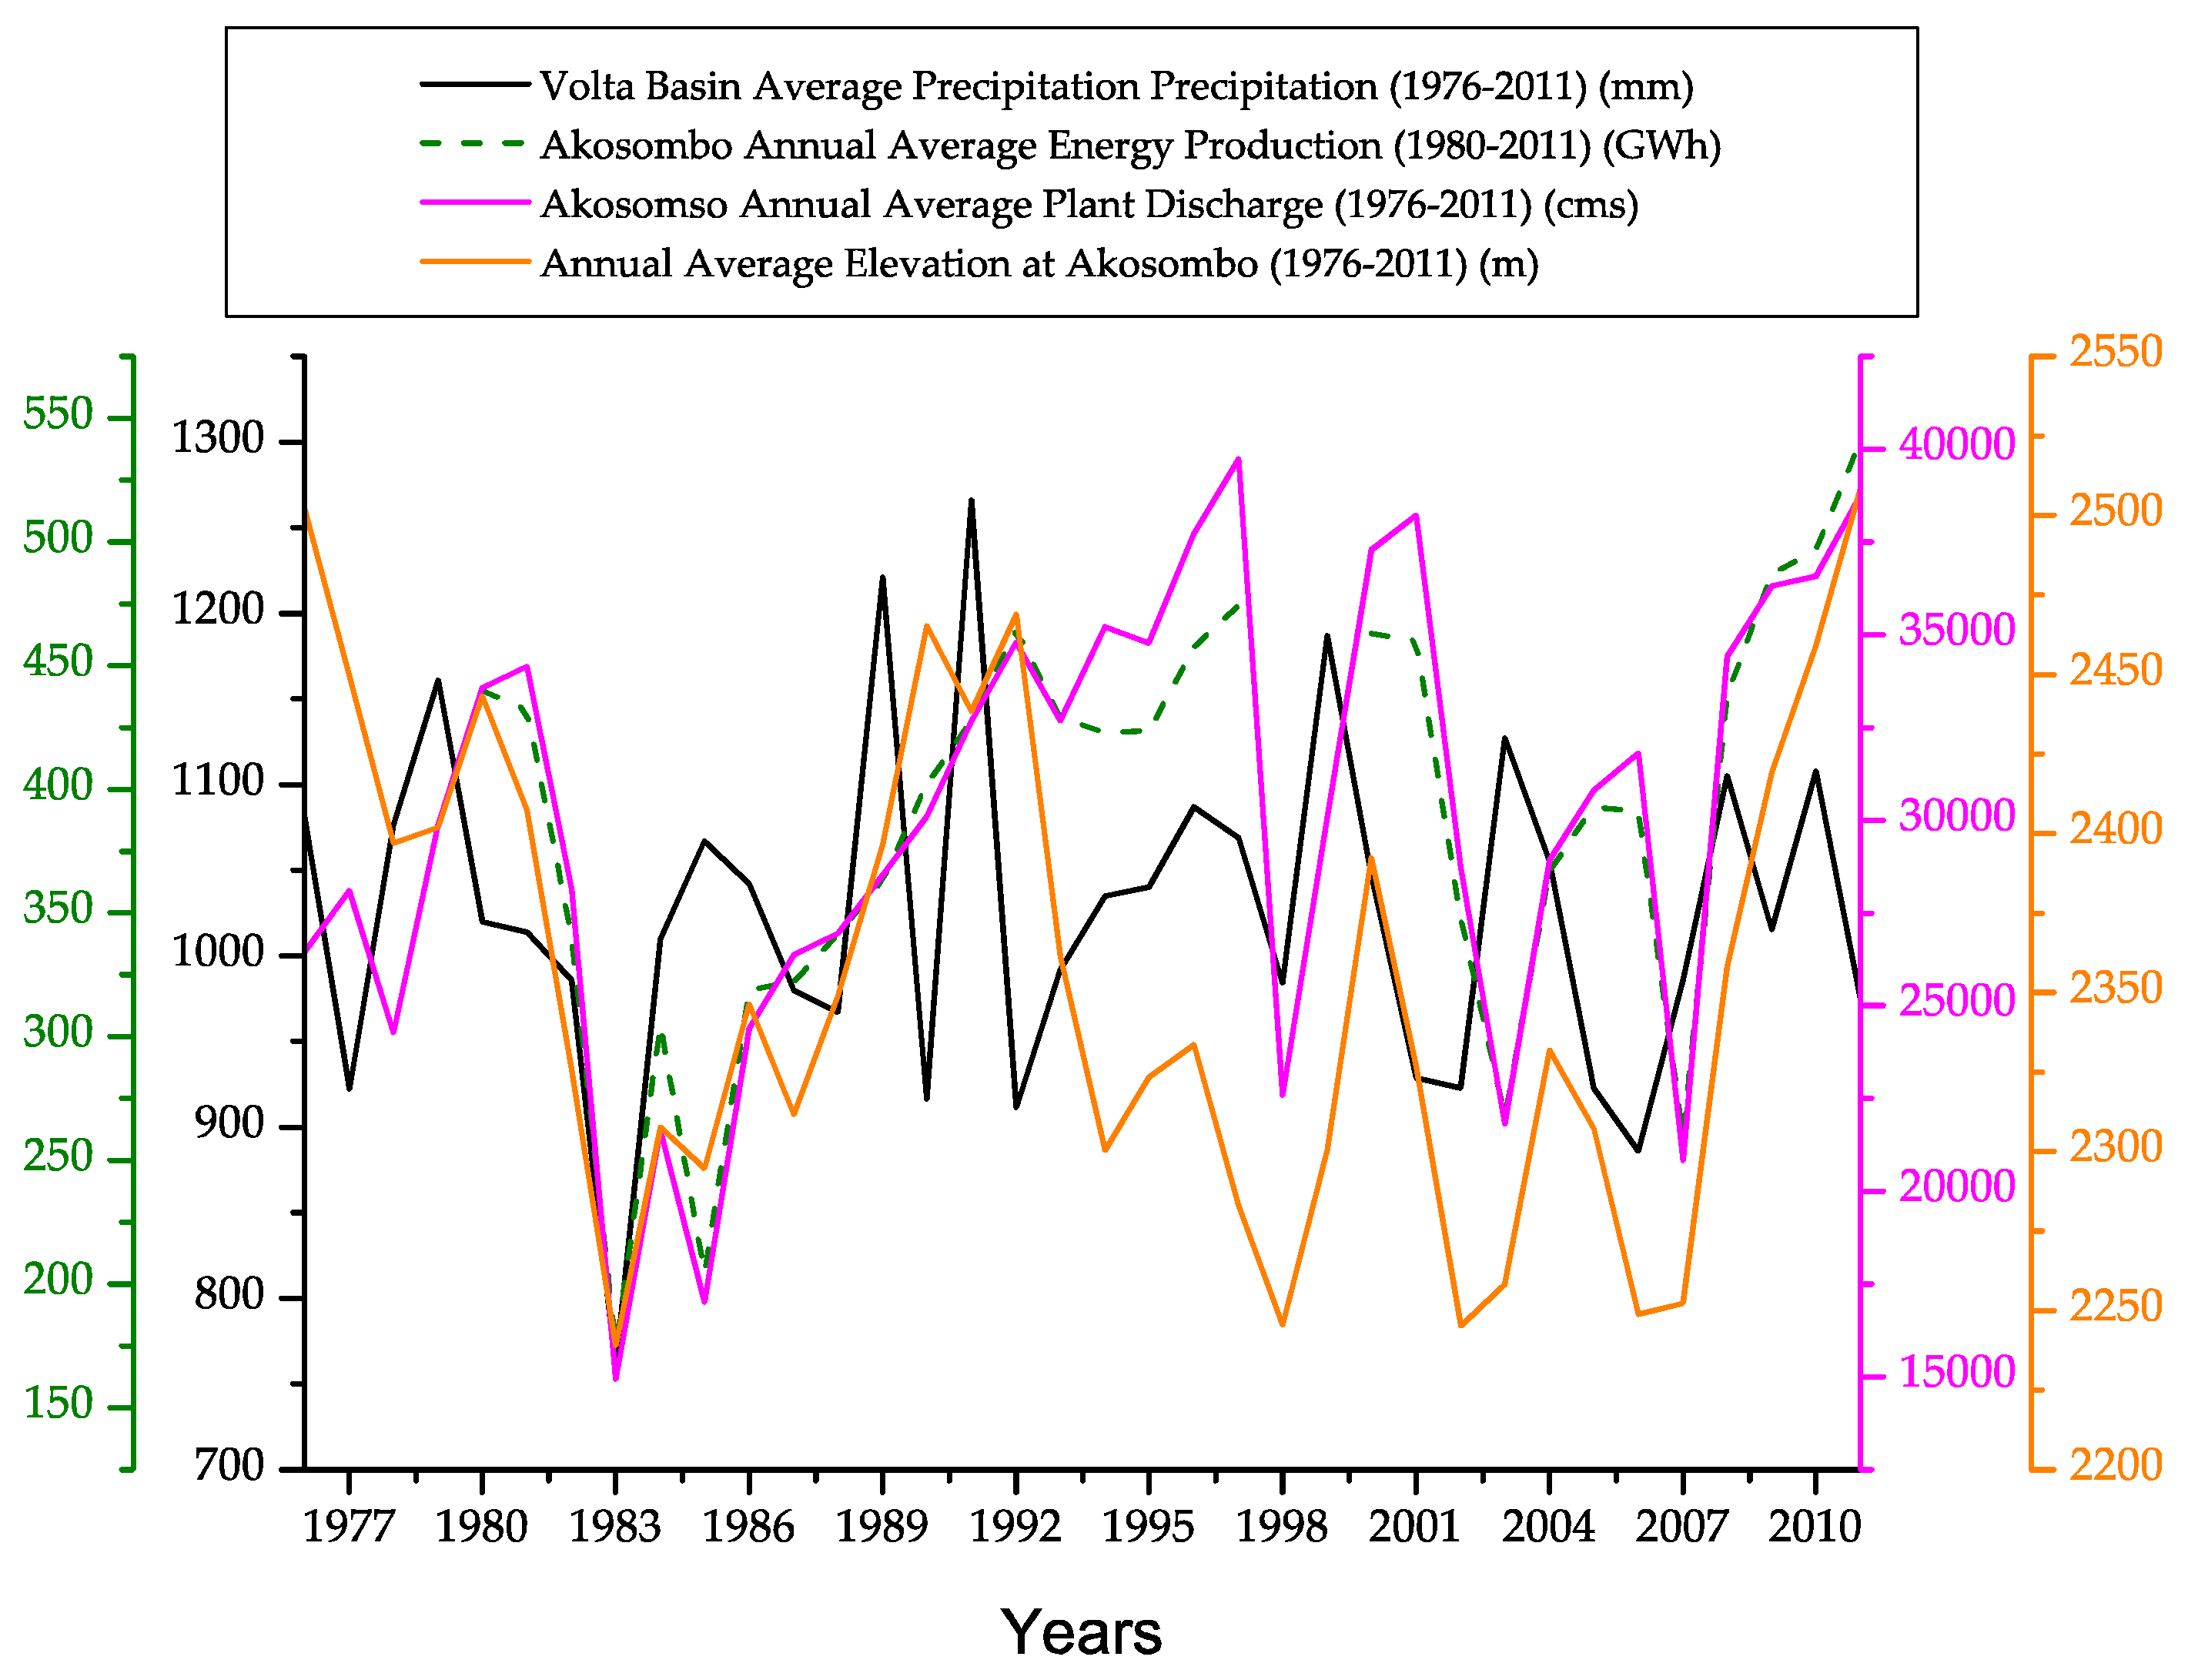
3.3. Discharge at Akosombo (1965–2014)

The Akosombo reservoir is fed by numerous tributary rivers to the Volta River, all of which rain-fed. The volume of water in the reservoir swells up during the rainy season and shrinks during the dry season. There is a large inflow of water into the reservoir in August during the peak rainfaill period and the reservoir attains its highest level in August/September. Spillage is always carried out in September mostly when the level of the Volta Lake rises above 84.3 m.a.s.l. However, the water level in the reservoir starts falling in October/November, with the onset of the harmattan (a dry and dusty northeasterly trade wind which blows from the Sahara Desert over the West Africa into the Gulf of Guinea between November–March) in the catchment area, and generally reaches its lowest level in May/July annually. Generally, the Akosombo Dam has experienced consistent reduction of water inflow into the reservoir mostly due to low rainfall patterns and high temperatures over the past years, and this has led to the occasional shut down of the turbines [36]. Therefore, discharge from the Akosombo Dam varies and depends on the amount of water inflow into the reservoir. However, other factors such as temperature also account for discharge at the dam.
From Figure 9, it can be seen that there is a cyclic nature of the rise and fall of the annual total discharge for Akosombo Dam from 1965–2014 as a result of the consistent fluctuation of rainfall distribution in Ghana and the Volta Basin. The Zs value, which is 4.93, shows that there is a positive trend for the annual average discharge for Akosombo Dam (1965–2014). In contrast, the results from the statistics for water level in Table 3 show that the Sen s   slope = 7.974 , this indicates a downward trend that is statistically significant at the 95% confidence interval. In general, the upward trend for discharge and downward trend for water elevation was not consistent throughout the period of 1965–2014. Also, it can be noted that the decreases in water level of the Akosombo Dam cannot be directly linked to decreases in precipitation alone. However, other factors—for instance as you increase flow regulation in a basin, evapotranspiration is shown to increase, which will reduce runoff [12] and temperature changes—may be considered due to their effects on evapotranspiration.

3.4. Potential Impact of Rainfall and Temperature Variations on Hydropower Generation

In the previous sections, we attempted to describe the spatio-temporal variation of rainfall and temperature in Ghana. Although all the trends were not statistically significant, the general pattern of the trends suggests a relative change. Figure 9 and Figure 10 show the temporal variation of the average Volta Basin rainfall, discharge, water level, energy production, and actual evapotranspiration at Akosombo. While there is an obvious correlation between plant discharge and power production from 1980–2011 (with a correlation coefficient of R2 = 0.95 for a linear model), the other parameters showed weak correlation. However, Figure 10 and Figure 11 show good correlation between power production and the other hydro-climatic parameters between the period of 1980–1990.
Figure 3 shows high potential evapotranspiration around Volta Lake. These relatively high values could result in important losses of water for Akosombo hydropower production. Although the fact that Volta Lake falls in the humid and dry-sub humid zone, the upper stream and the majority of the Volta Basin is under semi-arid conditions with high PET up to 2087 mm/year. This could lead to a deficit in rainfall with direct impacts on stream flow and consequently on hydropower production. As an example, Figure 10 reveals that with the decreasing trend of precipitation and energy production, there is a sharp increase in actual evapotranspiration. Jaramillo and Destouni (2015) [12] show that PET/P for the Volta Basin is, on average, 1.61 and has increased by 0.04 (4%) from 1955 to 2008 compare to the period 1901–1954 suggesting that the Volta Basin has become more “arid” with implications to the performance of the hydropower.
Electricity production in Ghana largely depends on hydropower production. In an era of changing climate, the challenge for hydropower plants to meet the country’s energy demand calls for innovation and the construction of additional power plants. One way of compensating the reduction in existing hydropower plant production due to climatic variations could be the exploitation of the mini to medium hydropower potential of Ghana. Referring to Figure 11, Ghana has potential for exploitable medium hydropower sites with the potential of some sites estimated to be over 75 MW. This could also help in meeting the growing demand for rural electrification.

4. Conclusions

Hydropower generation is highly dependent on available water resources. The impact of rainfall and temperature variability has a direct impact on electricity generation. This study examined the historical rainfall and temperature data across 22 stations in Ghana to understand the spatial and location specific trends over time. The paper also examined the discharge irregularities of the Akosombo Reservoir from 1965–2014 as way to contextualize the implications of climate variability on the performance of hydropower plants.
The results from the hydro-met stations across the country indicated an increasing trend of higher temperatures and declining rainfall patterns in various stations which will affect water availability and accessibility. The declining rainfall impacts on the performance of hydropower generation as exemplified at the three hydropower plants (Akosombo, Kpong and Bui) in Ghana. The rise in temperature will also increase evapotranspiration leading to water stress and drought, which will also affect the hydropower generation in Ghana. A deeper analysis of the Akosombo power generation reveals that the water level always drops, reaching its lowest in May/June each year, which has serious implications for power generation from the Akosombo Dam.
This study has revealed that hydropower is an important resource for Ghana’s future energy but changing hydrology due to changing climate has highlighted increasing uncertainties associated with hydropower generation. It means that Ghana will need to diversity its energy sources in order to build resilience in the country’s power sector as a way to supplement its energy demand during seasonal lows and address levels of variability in hydrogenation. This would need to involve government and energy providers to capitalize and invest in the oil and gas sector to power the thermal plants but more importantly integrating other renewable energy sources such as solar power to augment the electricity obtained from the hydropower plants. It is also envisaged that future hydropower plant investments in the country should take careful consideration into the rainfall and temperature impact on the potential for energy generation. Beyond these energy-specific interventions, there need to be considerable effort by individuals, non-governmental organizations and government institutions to uphold the principle of living in a green environment, which bring bottom-up actions to the broader goal of climate resilience. Such actions also acknowledge that interdependency between human and natural systems. For example, afforestation and improved management of catchments of hydroelectric dams would be necessary to minimize further increases in temperatures effects. Generally, the rise of temperatures would increase evaporation, thereby reducing the available water resources in the reservoirs for power generation.

Acknowledgments

This research is supported by funding from the Department for International Development (DfID) under the Climate Impact Research Capacity and Leadership Enhancement (CIRCLE) programme. We are grateful to all other anonymous contributors and reviewers of this work.

Author Contributions

Amos T. Kabo-Bah conducted this work as part of his post-doctoral researcher under the CIRCLE programme. Chuks J. Diji was the supervisor for the post-doctoral research and my mentors were Kaku Nokoe and Daniel Obeng-Ofori. Yacob Mulugetta was the external supervisor for reviewing and ensuring that the overall quality of the post-doctoral research was up to the international standards. Komlavi Akpoti was an MSc student who supported me during the data collection and analysis for this research.

Conflicts of Interest

The authors declare no conflict of interest. The founding sponsors had no role in the design of the study; in the collection, analyses, or interpretation of data; in the writing of the manuscript, and in the decision to publish the results.

References

  1. Feddema, J.J.; Oleson, K.W.; Bonan, G.B.; Mearns, L.O.; Buja, L.E.; Meehl, G.A.; Washington, W.M. The importance of land-cover change in simulating future climates. Science 2005, 310, 1674–1678. [Google Scholar] [CrossRef] [PubMed]
  2. Gordon, L.; Dunlop, M.; Foran, B. Land cover change and water vapour flows: Learning from Australia. Philos. Trans. R. Soc. Lond. Ser. B Biol. Sci. 2003, 358, 1973–1984. [Google Scholar] [CrossRef] [PubMed]
  3. Vorosmarty, C.J.; Sahagian, D. Anthropogenic disturbance of the terrestrial water cycle. BioScience 2000, 50, 753–765. [Google Scholar] [CrossRef]
  4. Milly, P.C.D.; Dunne, K.A. Trends in evaporation and surface cooling in the Mississippi River basin. Geophys. Res. Lett. 2001, 28, 1219–1222. [Google Scholar] [CrossRef]
  5. Destouni, G.; Jaramillo, F.; Prieto, C. Hydroclimatic shifts driven by human water use for food and energy production. Nat. Clim. Chang. 2013, 3, 213–217. [Google Scholar] [CrossRef]
  6. Degu, A.M.; Hossain, F.; Niyogi, D.; Pielke, R.; Shepherd, J.M.; Voisin, N.; Chronis, T. The influence of large dams on surrounding climate and precipitation patterns. Geophys. Res. Lett. 2011, 38. [Google Scholar] [CrossRef]
  7. Milly, P.C.D. Climate, soil water storage, and the average annual water balance. Water Resour. Res. 1994, 30, 2143–2156. [Google Scholar] [CrossRef]
  8. Reynolds, J.F.; Kemp, P.R.; Tenhunen, J.D. Effects of long-term rainfall variability on evapotranspiration and soil water distribution in the Chihuahuan Desert: A modeling analysis. Plant Ecol. 2000, 150, 145–159. [Google Scholar] [CrossRef]
  9. Akpoti, K.; Antwi, E.O.; Kabo-Bah, A.T. Impacts of rainfall variability, land use and land cover change on stream flow of the black Volta Basin, West Africa. Hydrology 2016, 3, 26. [Google Scholar] [CrossRef]
  10. IPCC. Climate Change 2014: Mitigation of Climate Change; Cambridge University Press: Cambridge, UK, 2015. [Google Scholar]
  11. Madani, K. Hydropower licensing and climate change: Insights from cooperative game theory. Adv. Water Resour. 2011. [Google Scholar] [CrossRef]
  12. Jaramillo, F.; Destouni, G. Local flow regulation and irrigation raise global human water consumption and footprint. Science 2015, 350, 1248–1251. [Google Scholar] [CrossRef] [PubMed]
  13. The Global Runoff Data Centre (GRDC). Monthly Runoff Information of Station Number 1531700 of the Volta River; GRDC: Koblenz, Germany, 2016. [Google Scholar]
  14. Paulhus, J.L.; Kohler, M.A. Interpolation of missing precipitation records. Mon. Weather Rev. 1952. [Google Scholar] [CrossRef]
  15. Eischeid, J.K.; Bruce Baker, C.; Karl, T.R.; Diaz, H.F. The quality control of long-term climatological data using objective data analysis. J. Appl. Meteorol. 1995, 34, 2787–2795. [Google Scholar] [CrossRef]
  16. Eischeid, J.K.; Pasteris, P.A.; Diaz, H.F.; PLantico, M.S.; Lott, N.J. Creating a serially complete, national daily time series of temperature and precipitation for the Western United States. J. Appl. Meteorol. 2000, 39, 1580–1591. [Google Scholar] [CrossRef]
  17. Romero, R.; Guijarro, J.A.; Ramis, C.; Alonso, S. A 30-year (1964–1993) daily rainfall data base for the Spanish mediterranean regions: First exploratory. Int. J. Climatol. 1998, 560, 541–560. [Google Scholar] [CrossRef]
  18. Gocic, M.; Trajkovic, S. Analysis of changes in meteorological variables using Mann-Kendall and Sen’s slope estimator statistical tests in Serbia. Glob. Planet. Chang. 2013, 100, 172–182. [Google Scholar] [CrossRef]
  19. Tabari, H.; Marofi, S.; Ahmadi, M. Long-term variations of water quality parameters in the Maroon River, Iran. Environ. Monit. Assess. 2011, 177, 273–287. [Google Scholar] [CrossRef] [PubMed]
  20. Salmi, T.; Määttä, A.; Anttila, P.; Ruoho-Airola, T.; Amnell, T. Detecting Trends of Annual Values of Atmospheric Pollutants by the Mann-Kendall Test and Sen’s Slope Estimates—The Excel Template Application MAKESENS; Finnish Meteorological Institute: Helsinki, Finland, 2002. [Google Scholar]
  21. Hirsch, R.M.; Slack, J.R.; Smith, R.A. Techniques of trend analysis for monthly water quality data. Water Resour. Res. 1982, 18, 107–121. [Google Scholar] [CrossRef]
  22. Xu, Z.X.; Li, J.Y.; Liu, C.M. Long-term trend analysis for major climate variables in the Yellow River basin. Hydrol. Process. 2007. [Google Scholar] [CrossRef]
  23. Sen, P.K. Estimates of the regression coefficient based on Kendall’s tau. J. Am. Stat. Assoc. 1968, 63, 1379–1389. [Google Scholar] [CrossRef]
  24. Nasher, N.M.R.; Uddin, M.N. Maximum and minimum temperature trends variation over northern and southern part of Bangladesh. J. Environ. Sci. Nat. Resour. 2013, 6, 83–88. [Google Scholar] [CrossRef]
  25. Thiessen, A.H. Precipitation averages for large areas. Mon. Weather Rev. 1911, 39, 1082–1089. [Google Scholar] [CrossRef]
  26. Jaramillo, F.; Prieto, C.; Lyon, S.W.; Destouni, G. Multimethod assessment of evapotranspiration shifts due to non-irrigated agricultural development in Sweden. J. Hydrol. 2013, 484, 55–62. [Google Scholar] [CrossRef]
  27. Adu-Gyamerah, E. Alternative Power Needed. Available online: http://www.graphic.com.gh/features/opinion/26002-alternative-power-needed.html (accessed on 18 January 2016).
  28. DailyGraphic. The Power Crisis in Ghana: Analysis of the Causal Factors from the Perspectives of Public. Available online: http://www.graphic.com.gh/features/opinion/39140-the-power-crisis-in-ghana-analysis-of-the-causal-factors-from-the-perspectives-of-public-officials.html (accessed on 18 January 2015).
  29. Trabucco, A.; Zomer, R.J. Global Aridity Index (Global-Aridity) and Global Potential Evapo-Transpiration (Global-PET) Geospatial Database; CGIAR Consortium for Spatial Information: Washington, DC, USA, 2006. [Google Scholar]
  30. Markoff, M.S.; Cullen, A.C. Impact of climate change on Pacific Northwest hydropower. Clim. Chang. 2008, 87, 451–469. [Google Scholar] [CrossRef]
  31. Schaefli, B.; Hingray, B.; Musy, A. Climate change and hydropower production in the Swiss Alps: Quantification of potential impacts and related modelling uncertainties. Hydrol. Earth Syst. Sci. Discuss. 2007, 11, 1191–1205. [Google Scholar] [CrossRef]
  32. United Nations Framework Convention on Climate Change Secretariat (UNFCCCS). Climate Change: Impacts, Vulnerabilities, and Adaptation in Developing Countries; United Nations Framework Convention on Climate Change Secretariat: Bonn, Germany, 2007. [Google Scholar]
  33. Ministry of Environment. Ghana Goes for Green Growth; Ministry of Environment, Science and Technology: Accra, Ghana, 2010.
  34. Cameron, C. Climate Change Financing and Aid Effectiveness: Ghana Case Study; Agulhas Applied Knowledge. Available online: www.oecd.org/dac/environment-development/48458430.pdf (accessed on 24 September 2016).
  35. World Bank. Economics of Adaptation to Climate Change. Ghana Country Study; World Bank: Washington, DC, USA, 2010. [Google Scholar]
  36. Ghana News. Akosombo Dam Water Level Expected to Drop to Record Low; Ghana News: Accra, Ghana, 2014. Available online: http://www.myjoyonline.com/business/2014/april-23rd/akosombo-dam-water-level-expected-to-drop-to-record-low.php (accessed on 30 March 2016).
Figure 1. Location of the weather stations in Ghana.
Climate 04 00049 g001
Figure 2. Spatial distribution of annual precipitation from 1960 to 2011. The Inverse Distance Weighting (IDW) approach was used to interpolate the rainfall data.
Climate 04 00049 g002
Figure 3. Spatial distribution of the rainfall trends.
Climate 04 00049 g003
Figure 4. Rainfall times series of four selected stations in Ghana. The blue line or regression line represents a smoother (mean of annual precipitation at each year). The grey band is the display of the confidence interval (95% confidence interval) around the smoother. This helps to see the overall trend in the precipitation. Note that this stands for all the following graphs in this paper.
Climate 04 00049 g004
Figure 5. Annual potential evapotranspiration (PET) and aridity index (AI) profile of the Volta Basin.
Climate 04 00049 g005
Figure 6. Minimum temperature time series of four selected stations in Ghana. The blue line or regression line represents a smoother. The grey band is the display of the confidence interval (95% confidence interval) around the smoother.
Climate 04 00049 g006
Figure 7. Maximum temperature time series of four selected stations in Ghana. The blue line or regression line represents a smoother. The grey band is the display of the confidence interval (95% confidence interval) around the smoother.
Climate 04 00049 g007
Figure 8. Spatial distribution of Minimum temperature (a) and Maximum temperature (b) from 1960 to 2011. The Inverse Distance Weighting (IDW) approach was used for the interpolation.
Climate 04 00049 g008
Figure 9. Plot of average precipitation, plant discharge, water level, and energy production at Akosombo dam. The average precipitation of the Volta Basin was estimated using the Thiessen Method.
Climate 04 00049 g009
Figure 10. Plot of average precipitation, plant discharge, water level, and energy production at Akosombo dam. The average precipitation of the Volta Basin was estimated using the Thiessen Method.
Climate 04 00049 g010
Figure 11. Map of Ghana showing potential mini and medium hydropower sites along with existing hydropower sites.
Climate 04 00049 g011
Table 1. Data quality control.
StationsPercentage of Missing Data (%)
Annual Total PrecipitationAnnual Minimum TemperatureAnnual Maximum Temperature
Abetifi1.9240.3840.38
Accra1.925.805.80
Ada0.000.000.00
Akatsi40.3834.6234.62
Akim Oda30.0026.9026.90
Akuse36.515.3813.50
Axim0.009.629.62
Bole3.8017.3017.30
Ho0.007.709.62
Kete Krachi0.0015.4015.40
Koforidua9.607.7023.10
Kumasi0.000.000.00
Navrongo0.0034.6232.70
Saltpond0.0011.5011.50
Sefwi Bekwai7.707.707.70
Sunyani3042.3044.23
Takoradi307.7040.38
Tamale0.000.003.80
Tema9.603.803.80
Wa0.000.000.00
Wenchi0.0013.5011.50
Yendi0.0013.5013.50
Table 2. Summary of the statistical trend test.
StationsMeteorological ParametersStationsMeteorological Parameters
TestRainfallTminTmaxTestRainfallTminTmax
WaZs0.1895.650 ***5.729 ***AkatsiZs1.3025.871 ***4.585 ***
Qmed0.2540.031 0.028Qmed2.3160.025 0.021
NavrongoZs0.4022.675 **2.044 *Sefwi BekwaiZs−1.673 +3.512 ***5.184 ***
Qmed0.6000.010 0.008Qmed−2.7190.021 0.041
BoleZs−0.6634.151 ***4.332 ***KumasiZs−0.8135.548 ***6.179 ***
Qmed−1.5730.019 0.022Qmed−2.0670.025 0.034
TamaleZs−0.2134.798 ***4.814 ***Akim OdaZs−1.5945.816 ***5.224 ***
Qmed−0.4290.020 0.024Qmed−4.1110.019 0.025
YendiZs−0.4024.530 ***3.606 ***KoforiduaZs−1.6345.816 ***5.563 ***
Qmed−0.8940.022 0.022Qmed−3.9010.029 0.028
Kete KrachiZs0.0004.435 ***3.930 ***AximZs−1.728+2.872 **3.496 ***
Qmed0.0000.024 0.029Qmed−7.7440.014 0.017
HoZs−1.6106.432 ***5.216 ***AdaZs−0.8764.774 ***2.257 *
Qmed−2.4480.026 0.022Qmed−2.0980.021 0.011
WenchiZs0.0325.619 ***4.995 ***TakoradiZs−1.0185.390 ***3.314 ***
Qmed0.0710.024 0.024Qmed−2.0480.026 0.015
SunyaniZs−2.723 **2.304 *4.695 ***AccraZs−0.7976.558 ***3.969 ***
Qmed−6.1670.009 0.023Qmed−1.6930.036 0.019
AkuseZs−2.9434.411 ***5.809 ***TemaZs−0.7347.182 ***5.842 ***
Qmed−5.967 **0.020 0.028Qmed−1.6500.041 0.022
AbetifiZs0.1035.406 ***5.547 ***SaltpondZs−1.5945.399 ***4.057 ***
Qmed0.2430.020 ***0.018Qmed−3.8770.024 0.031
Table 2 shows the statistics of the trend test for each of the stations. Zs: Mann-Kendall test, Qmed: Sen’s slope estimator (mm/year) for precipitation and °C/year, *** Statistically significant trends at the 0.1% significance level, ** Statistically significant trends at the 1% significance level, * Statistically significant trends at the 5% significance level, + Statistically significant trends at the 10% significance level.
Table 3. Trends test on water level and discharge.
ParametersTest ZsSignificanceQmed
Water level−2.11*−7.974 (m/year)
Discharge4.93***15,441.1(m3/year)
Zs: Mann-Kendall test, Qmed: Sen’s slope estimator, *** statistically significant trends at the 0.1% significance level, * statistically significant trends at the 5% significance level.

