Genetic Diversity and Combining Ability of White Maize Inbred Lines under Different Plant Densities

 ,
, 

 , , and
Abstract
:1. Introduction
2. Results
2.1. Analysis of Variance
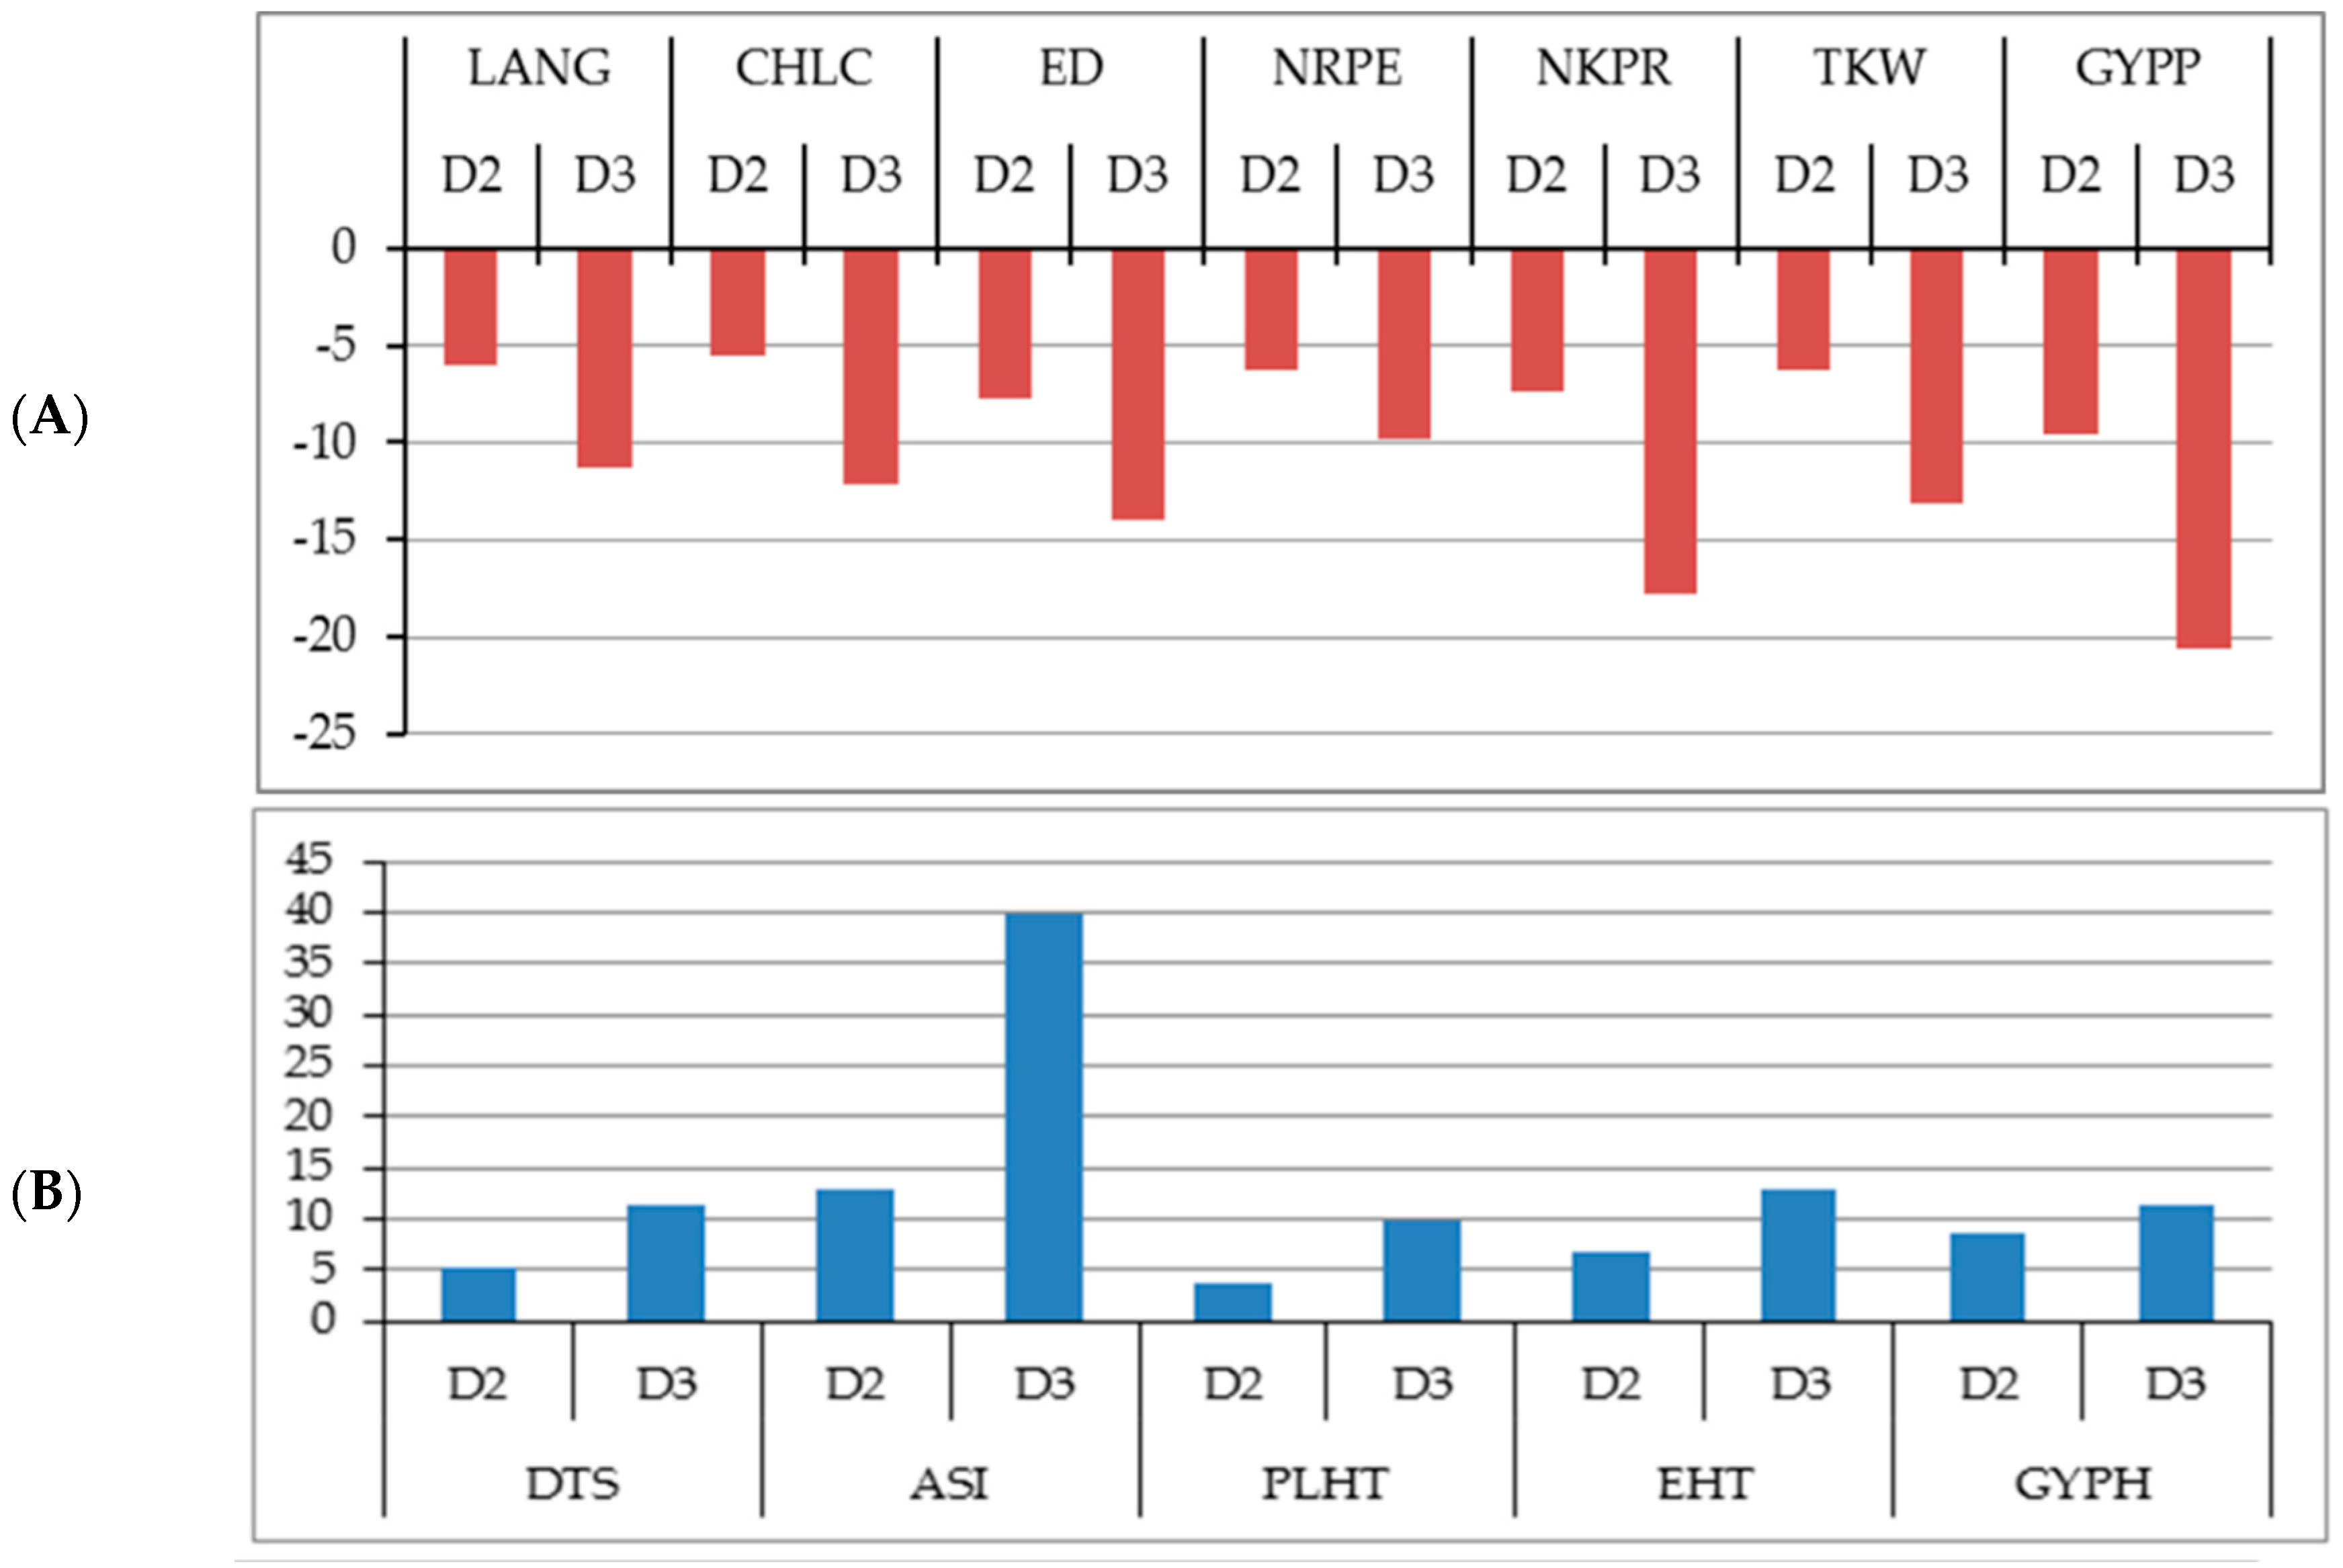
2.2. Changes in the Studied Traits Due to Increased Plant Density
2.3. Performance of F1 Hybrids
2.4. General Combining Ability (GCA) Effects
2.5. Specific Combining Ability (SCA) Effects
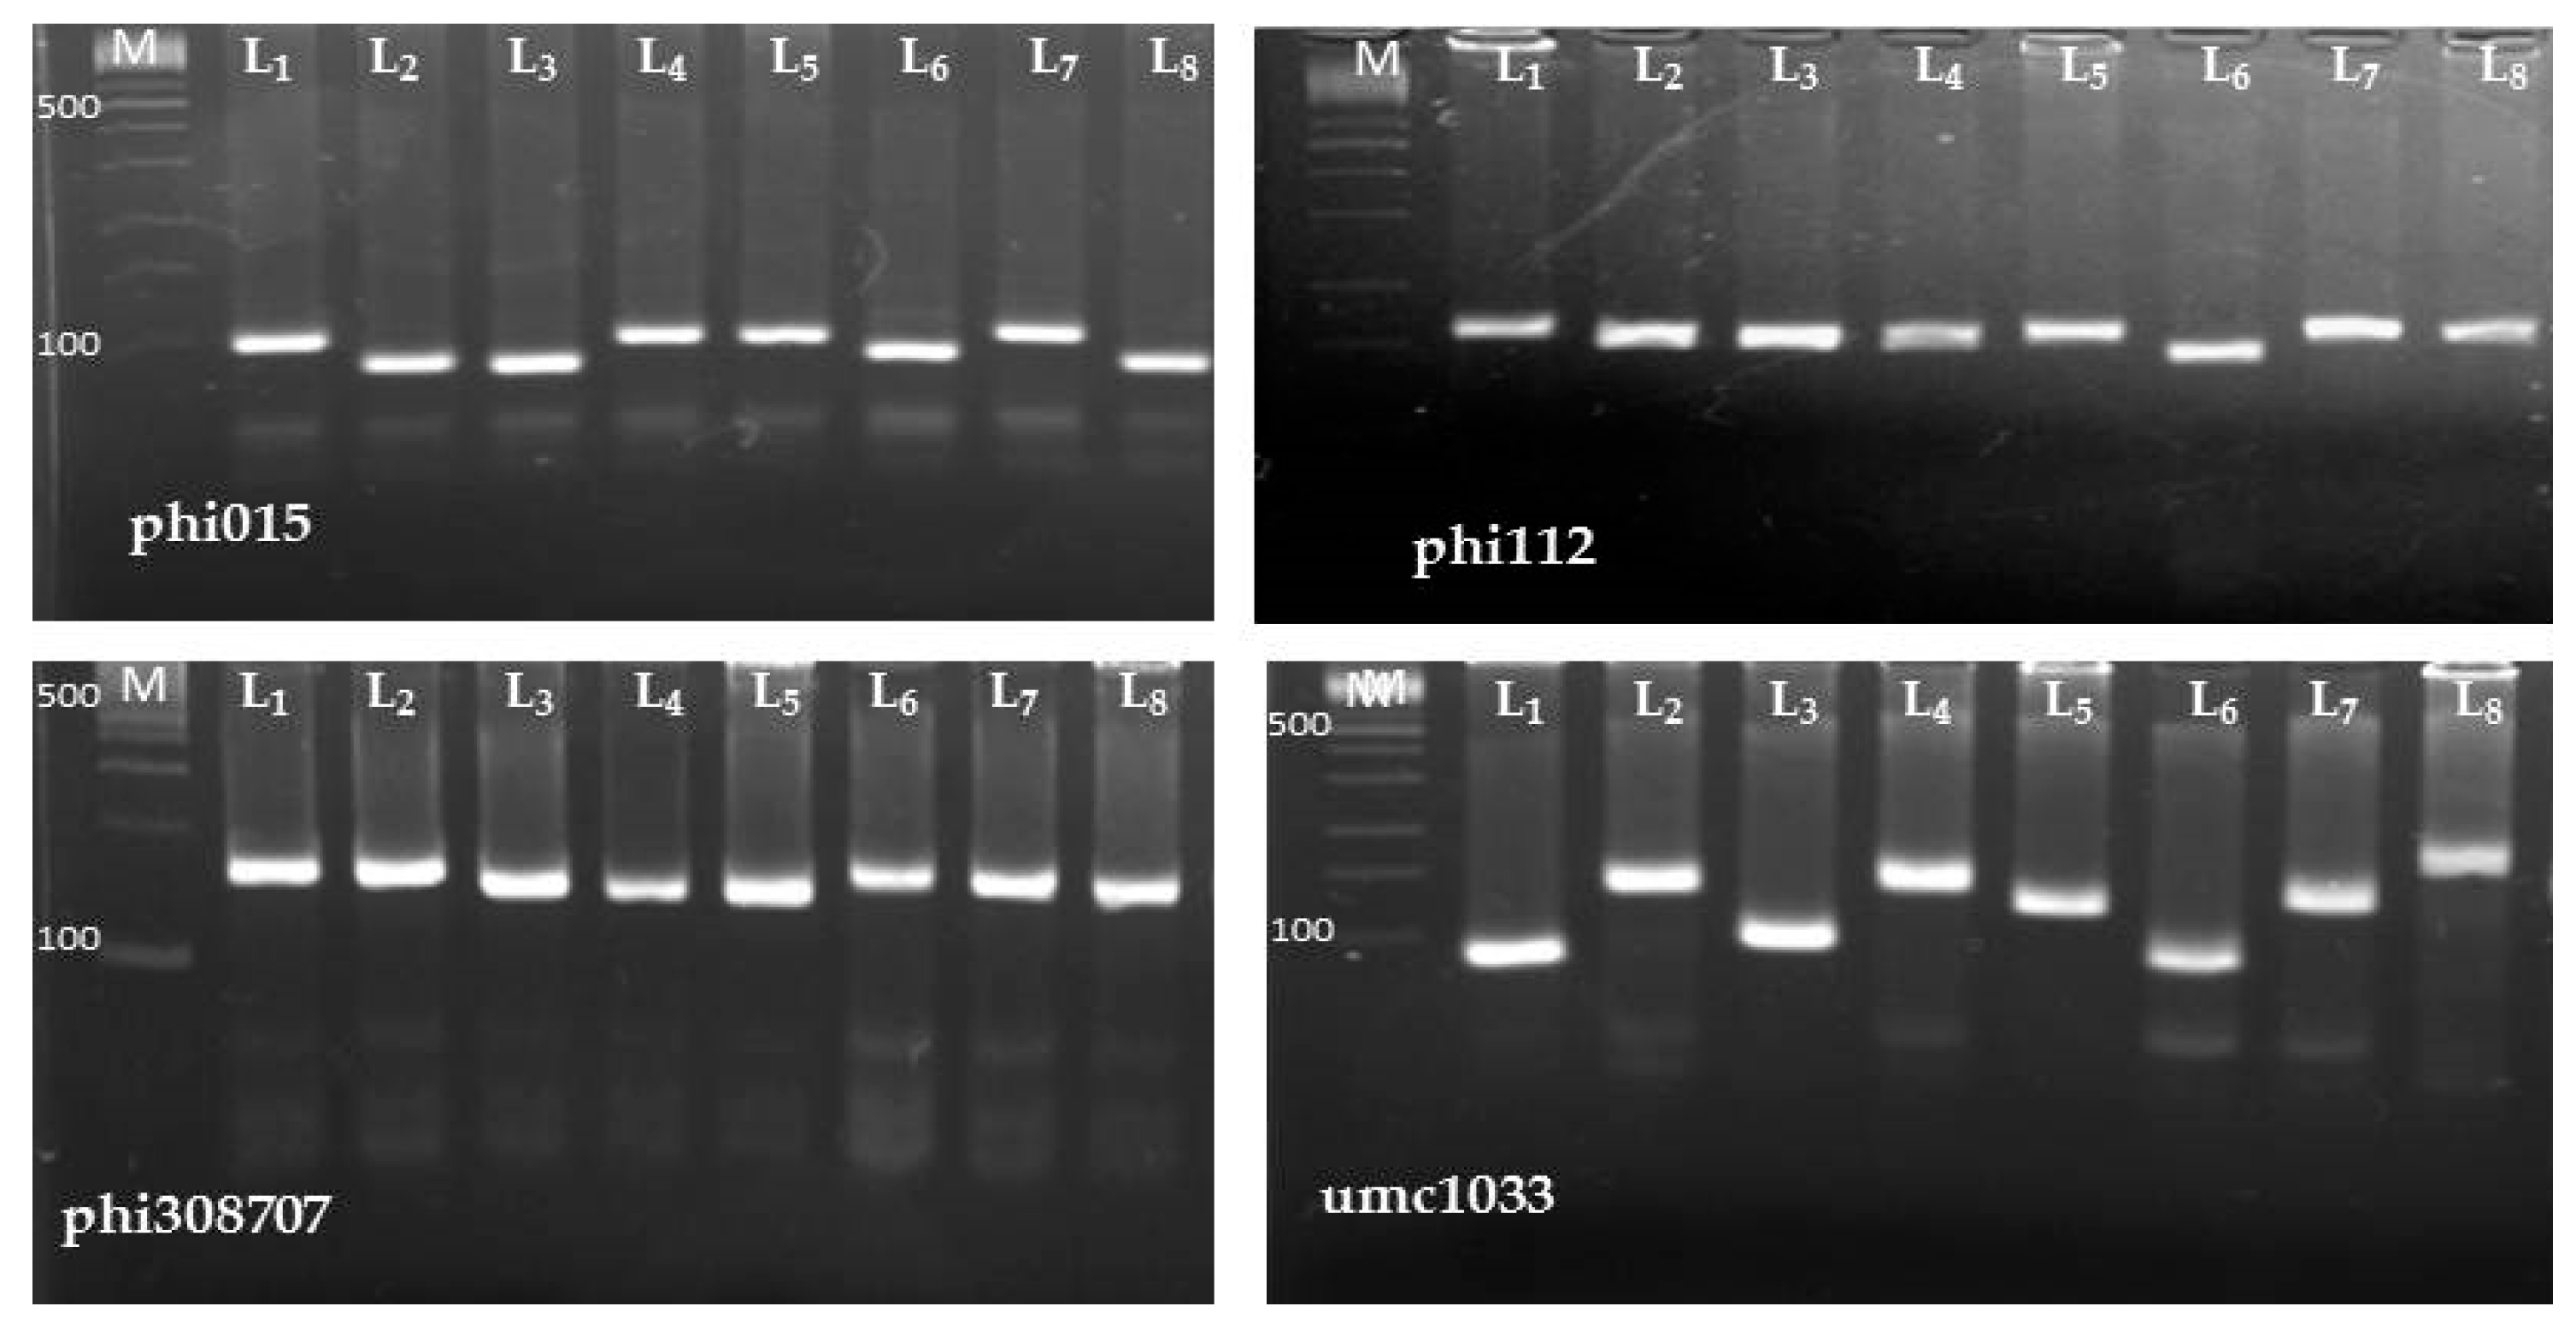
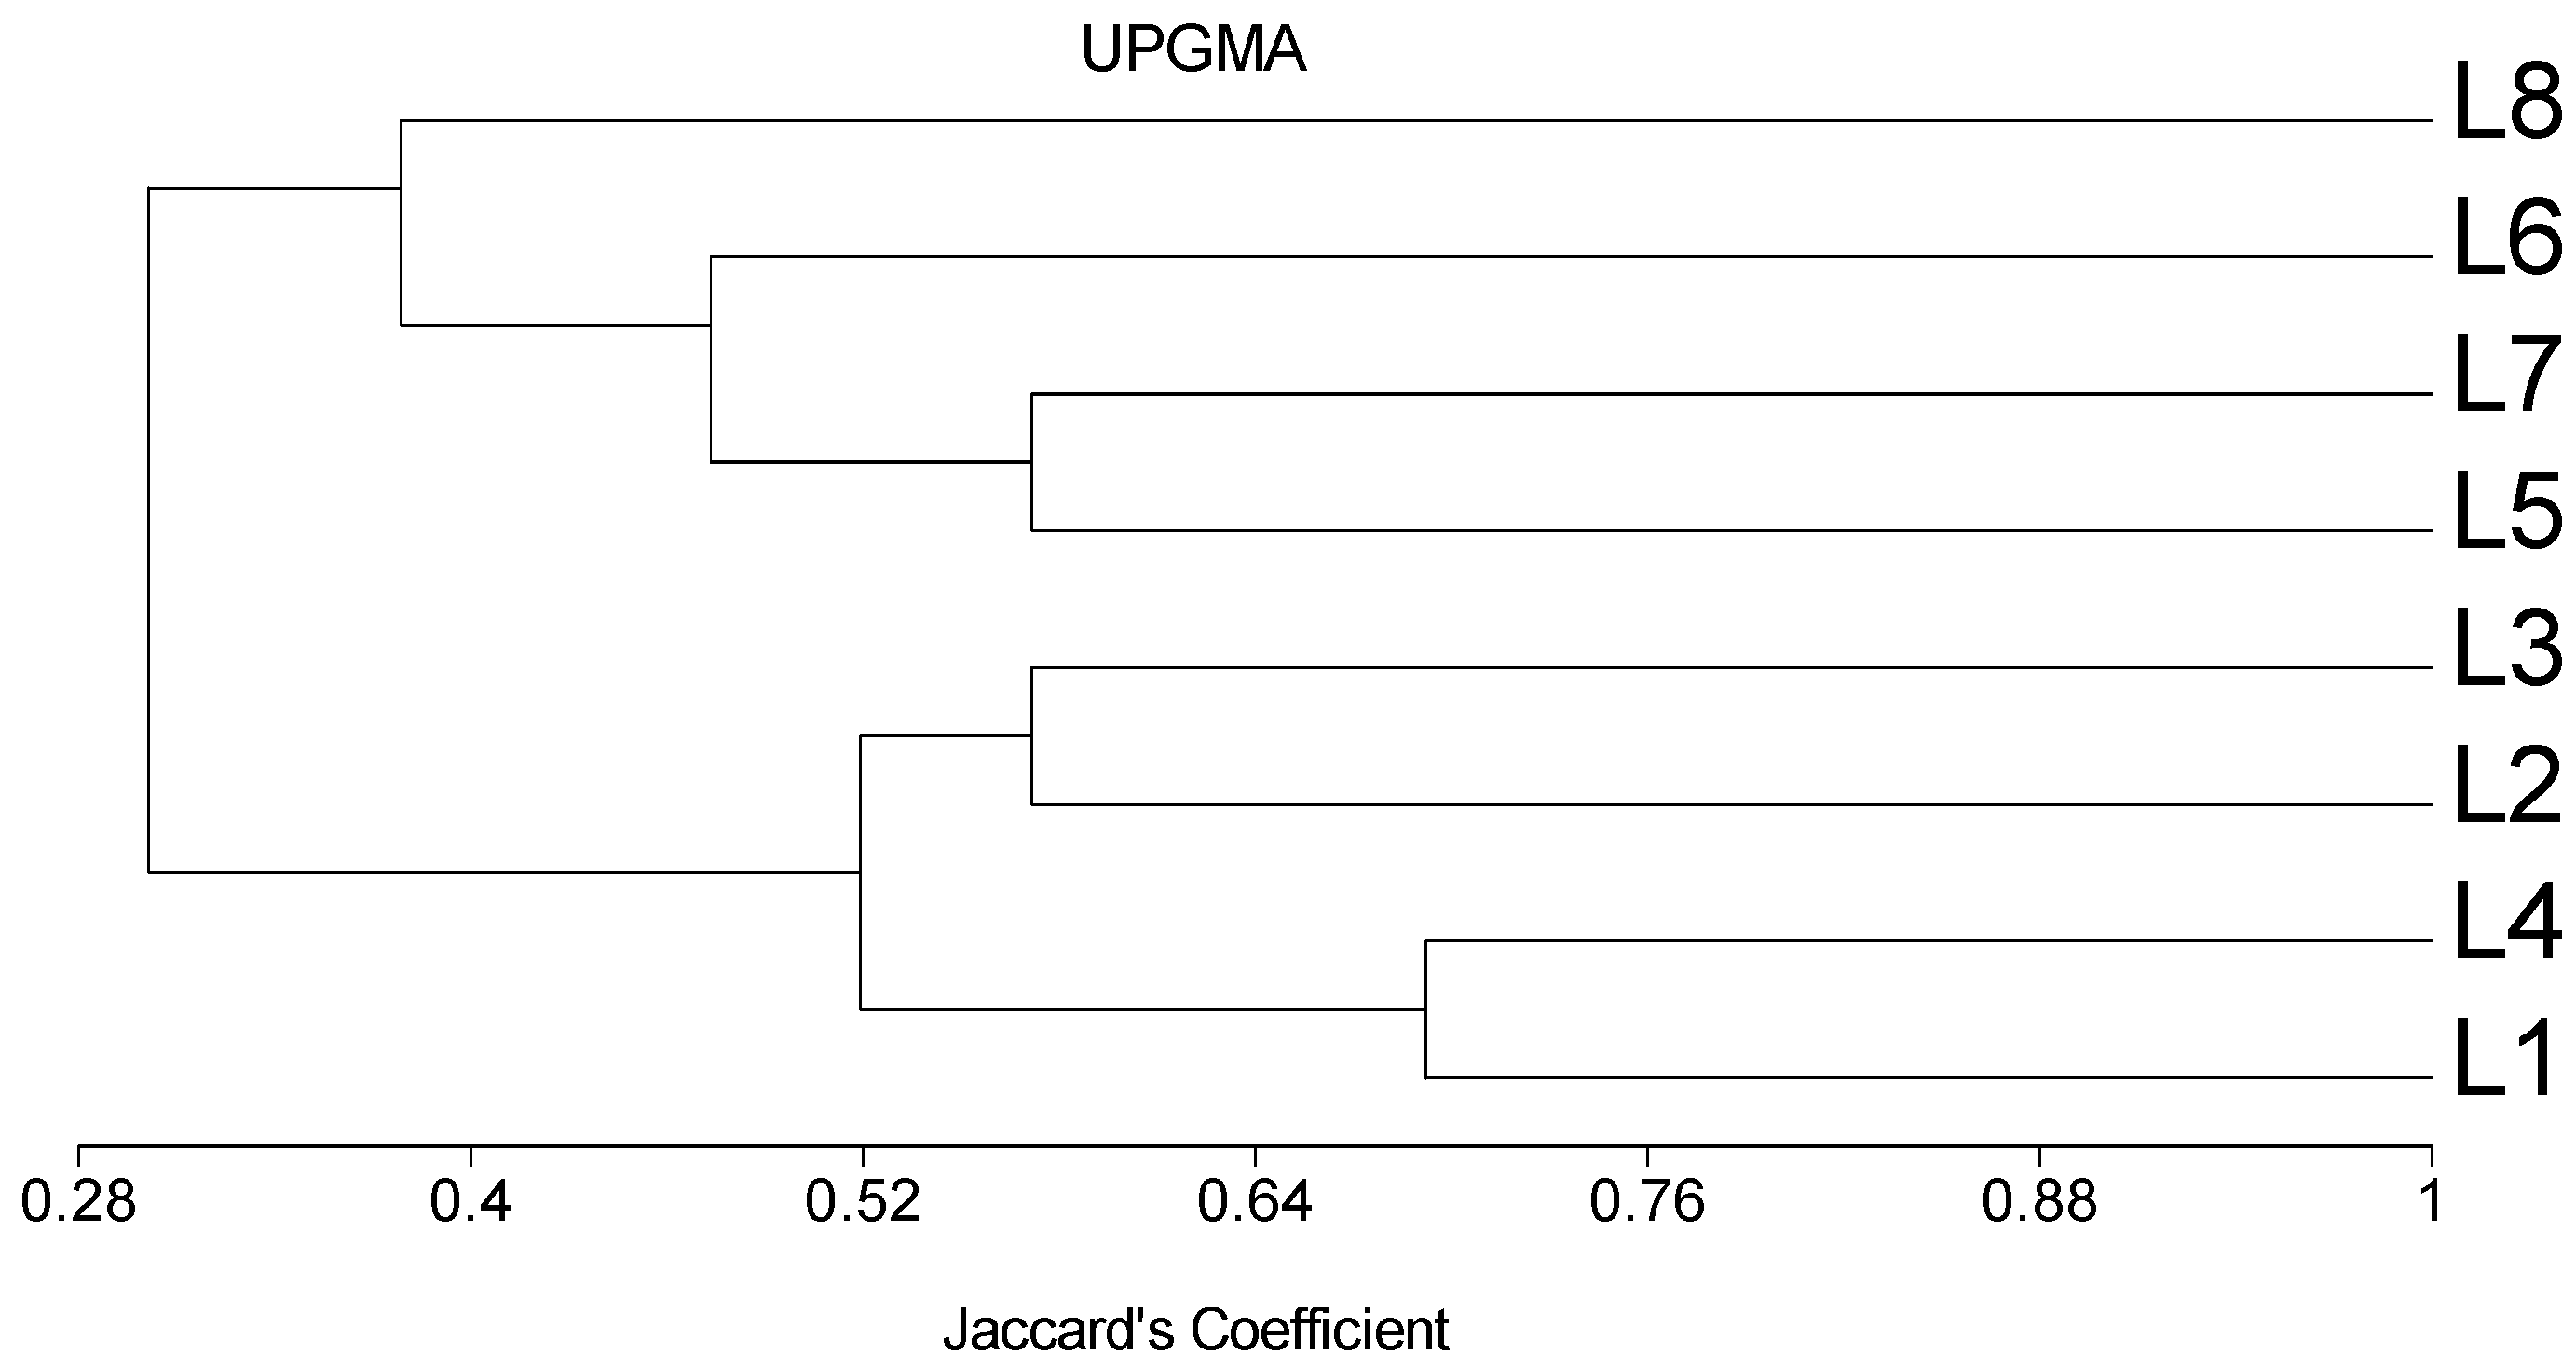
2.6. SSR Polymorphisms, Genetic Distance (GD) and Cluster Analysis
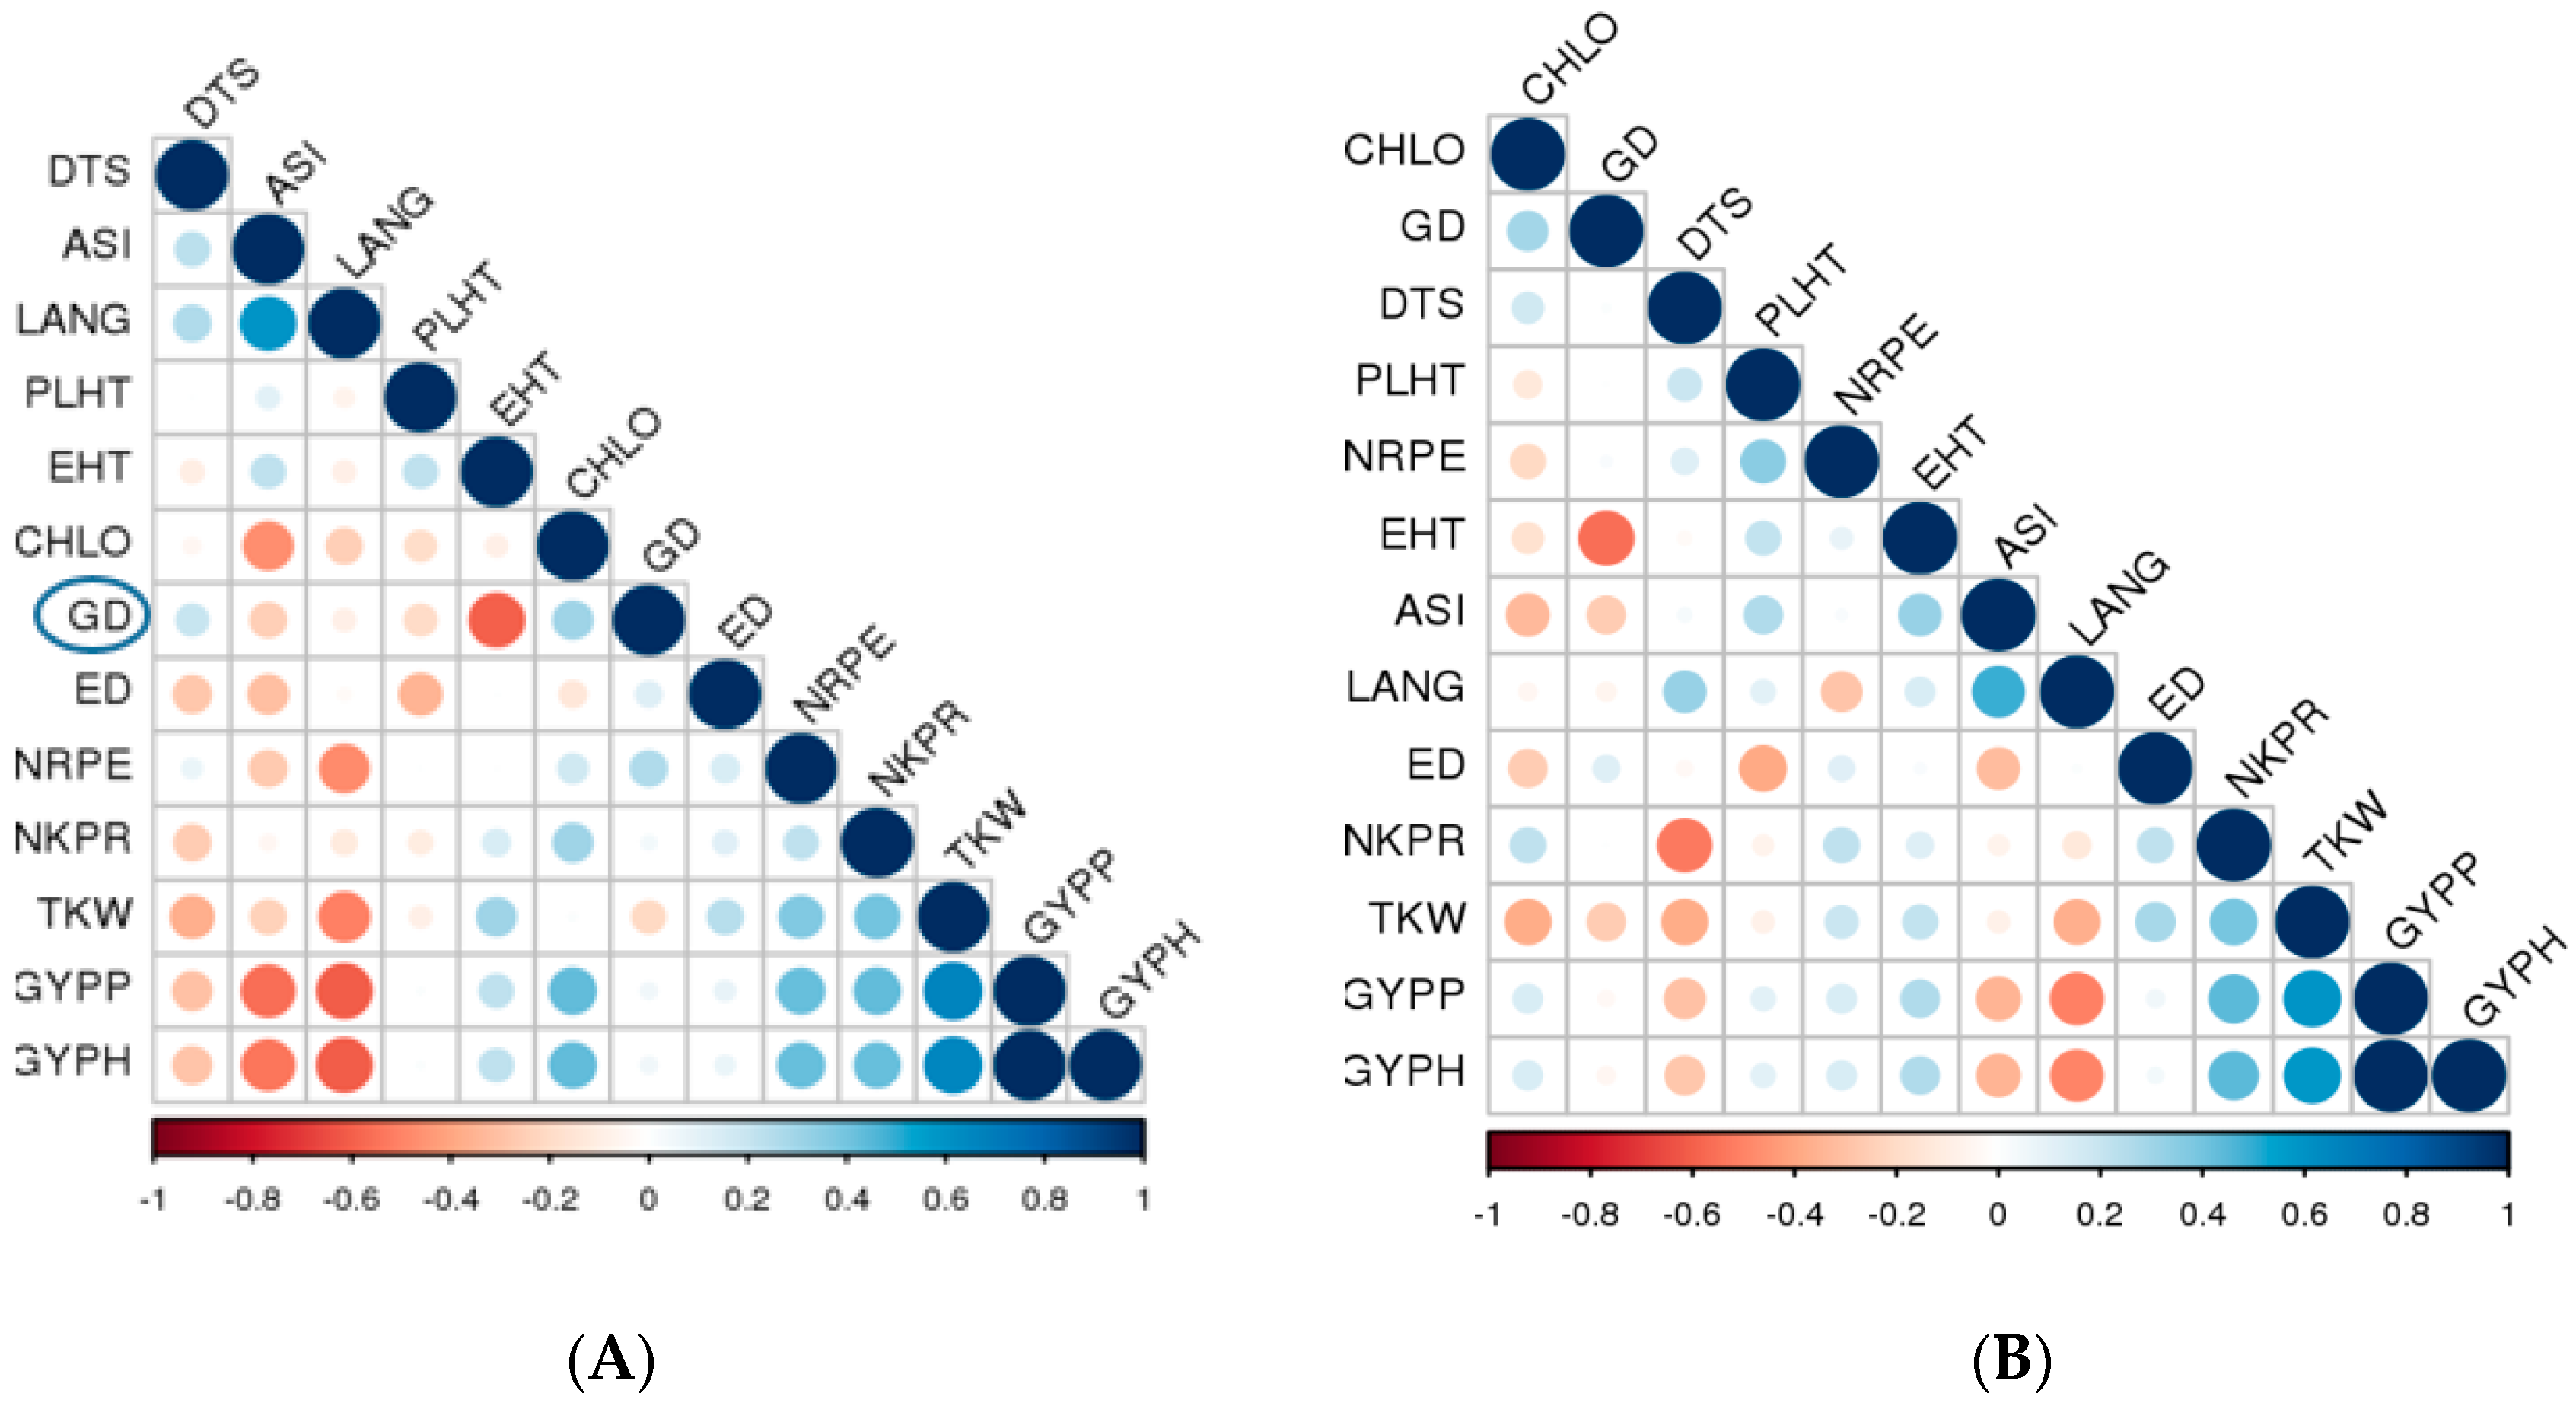
2.7. Association between Genetic Distance, F1 Hybrid Performance and SCA
3. Discussion
3.1. Analysis of Variance and Hybrid Performance
3.2. GCA and SCA Estimates
3.3. SSR Polymorphisms, Genetic Distance (GD) and Cluster Analysis
3.4. Association between Genetic Distance, F1 Hybrid Performance and SCA
4. Conclusions
5. Materials and Methods
5.1. Plant Materials
5.2. Production and Evaluation of F1 Hybrids
5.3. Data Collection
5.4. Molecular Analysis
5.4.1. DNA Isolation
5.4.2. SSR Primers and PCR Amplification
5.5. Statistical Analysis
5.6. SSR Data Analysis
Supplementary Materials
Author Contributions
Funding
Acknowledgments
Conflicts of Interest
References
- Elmyhun, M.; Liyew, C.; Shita, A.; Andualem, M. Combining ability performance and heterotic grouping of maize (Zea mays) inbred lines in testcross formation in Western Amhara, North West Ethiopia. Cogent Food Agric. 2020, 6, 1727625. [Google Scholar] [CrossRef]
- FAOSTAT. Food and Agriculture Organization of the United Nations Statistics Division. Available online: http://faostat.fao.org/site/567/DesktopDefault.aspx (accessed on 23 February 2020).
- Zohry, A.; Ouda, S.; Noreldin, T. Solutions for maize production consumption gap in Egypt. In Proceedings of the 4th African Regional ICID Conference, Aswan, Egypt, 26–28 April 2016; pp. 24–28. [Google Scholar]
- Abdelaal, H.S.A.; McFadden, D.T. Grains production prospects and long run food security in Egypt. Sustainability 2019, 11, 4457. [Google Scholar] [CrossRef] [Green Version]
- Shao, H.; Shi, D.; Shi, W.; Ban, X.; Chen, Y.; Ren, W.; Chen, F.; Mi, G. Nutrient accumulation and remobilization in relation to yield formation at high planting density in maize hybrids with different senescent characters. Arch. Agron. Soil Sci. 2020, 1–17. [Google Scholar] [CrossRef]
- Zhao, J.R.; Wang, R.H. Factors promoting the steady increase of American maize production and their enlightenments for China. J. Maize Sci. 2009, 17, 156–159. [Google Scholar]
- Al-Naggar, A.; Atta, M. Elevated plant density effects on performance and genetic parameters controlling maize (Zea mays L.) agronomic traits. J. Adv. Biol. Biotechnol. 2017, 12, 1–20. [Google Scholar] [CrossRef]
- Andrade, F.H.; Vega, C.R.; Uhart, S.; Cirilo, A.; Cantarero, M.; Valentinuz, O. Kernel number determination in maize. Crop. Sci. 1999, 39, 453–459. [Google Scholar] [CrossRef]
- Edmeades, G.O.; Bolaños, J.; Elings, A.; Ribaut, J.M.; Banziger, M.; Westgate, M.E.; Westgate, M.; Boote, K. The role and regulation of the anthesis-silking interval in maize. Physiol. Model. Kernel Set Maize 2015, 29, 43–73. [Google Scholar] [CrossRef]
- Sangoi, L.; Gracietti, M.; Rampazzo, C.; Bianchetti, P. Response of Brazilian maize hybrids from different eras to changes in plant density. Field Crop. Res. 2002, 79, 39–51. [Google Scholar] [CrossRef]
- Echarte, L.; Luque, S.L.; Andrade, F.H.; Sadras, V.; Cirilo, A.; Otegui, M.E.; Vega, C.R. Response of maize kernel number to plant density in Argentinean hybrids released between 1965 and 1993. Field Crop. Res. 2000, 68, 1–8. [Google Scholar] [CrossRef]
- Al-Naggar, A.; Shabana, R.A.; Atta, M.M.; Al-Khalil, T.H.; Al-Naggar, A.M.M. Maize response to elevated plant density combined with lowered N-fertilizer rate is genotype-dependent. Crop. J. 2015, 3, 96–109. [Google Scholar] [CrossRef] [Green Version]
- Al-Naggar, A.M.M.; Atta, M.M.; Ahmed, M.; Younis, A. Mean performance, heterobeltiosis and combining ability of corn (Zea mays L.) agronomic and yield traits under elevated plant density. J. Appl. Life Sci. Int. 2016, 7, 1–20. [Google Scholar] [CrossRef] [PubMed]
- Hammer, G.L.; Dong, Z.; McLean, G.; Doherty, A.; Messina, C.; Schussler, J.; Zinselmeier, C.; Paszkiewicz, S.; Cooper, M. Can changes in canopy and/or root system architecture explain historical maize yield trends in the U.S. corn belt? Crop. Sci. 2009, 49, 299–312. [Google Scholar] [CrossRef]
- Tokatlidis, I.; Koutroubas, S. A review of maize hybrids’ dependence on high plant populations and its implications for crop yield stability. Field Crop. Res. 2004, 88, 103–114. [Google Scholar] [CrossRef]
- Ruffo, M.L.; Gentry, L.; Henninger, A.S.; Seebauer, J.R.; Below, F.E. Evaluating management factor contributions to reduce corn yield gaps. Agron. J. 2015, 107, 495–505. [Google Scholar] [CrossRef] [Green Version]
- Mageto, E.K.; Makumbi, D.; Njoroge, K.; Nyankanga, R. Genetic analysis of early-maturing maize (Zea mays L.) inbred lines under stress and nonstress conditions. J. Crop. Improv. 2017, 31, 560–588. [Google Scholar] [CrossRef]
- Kamara, M.M.; El-Degwy, I.S.; Koyama, H. Estimation combining ability of some maize inbred lines using line x tester mating design under two nitrogen levels. Aust. J. Crop Sci. 2014, 8, 1336. [Google Scholar]
- Carena, M.J.; Hallauer, A.R.; Filho, J.M. Quantitative Genetics in Maize Breeding; Springer: New York, NY, USA, 2010. [Google Scholar]
- Henry, W.B.; Blanco, M.H.; Rowe, D.E.; Windham, G.L.; Murray, S.C.; Williams, W.P. Diallel analysis of diverse maize germplasm lines for agronomic characteristics. Crop. Sci. 2014, 54, 2547–2556. [Google Scholar] [CrossRef]
- Sughroue, J.R.; Hallauer, A.R. Analysis of the diallel mating design for maize inbred lines. Crop. Sci. 1997, 37, 400–405. [Google Scholar] [CrossRef]
- Zhang, Y.; Fan, X.; Yao, W.; Piepho, H.P.; Kang, M.S. Diallel analysis of four maize traits and a modified heterosis hypothesis. Crop. Sci. 2016, 56, 1115–1126. [Google Scholar] [CrossRef] [Green Version]
- Sprague, G.F.; Tatum, L.A. General vs. specific combining ability in single crosses of corn1. Agron. J. 1942, 34, 923–932. [Google Scholar] [CrossRef]
- Al-Naggar, A.; Atta, M.; Shabana, R.; Al-Khalil, T. Heterosis and type of gene action for some adaptive traits to high plant density in maize. Egypt. J. Plant. Breed. 2014, 18, 189–209. [Google Scholar] [CrossRef]
- Mason, L.; Zuber, M.S. Diallel analysis of maize for leaf angle, leaf area, yield, and yield components 1. Crop. Sci. 1976, 16, 693–696. [Google Scholar] [CrossRef]
- Badu-Apraku, B.; Oyekunle, M.; Fakorede, M.A.B.; Vroh, I.; Akinwale, R.O.; Aderounmu, M. Combining ability, heterotic patterns and genetic diversity of extra-early yellow inbreds under contrasting environments. Euphytica 2013, 192, 413–433. [Google Scholar] [CrossRef]
- Akinwale, R.; Badu-Apraku, B.; Fakorede, M.; Vroh-Bi, I. Heterotic grouping of tropical early-maturing maize inbred lines based on combining ability in Striga-infested and Striga-free environments and the use of SSR markers for genotyping. Field Crop. Res. 2014, 156, 48–62. [Google Scholar] [CrossRef]
- Akaogu, I.C.; Badu-Apraku, B.; Adetimirin, V.O.; Vroh-Bi, I.; Oyekunle, M.; Akinwale, R.O. Genetic diversity assessment of extra-early maturing yellow maize inbreds and hybrid performance in Striga-infested and Striga-free environments. J. Agric. Sci. 2013, 151, 519–537. [Google Scholar] [CrossRef]
- Nyaligwa, L.; Hussein, S.; Amelework, B.; Ghebrehiwot, H. Genetic diversity analysis of elite maize inbred lines of diverse sources using SSR markers. Maydica 2015, 60, M29. [Google Scholar]
- Sserumaga, J.P.; Ji, H.; Njoroge, K.; Muthomi, J.; Chemining’wa, G.; Si-myung, L.; Kim, H.; Asea, G.; Makumbi, D. Molecular characterization of tropical maize inbred lines using microsatellite DNA markers. Maydica 2014, 59, 267–274. [Google Scholar]
- Phumichai, C.; Doungchan, W.; Puddhanon, P.; Jampatong, S.; Grudloyma, P.; Kirdsri, C.; Chunwongse, J.; Pulam, T. SSR-based and grain yield-based diversity of hybrid maize in Thailand. Field Crop. Res. 2008, 108, 157–162. [Google Scholar] [CrossRef]
- Singh, P. Genetic distance, heterosis and combing ability studies in maize for predicting F1 hybrid performance. Sabrao J. Breed. Genet. 2015, 47, 21–28. [Google Scholar]
- Dhliwayo, T.; Pixley, K.; Menkir, A.; Warburton, M. Combining ability, genetic distances, and heterosis among elite CIMMYT and IITA tropical maize inbred lines. Crop. Sci. 2009, 49, 1201–1210. [Google Scholar] [CrossRef]
- Menkir, A.; Melake-Berhan, A.; The, C.; Ingelbrecht, I.; Adepoju, A. Grouping of tropical mid-altitude maize inbred lines on the basis of yield data and molecular markers. Theor. Appl. Genet. 2004, 108, 1582–1590. [Google Scholar] [CrossRef] [PubMed]
- Lashkari, M.; Madani, H.; Ardakani, M.R.; Golzardi, F.; Zargari, K. Effect of plant density on yield and yield components of different corn (Zea mays L.) hybrids. Am-Euras J. Agric. Environ. Sci. 2011, 10, 450–457. [Google Scholar]
- Mansfield, B.D.; Mumm, R.H. Survey of plant density tolerance in U.S. maize germplasm. Crop. Sci. 2014, 54, 157–173. [Google Scholar] [CrossRef] [Green Version]
- Trachsel, S.; Vicente, F.M.S.; Suarez, E.A.; Rodriguez, C.S.; Atlin, G.N. Effects of planting density and nitrogen fertilization level on grain yield and harvest index in seven modern tropical maize hybrids (Zea mays L.). J. Agric. Sci. 2015, 154, 689–704. [Google Scholar] [CrossRef]
- Kamara, A.Y.; Menkir, A.; Abubakar, A.W.; Tofa, A.I.; Ademulegun, T.D.; Omoigui, L.O.; Kamai, N. Maize hybrids response to high plant density in the Guinea savannah of Nigeria. J. Crop. Improv. 2020, 1–20. [Google Scholar] [CrossRef]
- Abd El-Aty, M.; El-Hity, M.; Amer, E.; El-Mouslhy, T. Selection of maize (Zea mays) hybrids for plant density tolerance. Indian J. Agric. Sci. 2019, 89, 951–957. [Google Scholar]
- Makumbi, D.; Betrán, J.F.; Bänziger, M.; Ribaut, J.M. Combining ability, heterosis and genetic diversity in tropical maize (Zea mays L.) under stress and non-stress conditions. Euphytica 2011, 180, 143–162. [Google Scholar] [CrossRef]
- Badu-Apraku, B.; Oyekunle, M. Genetic analysis of grain yield and other traits of extra-early yellow maize inbreds and hybrid performance under contrasting environments. Field Crop. Res. 2012, 129, 99–110. [Google Scholar] [CrossRef]
- Liu, W.; Tollenaar, M. Response of yield heterosis to increasing plant density in maize. Crop. Sci. 2009, 49, 1807–1816. [Google Scholar] [CrossRef]
- Tollenaar, M.; Wu, J. Yield improvement in temperate maize is attributable to greater stress tolerance. Crop. Sci. 1999, 39, 1597–1604. [Google Scholar] [CrossRef]
- Van Averbeke, W.; Marais, J.N. Maize response to plant population and soil water supply: I. Yield of grain and total above-ground biomass. S. Afr. J. Plant. Soil 1992, 9, 186–192. [Google Scholar] [CrossRef] [Green Version]
- Tang, L.; Ma, W.; Noor, M.A.; Li, L.; Hou, H.; Zhang, X.; Zhao, M. Density resistance evaluation of maize varieties through new “Density–Yield Model” and quantification of varietal response to gradual planting density pressure. Sci. Rep. 2018, 8, 1–16. [Google Scholar] [CrossRef] [PubMed]
- Hashemi, A.M.; Herbert, S.J.; Putnam, D.H. Yield response of corn to crowding stress. Agron. J. 2005, 97, 839–846. [Google Scholar] [CrossRef]
- Ren, B.; Liu, W.; Zhang, J.; Dong, S.; Liu, P.; Zhao, B. Effects of plant density on the photosynthetic and chloroplast characteristics of maize under high-yielding conditions. Sci. Nat. 2017, 104, 12. [Google Scholar] [CrossRef]
- Gou, L.; Xue, J.; Qi, B.; Ma, B.; Zhang, W. Morphological variation of maize cultivars in response to elevated plant densities. Agron. J. 2017, 109, 1443–1453. [Google Scholar] [CrossRef]
- Sangoi, L. Understanding plant density effects on maize growth and development: An important issue to maximize grain yield. Ciência Rural 2001, 31, 159–168. [Google Scholar] [CrossRef] [Green Version]
- Al-Naggar, A.; Shabana, R.; Hassanein, M.S.; Elewa, T.A.; Younis, A.; Metwally, A. Secondary traits and selection environment of plant density tolerance in maize inbreds and testcrosses. J. Adv. Biol. Biotechnol. 2017, 14, 1–13. [Google Scholar] [CrossRef]
- Gyenes-Hegyi, Z.; Pók, I.; Kizmus, L.; Al, E. Plant height and height of the main ear in maize (Zea mays L.) at different locations and different plant densities. Acta Agron. Hung. 2002, 50, 75–84. [Google Scholar] [CrossRef]
- Carena, M.; Cross, H. Plant density and maize germplasm improvement in the northern Corn Belt. Maydica 2003, 48, 105–111. [Google Scholar]
- Tollenaar, M.; Lee, E. Yield potential, yield stability and stress tolerance in maize. Field Crop. Res. 2002, 75, 161–169. [Google Scholar] [CrossRef]
- Duvick, D.N. The Contribution of Breeding to Yield Advances in maize (Zea mays L.). Adv. Agron. 2005, 86, 83–145. [Google Scholar] [CrossRef]
- Obeng-Bio, E.; Badu-Apraku, B.; Ifie, B.E.; Danquah, A.; Blay, E.T.; Annor, B. Genetic analysis of grain yield and agronomic traits of early provitamin A quality protein maize inbred lines in contrasting environments. J. Agric. Sci. 2019, 157, 413–433. [Google Scholar] [CrossRef] [Green Version]
- Chiuta, N.E.; Charles, M.S. Combining ability of quality protein maize inbred lines for yield and morpho-agronomic traits under optimum as well as combined drought and heat-stressed conditions. Agronomy 2020, 10, 184. [Google Scholar] [CrossRef] [Green Version]
- Gissa, D.W.; Zelleke, H.; Labuschagne, M.T.; Hussien, T.; Singh, H. Heterosis and combining ability for grain yield and its components in selected maize inbred lines. S. Afr. J. Plant. Soil 2007, 24, 133–137. [Google Scholar] [CrossRef] [Green Version]
- Reif, J.C.; Gumpert, F.M.; Fischer, S.; Melchinger, A.E. Impact of interpopulation divergence on additive and dominance variance in hybrid populations. Genetics 2007, 176, 1931–1934. [Google Scholar] [CrossRef] [Green Version]
- Ejigu, Y.G.; Tongoona, P.B.; Ifie, B.E. General and specific combining ability studies of selected tropical white maize inbred lines for yield and yield related traits. Int. J. Agric. Res. Innov. Technol. 2017, 7, 381–396. [Google Scholar]
- Oppong, A.; Bedoya, C.A.; Ewool, M.B.; Asante, M.D.; Thomson, R.N.; Adu-Dapaah, H.; Lamptey, J.N.; Ofori, K.; Offei, S.K.; Warburton, M.L. Bulk genetic characterization of Ghanaian maize landraces using microsatellite markers. Maydica 2014, 59, 1–8. [Google Scholar]
- Oyekunle, M.; Badu-Apraku, B.; Hearne, S.; Franco, J. Genetic diversity of tropical early-maturing maize inbreds and their performance in hybrid combinations under drought and optimum growing conditions. Field Crop. Res. 2015, 170, 55–65. [Google Scholar] [CrossRef] [Green Version]
- Legesse, B.W.; Myburg, A.; Pixley, K.V.; Botha, A. Genetic diversity of African maize inbred lines revealed by SSR markers. Hereditas 2007, 144, 10–17. [Google Scholar] [CrossRef]
- Botstein, D.; White, R.L.; Skolnick, M.; Davis, R.W. Construction of a genetic linkage map in man using restriction fragment length polymorphisms. Am. J. Hum. Genet. 1980, 32, 314–331. [Google Scholar]
- Adu, G.B.; Awuku, F.; Amegbor, I.; Haruna, A.; Manigben, K.; Aboyadana, P. Genetic characterization and population structure of maize populations using SSR markers. Ann. Agric. Sci. 2019, 64, 47–54. [Google Scholar] [CrossRef]
- El-Esawi, M.; Germaine, K.J.; Bourke, P.; Malone, R. AFLP analysis of genetic diversity and phylogenetic relationships of Brassica oleracea in Ireland. Comptes Rendus Biol. 2016, 339, 163–170. [Google Scholar] [CrossRef] [PubMed]
- El-Esawi, M.; Alaraidh, I.A.; Alsahli, A.A.; Ali, H.M.; Alayafi, A.A.; Witczak, J.; Ahmad, M. Genetic variation and alleviation of salinity stress in barley (Hordeum vulgare L.). Molecules 2018, 23, 2488. [Google Scholar] [CrossRef] [PubMed] [Green Version]
- El-Esawi, M.; Al-Ghamdi, A.A.; Ali, H.M.; Alayafi, A.A.; Witczak, J.; Ahmad, M. Analysis of genetic variation and enhancement of salt tolerance in French pea (Pisum sativum L.). Int. J. Mol. Sci. 2018, 19, 2433. [Google Scholar] [CrossRef] [PubMed] [Green Version]
- El-Esawi, M. Genetic diversity and evolution of Brassica genetic resources: From morphology to novel genomic technologies—A review. Plant. Genet. Resour. 2016, 15, 388–399. [Google Scholar] [CrossRef]
- El-Esawi, M.; Sammour, R. Karyological and phylogenetic studies in the genus Lactuca L. (Asteraceae). Cytologia 2014, 79, 269–275. [Google Scholar] [CrossRef] [Green Version]
- El-Esawi, M.; Al-Ghamdi, A.A.; Ali, H.M.; Ahmad, M. Overexpression of AtWRKY30 transcription factor enhances heat and drought stress tolerance in wheat (Triticum aestivum L.). Genes 2019, 10, 163. [Google Scholar] [CrossRef] [Green Version]
- Vwioko, E.; Adinkwu, O.; El-Esawi, M.A. Comparative physiological, biochemical, and genetic responses to prolonged waterlogging stress in okra and maize given exogenous ethylene priming. Front. Physiol. 2017, 8, 632. [Google Scholar] [CrossRef]
- Xia, X.; Reif, J.; Hoisington, D.; Melchinger, A.; Frisch, M.; Warburton, M. Genetic diversity among CIMMYT maize inbred lines investigated with SSR markers. Crop. Sci. 2004, 44, 2230–2237. [Google Scholar] [CrossRef]
- Adebayo, M.A.; Menkir, A.; Gedil, M.; Blay, E.; Gracen, V.; Danquah, E.; Funmilayo, L. Diversity assessment of drought tolerant exotic and adapted maize (Zea mays L.) inbred lines with microsatellite markers. J. Crop. Sci. Biotechnol. 2015, 18, 147–154. [Google Scholar] [CrossRef]
- Bernardo, R. Relationship between single-cross performance and molecular marker heterozygosity. Theor. Appl. Genet. 1992, 83, 628–634. [Google Scholar] [CrossRef] [PubMed]
- Betran, F.; Beck, D.; Bänziger, M.; Edmeades, G. Genetic analysis of inbred and hybrid grain yield under stress and nonstress environments in tropical maize. Crop Sci. 2003, 43, 807–817. [Google Scholar] [CrossRef]
- Parentoni, S.; Magalhães, J.; Pacheco, C.; Santos, M.; Abadie, T.; Gama, E.; Guimarães, P.; Meirelles, W.; Lopes, M.; Vasconcelos, M.; et al. Heterotic groups based on yield-specific combining ability data and phylogenetic relationship determined by RAPD markers for 28 tropical maize open pollinated varieties. Euphytica 2001, 121, 197–208. [Google Scholar] [CrossRef]
- AOAC, C.A. Official Methods of Analysis of the Association of Analytical Chemists International; Official Methods: Gaithersburg, MD, USA, 2005. [Google Scholar]
- Doyle, J. DNA Protocols for plants. In Molecular Techniques in Taxonomy; Springer Science and Business Media LLC: New York, NY, USA, 1991; pp. 283–293. [Google Scholar]
- David, F.N.; Steel, R.G.D.; Torrie, J.H. Principles and Procedures of Statistics, A Biometrical Approach, 3rd ed.; McGraw Hill Inc. Book Co.: New York, NY, USA, 1997; pp. 352–358. [Google Scholar]
- Griffing, B. Concept of general and specific combining ability in relation to diallel crossing systems. Aust. J. Biol. Sci. 1956, 9, 463–493. [Google Scholar] [CrossRef]
- Zhang, Y.; Kang, M.S.; Lamkey, K.R. DIALLEL-SAS05: A comprehensive program for griffing’s and gardner-eberhart analyses. Agron. J. 2005, 97, 1097–1106. [Google Scholar] [CrossRef]
- Wei, T.; Simko, V.; Levy, M.; Xie, Y.; Jin, Y.; Zemla, J. Corrplot: Visualization of a Correlation Matrix. Available online: https://github.com/taiyun/corrplot (accessed on 15 December 2019).
- Jaccard, P. Nouvelles recherches sur la distribution florale. Bull. Soc. Vaud. Sci. Nat. 1908, 44, 223–270. [Google Scholar]


| SOV | DF | DTS | ASI | PLHT | EHT | LANG | CHLC |
| Locations (L) | 1 | 1114.26 ** | 12.87 ** | 16,592.96 ** | 6489.21 ** | 108.64 * | 400.29 ** |
| Rep (L) | 4 | 15.14 | 0.58 | 325.06 | 138.65 | 14.87 | 10.84 |
| Densities (D) | 2 | 1899.48 ** | 73.14 ** | 23,422.30 ** | 9384.04 ** | 603.65 ** | 1585.67 ** |
| L × D | 2 | 308.23 ** | 22.39 ** | 9852.25 ** | 5708.38 ** | 27.17 ** | 180.79 ** |
| Error a | 8 | 1.07 | 0.19 | 121.77 | 53.15 | 3.33 | 2.34 |
| Hybrids (H) | 27 | 28.04 ** | 7.89 ** | 6842.02 ** | 2056.81 ** | 425.82 ** | 119.32 ** |
| GCA | 7 | 57.16 ** | 12.03 ** | 11,397.27 ** | 2447.44 ** | 836.14 ** | 162.00 ** |
| SCA | 20 | 17.85 ** | 6.44 ** | 5247.69 ** | 1920.08 ** | 282.20 ** | 104.38 ** |
| H × L | 27 | 61.66 ** | 0.83 ** | 796.40 ** | 362.93 ** | 4.15 ** | 3.61 ** |
| GCA × L | 7 | 52.48 ** | 0.88 ** | 915.53 ** | 309.35 ** | 3.16 | 3.57 |
| SCA × L | 20 | 64.88 ** | 0.81 ** | 754.71 ** | 381.68 ** | 4.49 ** | 3.62 * |
| H × D | 54 | 5.01 ** | 0.31 ** | 254.88 ** | 60.51 ** | 4.57 ** | 10.19 ** |
| GCA × D | 14 | 4.54 ** | 0.30 ** | 212.94 ** | 78.99 * | 6.63 ** | 19.13 ** |
| SCA × D | 40 | 5.18 ** | 0.31 ** | 269.56 ** | 54.03 | 3.85 | 7.06 ** |
| H × D × L | 54 | 63.25 ** | 0.88 ** | 592.24 ** | 397.54 ** | 4.11 * | 4.30 ** |
| GCA × L × D | 14 | 64.03 ** | 0.86 ** | 544.25 ** | 363.40 ** | 3.90 | 2.64 |
| SCA × L × D | 40 | 62.97 ** | 0.88 ** | 609.03 ** | 409.48 ** | 4.19 * | 4.88 ** |
| Error b | 324 | 0.81 | 0.14 | 84.07 | 42.33 | 2.69 | 1.93 |
| GCA/SCA | 3.20 | 1.87 | 2.17 | 1.27 | 2.96 | 1.55 | |
| SOV | DF | ED | NRPE | NKPR | TKW | GYPP | GYPH |
| Locations (L) | 1 | 2.09 * | 36.35 ** | 353.21 ** | 8232.88 ** | 12,079.40 ** | 40.40 ** |
| Rep (L) | 4 | 0. 26 | 1.35 | 12.53 | 225.52 | 285.31 | 0.78 |
| Densities (D) | 2 | 21.93 ** | 88.74 ** | 2229.25 ** | 91,176.13 ** | 50,563.13 ** | 58.38 ** |
| L × D | 2 | 1.78 ** | 6.33 ** | 331.20 ** | 3151.63 ** | 14,971.59 ** | 54.39 ** |
| Error a | 8 | 0.18 | 0.52 | 3.09 | 192.11 | 56.68 | 0.30 |
| Hybrids (H) | 27 | 1.01 ** | 8.75 ** | 56.88 ** | 10,944.20 ** | 9941.33 ** | 49.21 ** |
| GCA | 7 | 1.07 ** | 16.50 ** | 41.59 ** | 12,835.71 ** | 13,527.67 ** | 67.17 ** |
| SCA | 20 | 0.99 ** | 6.04 ** | 62.24 ** | 10,282.17 ** | 8686.11 ** | 42.93 ** |
| H × L | 27 | 1.25 ** | 18.90 ** | 21.01 ** | 2126.28 ** | 1230.60 ** | 4.24 ** |
| GCA × L | 7 | 1.56 ** | 20.27 ** | 17.14 ** | 2328.04 ** | 1621.69 ** | 5.61 ** |
| SCA × L | 20 | 1.14 ** | 18.42 ** | 22.36 ** | 2055.67 ** | 1093.72 ** | 3.75 ** |
| H × D | 54 | 0.20 ** | 0.98 ** | 8.77 ** | 360.55 ** | 187.93 ** | 0.71 ** |
| GCA × D | 14 | 0.24 | 1.45 ** | 10.49 ** | 560.46 ** | 166.93 ** | 0.73 ** |
| SCA × D | 40 | 0.19 | 0.82 ** | 8.17 ** | 290.58 ** | 195.28 ** | 0.70 ** |
| H × D × L | 54 | 1.27 ** | 13.20 ** | 16.84 ** | 621.87 ** | 1517.64 ** | 5.45 ** |
| GCA × L × D | 14 | 1.45 ** | 11.20 ** | 19.16 ** | 529.08 ** | 1951.52 ** | 6.99 ** |
| SCA × L × D | 40 | 1.21 ** | 13.89 ** | 16.02 ** | 654.34 ** | 1365.78 ** | 4.91 ** |
| Error b | 324 | 0.15 | 0.38 | 2.41 | 143.75 | 45.22 | 0.25 |
| GCA/SCA | 1.08 | 2.73 | 0.67 | 1.25 | 1.56 | 1.57 |
| Trait | Parameter | D1 | D2 | D3 | |||
|---|---|---|---|---|---|---|---|
| Value | Hybrid | Value | Hybrid | Value | Hybrid | ||
| DTS | Minimum | 56.17 | L1 × L3 | 58.50 | L3 × L4 | 62.52 | L1 × L4 |
| Maximum | 61.50 | L6 × L8 | 65.00 | L6 × L8 | 67.60 | L3 × L6 | |
| Mean | 58.22 | 61.19 | 64.80 | ||||
| ASI | Minimum | 2.15 | L2 × L5 | 2.28 | L2 × L5 | 3.12 | L2 × L5 |
| Maximum | 4.65 | L3 × L7 | 5.20 | L3 × L7 | 5.65 | L3 × L7 | |
| Mean | 3.26 | 3.68 | 4.56 | ||||
| PLHT (cm) | Minimum | 203.17 | L2 × L6 | 206.00 | L2 × L6 | 213.35 | L2 × L6 |
| Maximum | 283.00 | L4 × L7 | 290.63 | L2 × L4 | 304.35 | L4 × L7 | |
| Mean | 240.12 | 249.20 | 263.52 | ||||
| EHT (cm) | Minimum | 104.32 | L3 × L6 | 109.49 | L2 × L6 | 116.42 | L2 × L6 |
| Maximum | 144.14 | L6 × L7 | 151.23 | L6 × L7 | 160.29 | L6 × L7 | |
| Mean | 117.86 | 125.68 | 133.02 | ||||
| LANG (°) | Minimum | 25.70 | L4 × L5 | 24.40 | L4 × L5 | 22.00 | L4 × L5 |
| Maximum | 45.35 | L3 × L7 | 42.30 | L3 × L7 | 39.05 | L3 × L7 | |
| Mean | 34.03 | 32.00 | 30.21 | ||||
| CHLC (SPAD unit) | Minimum | 44.37 | L7 × L8 | 41.80 | L7 × L8 | 39.39 | L7 × L8 |
| Maximum | 54.50 | L2 × L8 | 53.13 | L2 × L8 | 50.20 | L2 × L8 | |
| Mean | 50.34 | 47.59 | 44.23 | ||||
| ED (cm) | Minimum | 4.70 | L1 × L7 | 4.20 | L2 × L4 | 3.60 | L2 × L4 |
| Maximum | 5.80 | L1 × L8 | 5.15 | L1 × L3 | 5.00 | L1 × L4 | |
| Mean | 5.16 | 4.76 | 4.44 | ||||
| NRPE | Minimum | 13.00 | L3 × L7 | 12.30 | L3 × L4 | 12.18 | L1 × L3 |
| Maximum | 16.40 | L2 × L5 | 15.20 | L1 × L5 | 14.70 | L1 × L5 | |
| Mean | 14.83 | 13.91 | 13.37 | ||||
| NKPR | Minimum | 35.20 | L1 × L5 | 34.00 | L1 × L5 | 30.29 | L1 × L5 |
| Maximum | 45.10 | L2 × L8 | 42.00 | L2 × L8 | 37.95 | L2 × L8 | |
| Mean | 40.28 | 37.31 | 33.12 | ||||
| TKW (g) | Minimum | 315.00 | L3 × L8 | 291.00 | L5 × L6 | 276.00 | L5 × L7 |
| Maximum | 405.00 | L2 × L8 | 374.00 | L1 × L4 | 353.50 | L1 × L4 | |
| Mean | 356.00 | 333.24 | 309.26 | ||||
| GYPP (g) | Minimum | 130.88 | L3 × L7 | 122.71 | L3 × L8 | 103.75 | L3 × L7 |
| Maximum | 236.45 | L2 × L8 | 215.01 | L2 × L8 | 187.44 | L2 × L8 | |
| Mean | 170.11 | 153.78 | 135.09 | ||||
| GYPH ( t ha−1) | Minimum | 7.79 | L3 × L7 | 8.76 | L3 × L8 | 8.78 | L3 × L7 |
| Maximum | 14.07 | L2 × L8 | 15.35 | L2 × L8 | 15.61 | L2 × L8 | |
| Mean | 10.12 | 10.98 | 11.26 | ||||
| Inbred Line | DTS | ASI | PLHT | EHT | ||||||||
| D1 | D2 | D3 | D1 | D2 | D3 | D1 | D2 | D3 | D1 | D2 | D3 | |
| L1 | −0.84 ** | −0.94 ** | −1.08 ** | −0.27 ** | −0.26 ** | −0.16 ** | −7.22 ** | −10.48 ** | −3.92 ** | 10.29 ** | 8.20 ** | 5.43 ** |
| L2 | −0.21 | −0.27 | 0.07 | −0.28 ** | −0.31 ** | −0.30 ** | −0.90 | −2.58 | −7.66 ** | −1.35 | −1.28 | −1.54 |
| L3 | −0.62 ** | −0.81 ** | −0.38 ** | 0.43 ** | 0.48 ** | 0.37 ** | −3.52 * | −1.12 | −4.93 ** | −3.74 ** | −4.22 ** | −3.03 ** |
| L4 | −0.74 ** | −0.60 ** | −0.20 | −0.05 | −0.09 | −0.23 ** | 18.43 ** | 24.20 ** | 22.27 ** | 1.48 | 3.60 ** | 4.25 ** |
| L5 | 0.62 ** | 0.34 * | −0.56 ** | −0.31 ** | −0.43 ** | −0.30 ** | −4.29 ** | −3.48 * | −2.93 * | −4.21 ** | −6.60 ** | −6.32 ** |
| L6 | 1.28 ** | 1.49 ** | 1.32 ** | 0.65 ** | 0.58 ** | 0.42 ** | −8.60 ** | −9.06 ** | −5.94 ** | 1.38 | 1.93 | 3.43 ** |
| L7 | 0.09 | 0.30 * | 0.95 ** | 0.02 | 0.14 * | 0.13 * | 10.17 ** | 8.45 ** | 9.75 ** | 3.13 ** | 3.12 ** | 1.33 |
| L8 | 0.43 ** | 0.49 ** | −0.12 | −0.19 ** | −0.11 * | 0.07 | −4.05 ** | −5.94 ** | −6.64 ** | −6.99 ** | −4.75 ** | −3.55 ** |
| LSD 0.05 | 0.28 | 0.11 | 2.82 | 2.00 | ||||||||
| LSD 0.01 | 0.36 | 0.15 | 3.70 | 2.63 | ||||||||
| Inbred Line | LANG | CHLC | ED | NRPE | ||||||||
| D1 | D2 | D3 | D1 | D2 | D3 | D1 | D2 | D3 | D1 | D2 | D3 | |
| L1 | −2.31 ** | −2.55 ** | −3.35 ** | 0.07 | 0.80 ** | 2.13 ** | 0.13 * | 0.08 | 0.20 ** | −0.14 | 0.33 ** | 0.45 ** |
| L2 | −1.81 ** | −1.62 ** | −0.92 ** | 1.72 ** | 2.58 ** | 3.18 ** | 0.11 | −0.08 | −0.19 ** | 0.39 ** | 0.43 ** | 0.50 ** |
| L3 | 5.51 ** | 5.71 ** | 5.63 ** | −1.13 ** | −1.32 ** | −0.74 ** | −0.02 | 0.13 * | 0.06 | −0.73 ** | −0.55 ** | −0.51 ** |
| L4 | −3.77 ** | −2.92 ** | −2.87 ** | −0.20 | −0.42 | −1.20 ** | 0.04 | −0.03 | −0.06 | 0.13 | −0.29 ** | −0.19 * |
| L5 | −0.62 * | −0.13 | −0.75 ** | 1.19 ** | −0.38 | 0.16 | −0.09 | 0.02 | −0.02 | 0.42 ** | 0.27 ** | 0.16 |
| L6 | 0.84 ** | 0.55 * | 1.34 ** | −0.44 * | −0.61 ** | −1.81 ** | −0.21 ** | −0.11 | −0.06 | 0.16 | −0.07 | −0.08 |
| L7 | 1.74 ** | 1.18 ** | 1.15 ** | −0.97 ** | 0.00 | −1.34 ** | −0.13 * | −0.12 * | −0.07 | −0.72 ** | −0.52 ** | −0.37 ** |
| L8 | 0.42 | −0.21 | −0.23 | −0.24 | −0.66 ** | −0.38 | 0.17 ** | 0.09 | 0.13 * | 0.48 ** | 0.40 ** | 0.04 |
| LSD 0.05 | 0.50 | 0.43 | 0.12 | 0.19 | ||||||||
| LSD 0.01 | 0.66 | 0.56 | 0.15 | 0.25 | ||||||||
| Inbred Line | NKPR | TKW | GYPP | GYPH | ||||||||
| D1 | D2 | D3 | D1 | D2 | D3 | D1 | D2 | D3 | D1 | D2 | D3 | |
| L1 | −0.55 * | −0.14 | 0.58 * | 12.63 ** | 16.08 ** | 17.98 ** | 12.19 ** | 9.92 ** | 8.79 ** | 0.73 ** | 0.71 ** | 0.73 ** |
| L2 | 1.47 ** | 1.06 ** | 1.15 ** | 18.79 ** | 16.50 ** | 10.23 ** | 19.20 ** | 19.23 ** | 15.67 ** | 1.14 ** | 1.37 ** | 1.30 ** |
| L3 | 0.68 ** | −0.55 * | −1.17 ** | −17.88 ** | −10.58 ** | −6.60 ** | −16.55 ** | −16.58 ** | −16.95 ** | −0.98 ** | −1.18 ** | −1.39 ** |
| L4 | −0.62 * | 0.08 | −0.71 ** | 6.63 ** | 3.75 * | 1.81 | −3.93 ** | 0.90 | −0.58 | −0.23 ** | 0.06 | −0.05 |
| L5 | −1.43 ** | −0.73 ** | −0.48 * | 0.46 | −3.08 | −5.10 ** | 6.92 ** | 4.29 ** | 4.19 ** | 0.41 ** | 0.31 ** | 0.34 ** |
| L6 | −0.27 | 0.46 | 0.62 * | −5.21 ** | −2.58 | 4.73 * | −13.70 ** | −10.97 ** | −7.49 ** | −0.82 ** | −0.78 ** | −0.63 ** |
| L7 | 0.56 * | −0.01 | 0.05 | −9.04 ** | −13.08 ** | −13.27 ** | −4.05 ** | −4.52 ** | −6.16 ** | −0.24 ** | −0.32 ** | −0.50 ** |
| L8 | 0.15 | −0.17 | −0.05 | −6.38 ** | −7.00 ** | −9.77 ** | −0.08 | −2.27 * | 2.53 * | 0.00 | −0.16 * | 0.21 ** |
| LSD 0.05 | 0.48 | 3.68 | 2.07 | 0.15 | ||||||||
| LSD 0.01 | 0.63 | 4.84 | 2.72 | 0.20 | ||||||||
| Cross | DTS | ASI | PLHT | EHT | LANG | CHLC | ||||||||||||
| D1 | D2 | D3 | D1 | D2 | D3 | D1 | D2 | D3 | D1 | D2 | D3 | D1 | D2 | D3 | D1 | D2 | D3 | |
| L1 × L2 | 0.10 | 0.36 | 0.28 | 0.09 | 0.19 | 0.53 ** | 8.70 ** | 8.46 ** | 13.08 ** | 16.34 ** | 14.76 ** | 18.45 ** | 3.69 ** | 4.89 ** | 4.69 ** | −1.90 ** | −2.68 ** | −3.97 ** |
| L1 × L3 | −0.49 | −0.42 | −0.53 | −0.15 | 0.31 * | 0.36 ** | 2.57 | 0.49 | −7.16 * | 7.82 ** | 11.21 ** | 9.69 ** | 3.13 ** | 3.19 ** | 3.64 ** | 0.27 | 0.95 * | 0.44 |
| L1 × L4 | −0.04 | −0.58 | −1.03 ** | 0.34 ** | 0.32 * | 0.42 ** | −40.63 ** | −36.93 ** | −29.11 ** | 6.74 ** | 1.02 | 1.82 | −1.29 * | −1.61 ** | −1.92 ** | −1.66 ** | −3.95 ** | −4.89 ** |
| L1 × L5 | 0.96 ** | 0.68 * | 1.41 ** | 0.04 | 0.08 | −0.10 | 9.59 ** | 5.85 | 19.69 ** | 9.58 ** | 9.28 ** | 6.62 ** | −2.74 ** | −3.20 ** | −3.79 ** | 0.45 | 1.01 * | 2.35 ** |
| L1 × L6 | −1.05 ** | −0.87 ** | −1.49 ** | −0.10 | −0.18 | −0.05 | 6.40 * | 7.94 * | 3.30 | −3.99 | −4.10 | −6.08 ** | −3.21 ** | −2.88 ** | −1.87 ** | 0.38 | 0.84 | 2.02 ** |
| L1 × L7 | 0.53 | 1.52 ** | 0.39 | −0.55 ** | −0.81 ** | −0.89 ** | 23.63 ** | 21.17 ** | 2.15 | −20.97 ** | −18.24 ** | −14.06 ** | −2.80 ** | −2.98 ** | −2.32 ** | 1.84 ** | 1.75 ** | 2.58 ** |
| L1 × L8 | −0.01 | −0.67 * | 0.97 ** | 0.33 ** | 0.08 | −0.27 * | −10.26 ** | −6.98 * | −1.95 | −15.52 ** | −13.93 ** | −16.44 ** | 3.22 ** | 2.58 ** | 1.57 ** | 0.61 | 2.09 ** | 1.46 ** |
| L2 × L3 | 1.21 ** | 2.26 ** | 1.16 ** | 0.74 ** | 0.65 ** | 0.72 ** | 22.50 ** | 34.10 ** | 35.82 ** | 5.48 * | 3.19 | 0.98 | 0.88 | 0.63 | −0.09 | −0.65 | −1.03 * | −0.57 |
| L2 × L4 | −0.67 * | −0.84 ** | −1.30 ** | 0.43 ** | 1.06 ** | 0.88 ** | 25.00 ** | 19.90 ** | 15.73 ** | 0.82 | 0.12 | −1.07 | 1.31 * | 0.26 | −0.60 | −0.91 | −0.10 | 0.39 |
| L2 × L5 | 1.98 ** | −0.44 | −0.09 | −0.53 ** | −0.66 ** | −0.83 ** | −10.73 ** | −10.14 ** | −5.97 | −3.86 | −2.44 | 2.48 | −2.74 ** | −1.93 ** | −1.52 ** | −0.97 * | 1.04 * | 0.04 |
| L2 × L6 | −0.68* | 0.15 | 0.83 ** | 0.01 | −0.10 | −0.03 | −27.25 ** | −31.46 ** | −36.41 ** | −12.74 ** | −16.48 ** | −18.13 ** | −0.71 | −2.44 ** | −1.03 | 1.66 ** | −1.53 ** | −0.52 |
| L2 × L7 | −1.10 ** | −1.15 ** | 0.50 | −0.30 * | −0.61 ** | −0.53 ** | −6.69 * | −6.98 * | −9.70 ** | −4.10 | 2.13 | −0.21 | 2.50 ** | 2.93 ** | 3.40 ** | 0.04 | 0.65 | 1.38 ** |
| L2 × L8 | −0.84 ** | −0.34 | −1.38 ** | −0.45 ** | −0.52 ** | −0.75 ** | −11.53 ** | −13.88 ** | −12.56 ** | −1.94 | −1.28 | −2.51 | −4.93 ** | −4.35 ** | −4.86 ** | 2.73 ** | 3.64 ** | 3.25 ** |
| L3 × L4 | 1.19 ** | −1.21 ** | 0.34 | −0.89 ** | −1.30 ** | −1.31 ** | −15.53 ** | −15.19 ** | −12.24 ** | 3.66 | 3.71 | −1.88 | −4.06 ** | −3.97 ** | −2.44 ** | 3.44 ** | 5.64 ** | 6.31 ** |
| L3 × L5 | −1.62 ** | −0.65 * | −1.04 ** | 0.61 ** | 0.77 ** | 0.62 ** | 5.89 | 3.14 | 0.11 | −3.62 | 1.51 | −0.31 | 1.89 ** | 1.74 ** | 1.24 * | −3.44 ** | −2.37 ** | −3.38 ** |
| L3 × L6 | −0.27 | −1.05 ** | 1.82 ** | −0.87 ** | −0.97 ** | −0.77 ** | 5.30 | −4.02 | 0.10 | −11.04 ** | −10.35 ** | −7.78 ** | −5.82 ** | −3.94 ** | −3.81 ** | −1.65 ** | −3.64 ** | −1.92 ** |
| L3 × L7 | 1.41 ** | 1.89 ** | −0.01 | 0.93 ** | 0.90 ** | 0.59 ** | −18.37 ** | −12.94 ** | −13.61 ** | −0.76 | −5.93 ** | −7.95 ** | 4.18 ** | 3.53 ** | 2.14 ** | 2.44 ** | 2.35 ** | 0.92 |
| L3 × L8 | −1.43 ** | −0.80 ** | −1.74 ** | −0.37 ** | −0.36 ** | −0.22 | −2.36 | −5.59 | −3.01 | −1.55 | −3.34 | 7.25 ** | −0.20 | −1.18 * | −0.67 | −0.42 | −1.89 ** | −1.81 ** |
| L4 × L5 | −1.10 ** | −0.06 | −0.17 | −0.47 ** | −0.36 ** | −0.40 ** | −1.56 | 4.05 | 9.83 ** | −1.54 | −3.17 | 0.54 | −3.82 ** | −4.42 ** | −3.97 ** | 0.05 | −0.77 | −1.00 * |
| L4 × L6 | −0.16 | 1.74 ** | 0.64 * | 0.02 | 0.33 * | 0.21 | 16.55 ** | 24.75 ** | 13.42 ** | −7.77 ** | −5.22 * | −2.11 | 6.61 ** | 7.69 ** | 6.35 ** | −2.34 ** | −0.54 | −1.15 * |
| L4 × L7 | −0.67 * | −0.82 ** | −0.88 ** | 0.34 ** | 0.01 | 0.25 | 14.48 ** | 7.99 * | 8.97 ** | −1.93 | −0.52 | 0.89 | −2.63 ** | −3.24 ** | −3.67 ** | −0.24 | −0.28 | −0.59 |
| L4 × L8 | 1.44 ** | 1.79 ** | 2.39 ** | 0.23 | −0.06 | −0.04 | 1.69 | −4.58 | −6.59 * | 0.03 | 4.06 | 1.81 | 3.88 ** | 5.28 ** | 6.25 ** | 1.66 ** | 0.01 | 0.92 |
| L5 × L6 | 0.49 | 0.05 | −1.49 ** | 0.03 | 0.02 | 0.11 | −5.53 | −7.57 * | −11.28 ** | −1.55 | −0.52 | 0.62 | 0.31 | 0.40 | −0.27 | 2.56 ** | 2.02 ** | 2.80 ** |
| L5 × L7 | −0.03 | 1.39 ** | 0.68 * | −0.27 * | −0.21 | −0.12 | −4.32 | −5.58 | −16.94 ** | 1.50 | −0.83 | −5.39 * | 3.57 ** | 3.94 ** | 5.21 ** | 0.09 | −0.99 * | −0.47 |
| L5 × L8 | −0.67 * | −0.95 ** | 0.70 * | 0.58 ** | 0.36 ** | 0.72 ** | 6.66 * | 10.24 ** | 4.57 | −0.51 | −3.83 | −4.56 * | 3.53 ** | 3.46 ** | 3.10 ** | 1.26 ** | 0.07 | −0.33 |
| L6 × L7 | 0.0 | −1.91 ** | −0.01 | 0.54 ** | 0.55 ** | 0.34 ** | −9.99 ** | −7.05 * | 20.23 ** | 21.93 ** | 20.87 ** | 22.87 ** | 1.75 ** | 1.39 * | 0.63 | 0.53 | 1.64 ** | −0.78 |
| L6 × L8 | 1.67 ** | 1.90 ** | −0.29 | 0.37 ** | 0.34 ** | 0.19 | 14.52 ** | 17.40 ** | 10.65 ** | 15.17 ** | 15.80 ** | 10.60 ** | 1.07 | −0.22 | 0.02 | −1.15 * | 1.20 * | −0.45 |
| L7 × L8 | −0.15 | −0.91 ** | −0.66 * | −0.69 ** | 0.18 | 0.36 ** | 1.26 | 3.38 | 8.90 ** | 4.33 | 2.52 | 3.85 | −6.57 ** | −5.56 ** | −5.40 ** | −4.70 ** | −5.11 ** | −3.04 ** |
| LSD 0.05 | 0.61 | 0.25 | 6.23 | 4.42 | 1.12 | 0.95 | ||||||||||||
| LSD 0.01 | 0.80 | 0.33 | 8.19 | 5.81 | 1.47 | 1.24 | ||||||||||||
| Cross | ED | NRPE | NKPR | TKW | GYPP | GYPH | ||||||||||||
| D1 | D2 | D3 | D1 | D2 | D3 | D1 | D2 | D3 | D1 | D2 | D3 | D1 | D2 | D3 | D1 | D2 | D3 | |
| L1 × L2 | −0.13 | −0.17 | −0.14 | −0.05 | −0.16 | −0.31 | −0.74 | −0.47 | −1.83 ** | 13.26 ** | 6.92 | 3.06 | 0.63 | −1.34 | −2.05 | 0.04 | −0.10 | −0.16 |
| L1 × L3 | 0.21 | 0.17 | −0.19 | −0.69 ** | −0.88 ** | −1.12 ** | −1.34 * | 0.43 | 1.38* | 3.93 | 2.00 | −6.11 | 16.42 ** | 10.99 ** | 10.06 ** | 0.98 ** | 0.78 ** | 0.82 ** |
| L1 × L4 | 0.32 * | 0.19 | 0.42 ** | 0.20 | 0.76 ** | 0.50 * | 0.96 | 0.97 | 0.03 | 27.43 ** | 21.67 ** | 24.48 ** | −24.25 ** | −22.70 ** | −18.21 ** | −1.44 ** | −1.62 ** | −1.51 ** |
| L1 × L5 | −0.34 ** | −0.07 | 0.11 | 0.42 * | 0.69 ** | 0.73 ** | −3.04 ** | −2.34 ** | −1.39 ** | −33.40 ** | −24.50 ** | −16.11 ** | 2.81 | 10.32 ** | 12.43 ** | 0.17 | 0.74 ** | 1.04 ** |
| L1 × L6 | 0.03 | 0.16 | 0.12 | −0.18 | −0.36 | −0.30 | 2.61 ** | 2.77 ** | 2.93 ** | 25.26 ** | 25.00 ** | 22.06 ** | 33.52 ** | 28.56 ** | 22.11 ** | 1.99 ** | 2.04 ** | 1.85 ** |
| L1 × L7 | −0.45 ** | −0.13 | −0.26 * | 0.25 | 0.29 | 0.15 | −0.63 | −2.06 ** | −1.10 * | −9.90 * | −10.50 * | −6.94 | −18.98 ** | −21.89 ** | −18.42 ** | −1.13 ** | −1.56 ** | −1.55 ** |
| L1 × L8 | 0.35 ** | −0.14 | −0.06 | 0.05 | −0.33 | 0.35 | 2.19 ** | 0.70 | −0.03 | −26.57 ** | −20.58 ** | −20.44 ** | −10.14 ** | −3.94 | −5.92 * | −0.60 ** | −0.28 | −0.49 ** |
| L2 × L3 | −0.05 | 0.08 | −0.31* | 0.74 ** | 0.82 ** | 1.05 ** | 2.53 ** | 0.28 | −2.66 ** | −12.24 ** | −7.42 | 1.14 | −15.69 ** | −15.14 ** | −6.32 ** | −0.93 ** | −1.08 ** | −0.54 ** |
| L2 × L4 | −0.51 ** | −0.46 ** | −0.59 ** | −1.02 ** | −0.04 | 0.02 | −2.07 ** | −1.56 ** | −0.02 | −12.74 ** | −9.75 * | −14.77 ** | −4.15 | 2.88 | 8.81 ** | −0.25 | 0.21 | 0.74 ** |
| L2 × L5 | 0.42 ** | 0.29 * | 0.57 ** | 0.79 ** | 0.39 | 0.18 | 0.00 | 1.13 * | 1.03 | 18.43 ** | 22.58 ** | 14.64 ** | 25.96 ** | 23.99 ** | 18.55 ** | 1.54 ** | 1.71 ** | 1.55 ** |
| L2 × L6 | −0.05 | −0.08 | 0.01 | −0.73 ** | −0.96 ** | −1.18 ** | −4.42 ** | −3.73 ** | −1.99 ** | −18.90 ** | −14.42 ** | −6.69 | −33.57 ** | −30.75 ** | −29.77 ** | −2.00 ** | −2.20 ** | −2.47 ** |
| L2 × L7 | 0.36 ** | 0.43 ** | 0.63 ** | 0.33 | −0.31 | −0.30 | 1.45 ** | 0.44 | 1.60 ** | −25.07 ** | −25.92 ** | −23.69 ** | −21.99 ** | −25.20 ** | −24.60 ** | −1.31 ** | −1.80 ** | −2.07 ** |
| L2 × L8 | −0.04 | −0.08 | −0.17 | −0.05 | 0.27 | 0.54 * | 3.26 ** | 3.90 ** | 3.88 ** | 37.26 ** | 28.00 ** | 26.31 ** | 48.82 ** | 45.56 ** | 35.39 ** | 2.90 ** | 3.25 ** | 2.95 ** |
| L3 × L4 | −0.18 | −0.06 | 0.16 | −0.41 | −0.76 ** | −0.47 * | 0.62 | −0.34 | 1.78 ** | 10.93 ** | 7.33 | −17.94 ** | 21.41 ** | 20.99 ** | 9.83 ** | 1.27 ** | 1.50 ** | 0.80 ** |
| L3 × L5 | −0.05 | 0.08 | 0.12 | −0.49 * | −0.12 | 0.19 | 2.83 ** | 2.38 ** | 0.60 | 27.10 ** | 15.17 ** | 22.98 ** | −15.18 ** | −17.28 ** | −14.84 ** | −0.90 ** | −1.23 ** | −1.25 ** |
| L3 × L6 | −0.12 | −0.09 | 0.36 ** | 1.07 ** | 0.72 ** | 0.93 ** | −0.33 | −0.91 | −1.05 | −2.24 | 4.67 | 5.14 | 16.68 ** | 10.35 ** | 14.54 ** | 0.99 ** | 0.74 ** | 1.20 ** |
| L3 × L7 | −0.01 | −0.18 | −0.12 | −0.36 | −0.03 | 0.11 | −2.86 ** | −0.35 | −0.18 | −11.40 ** | −10.83 ** | −0.86 | −17.02 ** | 1.01 | −6.99 ** | −1.01 ** | 0.07 | −0.48 ** |
| L3 × L8 | 0.19 | 0.01 | −0.02 | 0.14 | 0.25 | −0.69 ** | −1.44 ** | −1.49 ** | 0.12 | −16.07 ** | −10.92 ** | −4.36 | −6.61 ** | −10.93 ** | −6.29 ** | −0.39 * | −0.78 ** | −0.54 ** |
| L4 × L5 | 0.19 | 0.14 | −0.06 | −0.04 | 0.38 | 0.06 | −0.57 | −0.66 | 1.09 * | 22.60 ** | 29.83 ** | 38.56 ** | 31.54 ** | 18.23 ** | 14.79 ** | 1.88 ** | 1.30 ** | 1.24 ** |
| L4 × L6 | 0.22 | 0.18 | 0.08 | 0.21 | 0.46 * | 0.11 | 0.67 | 0.15 | −2.01 ** | 3.26 | 2.33 | 8.73 * | −9.18 ** | −6.02 ** | −5.72 * | −0.55 ** | −0.43 * | −0.47 ** |
| L4 × L7 | −0.07 | −0.16 | −0.11 | 0.78 ** | 0.21 | 0.29 | 1.84 ** | 1.72 ** | 0.26 | −23.90 ** | −22.17 ** | −19.27 ** | 12.90 ** | 5.74 * | 0.74 | 0.77 ** | 0.41 * | 0.05 |
| L4 × L8 | 0.03 | 0.18 | 0.09 | 0.28 | −1.01 ** | −0.52 * | −1.44 ** | −0.27 | −1.14 * | −27.57 ** | −29.25 ** | −19.77 ** | −28.26 ** | −19.12 ** | −10.25 ** | −1.68 ** | −1.37 ** | −0.85 ** |
| L5 × L6 | −0.05 | −0.18 | −0.36 ** | −0.38 | −0.91 ** | −0.23 | 1.38 * | 0.87 | 1.30 * | −32.57 ** | −35.83 ** | −31.86 ** | −21.29 ** | −10.90 ** | −12.19 ** | −1.27 ** | −0.78 ** | −1.01 ** |
| L5 × L7 | 0.06 | −0.07 | −0.14 | −0.90 ** | −0.86 ** | −0.91 ** | −1.65 ** | −1.07 * | −2.07 ** | −2.74 | −5.33 | −14.36 ** | −4.05 | 0.14 | 4.58 * | −0.24 | 0.01 | 0.36 * |
| L5 × L8 | −0.24 | −0.18 | −0.24 | 0.60 ** | 0.43 * | −0.02 | 1.06 * | −0.31 | −0.57 | 0.60 | −1.92 | −13.86 ** | −19.79 ** | −24.51 ** | −23.32 ** | −1.18 ** | −1.75 ** | −1.94 ** |
| L6 × L7 | 0.19 | −0.04 | −0.31 * | 0.46 * | 0.69 ** | 0.49 * | 2.79 ** | 2.35 ** | 2.28 ** | 32.93 ** | 29.17 ** | 17.81 ** | 23.51 ** | 18.01 ** | 22.66 ** | 1.40 ** | 1.29 ** | 1.87 ** |
| L6 × L8 | −0.21 | 0.05 | 0.09 | −0.45 * | 0.37 | 0.18 | −2.69 ** | −1.50 ** | −1.47 ** | −7.74 | −10.92 ** | −15.19 ** | −9.67 ** | −9.25 ** | −11.64 ** | −0.58 ** | −0.66 ** | −0.96 ** |
| L7 × L8 | −0.09 | 0.16 | 0.31 * | −0.57 ** | 0.02 | 0.16 | −0.93 | −1.03 | −0.79 | 40.10 ** | 45.58 ** | 47.31 ** | 25.64 ** | 22.19 ** | 22.03 ** | 1.53 ** | 1.58 ** | 1.82 ** |
| LSD 0.05 | 0.26 | 0.42 | 1.06 | 8.15 | 4.57 | 0.34 | ||||||||||||
| LSD 0.01 | 0.34 | 0.55 | 1.39 | 10.71 | 6.01 | 0.45 | ||||||||||||
| Marker | Ch. | Size Range (bp) | No. of Alleles | Major Allele Frequency | Gene Diversity | PIC |
|---|---|---|---|---|---|---|
| phi308707 | 1 | 125–140 | 2 | 0.63 | 0.47 | 0.36 |
| phi96100 | 2 | 150–200 | 2 | 0.88 | 0.22 | 0.19 |
| phi453121 | 3 | 150–200 | 2 | 0.50 | 0.50 | 0.38 |
| phi072 | 4 | 100–150 | 2 | 0.75 | 0.38 | 0.30 |
| phi024 | 5 | 100–200 | 2 | 0.50 | 0.50 | 0.38 |
| umc1014 | 6 | 100–150 | 3 | 0.50 | 0.59 | 0.51 |
| phi112 | 7 | 150–200 | 3 | 0.50 | 0.59 | 0.51 |
| phi015 | 8 | 50–150 | 3 | 0.50 | 0.59 | 0.51 |
| umc1033 | 9 | 50–200 | 6 | 0.25 | 0.81 | 0.79 |
| phi301654 | 10 | 100–150 | 2 | 0.88 | 0.22 | 0.19 |
| Mean | 2.7 | 0.59 | 0.50 | 0.41 | ||
| Parent | L1 | L2 | L3 | L4 | L5 | L6 | L7 | L8 |
|---|---|---|---|---|---|---|---|---|
| L1 | - | 0.43 | 0.53 | 0.31 | 0.71 | 0.71 | 0.71 | 0.78 |
| L2 | - | 0.43 | 0.53 | 0.78 | 0.78 | 0.71 | 0.78 | |
| L3 | - | 0.43 | 0.63 | 0.63 | 0.63 | 0.71 | ||
| L4 | - | 0.63 | 0.71 | 0.63 | 0.71 | |||
| L5 | - | 0.63 | 0.43 | 0.71 | ||||
| L6 | - | 0.43 | 0.63 | |||||
| L7 | - | 0.53 | ||||||
| L8 | - |
| Trait | DTS | ASI | PLHT | EHT | LANG | CHLC | ED | NRPE | NKPR | TKW | GYPP | GYPH |
|---|---|---|---|---|---|---|---|---|---|---|---|---|
| r (GD, F1) | 0.20 | −0.26 | −0.20 | −0.60 | −0.09 | 0.30 | 0.13 | 0.26 | 0.04 | −0.21 | 0.05 | 0.05 |
| r (GD, SCA) | 0.01 | −0.26 | 0.00 | −0.55 | −0.07 | 0.29 | 0.11 | 0.12 | −0.25 | −0.26 | 0.04 | 0.04 |
| r (F1, SCA) | 0.69 ** | 0.78 ** | 0.75 ** | 0.83 ** | 0.70 ** | 0.80 ** | 0.85 ** | 0.71 ** | 0.90 ** | 0.83 ** | 0.80 ** | 0.80 ** |
| Parent Code | Name | Source |
|---|---|---|
| L1 | IL36 | ARC-Egypt |
| L2 | IL94 | ARC-Egypt |
| L3 | IL53 | ARC-Egypt |
| L4 | IL38 | ARC-Egypt |
| L5 | CML538 | CIMMYT-Mexico |
| L6 | CML203 | CIMMYT-Mexico |
| L7 | CML206 | CIMMYT-Mexico |
| L8 | CML441 | CIMMYT-Mexico |
© 2020 by the authors. Licensee MDPI, Basel, Switzerland. This article is an open access article distributed under the terms and conditions of the Creative Commons Attribution (CC BY) license (http://creativecommons.org/licenses/by/4.0/).
Share and Cite
Kamara, M.M.; Rehan, M.; Ibrahim, K.M.; Alsohim, A.S.; Elsharkawy, M.M.; Kheir, A.M.S.; Hafez, E.M.; El-Esawi, M.A. Genetic Diversity and Combining Ability of White Maize Inbred Lines under Different Plant Densities. Plants 2020, 9, 1140. https://doi.org/10.3390/plants9091140
Kamara MM, Rehan M, Ibrahim KM, Alsohim AS, Elsharkawy MM, Kheir AMS, Hafez EM, El-Esawi MA. Genetic Diversity and Combining Ability of White Maize Inbred Lines under Different Plant Densities. Plants. 2020; 9(9):1140. https://doi.org/10.3390/plants9091140
Chicago/Turabian StyleKamara, Mohamed M., Medhat Rehan, Khaled M. Ibrahim, Abdullah S. Alsohim, Mohsen M. Elsharkawy, Ahmed M. S. Kheir, Emad M. Hafez, and Mohamed A. El-Esawi. 2020. "Genetic Diversity and Combining Ability of White Maize Inbred Lines under Different Plant Densities" Plants 9, no. 9: 1140. https://doi.org/10.3390/plants9091140