Article

Leaf Anatomy, Morphology and Photosynthesis of Three Tundra Shrubs after 7-Year Experimental Warming on Changbai Mountain

1
Ecological Technique and Engineering School, Shanghai Institute of Technology, Shanghai 201418, China
2
Department of Tourism Economy, Changbai Mountain Academy of Sciences, Baihe 133633, China
3
Center for Ecosystem Science and Society, Northern Arizona University, Flagstaff, AZ 86011, USA
4
Swiss Federal Research Institute WSL, Zuercherstrasse 111, 8903 Birmensdorf, Switzerland
5
School of Geographical Sciences, Northeast Normal University, Changchun 130024, China
*
Author to whom correspondence should be addressed.
Plants 2019, 8(8), 271; https://doi.org/10.3390/plants8080271
Submission received: 26 June 2019 / Revised: 1 August 2019 / Accepted: 2 August 2019 / Published: 7 August 2019
(This article belongs to the Special Issue Plants Reacts to the Changing Environment)

Abstract

:
Tundra is one of the most sensitive biomes to climate warming. Understanding plant eco-physiological responses to warming is critical because these traits can give feedback on the effects of climate-warming on tundra ecosystem. We used open-top chambers following the criteria of the International Tundra Experiment to passively warm air and soil temperatures year round in alpine tundra. Leaf size, photosynthesis and anatomy of three dominant species were investigated during the growing seasons after 7 years of continuous warming. Warming increased the maximal light-saturated photosynthetic rate (Pmax) by 43.6% for Dryas. octopetala var. asiatica and by 26.7% for Rhododendron confertissimum across the whole growing season, while warming did not significantly affect the Pmax of V. uliginosum. The leaf size of Dr. octopetala var. asiatica and Rh. confertissimum was increased by warming. No marked effects of warming on anatomical traits of Dr. octopetala var. asiatica were observed. Warming decreased the leaf thickness of Rh. confertissimum and Vaccinium uliginosum. This study highlights the species-specific responses to climate warming. Our results imply that Dr. octopetala var. asiatica could be more dominant because it, mainly in terms of leaf photosynthetic capacity and size, seems to have advantages over the other two species in a warming world.

1. Introduction

Global climate change causes non-uniform warming, with faster and stronger warming in high latitudes and altitudes where tundra exists [1]. Tundra develops at low temperatures, and air warming will affect many other environmental factors such as moisture and nutrient availability, and thus directly or/and indirectly influences eco-physiological functions of plants [2]. Even a relatively small increase in temperature has caused strong responses of plants in the tundra ecosystem [3,4]. It has been expected that present and future warming could lead to pronounced effects on tundra plants.
Many studies have reported phenology [5], shrub expansion [6], growth [7,8], gas exchange [9], morphological changes [10], and anatomical changes [11] in tundra plants in response to warming. Among these changes, the photosynthetic adjustment was found to be relatively rapid and sensitive to warming, while alterations in leaf morphology and anatomy showed adaptive responses to long-term warming.
Low temperature is one of the most important limiting factors determining the growth of alpine and tundra vegetation. Generally, photosynthesis increases with increasing leaf temperature until temperature reaches an optimum [12]. Therefore, the positive effect of warming on photosynthesis is expected for vegetation growing in the tundra. It has been widely reported that warming has increased photosynthetic carbon uptake for arctic tundra vegetation [13,14,15,16]. However, the magnitude and direction of photosynthetic responses of tundra plants to warming differ greatly with species. In-situ warming (+1.4 °C, 3 years) in the Antarctic has promoted photosynthetic assimilation in Colobanthus quitensis but not in Deschampsia antarctica [17]. The photosynthetic rate of Picea glauca was 41% greater in OTCs (+1.8 °C warming, three growing seasons) compared to that in the controls [18]. Knowledge of species-specific responses to warming can help to better understand and predict future changes in cover, abundance, distribution and adaptation of tundra plants in a changing world.
Warming has been shown to induce morphological and anatomical changes in plants grown in a variety of environments including tundra. Long-term warming (+1~2 °C, 16 years) has increased leaf size and plant height but decreased specific leaf area in Cassiope tetragona and Salix arctica in Canadian High Arctic tundra [19]. Increased temperature (+1 °C, one growing season) has resulted in thinner leaves due to thinner epidermis, palisade and spongy layers in Populus tremula [20]. Warming has decreased the palisade-spongy ratio in C. tetragona (subarctic, +3~4 °C, 23 growing seasons) and Empetrum nigrum (Greenland tundra, +2.7 °C, two growing seasons) but has increased the thickness of the epidermis in C. tetragona and Betula nana (Greenland tundra, +2.7 °C, two growing seasons) [11,21].
Leaf anatomy showed acclimation to long-term warming. For example, Hartikainen et al. found that leaf anatomy can respond sensitively to short-term warming, but Schollert et al. showed no alterations of leaf anatomy to long-term warming [11,20]. The alterations in leaf anatomy can then affect photosynthetic gas exchange. For instance, increased leaf thickness and epidermis could be beneficial for water deficit and thus influence leaf physiology, and changes in palisade-spongy tissue ratio will change photosynthetic potential because palisade tissue has more chloroplasts [21].
To better understand and predict tundra species and ecosystem responses to future warming, we studied leaf photosynthesis, morphology and anatomy of three dominant tundra shrubs (Dryas octopetala var. asiatica, Vaccinium uliginosum and Rhododendron confertissimum) which have been artificially warmed by OTCs in situ on the Changbai Mountain tundra for 7 years. We hypothesized that a continuous 7 years of warming would stimulate photosynthesis at the individual scale, but with different magnitudes for different species. The changes in morphology and anatomy would benefit to improve photosynthesis. Therefore, we expected some species with higher responses in photosynthesis and/or morphology and/or anatomy to have competitive advantages over the other species.

2. Results

2.1. Environmental Measurements

The OTC treatment increased average air and soil temperatures, while the soil water content was decreased (Table 1). Compared to controls, OTCs increased the mean daily (24 h) air temperature during the growing season by 1.4 °C (2016) and 1.6 °C (2017). OTCs increased the daytime air temperature by 2.5 °C (2016) and 2.9 °C (2017), and the nighttime temperature by 0.9 °C (2016) and 0.3 °C (2017) (Table 1). Warming did not significantly affect daily soil temperature at 10 cm depth although there was an increased trend, 13.7 vs. 13.1 °C in 2016 and 13.9 vs. 12.9 °C in 2017. The daytime soil temperature was markedly increased by 2.9 °C in 2016 and 3.3 °C in 2017, but the nighttime soil temperature did not change as compared to the control (Table 1). The soil water content was decreased by the same scales during the day and the night.

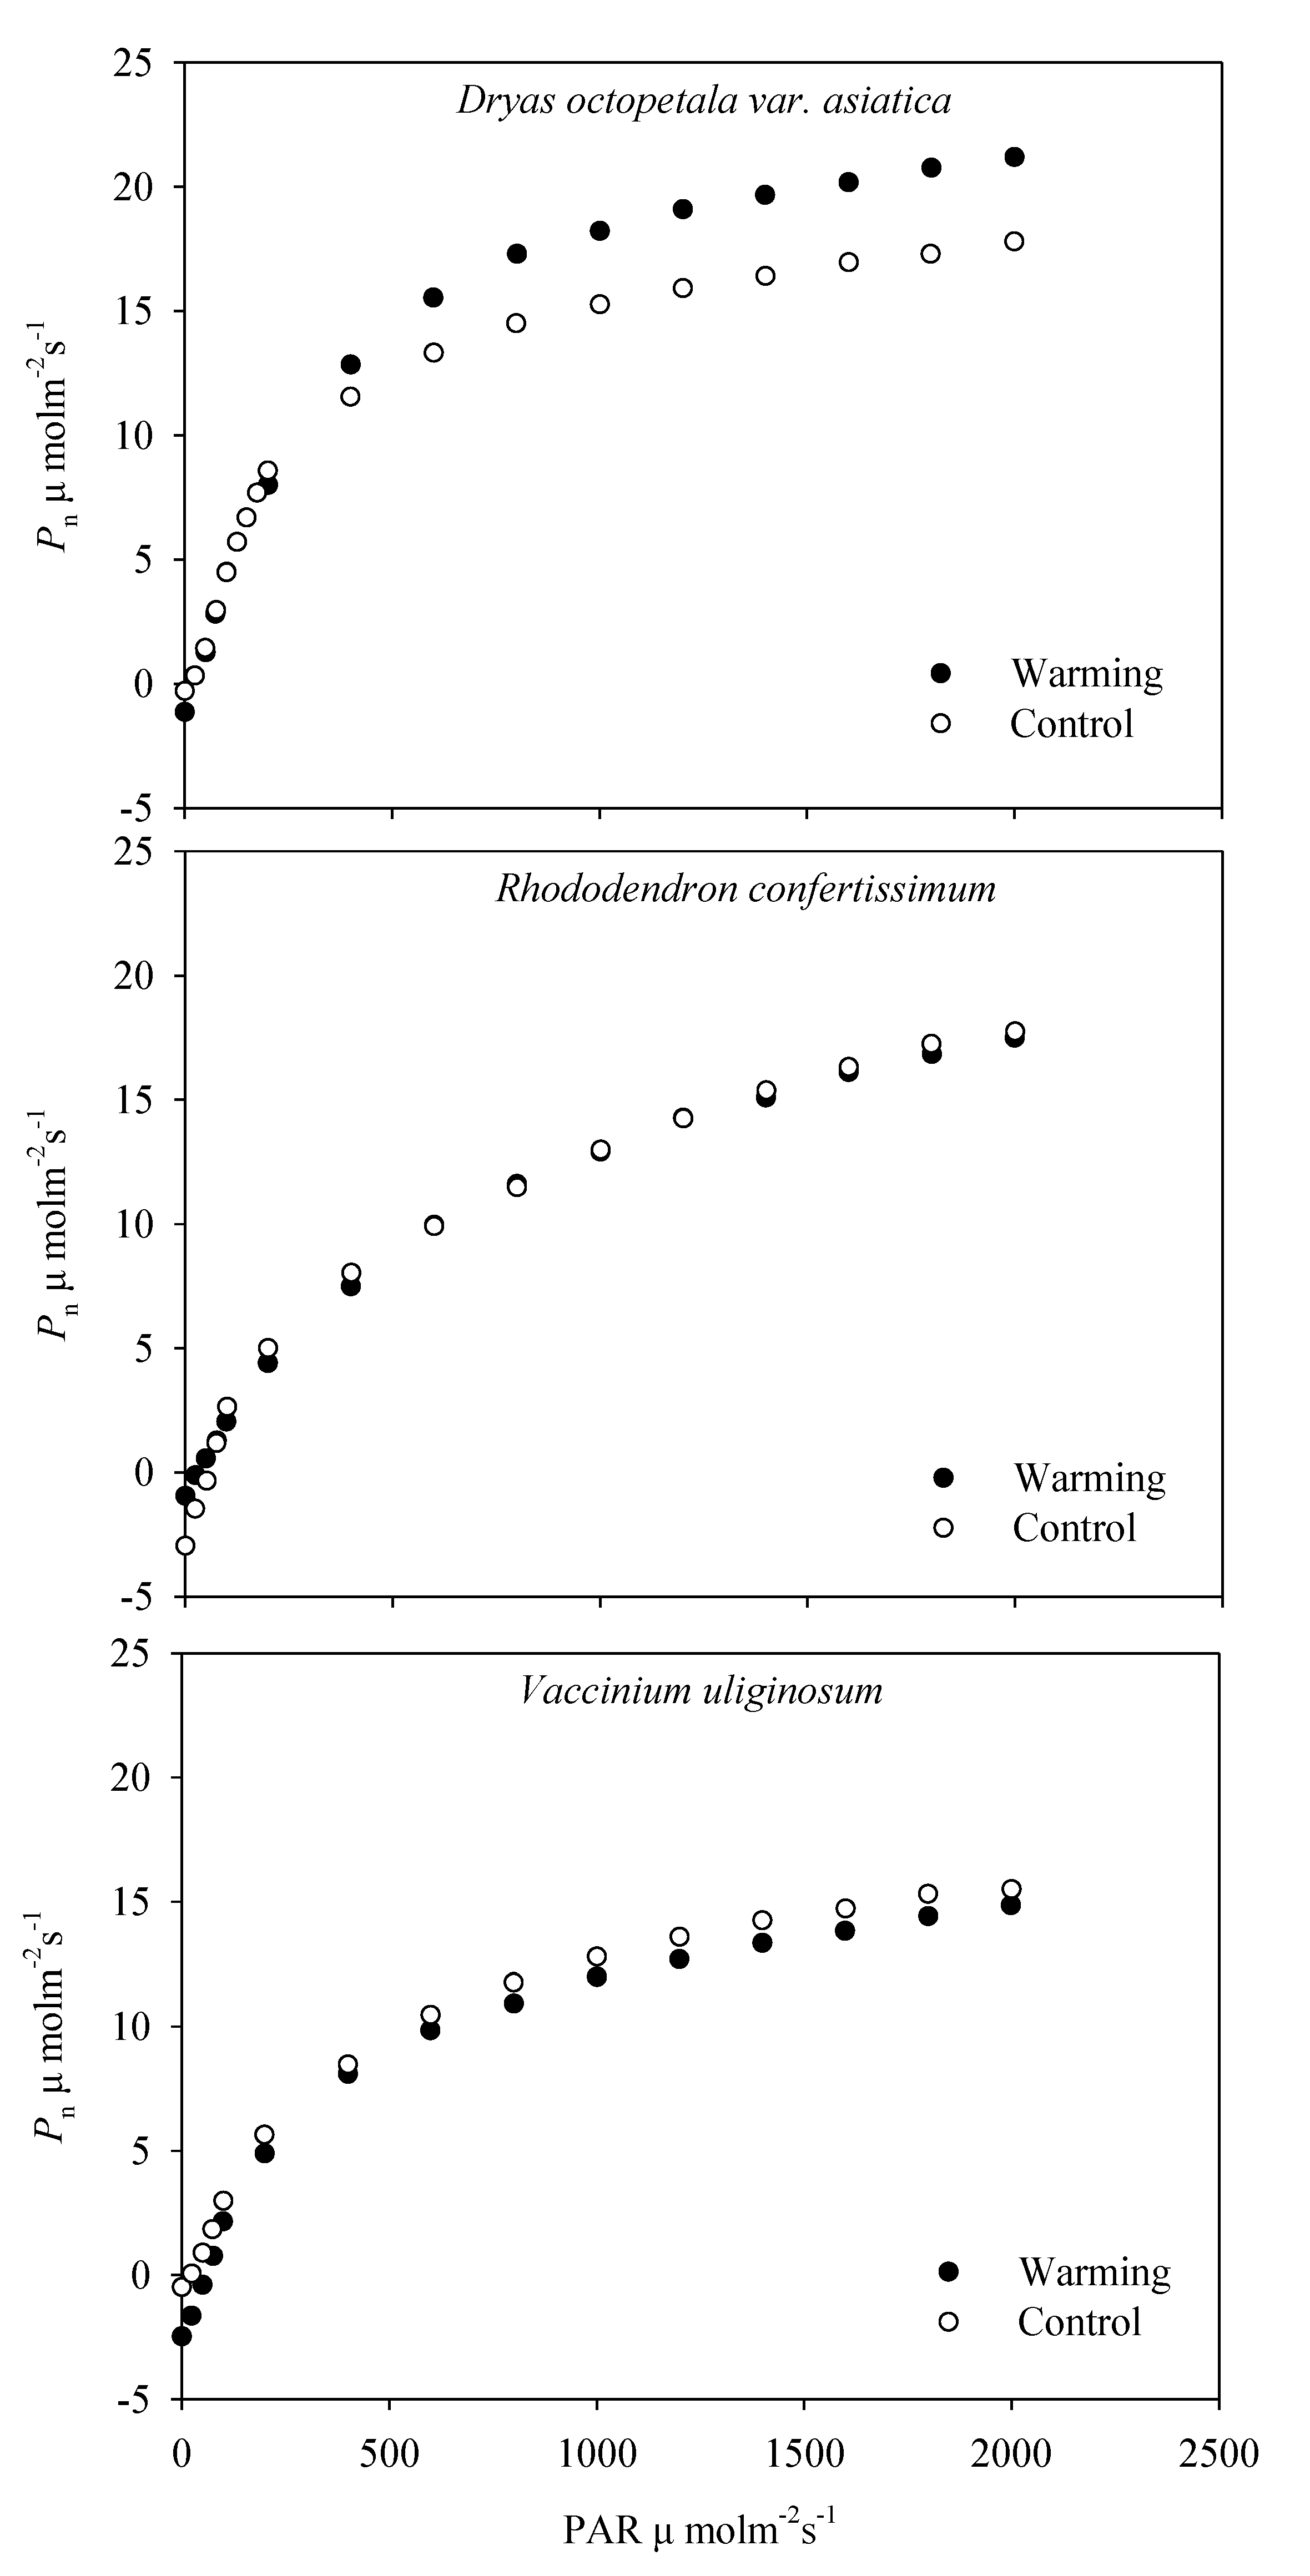
2.2. The Light Response Curves

In all curves for Dr. octopetala var. asiatica, V. uliginosum and Rh. confertissimum, the measured and fitted photosynthetic rate showed linear responses with increasing PAR up to 200 μmol m−2 s–1, and the uptrend of the net photosynthetic rate slowed down after 1800 μmol m–2 s–1. As an example, Figure 1 showed the photosynthetic light-response curves measured on 11 August 2017. Dr. octopetala var. asiatica in the warming always showed a higher photosynthetic rate than that in the control.

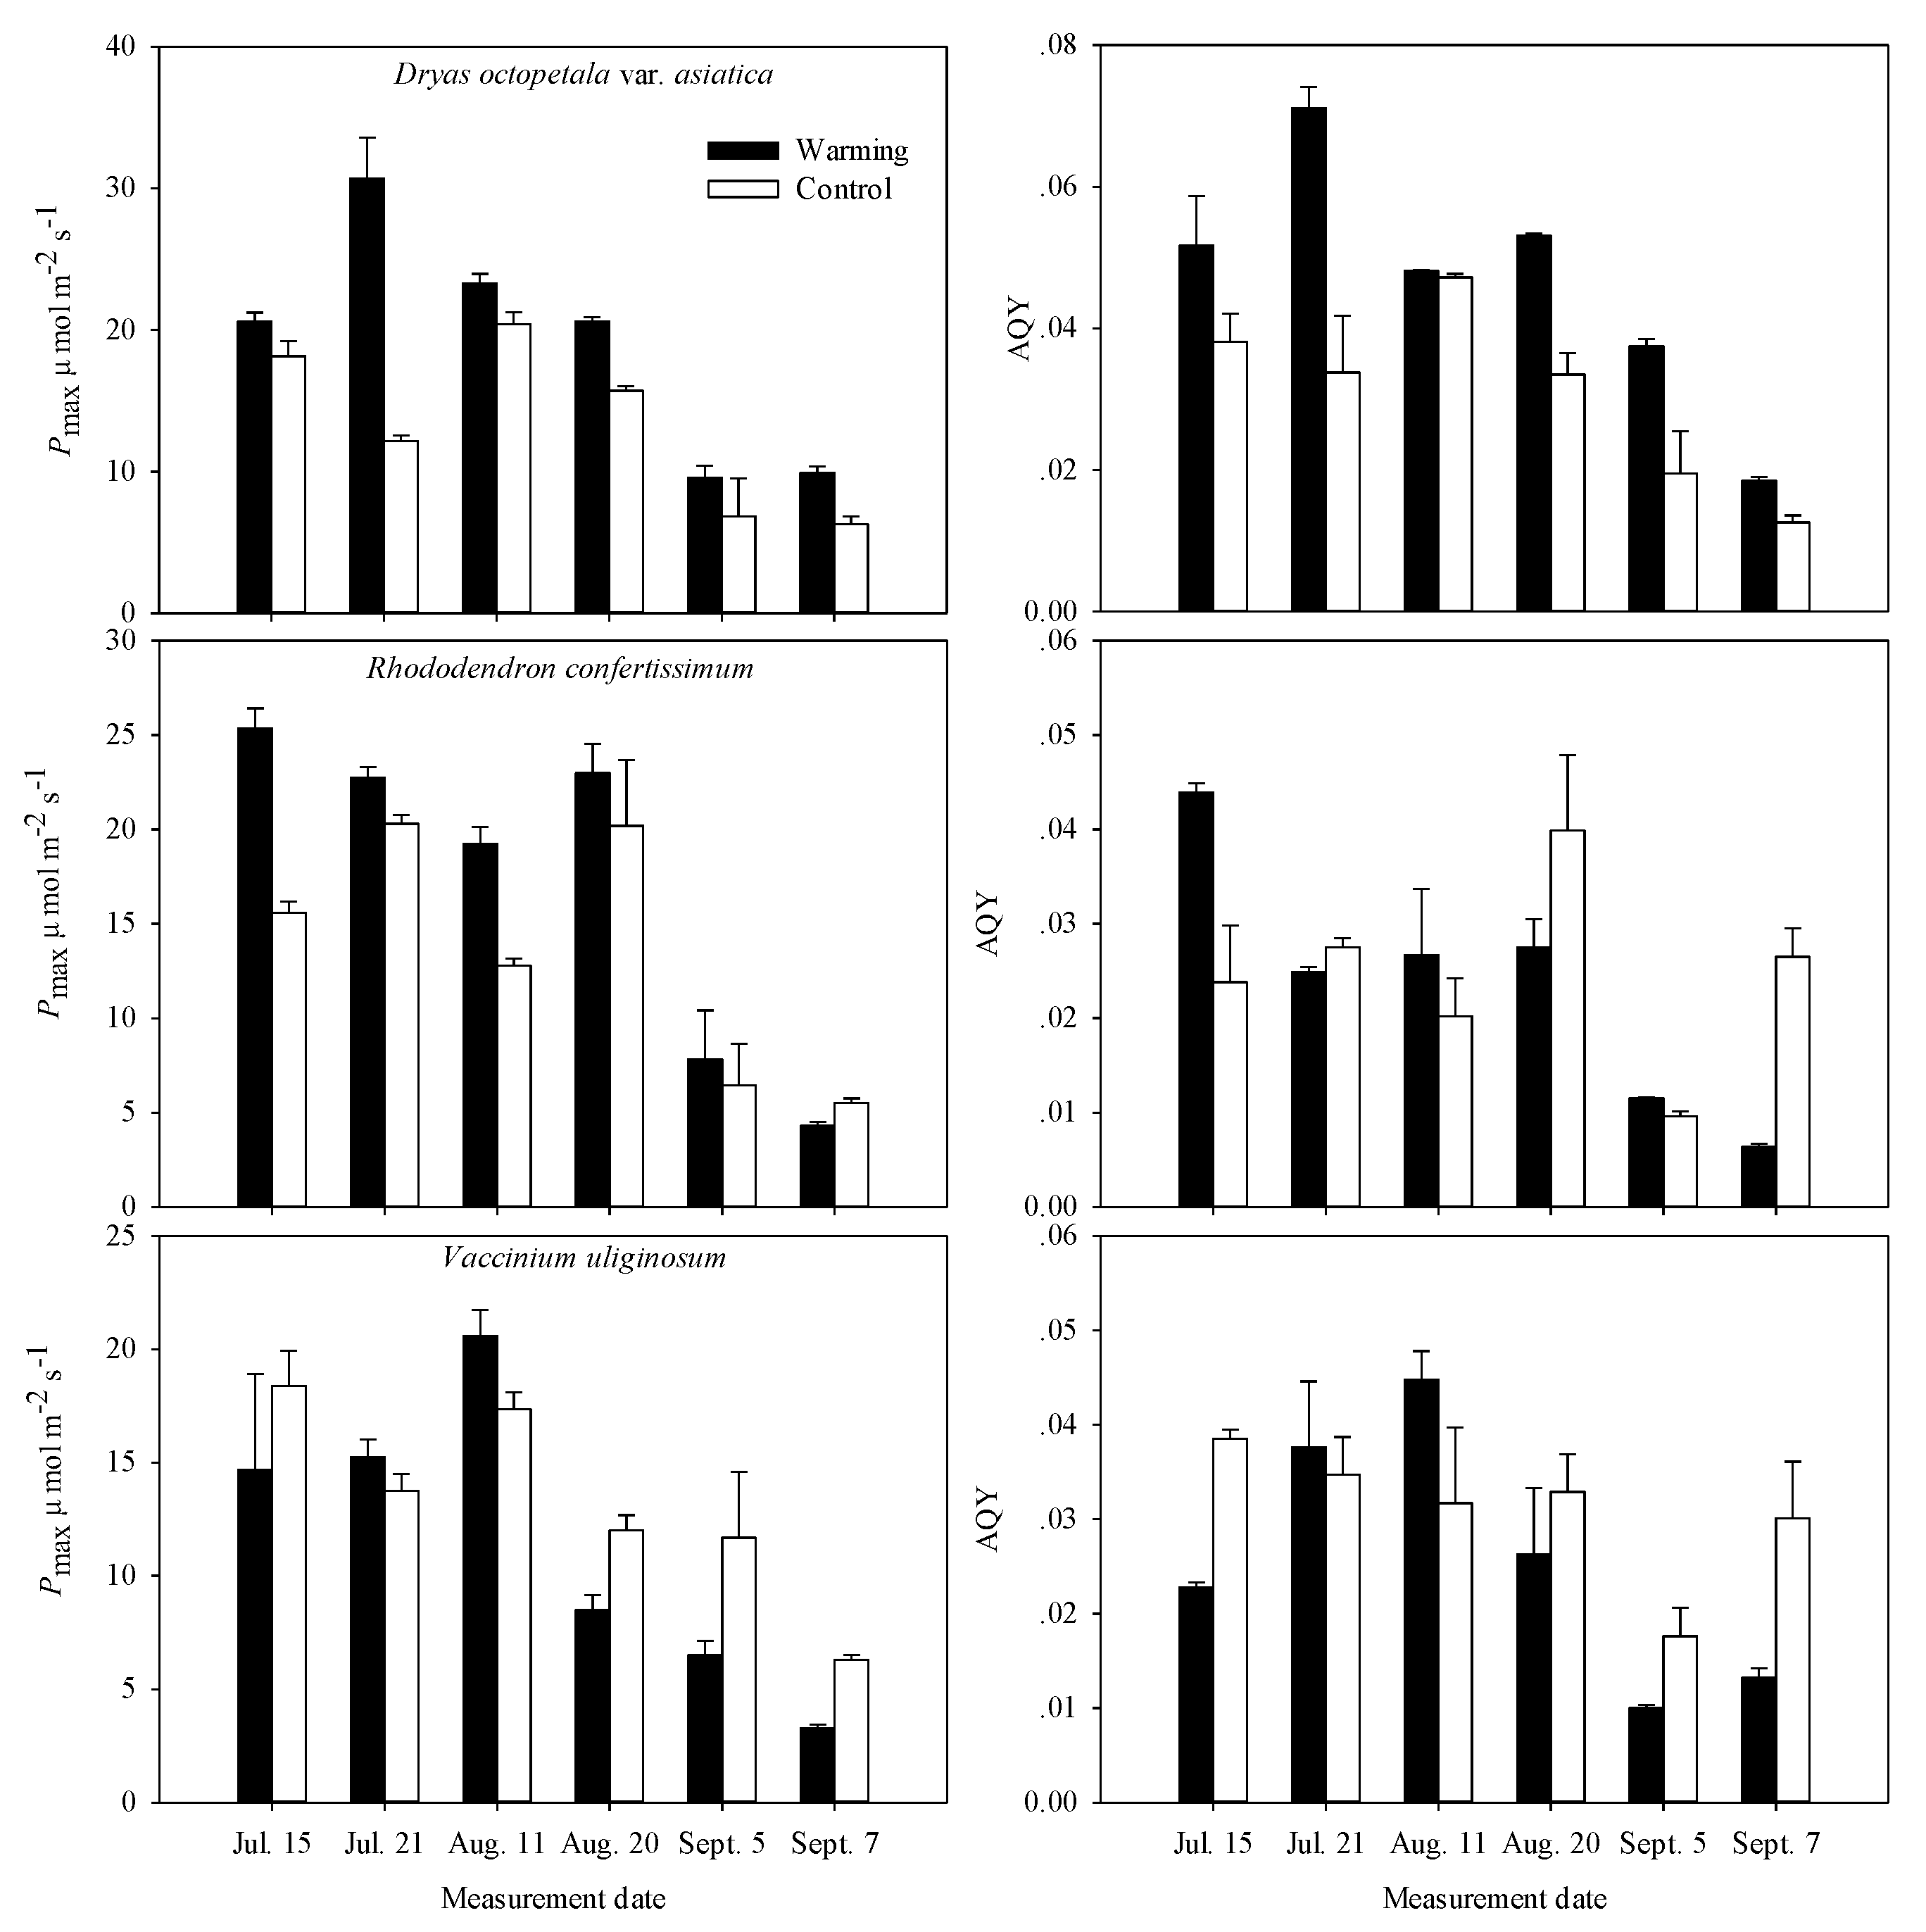
2.3. Photosynthetic Characteristics

The Pmax in both Dr. octopetala var. asiatica and Rh. confertissimum displayed significant differences between the warming and the control plots, and Pmax in Dr. octopetala var. asiatica differed significantly between measurement dates. There were no significant interactions between treatment and measurement date on Pmax for the three species (Table 2). Warming did not significantly affect the Pmax in V. uliginosum (Figure 2, Table 2). On average, warming increased Pmax by 43.6% for Dr. octopetala var. asiatica and by 26.7% for Rh. confertissimum across the whole growing season (Table 3). In addition, the higher Pmax and marked increase in Pmax mainly occurred in July and August (+21.0 to +68.4%). The photosynthetic rates declined rapidly at the end of growing season (September) for the three species (Figure 2). The Pmax of Dr. octopetala var. asiatica was 1.5 times higher in OTCs (9.7 μmol m−2 s−1) than that in the controls (6.6 μmol m−2 s−1) in September. Rh. confertissimum grown in the warming and the control exhibited the same Pmax of 6.0 μmol m−2 s−1 in September (Table 3). Smaller Pmax of V. uliginosum in the warming OTCs compared to controls was observed at the end of the growing season (Figure 2). In addition, the Pmax of Dr. octopetala var. asiatica and Rh. confertissimum was higher than that of V. uliginosum (Table 3).
The AQY of Dr. octopetala var. asiatica grown in the warming OTCs was 51.6% greater than that in the control plots across the whole growing season (Figure 2; Table 2 and Table 3). OTCs increased AQY in Dr. octopetala var. asiatica by 69.4% in July, 27.5% in August, and 7.5% in September compared to the control plots (Table 3). However, compared to the controls, V. uliginosum showed a marginally significant decrease in AQY (−16.1%; p = 0.044), while no changes in AQY were observed for Rh. confertissimum across the whole growing season (Table 2 and Table 3).

2.4. Leaf Anatomy

For Dr. octopetala var. asiatica, warming did not significantly change the leaf thickness (mean 136.3 μm for leaves both in the warming OTCs and the control plots) throughout the growing season (Table 4). Warming significantly decreased the leaf thickness by 26.6% for Rh. confertissimum in July (p = 0.022) and by 12.7% for V. uliginosum in September (p = 0.001). The three species showed relatively higher leaf thickness in July than in September for the warming and the control plots. The thickest leaves were found in Rh. confertissimum (mean 250.6 μm) and the thinnest in Dr. octopetala var. asiatica (mean 136.3 μm) (Table 4). As an example, Figure S1 showed the light microscopy images of leaf cross-sections for the three species measured on 11 August 2017.
There was no significant difference in palisade thickness (ranging from 63 μm to 70 μm) between the warming and the control plots for Dr. octopetala var. asiatica, V. uliginosum and Rh. confertissimum (all p > 0.05) (Table 4). Warming did not significantly affect the ratio of palisade to spongy parenchyma for the three species except for the measurements for V. uliginosum in September (Table 4). The ratios of palisade to leaf thickness and to spongy parenchyma in Dr. octopetala var. asiatica were the highest among the three species.
Warming significantly decreased adaxial and abaxial epidermis cell length (−17.2~−29.8%) and cell thickness (−21.6~−39.6%) in V. uliginosum. However, warming significantly increased adaxial and abaxial epidermis cell length and thickness (+12.1~+17.9%) in Rh. confertissimum measured in July (Table 4). At the end of growing season (September), the cuticle thickness of Rh. confertissimum was 13.7% higher in the warming OTCs than that in the control plots (p < 0.05). The epidermis cell length and thickness in Dr. octopetala var. asiatica were not affected by warming (p > 0.05), except abaxial epidermis thickness measured in September. The cell length and thickness of Dr. octopetala var. asiatica were increased on average by 18.1 and 31.0% by warming during the growing season. The adaxial epidermis cells were bigger than abaxial epidermis for each species (Table 4).

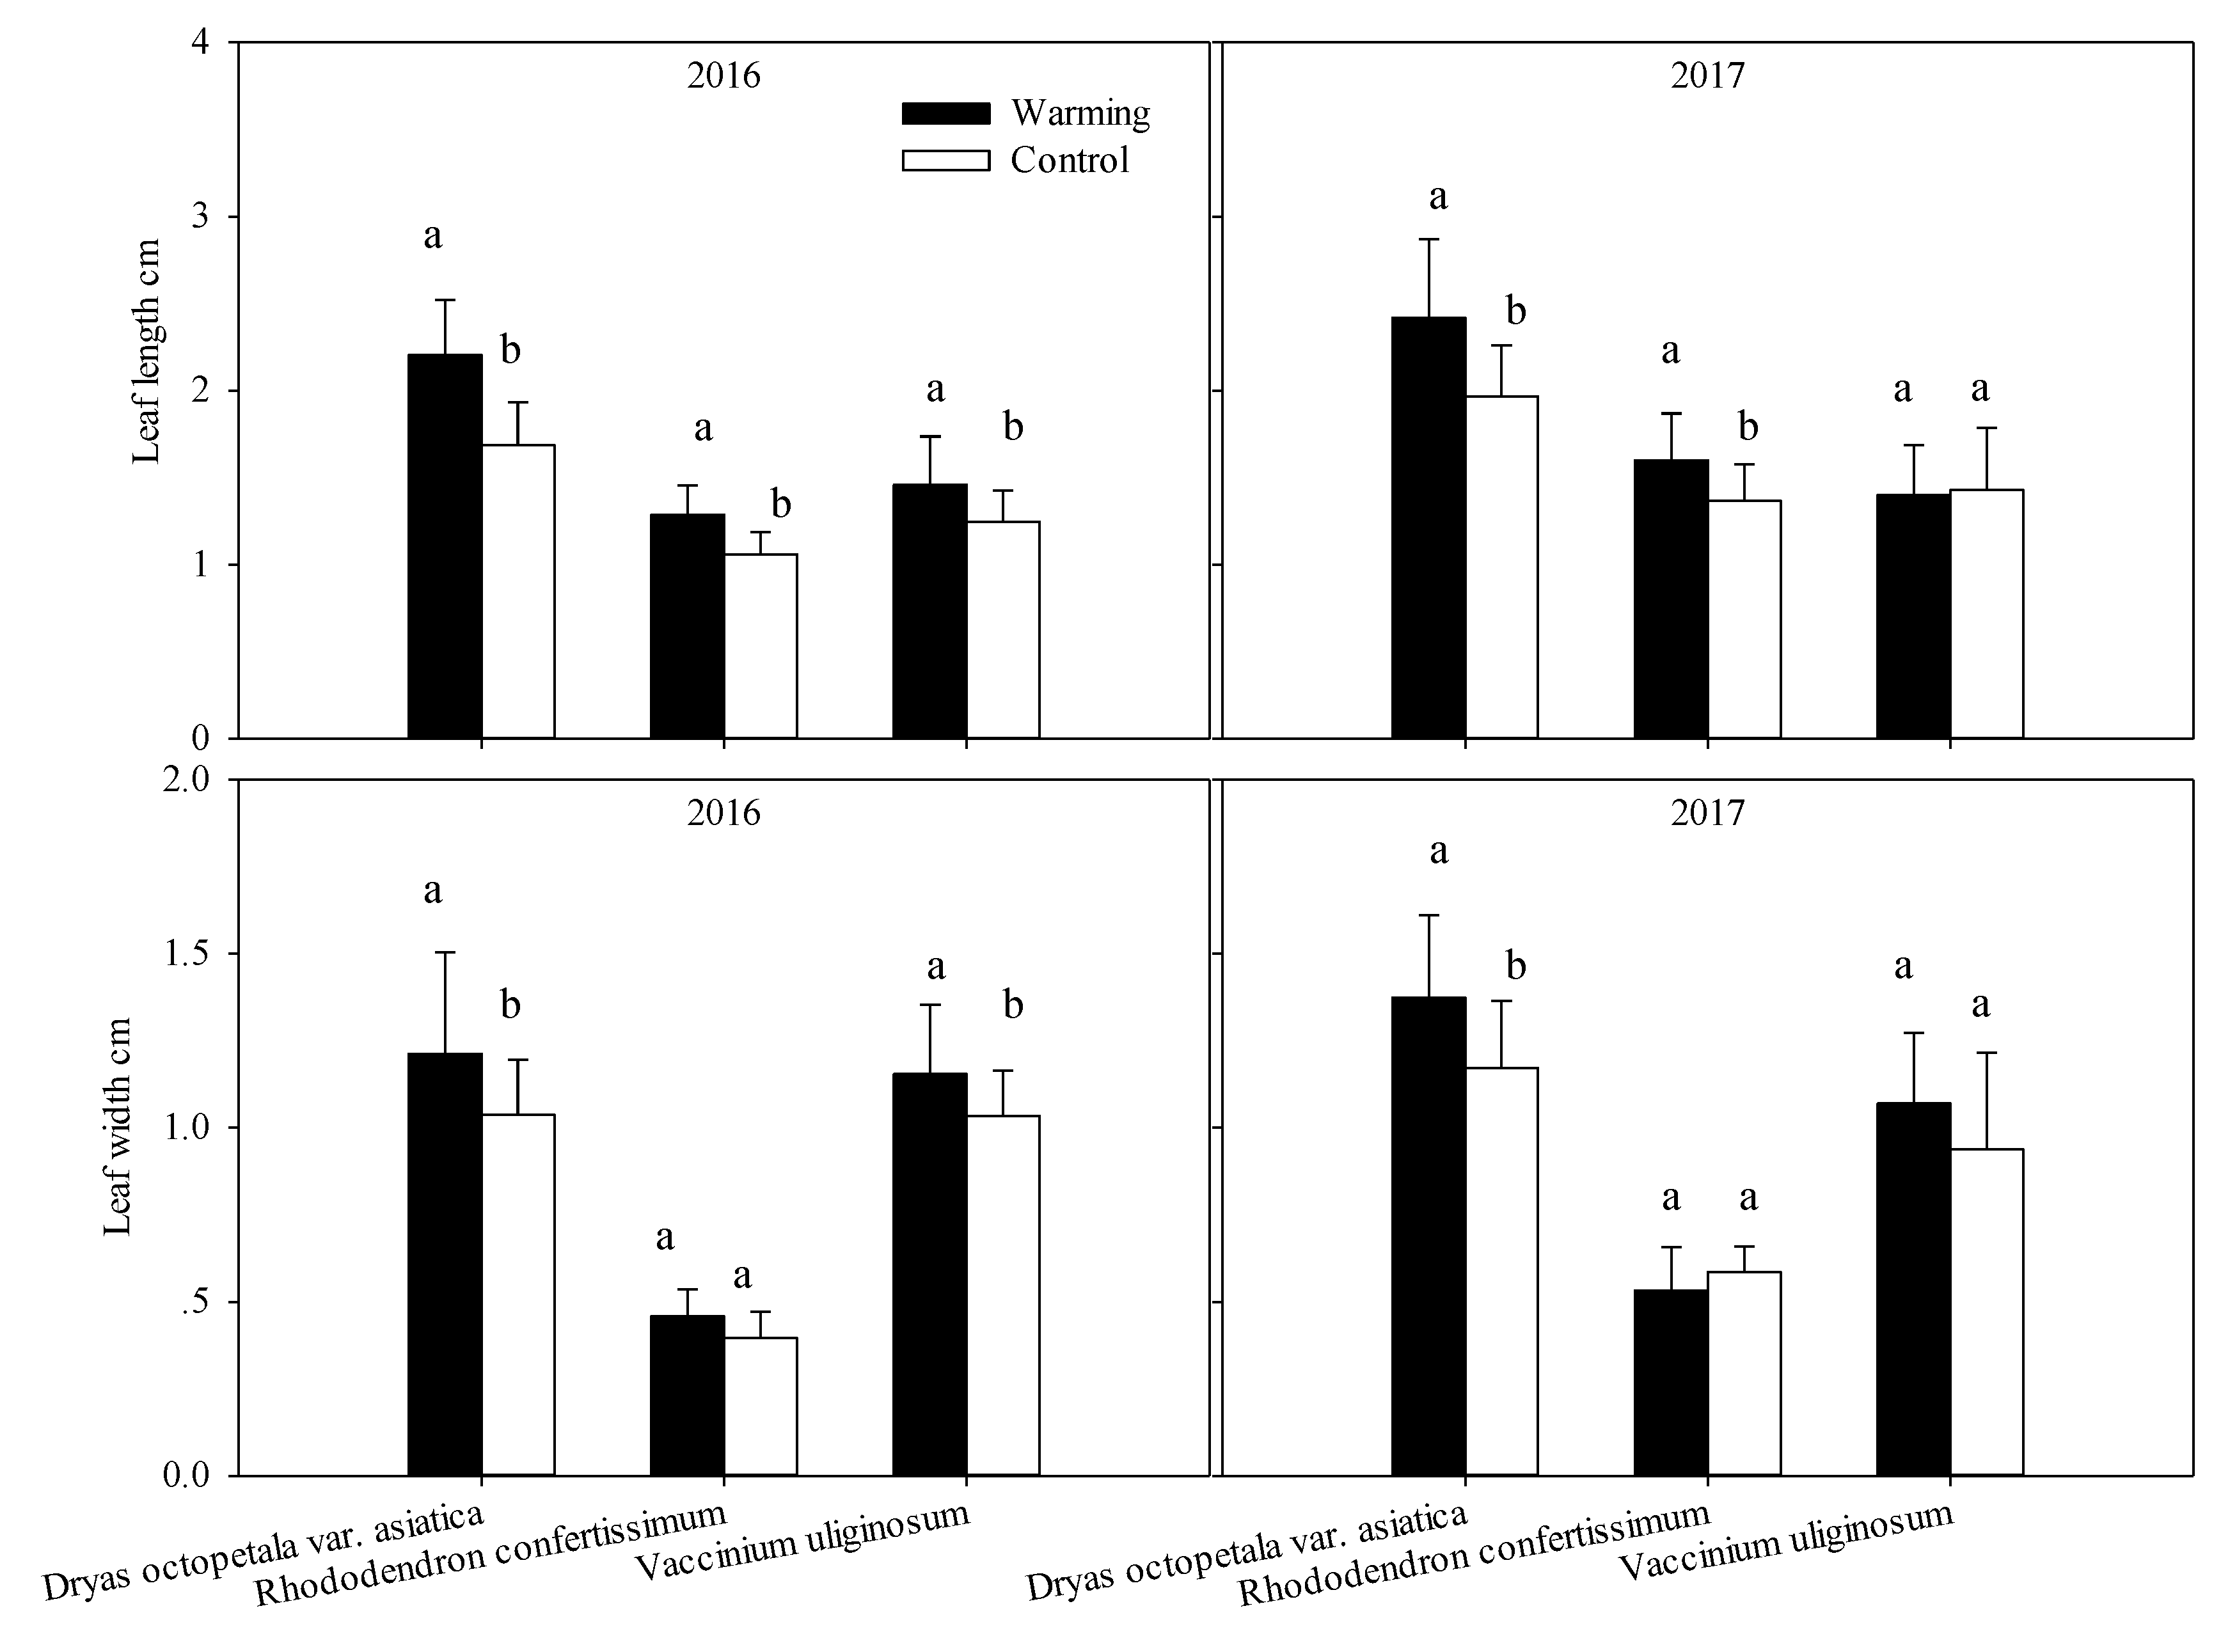
2.5. Leaf Morphology

Across the two growing seasons, there were significant differences in leaf length and width between treatments for Dr. octopetala var. asiatica (Figure 3). Warming increased the leaf length by 29.4% in 2016 and 20.0% in 2017, and similarly increased leaf width by 20.0% in 2016 and 16.7 % in 2017 for Dr. octopetala var. asiatica. Warming increased the leaf length (+25.0%; p = 0.001) and width (+20.0%; p = 0.044) of V. uliginosum in 2016, but these increases disappeared in 2017. For Rh. confertissimum, warming affected the leaf length (+16%) only (Figure 3).

3. Discussions

Since plant growth in the tundra is mainly temperature limited, the marked increase in daytime temperature can promote photosynthesis in OTCs (Figure 2; Table 1 and Table 2). The relatively smaller increase in nighttime temperature is beneficial to the reduction of carbon consumption by respiration (Table 1). Thus, the environment of OTCs is expected to have positive effects on plants in the alpine tundra. However, the responses of leaf photosynthesis, morphology and anatomy to OTC warming for the three species in the present study are not always positive and show species-specific reactions. Previous studies also indicated that different species grown in the Antarctic were differently affected by warming [17,22]. For example, warming changed the photosynthesis and anatomical structure of Colobanthus quitensis, but it had no effects on those of Deschampsia antarctica [17,22]. These results suggest that measurements at the individual species level are still needed to better understand and predict the responses at the community and ecosystem level of tundra vegetation under future climate warming.
The photosynthesis of high alpine plants have been found to increase [9,23], decrease [23] or not change [24] in response to climate warming. In the present study, the Pmax of Dr. octopetala var. asiatica was significantly increased by warming. Rh. confertissimum also showed increases in Pmax, but the magnitude of stimulation was smaller than in Dr. octopetala var. asiatica. By contrast, warming tended to reduce Pmax of V. uliginosum. We also found increased leaf size in 2016 had not been maintained in 2017 for V. uliginosum. Thus, V. uliginosum probably acclimated to long-term warming treatment. Similarly, Carroll et al. also found different responses of photosynthesis and leaf size to warming in three dominant tree species (Pinus contorta var. latifolia, Pinus ponderosa and Populus tremuloides) [25]. Long-term responses of photosynthesis to changes in temperature can cause a shift in optimum temperature of leaf photosynthesis, which stimulates photosynthesis at the new growth temperature, or changes the shape of the photosynthesis-temperature curve without shifting optimum temperature [26,27]. Plants growing in the cool region can also increase the activity of photosynthesis-related enzymes to acclimate to warming, thereby enhancing photosynthesis [27].
Photosynthesis and morphology exhibit comparatively strong plasticity to warming. Leaf anatomical features are relatively less susceptible to environmental change, and therefore the variations in anatomy might reflect long-term adaption to warming. We asked whether the differential responses of photosynthesis to long-term warming related to specific morphology and anatomical adjustments. No observed anatomical determinants of Dr. octopetala var. asiatica were affected by warming compared to the controls. However, the leaf size of Dr. octopetala var. asiatica was significantly stimulated, which means the total photosynthetic area and photosynthate increased. By contrast, the photosynthetic response of Colobanthus quitensis in the Antarctic to warming relied on specific adjustments in the anatomical determinants, which enhanced photosynthetic assimilation, thereby promoting plant growth [17].
Among the leaf anatomical traits, palisade tissue might be the most important to photosynthesis because palisade mesophyll cells are the structural powerhouse of photosynthesis. The thickness of palisade mesophyll has been found to be positively correlated with net photosynthetic rate [21]. However, both the Pmax and AQY of Dr. octopetala var. asiatica were significantly increased, which is inconsistent with the anatomical traits. This indicates that photosynthesis, at least for Dr. octopetala var. asiatica, does not integrate closely to anatomical characteristics, which does not support our hypothesis. Photosynthesis is relatively sensitive to environmental factors, like temperature, light and water status. The activity of photosynthesis-related enzyme increases with temperature, which will stimulate photosynthesis but not necessarily cause changes in anatomical structure.
We found increases in leaf size of Dr. octopetala var. asiatica and Rh. Confertissimum in response to long-term warming. The leaf area and growth are determined by the fraction of photosynthate required for plant respiration. In the present study, increased leaf size, photosynthesis and number of individuals (32% in the warming OTCs vs. 25% in the control plots) of Dr. octopetala var. asiatica in OTCs imply significant advantages of this species in a warming world. Larger leaves in shrubs of Cassiope tetragona, Salix arctica and Dr. integrifolia were also observed in the Canadian High Arctic after 16 years of warming treatment (+1~2 °C) [19]. Similar palisade thickness but relatively thinner leaf thickness in Dr. octopetala var. asiatica than in Rh. confertissimum and V. uliginosum (Table 4) suggests that Dr. octopetala var. asiatica will grow better than the other two species if the Changbai Mountain tundra continues warming. Taken together, our results suggest that global warming will benefit Dr. octopetala var. asiatica in the tundra on Changbai Mountain. In the long term, warming favors greater dominance by Dr. octopetala var. asiatica. Based on differential responses of photosynthesis and leaf size to warming among the three dominant tree species (Pinus contorta var. latifolia, Pinus ponderosa and Populus tremuloides) in a community, Carroll et al. concluded that forest composition will be altered in a future warming world [25]. Thus, we may also predict that future warming might promote expansion and enhance the cover of Dr. octopetala var. asiatica, whereas V. uliginosum may be at risk for gradual occupation by other species, which could lead to changes in the tundra ecosystem function on Changbai Mountain.
Thinning of the leaf and thickening of epidermis cells in Rh. confertissimum by warming probably imply less diffusion space of CO2 in spongy parenchyma. Similar results were observed by Schollert et al. that the epidermis of Betula nana in Greenland was also thickened by OTC warming [21]. The cuticle thickness of Rh. confertissimum in the warming was higher than the control in September (Table 4). This situation in Rh. confertissimum is not beneficial for photosynthetic carbon uptake but probably good for water conservation in the long term if the climate continues to warm. Bacelar et al. reported that a thicker epidermis (including cuticle) was an anatomical adaptation to improve water conservation [28]. A thicker epidermis in response to warming may be a structural adaptation for prevention of water loss. However, a significant decrease in adaxial and abaxial epidermis thickness with decreased leaf thickness in V. uliginosum under warming was also observed in the present study. Similar results of decreased epidermis thickness to warming have been found in some boreal forest species such as Pinus sylvestris and Populus tremula [20,29]. For Dr. octopetala var. asiatica, warming had no effects on the epidermis thickness and other leaf anatomical traits, which is in accordance with results in Empetrum hermaphroditum [11].
No significant changes in palisade-spongy parenchyma ratio have been observed for the three species, but with an increased trend in Dr. octopetala var. asiatica and Rh. confertissimum, and decreased trend in V. uliginosum. Coincidentally, warming increased the Pmax of Dr. octopetala var. asiatica and Rh. confertissimum and caused a decline in Pmax of V. uliginosum. A decreased palisade-spongy parenchyma ratio has also been observed for Betula nana and Cassiope tetragona under warming [11]. The higher palisade-spongy parenchyma ratio suggests a compact arrangement of cells and high mesophyll surface area which could facilitate CO2 uptake and thus maintain higher photosynthesis [30].

4. Materials and Methods

4.1. Study Site and Experimental Design

The study was conducted in the tundra ecosystem at 2028 m a.s.l. on the north-facing slope of Changbai Mountain (41°58′–42°42′ N; 127°67′–128°27′ E), northeastern China. The experimental site has a mean annual temperature of −7.3 °C and mean annual precipitation of 1373 mm [31,32]. A snow-free season lasts from June to August (growing season). The average growing season (June to September) temperature is 5.87 °C and average precipitation ranges from 700 to 1400 mm [33]. The vegetation in the experimental plots is dominated by Dr. octopetala var. asiatica, V. uliginosum and Rh. confertissimum. After 7 years of OTC warming in 2017, the average coverage was 32% (OTCs) and 21% (controls) for Dr. octopetala var. asiatica, 32% (OTCs) and 25% (controls) for V. uliginosum, and 6% (OTCs) and 9% (controls) for Rh. confertissimum.
Eight hexagonal clear-sided OTCs, according to the criteria of the International Tundra Experiment [3], were installed in the tundra in 2010. The OTCs were 45 cm high, had inclined sides (60 °C), enclosed a surface of 1.0 m2, and were left in the experimental plots year round. The OTCs were installed on relatively flat ground with similar species composition and vegetation coverage. Equal areas of control plots with similar characteristics were adjacently established to each OTC. The spatial arrangements of OTCs and control plots were randomly based on the similarity of the vegetation.
The Em 50 Data Collection System (Decagon Devices Inc., Pullman, WA, USA) was respectively placed in each OTC and the corresponding control plot. The air temperature at the height of 15 cm above the ground surface, soil temperatures at 10 cm soil depth, air and soil relative humidity, and photosynthetically active radiation (PAR) were monitored and recorded every half an hour. All sensors were put in the research field only during growing seasons (June to September). We separated daytime from 0600 h to 1800 h and nighttime from 1800 h to next 0600 h to distinguish different warming effects between daytime and nighttime since daytime warming is more effective for photosynthesis. We showed only the data recorded during the growing seasons in 2016 and 2017.

4.2. Photosynthetic Light Response Curves

Photosynthesis was measured under ambient CO2 concentration (approx. 350 μmolmol−1) using LI-6400 portable photosynthesis systems with a red/blue LED light source (Li-Cor Inc., Lincoln, Dearborn, MI, USA) between 0900 h and 1130 h on sunny days. All measurements were conducted at ambient temperature to evaluate seasonal differences. At least three replicate measurements were made for each species in the warming OTCs and control plots on 21 and 28 July, 11 and 30 August, 5 and 7 September 2017. Leaf chamber temperature was maintained at ambient temperature without temperature control, representing the natural temperature experienced by leaves during the measurement time. Relative humidity inside the leaf chamber ranged from 30% to 50%. Net photosynthetic rate was determined at a series of light levels of photosynthetically active radiation (PAR) of 0, 25, 50, 75, 100, 125, 150, 175, 200, 400, 600, 800, 1000, 1200, 1400, 1600, 1800, and 2000 μmol m−2 s−1. After leaf dark acclimation, PAR was increased gradually from 0 to each light level needed, and the net photosynthetic rates (Pn) were manually recorded when stabilized. The slope of the linear part of the light-response curve when PAR was between 0 and 200 μmol m−2 s−1 was defined as apparent quantum yield (AQY). To estimate theoretically the maximal light-saturated photosynthetic rate (Pmax), light response curves were modeled by fitting non-rectangular hyperbola described by Prioul and Chartier [34].
P N = α P A R + P max ( α P A R +   P max ) 2 4 θ α P A R P max 2 θ R d
where Pmax is the maximum light-saturated net photosynthetic rate (μmol CO2 m−2 s−1), PAR is (μmol m−2 s−1) the photosynthetically active radiation, α is the initial slope or AQY, and θ is the convexity or curvature factor (between 0 and 1). Rd is the rate of respiration in the light. Pmax was estimated by the above formula in the present study. The fitted α based on the above formula was far higher than the initial slope of the measured curve, so we used the initial slope during PAR < 200 μmol m−2 s−1 as AQY.

4.3. Leaf Morphology Measurement

Thirty-two plants per species (Dr. octopetala var. asiatica, Rh. confertissimum and V. uliginosum) were selected to measure leaf length and width by digital caliper (four individuals per OTC and control plot) during the growing seasons in 2016 and 2017. Leaf width was measured at the widest part of a leaf.

4.4. Leaf Anatomy Measurement

Three leaves from three randomly selected plants per species from each OTC and control plot were collected on 13 July and 18 September 2017. All leaves were immediately fixed in FAA (5 mL 38% formaldehyde, 90 mL 70% ethanol, and 5 mL acetic acid in a proportion of 1:18:1 v/v) after cutting down. Eight leaves from the warming OTCs and eight leaves from the control were selected at random to make a paraffin section for one sampling date. Each leaf had two pieces avoiding midribs and margins, and each transversal section was observed by three views. The leaf anatomy characteristics were observed with a light microscope and photographed (Motic BA 300) with a 100 magnification. Leaf thickness was measured with complete structure and was estimated as an average of at least three points. Thicknesses of palisade tissues were measured at the same point as leaf thickness for both warming and the control plots [11].

4.5. Statistical Analysis

The normality of the distribution and homogeneity of the data were checked (Kolmogorov–Smirnov test) before any statistical analyses. One-way ANOVA was used to test the differences in environmental factors. After significant regression relationships between net photosynthetic rate and PAR less than 200 μmol m−2 s−1, the slope of the linear part represented AQY. Repeated measures ANOVA was used to assess the effects of warming and measurement date on Pmax, AQY and anatomic parameters. Leaf length and width were evaluated by one-way ANOVA with treatment as the main factor. All statistical analyses were conducted with SPSS 16.0 system (SPSS Inc., Chicago, IL, USA) and Excel (2013). All tests of statistical significance were conducted at a level of 0.05.

5. Conclusions

Our results indicate that in response to warming, the magnitude and direction of leaf photosynthesis, morphology and anatomy differ with species. Dr. octopetala var. asiatica showed an obvious advantage in Pmax, leaf size and relatively higher palisade proportion than Rh. confertissimum and V. uliginosum; therefore, we may expect that Dr. octopetala var. asiatica population could hold greater dominance on the Changbai Mountain tundra with the future continuous warming, and Rh. confertissimum and V. uliginosum might eventually decrease. Species-specific responses of leaf physiological traits to warming suggest that the measurements at the individual species level are still needed to better understand and predict the community- and/or ecosystem-level responses to future climate change and their responses in high latitude and high altitude ecosystems.

Supplementary Materials

The following are available online at https://www.mdpi.com/2223-7747/8/8/271/s1, Figure S1: Light microscopy images of leaf cross-sections for Dryas octopetala var. asiatica in the warming OTCs (a) and in the ambient control (b), Vaccinium uliginosum in the warming OTCs (c) and in the control (d), Rhododendron confertissimum in the warming OTCs (e) and in the control (f), sampled in July 2017 (measured data in detail in Table 4).

Author Contributions

Conceptualization: Y.Z.; Data collection and analysis: J.D., L.J. and Z.T.; Experiment: J.H. and G.M.; Wring-original draft preparation: Y.Z.; Writing-review and editing: Y.Z., L.J. and M.-H.L.; Supervision, M.-H.L.; Funding acquisition, Y.Z.

Funding

This research was funded by the Open Research Fund Program of the Changbai Mountain Academy of Sciences (201504) and by the National Natural Science Foundation of China (31170461).

Acknowledgments

We would like to thank Xiuxiu Wang who provided invaluable assistance during the field and lab work conducted for the research. We also thank the Changbai Mountain Forest Ecosystem Open Research Station for the support of all measurements.

Conflicts of Interest

The authors declare that they have no conflict of interest.

References

  1. Deslippe, J.R.; Simard, S.W. Below-ground carbon transfer among Betula nana may increase with warming in Arctic tundra. New Phytol. 2011, 192, 689–698. [Google Scholar] [CrossRef] [PubMed]
  2. Shaver, G.R.; Canadell, J.; Chapin, F.S., III; Gurevitch, J.; Harte, J.; Henry, G.; Ineson, P.; Jonasson, S.; Melillo, J.; Pitelka, L.; et al. Global warming and terrestrial ecosystems: A conceptual framework for analysis. Bioscience 2000, 50, 871–882. [Google Scholar] [CrossRef]
  3. Henry, G.H.R.; Molau, U. Tundra plants and climate change: The International Tundra Experiment (ITEX). Glob. Chang. Biol. 1997, 3, 1–9. [Google Scholar] [CrossRef]
  4. Arft, A.M.; Walker, M.D.; Gurevitch, J.; Alatalo, J.M.; Bret-Harte, M.S.; Dale, M.; Diemer, M.; Gugerli, F.; Henry, G.H.R.; Jones, M.H.; et al. Responses of tundra plants to experimental warming: Meta-analysis of the International Tundra Experiment. Ecol. Monogr. 1999, 69, 491–511. [Google Scholar] [CrossRef]
  5. Starr, G.; Oberbauer, S.F.; Pop, E.W. Effects of lengthened growing season and soil warming on the phenology and physiology of Polygonum bistorta. Glob. Chang. Biol. 2000, 6, 357–369. [Google Scholar] [CrossRef]
  6. Hallinger, M.; Manthey, M.; Wilmking, M. Establishing a missing link: Warm summers and winter snow cover promote shrub expansion into alpine tundra in Scandinavia. New Phytol. 2010, 186, 890–899. [Google Scholar] [CrossRef] [PubMed]
  7. Walker, M.D.; Wahren, C.H.; Hollister, R.D.; Henry, G.H.R.; Ahlquist, L.E.; Alatalo, J.M.; Bret-Harte, M.S.; Calef, M.P.; Callaghan, T.V.; Carroll, A.B.; et al. Plant community responses to experimental warming across the tundra biome. Prod. Nalt. Acad. Sci. USA 2006, 103, 1342–1346. [Google Scholar] [CrossRef] [Green Version]
  8. Weijers, S.; Buchwal, A.; Blok, D.; Löffler, J.; Elberling, B. High Arctic summer warming tracked by increased Cassiope tetragona growth in the world’s northernmost polar desert. Glob. Chang. Biol. 2017, 23, 5006–5020. [Google Scholar] [CrossRef]
  9. Welker, J.M.; Fahnestock, J.T.; Henry, G.H.R.; O’dea, K.W.; Chimner, R.A. CO2 exchange in three Canadian High Arctic ecosystems: Response to long-term experimental warming. Glob. Chang. Biol. 2004, 10, 1981–1995. [Google Scholar] [CrossRef]
  10. Björk, R.G.; Majdi, H.; Klemedtsson, L.; Lewis-Jonsson, L.; Molau, U. Long-term warming effects on root morphology, root mass distribution, and microbial activity in two dry tundra plant communities in northern Sweden. New Phytol. 2007, 176, 862–873. [Google Scholar] [CrossRef]
  11. Schollert, M.; Kivimäenpää, M.; Valolahti, H.M.; Rinnan, R. Climate change alters leaf anatomy, but has no effects on volatile emissions from arctic plants. Plant Cell Environ. 2015, 38, 2048–2060. [Google Scholar] [CrossRef]
  12. Slot, M.; Winter, K. In Situ temperature response of photosynthesis of 42 tree and liana species in the canopy of two Panamanian lowland tropical forests with contrasting rainfall regimes. New Phytol. 2017, 214, 1103–1117. [Google Scholar] [CrossRef]
  13. Oberbauer, S.F.; Tweedie, C.E.; Welker, J.M.; Fahnestock, J.T.; Henry, G.H.R.; Webber, P.J.; Hollister, R.D.; Walker, M.D.; Kuchy, A.; Elmore, E.; et al. Tundra CO2 fluxes in response to experimental warming across latitudinal and moisture gradients. Ecol. Monogr. 2007, 77, 221–238. [Google Scholar] [CrossRef]
  14. Huemmrich, K.F.; Kinoshita, G.; Gamon, J.A.; Houston, S.; Kwon, H.; Oechel, W.C. Tundra carbon balance under varying temperature and moisture regimes. J. Geophys. Res. 2010, 115, G00I02. [Google Scholar] [CrossRef]
  15. Natali, S.M.; Schuur, E.A.G.; Trucco, C.; Pries, C.E.H.; Crummer, K.G.; Lopez, A.F.B. Effects of experimental warming of air, soil and permafrost on carbon balance in Alaskan tundra. Glob. Chang. Biol. 2011, 17, 1394–1407. [Google Scholar] [CrossRef]
  16. Natali, S.M.; Schuur, E.A.G.; Webb, E.E.; Pries, C.E.H.; Crummer, K.G. Permafrost degradation stimulates carbon loss from experimentally warmed tundra. Ecology 2014, 95, 602–608. [Google Scholar] [CrossRef] [Green Version]
  17. Sáez, P.L.; Cavieres, L.A.; Galmés, J.; Gil-Pelegrín, E.; Peguero-Pina, J.J.; Sancho-Knapik, D.; Vivas, M.; Sanhueza, C.; Ramírez, C.F.; Rivera, B.K.; et al. In Situ warming in the Antarctic: Effects on growth and photosynthesis in Antarctic vascular plants. New Phytol. 2018, 218, 1406–1418. [Google Scholar] [CrossRef]
  18. Danby, R.K.; Hik, D.S. Responses of white spruce (Picea glauca) to experimental warming at a subarctic alpine treeline. Glob. Chang. Biol. 2007, 13, 437–451. [Google Scholar] [CrossRef]
  19. Hudson, J.M.G.; Henry, G.H.R.; Cornwell, W.K. Taller and larger: Shifts in Arctic tundra leaf traits after 16 years of experimental warming. Glob. Chang. Biol. 2011, 17, 1013–1021. [Google Scholar] [CrossRef]
  20. Hartikainen, K.; Nerg, A.-M.; Kivimäenpää, M.; Kontunen-Soppela, S.; Mäenpää, M.; Oksanen, E.; Rousi, M.; Holopainen, T. Emissions of volatile organic compounds and leaf structural characteristics of European aspen (Populus tremula) grown under elevated ozone and temperature. Tree Physiol. 2009, 29, 1163–1173. [Google Scholar] [CrossRef]
  21. Schollert, M.; Kivimäenpää, M.; Michelsen, A.; Blok, D.; Rinnan, R. Leaf anatomy, BVOC emission and CO2 exchange of arctic plants following snow addition and summer warming. Ann. Bot. 2017, 119, 433–445. [Google Scholar] [CrossRef]
  22. Cavieres, L.A.; Sáez, P.; Sanhueza, C.; Sierra-Almeida, A.; Rabert, C.; Corcuera, L.J.; Alberdi, M.; Bravo, L.A. Ecophysiological traits of Antarctic vascular plants: Their importance in the responses to climate change. Plant Ecol. 2016, 217, 343–358. [Google Scholar] [CrossRef]
  23. Hernández-Fuentes, C.; Bravo, L.A.; Cavieres, L.A. Photosynthetic responses and photoprotection strategies of Phacelia secunda plants exposed to experimental warming at different elevations in the central Chilean Andes. Alp. Bot. 2015, 125, 87–99. [Google Scholar] [CrossRef]
  24. Sharp, E.D.; Sullivan, P.F.; Steltzer, H.; Csank, A.Z.; Welker, J.M. Complex carbon cycle responses to multi-level warming and supplemental summer rain in the high Arctic. Glob. Chang. Biol. 2013, 19, 1780–1792. [Google Scholar] [CrossRef]
  25. Carroll, C.J.W.; Knapp, A.K.; Martin, P.H. Dominant tree species of the Colorado Rockies have divergent physiological and morphological responses to warming. For. Ecol. Manag. 2017, 402, 234–240. [Google Scholar] [CrossRef]
  26. Berry, J.; Björkman, O. Photosynthetic response and adaptation to temperature in higher plants. Annu. Rev. Plant Physiol. 1980, 31, 491–543. [Google Scholar] [CrossRef]
  27. Yamori, W.; Hikosaka, K.; Way, D.A. Temperature response of photosynthesis in C3, C4, and CAM plants: Temperature acclimation and temperature adaptation. Photosynth. Res. 2014, 119, 101–117. [Google Scholar] [CrossRef]
  28. Bacelar, E.A.; Correia, C.M.; Moutinho-Pereira, J.M.; Gonçalves, B.C.; Lopes, J.I.; Torres-Pereira, J.M.G. Sclerophylly and leaf anatomical traits of five field-grown olive cultivars growing under drought conditions. Tree Physiol. 2004, 24, 233–239. [Google Scholar] [CrossRef]
  29. Luomala, E.M.; Laitinen, K.; Sutinen, S.; Kellomäki, S.; Vapaavuori, E. Stomatal density, anatomy and nutrient concentrations of Scots pine needles are affected by elevated CO2 and temperature. Plant Cell Environ. 2005, 28, 733–749. [Google Scholar] [CrossRef]
  30. Chartzoulakis, K.; Bosabalidis, A.; Patakas, A.; Vemmos, S. Effects of water stress on water relations, gas exchange and leaf structure of olive tree. Acta Hortic. 2000, 537, 241–247. [Google Scholar] [CrossRef]
  31. Liu, Q.J.; Zhang, G.C.; Xu, Q.Q.; Wang, Y.D.; Wang, H.M. Simulation of soil respiration in response to temperature under snowpacks in the Changbai Mountain, China. Chinese J. Plant Ecol. 2010, 34, 477–487. [Google Scholar]
  32. Zhou, Y.M.; Frank, H.; Zhou, C.L.; Jiang, X.J.; Wang, X.X.; Li, M.-H. Experimental warming of a mountain tundra increases soil CO2 effluxes and enhances CH4 and N2O uptake at Changbai Mountain, China. Sci. Rep. 2016, 6, 21108. [Google Scholar] [CrossRef]
  33. Zong, S.; Jin, Y.; Xu, J.; Wu, Z.; He, H.; Du, H.; Wang, L. Nitrogen deposition but not climate warming promotes Deyeuxia angustifolia encroachment in alpine tundra of the Changbai Mountains, Northeast China. Sci. Total Environ. 2016, 544, 85–93. [Google Scholar] [CrossRef]
  34. Prioul, J.L.; Chartier, P. Partitioning of transfer and carboxylation components of intracellular resistance to photosynthetic CO2 fixation: A critical analysis of the methods used. Ann. Bot. 1977, 41, 789–800. [Google Scholar] [CrossRef]
Figure 1. Light response curves of net photosynthetic rate (Pn) in Dryas octopetala var. asiatica, Rhododendron confertissimum and Vaccinium uliginosum grown in the warming open-top chambers and control plots which were measured on 11 August 2017.
Plants 08 00271 g001
Figure 2. Light-saturated photosynthetic rates (Pmax) and apparent quantum yield (AQY) measured in Dryas octopetala var. asiatica, Rhododendron confertissimum and Vaccinium uliginosum grown in the warming open-top chambers and the control plots during the growing season (July to September) after 7 years’ warming treatment. In the figure, mean values are based on the individuals at least three chambers or control plots.
Plants 08 00271 g002
Figure 3. Leaf length and width in Dryas octopetala var. asiatica, Rhododendron confertissimum and Vaccinium uliginosum grown in the warming open-top chambers and the control plots measured during the growing seasons in 2016 and 2017. In the figure, mean values are those of 32 replicates and different lowercase letters indicate significant differences at the 0.05 level between the warming and the control for each species.
Plants 08 00271 g003
Table 1. Air temperature, air relative humidity, soil temperature at 10 cm depth, and soil water at the scale of daily, daytime and nighttime during the growing seasons in 2016 and 2017.
Parameter 2016 Significance 2017 Significance
OTCsControlsDifferenceOTCsControlsDifference
Daily air temperature (°C)15.313.7+1.6**13.412.0+1.4**
Daily relative humidity (%)8584+1ns7977+2ns
Daily soil temperature at 10 cm depth (°C)13.713.1+0.6ns13.912.9+1.0ns
Daily soil water content (m3 m−3)0.3140.358−0.044***0.2570.309−0.052***
Daytime air temperature (°C)18.716.2+2.5***16.013.1+ 2.9***
Daytime relative humidity (%)78813ns72731ns
Daytime soil temperature at 10 cm depth (°C)17.514.6+2.9***17.814.5−3.3***
Daytime soil water content (m3 m−3)0.3130.358−0.045***0.2570.309−0.052***
Nighttime air temperature (°C)12.111.2+0.9*10.910.6+0.3*
Nighttime relative humidity (%)9186+5ns8680+6ns
Nighttime soil temperature at 10 cm depth (°C)11.311.30ns11.011.2−0.2ns
Nighttime soil water content (m3 m−3)0.3150.358−0.043***0.2570.309−0.052***
Daytime PAR (μmol m−2 s−1)65567621ns722768−46ns
Notes: We artificially separated daytime from 0600 h to 1800 h and nighttime from 1800 h to next 0600 h. *** p < 0.001; ** p < 0.01; * p < 0.05; ns p > 0.05.
Table 2. Statistical results of the effects of warming treatment and measurement date on photosynthetic parameters of Dryas octopetala var. asiatica, Rhododendron confertissimum and Vaccinium uliginosum. Pmax, light-saturated photosynthetic rate. AQY, apparent quantum yield.
Dr. octopetala var. asiaticaRh. confertissimumV. uliginosum
PmaxAQYPmaxAQYPmaxAQY
Treatment******nsns*
Measurement date**nsnsnsns
Interactionnsnsnsnsnsns
Notes: Significance * p < 0.05, ** p < 0.01, *** p < 0.001, ns p > 0.05.
Table 3. The maximal light-saturated photosynthetic rate (Pmax) and apparent quantum yield (AQY) derived from light-response curves for Dryas octopetala var. asiatica, Rhododendron confertissimum and Vaccinium uliginosum grown in the warming open-top chambers and the control plots during the whole growing season. The values in the table are the monthly means based on the data in Figure 2.
JulyAugustSeptemberWhole Growing Season
WarmingControlWarmingControlWarmingControlWarmingControl
Dryas octopetala var. asiatica
Pmax (μmol m−2 s−1)25.615.221.918.19.76.619.113.3
AQY0.0610.0360.0510.0400.0280.0160.0470.031
Rhododendron confertissimum
Pmax (μmol m−2 s−1)24.018.021.116.56.16.017.113.5
AQY0.0340.0260.0270.0300.0090.0180.0230.025
Vaccinium uliginosum
Pmax (μmol m−2 s−1)15.016.114.514.74.99.011.513.2
AQY0.0300.0370.0360.0320.0120.0240.0260.031
Notes: Limited sample size of two in each month prohibited error to be calculated for Pmax and AQY.
Table 4. Leaf anatomy variables for Dryas octopetala var. asiatica, Rhododendron confertissimum and Vaccinium uliginosum collected on 13 July and 18 September 2017 in the open-top chambers and control plots. The different lowercase letters in the same row indicate significant differences at the level of 0.05. (Means ± SE, n = 24).
WarmingControl
JulySeptemberJulySeptember
Dryas octopetala var. asiatica
Leaf thickness (μm)147.2 ± 3.033 a125.4 ± 2.560 b150.0 ± 3.131 a122.5 ± 3.401 b
Palisade thickness (μm)67.7 ± 2.413 a65.7 ± 2.528 a69.2 ± 1.475 a62.6 ± 1.341 a
Palisade: leaf thickness 0.459 ± 0.012 b0.525 ± 0.019 a0.463 ± 0.007 b0.513 ± 0.011 a
Palisade: spongy parenchyma1.343 ± 0.114 b1.790 ± 0.195 a1.241 ± 0.044 b1.532 ± 0.101 ab
Adaxial epidermis length (μm)21.0 ± 0.712 a17.3 ± 0.609 b21.3 ± 0.638 a16.9 ± 1.009 b
Adaxial epidermis thickness (μm)13.8 ± 0.520 a11.2 ± 0.647 b12.9 ± 0.473 a9.7 ± 0.537 b
Abaxial epidermis length (μm)13.5 ± 0.461 a12.3 ± 0.856 ab13.0 ± 0.387 ab11.3 ± 0.931 b
Abaxial epidermis thickness (μm)10.2 ± 0.315 a8.2 ± 0.508 b9.9 ± 0.326 a6.9 ± 0.222 c
Rhododendron confertissimum
Leaf thickness (μm)254.3 ± 10.335 b222.8 ± 11.513 c280.9 ± 6.895 a244.5 ± 7.164 bc
Palisade thickness (μm)63.5 ± 2.933 a65.9 ± 2.796 a69.9 ± 2.890 a70.8 ± 2.164 a
Palisade: leaf thickness 0.252 ± 0.007 b0.301 ± 0.012 a0.247 ± 0.006 b0.293 ± 0.008 a
Palisade: spongy parenchyma0.404 ± 0.020 b0.482 ± 0.031 a0.372 ± 0.012 b0.478 ± 0.022 a
Adaxial epidermis length (μm)20.9 ± 0.583 a17.0 ± 0.545 b18.1 ± 0.494 b17.8 ± 0.680 b
Adaxial epidermis thickness (μm)14.2 ± 0.465 a9.3 ± 0.429 d12.7 ± 0.309 b10.7 ± 0.397 c
Abaxial epidermis length (μm)16.0 ± 0.557 a12.6 ± 0.863 b13.6 ± 0.389 b12.4 ± 0.431 b
Abaxial epidermis thickness (μm)12.2 ± 0.626 a8.6 ± 0.368 c10.5 ± 0.301 b8.9 ± 0.352 c
Cuticula thickness (μm)7.1 ± 0.269 b8.5 ± 0.542 a6.8 ± 0.225 b7.5 ± 0.250 b
Vaccinium uliginosum
Leaf thickness (μm)174.8 ± 2.766 a149.5 ± 4.412 b180.8 ± 4.218 a171.2 ± 4.445 a
Palisade thickness (μm)66.3 ± 1.451 ab67.0 ± 3.013 ab70.5 ± 2.153 a64.0 ± 2.233 b
Palisade: leaf thickness 0.381 ± 0.007 b0.448 ± 0.014 a0.391 ± 0.009 b0.375 ± 0.011 b
Palisade: spongy parenchyma0.793 ± 0.029 b1.008 ± 0.095 a0.886 ± 0.036 ab0.773 ± 0.059 b
Adaxial epidermis length (μm)21.8 ± 0.710 b24.0 ± 1.104 b29.2 ± 0.980 a29.0 ± 1.113 a
Adaxial epidermis thickness (μm)12.3 ± 0.475 b8.1 ± 0.646 c16.0 ± 0.576 a12.3 ± 0.594 b
Abaxial epidermis length (μm)17.8 ± 0.640 b16.3 ± 1.087 b22.0 ± 0.738 a23.2 ± 0.703 a
Abaxial epidermis thickness (μm)9.8 ± 0.280 b6.4 ± 0.618 c12.5 ± 0.515 a10.6 ± 0.611 b

