

Investigation of Epilobium hirsutum L. Optimized Extract’s Anti-Inflammatory and Antitumor Potential


 ,
,  ,
,  ,
, 
 ,
,  , ,
, ,  ,
,  ,
, 
Abstract
1. Introduction
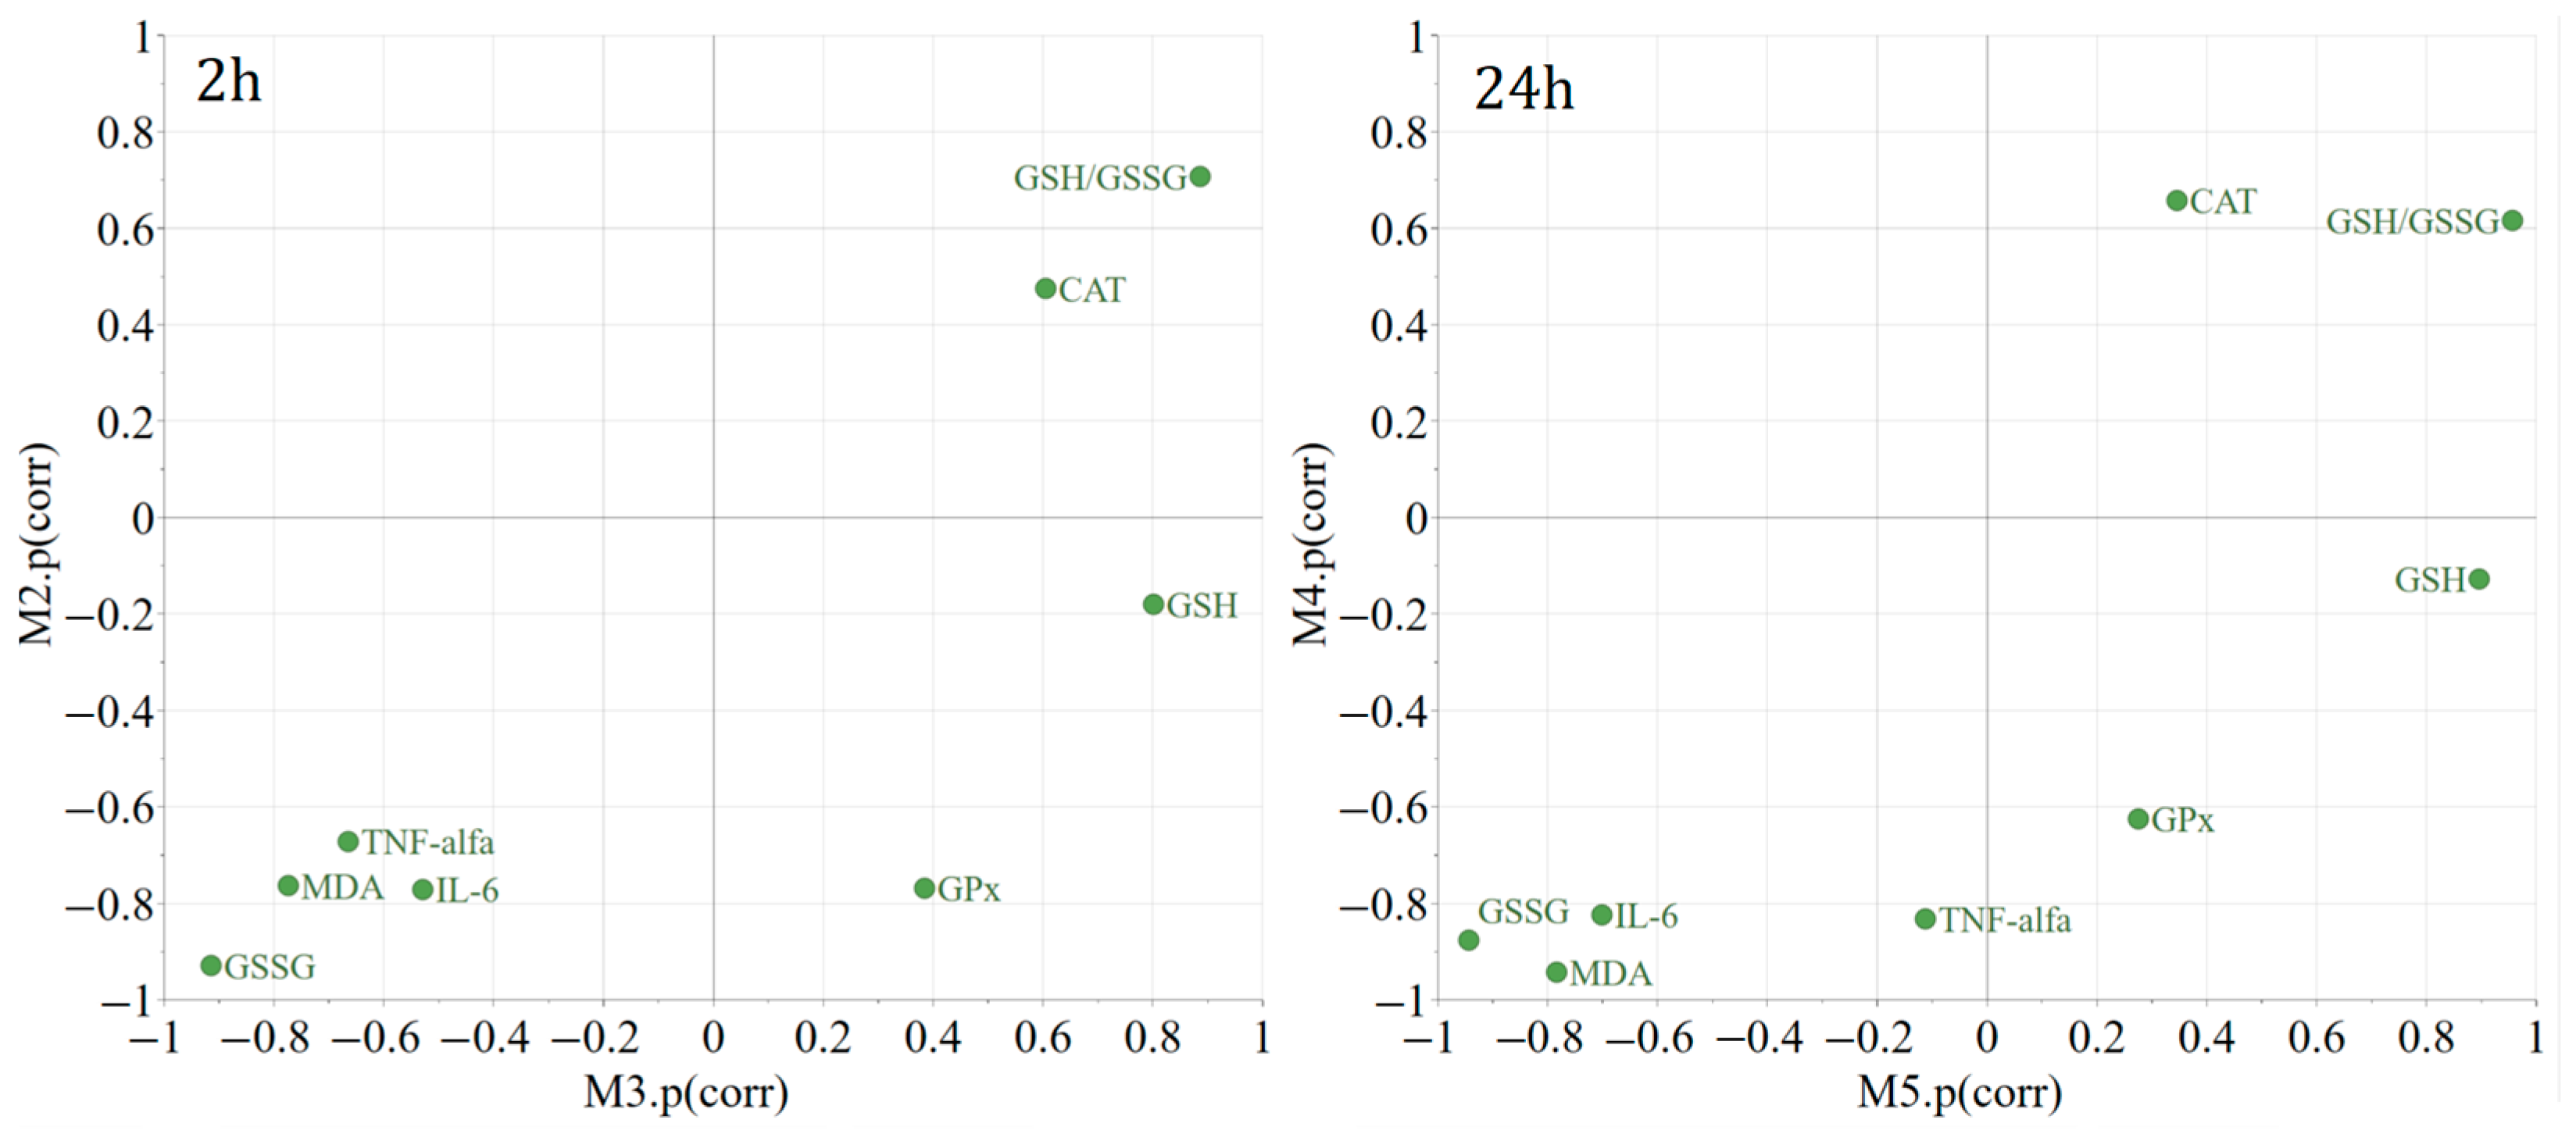
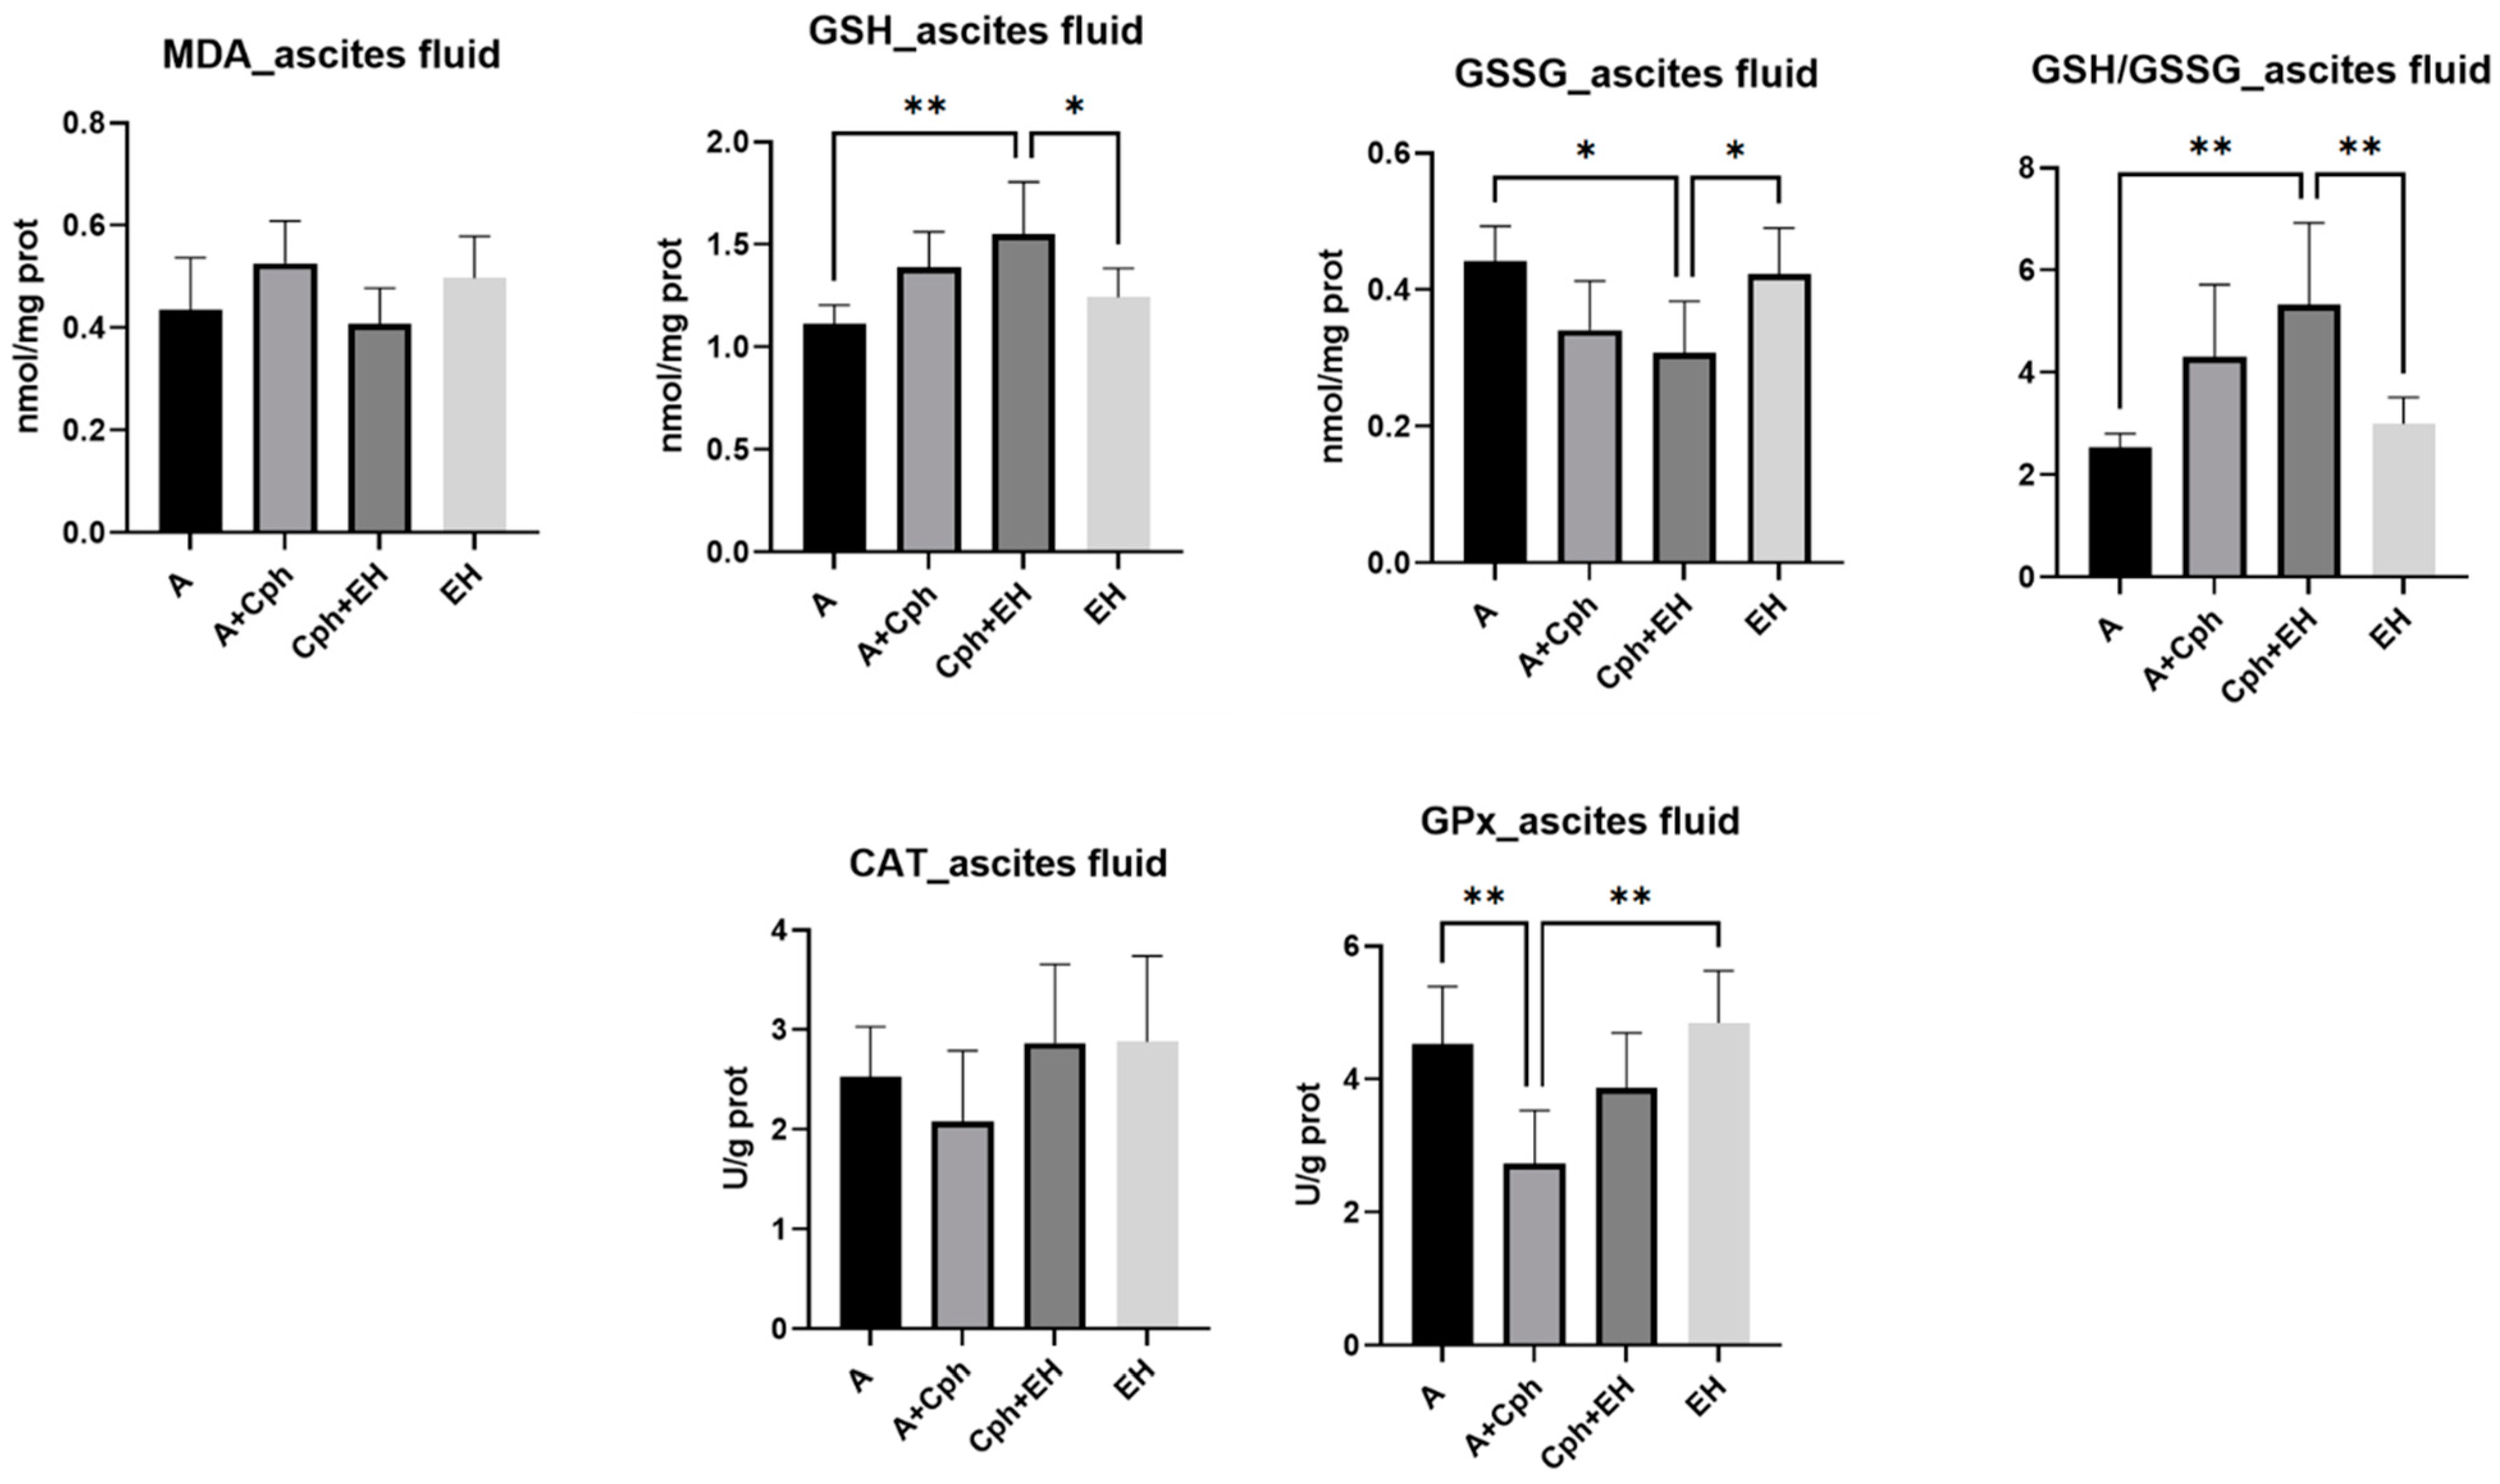
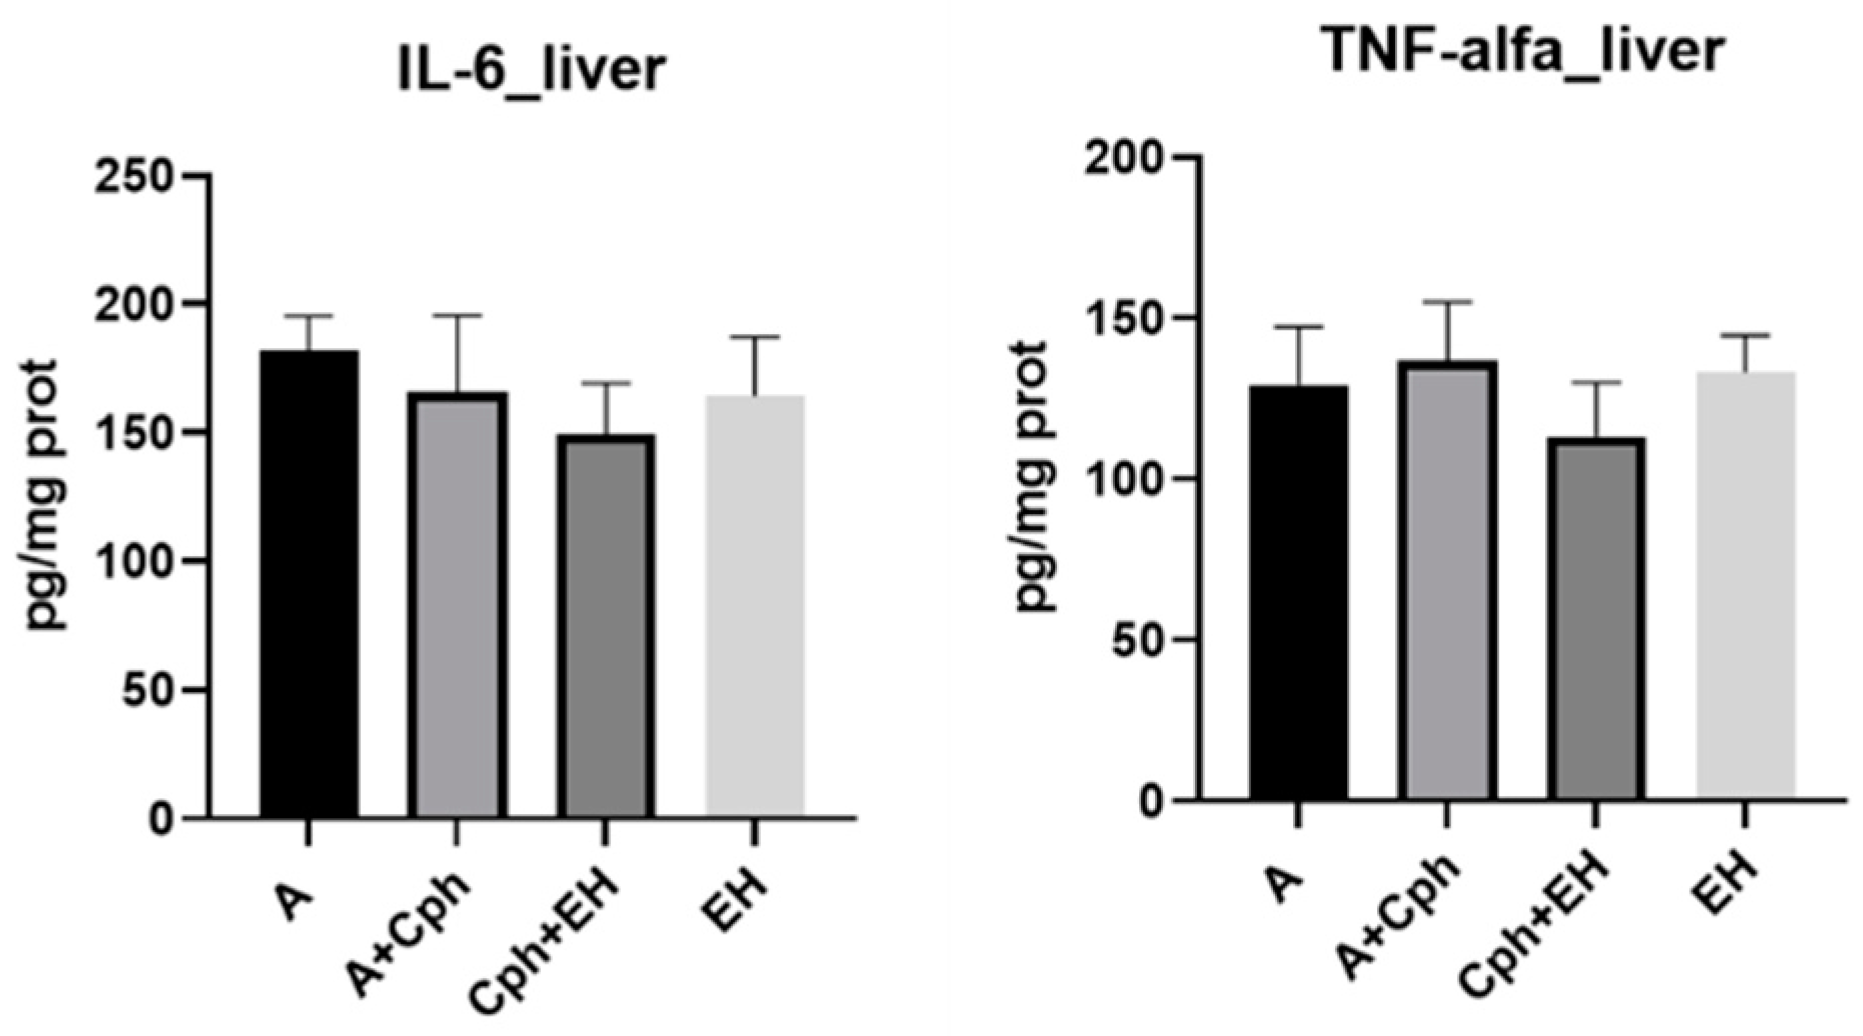
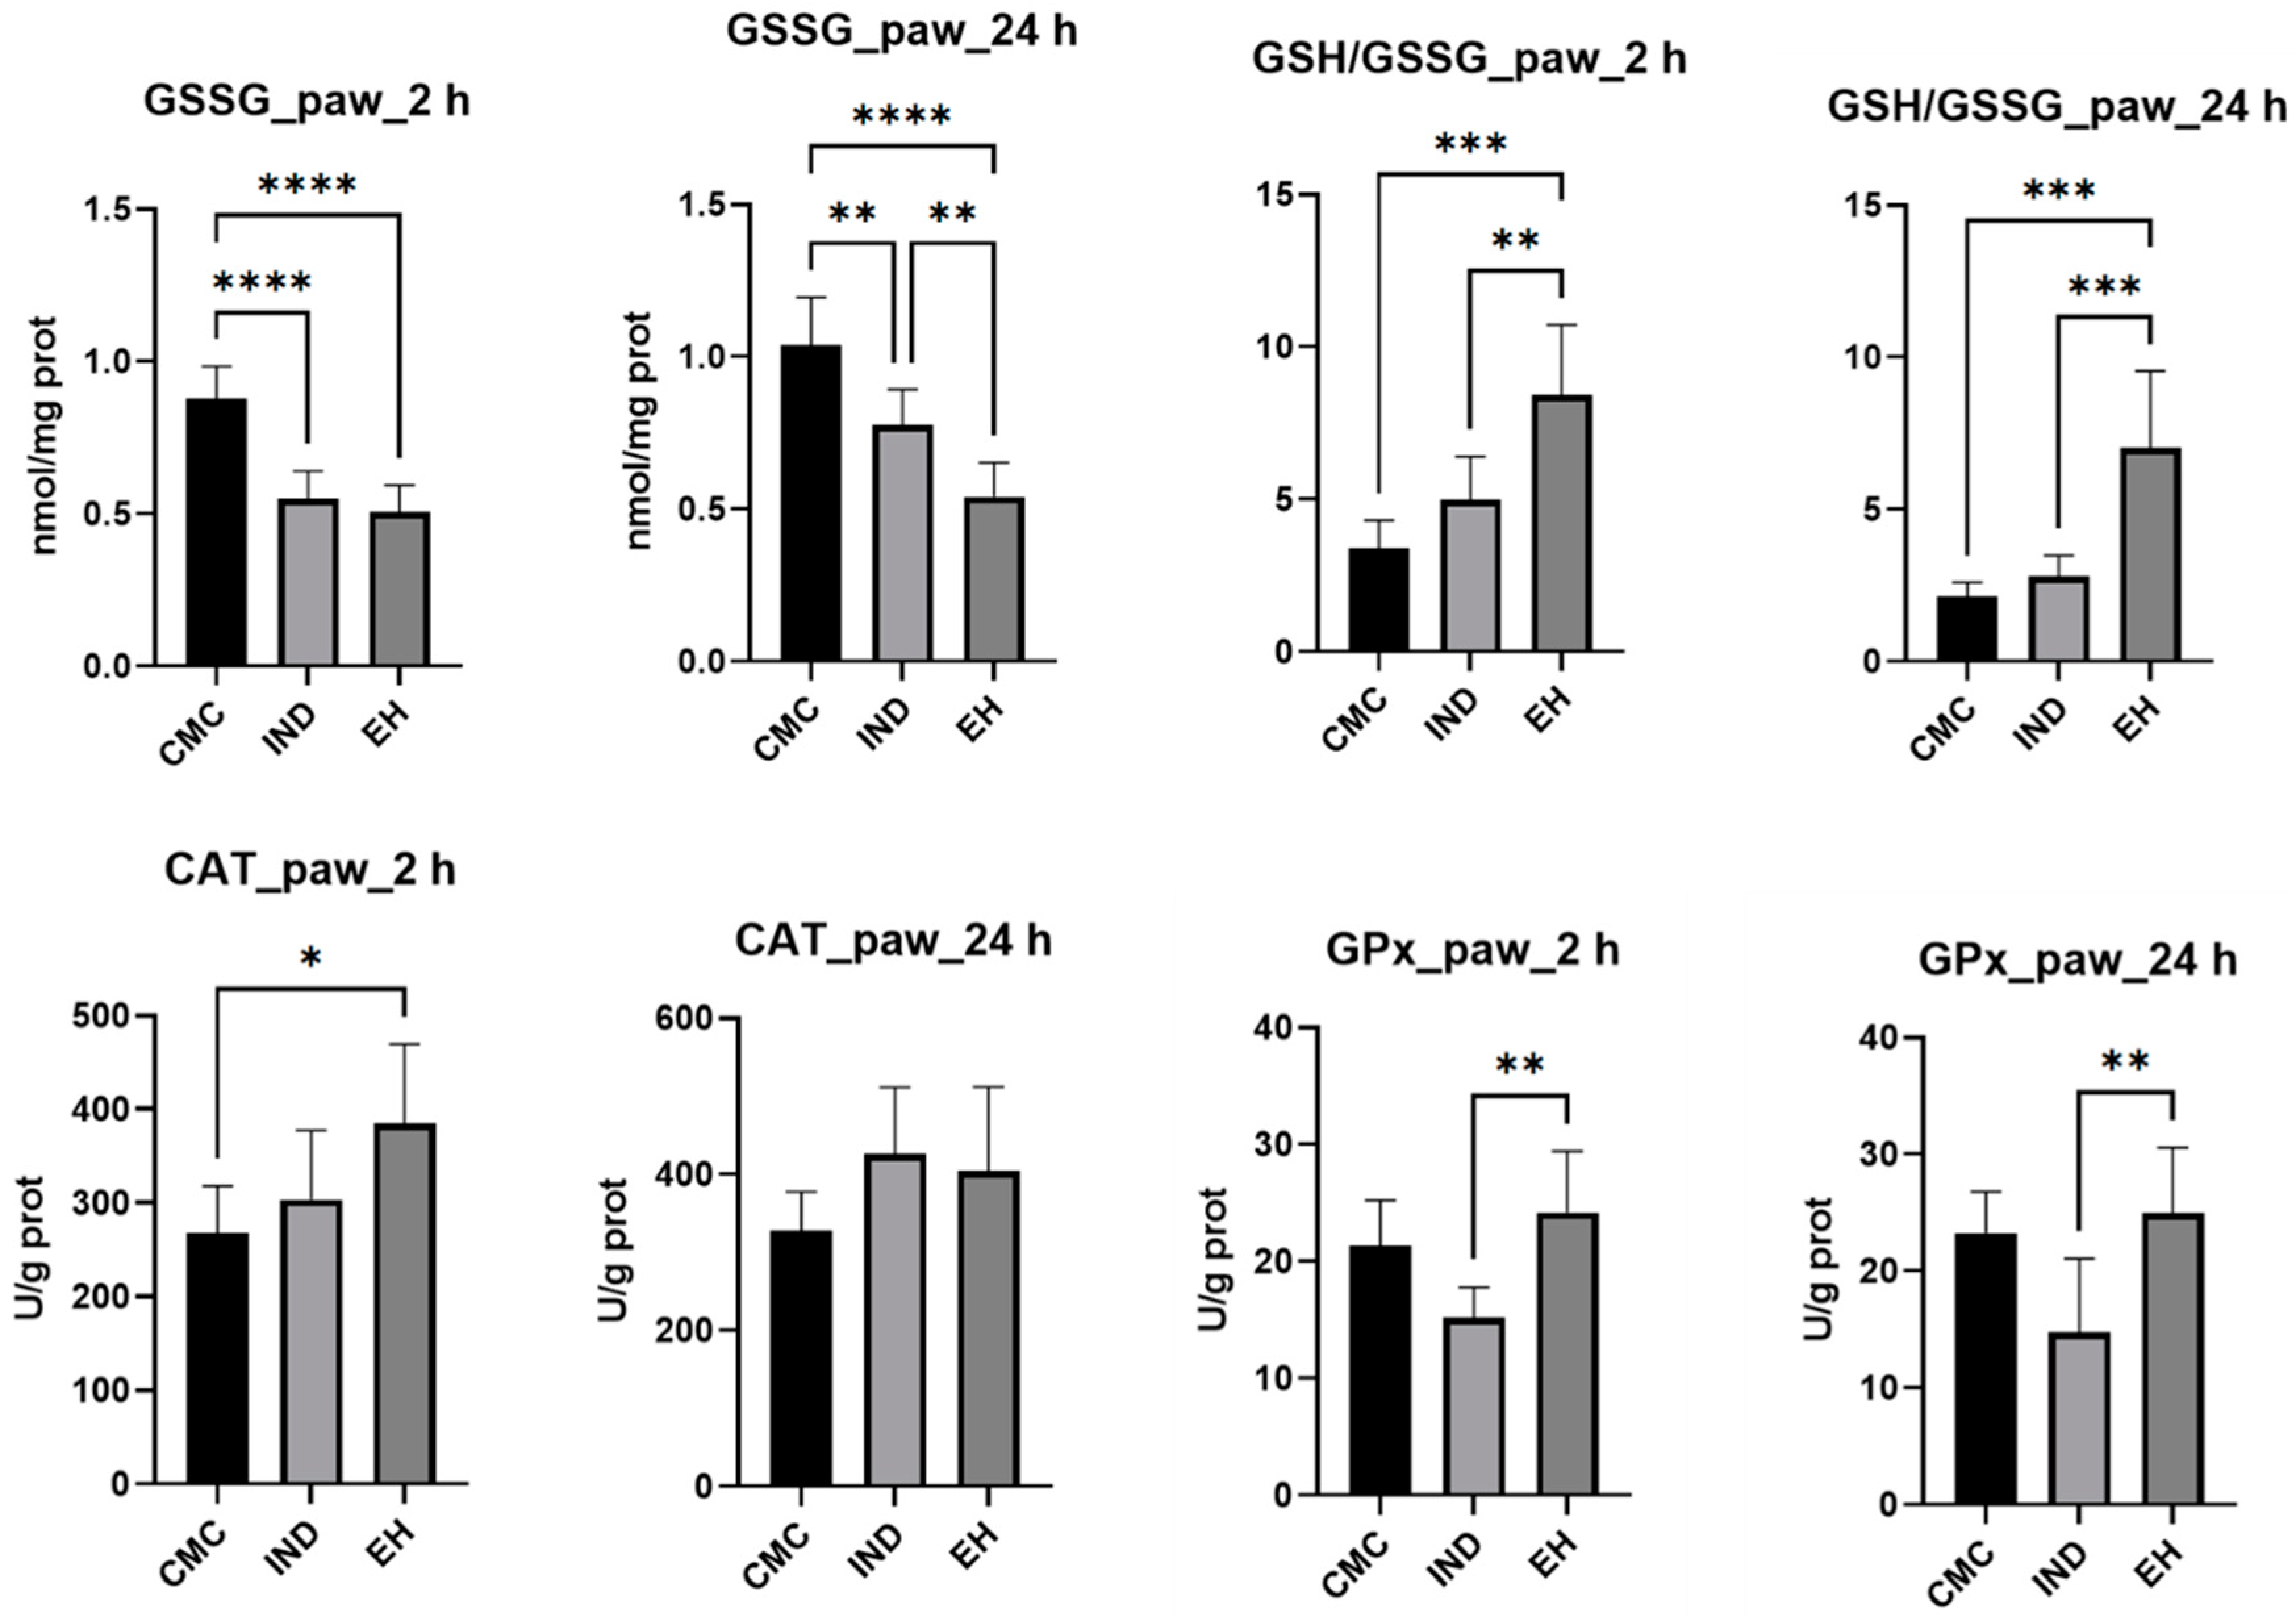
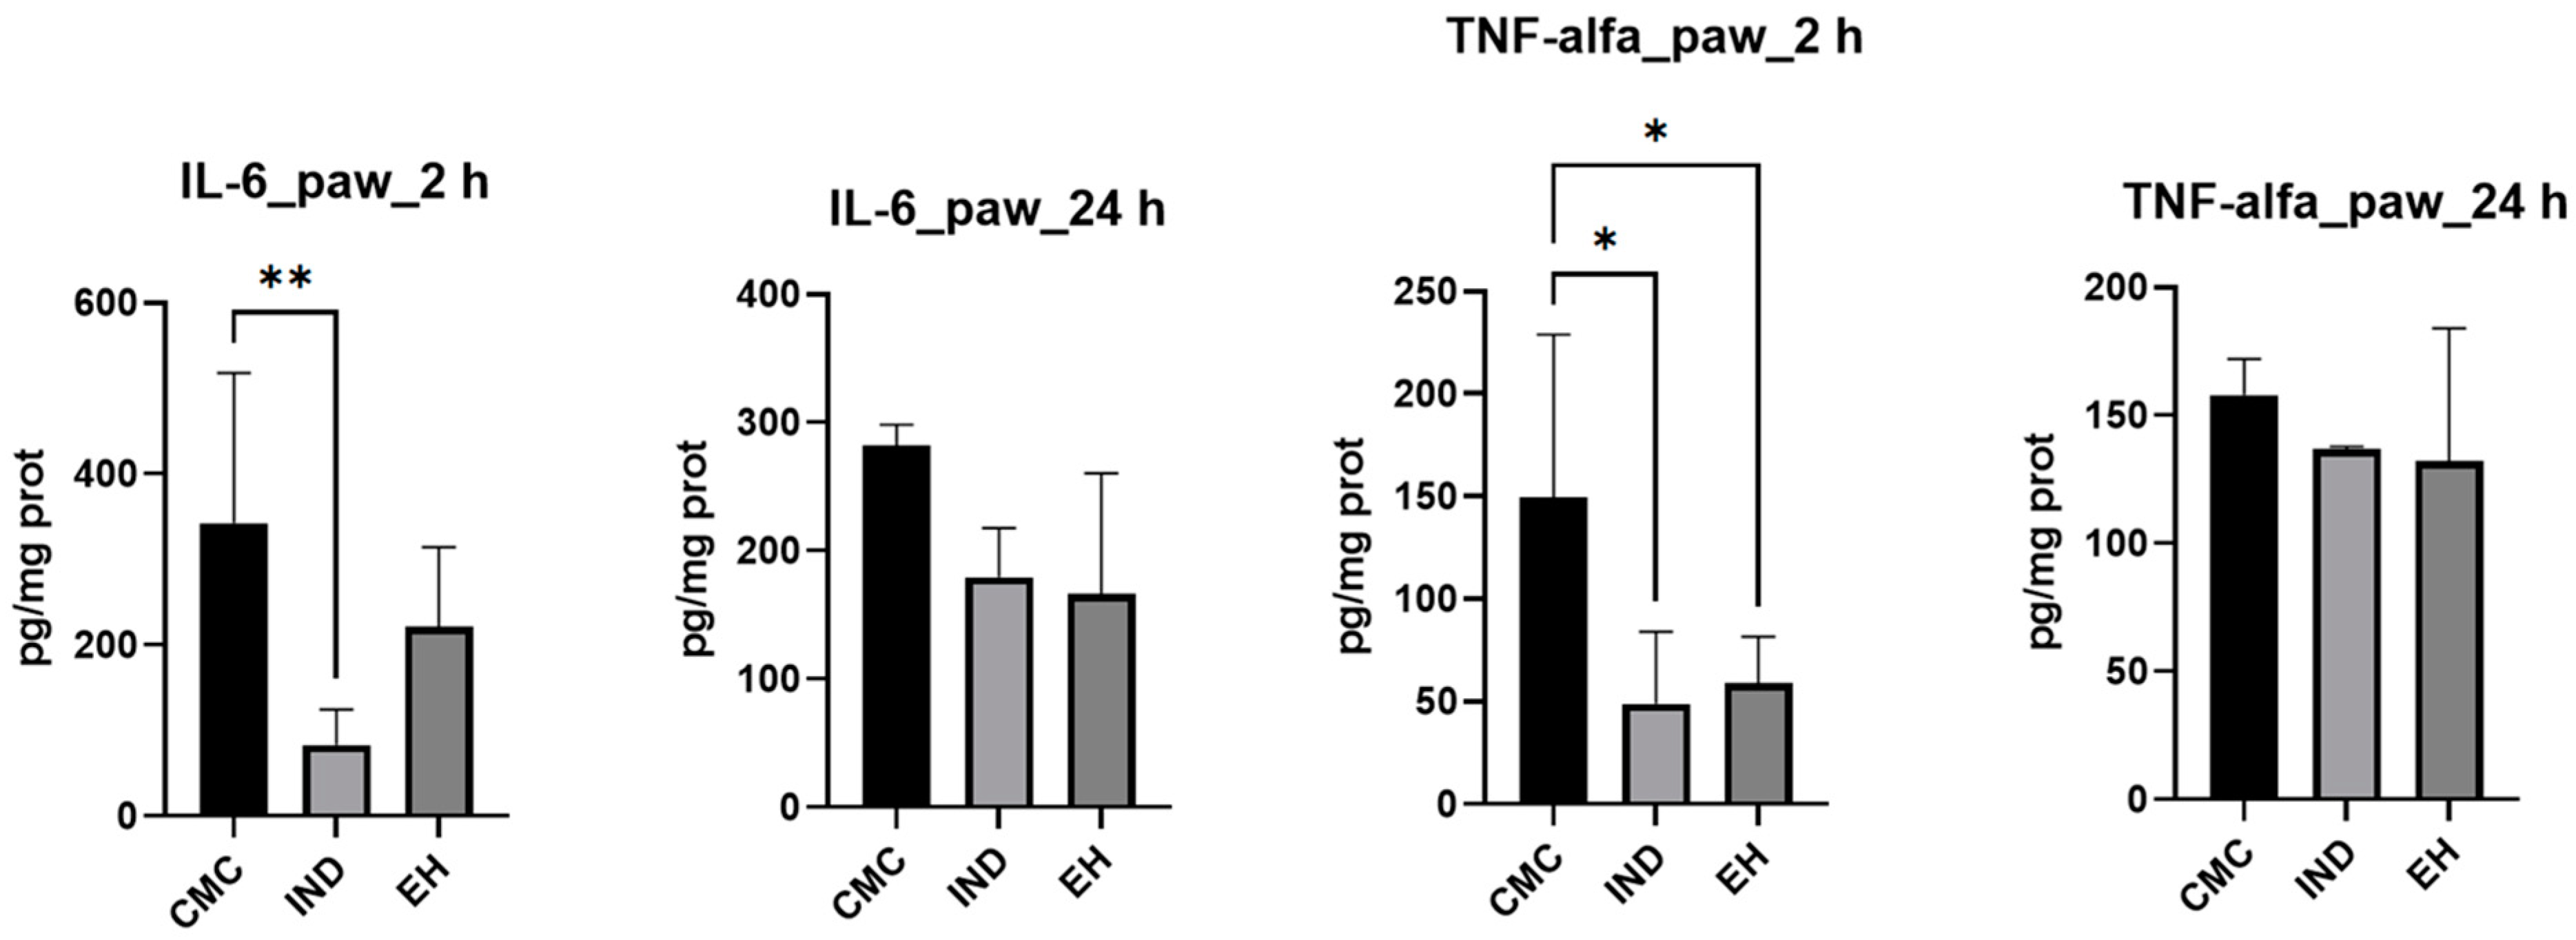
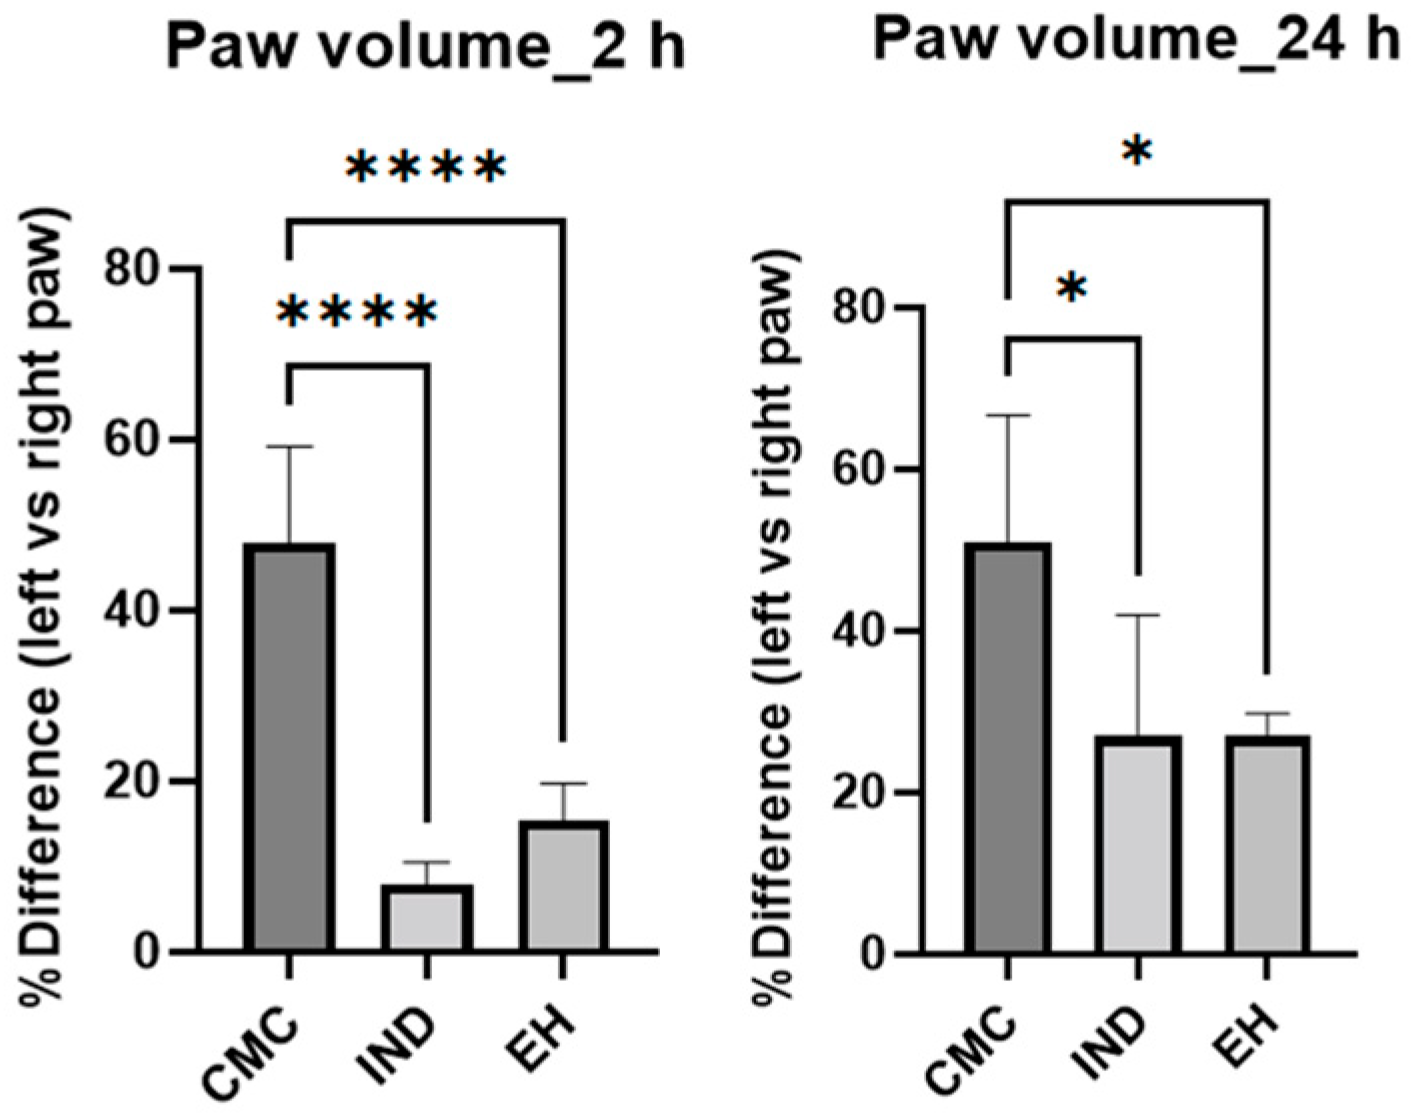
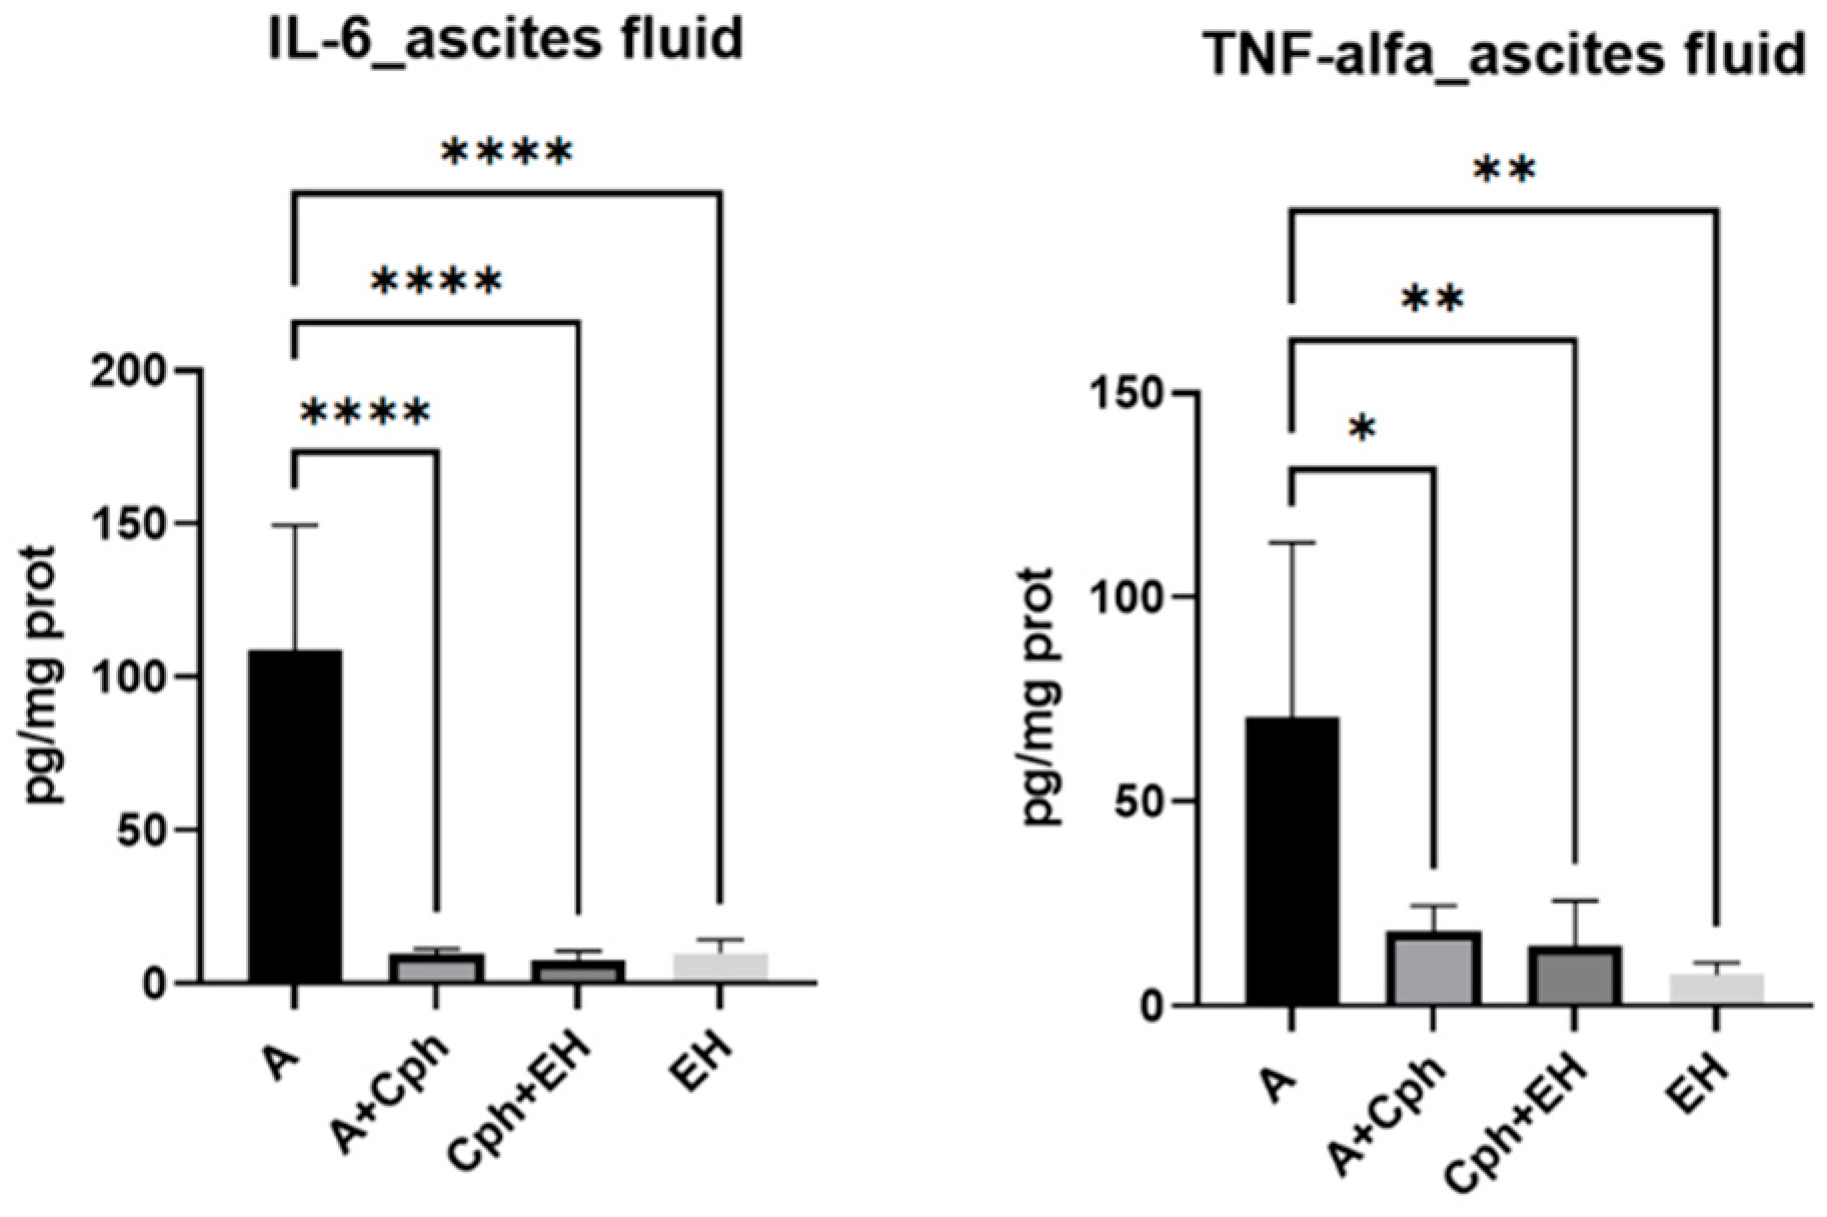
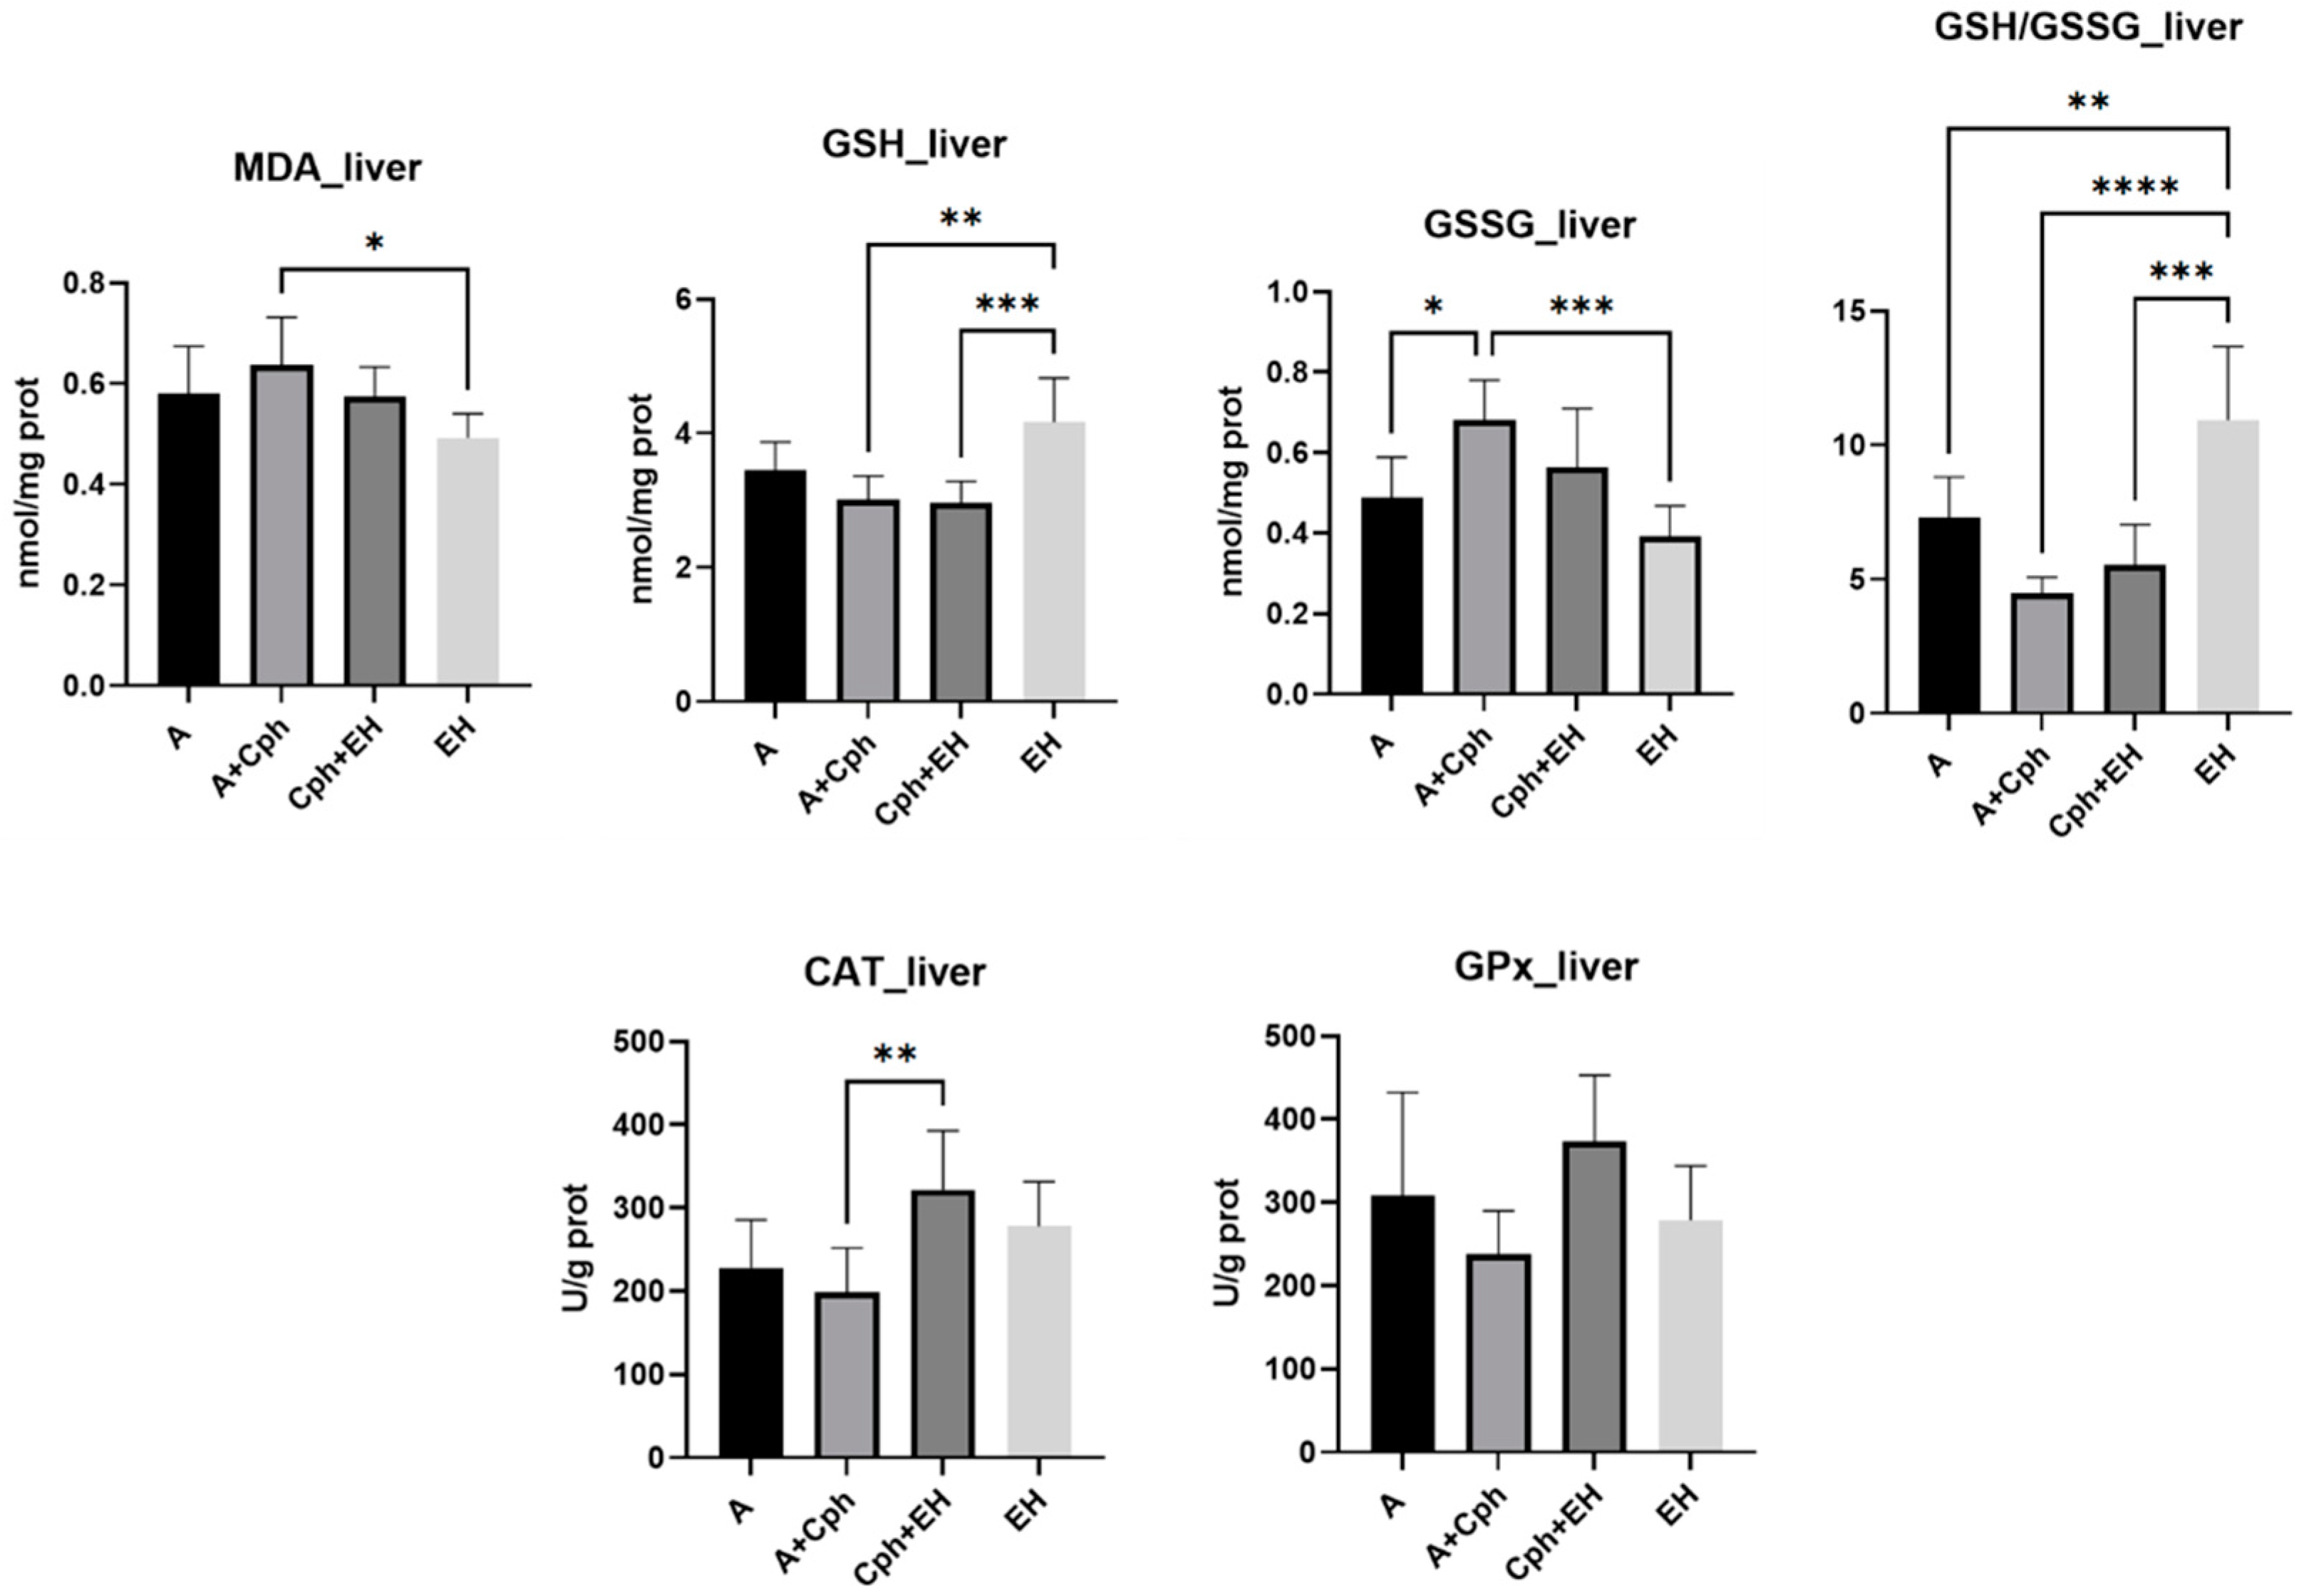
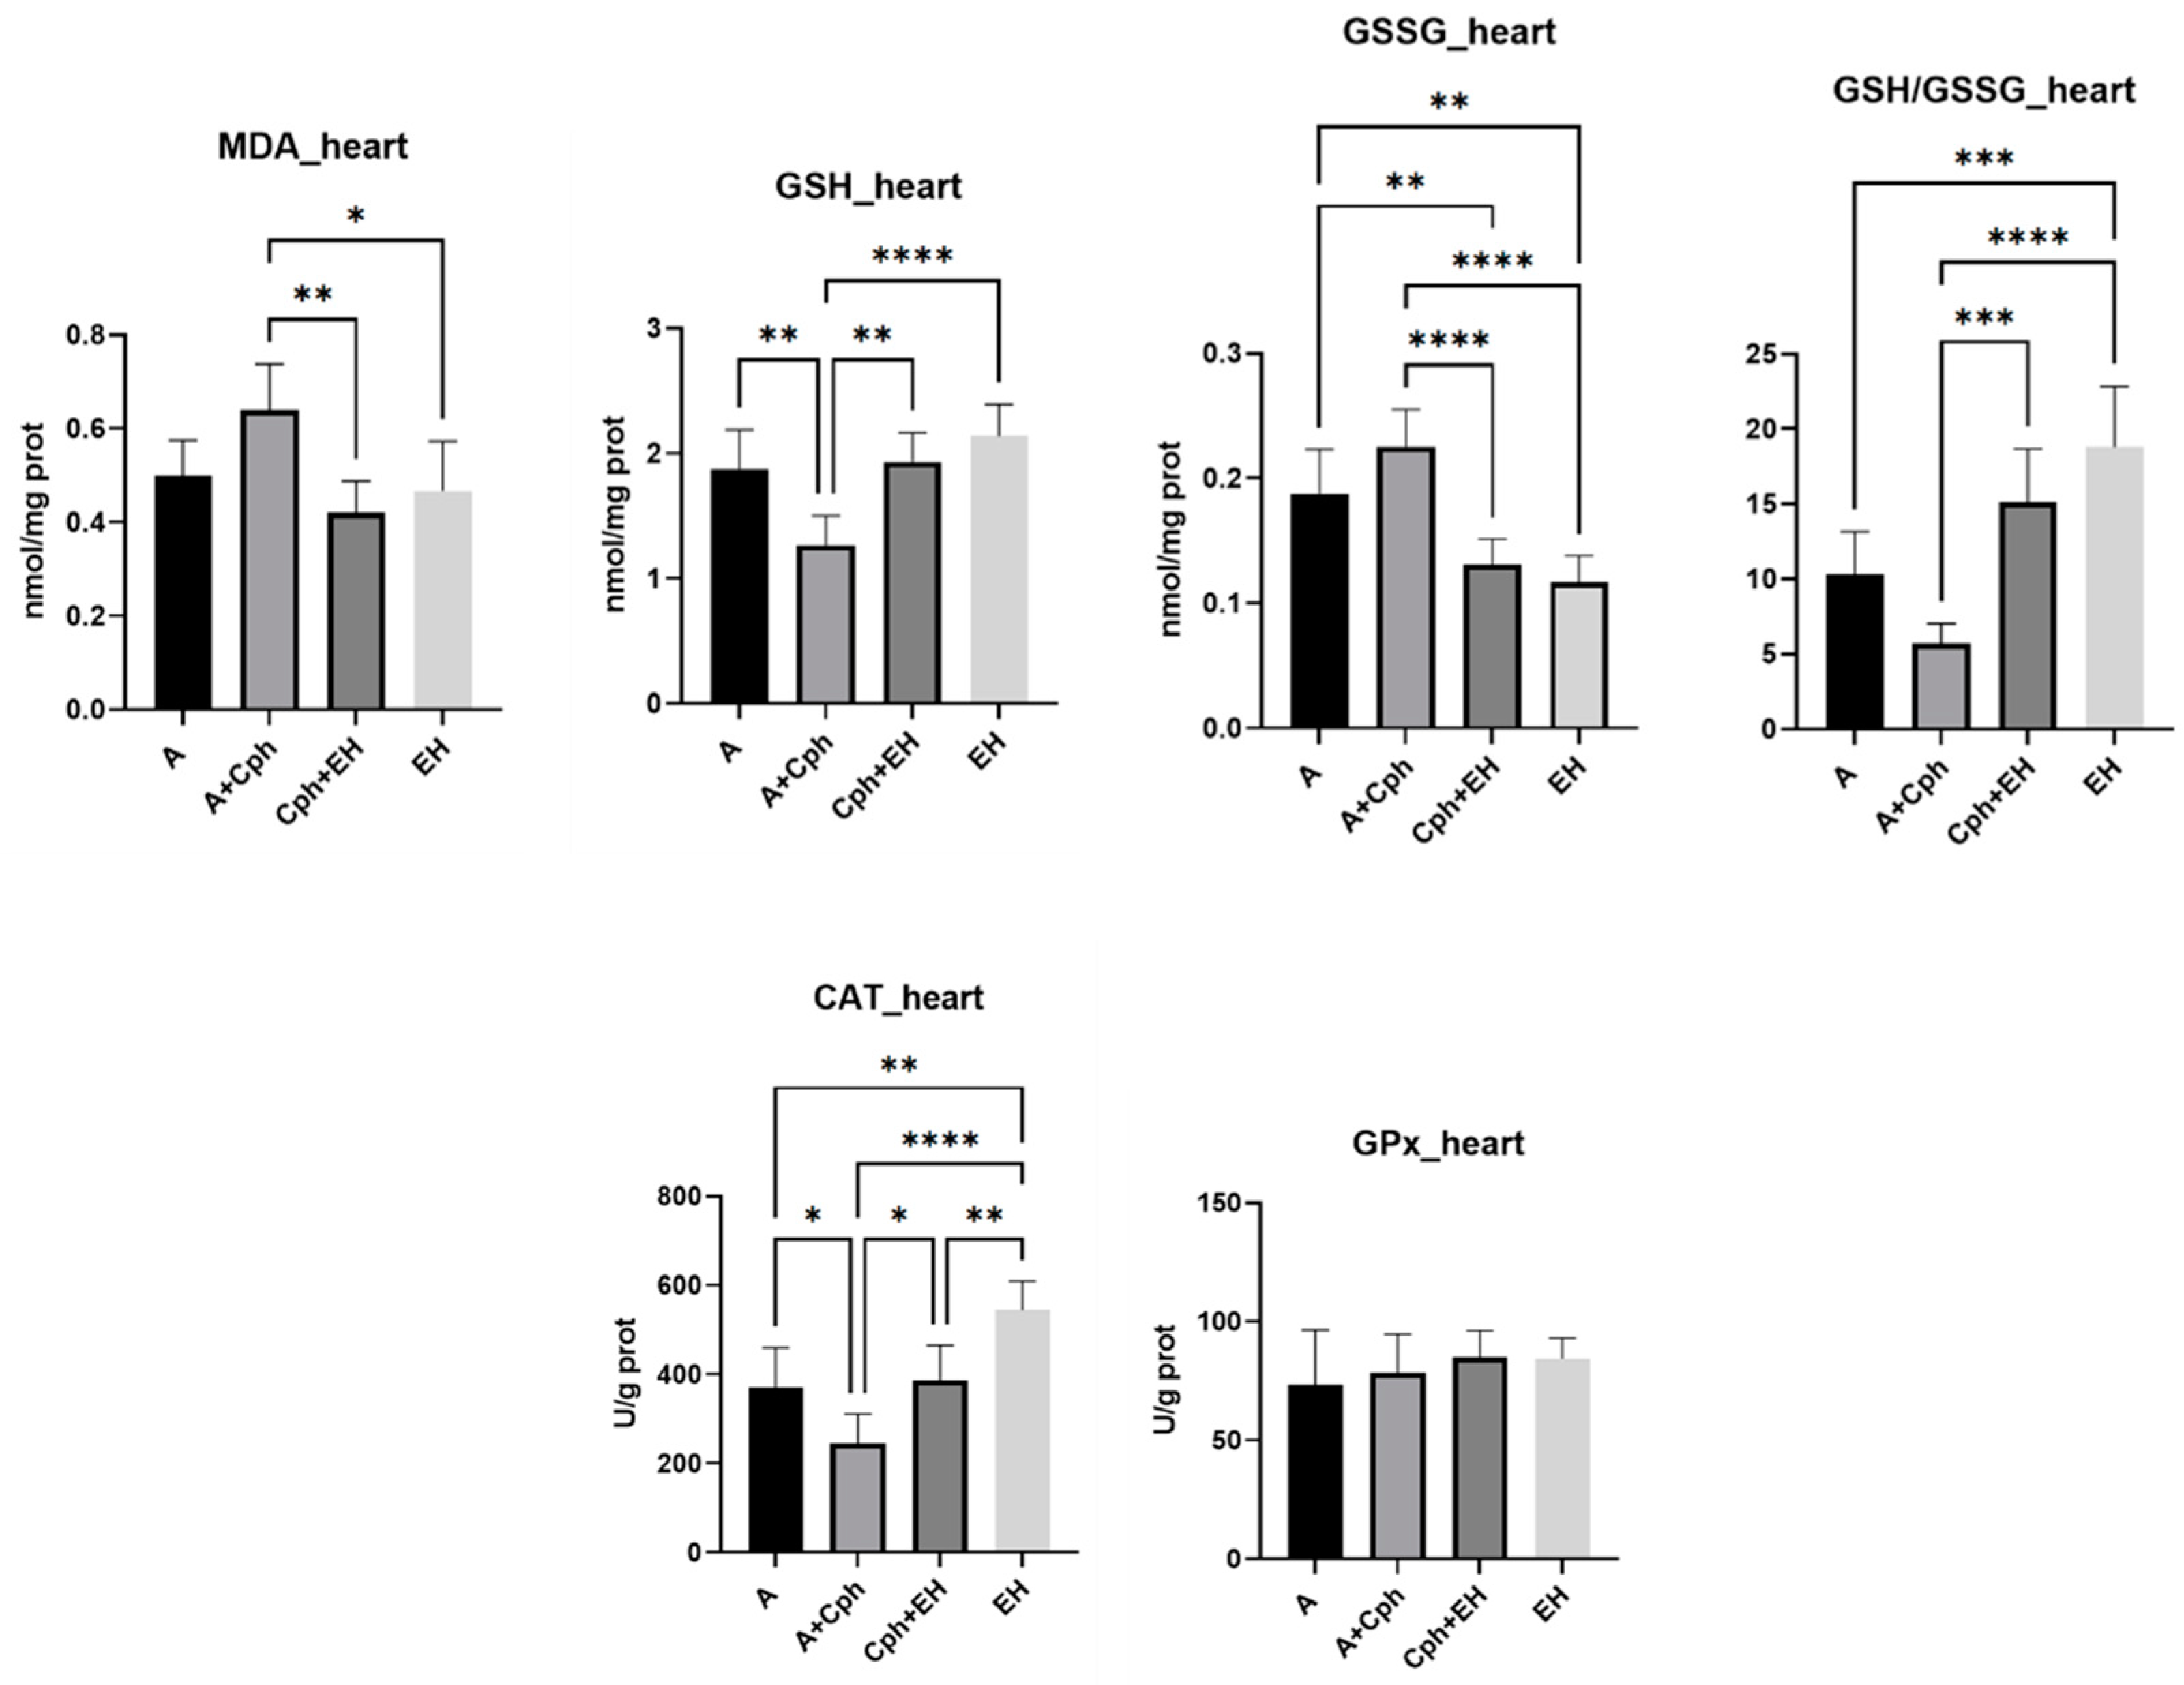
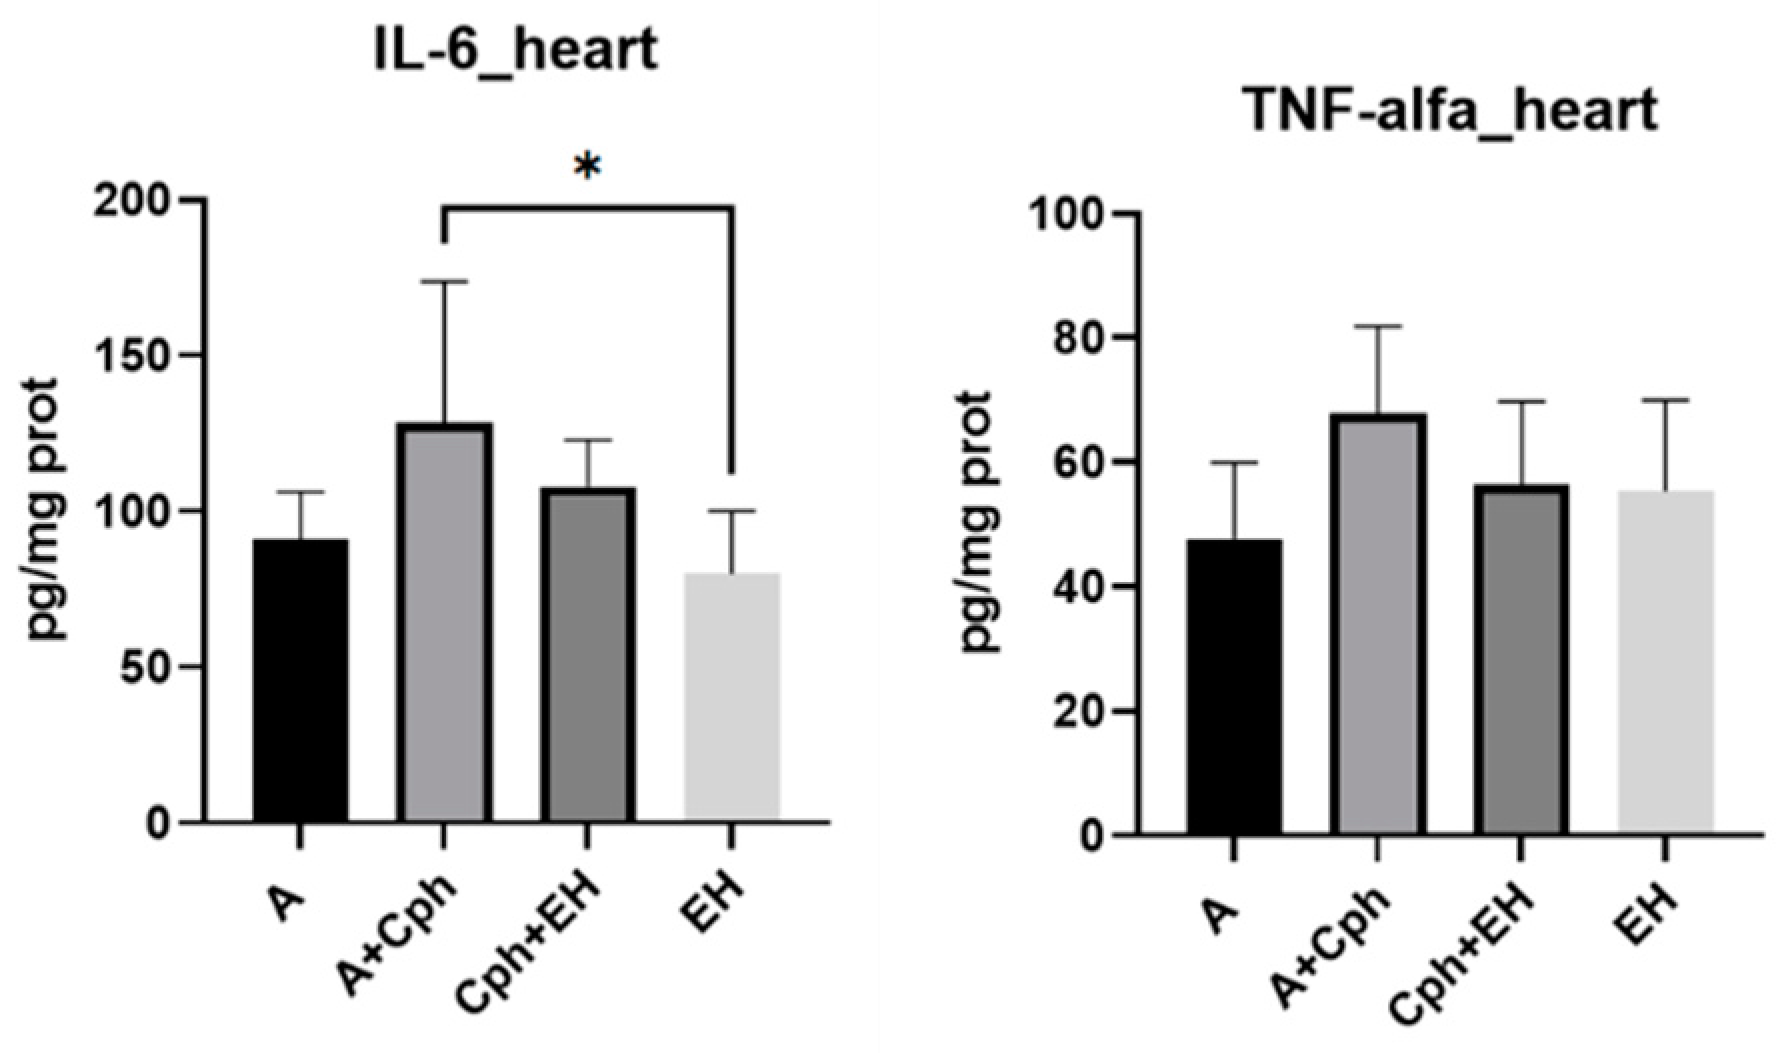
2. Results
3. Discussion
4. Materials and Methods
4.1. Chemical and Reagents
4.2. Plant Material and Extract Preparation
4.3. Phytochemical Characterization of Optimized Extract
4.4. Study Protocol for Animal Testing
4.4.1. Acute Rat Paw Inflammation
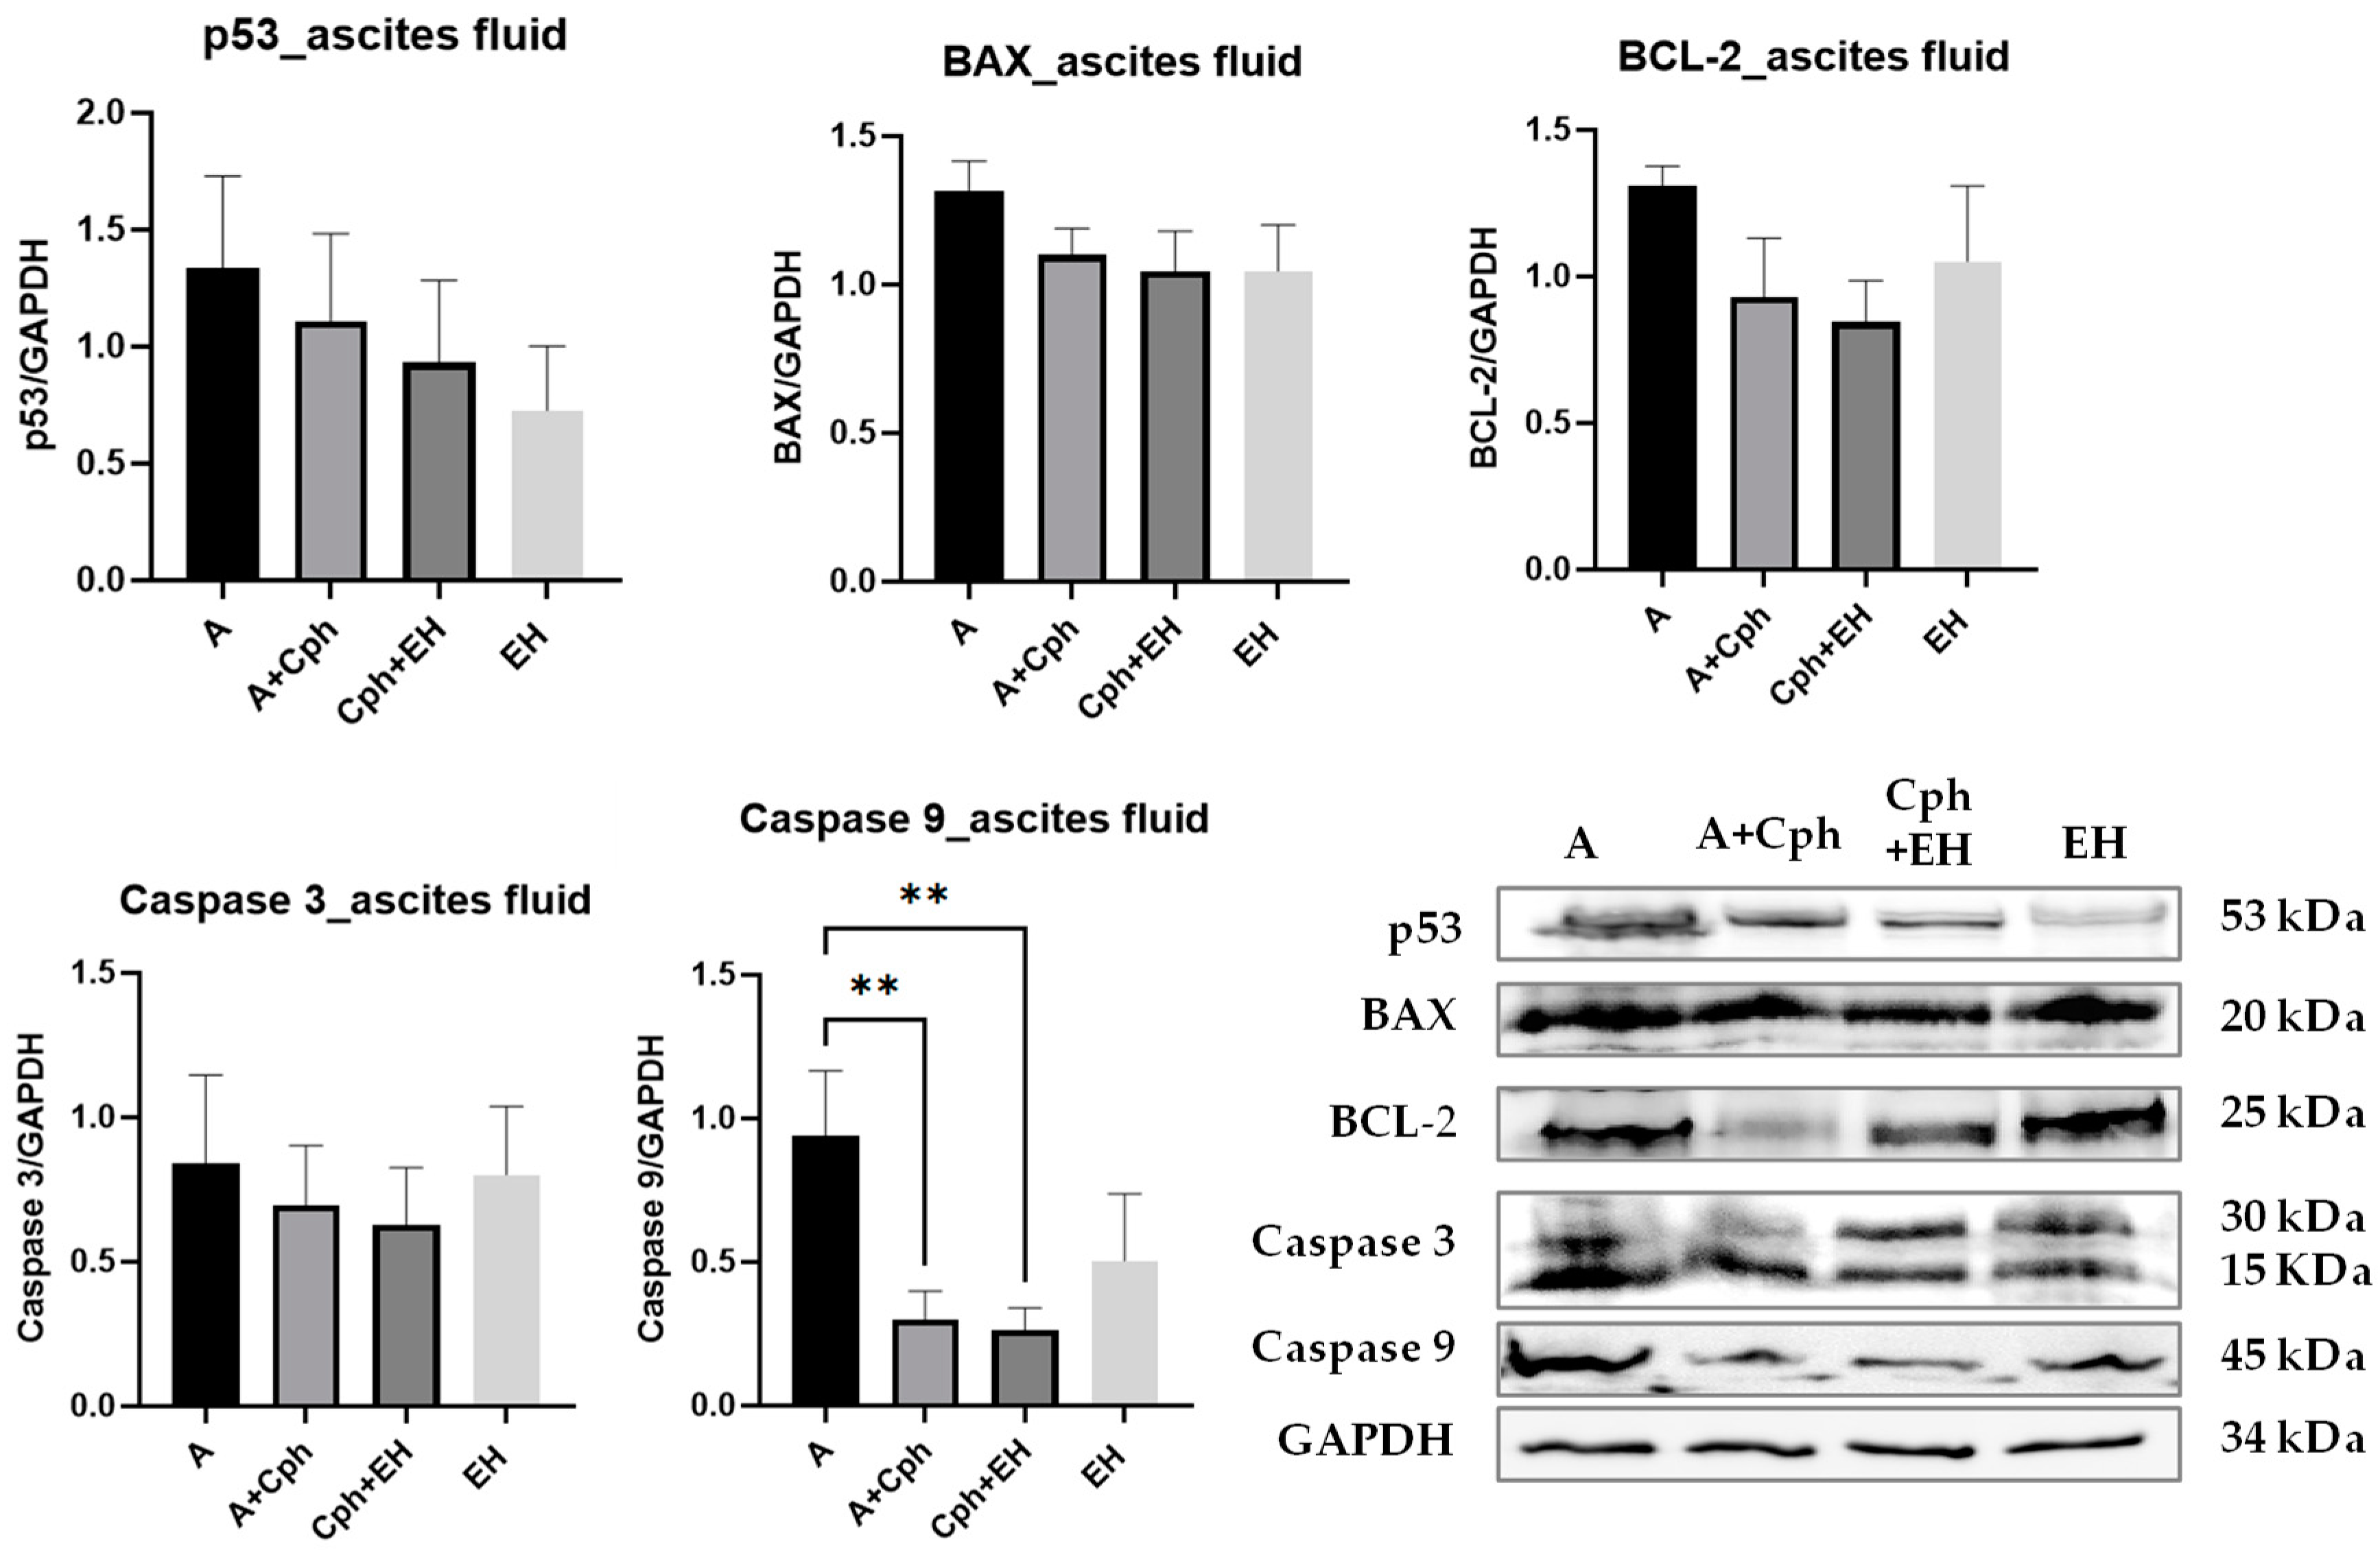
4.4.2. Ehrlich Ascites Carcinoma
- -
- Group 1 received 0.25 mL of 2% carboxymethyl cellulose (CMC), serving as the negative control (A).
- -
- Group 2 received 25 mg per kg of b.w. of cyclophosphamide (Cph), acting as the positive control.
- -
- Group 3 received 25 mg per kg of b.w. of cyclophosphamide (Cph) with 10 mg of oenothein B per 100 g of b.w. from the optimized extract E. hirsutum (Cph + EH).
- -
- Group 4 received 10 mg of oenothein B per 100 g of b.w. from the optimized extract E. hirsutum (EH).
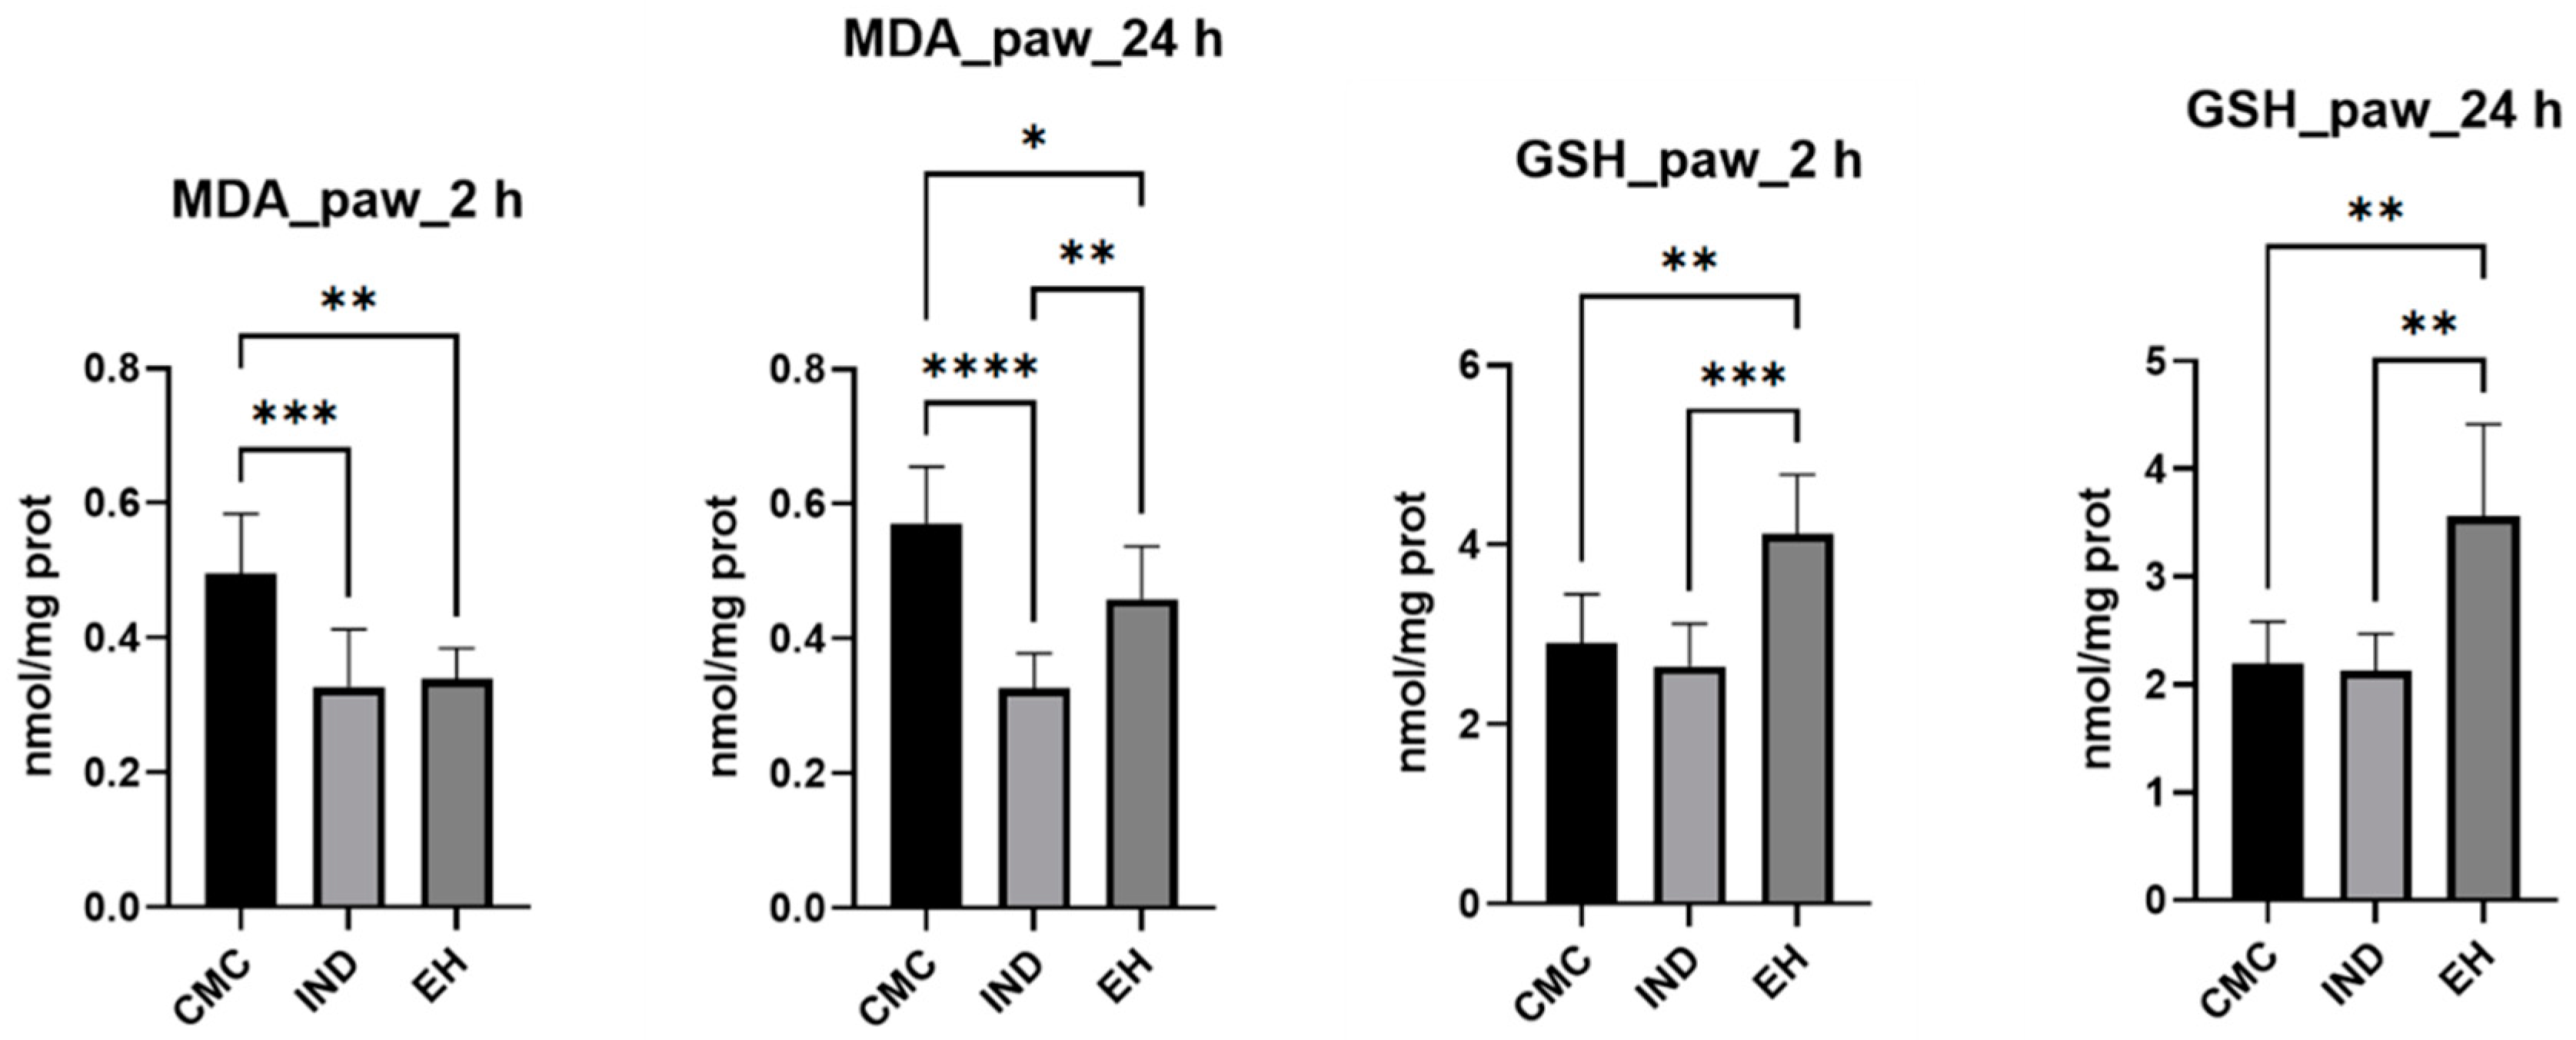
4.5. Oxidative Stress Evaluation
4.6. Proinflammatory Cytokine Investigation
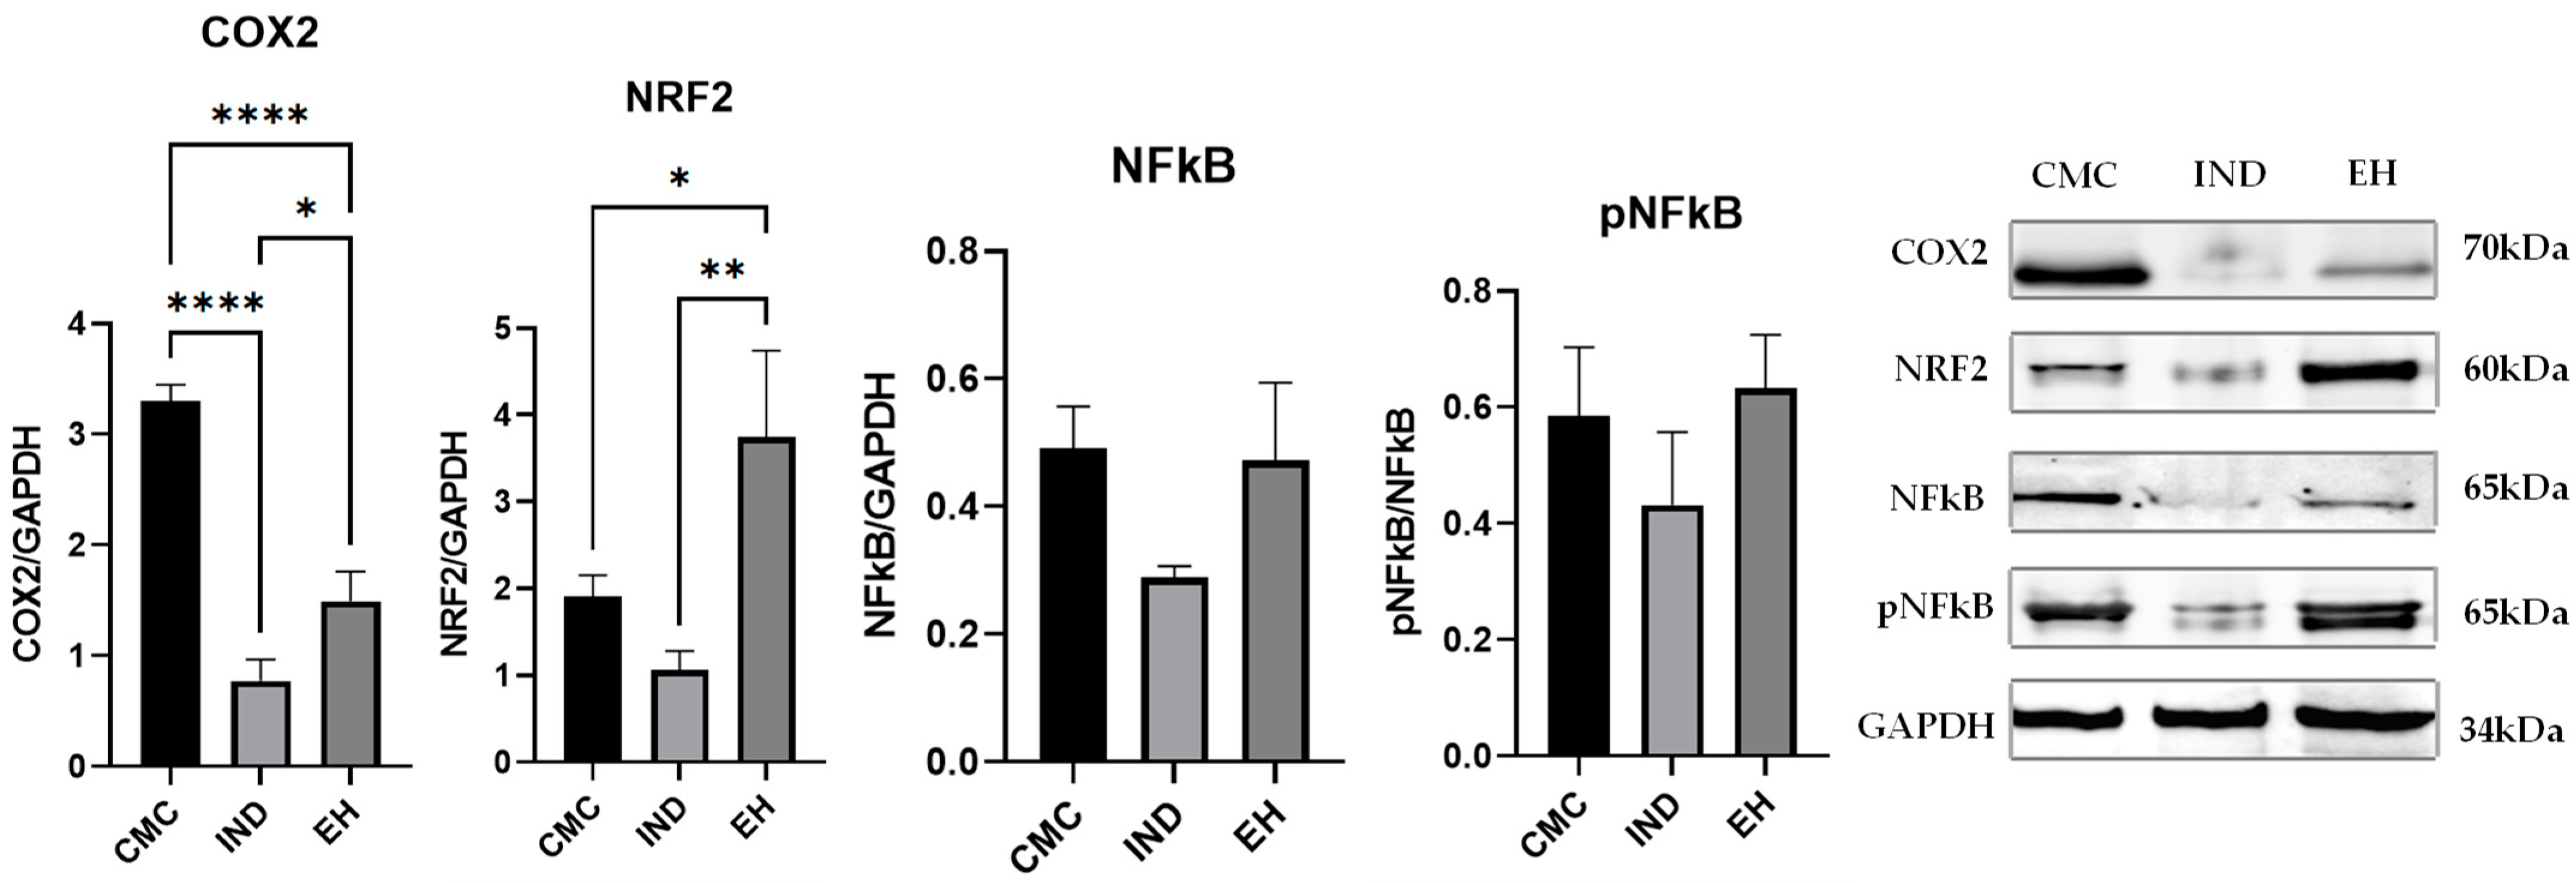
4.7. Western Blot Analysis
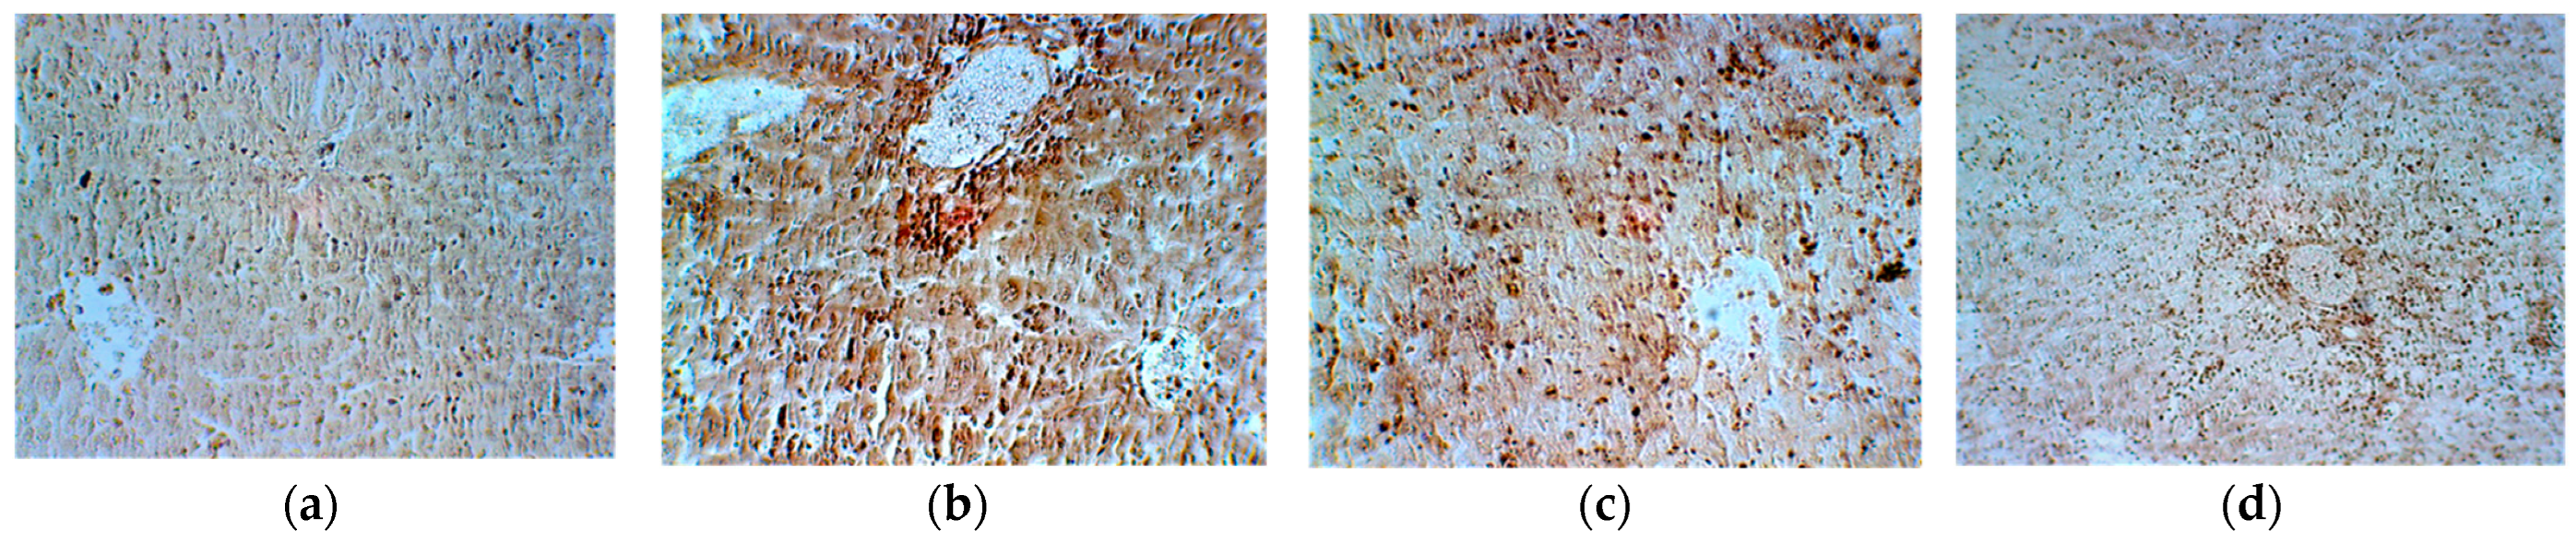
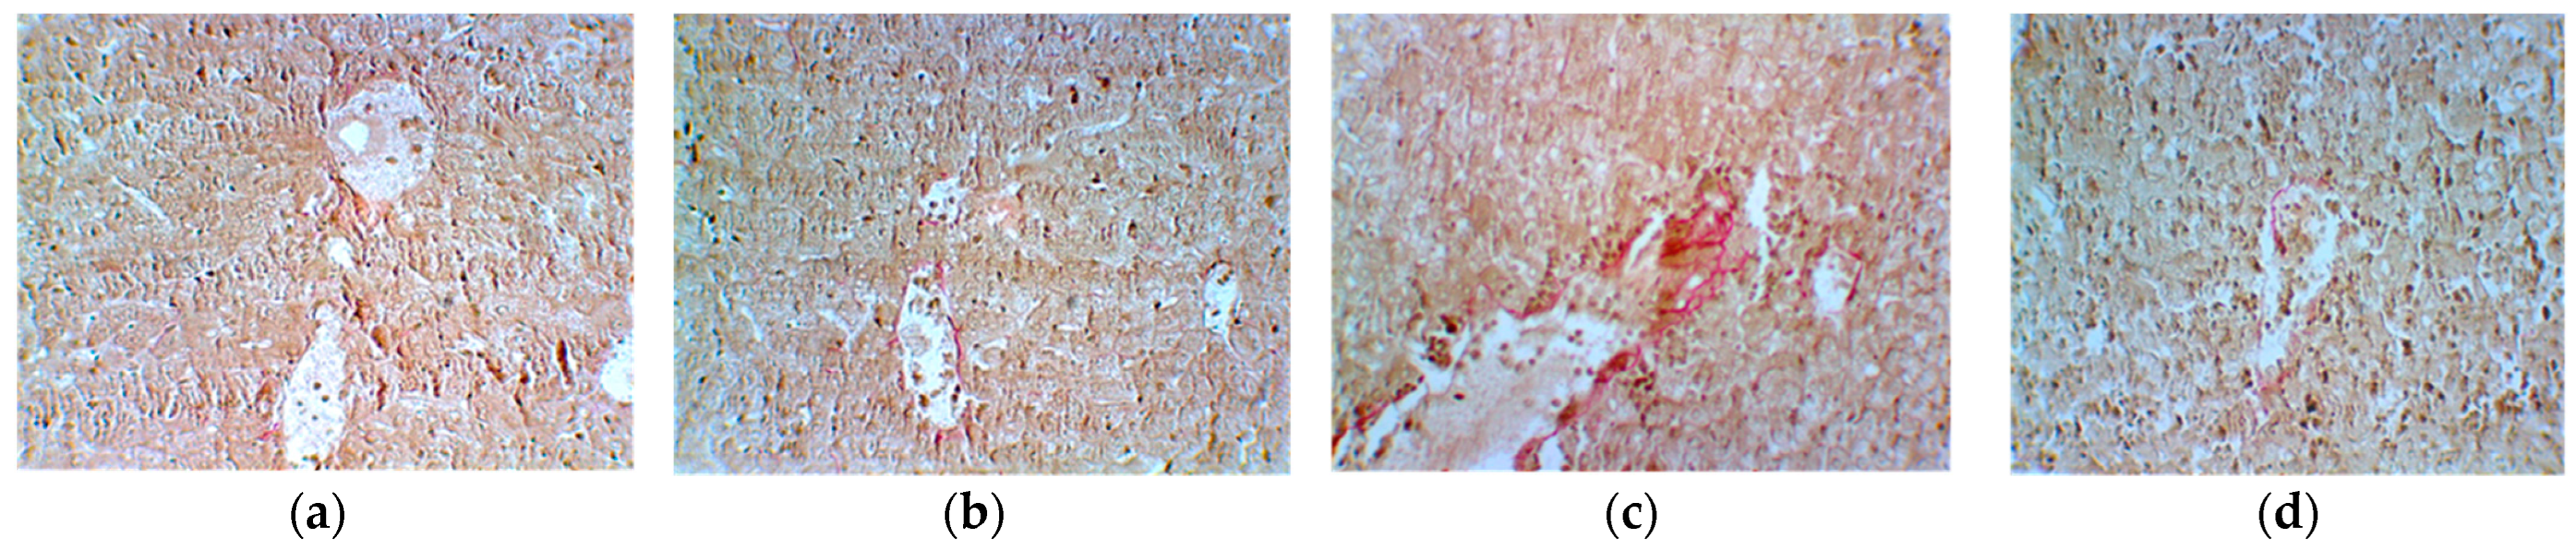
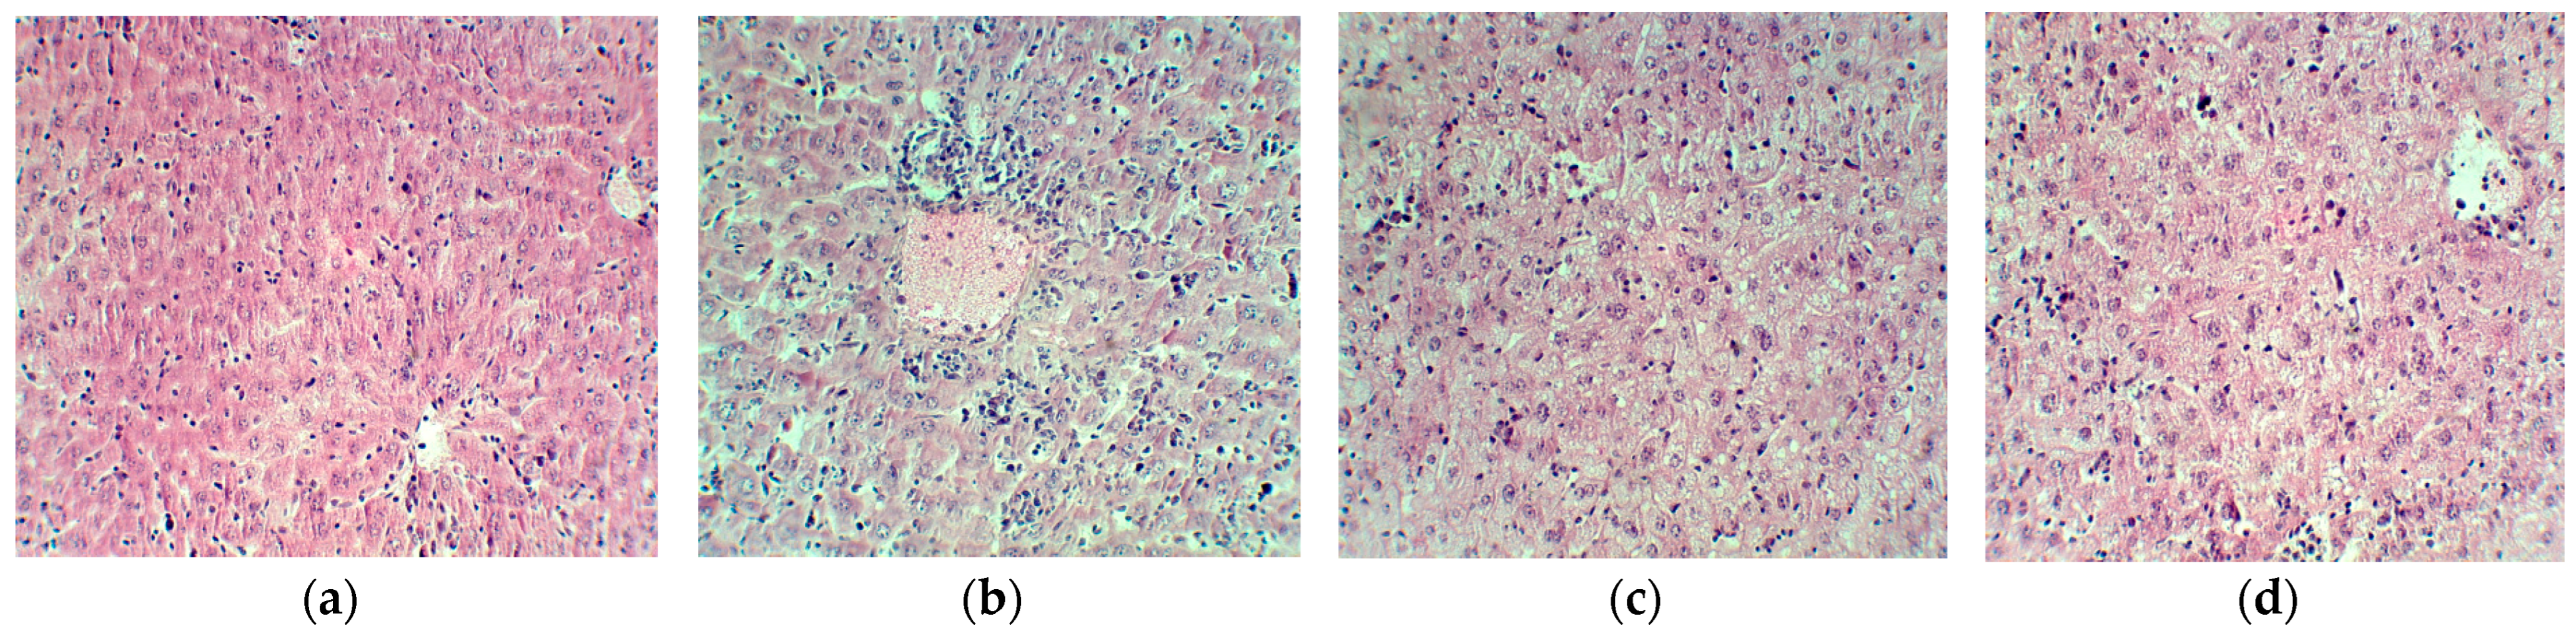
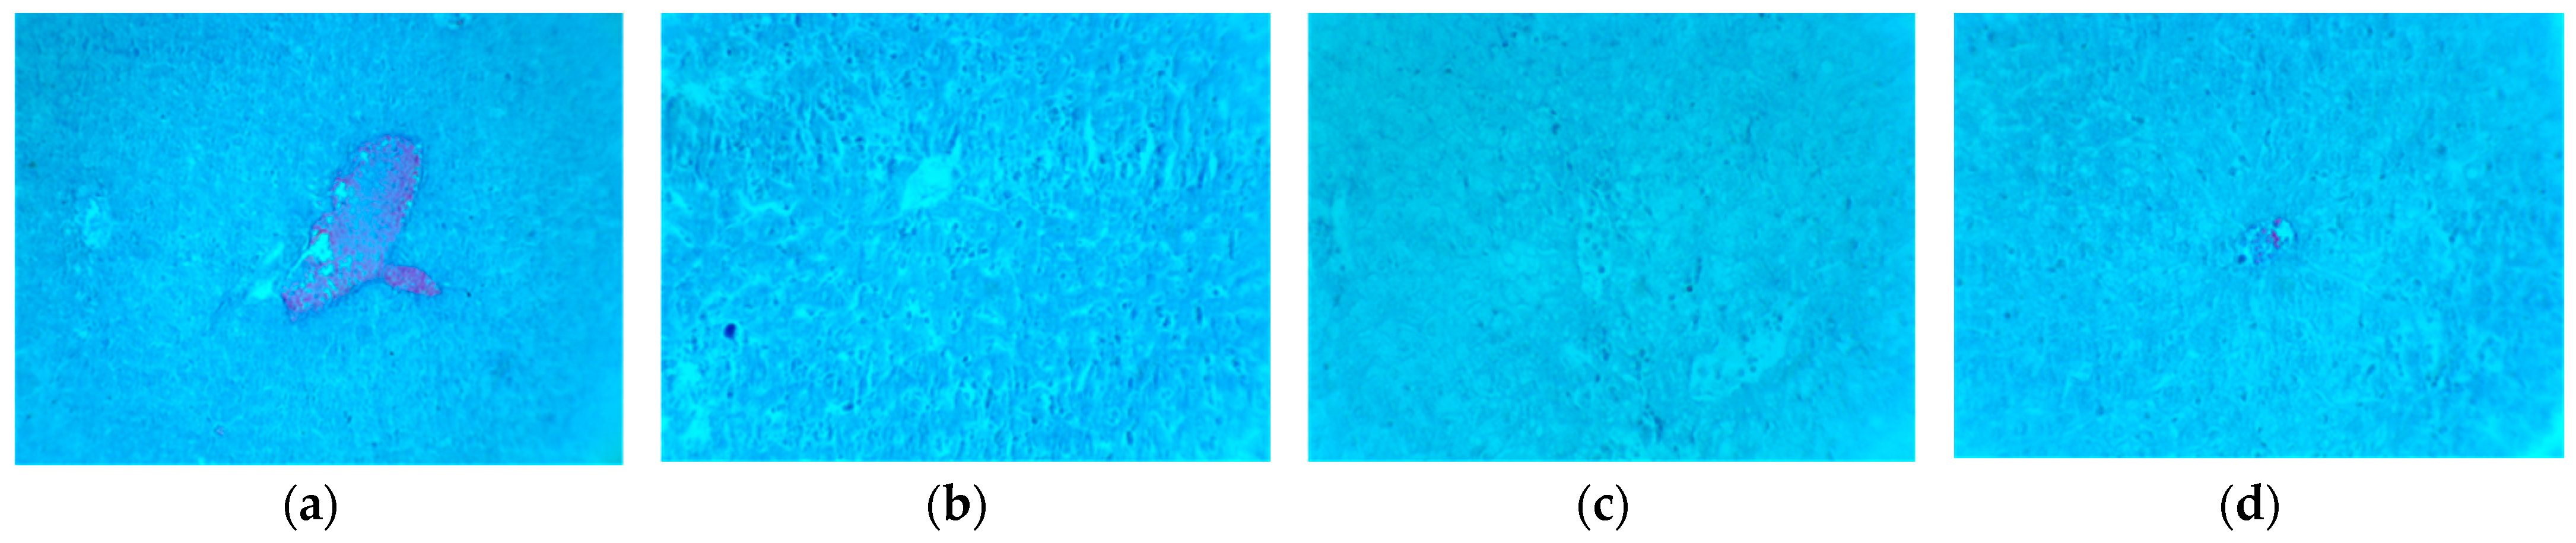
4.8. Histopathological Analysis
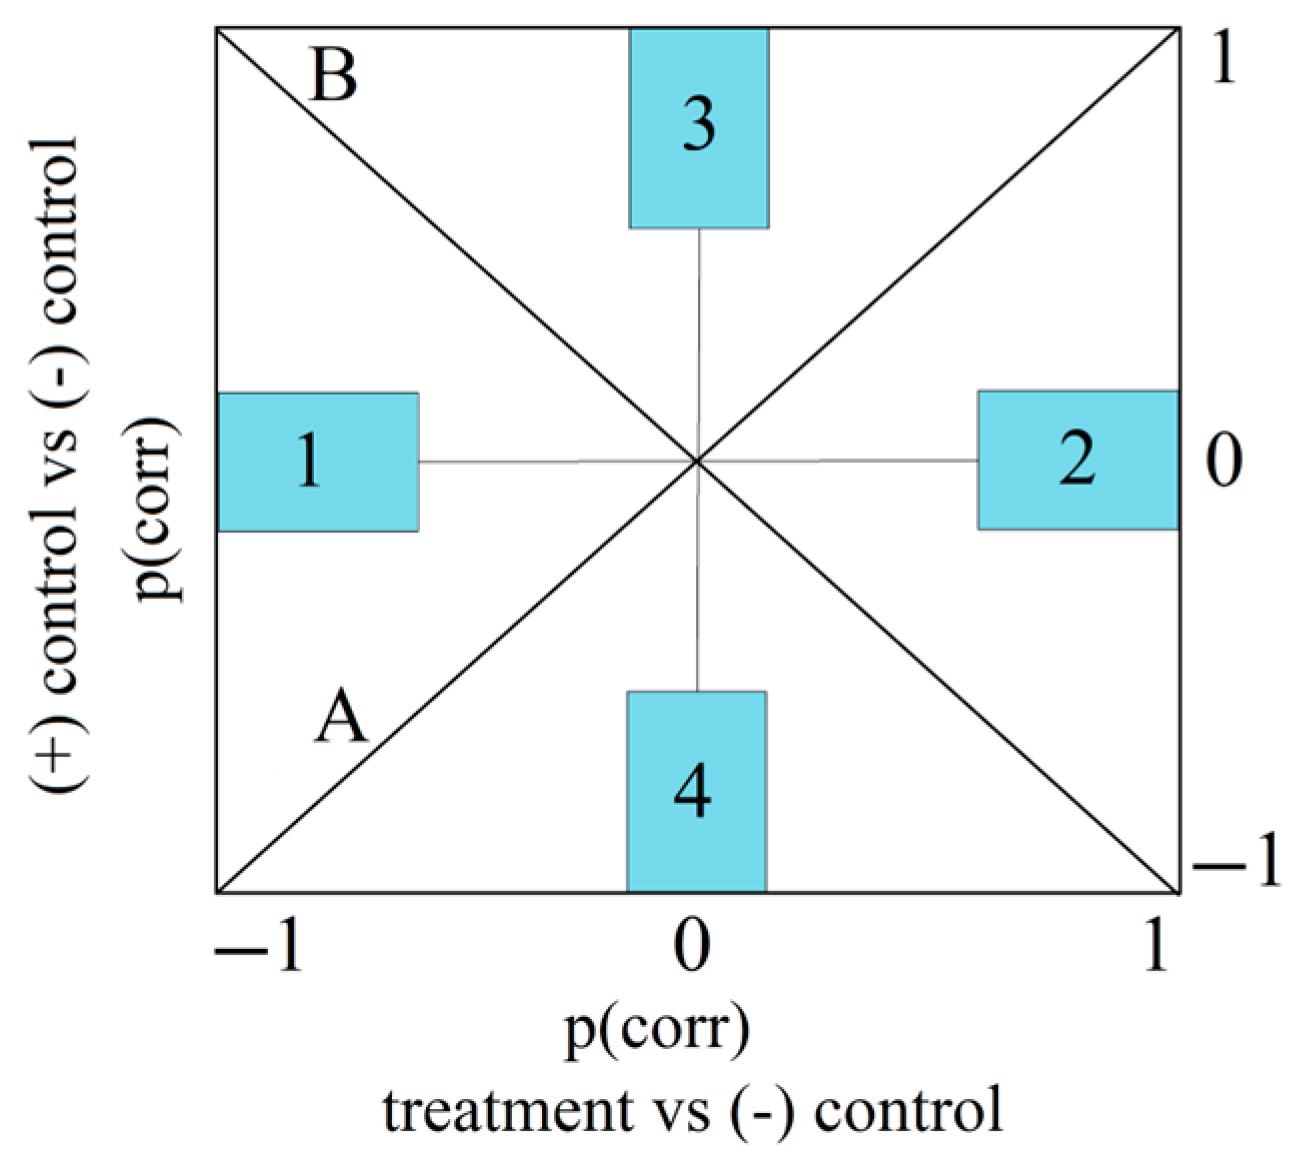
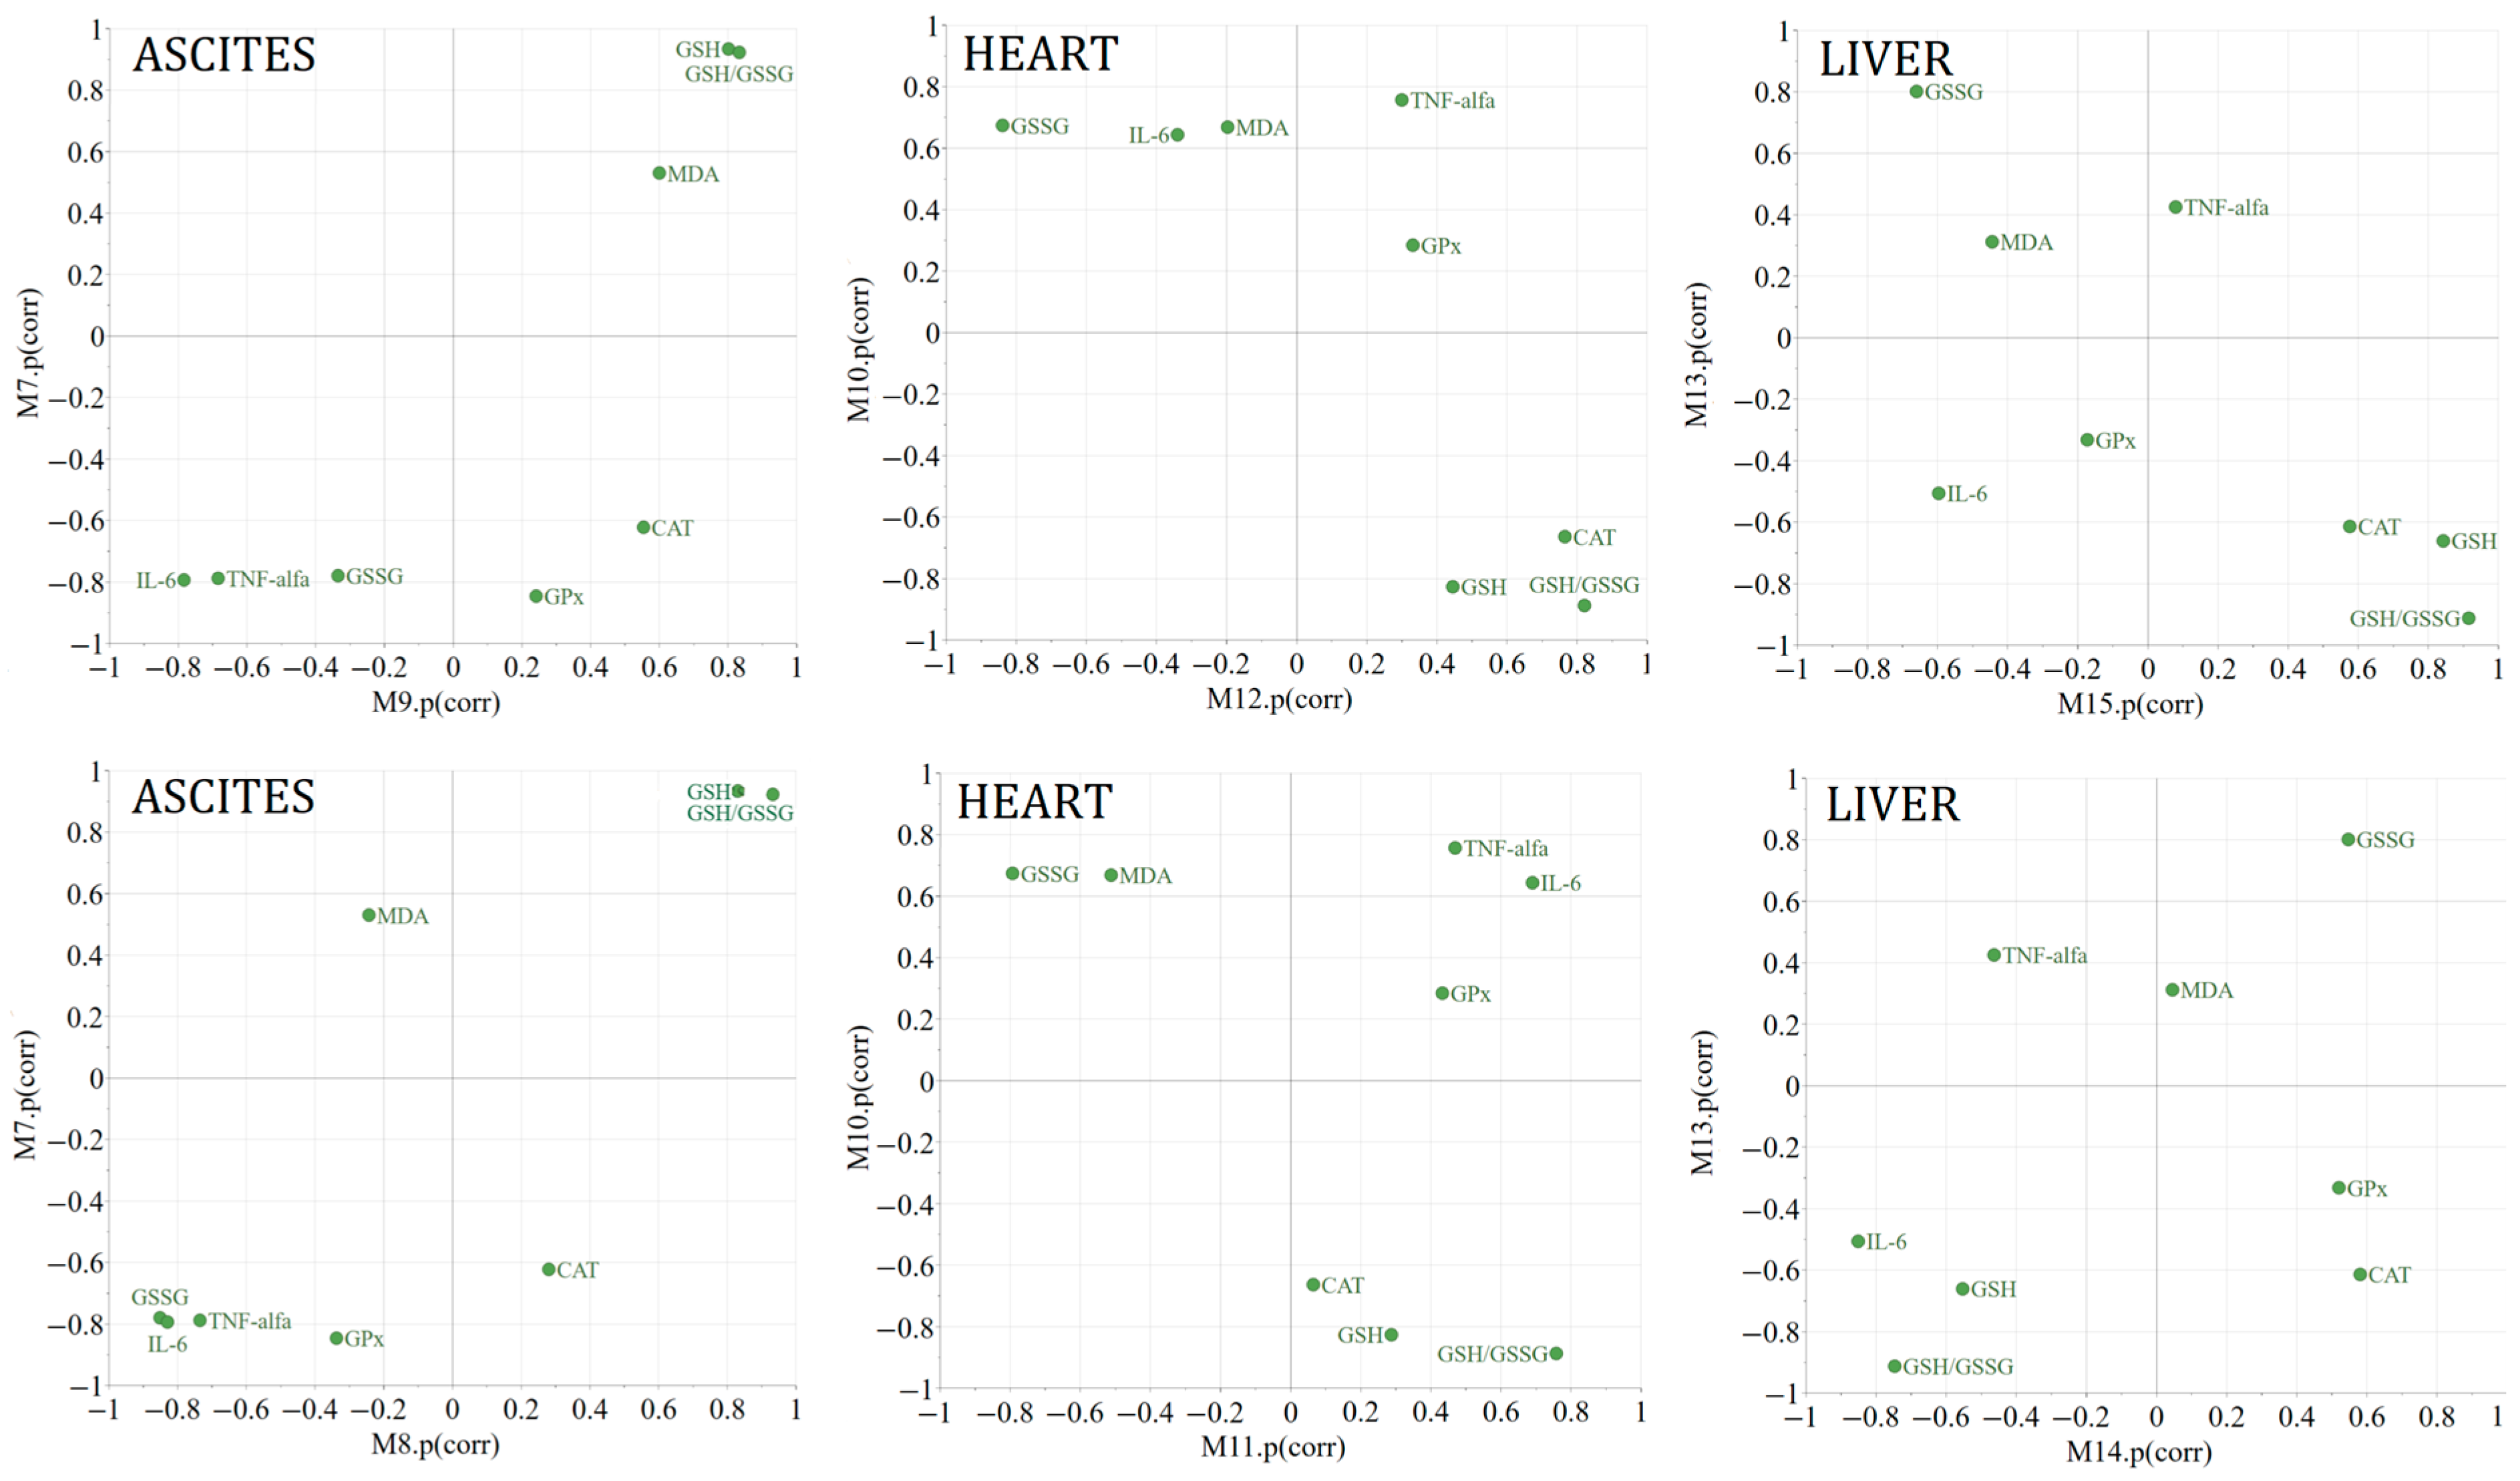
4.9. Multivariate Data Analysis
4.10. Statistical Analysis
5. Conclusions
Author Contributions
Funding
Institutional Review Board Statement
Data Availability Statement
Conflicts of Interest
References
- Bernstein, N.; Akram, M.; Daniyal, M.; Koltai, H.; Fridlender, M.; Gorelick, J. Antiinflammatory Potential of Medicinal Plants: A Source for Therapeutic Secondary Metabolites. In Advances in Agronomy; Elsevier: Amsterdam, The Netherlands, 2018; Volume 150, pp. 131–183. ISBN 978-0-12-815175-4. [Google Scholar]
- Nyakudya, T.T.; Tshabalala, T.; Dangarembizi, R.; Erlwanger, K.H.; Ndhlala, A.R. The Potential Therapeutic Value of Medicinal Plants in the Management of Metabolic Disorders. Molecules 2020, 25, 2669. [Google Scholar] [CrossRef]
- Josiah, A.J.; Twilley, D.; Pillai, S.K.; Ray, S.S.; Lall, N. Pathogenesis of Keratinocyte Carcinomas and the Therapeutic Potential of Medicinal Plants and Phytochemicals. Molecules 2021, 26, 1979. [Google Scholar] [CrossRef]
- Izuegbuna, O. Leukemia Chemoprevention and Therapeutic Potentials: Selected Medicinal Plants with Anti-Leukemic Activities. Nutr. Cancer 2022, 74, 437–449. [Google Scholar] [CrossRef]
- Kim, H.P.; Lim, H.; Kwon, Y.S. Therapeutic Potential of Medicinal Plants and Their Constituents on Lung Inflammatory Disorders. Biomol. Ther. 2017, 25, 91–104. [Google Scholar] [CrossRef]
- Sun, W.; Shahrajabian, M.H. Therapeutic Potential of Phenolic Compounds in Medicinal Plants—Natural Health Products for Human Health. Molecules 2023, 28, 1845. [Google Scholar] [CrossRef]
- Maione, F.; Cicala, C.; Musciacco, G.; De Feo, V.; Amat, A.G.; Ialenti, A.; Mascolo, N. Phenols, Alkaloids and Terpenes from Medicinal Plants with Antihypertensive and Vasorelaxant Activities. A Review of Natural Products as Leads to Potential Therapeutic Agents. Nat. Prod. Commun. 2013, 8, 1934578X1300800. [Google Scholar] [CrossRef]
- Wani, S.S.; Dar, P.A.; Zargar, S.M.; Dar, T.A. Therapeutic Potential of Medicinal Plant Proteins: Present Status and Future Perspectives. CPPS 2020, 21, 443–487. [Google Scholar] [CrossRef]
- Khan, T.; Khan, M.A.; Mashwani, Z.-R.; Ullah, N.; Nadhman, A. Therapeutic Potential of Medicinal Plants against COVID-19: The Role of Antiviral Medicinal Metabolites. Biocatal. Agric. Biotechnol. 2021, 31, 101890. [Google Scholar] [CrossRef]
- Shaheen, G.; Akram, M.; Jabeen, F.; Ali Shah, S.M.; Munir, N.; Daniyal, M.; Riaz, M.; Tahir, I.M.; Ghauri, A.O.; Sultana, S.; et al. Therapeutic Potential of Medicinal Plants for the Management of Urinary Tract Infection: A Systematic Review. Clin. Exp. Pharmacol. Physiol. 2019, 46, 613–624. [Google Scholar] [CrossRef]
- Willcox, M.L.; Elugbaju, C.; Al-Anbaki, M.; Lown, M.; Graz, B. Effectiveness of Medicinal Plants for Glycaemic Control in Type 2 Diabetes: An Overview of Meta-Analyses of Clinical Trials. Front. Pharmacol. 2021, 12, 777561. [Google Scholar] [CrossRef]
- Furquim Dos Santos Cardoso, V.; Amaral Roppa, R.H.; Antunes, C.; Silva Moraes, A.N.; Santi, L.; Konrath, E.L. Efficacy of Medicinal Plant Extracts as Dental and Periodontal Antibiofilm Agents: A Systematic Review of Randomized Clinical Trials. J. Ethnopharmacol. 2021, 281, 114541. [Google Scholar] [CrossRef]
- Baharara, H.; Rahsepar, S.; Emami, S.A.; Elyasi, S.; Mohammadpour, A.H.; Ghavami, V.; Rajendram, R.; Sahebkar, A.; Arasteh, O. The Efficacy of Medicinal Plant Preparations in the Alleviation of Radiodermatitis in Patients with Breast Cancer: A Systematic Review of Clinical Trials. Phytother. Res. 2023, 37, 3275–3295. [Google Scholar] [CrossRef]
- Moragrega, I.; Ríos, J.L. Medicinal Plants in the Treatment of Depression. II: Evidence from Clinical Trials. Planta Med. 2022, 88, 1092–1110. [Google Scholar] [CrossRef]
- Ajjoun, M.; Kharchoufa, L.; Alami Merrouni, I.; Elachouri, M. Moroccan Medicinal Plants Traditionally Used for the Treatment of Skin Diseases: From Ethnobotany to Clinical Trials. J. Ethnopharmacol. 2022, 297, 115532. [Google Scholar] [CrossRef]
- Amini, S.; Bagherniya, M.; Butler, A.E.; Askari, G.; Sahebkar, A. The Effect of Medicinal Plants on Cirrhosis: A Systematic Review of Clinical Trials. Phytother. Res. 2023, 37, 3083–3096. [Google Scholar] [CrossRef]
- Bouyahya, A.; Chamkhi, I.; Balahbib, A.; Rebezov, M.; Shariati, M.A.; Wilairatana, P.; Mubarak, M.S.; Benali, T.; El Omari, N. Mechanisms, Anti-Quorum-Sensing Actions, and Clinical Trials of Medicinal Plant Bioactive Compounds against Bacteria: A Comprehensive Review. Molecules 2022, 27, 1484. [Google Scholar] [CrossRef]
- Salleh, N.H.; Zulkipli, I.N.; Mohd Yasin, H.; Ja’afar, F.; Ahmad, N.; Wan Ahmad, W.A.N.; Ahmad, S.R. Systematic Review of Medicinal Plants Used for Treatment of Diabetes in Human Clinical Trials: An ASEAN Perspective. Evid. -Based Complement. Altern. Med. 2021, 2021, 5570939. [Google Scholar] [CrossRef]
- Buddhachat, K.; Osathanunkul, M.; Madesis, P.; Chomdej, S.; Ongchai, S. Authenticity Analyses of Phyllanthus amarus Using Barcoding Coupled with HRM Analysis to Control Its Quality for Medicinal Plant Product. Gene 2015, 573, 84–90. [Google Scholar] [CrossRef]
- Raclariu, A.C.; Mocan, A.; Popa, M.O.; Vlase, L.; Ichim, M.C.; Crișan, G.; Brysting, A.K.; De Boer, H. Veronica officinalis Product Authentication Using DNA Metabarcoding and HPLC-MS Reveals Widespread Adulteration with Veronica chamaedrys. Front. Pharmacol. 2017, 8, 378. [Google Scholar] [CrossRef]
- Raclariu-Manolică, A.C.; Mauvisseau, Q.; Paranaiba, R.; De Boer, H.J.; Socaciu, C. Authentication of Milk Thistle Commercial Products Using UHPLC-QTOF-ESI + MS Metabolomics and DNA Metabarcoding. BMC Complement. Med. Ther. 2023, 23, 257. [Google Scholar] [CrossRef]
- Raclariu-Manolică, A.C.; Anmarkrud, J.A.; Kierczak, M.; Rafati, N.; Thorbek, B.L.G.; Schrøder-Nielsen, A.; De Boer, H.J. DNA Metabarcoding for Quality Control of Basil, Oregano, and Paprika. Front. Plant Sci. 2021, 12, 665618. [Google Scholar] [CrossRef] [PubMed]
- Raclariu-Manolică, A.C.; Mauvisseau, Q.; De Boer, H.J. Horizon Scan of DNA-Based Methods for Quality Control and Monitoring of Herbal Preparations. Front. Pharmacol. 2023, 14, 1179099. [Google Scholar] [CrossRef]
- Seethapathy, G.S.; Raclariu-Manolică, A.-C.; Anmarkrud, J.A.; Wangensteen, H.; De Boer, H.J. DNA Metabarcoding Authentication of Ayurvedic Herbal Products on the European Market Raises Concerns of Quality and Fidelity. Front. Plant Sci. 2019, 10, 68. [Google Scholar] [CrossRef] [PubMed]
- Tutin, T.G. (Ed.) Flora Europaea. Vol. 2: Rosaceae to Umbelliferae; Cambridge University Press: Cambridge, UK, 2010; ISBN 978-0-521-06662-4. [Google Scholar]
- Vitalone, A.; Allkanjari, O. Epilobium Spp: Pharmacology and Phytochemistry. Phytother. Res. 2018, 32, 1229–1240. [Google Scholar] [CrossRef]
- Vlase, A.-M.; Toiu, A.; Tomuță, I.; Vlase, L.; Muntean, D.; Casian, T.; Fizeșan, I.; Nadăș, G.C.; Novac, C.Ș.; Tămaș, M.; et al. Epilobium Species: From Optimization of the Extraction Process to Evaluation of Biological Properties. Antioxidants 2023, 12, 91. [Google Scholar] [CrossRef]
- De Elguea-Culebras, G.O.; Panamá-Tapia, L.A.; Melero-Bravo, E.; Cerro-Ibáñez, N.; Calvo-Martínez, A.; Sánchez-Vioque, R. Comparison of the Phenolic Composition and Biological Capacities of Wastewater from Origanum vulgare L., Rosmarinus officinalis L., Salvia lavandulifolia Vahl. and Thymus mastichina L. Resulting from Two Hydrodistillation Systems: Clevenger and MAE. J. Appl. Res. Med. Aromat. Plants 2023, 34, 100480. [Google Scholar] [CrossRef]
- Dacrema, M.; Sommella, E.; Santarcangelo, C.; Bruno, B.; Marano, M.G.; Insolia, V.; Saviano, A.; Campiglia, P.; Stornaiuolo, M.; Daglia, M. Metabolic Profiling, In Vitro Bioaccessibility and in Vivo Bioavailability of a Commercial Bioactive Epilobium angustifolium L. Extract. Biomed. Pharmacother. 2020, 131, 110670. [Google Scholar] [CrossRef]
- Ak, G.; Zengin, G.; Mahomoodally, M.F.; Llorent-Martínez, E.; Orlando, G.; Chiavaroli, A.; Brunetti, L.; Recinella, L.; Leone, S.; Di Simone, S.C.; et al. Shedding Light into the Connection between Chemical Components and Biological Effects of Extracts from Epilobium hirsutum: Is It a Potent Source of Bioactive Agents from Natural Treasure? Antioxidants 2021, 10, 1389. [Google Scholar] [CrossRef]
- Esposito, C.; Santarcangelo, C.; Masselli, R.; Buonomo, G.; Nicotra, G.; Insolia, V.; D’Avino, M.; Caruso, G.; Buonomo, A.R.; Sacchi, R.; et al. Epilobium angustifolium L. Extract with High Content in Oenothein B on Benign Prostatic Hyperplasia: A Monocentric, Randomized, Double-Blind, Placebo-Controlled Clinical Trial. Biomed. Pharmacother. 2021, 138, 111414. [Google Scholar] [CrossRef] [PubMed]
- Coulson, S.; Rao, A.; Beck, S.L.; Steels, E.; Gramotnev, H.; Vitetta, L. A Phase II Randomised Double-Blind Placebo-Controlled Clinical Trial Investigating the Efficacy and Safety of ProstateEZE Max: A Herbal Medicine Preparation for the Management of Symptoms of Benign Prostatic Hypertrophy. Complement. Ther. Med. 2013, 21, 172–179. [Google Scholar] [CrossRef]
- Herbal Medicine: Summary for the Public. In Willow Herb—Epilobium angustifolium L. and/or Epilobium parviflorum Schreb., Herba. 2016. Available online: https://www.Ema.Europa.Eu/En/Medicines/Herbal/Epilobii-Herba (accessed on 6 November 2023).
- Granica, S.; Piwowarski, J.P.; Czerwińska, M.E.; Kiss, A.K. Phytochemistry, Pharmacology and Traditional Uses of Different Epilobium Species (Onagraceae): A Review. J. Ethnopharmacol. 2014, 156, 316–346. [Google Scholar] [CrossRef]
- Vitali, F.; Fonte, G.; Saija, A.; Tita, B. Inhibition of Intestinal Motility and Secretion by Extracts of Epilobium Spp. in Mice. J. Ethnopharmacol. 2006, 107, 342–348. [Google Scholar] [CrossRef]
- Nowak, A.; Zielonka-Brzezicka, J.; Perużyńska, M.; Klimowicz, A. Epilobium angustifolium L. as a Potential Herbal Component of Topical Products for Skin Care and Treatment—A Review. Molecules 2022, 27, 3536. [Google Scholar] [CrossRef]
- Nowak, A.; Cybulska, K.; Makuch, E.; Kucharski, Ł.; Różewicka-Czabańska, M.; Prowans, P.; Czapla, N.; Bargiel, P.; Petriczko, J.; Klimowicz, A. In Vitro Human Skin Penetration, Antioxidant and Antimicrobial Activity of Ethanol-Water Extract of Fireweed (Epilobium angustifolium L.). Molecules 2021, 26, 329. [Google Scholar] [CrossRef]
- Nowak, A.; Zagórska-Dziok, M.; Ossowicz-Rupniewska, P.; Makuch, E.; Duchnik, W.; Kucharski, Ł.; Adamiak-Giera, U.; Prowans, P.; Czapla, N.; Bargiel, P.; et al. Epilobium angustifolium L. Extracts as Valuable Ingredients in Cosmetic and Dermatological Products. Molecules 2021, 26, 3456. [Google Scholar] [CrossRef]
- Agnieszka, G.; Mariola, D.; Anna, P.; Piotr, K.; Natalia, W.; Aneta, S.; Marcin, O.; Bogna, O.; Zdzisław, Ł.; Aurelia, P.; et al. Qualitative and Quantitative Analyses of Bioactive Compounds from Ex Vitro Chamaenerion angustifolium (L.) (Epilobium augustifolium) Herb in Different Harvest Times. Ind. Crops Prod. 2018, 123, 208–220. [Google Scholar] [CrossRef]
- Rahmani, A.; Almatroudi, A.; Allemailem, K.; Alwanian, W.; Alharbi, B.; Alrumaihi, F.; Khan, A.; Almatroodi, S. Myricetin: A Significant Emphasis on Its Anticancer Potential via the Modulation of Inflammation and Signal Transduction Pathways. Int. J. Mol. Sci. 2023, 24, 9665. [Google Scholar] [CrossRef]
- Javed, Z.; Khan, K.; Herrera-Bravo, J.; Naeem, S.; Iqbal, M.J.; Raza, Q.; Sadia, H.; Raza, S.; Bhinder, M.; Calina, D.; et al. Myricetin: Targeting Signaling Networks in Cancer and Its Implication in Chemotherapy. Cancer Cell Int. 2022, 22, 239. [Google Scholar] [CrossRef]
- Xie, Y.; Wang, Y.; Xiang, W.; Wang, Q.; Cao, Y. Molecular Mechanisms of the Action of Myricetin in Cancer. Mini-Rev. Med. Chem. 2020, 20, 123–133. [Google Scholar] [CrossRef]
- Charachit, N.; Sukhamwang, A.; Dejkriengkraikul, P.; Yodkeeree, S. Hyperoside and Quercitrin in Houttuynia cordata Extract Attenuate UVB-Induced Human Keratinocyte Cell Damage and Oxidative Stress via Modulation of MAPKs and Akt Signaling Pathway. Antioxidants 2022, 11, 221. [Google Scholar] [CrossRef]
- Wang, K.; Zhang, H.; Yuan, L.; Li, X.; Cai, Y. Potential Implications of Hyperoside on Oxidative Stress-Induced Human Diseases: A Comprehensive Review. J. Inflamm. Res. 2023, 16, 4503–4526. [Google Scholar] [CrossRef] [PubMed]
- Xu, S.; Chen, S.; Xia, W.; Sui, H.; Fu, X. Hyperoside: A Review of Its Structure, Synthesis, Pharmacology, Pharmacokinetics and Toxicity. Molecules 2022, 27, 3009. [Google Scholar] [CrossRef] [PubMed]
- Sophiya, P.; Urs, D.; Lone, J.K.; Giresha, A.S.; Krishna Ram, H.; Manjunatha, J.G.; El-Serehy, H.A.; Narayanappa, M.; Shankar, J.; Bhardwaj, R.; et al. Quercitrin Neutralizes sPLA2IIa Activity, Reduces the Inflammatory IL-6 Level in PC3 Cell Lines, and Exhibits Anti-Tumor Activity in the EAC-Bearing Mice Model. Front. Pharmacol. 2022, 13, 996285. [Google Scholar] [CrossRef]
- Chen, Q.; Wei, Y.; Zhao, Y.; Xie, X.; Kuang, N.; Wei, Y.; Yu, M.; Hu, T. Intervening Effects and Molecular Mechanism of Quercitrin on PCV2-Induced Histone Acetylation, Oxidative Stress and Inflammatory Response in 3D4/2 Cells. Antioxidants 2022, 11, 941. [Google Scholar] [CrossRef]
- Amjad, E.; Sokouti, B.; Asnaashari, S. A Systematic Review of Anti-Cancer Roles and Mechanisms of Kaempferol as a Natural Compound. Cancer Cell Int. 2022, 22, 260. [Google Scholar] [CrossRef]
- Alam, W.; Khan, H.; Shah, M.A.; Cauli, O.; Saso, L. Kaempferol as a Dietary Anti-Inflammatory Agent: Current Therapeutic Standing. Molecules 2020, 25, 4073. [Google Scholar] [CrossRef]
- Bai, J.; Zhang, Y.; Tang, C.; Hou, Y.; Ai, X.; Chen, X.; Zhang, Y.; Wang, X.; Meng, X. Gallic Acid: Pharmacological Activities and Molecular Mechanisms Involved in Inflammation-Related Diseases. Biomed. Pharmacother. 2021, 133, 110985. [Google Scholar] [CrossRef]
- Hong, R.; Lim, S.-C.; Lee, T.-B.; Han, S.-I. Anticancer Effect of Gallic Acid on Acidity-Induced Invasion of MCF7 Breast Cancer Cells. Nutrients 2023, 15, 3596. [Google Scholar] [CrossRef]
- Hassani, S.; Ghanbari, F.; Lotfi, M.; Alam, W.; Aschner, M.; Popović-Djordjević, J.; Shahcheraghi, S.H.; Khan, H. How Gallic Acid Regulates Molecular Signaling: Role in Cancer Drug Resistance. Med. Oncol. 2023, 40, 308. [Google Scholar] [CrossRef]
- Huang, C.-C.; Tsai, M.-C.; Wu, Y.-L.; Lee, Y.-J.; Yen, A.-T.; Wang, C.-J.; Kao, S.-H. Gallic Acid Attenuates Metastatic Potential of Human Colorectal Cancer Cells through the miR -1247-3p-modulated Integrin/FAK Axis. Environ. Toxicol. 2023. [Google Scholar] [CrossRef]
- Baranwal, A.; Aggarwal, P.; Rai, A.; Kumar, N. Pharmacological Actions and Underlying Mechanisms of Catechin: A Review. Mini-Rev. Med. Chem. 2022, 22, 821–833. [Google Scholar] [CrossRef] [PubMed]
- Wang, L.; Du, X.; Yue, D.; Chen, X. Catechin, Rutin and Quercetin in Quercus mongolica Fisch Leaves Exert Inhibitory Effects on Multiple Cancer Cells. J. Food Biochem. 2022, 46, e14486. [Google Scholar] [CrossRef] [PubMed]
- Nandi, S.; Nag, A.; Khatua, S.; Sen, S.; Chakraborty, N.; Naskar, A.; Acharya, K.; Calina, D.; Sharifi-Rad, J. Anticancer Activity and Other Biomedical Properties of β-sitosterol: Bridging Phytochemistry and Current Pharmacological Evidence for Future Translational Approaches. Phytother. Res. 2023. [Google Scholar] [CrossRef] [PubMed]
- Wang, H.; Wang, Z.; Zhang, Z.; Liu, J.; Hong, L. β-Sitosterol as a Promising Anticancer Agent for Chemoprevention and Chemotherapy: Mechanisms of Action and Future Prospects. Adv. Nutr. 2023, 14, 1085–1110. [Google Scholar] [CrossRef] [PubMed]
- Schepetkin, I.A.; Ramstead, A.G.; Kirpotina, L.N.; Voyich, J.M.; Jutila, M.A.; Quinn, M.T. Therapeutic Potential of Polyphenols from Epilobium angustifolium (Fireweed): Polyphenols from Fireweed. Phytother. Res. 2016, 30, 1287–1297. [Google Scholar] [CrossRef]
- Stolarczyk, M.; Naruszewicz, M.; Kiss, A.K. Extracts from Epilobium Sp. Herbs Induce Apoptosis in Human Hormone-Dependent Prostate Cancer Cells by Activating the Mitochondrial Pathway. J. Pharm. Pharmacol. 2013, 65, 1044–1054. [Google Scholar] [CrossRef]
- Stolarczyk, M.; Piwowarski, J.P.; Granica, S.; Stefańska, J.; Naruszewicz, M.; Kiss, A.K. Extracts from Epilobium Sp. Herbs, Their Components and Gut Microbiota Metabolites of Epilobium Ellagitannins, Urolithins, Inhibit Hormone-Dependent Prostate Cancer Cells-(LNCaP) Proliferation and PSA Secretion. Phytother. Res. 2013, 27, 1842–1848. [Google Scholar] [CrossRef]
- Granica, S.; Bazylko, A.; Kiss, A.K. Determination of Macrocyclic Ellagitannin Oenothein B in Plant Materials by HPLC-DAD-MS: Method Development and Validation. Phytochem. Anal. 2012, 23, 582–587. [Google Scholar] [CrossRef]
- Bazylko, A.; Kiss, A.K.; Kowalski, J. High-Performance Thin-Layer Chromatography Method for Quantitative Determination of Oenothein B and Quercetin Glucuronide in Aqueous Extract of Epilobii angustifolii Herba. J. Chromatogr. A 2007, 1173, 146–150. [Google Scholar] [CrossRef]
- Baert, N.; Karonen, M.; Salminen, J.-P. Isolation, Characterisation and Quantification of the Main Oligomeric Macrocyclic Ellagitannins in Epilobium angustifolium by Ultra-High Performance Chromatography with Diode Array Detection and Electrospray Tandem Mass Spectrometry. J. Chromatogr. A 2015, 1419, 26–36. [Google Scholar] [CrossRef]
- Kiss, A.K.; Bazylko, A.; Filipek, A.; Granica, S.; Jaszewska, E.; Kiarszys, U.; Kośmider, A.; Piwowarski, J. Oenothein B’s Contribution to the Anti-Inflammatory and Antioxidant Activity of Epilobium sp. Phytomedicine 2011, 18, 557–560. [Google Scholar] [CrossRef] [PubMed]
- Hevesi Tóth, B.; Blazics, B.; Kéry, Á. Polyphenol Composition and Antioxidant Capacity of Epilobium Species. J. Pharm. Biomed. Anal. 2009, 49, 26–31. [Google Scholar] [CrossRef]
- Minghetti, L. Cyclooxygenase-2 (COX-2) in Inflammatory and Degenerative Brain Diseases. J. Neuropathol. Exp. Neurol. 2004, 63, 901–910. [Google Scholar] [CrossRef] [PubMed]
- Ngo, V.; Duennwald, M.L. Nrf2 and Oxidative Stress: A General Overview of Mechanisms and Implications in Human Disease. Antioxidants 2022, 11, 2345. [Google Scholar] [CrossRef]
- Vergnolle, N. The Inflammatory Response. Drug Dev. Res. 2003, 59, 375–381. [Google Scholar] [CrossRef]
- Ward, P.A. The Acute Inflammatory Response and Its Regulation. Arch. Surg. 1999, 134, 666. [Google Scholar] [CrossRef]
- Winyard, P.G. Key Stages in the Acute Inflammatory Response and Their Relevance as Therapeutic Targets Introduction to Part 1. In Inflammation Protocols; Humana Press: Totowa, NJ, USA, 2003; Volume 225, pp. 3–6. ISBN 978-1-59259-374-3. [Google Scholar]
- Lefkowitch, J.H. Special Stains in Diagnostic Liver Pathology. Semin. Diagn. Pathol. 2006, 23, 190–198. [Google Scholar] [CrossRef]
- Kazlouskaya, V.; Malhotra, S.; Lambe, J.; Idriss, M.H.; Elston, D.; Andres, C. The Utility of Elastic Verhoeff-Van Gieson Staining in Dermatopathology. J. Cutan. Pathol. 2013, 40, 211–225. [Google Scholar] [CrossRef]
- Sterehi, D.L.; Keefer, L.R. Modified Mallory Aniline Blue Stain for Bone, Cartilage, and Other Connective Tissues. J. Histotechnol. 1998, 21, 129–133. [Google Scholar] [CrossRef]
- Ahmed, S.M.U.; Luo, L.; Namani, A.; Wang, X.J.; Tang, X. Nrf2 Signaling Pathway: Pivotal Roles in Inflammation. Biochim. Et Biophys. Acta BBA Mol. Basis Dis. 2017, 1863, 585–597. [Google Scholar] [CrossRef]
- Murakami, S.; Kusano, Y.; Okazaki, K.; Akaike, T.; Motohashi, H. NRF2 Signalling in Cytoprotection and Metabolism. Br. J. Pharmacol. 2023. [Google Scholar] [CrossRef] [PubMed]
- Lin, L.; Wu, Q.; Lu, F.; Lei, J.; Zhou, Y.; Liu, Y.; Zhu, N.; Yu, Y.; Ning, Z.; She, T.; et al. Nrf2 Signaling Pathway: Current Status and Potential Therapeutic Targetable Role in Human Cancers. Front. Oncol. 2023, 13, 1184079. [Google Scholar] [CrossRef]
- Huang, W.; Zhong, Y.; Gao, B.; Zheng, B.; Liu, Y. Nrf2-Mediated Therapeutic Effects of Dietary Flavones in Different Diseases. Front. Pharmacol. 2023, 14, 1240433. [Google Scholar] [CrossRef] [PubMed]
- Opriș, R.; Toma, V.; Olteanu, D.; Bâldea, I.; Baciu, A.M.; Lucaci, F.I.; Berghian-Sevastre, A.; Tatomir, C.; Moldovan, B.; Clichici, S.; et al. Effects of Silver Nanoparticles Functionalized with Cornus mas L. Extract on Architecture and Apoptosis in Rat Testicle. Nanomedicine 2019, 14, 275–299. [Google Scholar] [CrossRef]
- Deng, L.; Zong, W.; Tao, X.; Liu, S.; Feng, Z.; Lin, Y.; Liao, Z.; Chen, M. Evaluation of the Therapeutic Effect against Benign Prostatic Hyperplasia and the Active Constituents from Epilobium angustifolium L. J. Ethnopharmacol. 2019, 232, 1–10. [Google Scholar] [CrossRef] [PubMed]
- Szwajgier, D.; Baranowska-Wójcik, E.; Kukula-Koch, W.; Kowalik, K.; Polak-Berecka, M.; Waśko, A. Evolution of the Anticholinesterase, Antioxidant, and Anti-Inflammatory Activity of Epilobium angustifolium L. Infusion during In Vitro Digestion. J. Funct. Foods 2021, 85, 104645. [Google Scholar] [CrossRef]
- Lin, P.; Wang, X.; Zhou, N.; Wu, Y.; Wang, Z.; Wu, L.; Li, J.; Shang, X. Chemical Characterization of the Anti-Inflammatory Activity Fraction of Epilobium angustifolium. Eur. Food Res. Technol. 2022, 248, 35–44. [Google Scholar] [CrossRef]
- Singh, Z.; Karthigesu, I.P.; Singh, P.; Kaur, R. Use of Malondialdehyde as a Biomarker for Assessing Oxidative Stress in Different Disease Pathologies: A Review. Iran. J. Public Health 2015, 43, 7–16. [Google Scholar]
- Moussa, Z.; Judeh, Z.M.A.; Ahmed, S.A. Nonenzymatic Exogenous and Endogenous Antioxidants. In Free Radical Medicine and Biology; Das, K., Das, S., Shivanagouda Biradar, M., Bobbarala, V., Subba Tata, S., Eds.; IntechOpen: London, UK, 2020; ISBN 978-1-78985-143-4. [Google Scholar]
- Dzhafar, S.; Dalar, A.; Mükemre, M.; EkiN, S.; Yildiz, D.; Yunusoğlu, O. Phytochemical Profile and in Vitro and in Vivo Anticonvulsant and Antioxidant Activities of Epilobium hirsutum. Int. J. Second. Metab. 2020, 7, 63–76. [Google Scholar] [CrossRef]
- Karakurt, S.; Semiz, A.; Celik, G.; Gencler-Ozkan, A.M.; Sen, A.; Adali, O. Epilobium hirsutum Alters Xenobiotic Metabolizing CYP1A1, CYP2E1, NQO1 and GPx Activities, mRNA and Protein Levels in Rats. Pharm. Biol. 2013, 51, 650–658. [Google Scholar] [CrossRef]
- Ranajit, S.K.; Killari, K.N.; Kilari, E.K.; Sahu, P.K. Evaluation of Antihyperglycemic Effect of Epilobium parviflorum in High Fat Diet Fructose Streptozotocin Induced Type 2 Diabetic Albino Wistar Rats. Indian J. Pharm. Sci. 2021, 83, 547–555. [Google Scholar] [CrossRef]
- Bidian, C.; Filip, G.A.; David, L.; Moldovan, B.; Olteanu, D.; Clichici, S.; Olănescu-Vaida-Voevod, M.-C.; Leostean, C.; Macavei, S.; Muntean, D.M.; et al. Green Synthesized Gold and Silver Nanoparticles Increased Oxidative Stress and Induced Cell Death in Colorectal Adenocarcinoma Cells. Nanomaterials 2023, 13, 1251. [Google Scholar] [CrossRef]
- Akbudak, M.A.; Sut, T.; Eruygur, N.; Akinci, E. Antiproliferative Effect of Epilobium parviflorum Extracts on Colorectal Cancer Cell Line HT-29. Rom. Biotechnol. Lett. 2021, 26, 3120–3128. [Google Scholar] [CrossRef]
- Shen, Y.; White, E. P53-Dependent Apoptosis Pathways. In Advances in Cancer Research; Elsevier: Amsterdam, The Netherlands, 2001; Volume 82, pp. 55–84. ISBN 978-0-12-006682-7. [Google Scholar]
- Putra, J.; Ferrell, L.D.; Gouw, A.S.H.; Paradis, V.; Rishi, A.; Sempoux, C.; Balabaud, C.; Thung, S.N.; Bioulac-Sage, P. Malignant Transformation of Liver Fatty Acid Binding Protein-Deficient Hepatocellular Adenomas: Histopathologic Spectrum of a Rare Phenomenon. Mod. Pathol. 2020, 33, 665–675. [Google Scholar] [CrossRef]
- Gheldiu, A.-M.; Popa, D.-S.; Loghin, F.; Vlase, L. Oxidative Metabolism of Estrone Modified by Genistein and Bisphenol A in Rat Liver Microsomes. Biomed. Environ. Sci. 2015, 28, 834–838. [Google Scholar] [CrossRef] [PubMed]
- Filip, A.; Daicoviciu, D.; Clichici, S.; Bolfa, P.; Cătoi, C.; Bâldea, I.; Bolojan, L.; Olteanu, D.; Mureșan, A.; Postescu, I.D. The Effects of Grape Seeds Polyphenols on SKH-1 Mice Skin Irradiated with Multiple Doses of UV-B. J. Photochem. Photobiol. B Biol. 2011, 105, 133–142. [Google Scholar] [CrossRef] [PubMed]
- Noble, J.E.; Bailey, M.J.A. Chapter 8 Quantitation of Protein. In Methods in Enzymology; Elsevier: Amsterdam, The Netherlands, 2009; Volume 463, pp. 73–95. ISBN 978-0-12-374536-1. [Google Scholar]
- Grover, J.; Patel, P.; Carnelio, S.; Chandrashekar, C.; Shergill, A.K.; Nilima, N.; Solomon, M.C. Comparison of Glycogen Content, Basement Membrane Integrity and Mitotic Index in Stages of Oral Dysplasia Progression to Cancer and in Oral Lichen-Lichenoid Reactions: A Histochemical Study. J. Adv. Med. Dent. Sci. Res. 2015, 3, 3–8. [Google Scholar]
- Toma, V.A.; Farcaș, A.D.; Pârvu, M.; Silaghi-Dumitrescu, R.; Roman, I. CA3 Hippocampal Field: Cellular Changes and Its Relation with Blood Nitro-Oxidative Stress Reveal a Balancing Function of CA3 Area in Rats Exposed to Repetead Restraint Stress. Brain Res. Bull. 2017, 130, 10–17. [Google Scholar] [CrossRef]
- Eriksson, L.; Byrne, T.; Johansson, E.; Trygg, J.; Vikström, C. Multi- and Megavariate Data Analysis. 1: Basic Principles and Applications, 3rd ed.; MKS Umetrics AB: Malmö, Sweden, 2013; ISBN 978-91-973730-5-0. [Google Scholar]
- Wiklund, S.; Johansson, E.; Sjöström, L.; Mellerowicz, E.J.; Edlund, U.; Shockcor, J.P.; Gottfries, J.; Moritz, T.; Trygg, J. Visualization of GC/TOF-MS-Based Metabolomics Data for Identification of Biochemically Interesting Compounds Using OPLS Class Models. Anal. Chem. 2008, 80, 115–122. [Google Scholar] [CrossRef]


| Group 1 Ascites | Group 2 Ascites + Cyclophosphamide | Group 3 Cyclophosphamide + E. hirsutum Extract | Group 4 E. hirsutum Extract | |
|---|---|---|---|---|
| Reticulin | 0 | 4+ | 2+ | 1+ |
| Van Gieson | 0 | 0 | 3+ | 1+ |
Disclaimer/Publisher’s Note: The statements, opinions and data contained in all publications are solely those of the individual author(s) and contributor(s) and not of MDPI and/or the editor(s). MDPI and/or the editor(s) disclaim responsibility for any injury to people or property resulting from any ideas, methods, instructions or products referred to in the content. |
© 2024 by the authors. Licensee MDPI, Basel, Switzerland. This article is an open access article distributed under the terms and conditions of the Creative Commons Attribution (CC BY) license (https://creativecommons.org/licenses/by/4.0/).
Share and Cite
Vlase, A.-M.; Toiu, A.; Gligor, O.; Muntean, D.; Casian, T.; Vlase, L.; Filip, A.; Bȃldea, I.; Clichici, S.; Decea, N.; et al. Investigation of Epilobium hirsutum L. Optimized Extract’s Anti-Inflammatory and Antitumor Potential. Plants 2024, 13, 198. https://doi.org/10.3390/plants13020198
Vlase A-M, Toiu A, Gligor O, Muntean D, Casian T, Vlase L, Filip A, Bȃldea I, Clichici S, Decea N, et al. Investigation of Epilobium hirsutum L. Optimized Extract’s Anti-Inflammatory and Antitumor Potential. Plants. 2024; 13(2):198. https://doi.org/10.3390/plants13020198
Chicago/Turabian StyleVlase, Ana-Maria, Anca Toiu, Octavia Gligor, Dana Muntean, Tibor Casian, Laurian Vlase, Adriana Filip, Ioana Bȃldea, Simona Clichici, Nicoleta Decea, and et al. 2024. "Investigation of Epilobium hirsutum L. Optimized Extract’s Anti-Inflammatory and Antitumor Potential" Plants 13, no. 2: 198. https://doi.org/10.3390/plants13020198
APA StyleVlase, A.-M., Toiu, A., Gligor, O., Muntean, D., Casian, T., Vlase, L., Filip, A., Bȃldea, I., Clichici, S., Decea, N., Moldovan, R., Toma, V.-A., Virag, P., & Crișan, G. (2024). Investigation of Epilobium hirsutum L. Optimized Extract’s Anti-Inflammatory and Antitumor Potential. Plants, 13(2), 198. https://doi.org/10.3390/plants13020198