
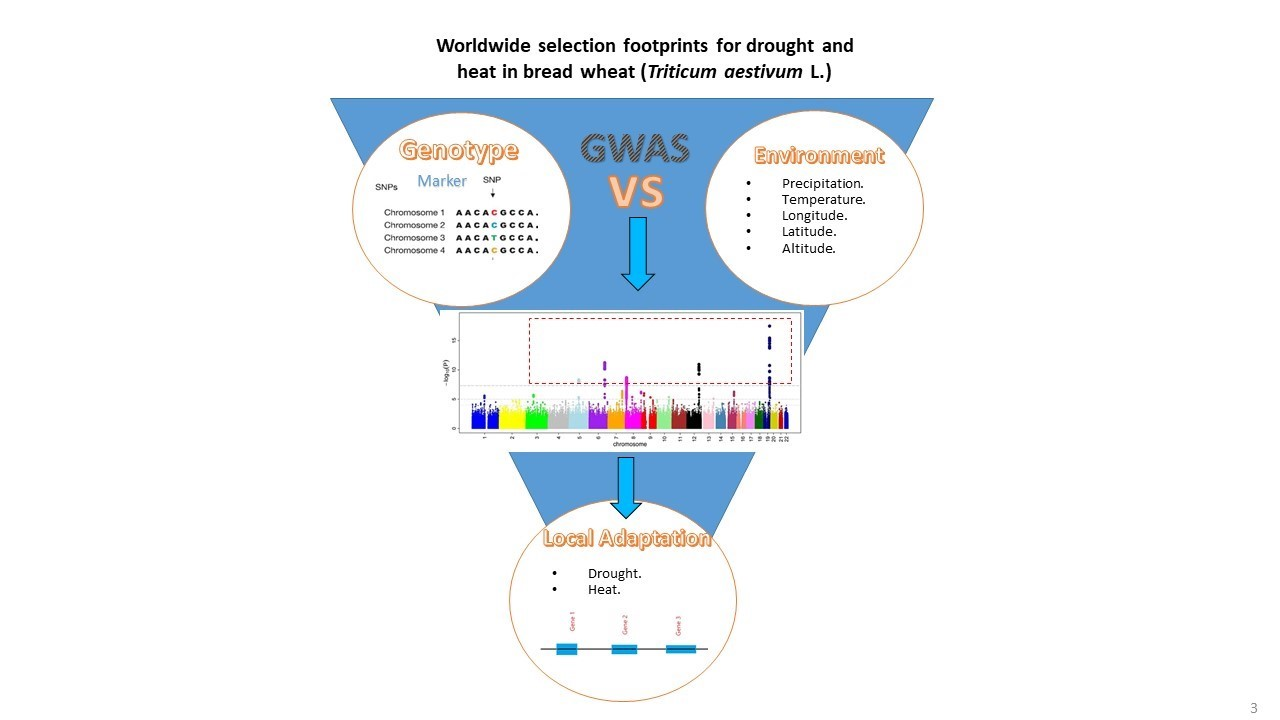
Worldwide Selection Footprints for Drought and Heat in Bread Wheat (Triticum aestivum L.)
 , , and
Abstract
:
1. Introduction
2. Results
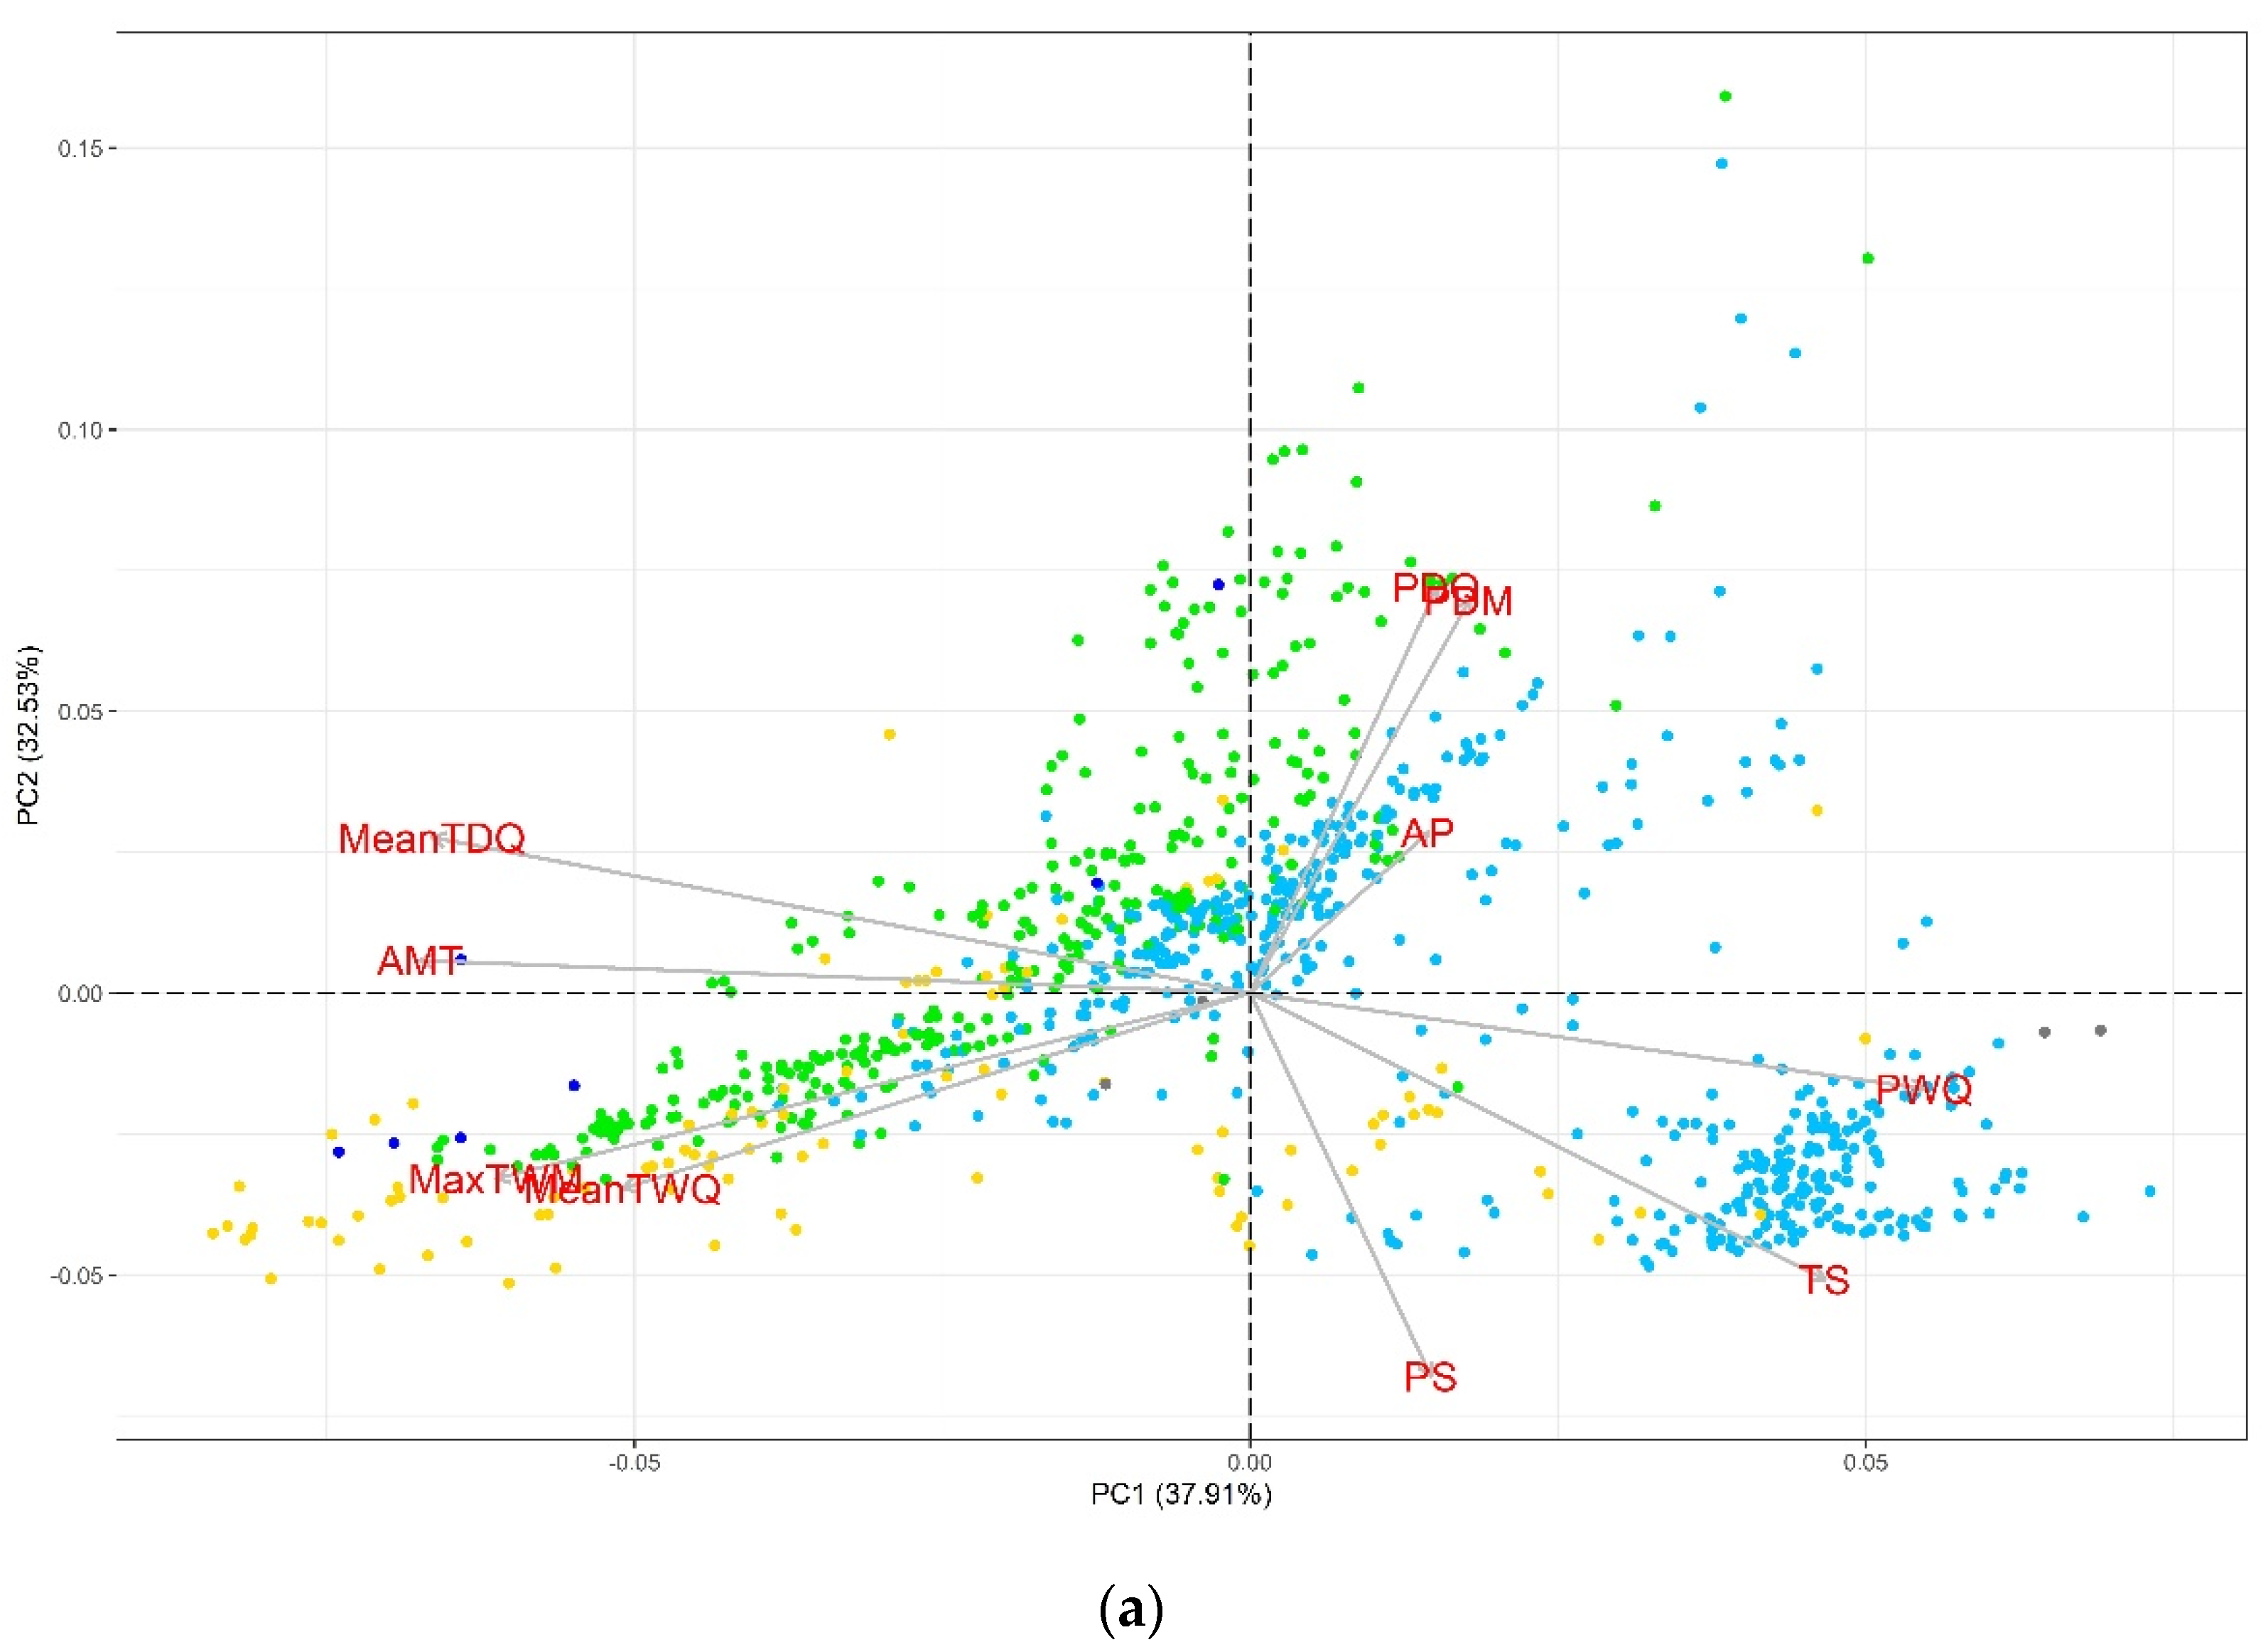
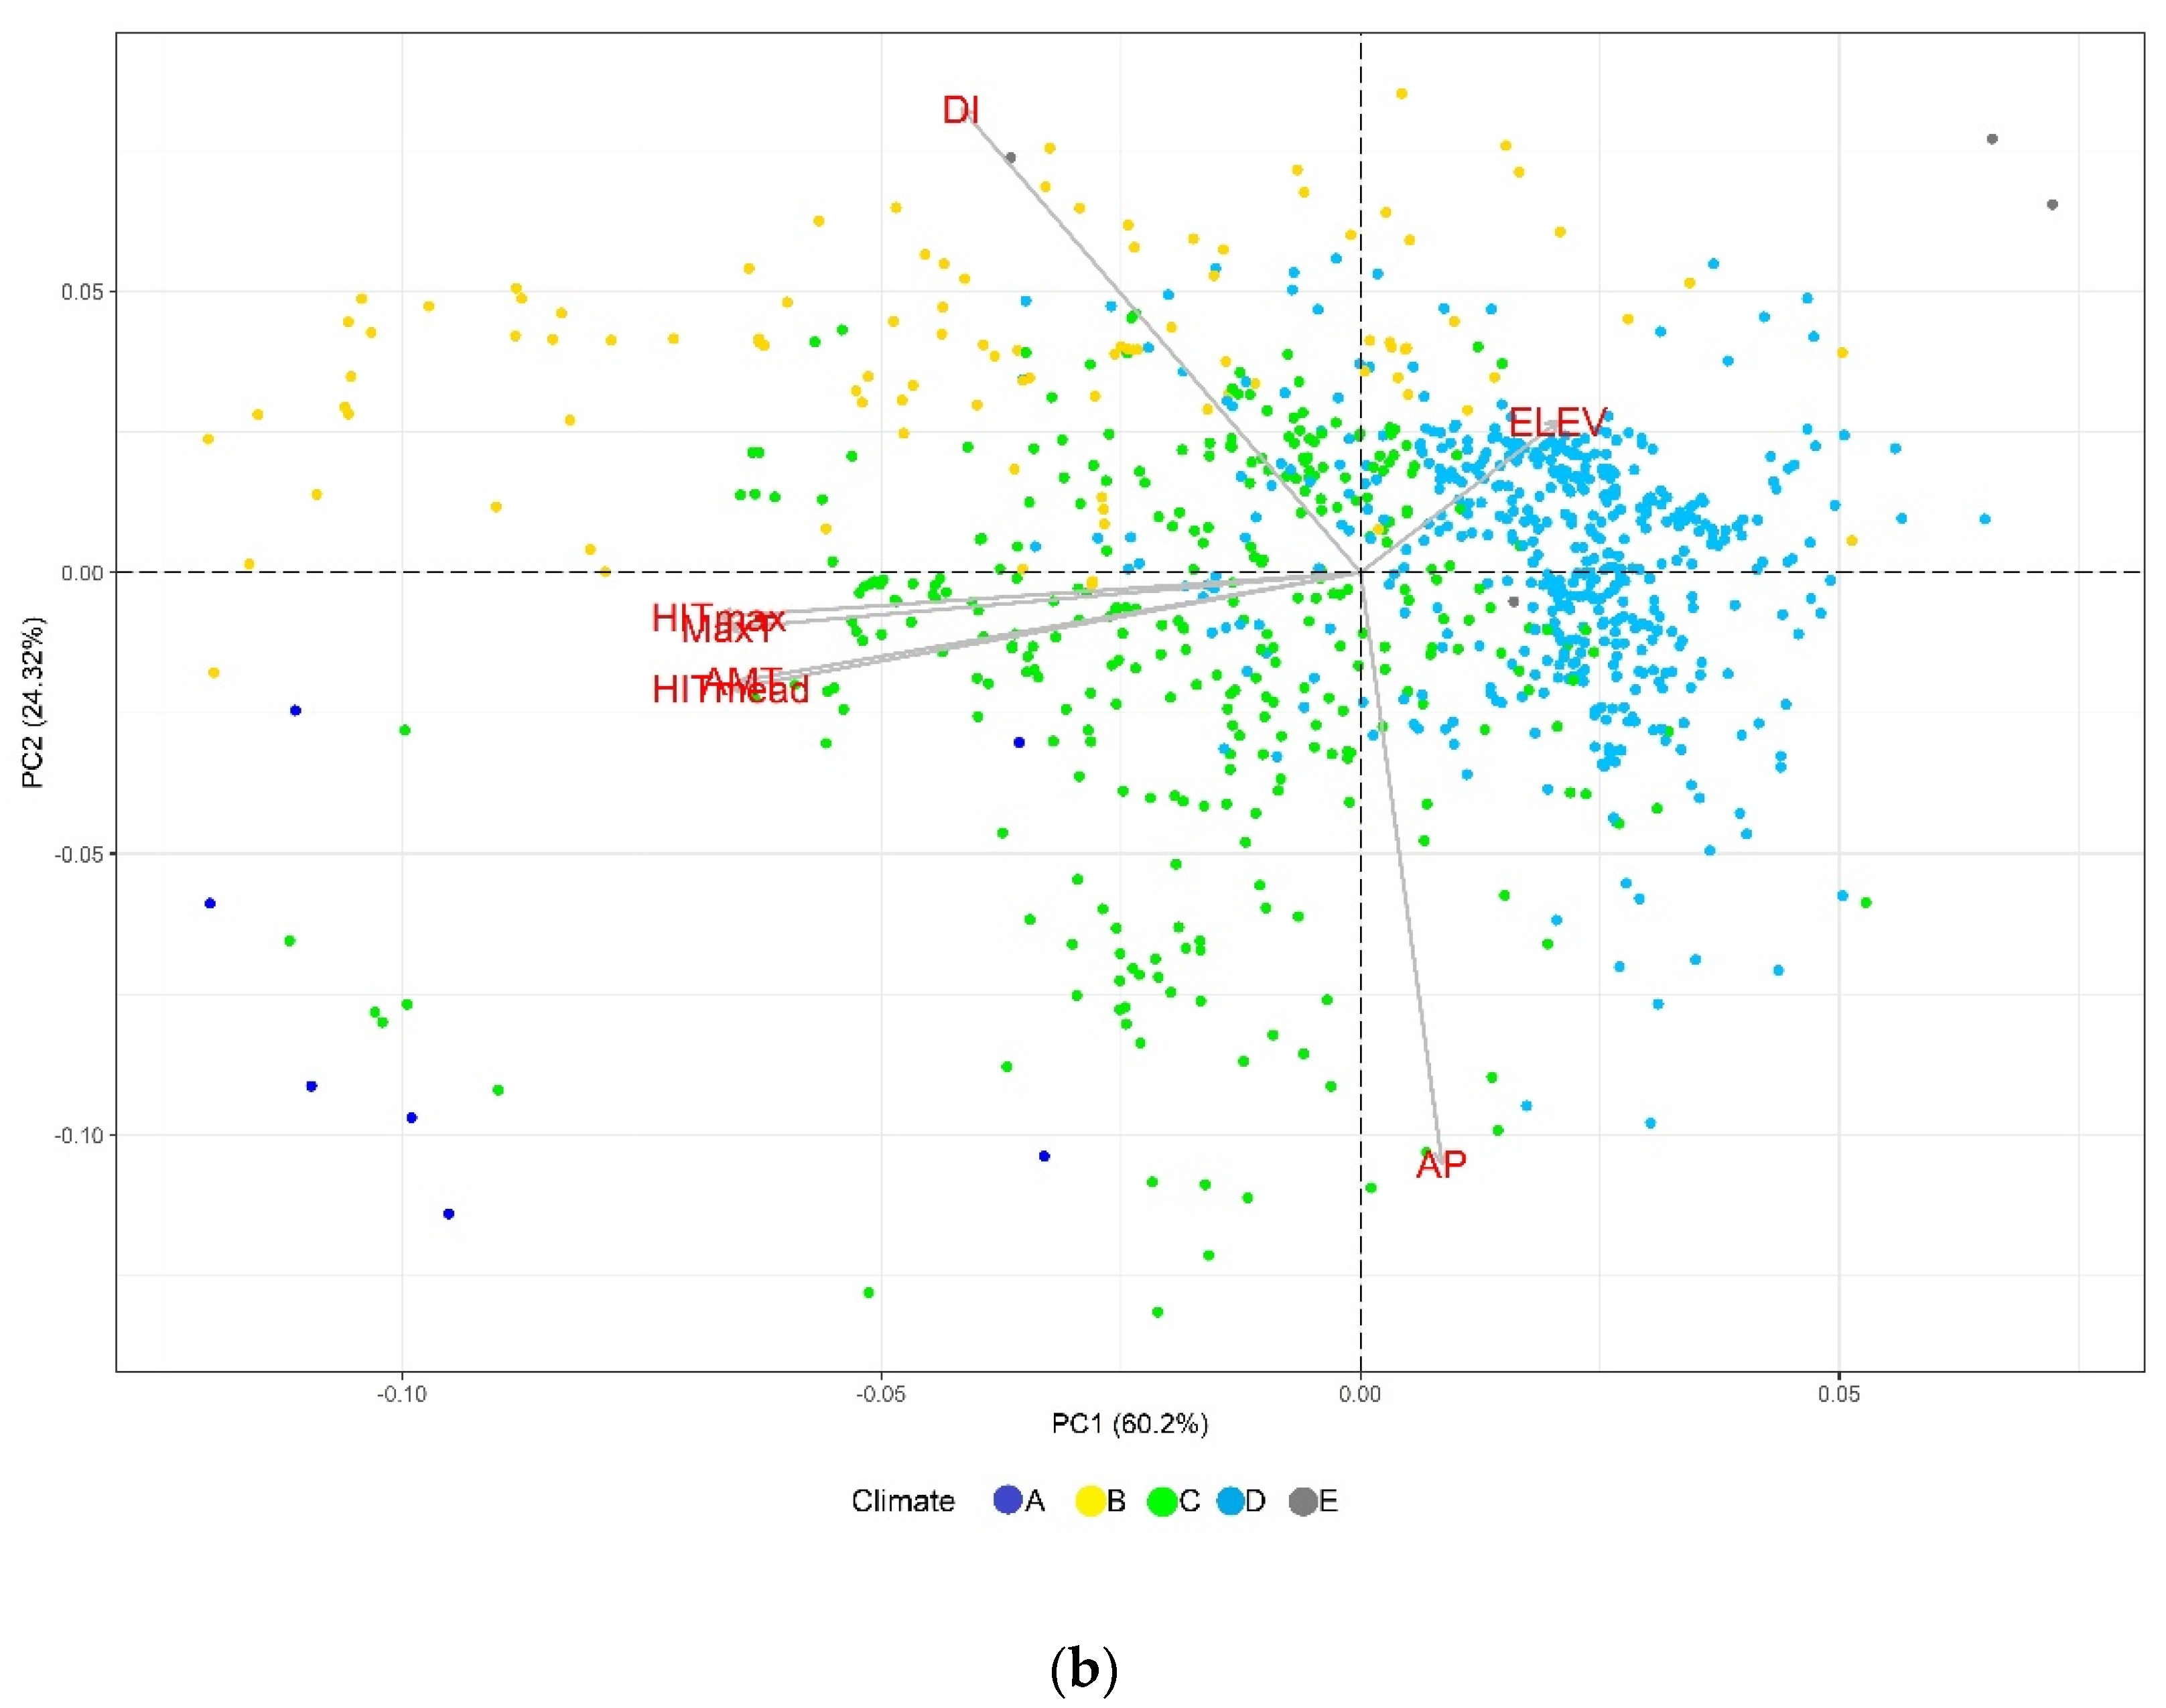
2.1. Exploratory Analysis
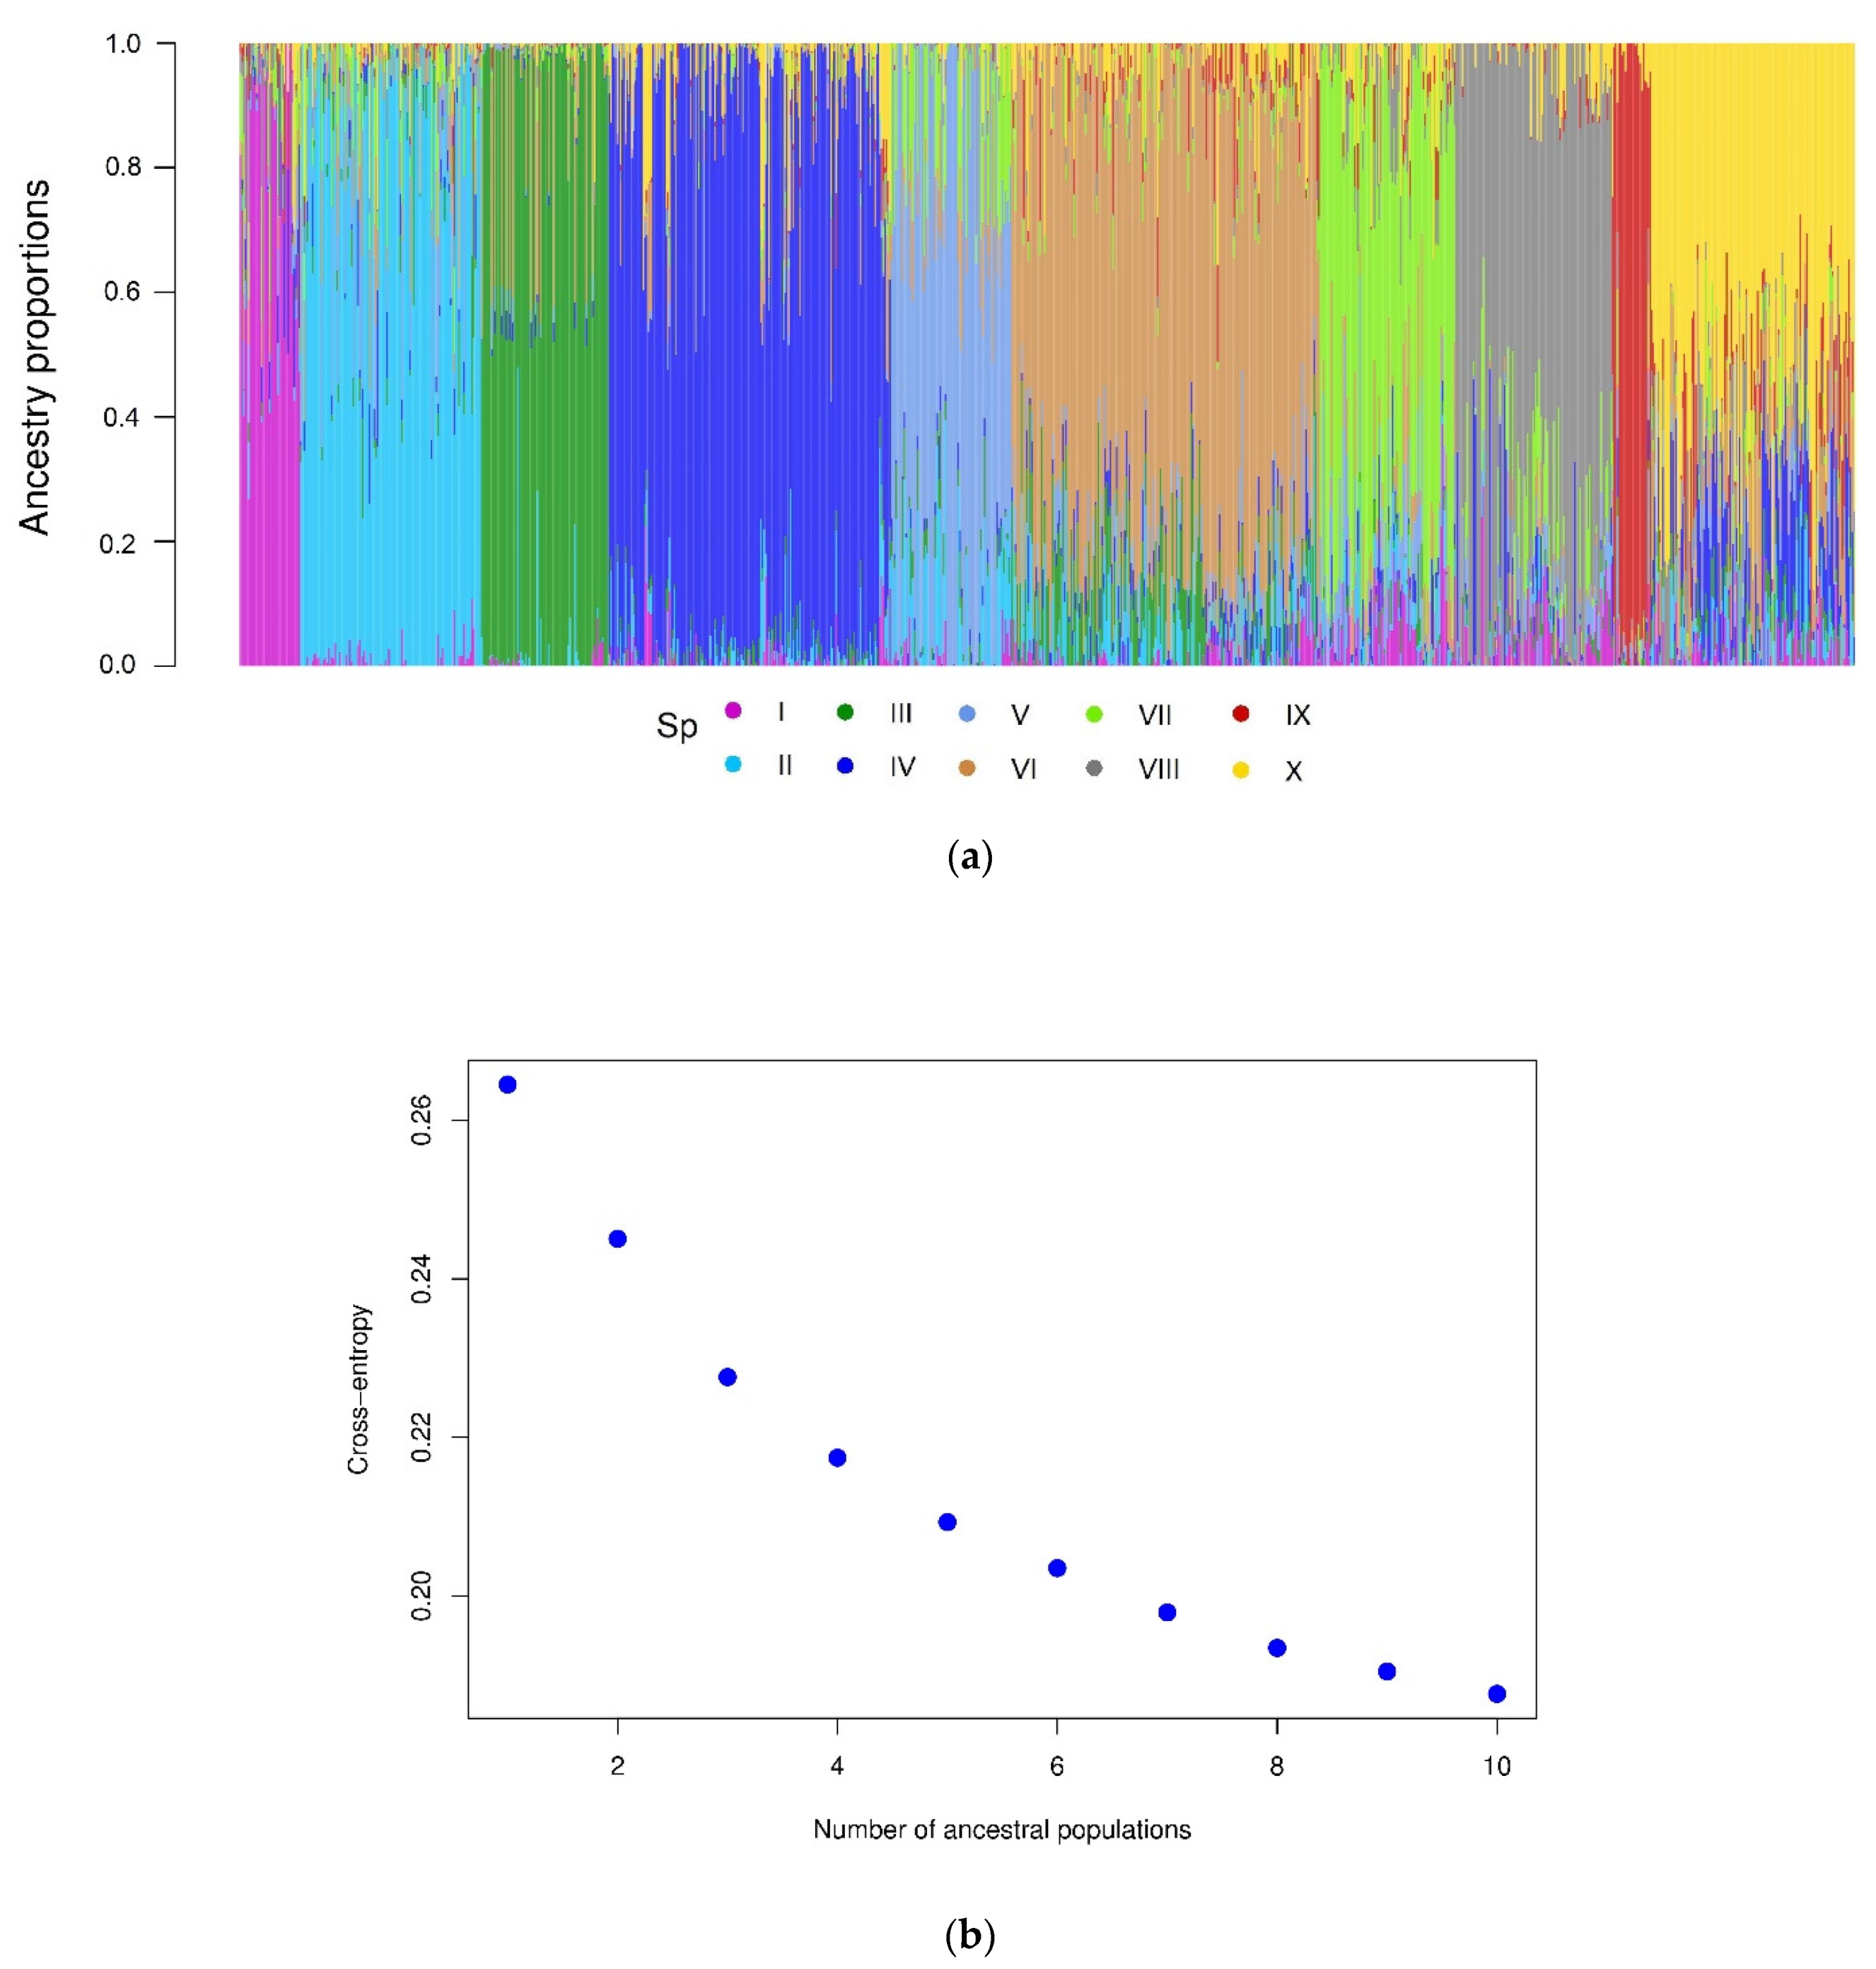
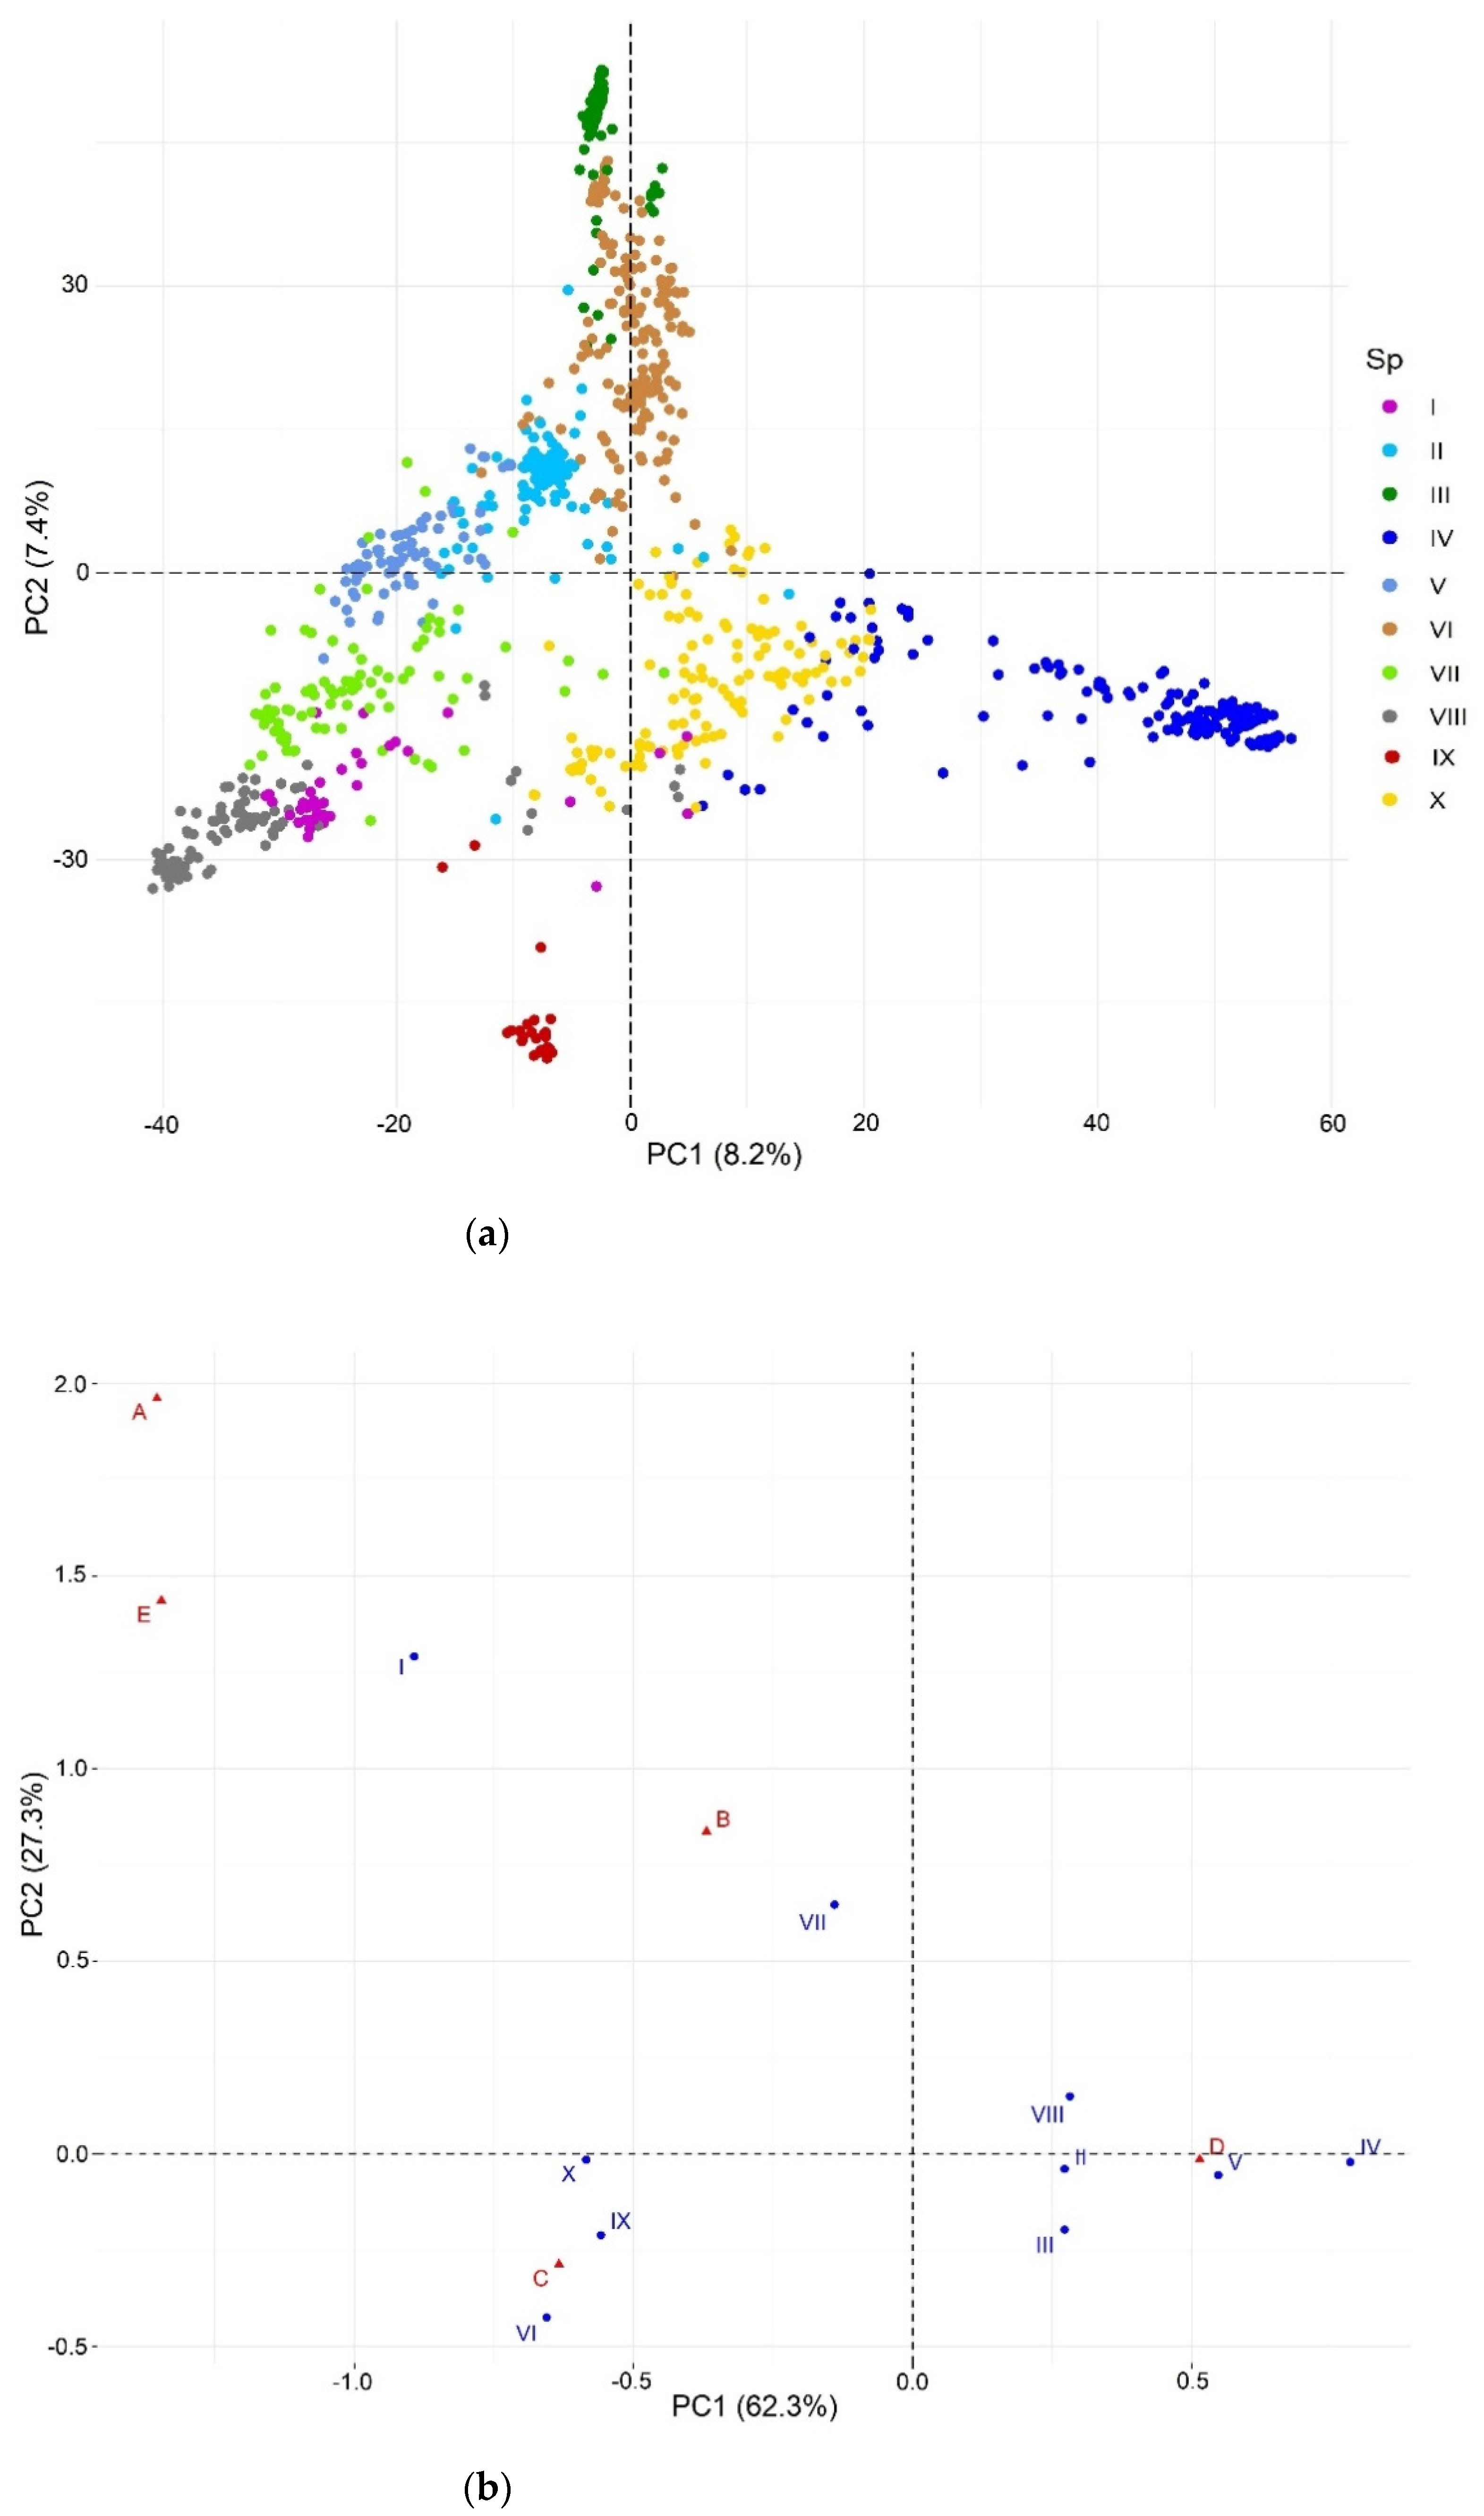
2.2. Population Structure
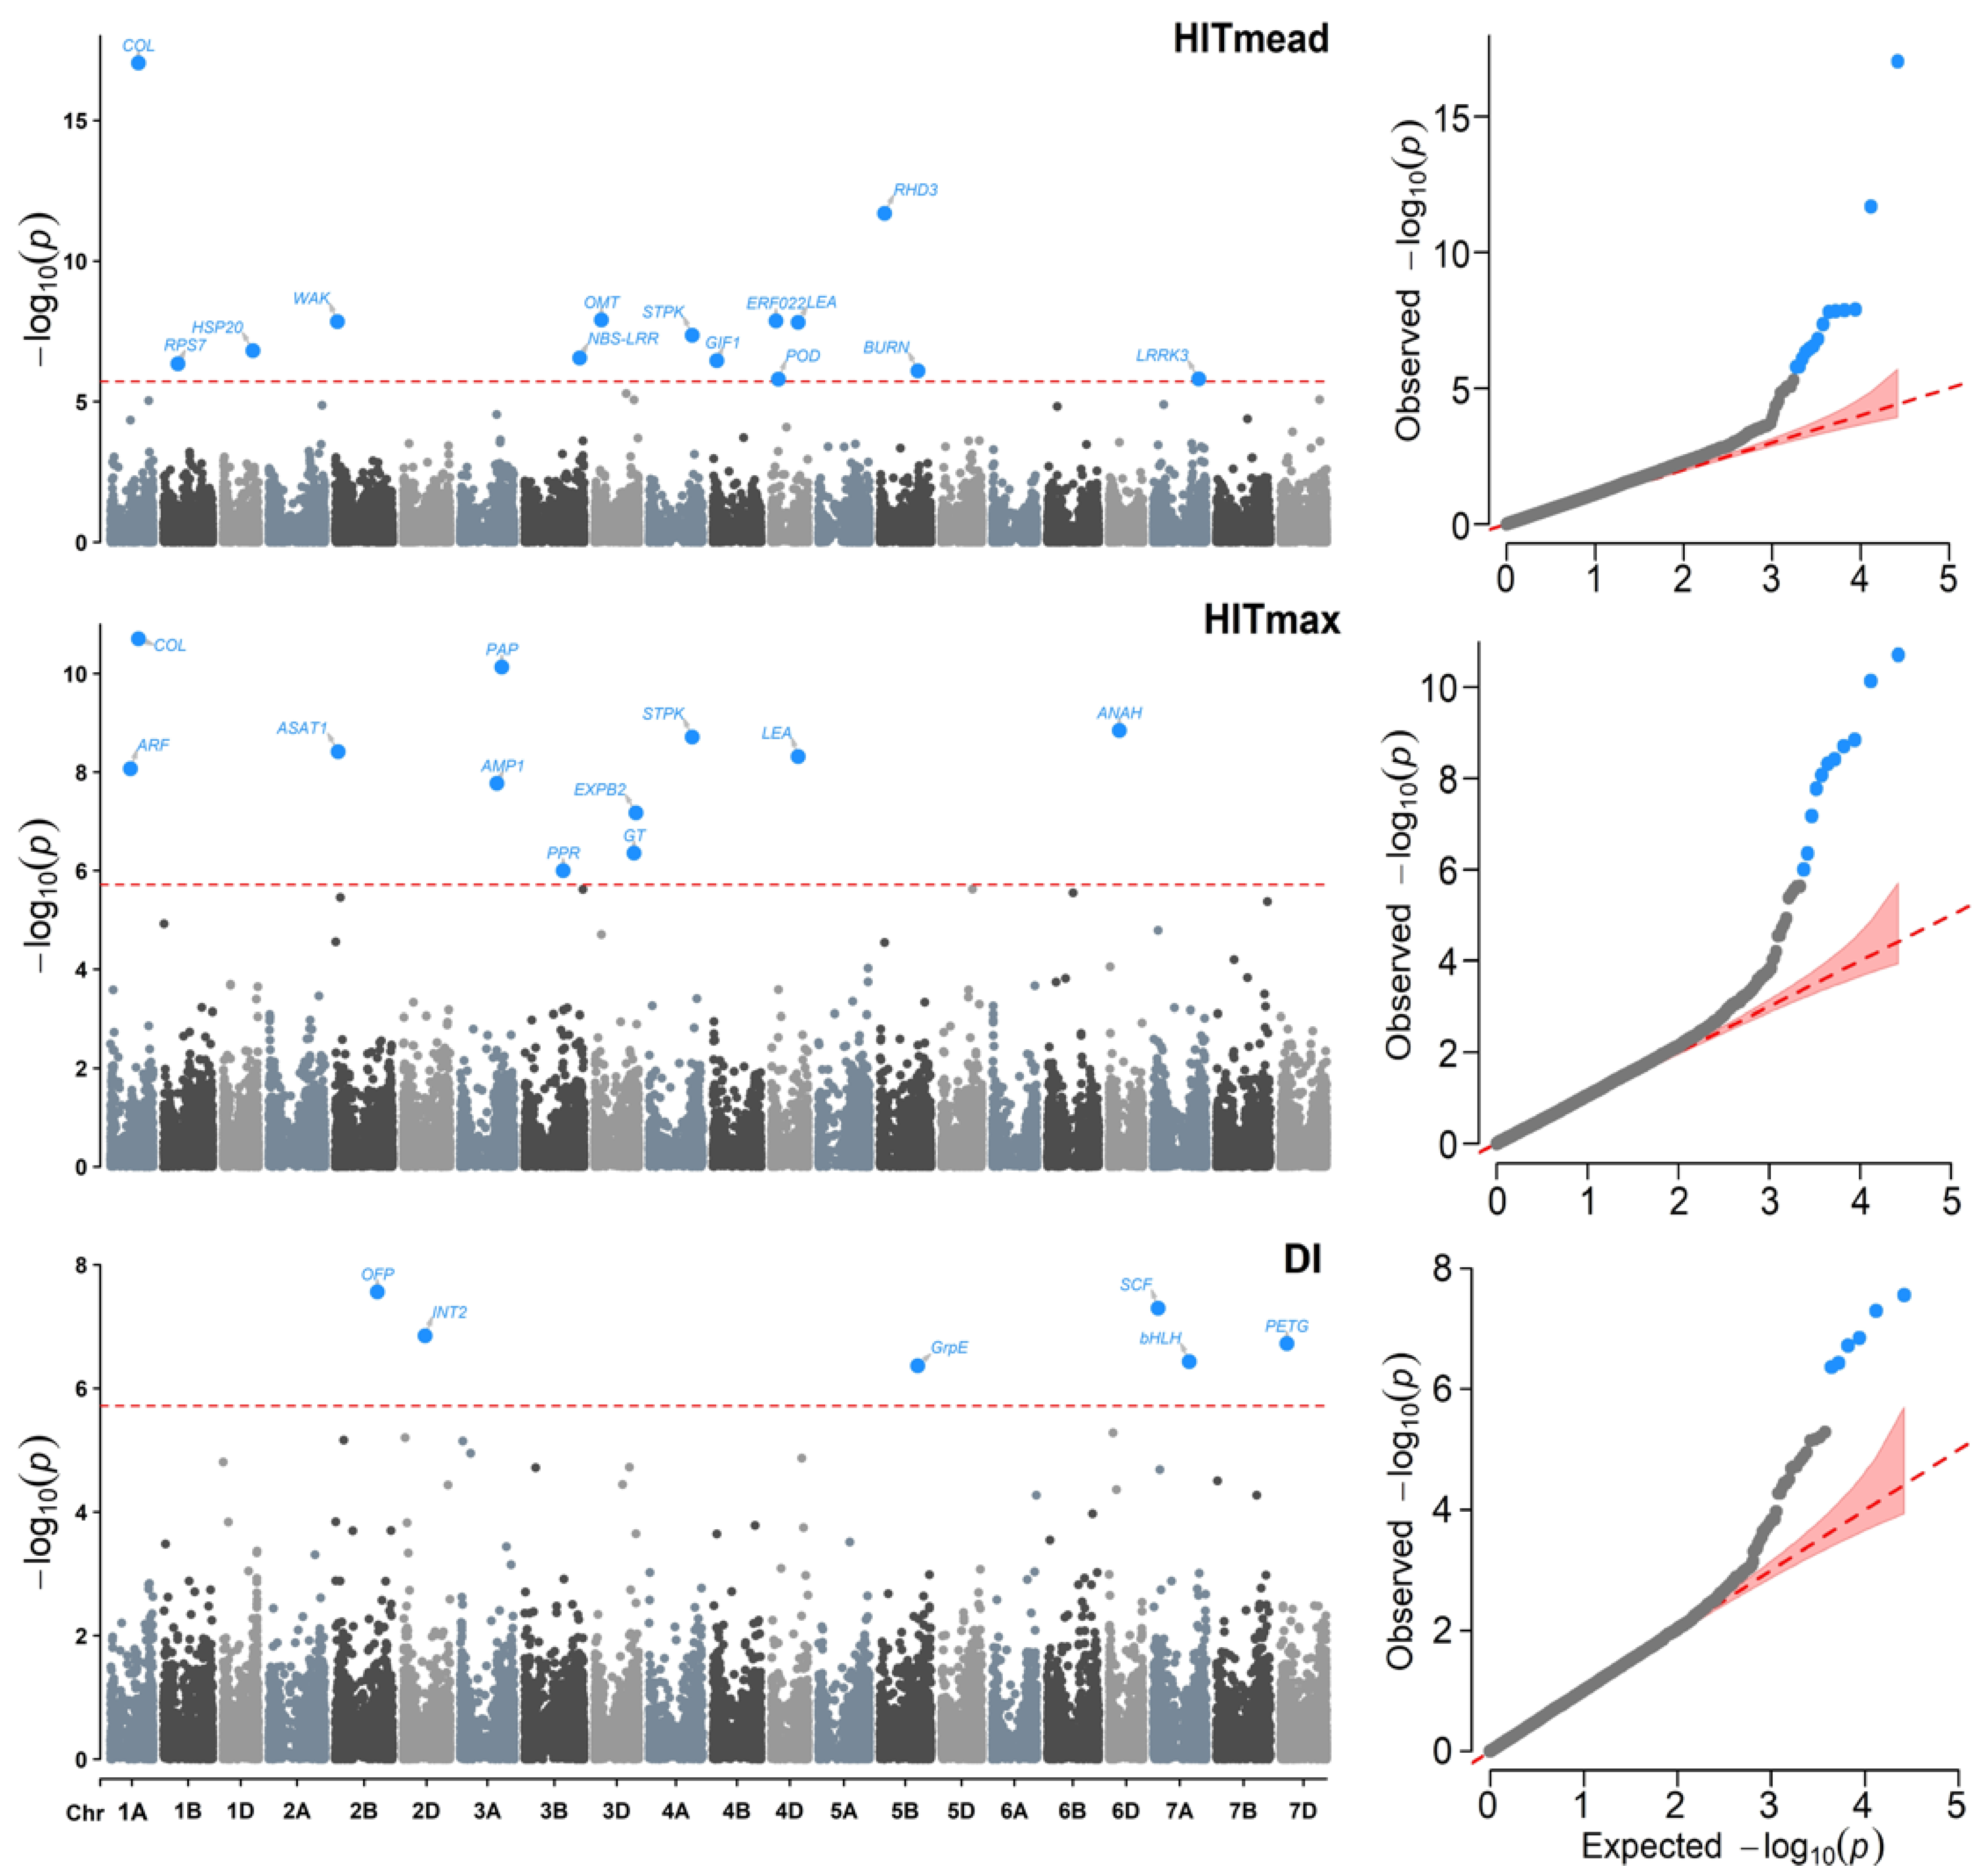
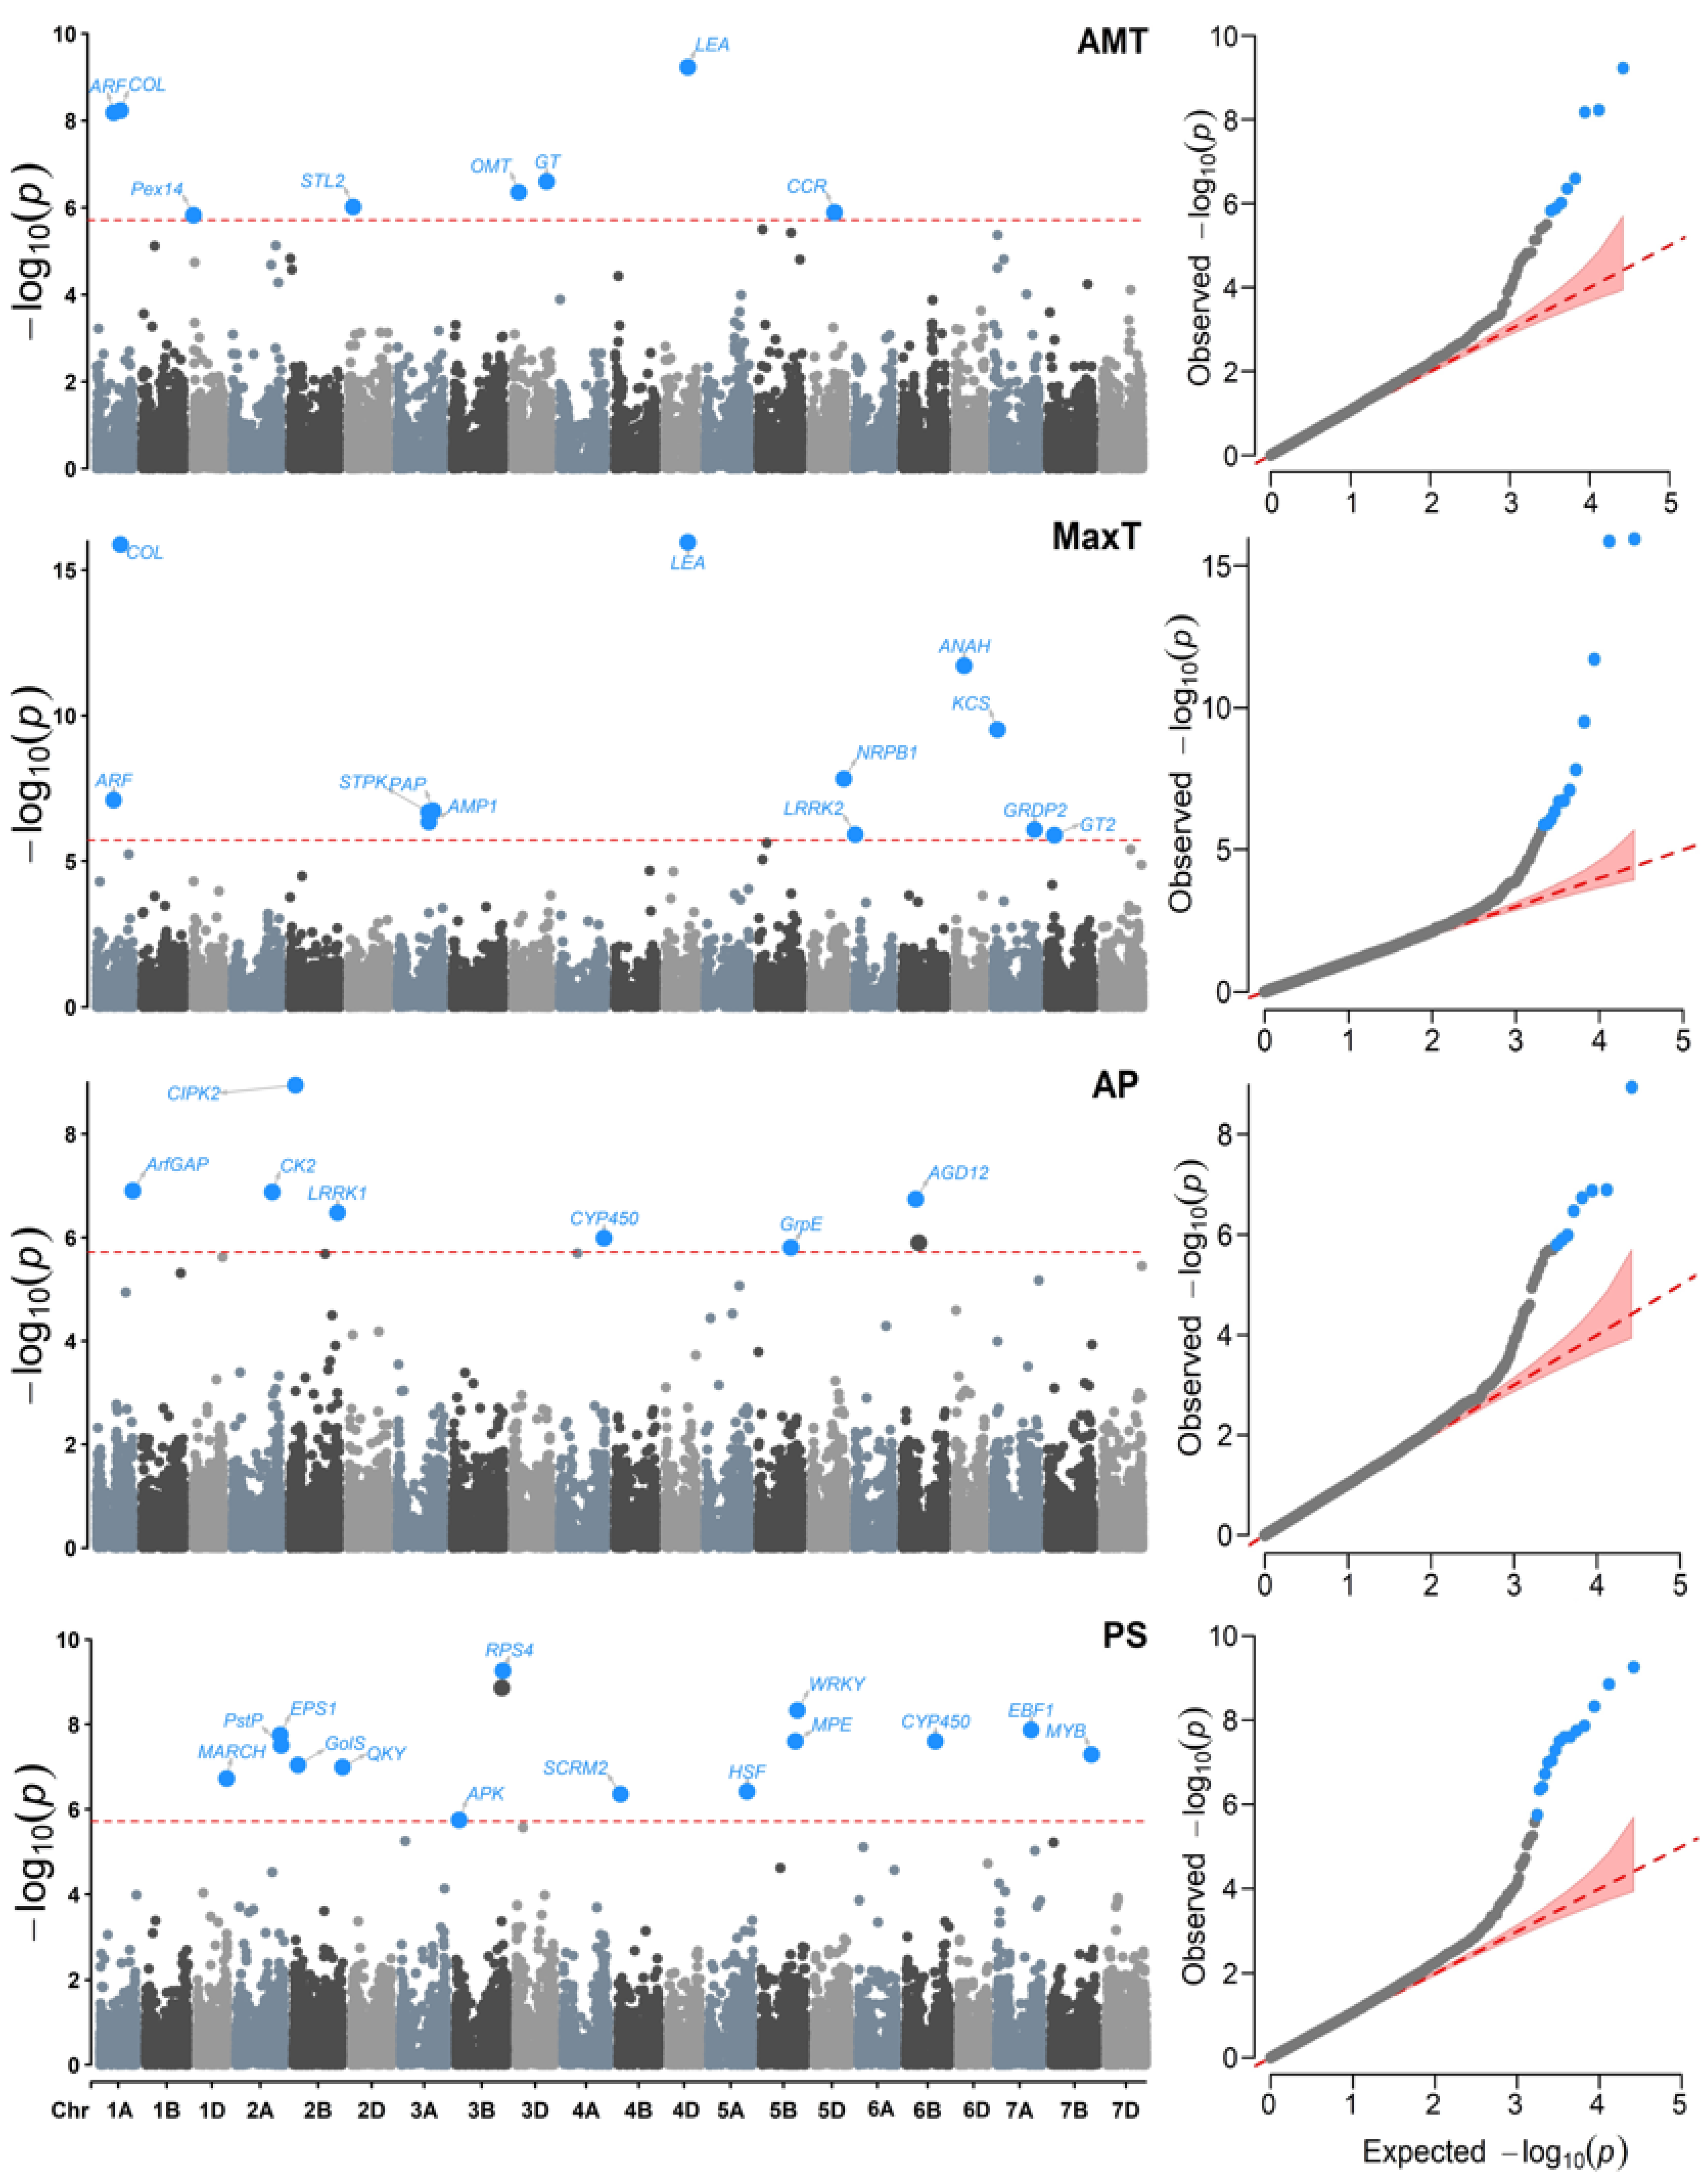
2.3. Genome-Wide Association Studies
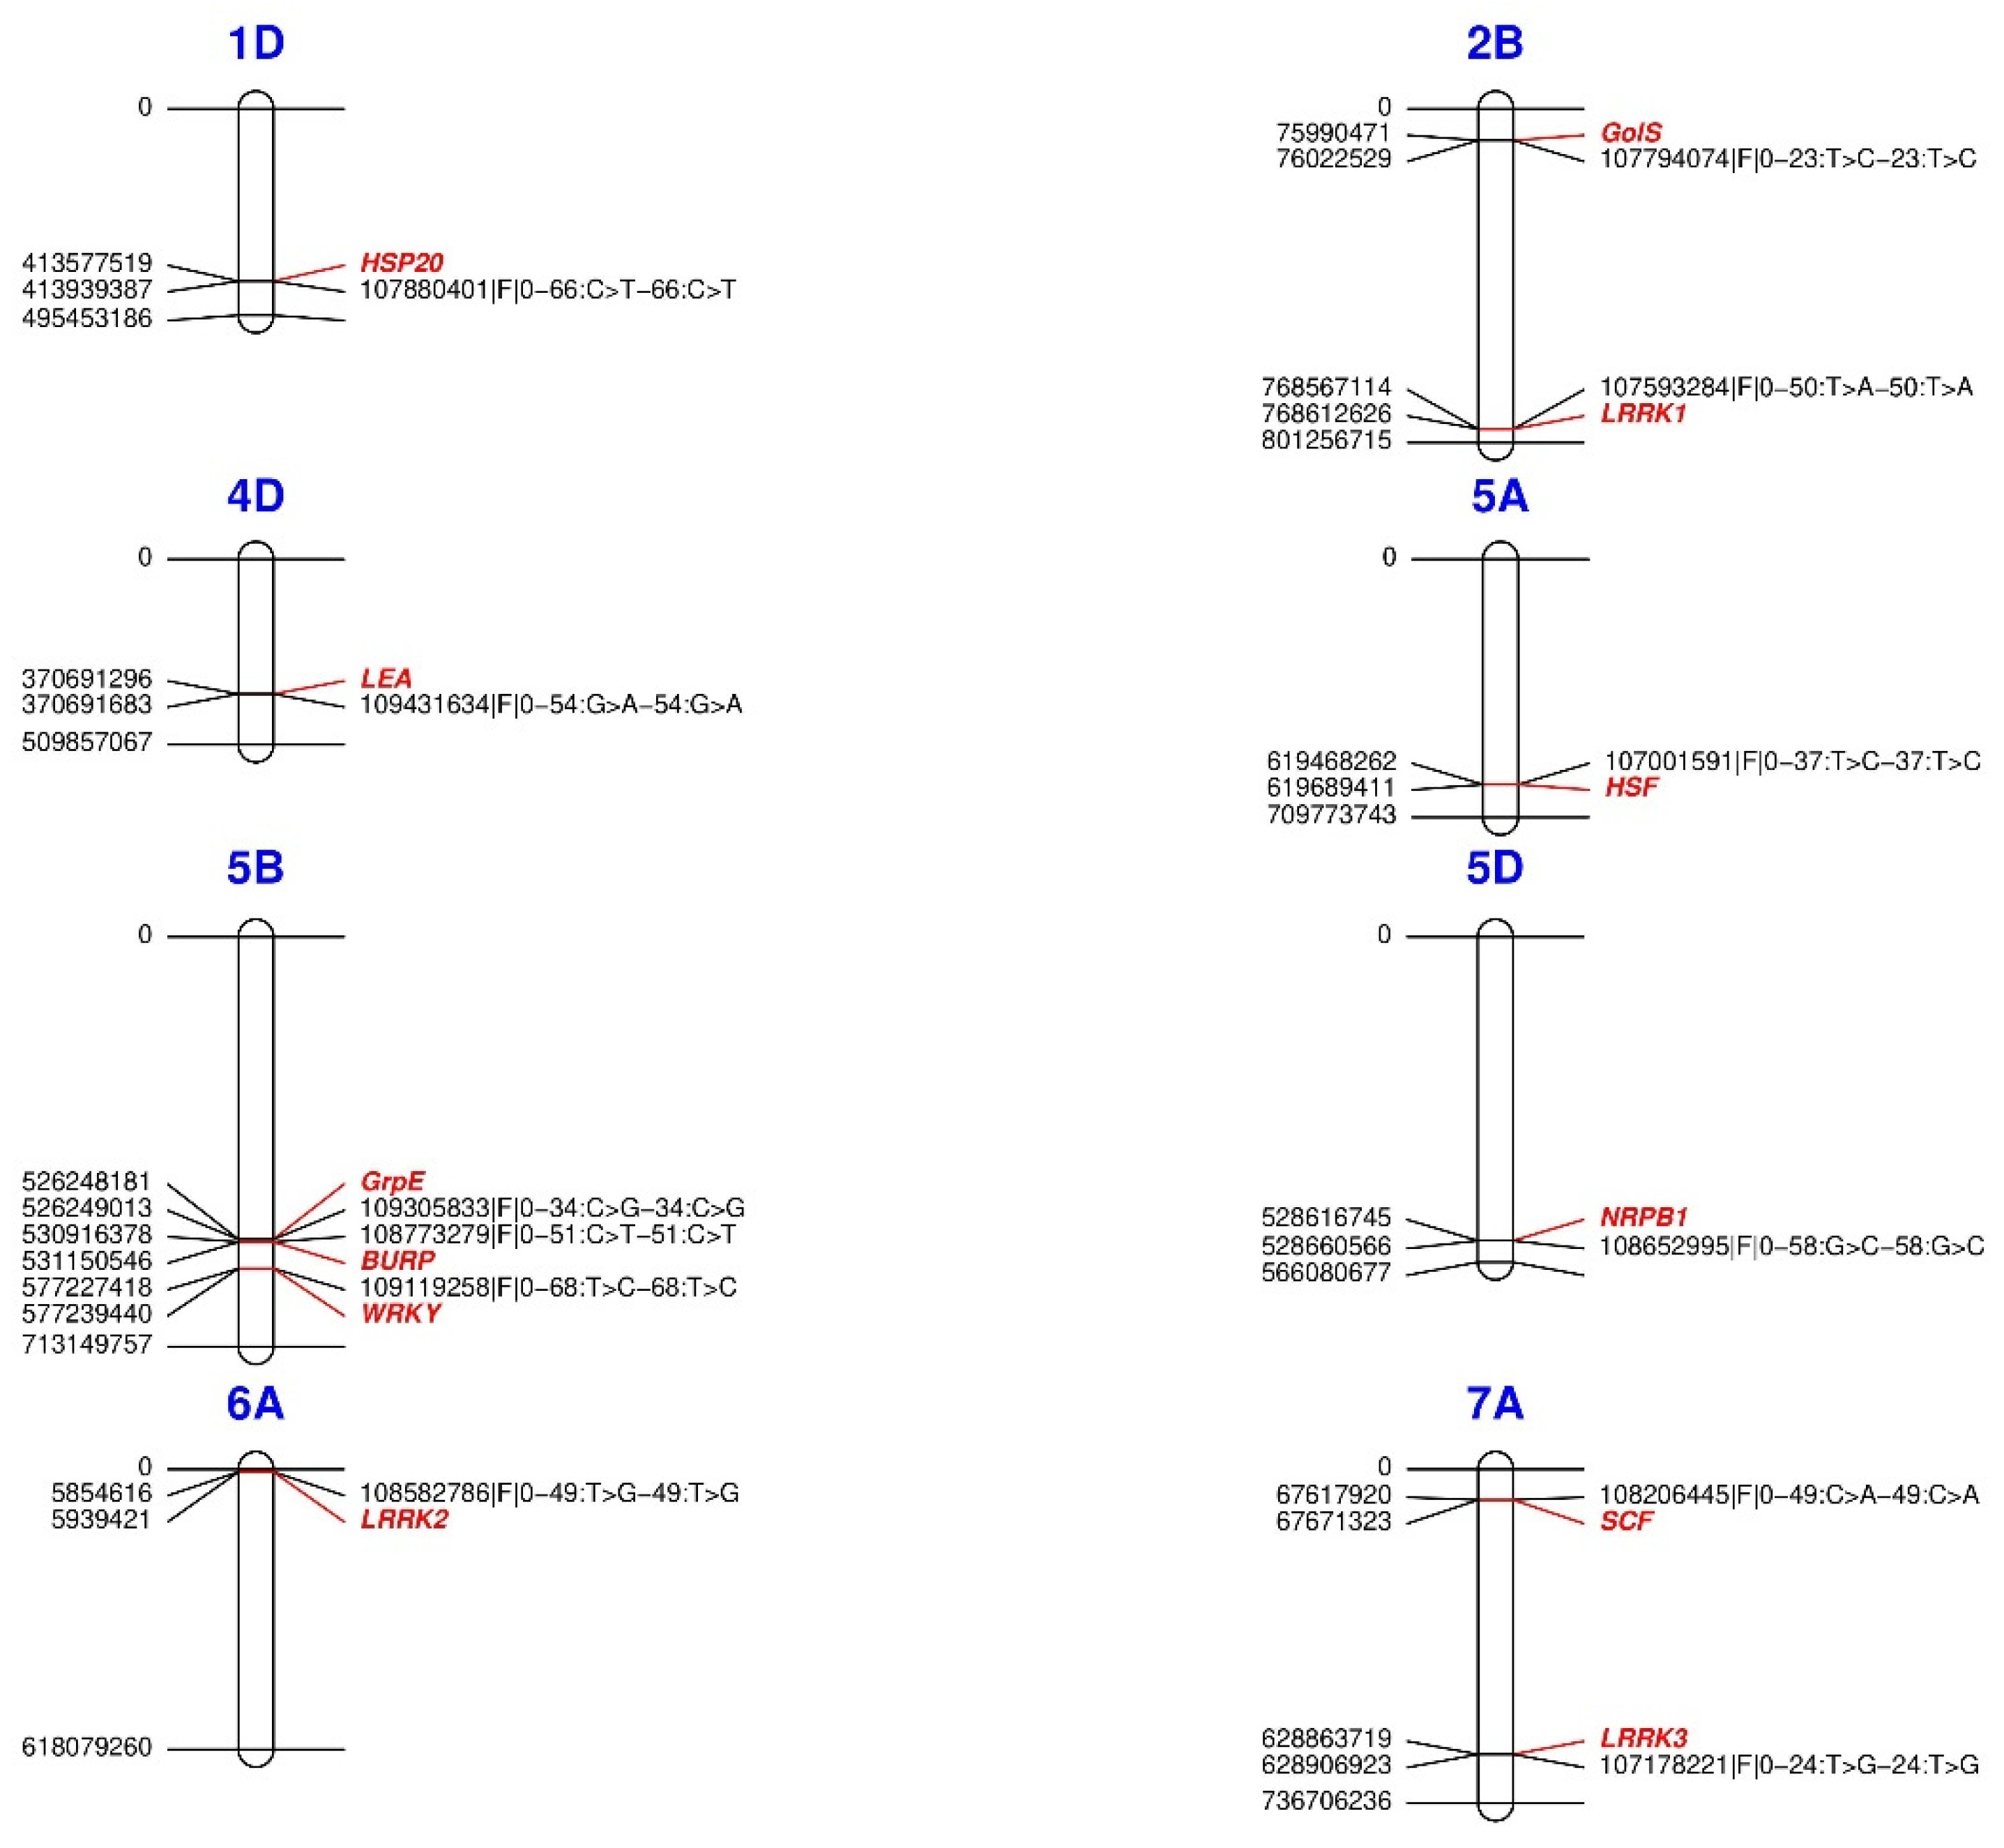
2.4. Identification of Genes Related to Adaptation to Abiotic Stress in Plants
2.5. Drought and Heat Adaptation Genes
2.6. Other Genes
3. Discussion
3.1. Environmental Variables Involved in the Detection of Adaptive Loci by GEA
3.2. Adaptation to Drought and Heat Stress
4. Materials and Methods
4.1. Geographical Data
4.2. Genotypic Data
4.3. Climatic Data
4.4. Index Estimation
4.5. Exploratory Analysis of Climatic Variables
4.6. Population Structure
4.7. Association Analysis
4.8. Candidate Genes and Their Annotation
5. Conclusions and Practical Implications
Supplementary Materials
Author Contributions
Funding
Data Availability Statement
Acknowledgments
Conflicts of Interest
References
- Chao, S.; Dubcovsky, J.; Dvorak, J.; Luo, M.-C.; Baenziger, S.P.; Matnyazov, R.; Clark, D.R.; Talbert, L.E.; Anderson, J.A.; Dreisigacker, S.; et al. Population- andGenome-Specific Patterns of Linkage Disequilibriumand SNP Variationin Spring and Winter Wheat (Triticum aestivum L.). BMC Genom. 2010, 11, 727. [Google Scholar] [CrossRef] [PubMed]
- Lopes, M.S.; El-Basyoni, I.; Baenziger, P.S.; Singh, S.; Royo, C.; Ozbek, K.; Aktas, H.; Ozer, E.; Ozdemir, F.; Manickavelu, A.; et al. Exploiting Genetic Diversity from LandracesinWheat Breeding for Adaptation to Climate Change. J. Exp. Bot. 2015, 66, 3477–3486. [Google Scholar] [CrossRef]
- Nazim Ud Dowla, M.A.N.; Edwards, I.; O’Hara, G.; Islam, S.; Ma, W. Developing Wheat for Improved Yield and Adaptation under a Changing Climate: Optimization of a Few Key Genes. Engineering 2018, 4, 514–522. [Google Scholar] [CrossRef]
- Challinor, A.J.; Watson, J.; Lobell, D.B.; Howden, S.M.; Smith, D.R.; Chhetri, N. A Meta-Analysis of Crop Yield under Climate Change and Adaptation. Nat. Clim. Change 2014, 4, 287–291. [Google Scholar] [CrossRef]
- Corrado, G.; Rao, R. Towards the Genomic Basis of Local Adaptation in Landraces. Diversity 2017, 9, 51. [Google Scholar] [CrossRef]
- Sansaloni, C.; Franco, J.; Santos, B.; Percival-Alwyn, L.; Singh, S.; Petroli, C.; Campos, J.; Dreher, K.; Payne, T.; Marshall, D.; et al. Diversity Analysis of 80,000 Wheat Accessions Reveals Consequences and Opportunities of Selection Footprints. Nat. Commun. 2020, 11, 4572. [Google Scholar] [CrossRef] [PubMed]
- Contreras-Moreira, B.; Serrano-Notivoli, R.; Mohammed, N.E.; Cantalapiedra, C.P.; Beguería, S.; Casas, A.M.; Igartua, E. Genetic Association with High-Resolution Climate Data Reveals Selection Footprints in the Genomes of Barley Landraces across the Iberian Peninsula. Mol. Ecol. 2019, 28, 1994–2012. [Google Scholar] [CrossRef] [PubMed]
- Pavlidis, P.; Jensen, J.D.; Stephan, W. Searching for Footprints of Positive Selection in Whole-Genome SNP Data from Nonequilibrium Populations. Genetics 2010, 185, 907–922. [Google Scholar] [CrossRef] [PubMed]
- Tang, Y.; Liu, X.; Wang, J.; Li, M.; Wang, Q.; Tian, F.; Su, Z.; Pan, Y.; Liu, D.; Lipka, A.E.; et al. GAPIT Version2: An Enhanced Integrated Tool for Genomic Association and Prediction. Plant Genome 2016, 9. [Google Scholar] [CrossRef]
- López-Hernández, F.; Cortés, A.J. Last-Generation Genome–Environment Associations Reveal the Genetic Basis of Heat Tolerancein Common Bean (Phaseolus vulgaris L.). Front. Genet. 2019, 10, 954. [Google Scholar] [CrossRef] [Green Version]
- Hancock, A.M.; Brachi, B.; Faure, N.; Horton, M.W.; Jarymowycz, L.B.; Sperone, F.G.; Toomajian, C.; Roux, F.; Bergelson, J. Adaptation to Climate across the Arabidopsis thaliana Genome. Science 2011, 334, 83–86. [Google Scholar] [CrossRef] [PubMed]
- Jones, F.C.; Grabherr, M.G.; Chan, Y.F.; Russell, P.; Mauceli, E.; Johnson, J.; Swofford, R.; Pirun, M.; Zody, M.C.; White, S.; et al. The Genomic Basis of Adaptive Evolution in Threespine Sticklebacks. Nature 2012, 484, 55–61. [Google Scholar] [CrossRef] [PubMed]
- Turner, T.L.; Bourne, E.C.; VonWettberg, E.J.; Hu, T.T.; Nuzhdin, S.V. Population Resequencing Reveals Local Adaptation of Arabidopsis lyrate to Serpentine Soils. Nat. Genet. 2010, 42, 260–263. [Google Scholar] [CrossRef] [PubMed]
- Yoder, J.B.; Stanton-Geddes, J.; Zhou, P.; Briskine, R.; Young, N.D.; Tiffin, P. Genomic Signature of Adaptation to Climate in Medicago Truncatula. Genetics 2014, 196, 1263–1275. [Google Scholar] [CrossRef]
- Lasky, J.R.; Upadhyaya, H.D.; Ramu, P.; Deshpande, S.; Hash, C.T.; Bonnette, J.; Juenger, T.E.; Hyma, K.; Acharya, C.; Mitchell, S.E.; et al. Genome-Environment Associations in Sorghum Landraces Predict Adaptive Traits. Sci. Adv. 2015, 1, e1400218. [Google Scholar] [CrossRef]
- Romero-Navarro, J.A.; Willcox, M.; Burgueño, J.; Romay, C.; Swarts, K.; Trachsel, S.; Preciado, E.; Terron, A.; Delgado, H.V.; Vidal, V.; et al. A Study of Allelic Diversity Underlying Flowering-Time Adaptation in Maize Landraces. Nat. Genet. 2017, 49, 476–480. [Google Scholar] [CrossRef]
- Cortés, A.J.; Blair, M.W. Genotyping by Sequencing and Genome–Environment Associations in Wild Common Bean Predict Widespread Divergent Adaptation to Drought. Front. Plant Sci. 2018, 9, 128. [Google Scholar] [CrossRef]
- Lei, L.; Poets, A.M.; Liu, C.; Wyant, S.R.; Hoffman, P.J.; Carter, C.K.; Shaw, B.G.; Li, X.; Muehlbauer, G.J.; Katagiri, F.; et al. Environmental Association Identifies Candidates for Tolerance to Low Temperature and Drought. G3 Genes Genomes Genet. 2019, 9, 3423–3438. [Google Scholar] [CrossRef]
- Li, Y.; Li, D.; Jiao, Y.; Schnable, J.C.; Li, Y.; Li, H.; Chen, H.; Hong, H.; Zhang, T.; Liu, B.; et al. Identification of Loci Controlling Adaptation in Chinese Soya Bean Landraces via a Combination of Conventional and Bioclimatic GWAS. Plant Biotechnol. J. 2020, 18, 389–401. [Google Scholar] [CrossRef]
- Rodriguez, M.; Scintu, A.; Posadinu, C.M.; Xu, Y.; Nguyen, C.V.; Sun, H.; Bitocchi, E.; Bellucci, E.; Papa, R.; Fei, Z.; et al. GWASBasedon RNA-Seq SNPs and High-Throughput Phenotyping Combined with Climatic Data Highlights the Reservoir of Valuable Genetic Diversity in Regional Tomato Landraces. Genes 2020, 11, 1387. [Google Scholar] [CrossRef]
- Sokolkova, A.; Bulyntsev, S.V.; Chang, P.L.; Carrasquilla-Garcia, N.; Igolkina, A.A.; Noujdina, N.V.; von Wettberg, E.; Vishnyakova, M.A.; Cook, D.R.; Nuzhdin, S.V.; et al. Genomic Analysis of Vavilov’s Historic Chickpea Landraces Reveals Footprintsof Environmental and Human Selection. Int. J. Mol. Sci. 2020, 21, 3952. [Google Scholar] [CrossRef]
- Li, Y.; Cao, K.; Li, N.; Zhu, G.; Fang, W.; Chen, C.; Wang, X.; Guo, J.; Wang, Q.; Ding, T.; et al. Genomic Analyses Provide Insights into Peach Local Adaptation and Responses to Climate Change. Genome Res. 2021, 31, 592–606. [Google Scholar] [CrossRef]
- Hanif, U.; Alipour, H.; Gul, A.; Jing, L.; Darvishzadeh, R.; Amir, R.; Munir, F.; Ilyas, M.K.; Ghafoor, A.; Siddiqui, S.U.; et al. Characterization of the Genetic Basis of Local Adaptation of Wheat Landraces from Iran and Pakistan Using Genome-WideAssociation Study. Plant Genome 2021, 14, e20096. [Google Scholar] [CrossRef] [PubMed]
- Pixley, K.V.; Salinas-Garcia, G.E.; Hall, A.; Kropff, M.; Ortiz, C.; Bouvet, L.C.; Suhalia, A.; Vikram, P.; Singh, S. CIMMYT’s Seeds of Discovery Initiative: Harnessing Biodiversity for Food Security and Sustainable Development. Indian J. Plant Genet. Resour. 2018, 31, 1. [Google Scholar] [CrossRef]
- Vikram, P.; Franco, J.; Burgueño-Ferreira, J.; Li, H.; Sehgal, D.; SaintPierre, C.; Ortiz, C.; Sneller, C.; Tattaris, M.; Guzman, C.; et al. Unlocking the Genetic Diversity of Creole Wheats. Sci. Rep. 2016, 6, 23092. [Google Scholar] [CrossRef] [PubMed]
- Vangelis, H.; Tigkas, D.; Tsakiris, G. The Effect of PET Method on Reconnaissance Drought Index (RDI) Calculation. J. Arid Environ. 2013, 88, 130–140. [Google Scholar] [CrossRef]
- O’Donnell, M.S.; Ignizio, D.A. Bioclimatic Predictors for Supporting Ecological Applications in the Conterminous United States; Data Series; U.S. Geological Survey; U.S. Department of the Interior: Washington, DC, USA, 2012.
- Noce, S.; Caporaso, L.; Santini, M. A New Global Dataset of Bioclimatic Indicators. Sci. Data 2020, 7, 398. [Google Scholar] [CrossRef]
- Cortés, A.J.; Monserrate, F.A.; Ramírez-Villegas, J.; Madriñán, S.; Blair, M.W. Drought Tolerance in Wild Plant Populations: The Case of Common Beans (Phaseolus vulgaris L.). PLoS ONE 2013, 8, e62898. [Google Scholar] [CrossRef]
- Van der Schrier, G.; Jones, P.D.; Briffa, K.R. The Sensitivity of the PDSI to the Thornthwaite and Penman-Monteith Parameterizations for Potential Evapotranspiration. J. Geophys. Res. 2011, 116, D03106. [Google Scholar] [CrossRef]
- Salehnia, N.; Alizadeh, A.; Sanaeinejad, H.; Bannayan, M.; Zarrin, A.; Hoogenboom, G. Estimation of Meteorological Drought Indices Based on AgMERRA Precipitation Data and Station-Observed Precipitation Data. J. Arid Land 2017, 9, 797–809. [Google Scholar] [CrossRef] [Green Version]
- Khatun, K.; Debnath, S.; Robin, A.H.K.; Wai, A.H.; Nath, U.K.; Lee, D.-J.; Kim, C.-K.; Chung, M.-Y. Genome-Wide Identification, Genomic Organization, and Expression Profiling of the CONSTANS-like (COL) Gene Family in Petunia under Multiple Stresses. BMC Genom. 2021, 22, 727. [Google Scholar] [CrossRef] [PubMed]
- Qin, W.; Yu, Y.; Jin, Y.; Wang, X.; Liu, J.; Xi, J.; Li, Z.; Li, H.; Zhao, G.; Hu, W.; et al. Genome-Wide Analysis Elucidates the Role of CONSTANS-like Genes in Stress Responses of Cotton. Int. J. Mol. Sci. 2018, 19, 2658. [Google Scholar] [CrossRef] [PubMed]
- Wong, A.C.S.; Hecht, V.F.G.; Picard, K.; Diwadkar, P.; Laurie, R.E.; Wen, J.; Mysore, K.; Macknight, R.C.; Weller, J.L. Isolation and Functional Analysis of CONSTANS-LIKE Genes Suggests That a Central Role for CONSTANS in Flowering Time Control Is Not Evolutionarily Conserved in Medicago Truncatula. Front. Plant Sci. 2014, 5, 486. [Google Scholar] [CrossRef] [PubMed]
- Battaglia, M.; Covarrubias, A.A. Late Embryogenesis Abundant (LEA) Proteins in Legumes. Front. Plant Sci. 2013, 4, 190. [Google Scholar] [CrossRef]
- Liu, H.; Xing, M.; Yang, W.; Mu, X.; Wang, X.; Lu, F.; Wang, Y.; Zhang, L. Genome-Wide Identification of and Functional Insights into the Late Embryogenesis Abundant (LEA) Gene Family in Bread Wheat (Triticum aestivum). Sci. Rep. 2019, 9, 13375. [Google Scholar] [CrossRef]
- Mertens, J.; Aliyu, H.; Cowan, D.A. LEA Proteins and the Evolution of the WHy Domain. Appl. Environ. Microbiol. 2018, 84, e00539-18. [Google Scholar] [CrossRef]
- Hu, C.; Lin, S.; Chi, W.; Charng, Y. Recent Gene Duplication and Subfunctionalization Produced a Mitochondrial GrpE, the Nucleotide Exchange Factor of the Hsp70 Complex, Specialized in Thermotolerance to Chronic Heat Stressin Arabidopsis. Plant Physiol. 2012, 158, 747–758. [Google Scholar] [CrossRef]
- Su, P.-H.; Lin, H.-Y.; Lai, Y.-H. Two Arabidopsis Chloroplast GrpE Homologues Exhibit Distinct Biological Activities and Can Form Homo- and Hetero-Oligomers. Front. Plant Sci. 2020, 10, 1719. [Google Scholar] [CrossRef]
- ElHabti, A.; Fleury, D.; Jewell, N.; Garnett, T.; Tricker, P.J. Tolerance of Combined Drought and Heat Stress Is Associated with ranspiration Maintenance and Water Soluble Carbohydrates in Wheat Grains. Front. PlantSci. 2020, 11, 568693. [Google Scholar] [CrossRef]
- Qaseem, M.F.; Qureshi, R.; Muqaddasi, Q.H.; Shaheen, H.; Kousar, R.; Röder, M.S. Genome-Wide Association Mapping in Bread Wheat Subjected to Independentand Combined High Temperature and Drought Stress. PLoS ONE 2018, 13, e0199121. [Google Scholar] [CrossRef] [Green Version]
- Verma, V.; Ravindran, P.; Kumar, P.P. Plant Hormone-Mediated Regulation of Stress Responses. BMC Plant Biol. 2016, 16, 86. [Google Scholar] [CrossRef] [PubMed]
- Miura, K.; Tada, Y. Regulation of Water, Salinity, and Cold Stress Responses by Salicylic Acid. Front. Plant Sci. 2014, 5, 4. [Google Scholar] [CrossRef] [PubMed]
- Sabagh, A.E.; Mbarki, S.; Hossain, A.; Iqbal, M.A.; Islam, M.S.; Raza, A.; Llanes, A.; Reginato, M.; Rahman, M.A.; Mahboob, W.; et al. Potential Role of Plant Growth Regulators in Administering Crucial Processes against Abiotic Stresses. Front. Agron. 2021, 3, 648694. [Google Scholar] [CrossRef]
- Li, N.; Euring, D.; Cha, J.Y.; Lin, Z.; Lu, M.; Huang, L.-J.; Kim, W.Y. Plant Hormone-Mediated Regulation of Heat Tolerance in Response to Global Climate Change. Front. PlantSci. 2021, 11, 627969. [Google Scholar] [CrossRef] [PubMed]
- Binder, B.M. Ethylene Signaling in Plants. J. Biol. Chem. 2020, 295, 7710–7725. [Google Scholar] [CrossRef]
- Müller, M. Foesor Friends: ABA and Ethylene Interactionunder Abiotic Stress. Plants 2021, 10, 448. [Google Scholar] [CrossRef]
- Khan, M.I.R.; Fatma, M.; Per, T.S.; Anjum, N.A.; Khan, N.A. Salicylic Acid-Induced Abiotic Stress Tolerance and Underlying Mechanisms in Plants. Front. Plant Sci. 2015, 6, 462. [Google Scholar] [CrossRef]
- Wani, S.H.; Kumar, V.; Shriram, V.; Sah, S.K. Phytohormones and Their Metabolic Engineering for Abiotic Stress Tolerance in Crop Plants. Crop J. 2016, 4, 162–176. [Google Scholar] [CrossRef]
- Qiu, Z.; Guo, J.; Zhu, A.; Zhang, L.; Zhang, M. Exogenous Jasmonic Acid Can Enhance Tolerance of Wheat Seedlings to Salt Stress. Ecotoxicol. Environ. Saf. 2014, 104, 202–208. [Google Scholar] [CrossRef]
- Su, Y.; Huang, Y.; Dong, X.; Wang, R.; Tang, M.; Cai, J.; Chen, J.; Zhang, X.; Nie, G. Exogenous Methyl Jasmonate Improves Heat Tolerance of Perennial Ryegrass through Alteration of Osmotic Adjustment, Antioxidant Defense, and Expression of Jasmonic Acid-Responsive Genes. Front. Plant Sci. 2021, 12, 664519. [Google Scholar] [CrossRef]
- Sharma, M.; Laxmi, A. Jasmonates: Emerging Players in Controlling Temperature Stress Tolerance. Front. Plant Sci. 2016, 6, 1129. [Google Scholar] [CrossRef] [PubMed]
- Lamaoui, M.; Jemo, M.; Datla, R.; Bekkaoui, F. Heat and Drought Stresses in Crops and Approaches for Their Mitigation. Front. Chem. 2018, 6, 26. [Google Scholar] [CrossRef] [PubMed]
- R Core Team. R: A Language and Environment for Statistical Computing; R Foundation for Statistical Computing: Vienna, Austria, 2017. [Google Scholar]
- QGIS Development Team. QGIS Las Palmas. Open Source Geospatial Foundation Project; QGIS: Austin, TX, USA, 2017. [Google Scholar]
- Balfourier, F.; Bouchet, S.; Robert, S.; DeOliveira, R.; Rimbert, H.; Kitt, J.; Choulet, F.; IWGSC; Breed Wheat, C.; Paux, E. Worldwide Phylogeography and History of Wheat Genetic Diversity. Sci. Adv. 2019, 11, eaav0536. [Google Scholar] [CrossRef] [PubMed]
- Hijmans, R.J. Raster: Geographic Data Analysis and Modeling; R Package Version: Vienna, Austria, 2022. [Google Scholar]
- Fick, S.E.; Hijmans, R.J. World Clim2: New1-km Spatial Resolution Climate Surfaces for Global Land Areas. Int. J. Climatol. 2017, 37, 4302–4315. [Google Scholar] [CrossRef]
- Chelsey, B.; Wheeler, N.R.; Rubel, F.; French, R.H. Kgc: Koeppen-Geiger Climatic Zones; R Package Version: Vienna, Austria, 2017. [Google Scholar]
- Kottek, M.; Grieser, J.; Beck, C.; Rudolf, B.; Rubel, F. World Map of the Köppen-Geiger Climate Classification Updated. Meteorol. Z. 2006, 15, 259–263. [Google Scholar] [CrossRef]
- Thornthwaite, C.W. An Approach toward a Rational Classification of Climate. Geogr. Rev. 1948, 38, 55. [Google Scholar] [CrossRef]
- Beguería, S.; Vicente-Serrano, S.M. SPEI: Calculation of the Standardised Precipitation—Evapotranspiration Index; R Core Team: Indianapolis, IN, USA, 2017. [Google Scholar]
- Alboukadel, K.; Mundt, F. Factoextra: Extract and Visualize the Results of Multivariate Data Analyses; R Package Version: Vienna, Austria, 2020. [Google Scholar]
- Frichot, E.; François, O. LEA: An R Package for Landscape and Ecological Association Studies. Methods Ecol. Evol. 2015, 6, 925–929. [Google Scholar] [CrossRef]
- Wang, J.; Zhang, Z. GAPIT Version3: Boosting Power and Accuracy for Genomic Association and Prediction. Genom. Proteom. Bioinform. 2021, 19, 629–640. [Google Scholar] [CrossRef]
- Liu, X.; Huang, M.; Fan, B.; Buckler, E.S.; Zhang, Z. Iterative Usage of Fixed and Random Effect Models for Powerful and Efficient Genome-Wide Association Studies. PLoS Genet. 2016, 12, e1005767. [Google Scholar] [CrossRef]
- LiLin, Y. CMplot: Circle Manhattan Plot; R Package Version: Vienna, Austria, 2022. [Google Scholar]
- IWGSC The International Wheat Genome Sequencing Consortium. Shifting the limits in wheat research and breeding using a fully annotated reference genome. Science 2018, 361, eaar7191. [Google Scholar] [CrossRef] [Green Version]
- Ouellette, L.A.; Reid, R.W.; Blanchard, S.G.; Brouwer, C.R. Linkage Map View-Rendering High-Resolution Linkage andQ TL Maps. Bionformatics 2018, 34, 306–307. [Google Scholar] [CrossRef] [PubMed] [Green Version]


| ||||||||||
| Variable | AMT | TS | MaxTWM | MeanTDQ | MeanTWQ | AP | PDM | PS | PDQ | PWQ |
| AMT | −0.65 | 0.79 | 0.71 | 0.77 | 0.07 | −0.03 | −0.08 | 0.01 | −0.4 | |
| TS | 0.000 | −0.14 | −0.76 | −0.03 | −0.13 | −0.3 | 0.53 | −0.35 | 0.56 | |
| MaxTWM | 0.000 | 0.000 | 0.5 | 0.94 | −0.17 | −0.38 | 0.21 | −0.38 | −0.34 | |
| MeanTDQ | 0.000 | 0.000 | 0.000 | 0.32 | −0.08 | −0.01 | −0.5 | 0.03 | −0.84 | |
| MeanTWQ | 0.000 | 0.374 | 0.000 | 0.000 | −0.02 | −0.29 | 0.33 | −0.29 | −0.09 | |
| AP | 0.023 | 0.000 | 0.000 | 0.009 | 0.552 | 0.41 | 0.01 | 0.44 | 0.38 | |
| PDM | 0.408 | 0.000 | 0.000 | 0.645 | 0.000 | 0.000 | −0.59 | 0.99 | 0.19 | |
| PS | 0.012 | 0.000 | 0.000 | 0.000 | 0.000 | 0.814 | 0.000 | −0.62 | 0.49 | |
| PDQ | 0.784 | 0.000 | 0.000 | 0.357 | 0.000 | 0.000 | 0.000 | 0.000 | 0.16 | |
| PWQ | 0.000 | 0.000 | 0.000 | 0.000 | 0.004 | 0.000 | 0.000 | 0.000 | 0.000 | |
| ||||||||||
| Variable | AMT | MaxT | HITmead | HITmax | AP | DI | ELEV | |||
| AMT | 0.98 | 0.92 | 0.93 | 0.07 | 0.42 | −0.16 | ||||
| MaxT | 0.000 | 0.92 | 0.96 | −0.02 | 0.49 | −0.14 | ||||
| HITmead | 0.000 | 0.000 | 0.97 | 0.06 | 0.45 | −0.38 | ||||
| HITmax | 0.000 | 0.000 | 0.000 | −0.05 | 0.53 | −0.27 | ||||
| AP | 0.023 | 0.602 | 0.042 | 0.117 | −0.83 | −0.13 | ||||
| DI | 0.000 | 0.000 | 0.000 | 0.000 | 0.000 | −0.11 | ||||
| ELEV | 0.000 | 0.000 | 0.000 | 0.000 | 0.000 | 0.000 | ||||
| Chr | Physical Position (bp) | SNP | Variables | Genes |
|---|---|---|---|---|
| 1A | 277825486 | 108825112|F|0-19:T>A-19:T>A | AMT, MaxT y HITmax | 1 |
| 1A | 388440316 | 108891114|F|0-33:A>G-33:A>G | AMT, MaxT, HITmead y HITmax | 1 |
| 1A | 588647447 | 108256081|F|0-24:C>G-24:C>G | AP | 1 |
| 1B | 201700273 | 108853213|F|0-26:C>T-26:C>T | HITmead | 1 |
| 1D | 2113561 | 108739422|F|0-31:T>A-31:T>A | AMT | 1 |
| 1D | 413939387 | 107880401|F|0-66:C>T-66:C>T | HITmead | 2 |
| 1D | 485539732 | 107874524|F|0-37:G>C-37:G>C | PS | 3 |
| 2A | 640221452 | 109058266|F|0-7:C>T-7:C>T | AP | 2 |
| 2A | 711971015 | 108020469|F|0-43:T>C-43:T>C | PS | 2 |
| 2A | 729345577 | 108514047|F|0-10:A>C-10:A>C | PS | 2 |
| 2B | 29129965 | 107488994|F|0-17:T>C-17:T>C | HITmead | 3 |
| 2B | 38321752 | 108024073|F|0-47:C>T-47:C>T | HITmax | 2 |
| 2B | 76022529 | 107794074|F|0-23:T>C-23:T>C | PS | 2 |
| 2B | 91596926 | 107797386|F|0-11:T>G-11:T>G | AP | 1 |
| 2B | 584134131 | 108980638|F|0-33:T>C-33:T>C | DI | 1 |
| 2B | 768567114 | 107593284|F|0-50:T>A-50:T>A | AP | 1 |
| 2B | 795754781 | 109021888|F|0-34:T>C-34:T>C | PS | 1 |
| 2D | 79989524 | 108968402|F|0-23:C>T-23:C>T | AMT | 2 |
| 2D | 302776397 | 107489027|F|0-34:C>T-34:C>T | DI | 1 |
| 3A | 502971897 | 106510612|F|0-30:C>T-30:C>T | MaxT | 2 |
| 3A | 507114154 | 108476623|F|0-32:T>A-32:T>A | MaxT y HITmax | 2 |
| 3A | 574516154 | 108028914|F|0-20:A>G-20:A>G | MaxT y HITmax | 2 |
| 3B | 50526285 | 108953425|F|0-21:A>G-21:A>G | PS | 1 |
| 3B | 535641207 | 109122135|F|0-40:A>G-40:A>G | HITmax | 1 |
| 3B | 741467423 | 107601308|F|0-23:G>A-23:G>A | PS | 0 |
| 3B | 758205945 | 108516380|F|0-24:T>C-24:T>C | PS | 1 |
| 3B | 764282419 | 108146856|F|0-65:T>A-65:T>A | HITmead | 1 |
| 3D | 97153088 | 107698139|F|0-48:C>T-48:C>T | AMT y HITmead | 1 |
| 3D | 546672913 | 108308207|F|0-18:G>A-18:G>A | AMT y HITmax | 2 |
| 3D | 575639014 | 109610030|F|0-20:C>T-20:C>T | HITmax | 2 |
| 4A | 598521397 | 109242168|F|0-13:A>G-13:A>G | HITmead y HITmax | 2 |
| 4A | 714179675 | 108145069|F|0-52:C>A-52:C>A | AP | 2 |
| 4B | 39759168 | 106772473|F|0-11:T>G-11:T>G | PS | 1 |
| 4B | 56276689 | 108145974|F|0-24:T>C-24:T>C | HITmead | 1 |
| 4D | 62303691 | 109363420|F|0-34:G>A-34:G>A | HITmead | 2 |
| 4D | 97959582 | 108773963|F|0-37:C>T-37:C>T | HITmead | 2 |
| 4D | 370691683 | 109431634|F|0-54:G>A-54:G>A | AMT, MaxT, HITmead y HITmax | 3 |
| 5A | 619468262 | 107001591|F|0-37:T>C-37:T>C | PS | 2 |
| 5B | 68925700 | 109240982|F|0-38:G>C-38:G>C | HITmead | 1 |
| 5B | 526249013 | 109305833|F|0-34:C>G-34:C>G | AP y DI | 1 |
| 5B | 530916378 | 108773279|F|0-51:C>T-51:C>T | HITmead | 2 |
| 5B | 548120559 | 108348543|F|0-58:A>G-58:A>G | PS | 1 |
| 5B | 577227418 | 109119258|F|0-68:T>C-68:T>C | PS | 2 |
| 5D | 379130055 | 108305241|F|0-68:A>G-68:A>G | AMT | 1 |
| 5D | 528660566 | 108652995|F|0-58:G>C-58:G>C | MaxT | 1 |
| 6A | 5854616 | 109126792|F|0-49:C>T-49:C>T | MaxT | 2 |
| 6B | 223441723 | 109177937|F|0-11:A>G-11:A>G | AP | 1 |
| 6B | 269818400 | 109523315|F|0-24:C>T-24:C>T | AP | 0 |
| 6B | 485290761 | 109354013|F|0-58:A>G-58:A>G | PS | 2 |
| 6D | 143959936 | 108582786|F|0-49:T>G-49:T>G | MaxT y HITmax | 2 |
| 7A | 64789408 | 108830300|F|0-9:T>G-9:T>G | MaxT | 2 |
| 7A | 67617920 | 108206445|F|0-49:C>A-49:C>A | DI | 1 |
| 7A | 498861613 | 107952026|F|0-63:G>C-63:G>C | DI | 1 |
| 7A | 552606647 | 108619258|F|0-17:C>T-17:C>T | PS | 1 |
| 7A | 628906923 | 107178221|F|0-24:T>G-24:T>G | HITmead | 2 |
| 7A | 662017143 | 109126469|F|0-35:G>A-35:G>A | MaxT | 2 |
| 7B | 107522176 | 107878167|F|0-16:G>A-16:G>A | MaxT | 2 |
| 7B | 650581291 | 108981313|F|0-8:C>T-8:C>T | PS | 1 |
| 7D | 88318125 | 109035950|F|0-29:C>T-29:C>T | DI | 1 |
| Total | 89 |
| Chr | SNP | Gene | Variable | Protein | Function |
|---|---|---|---|---|---|
| 1A | 108825112|F|0-19:T>A-19:T>A | TraesCS1A02G156600 | AMT, MaxT and HITmax | Auxin response factor (ARF) | Auxin-activated signaling. |
| 1D | 108739422|F|0-31:T>A-31:T>A | TraesCS1D02G003900 | AMT | Peroxisome membrane anchor (PEX14). | Transduction of stress signals by ROS. |
| 1D | 107880401|F|0-66:C>T-66:C>T | TraesCS1D02G319600 | HITmead | S-adenosyl-L-methionine-dependent methyltransferases (SAMe). | Methylation of DNA and proteins, ET biosynthesis, phenylpropanoid biosynthesis. |
| 1D | 107874524|F|0-37:G>C-37:G>C | TraesCS1D02G438700 | PS | Swi-Independent 3 (SIN3)-Like 1 (SNL1). | ABA and ET-activated signaling. |
| 2A | 108020469|F|0-43:T>C-43:T>C | TraesCS2A02G467400 | PS | Protein enhanced pseudomonas susceptibility 1 (EPS1). | SA biosynthesis and response to JA. |
| 2A | 108514047|F|0-10:A>C-10:A>C | TraesCS2A02G500200 | PS | Ser/Thr phosphatase (PstP). | Signaling in response to ABA. |
| 2B | 108024073|F|0-47:C>T-47:C>T | TraesCS2B02G071900 | HITmax | Ser/Thr kinase (STPK). | Signaling cascades. |
| 2B | 107794074|F|0-23:T>C-23:T>C | TraesCS2B02G112600 | PS | MYB108 TF (MYB). | Response to signaling by ABA and JA. |
| 2B | 107797386|F|0-11:T>G-11:T>G | TraesCS2B02G123900 | PS | Nonspecific Ser/Thr kinase (CIPK2). | Signaling cascades. |
| 2D | 107489027|F|0-34:C>T-34:C>T | TraesCS2D02G252400 | DI | Sugar/inositol transporter 2 (INT2). | Transduction of hormonal signals. |
| 3A | 106510612|F|0-30:C>T-30:C>T | TraesCS3A02G274000 | MaxT | Ser/Thr kinase (STPK). | Signaling cascades. |
| 3B | 109122135|F|0-40:A>G-40:A>G | TraesCS3B02G331800 | HITmax | Pentatricopeptide repeat (PPR). | Signaling in response to ABA. |
| 3B | 108516380|F|0-24:T>C-24:T>C | TraesCS3B02G516800 | PS | Mitochondrial ribosomal S4 (RPS4). | Proteins encoded in the mitochondrial genome exported to the cytoplasm. |
| 3D | 108308207|F|0-18:G>A-18:G>A | TraesCS3D02G433200 | AMT and HITmax | Similar to helix-loop-helix DNA (bHLH) | Signaling in response to auxin and cell wall modification. |
| 4A | 109242168|F|0-13:A>G-13:A>G | TraesCS4A02G301600 TraesCS4A02G302000 | HITmead and HITmax | 2-methyl-6-phytyl-1,4-hydroquinone methyltransferase (VTE3). Ser/Thr kinase (STPK). | Vitamin E biosynthesis and stress signaling. Signaling cascades. |
| 4D | 109363420|F|0-34:G>A-34:G>A | TraesCS4D02G087000 | HITmead | Ethylene-responsive TF (ERF022). | ET-activated signaling. |
| 4D | 109431634|F|0-54:G>A-54:G>A | TraesCS4D02G216300 TraesCS4D02G216600 | AMT, MaxT, HITmead and HITmax | Ethylene-responsive TF (ERF014). Ser/Thr kinase (STPK). | ET-activated signaling. Signaling cascades. |
| 5B | 108348543|F|0-58:A>G-58:A>G | TraesCS5B02G369300 | PS | Metallophone domain (MPE). | GPI biosynthesis the cell membrane. |
| 7A | 107952026|F|0-63:G>C-63:G>C | TraesCS7A02G340300 | DI | Basic helix-loop-helix (bHLH). | Signaling in response to auxin and cell wall modification. |
| 7A | 108619258|F|0-17:C>T-17:C>T | TraesCS7A02G377500 | PS | EIN3-binding F-box 1 (EBF1). | ET-activated signaling. |
| 7A | 107178221|F|0-24:T>G-24:T>G | TraesCS7A02G435700 | HITmead | IAA-amino acid hydrolase (ILL). | Auxin metabolic process. |
| 7A | 109126469|F|0-35:G>A-35:G>A | TraesCS7A02G465400 TraesCS7A02G465500 | MaxT | Kinase (Kinase). Glycine-rich domain 2 (GRDP2). | Signaling cascades. Auxin-activated signaling. |
| 7B | 108981313|F|0-8:C>T-8:C>T | TraesCS7B02G385700 | PS | HTH myb-type domain (MYB). | Response to signaling by ABA and JA. |
| Chr | SNP | Gene | Variable | Protein | Function |
|---|---|---|---|---|---|
| 1A | 108256081|F|0-24:C>G-24:C>G | TraesCS1A02G439300 | AP | ArfGAP domain 2G (ArfGAP). | Membrane trafficking. |
| 1D | 107874524|F|0-37:G>C-37:G>C | TraesCS1D02G439900 | PS | RING-CH-type domain/E3 ubiquitin ligase (MARCH). | Protein degradation by the ubiquitin pathway with abnormalities. |
| 2B | 107488994|F|0-17:T>C-17:T>C | TraesCS2B02G059400 | HITmead | Wall-associated kinase (WAK). | Regulation of wall functions and signaling of extracellular environment. |
| 2B | 108024073|F|0-47:C>T-47:C>T | TraesCS2B02G071600 | HITmax | Acyl-CoA--sterol O-acyltransferase (ASAT1). | Synthesis of long-chain esters (waxes). |
| 2B | 109021888|F|0-34:T>C-34:T>C | TraesCS2B02G621600 | PS | C2 calcium/lipid-phosphoribosyltransferase (QKY). | Signal transduction or calcium-dependent membrane trafficking. |
| 2D | 108968402|F|0-23:C>T-23:C>T | TraesCS2D02G136300 | AMT | Glycosyltransferase STELLO2 (STL2). | Cell wall cellulose biosynthesis. |
| 3A | 106510612|F|0-30:C>T-30:C>T | TraesCS3A02G274200 | MaxT | Mannan endo-1,4-beta-mannosidase 2 (MAN2). | Lignocellulose component in primary cell walls. |
| 3A | 108476623|F|0-32:T>A-32:T>A | TraesCS3A02G277100 | MaxT and HITmax | Glucan endo-1,3-beta-glucosidase 13 (1,3-β-glucanasa). | Defense against pathogens, cell wall biogenesis and reorganization. |
| 3D | 107698139|F|0-48:C>T-48:C>T | TraesCS3D02G138700 | AMT and HITmead | O-methyltransferase (OMT). | Lignin biosynthesis. |
| 3D | 108308207|F|0-18:G>A-18:G>A | TraesCS3D02G433400 | AMT and HITmax | Glycosyltransferase (GT). | Biosynthesis polysaccharides of cell walls: cellulose, hemicellulose, and pectin. |
| 3D | 109610030|F|0-20:C>T-20:C>T | TraesCS3D02G474800 | HITmax | Putative expansin-B2 (EXPB2). | Loosening of plant cell walls. |
| 5B | 109240982|F|0-38:G>C-38:G>C | TraesCS5B02G061500 | HITmead | Root hair defective 3 (RDH2). | Biogenesis of the cell wall and organization of the cytoskeleton. |
| 5D | 108305241|F|0-68:A>G-68:A>G | TraesCS5D02G276400 | AMT | Cinnamoyl-CoA reductase 4 (CCR). | Primary alcohols and leaf cuticular wax synthesis. |
| 7A | 108830300|F|0-9:T>G-9:T>G | TraesCS7A02G107500 | MaxT | 3-ketoacyl-CoA synthase (KCS). | Synthesis of long-chain esters (waxes). |
| 7B | 107878167|F|0-16:G>A-16:G>A | TraesCS7B02G093900 | MaxT | Glyco_trans_2-like (GT2). | Cell wall organization. |
| Chr | SNP | Gene | Variable | Protein | Function |
|---|---|---|---|---|---|
| 1B | 108853213|F|0-26:C>T-26:C>T | TraesCS1B02G146100 | HITmead | 40S ribosomal S7 (RPS7). | Response to environmental signals. |
| 1D | 107880401|F|0-66:C>T-66:C>T | TraesCS1D02G319400 | HITmead | Heat shock protein class VI (HSP20). | Heat and salt tolerance. |
| 1D | 107874524|F|0-37:G>C-37:G>C | TraesCS1D02G439800 | PS | Trimethylguanosine synthase (TGS). | Cold tolerance. |
| 2B | 107794074|F|0-23:T>C-23:T>C | TraesCS2B02G112800 | PS | Galactinol synthase 7 (GolS). | Tolerance to drought, salinity, and cold. |
| 2B | 107593284|F|0-50:T>A-50:T>A | TraesCS2B02G581100 | AP | Leucine-Rich Repeat Kinase (LRRK1). | Tolerance to drought. |
| 3A | 108476623|F|0-32:T>A-32:T>A | TraesCS3A02G276800 | MaxT and HITmax | Glutamate carboxypeptidase (AMP1). | Responses to oxidative stress. |
| 4A | 108145069|F|0-52:C>A-52:C>A | TraesCS4A02G446900 | AP | Cytochrome P450 709B3 (CYP450). | Biosynthesis of secondary metabolites and phytohormones in response to stress. |
| 4D | 108773963|F|0-37:C>T-37:C>T | TraesCS4D02G117200 | HITmead | Peroxidase (POD). | Response to oxidative stress. |
| 4D | 109431634|F|0-54:G>A-54:G>A | TraesCS4D02G216700 | AMT, MaxT, HITmead and HITmax | Late embryogenesis abundant (LEA). | Osmotic stress. |
| 5A | 107001591|F|0-37:T>C-37:T>C | TraesCS5A02G437900 | PS | Heat shock factor (HSF). | Heat shock proteins. |
| 5B | 109305833|F|0-34:C>G-34:C>G | TraesCS5B02G341100 | AP and DI | GrpE protein homolog (GrpE). | Thermotolerance to chronic heat stress. |
| 5B | 108773279|F|0-51:C>T-51:C>T | TraesCS5B02G350000 | HITmead | BURP domain (BURP). | Responses to drought stress by ABA. |
| 5B | 109119258|F|0-68:T>C-68:T>C | TraesCS5B02G399900 | PS | Probable WRKY TF 57 (WRKY). | Response to osmotic stress, salt, and drought. |
| 5D | 108652995|F|0-58:G>C-58:G>C | TraesCS5D02G498900 | MaxT | DNA-directed RNA polymerase subunit (NRPB1). | Response to heat stress. |
| 6A | 108582786|F|0-49:T>G-49:T>G | TraesCS6A02G012100 TraesCS6A02G013100 | MaxT | Cytochrome P450 709B1 (CYP450). Leucine-rich repeat receptor-like kinase (LRRK2). | Biosynthesis of secondary metabolites and phytohormones in response to stress. Tolerance to drought. |
| 6B | 109354013|F|0-58:A>G-58:A>G | TraesCS6B02G269500 | PS | Cytochrome P450 (CYP450). | Biosynthesis of secondary metabolites and phytohormones in response to stress. |
| 6D | 108582786|F|0-49:T>G-49:T>G | TraesCS6D02G164900 TraesCS6D02G165100 | MaxT and HITmax | Adenine nucleotide alpha hydrolases (ANAH). Cytochrome P450 (CYP450). | Response to salt stress. Biosynthesis of secondary metabolites and phytohormones in response to stress. |
| 7A | 108206445|F|0-49:C>A-49:C>A | TraesCS7A02G110500 | DI | F-box component of the SKP-Cullin-F-box E3 (SCF). | Water deficit. |
| 7A | 107178221|F|0-24:T>G-24:T>G | TraesCS7A02G435300 | HITmead | Leucine-rich repeat receptor-like kinase (LRRK3). | Tolerance to drought. |
| Country Code | Country | Region | Region Code | Total Landraces |
|---|---|---|---|---|
| AFG | Afghanistan | Southern Asia | SAS | 51 |
| ARM | Armenia | Western Asia | WAS | 7 |
| AUS | Australia | Australia and New Zealand | AUS | 1 |
| AUT | Austria | Western Europe | WEU | 1 |
| AZE | Azerbaijan | Western Asia | WAS | 5 |
| CAN | Canada | Northern America | NAM | 1 |
| CHN | China | Eastern Asia | EAS | 275 |
| DEU | Germany | Western Europe | WEU | 1 |
| DZA | Algeria | Northern Africa | NAF | 1 |
| ESP | Spain | Southern Europe | SEU | 3 |
| ETH | Ethiopia | Eastern Africa | EAF | 4 |
| GEO | Georgia | Western Asia | WAS | 10 |
| GRC | Greece | Southern Europe | SEU | 1 |
| IND | India | Southern Asia | SAS | 17 |
| IRN | Iran | Southern Asia | SAS | 34 |
| ESP | Spain | Southern Europe | SEU | 3 |
| ETH | Ethiopia | Eastern Africa | EAF | 4 |
| GEO | Georgia | Western Asia | WAS | 10 |
| GRC | Greece | Southern Europe | SEU | 1 |
| IND | India | Southern Asia | SAS | 17 |
| IRN | Iran | Southern Asia | SAS | 34 |
| IRQ | Iraq | Western Asia | WAS | 8 |
| ITA | Italy | Southern Europe | SEU | 1 |
| JPN | Japan | Eastern Asia | EAS | 1 |
| LBN | Lebanon | Western Asia | WAS | 1 |
| MEX | Mexico | Central America | CAM | 9 |
| PAK | Pakistan | Southern Asia | SAS | 1 |
| PER | Peru | South America | SAM | 1 |
| POL | Poland | Eastern Europe | EEU | 1 |
| PRT | Portugal | Southern Europe | SEU | 8 |
| RUS | Russia | Eastern Europe | EEU | 2 |
| SRB | Serbia | Southern Europe | SEU | 1 |
| SYR | Syria | Western Asia | WAS | 3 |
| TJK | Tajikistan | Central Asia | CAS | 42 |
| TUN | Tunisia | Northern Africa | NAF | 2 |
| TUR | Turkey | Western Asia | WAS | 490 |
| USA | United States | Northern America | NAM | 4 |
| UZB | Uzbekistan | Central Asia | CAS | 2 |
| VEN | Venezuela | South America | SAM | 1 |
| Abbreviation | Variable Description and Unit |
|---|---|
| ELEV | Altitude, meters. |
| MaxT | Maximum temperature, °C × 10. |
| AMT | Annual mean temperature, °C × 10. |
| TS | Temperature seasonality, standard deviation × 100. |
| MaxTWM | Maximum temperature of warmest month, °C × 10. |
| MeanTDQ | Mean temperature of driest quarter, °C × 10. |
| MeanTWQ | Mean temperature of warmest quarter, °C × 10. |
| AP | Annual precipitation, mm. |
| PDM | Precipitation of driest month, mm. |
| PS | Precipitation seasonality, mm. |
| PDQ | Precipitation of driest quarter, mm. |
| PWQ | Precipitation of warmest quarter, mm. |
| Group | Climates |
|---|---|
| A—Tropical | Tropical rainforest (Af), Tropical monsoon (Am), and Tropical savanna (Aw, As). |
| B—Dry | Desert (BWh, BWk) and Semi-arid (BSh, BSk). |
| C—Temperate | Humid subtropical (Cfa, Cwa); Oceanic (Cfb, Cwb, Cfc, Cwc); and Mediterranean (Csa, Csb, Csc). |
| D—Continental | Humid continental (Dfa, Dwa, Dfb, Dwb, Dsa, Dsb) and Subarctic (Dfc, Dwc, Dfd, Dwd, Dsc, Dsd). |
| E—Polar | Tundra (ET), Ice cap (EF), and Alpine (ET, EF). |
Publisher’s Note: MDPI stays neutral with regard to jurisdictional claims in published maps and institutional affiliations. |
© 2022 by the authors. Licensee MDPI, Basel, Switzerland. This article is an open access article distributed under the terms and conditions of the Creative Commons Attribution (CC BY) license (https://creativecommons.org/licenses/by/4.0/).
Share and Cite
Gómez-Espejo, A.L.; Sansaloni, C.P.; Burgueño, J.; Toledo, F.H.; Benavides-Mendoza, A.; Reyes-Valdés, M.H. Worldwide Selection Footprints for Drought and Heat in Bread Wheat (Triticum aestivum L.). Plants 2022, 11, 2289. https://doi.org/10.3390/plants11172289
Gómez-Espejo AL, Sansaloni CP, Burgueño J, Toledo FH, Benavides-Mendoza A, Reyes-Valdés MH. Worldwide Selection Footprints for Drought and Heat in Bread Wheat (Triticum aestivum L.). Plants. 2022; 11(17):2289. https://doi.org/10.3390/plants11172289
Chicago/Turabian StyleGómez-Espejo, Ana L., Carolina Paola Sansaloni, Juan Burgueño, Fernando H. Toledo, Adalberto Benavides-Mendoza, and M. Humberto Reyes-Valdés. 2022. "Worldwide Selection Footprints for Drought and Heat in Bread Wheat (Triticum aestivum L.)" Plants 11, no. 17: 2289. https://doi.org/10.3390/plants11172289