Article

Examining Hotspots of Traffic Collisions and their Spatial Relationships with Land Use: A GIS-Based Geographically Weighted Regression Approach for Dammam, Saudi Arabia

by
Muhammad Tauhidur Rahman
1,
Arshad Jamal
2,* and
Hassan M. Al-Ahmadi
2
1
Department of City and Regional Planning, King Fahd University of Petroleum & Minerals, KFUPM Box 5053, Dhahran 31261, Saudi Arabia
2
Department of Civil and Environmental Engineering, King Fahd University of Petroleum & Minerals, KFUPM Box 5055, Dhahran 31261, Saudi Arabia
*
Author to whom correspondence should be addressed.
ISPRS Int. J. Geo-Inf. 2020, 9(9), 540; https://doi.org/10.3390/ijgi9090540
Submission received: 21 July 2020 / Revised: 28 August 2020 / Accepted: 3 September 2020 / Published: 8 September 2020
(This article belongs to the Special Issue Using GIS to Improve (Public) Safety and Security)

Abstract

:
Examining the relationships between vehicle crash patterns and urban land use is fundamental to improving crash predictions, creating guidance, and comprehensive policy recommendations to avoid crash occurrences and mitigate their severities. In the existing literature, statistical models are frequently used to quantify the association between crash outcomes and available explanatory variables. However, they are unable to capture the latent spatial heterogeneity accurately. Further, the vast majority of previous studies have focused on detailed spatial analysis of crashes from an aggregated viewpoint without considering the attributes of the built environment and land use. This study first uses geographic information systems (GIS) to examine crash hotspots based on two severity groups, seven prevailing crash causes, and three predominant crash types in the City of Dammam, Kingdom of Saudi Arabia (KSA). GIS-based geographically weighted regression (GWR) analysis technique was then utilized to uncover the spatial relationships of traffic collisions with population densities and relate it to the land use of each neighborhood. Results showed that Fatal and Injury (FI) crashes were mostly located in residential neighborhoods and near public facilities having low to medium population densities on highways with relatively higher speed limits. Distribution of hotspots and GWR-based analysis for crash causes showed that crashes due to “sudden lane deviation” accounted for the highest proportion of crashes that were concentrated mainly in the Central Business District (CBD) of the study area. Similarly, hotspots and GWR analysis for crash types revealed that “collisions between motor vehicles” constitute a significant proportion of the total crashes, with epicenters mostly stationed in high-density residential neighborhoods. The outcomes of this study could provide analysts and practitioners with crucial insights to understand the complex inter-relationships between traffic safety and land use. It can provide useful guidance to policymakers for better planning and effective management strategies to enhance safety at zonal levels.

1. Introduction

1.1. Road Safety in Kingdom of Saudi Arabia

Road traffic collisions pose a critical public health concern worldwide. It is estimated that over 1.3 million peoples are killed, and 50 million others are injured due to traffic crashes every year [1]. The social and economic consequences of road traffic crashes (RTCs) are enormous, annually costing around 518 billion USD globally [1,2]. Residents of developing countries like the Kingdom of Saudi Arabia (KSA) are more vulnerable to traffic fatalities and injuries [3]. After exploring and exporting crude oil since 1938, Saudi Arabia has experienced rapid economic growth resulting in urban expansion and motorization over the past four decades. Due to such expansions, KSA is facing serious road safety issues. World Health Organization (WHO) Global Status Report on Road Safety reported that the annual fatality rate per 100,000 people due to RTCs in the KSA has increased from 17.4 to 27.4 since the last decade. Such an increasing fatality rate is the worst among the countries in the region and is significantly above the fatality rates for other G-20 nations [1]. A study conducted by Turki et al. suggests that, on average, more than 19 individuals lose their lives daily, and approximately four persons are injured every hour due to RTCs on KSA roads [3]. The cost of traffic crashes in KSA is estimated to be 5.6 billion dollars per year and accounts for approximately 4.3% of the KSA’s Gross Domestic Product (GDP) [4]. A recent study conducted in the Eastern Province in KSA reported that driver distractions, overspeeding, non-compliance with traffic control devices and regulations are a few of the dominant causes for traffic crashes in the region [5].

1.2. Definition of Crash Hotspots

To reduce the burden of traffic crashes, it is critical to examine the time and locations of crashes where they occur more frequently. Hotspot identification (HSID) is a vital task for road traffic safety programs. Locations that have clusters of high concentrations of crashes are commonly known as crash-prone locations or hotspots. The number of crashes occurring at any specific site or road segment during a certain period of time is a non-negative integer and probabilistic in nature [6,7]. Even though traffic crashes are unpredictable at the micro-level and random by nature, statistical models can yield reliable estimations of expected crash frequencies as a function of explanatory variables such as traffic flow, site characteristics, and road geometry data at the macro-level [8,9]. In previous studies, numerous empirical relationships between such predictor variables and vehicle crashes have been established [10,11,12]. Such crash prediction models are useful in determining the critical risk factors, evaluating design and management alternatives, and improving the safety for road users [13,14].

1.3. Existing Methods for Crash Hotspots Identification

Crash HSID methods are frequently studied under two main categories: observed crash frequency and expected crash frequency [15,16]. The methods based on the crash frequency or crash rate is calculated as the number of crashes per vehicle-kilometer for road segments or per vehicle-entering at road junctions. However, methods solely based on observed crash frequency are considered inefficient, since crashes are random events that are likely to change both spatially and temporally. This randomness of crash occurrences can be attributed to several factors, including the conditions of the drivers, vehicles, roadways, traffic, and the physical environment. Given the limitations of methods based on crash frequency, the methods based on expected frequency are gaining rapid attention, whereby expected measures for HSID are estimated by different statistical models, including basic Poisson models, Negative Binomial models, and Empirical Bayesian methods [17]. It is believed that methods based on expected crash frequency will more accurately reflect the expected risk levels at specific locations during a given time period [18].
Numerous methods have been suggested for HSID of traffic crashes in recent years [16,19,20,21]. Each method has its own characteristics, benefits, and shortcomings, making each suitable for HSID under specific conditions. The most commonly used methods for HSID for traffic crashes include the kernel density estimation method (KDE) [22,23], local indicators of spatial association (LISA) method [24], and the nearest neighborhood hierarchical (NNH) clustering method [25]. KDE is a non-parametric technique frequently adopted to estimate the probability density function of a random variable [26]. To measure local crash risk, each spatial unit is assigned a local density estimate (LDE) where spatial units exceeding a certain given LDE threshold are labeled as hazardous. If a group of neighboring spatial units shares the LDE higher than that certain threshold, the road segment and surrounding junctions can be identified as a hotspot [27]. Similarly, with the LISA approach, each spatial unit is allocated a LISA index. This index evaluates the spatial association for observed crashes at adjacent units. Higher LISA index would indicate an increased spatial concentration of crashes and vice-versa. Finally, the NNH is a hierarchical clustering technique that clusters the spatially distributed points together based on predefined criteria [28]. Clustering is repeated until all the points within the threshold distance are grouped into single cluster (referred to as hotspot), or the clustering criteria fails.
Empirical Bayes (EB) and full Bayesian (FB) are other approaches and techniques that are increasingly being used for HSID [20,29]. The EB method accounts for both historical and expected crash trends to yield the crash estimates for similar sites. It also accounts for the regression-to-mean phenomenon. Unlike other conventional HSID methods, previous studies suggest that the EB method is more reliable and accurate for HSID [30,31]. Regression-to-the-mean (RTM) implies the short-term fluctuations in crash frequencies around the average/expected crash frequency over a particular period. When a period with a comparatively high crash frequency is observed, it is statistically probable that the following period will have a comparatively low crash frequency (even in the absence of no countermeasures). This tendency also applies to the high probability that a low crash frequency period will be followed by a high crash frequency period. On the other hand, the FB HSID method uses a probability function (as Poisson-lognormal distribution) for crash frequency and caters to the area-specific myriad of risk factors as safety performance functions (SPFs) [17,32].

1.4. Relationship between Land Use and Crash Hotspots

Identifying crash clusters or hotspots provide key insights to safety specialists for a better understanding of crash patterns and management of road safety. Understanding the role of the built environment and urban land use is an essential problem in road safety studies. The relationship between land use and traffic crashes is apparent since different land use tends to attract and generate different types of trips [33]. Trip making behavior is a crucial predictor variable for determining the nature and volume of traffic. Although several previous studies have reported that traffic violations and crashes are closely related to characteristics of drivers and travel behavior [34,35,36,37], yet it is rational to assume that they are likely to increase as the land use intensifies. Earlier studies have proposed different methods to explore spatio-temporal variations of crashes [15,18]. Only a few have investigated the influence of land use on the crash patterns [33,38]. Further, conventional studies have primarily focused on determining crash hotspots based on aggregated crash frequencies, thus ignoring the significance of individual crash characteristics and contributing factors. However, it is well established that “not all crashes are equal,” making it inevitable to identify hotspots for different crash attributes.
A number of previous studies reported that that urban zones with low densities such as rural and residential areas have high injury severities when compared to those with high densities such as commercial and congested residential areas [39,40]. A study conducted by Xie et al. used generalized structural equation modeling (GSEM) to assess the effect of land-use conversion on severe crashes (SC) [41]. The study results showed that urban residential, business and commercial, and mixed residential-commercial land uses had the highest risk of exposure to SC. Pulugurtha et al. utilized a negative binomial model to explore the impact of land use characteristics on zonal risk estimation and found that urban residential land use and mixed areas were highly correlated with crash frequencies [42]. In another study, the applicability of the empirical Bayes (EB) method was examined for the association between land use traffic collisions in three districts of Hong Kong [43]. It was concluded that commercial areas were more hazardous based on average crash counts and as well as injury severity. Chen et al. also investigated the effect of the built environment on pedestrian crashes [44]. The authors noted that they are inversely related with (i) high densities of sidewalks, (ii) high proportions of steep gradients, (iii) high proportions of industrial land use and employment, (iv) areas with lower average speed limits, and (v) lower number of bus stops. Thisstudy further demonstrated that local characteristics such as land use and urban population densities do have noticeable effects on traffic crashes. A better understanding of the relationship between vehicle crashes and land use is fundamental in improving crash prediction and providing sound policy recommendations that could reduce the number of crash occurrences as well as their severities.

1.5. Previous Studies for HSID Using GIS

Recently, geographic information systems technologies (GIST) have drawn widespread attention for the identification of crash hotspots. The GIS-based HSID process uses several methods and techniques, such as the traditional kernel density estimations, nearest neighbor analysis, and K-functions. A recent study examined the performance of four clustering methods in a GIS platform to observe crash patterns in the complex urban networks of Mashhad city, Iran [45]. The results revealed that crashes in the study area were more clustered in certain parts of the city. Additionally, in Iran, Shariat et al. adopted a GIS-based network kernel density estimation (NKDE) approach for detecting high-risk crash locations in the Markazi province [46]. They used Moran’s I spatial autocorrelation coefficient to determine whether crashes were clustered together or not. Similarly, Ulak et al. compared the performance of Local Moran’s I, Getis-Ord Gi*, KLINCS, and KLINCS-IC to gain better insights in the identification of hotspots in the eastern US state of Florida [47]. Alternative spatial weights (such as distance, free-flow travel time, and congested travel time) based sensitivity analysis were undertaken to examine the influence of bandwidths on the identified hotspots. Local Moran’s I considering the weight distance, achieved the highest prediction accuracy followed by KLINCS-IC with free-flow weight travel time. Bíl et al. used KDE based clustering methods for spatiotemporal analysis of crash hotspots using nine years (2010–2018) crash data from Czech Republic [48]. The authors classified the hotspots based on three attributes, i.e., hotspot emergence, their stability, and disappearance. It was noted that only 100 hotspots were stable over the entire period.
Dereli and Erdogan also used GIS-aided spatial statistical methods (Poisson regression, empirical Bayesian, negative binomial regression) for determining crash hotspots [49]. Nine years of crash data (2005–2013) for 2408 state roads in Turkey were collected. Out of the 32,107 sub-segments, 126 were classified as hotspots. In another study, Yalcin and Duzgun employed GIS for the identification of hotspots for two-wheeled vehicles [50]. Three methods of spatial crash pattern analysis (nearest neighbor distance, kernel density, and the K-function) on road networks were used to find crashes clustered along the main transportation routes in the study area. Yuan et al. proposed a novel Firefly Clustering Algorithm coupled with GIS for accurate identification of crash hotspots in the urban areas of Licheng district, situated in the east of Jian, China [51]. Results showed that Euclidean distance-based search method could easily overestimate the number of hotspots, especially near the urban road intersections, while the proposed method is more robust under different scenarios. Butt et al. also utilized GIS-based geo-statistical surveillance for the identification of crash hotspots in the district of Rawalpindi, Pakistan [52]. They found that high-risk sites were located in both commercial and residential areas near hospitals schools, public transit services, and airports. Le and Lin investigated the significance of GIS-based statistical analytic techniques for spatio-temporal variation of crash severity index (SI) in Hanoi, Vietnam [53]. During the first phase of the study, the KDE method was utilized to analyze hotspots according to different time intervals (daytime, night-time, peak/off-peak periods) and seasons. The results were then presented using co-map technique. Results showed that both methods provided relatively similar hotpot locations, but due to the integration of SI, a ranking of some hotspots was different from others. The authors included SI in crash hotspot analysis for precise determination and ranking of hotspots locations.
Recently, few studies have used geographically weighted regression (GWR) for analysis of traffic crashes. Zheng et al. examined the spatial variation of factors contributing to crash harm using GWR in southeastern Virginia [54]. The map of coefficients with GWR showed detailed insights where certain factors are associated with higher crash harm. In another study, Soroori et al. utilized geographically weighted Poisson and negative binomial regression (GWPR and GWNBR) to model the relationship between crash injury frequency and transportation macro-level variables such as transport infrastructures, traffic characteristics, driver socio-economic factors, and land use attributes [55]. Results showed that proposed methods are more robust than GWR by capturing the variable’s spatial heterogeneity more accurately. Zhibin, in their study, also showed that GWPR was useful in capturing the spatially non-stationary relationships between predictor variables at the county level [56]. Similarly, Li et al. compared the performance of the GWR calibrated statistical models with other models calibrated using the ordinary least squares (OLS) technique for predicting crashes on 245 intersections in Chicago [57]. The authors used crash data collected from 2008 to 2010 and performed analysis of variance tests that revealed that models calibrated with GWR achieved improved crash predictability. Another study conducted in Flanders, Belgium, also demonstrated that GWPR outperforms their corresponding generalized linear models (GLMs) in capturing the spatial heterogeneity of fatal and injury crashes [58]. Li et al. employed GIS-based Bayesian approach for analyzing spatio-temporal patterns of motor vehicle crashes in Texas and found that the proposed method is promising in identifying the relative crash risks [59]. Huang et al. also examined the relationship of built-environment and land use with urban traffic crashes through the application of GWR analysis [60]. Their study showed that variables such as intersection density, percentage of local road mileage, and percentage of commercial land use have a stable relationship with traffic crashes. Ye et al. also reported that urban population density and the presence of subway stations are directly related to the occurrence of traffic crashes [61].

1.6. Contributions of the Current Study
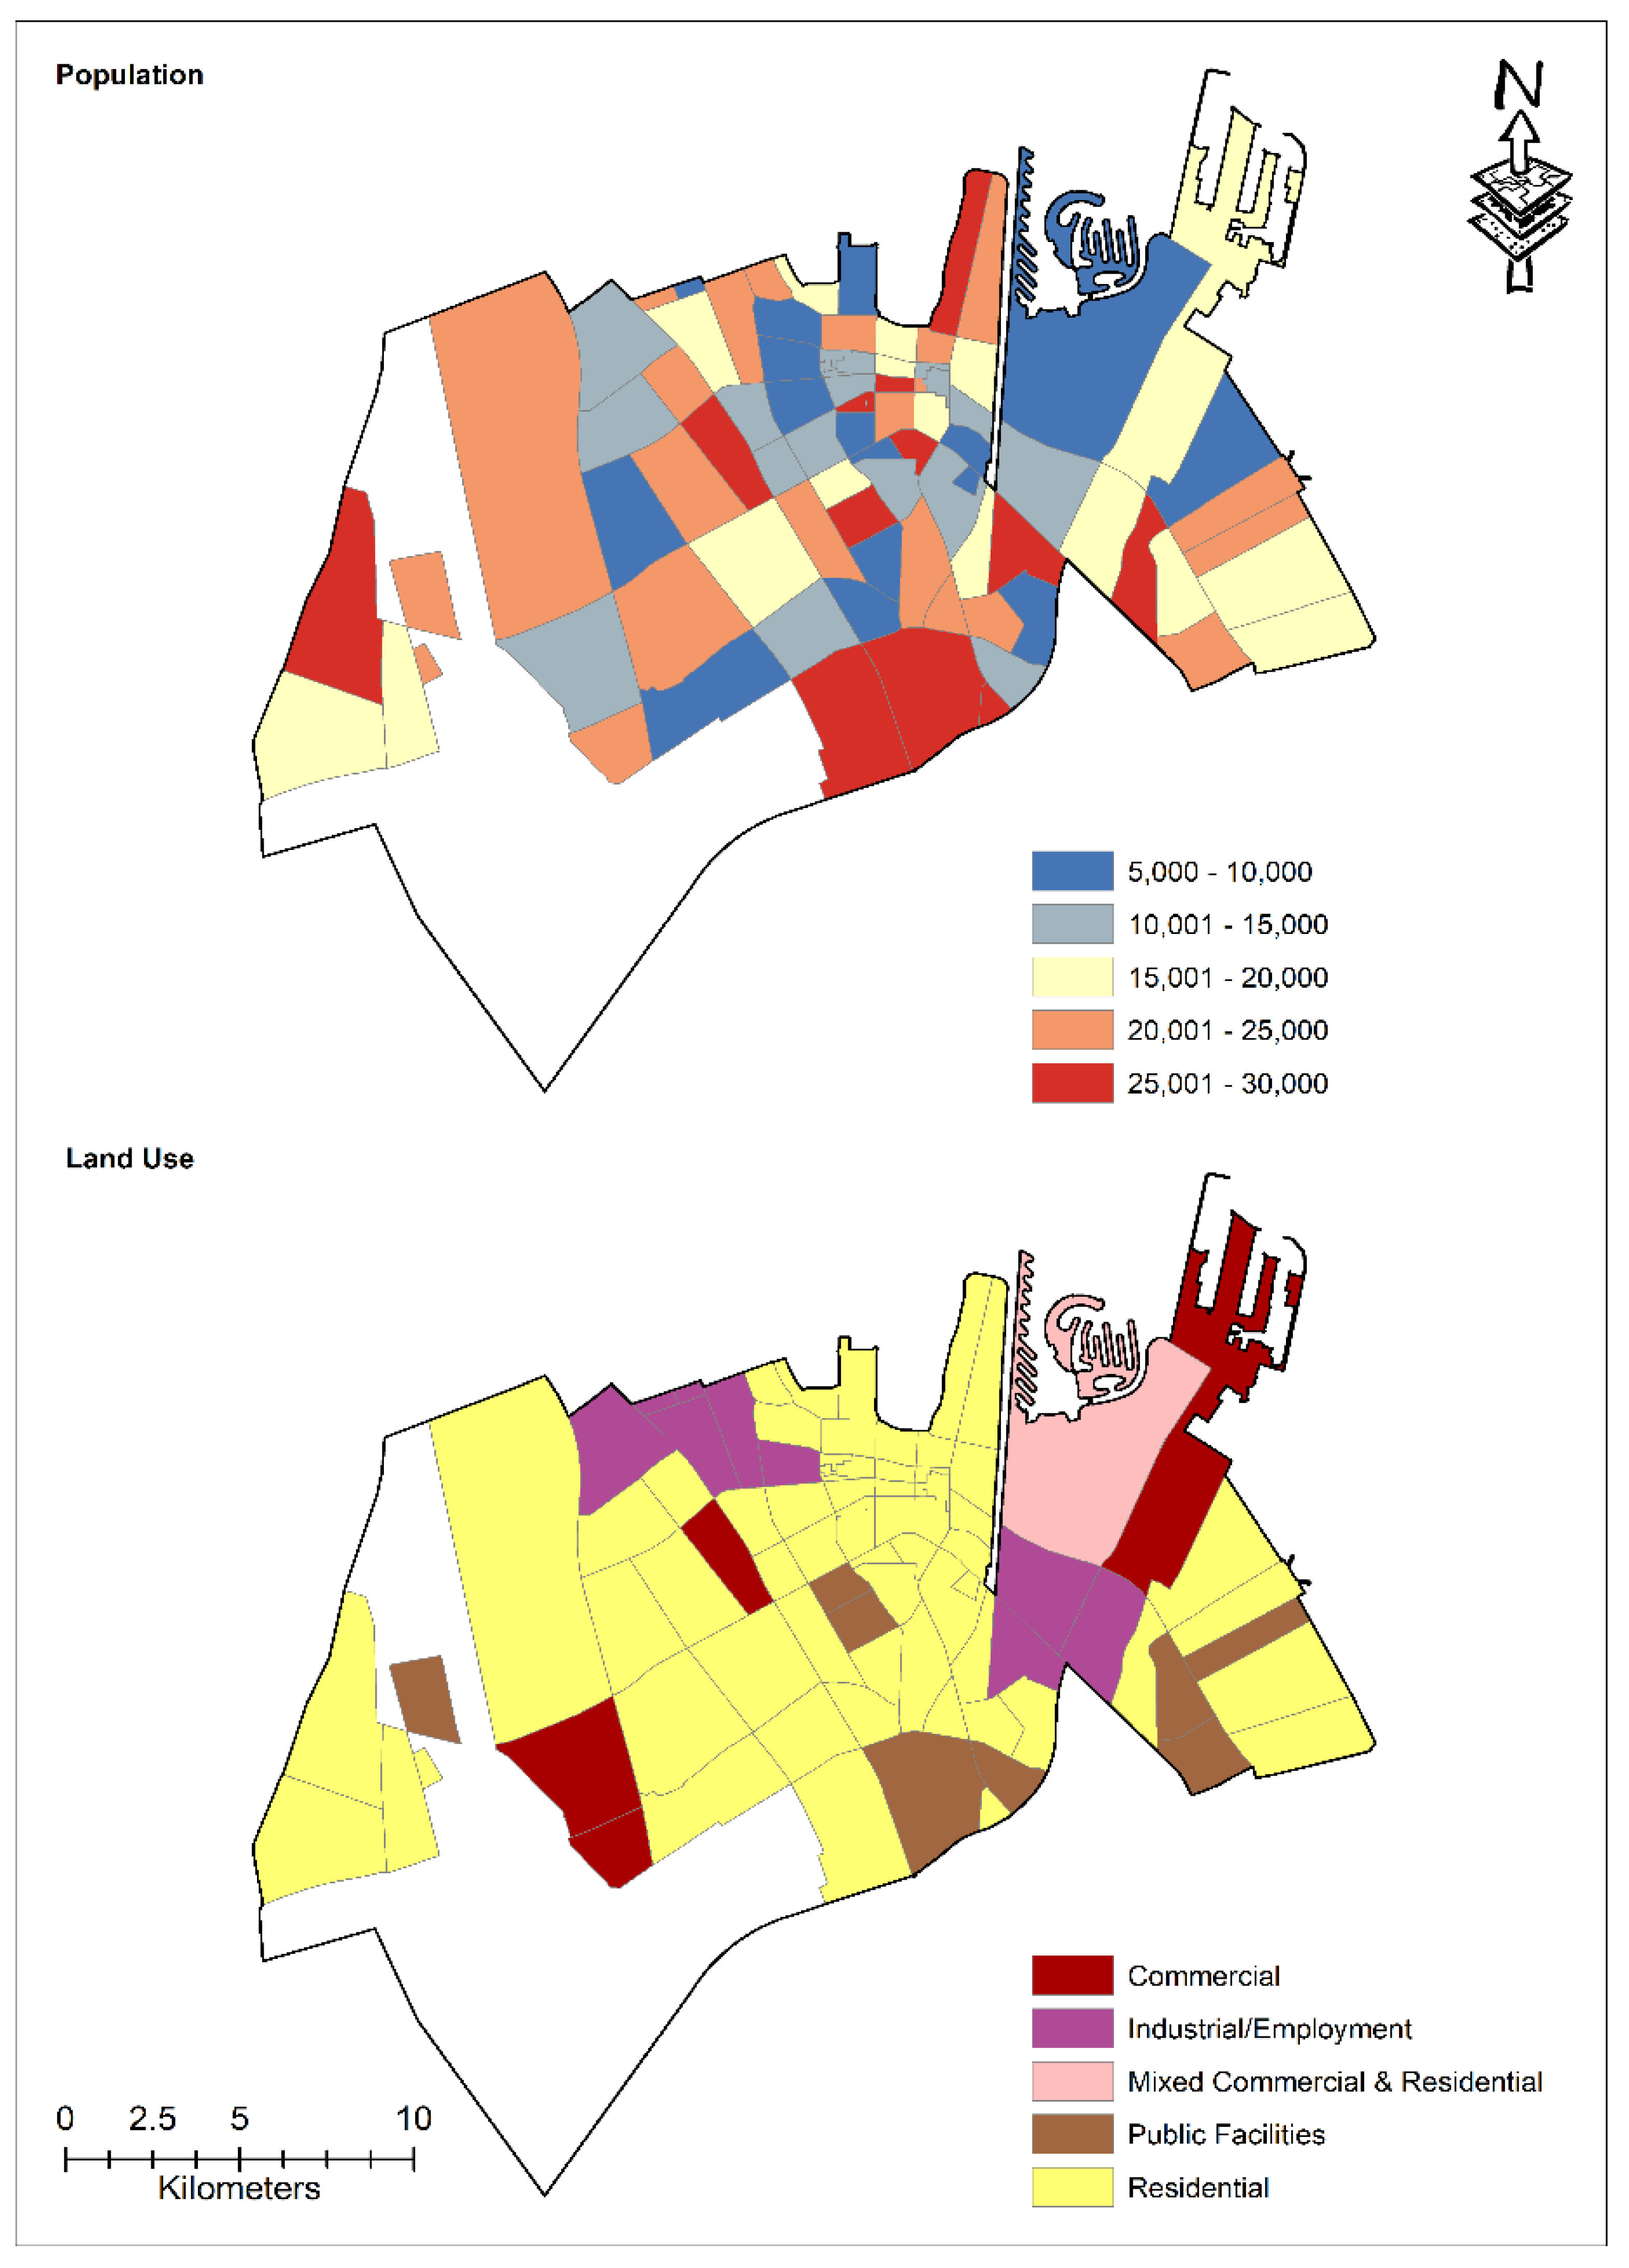
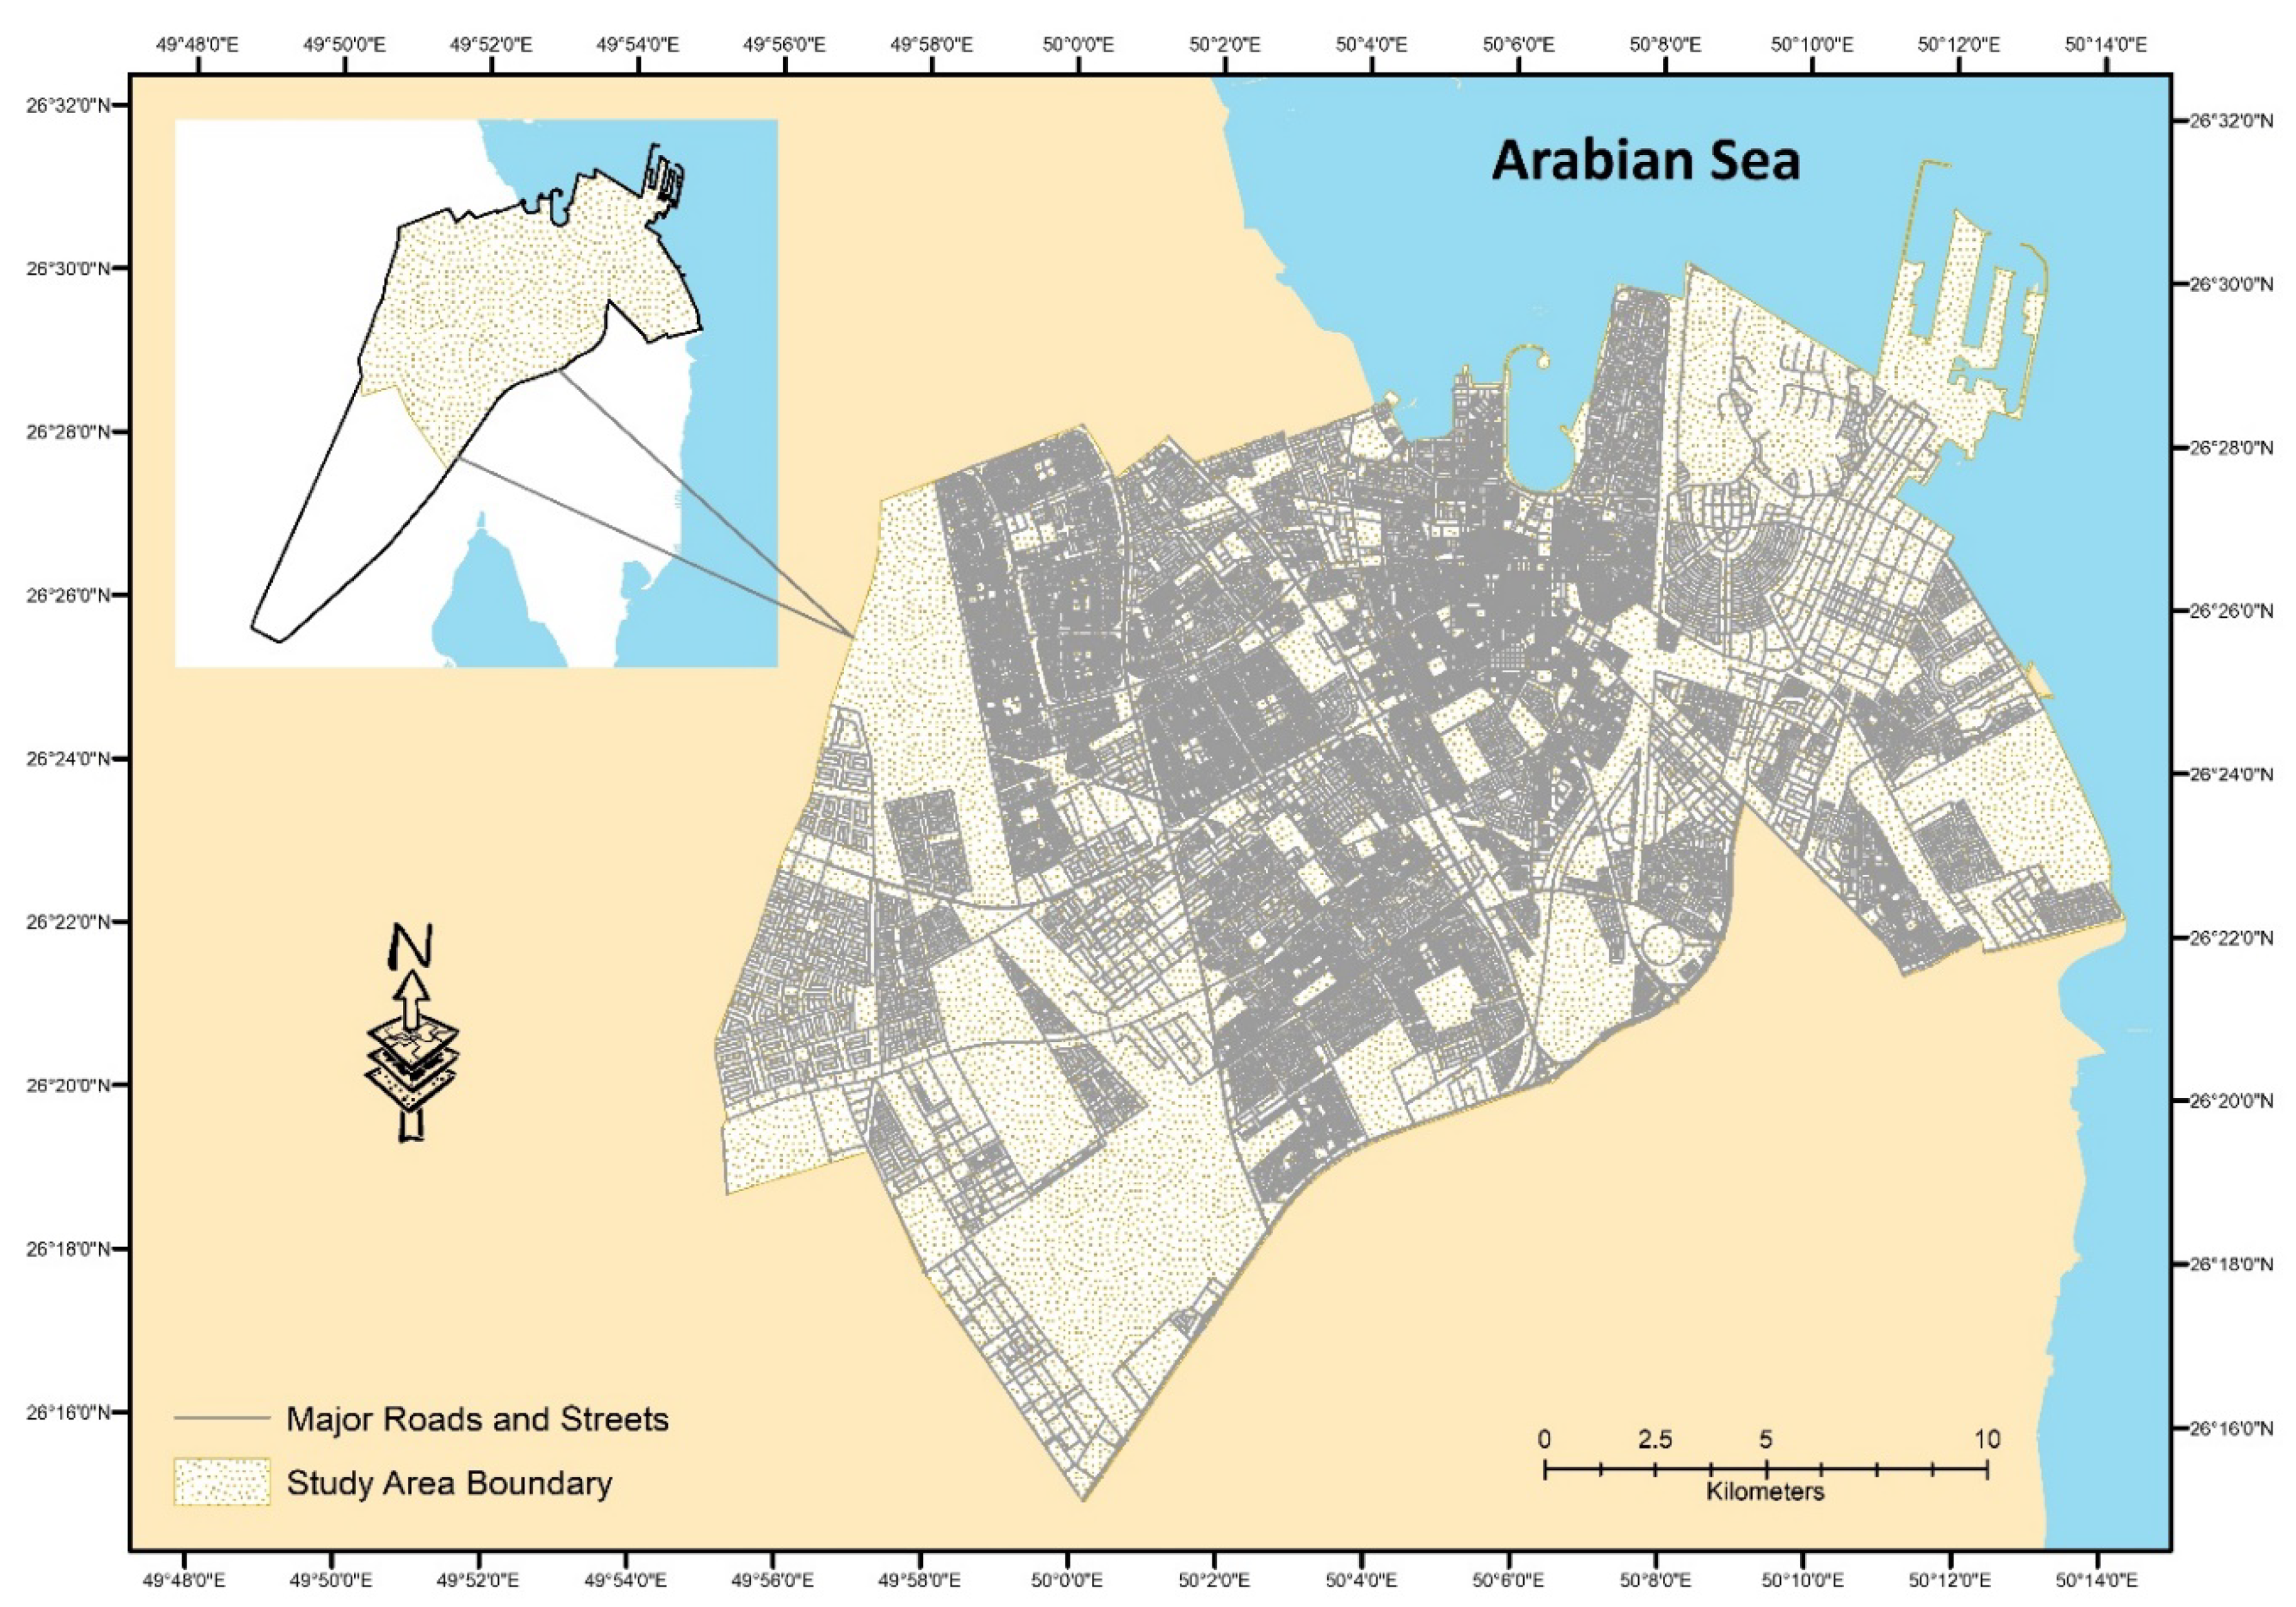
A critical review of the existing literature indicates that various methods were proposed for HSID in various parts of the world, with each having its own suitability and characteristics. Existing studies have mostly focused on statistical modeling-based approaches to uncover associations between crash outcome and predictor variables. However, these methods fail to capture the spatial heterogeneity and non-stationarity of traffic crashes. The relationship between land use and traffic crashes is obvious since different land uses generates/attracts different types of trips, yet only a few studies have explored this topic. Furthermore, previous studies have mostly focused on aggregated frequencies-based clustering of traffic crashes, which has limited applications to the implementation of effective countermeasures. Thus, it is essential to explore the crash patterns based on individual disaggregated crash attributes to mitigate the burden of specific severity class, crash causes, and crash types.
Only few studies have examined a detailed spatial analysis of crashes in KSA. This study is aimed to utilize the geographically weighted regression (GWR) method for unraveling the relationship between traffic crashes with population density and urban land use for the city of Dammam, Saudi Arabia. Crash hotspots and GWR based maps for three prevailing crash types (vehicle collisions, hit fixed object, and hit pedestrians), seven predominant crash causes (distractions, speeding, sudden lane deviations, not giving way, poor roadway, fatigue driving, and traffic violations), and two severity groups (fatal and injury (FI) and property damage only (PDO)) were developed at the zonal level in the study area. The findings of this study could provide essential guidance for road safety agencies and policymakers to identify the high-risk and crash-prone locations and to adopt appropriate measures for improving zonal-level safety.
The remainder of this paper is organized as follows. Section 2 provides a brief description of the study area. Section 3 presents the data and methods. The results are presented and discussed in Section 4. Finally, Section 5 highlights the study conclusions, implications of the current study, and prospects for future studies.

2. Study Area

The city of Dammam is the capital of the Eastern Province of Saudi Arabia, and it was chosen as the area of interest for this study (Figure 1). While the city has a total area of 653 km2, only 450 km2 was chosen for this study since the remaining 203 km2 are vacant lands that are yet to be developed [62]. Dammam currently has a total population of over 1.1 million [63]. After the oil boom during the 1970s, the city’s population grew exponentially over the past few decades. With the rapid population growth, the number of registered vehicles in the city has surged from 0.4 million in 2001 to 1.3 million in 2018 [64]. Dammam currently does not have any public transportation system. The rapid rate of motorization and increased auto-ownership have severe consequences as far as road safety is concerned. The number of traffic crashes have increased exponentially over the past ten years resulting in hundreds of deaths, injuries, and costing billions of dollars in losses to the economy.
The population distribution and the land use map of the Dammam Metropolitan area are shown in Figure 2. A total of 82 occupied residential neighborhoods were considered in the analysis. Distribution of the population is diverse among the different neighborhoods (ranging between 5000 and 30,000 residents). Nearly 40% of the city’s population are expatriates coming from surrounding Arab, South Asian, and Southeast Asian countries. Due to their diverse backgrounds and cultures with various driving styles and training, it is difficult for them to follow the Saudi driving rules and regulations. The city is a major hub to oil industries, public and private businesses, public services, academic institutions, and various commercial activities contributing to the traffic generations. As shown in Figure 2, the entire city can be primarily divided into five different land use zones (i.e., residential, commercial, mixed commercial-residential, industrial/employment, and public facilities and services). Almost 65% of the area is pure residential areas with high-density neighborhoods surrounding the downtown. Low-to-medium population densities are located mostly within the mixed commercial and residential zones along the coastal areas in the north-eastern parts of the city.

3. Data and Methods

There were several sets of data that were collected and processed for this study. First, a database containing the detailed vehicular crash dataset containing their latitude and longitudinal coordinates between the years 2009 and 2016 was collected from the Dammam Traffic Department. The data cover all types of motor vehicle crashes during the study period. The local traffic police department is mainly responsible for recording detailed information about the crash event. Details on different crash characteristics are collected by emergency response crew on standard crash reporting proformas. The nearby police patrolling unit is required to reach the crash scene within 7 min of the event happening. The crew consists of a medical staff unit and trained observers for noting crash information. This information includes the drivers, sociodemographic attributes (age, gender, education, profession etc.), vehicle characteristics, weather characteristics, lighting conditions, and road inventory from crash locations. The final crash database on the excel spreadsheet is then complied by extracting the details from individual crash report files remotely in office. In addition to crash data, information about the boundaries of the residential neighborhoods with their population size (2010) and detailed land use was collected from the Dammam Municipality’s office. Data on land use and population zoning were also collected from Dammam municipality.
To examine the pattern of distribution for the crashes, the nearest neighbor index (NNI) for the three crash attribute categories (crash severity groups, crash causes, and crash types) were calculated in ArcGIS v.10.6 to examine their pattern of distribution and knowing if the crashes are clustered together in few specific locations, are dispersed, or occurred randomly throughout the study area. The NNI is one of the common indexes used to examine point patterns, and it is calculated using Equation (1) [65]. In the equation D ¯ n n d is the average distance between each crash location and the nearest crash and D ¯ r a n is the distance that would be expected if the crashes were randomly distributed [65]:
N N I = D ¯ n n d D ¯ r a n .  
where:
D ¯ n n d = i = 1 n d i n .   and   D ¯ r a n = 0.5 × A n
In the equations, n is the total number of crashes within the study area; di is the distance between each crash location, and its nearest closest crashes location, and A is the total area for the study (450 km2). The NNI value near 0 would indicate clustering, while a value close to 1 would suggest the crashes are randomly distributed. An NNI value greater than 1 suggests that the crashes are spatially dispersed. In this study, crash points that had NNI values less than 0.6 were considered to be clustered, and the optimized hotspot analysis algorithm in ArcGIS was used to find the locations of the hotspots for each of the concerned crash attribute categories. In this algorithm, a fishnet polygon formed by cells of 250 m side length is created based on the number of crashes within each polygon. All the hotspot areas were mapped with more than a 90% confidence level.
In the final step of the analysis, a geographically weighted regression (GWR) method was used to examine the spatial relationships between the number of crashes (by per neighborhood and the population within that neighborhood). The mathematical equation for GWR is given in Equation (3) [50].
y i = j 0 m β j ( u i , v i ) x i j + ε i
where xij is the jth predictor variable (only population), βj(ui,vi) is the jth coefficient, (ui,vi) is the vector form of x and y coordinates, and yi is the rate of the crash within each neighborhood. Finally, the ε i   is the error term determined from the observed standardized score and the predicted score [66]. A fixed kernel was used to conduct the GWR analysis, using the AICc (corrected Akaike Information Criterion) to determine the optimal bandwidth parameter.

4. Results and Discussion

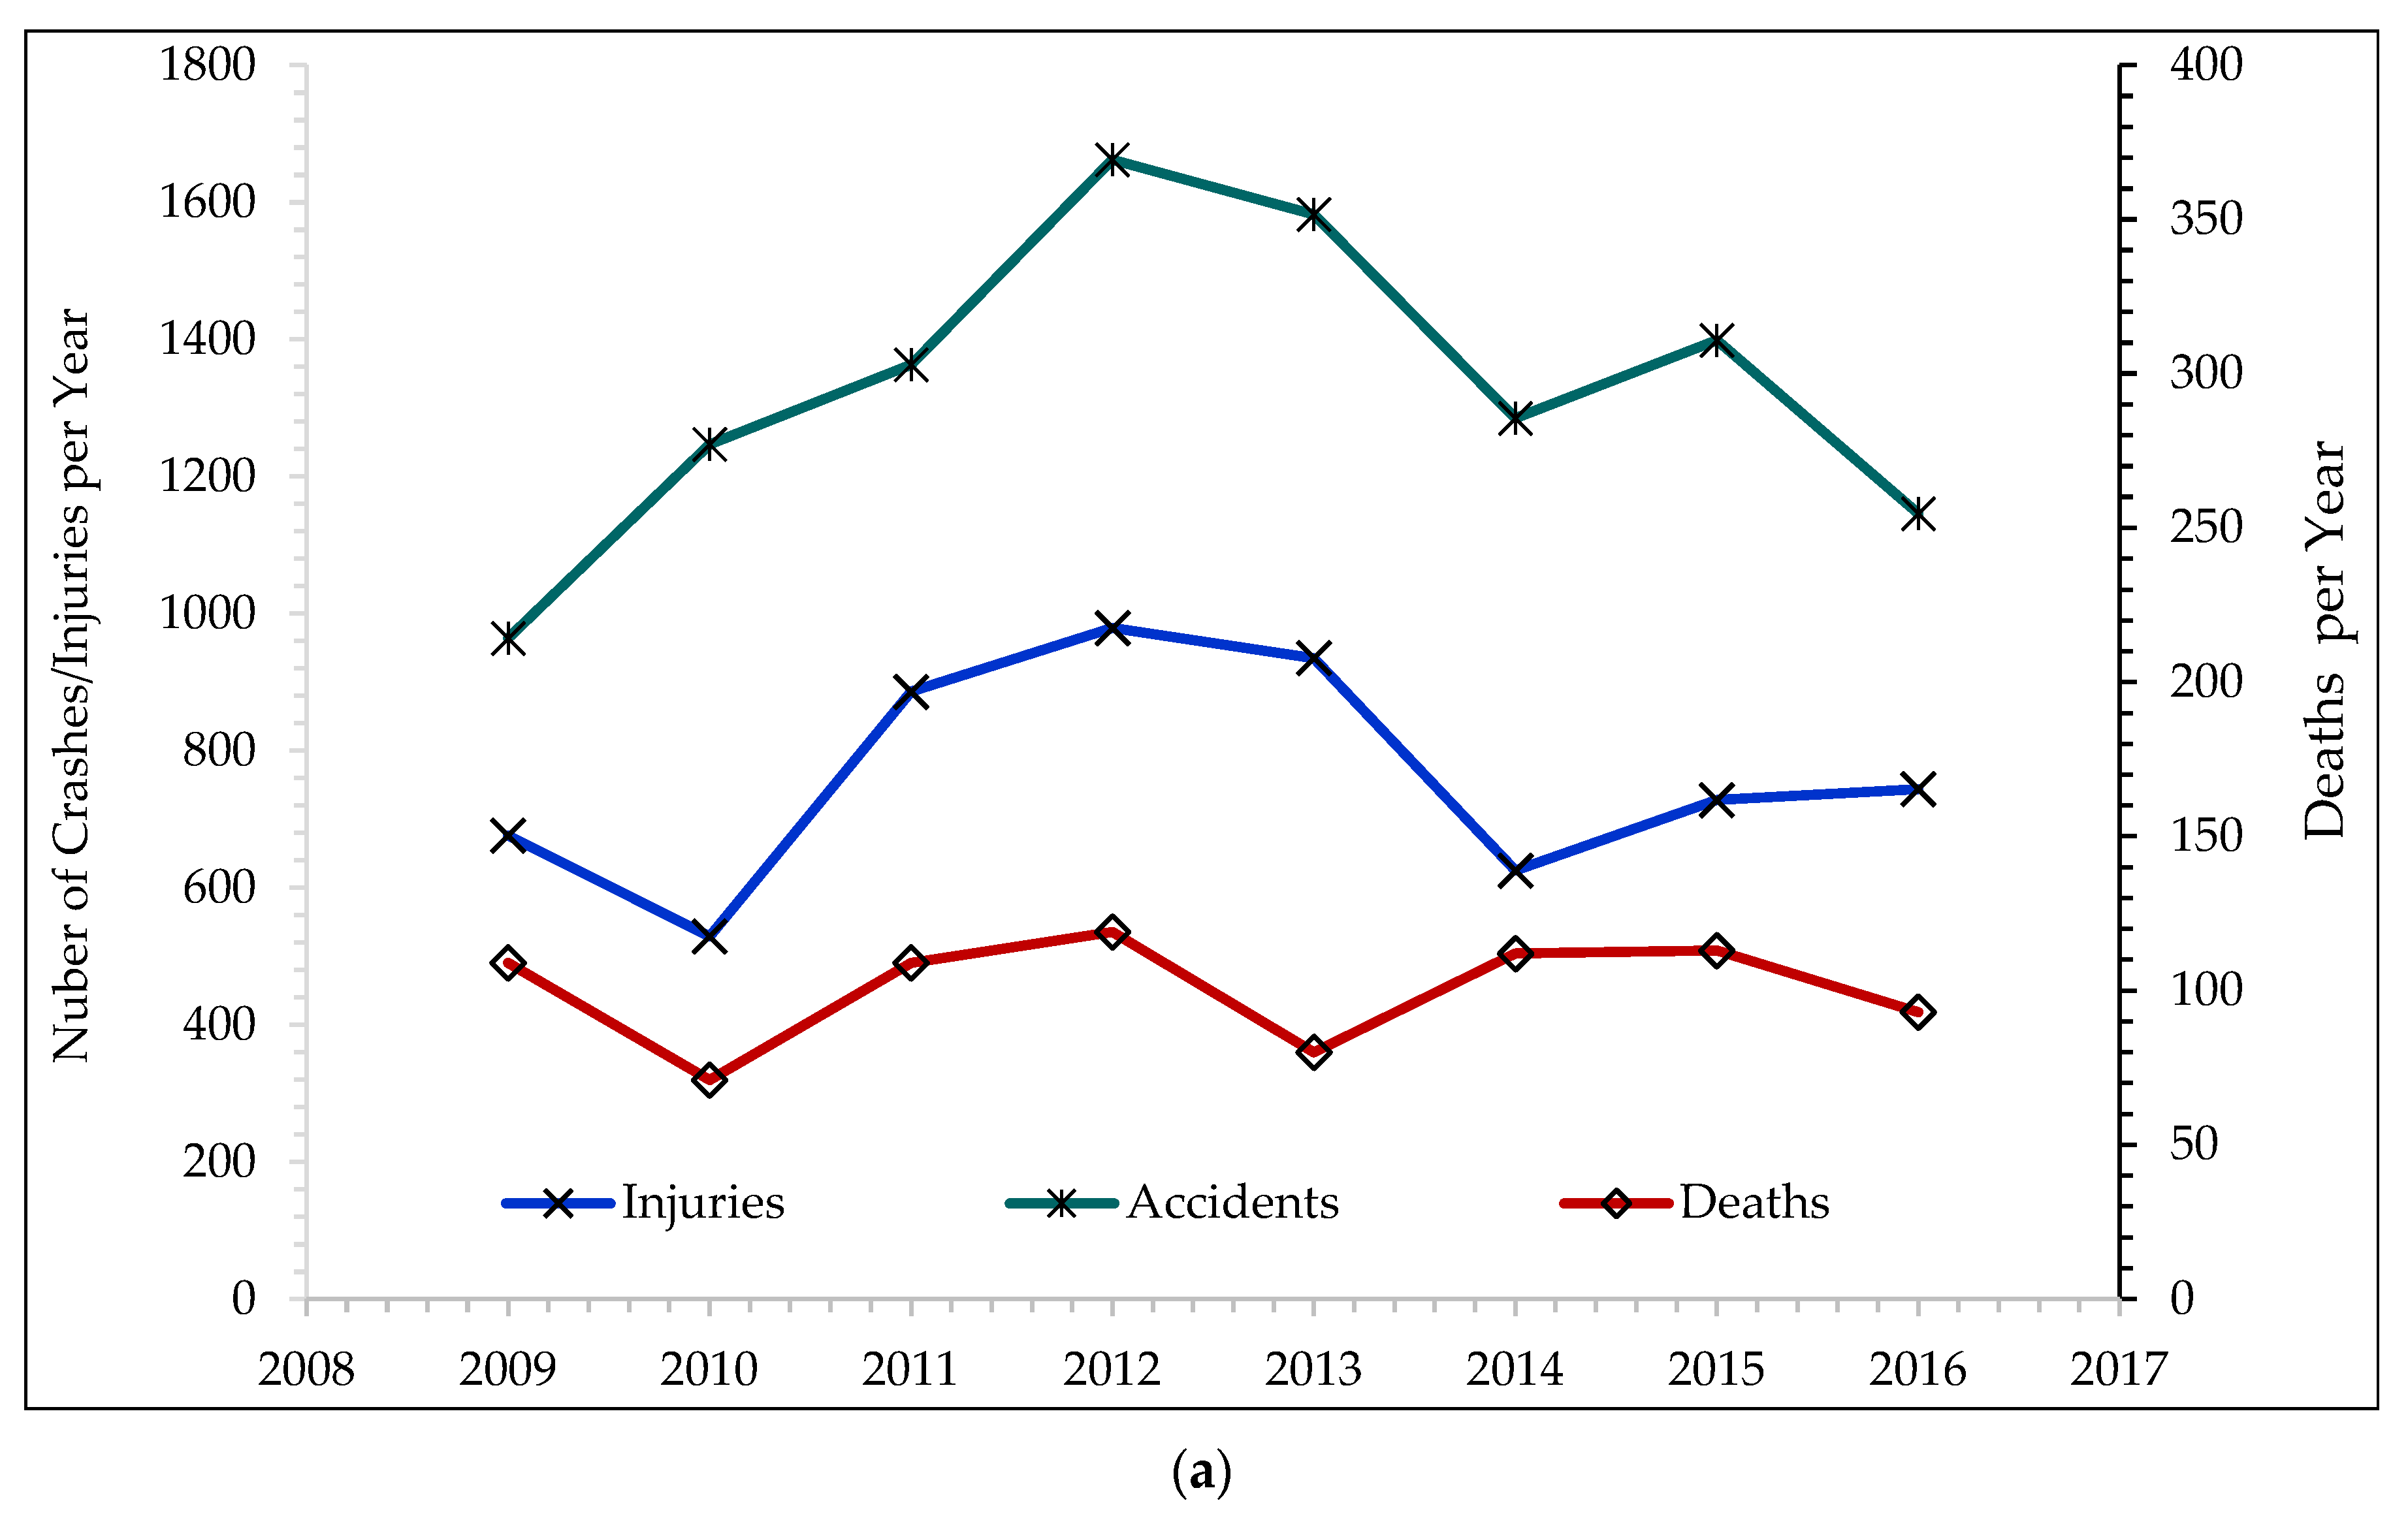
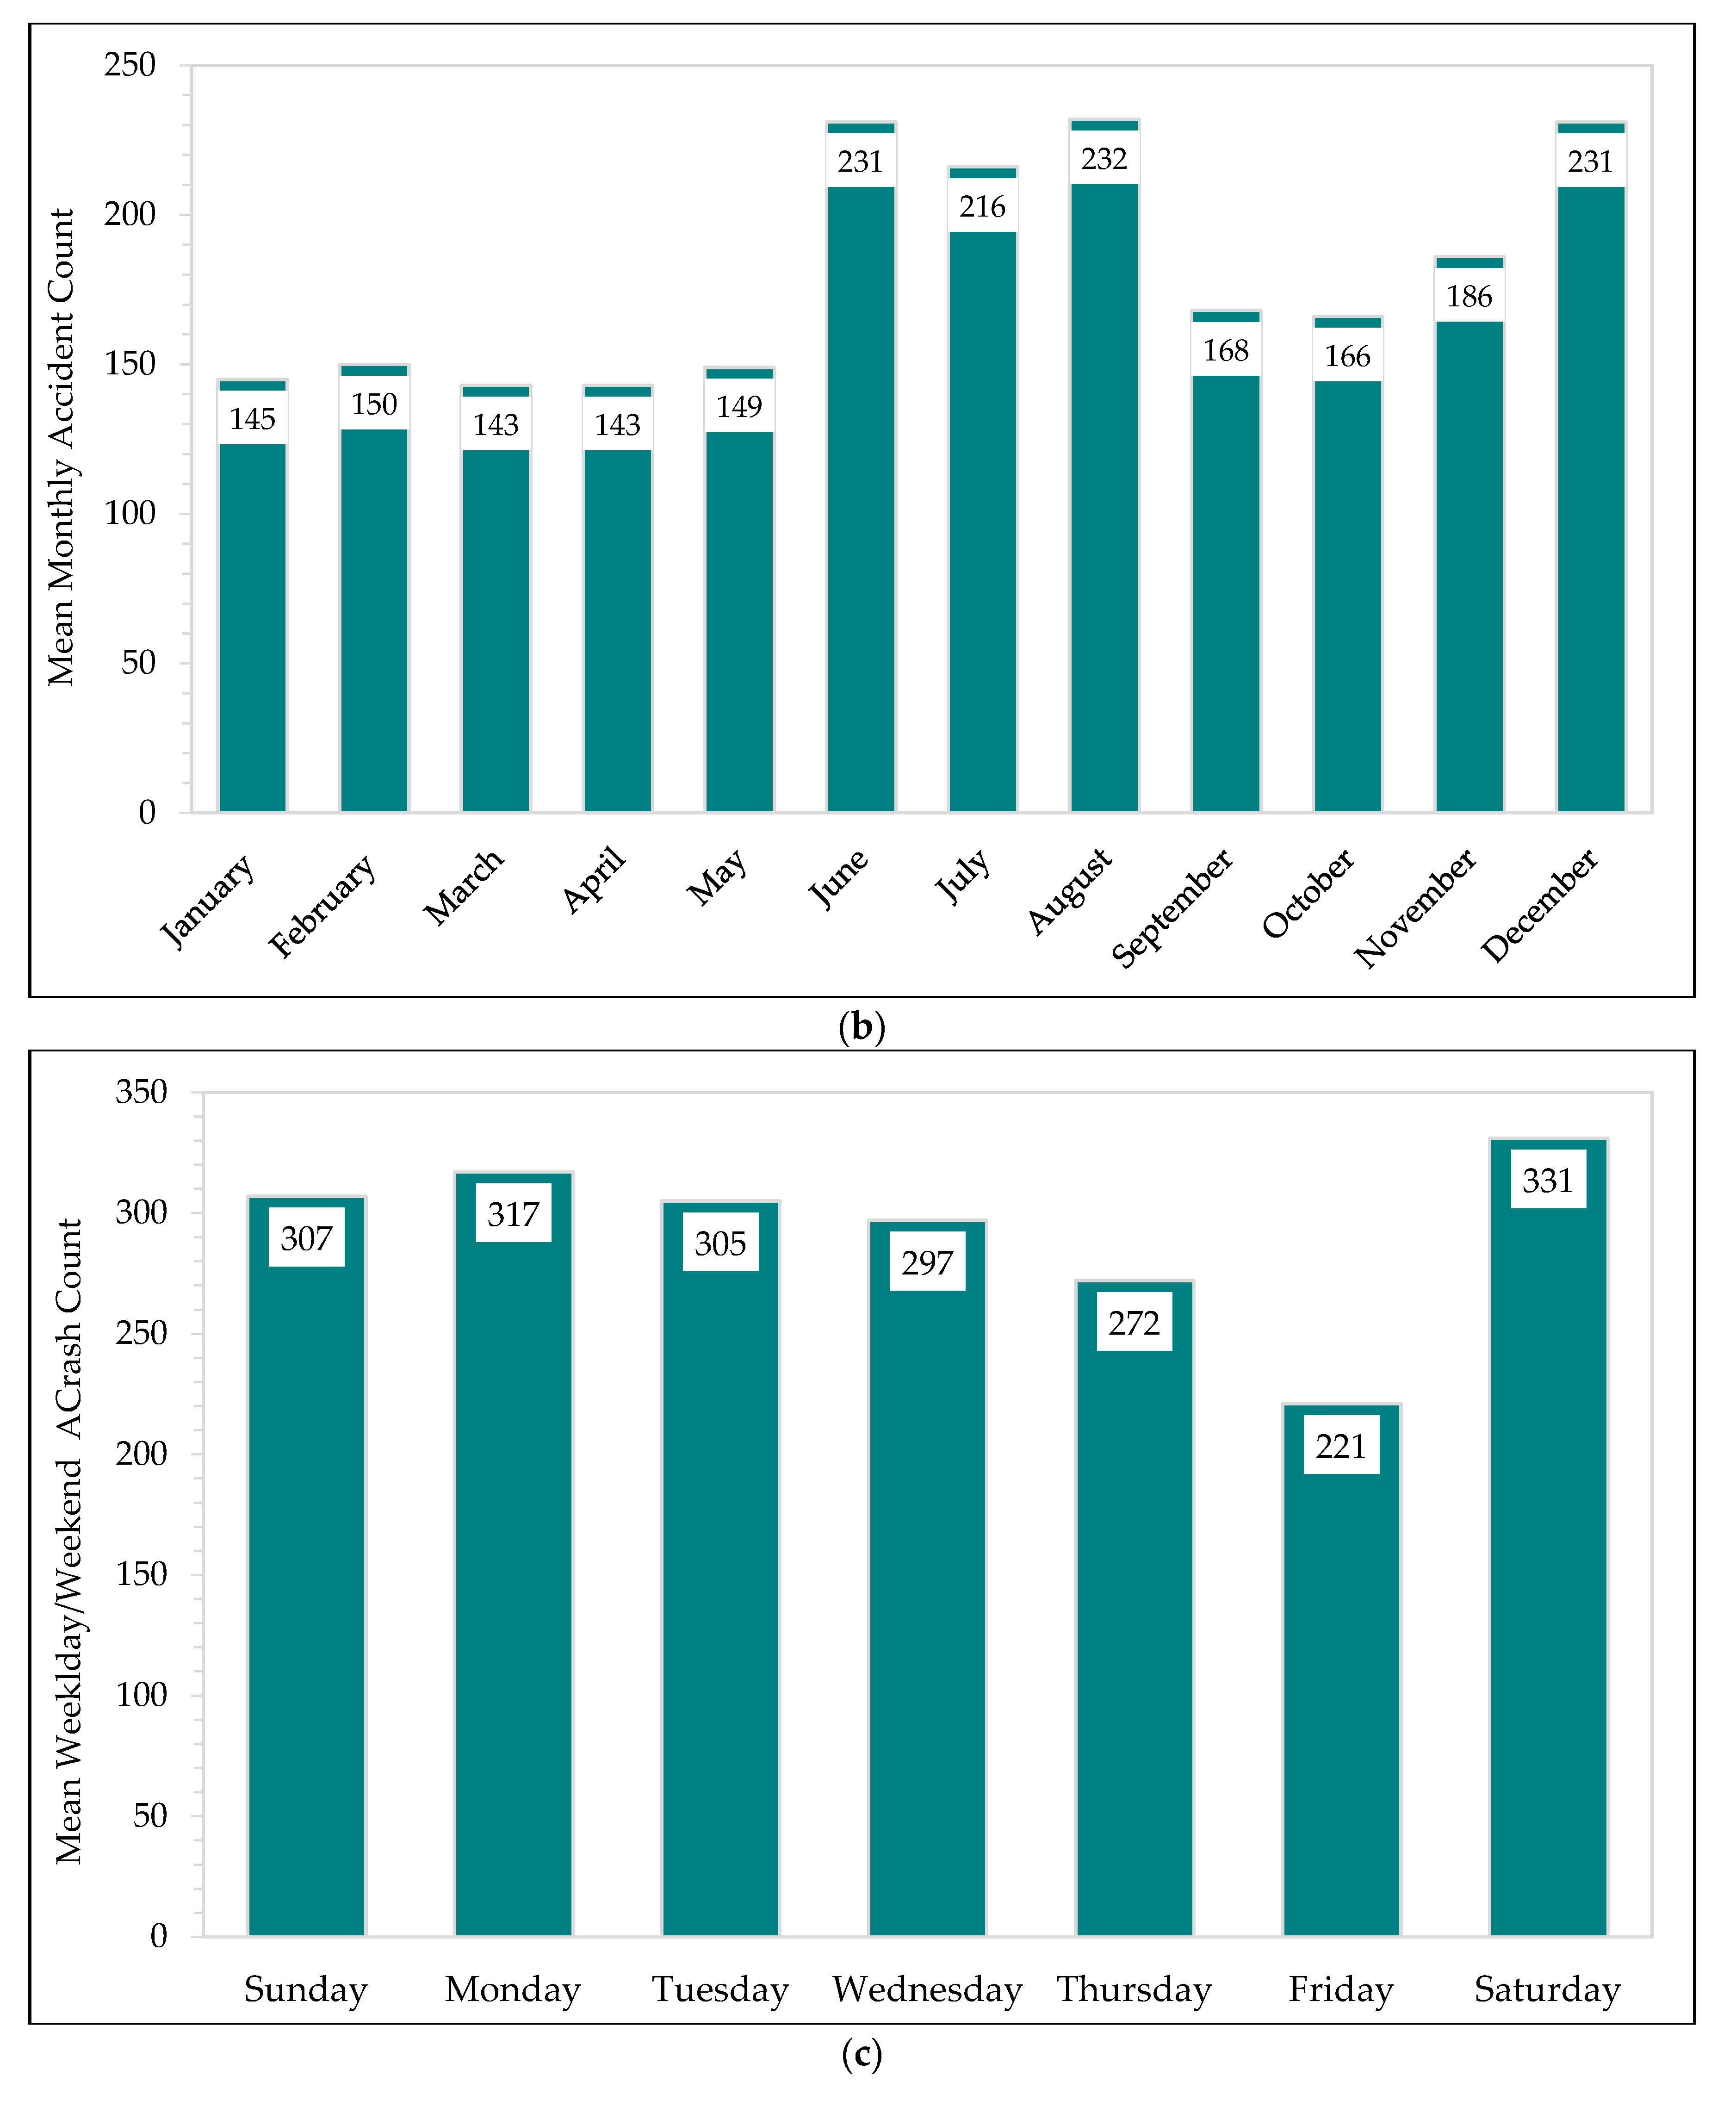
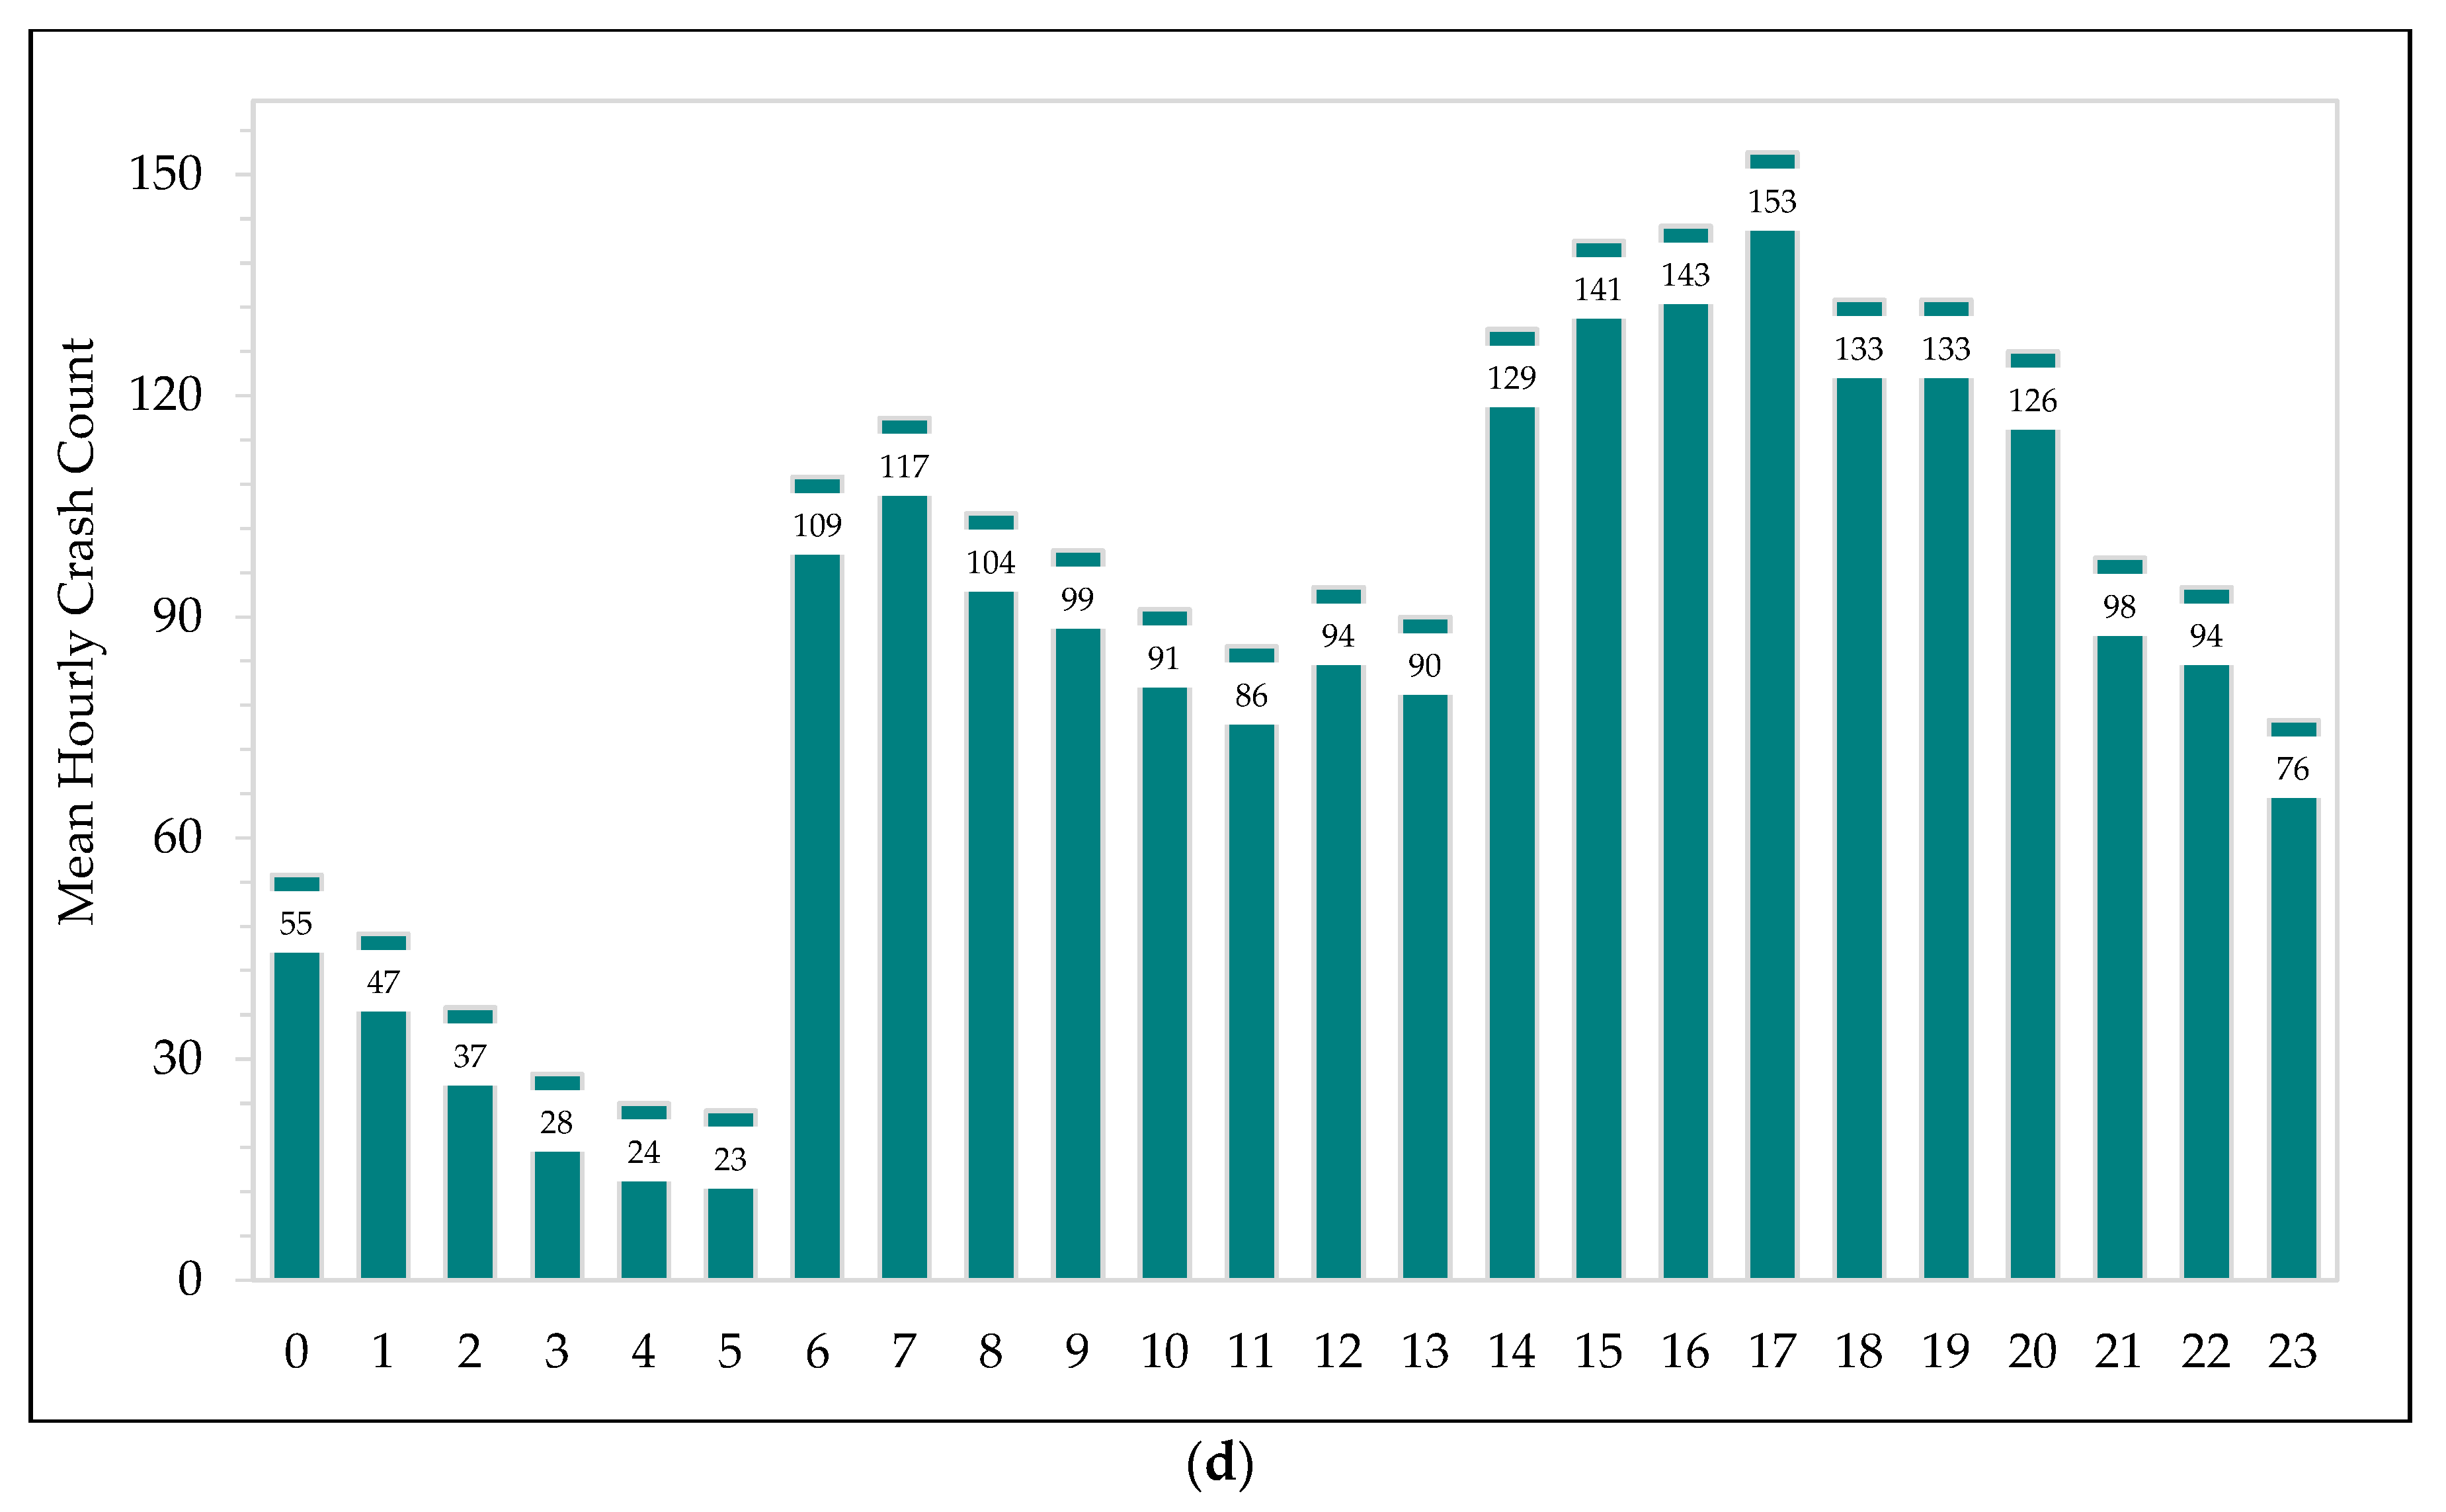
4.1. Temporal Distribution of Crashes

The temporal variations of the traffic crashes within the study area are shown in Figure 3. Figure 3a shows the yearly fluctuations in the total number of crashes, injuries, and fatalities. A total of 11,539 crashes were recorded, resulting in 806 deaths and over 6000 injuries. Close evaluation of Figure 3a indicates that year 2012 witnessed the highest number of crashes, injuries, and traffic casualties. This sharp increase in crash record stirred an immediate response from road safety officials and concerned authorities. Various preventive measures such as revising the speed limits, strictly enforcing traffic rules and regulations, and increasing traffic violation fines were implemented. The steady decrease in the observed number of crashes in the following years may be attributed partly due to the regression-to-mean (RTM) phenomenon and partly due to implemented interventions. However, the proportion of injuries and deaths is well above the desired road safety targets in the country.
In Figure 3b, the variation in mean monthly crashes for the entire study period is presented. It can be observed that the summer months, including June, July, and August, carried the highest number of crashes followed by November and December. The large proportion of accidents during summer months may be attributed to a greater number of intracity trips during summer vacations as well as due to tire failures due to extreme heat in months of summer in KSA [5,67,68]. The frequency distribution of mean crashes among a different day of the weeks are plotted in Figure 3c. In KSA, Fridays and Saturdays are considered the weekends. Since the residents usually stay at home to attend the Friday noon prayers and spend the afternoon at home with friends and family, Friday has the lowest rate of total crashes. However, the residents travel to supermarkets, restaurants, and medical facilities during Saturdays. Therefore, Saturday has the highest rate of traffic crashes. During the weekdays, the number of crashes is fairly consistent. Finally, Figure 3d shows the hourly fluctuations in average daily traffic crashes. The distribution of hourly crash patterns is intuitive based on traffic exposure and travel during the day.

4.2. Crash Hotspot Analysis

The first objective of this study is to examine the presence of hotspots by crash severity, causes, and types. It was done by assessing the NNI values for the crash incidences (Table 1). Since all the crash attributes had NNI values less than 0.6, the hotspot analysis was performed for all the crash severity, causes, and types.

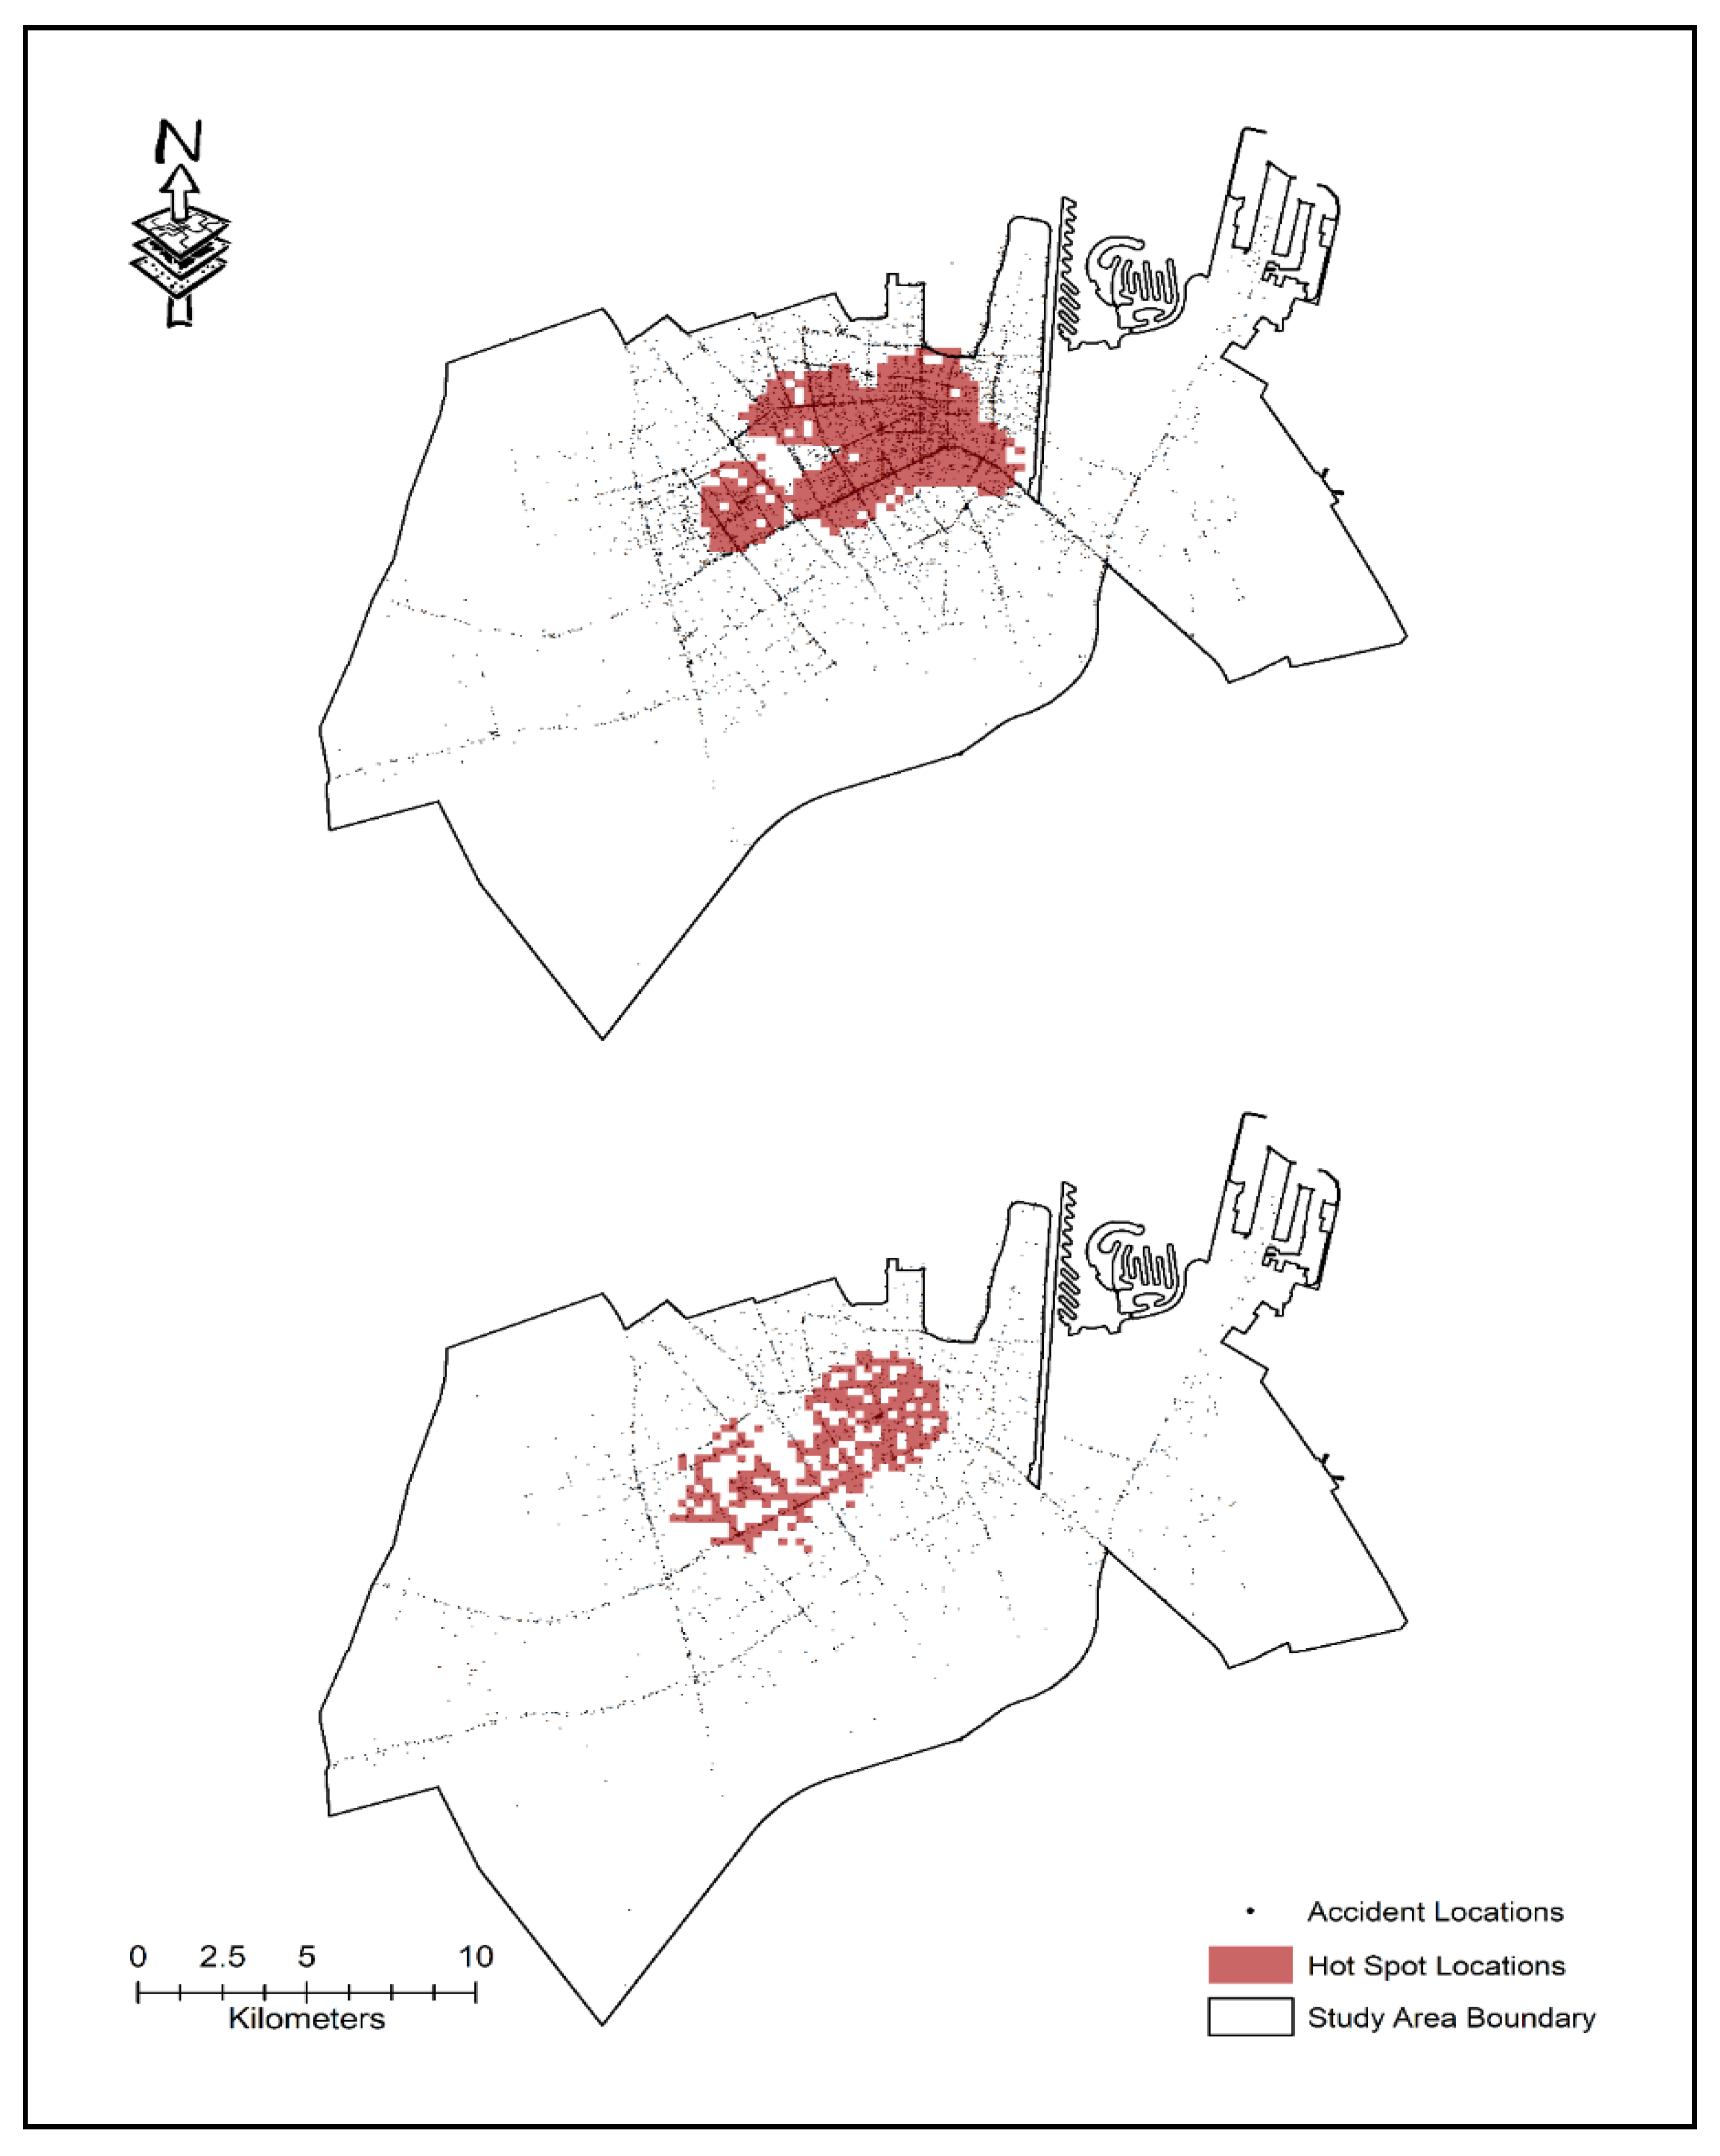
4.2.1. Hotspot Analysis by Crash Severity

In Figure 4, the crash hotspot locations based on severity indices (i.e., property damage only (PDO) or those involving fatal and injury (FI)) are shown. It is established that “not all crashes are equal”, the extent of damage associated with the specific crash is dependent on several factors including urban land use, features of the built environment, crash type, driver alertness, and response to the event, road designs, vehicle characteristics, number of vehicles involved, the speed at the time of impact, and many others. PDO crashes were prevalent in medium to high density residential and public facility zones where permissible speed limits (<50 kmph) are relatively low, and traffic volumes are significantly high. Since the drivers are usually more alert during such circumstances, the chances of any significant injuries and casualties are low. On the other hand, the FI crashes were clustered on routes having flexible driving speed limits in urban areas having low-to-medium population densities. Apart from over-speeding, other factors such as driver distractions, fatigue driving, sudden lane deviations, and crashes involving pedestrians were significant contributors to FI crashes.

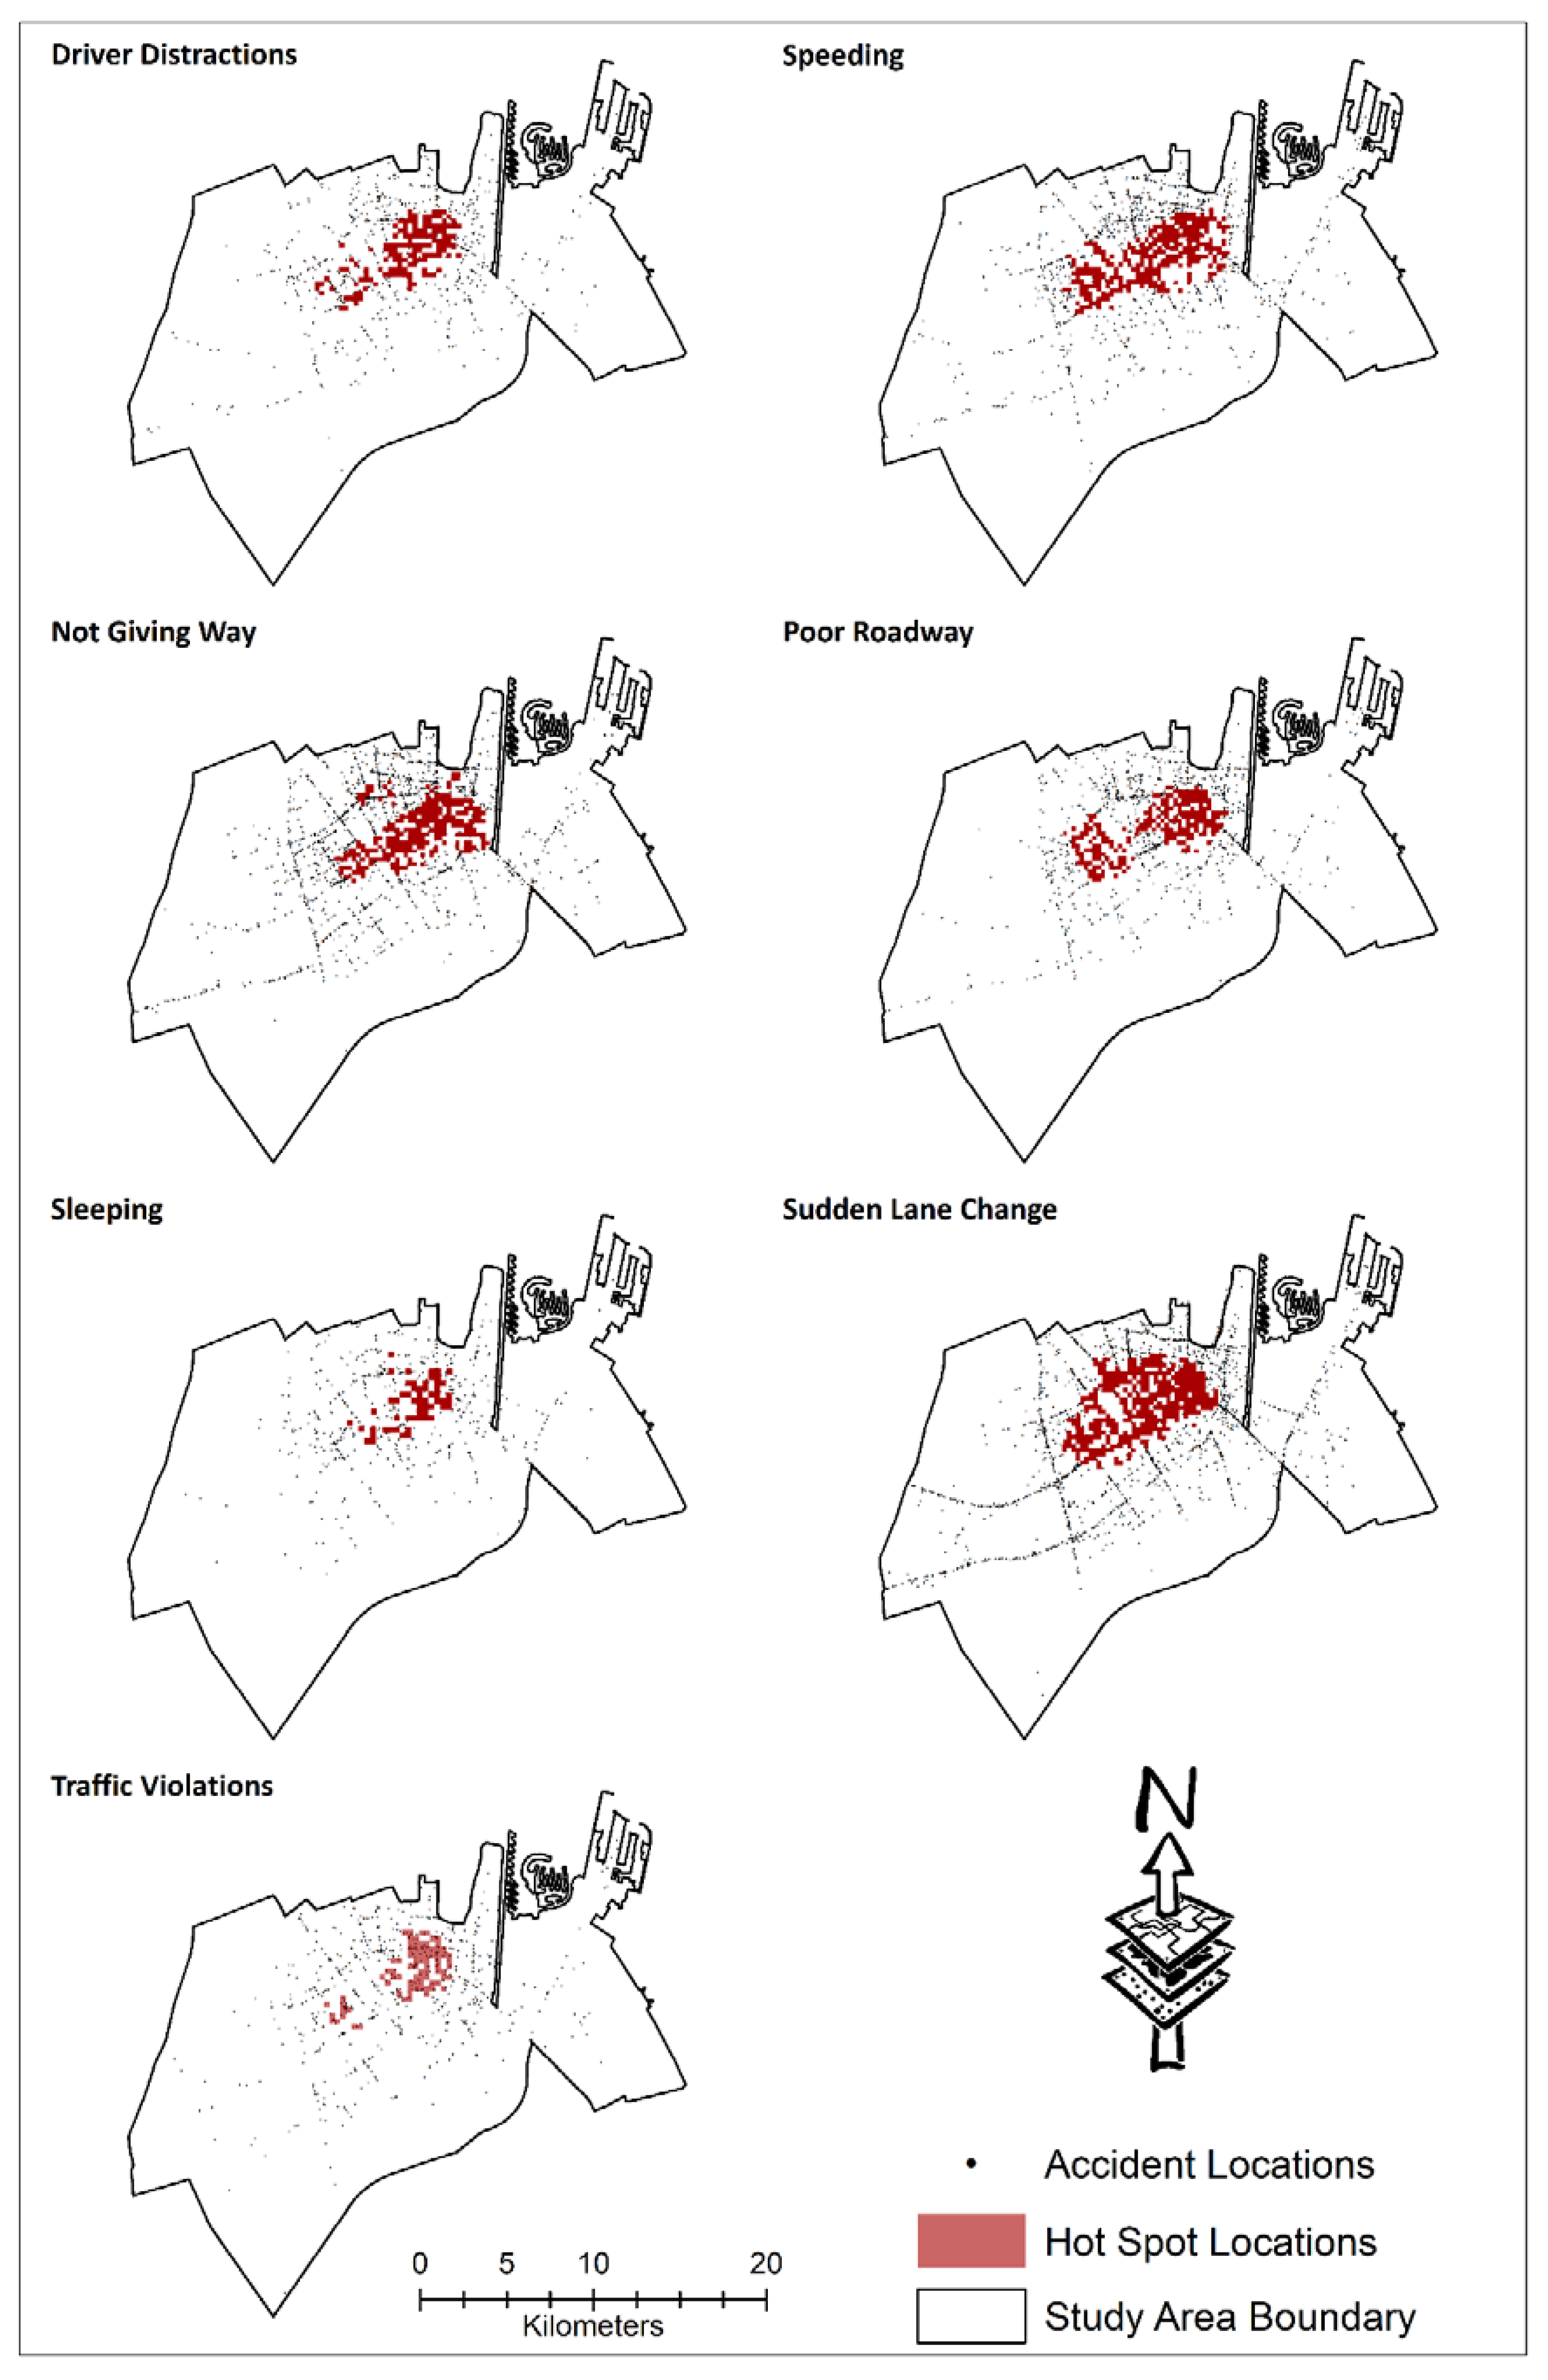
4.2.2. Hotspot Analysis by Crash Causes

In Figure 5, the distribution of hotspots by prevailing crash causes (i.e., driver distractions, not giving way, over-speeding, poor roadway, driver fatigued or falling asleep behind the steering wheel, and sudden lane deviations) is shown. Such crashes are mainly distributed along major and minor urban residential streets. However, a high concentration of crashes occurred at congested major intersections havinghigh population density in the surrounding areas. It is evident from the figure that although the extent and spread of hotspot zones by crash causes are different, they have one main common epicenter. This observation is intuitive because the epicenter for all crash categories is located in the downtown or central business districts of the Dammam Metropolitan Area. Speeding has the highest percentage (46.4%), followed by sudden lane change (43.9%). The distribution of crashes caused by driver sleep/exhaustion has the lowest percentage (19.9%) of the hotspots (Table 1). Crashes caused by traffic violations were another prevailing crash category that was mapped. These include violations of traffic control devices (TCD) like traffic signals, stop signs, road markings, non-compliance with the pedestrian crossings, and distractions caused by the use of mobile phones while driving. About 29% of the total crashes in this class fall within the hotspot zones.

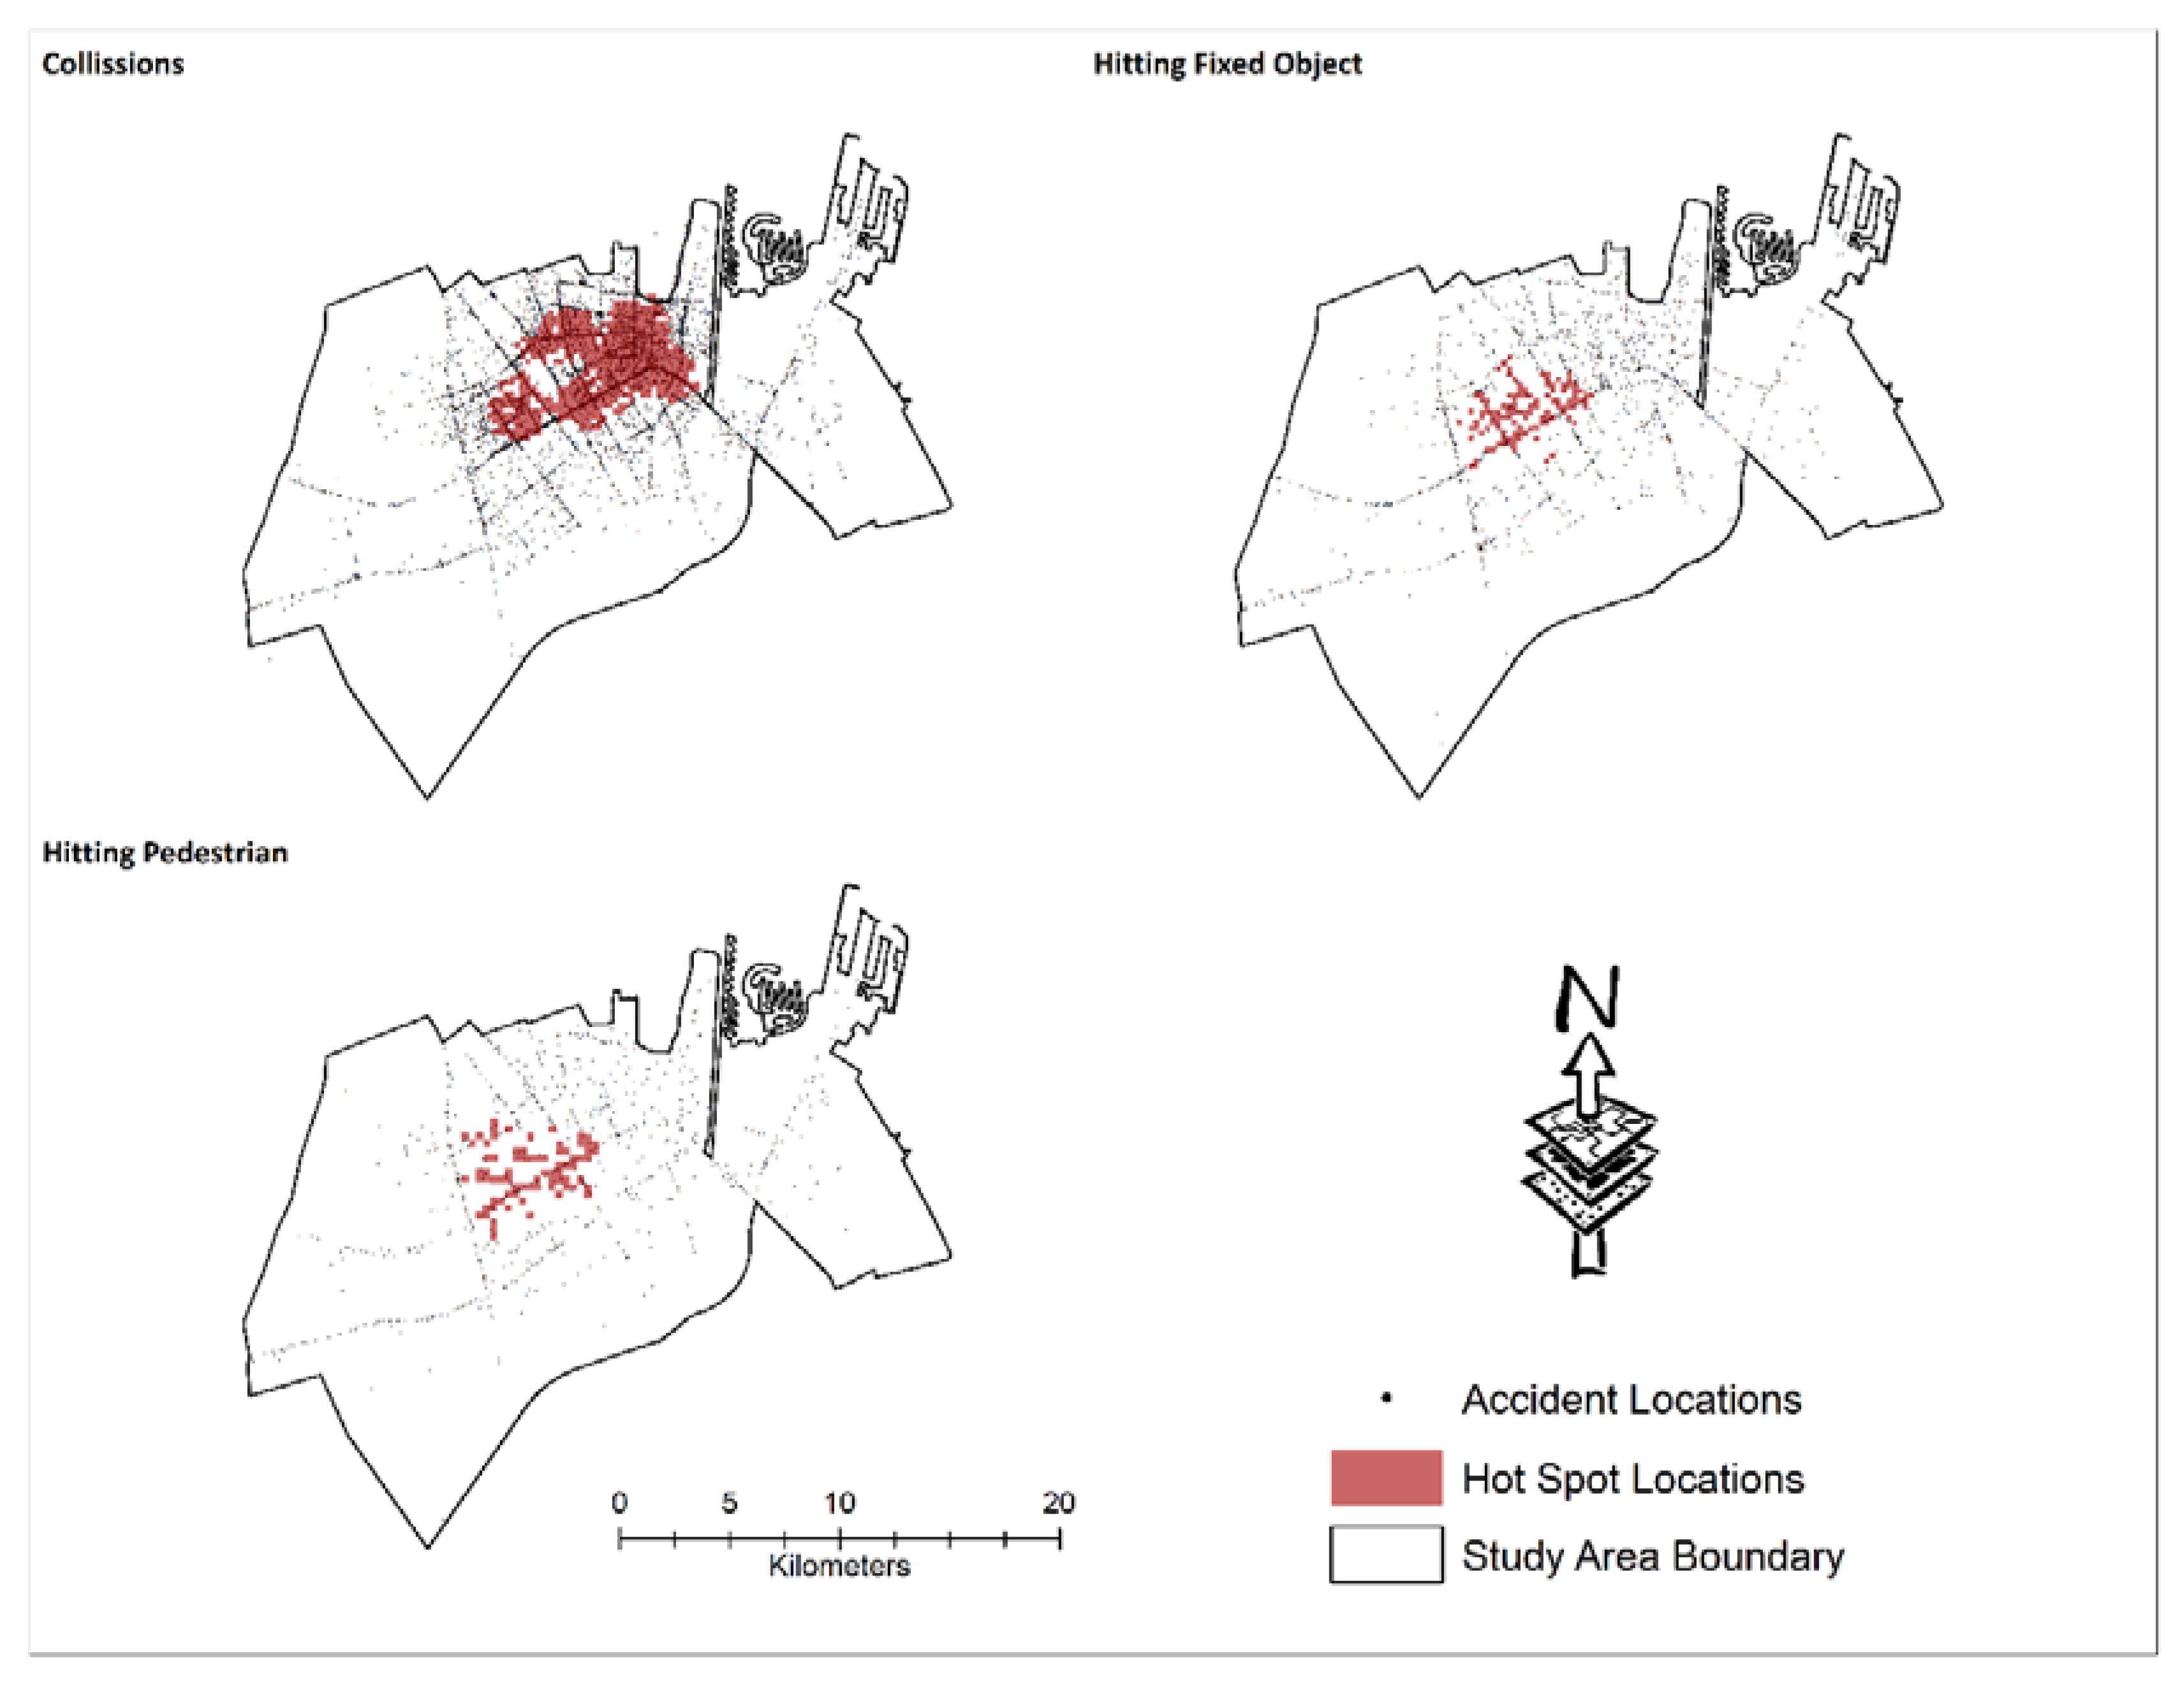
4.2.3. Hotspot Analysis by Crash Types

The distribution of hotspots by crash types are shown in Figure 6. It was found that crashes between two or more modes of motorized transportations are the most predominant crash types accounting for over 68% of the total crashes. A significant proportion of collisions were rear-end crashes in the dilemma zones near the signalization intersections, which primarily resulted in non-fatal crashes. Approximately 53% of the total collisions belonged to hotspots. The next prevailing type of crash hotspot in this category was “hit fixed objects crashes” that included a collision with a pole, tree, and parked vehicles, etc. Only 17% of fixed object crashes were marked as hotspots. Although pedestrian crash hotspots constitute a low percentage (19.3%) of total crashes in this category, it resulted in a high number of injuries and fatalities. Elderly pedestrians, in particular, were more prone to severe crashes. In general, the patterns of crash hotspots by prevailing crash types (mapped in Figure 6) were also concentrated in the metropolitan downtown area.

4.3. GWR Analysis for Land Use Neighborhood Population and Crash Counts Severity, Causes, and Types

The second objective of this study was to examine the relationships between the total population of each neighborhood (Figure 2) against the number of vehicle crashes based on their characteristics (severity, causes, and types) occurring in that neighborhood during the study period. As discussed in the methods section, such relationships were examined using the GWR analyses. The results of the GWR analyses are shown in Figure 7, Figure 8 and Figure 9. Each figure shows the standard deviations of the residuals (SDR), indicating the neighborhoods where the model over- and under-predicted the value of the dependent variable (crash characteristics). Neighborhoods with SDR values below −1.5 have crash characteristics very low when compared to the population in those neighborhoods. On the other hand, neighborhoods having the SDR value above 1.5 have value for crash characteristics that are significantly very high when compared to the population in those neighborhoods. Neighborhoods with SDR values between −0.5 and +0.5 have relatively proportional crash characteristics compared to the neighborhood populations.

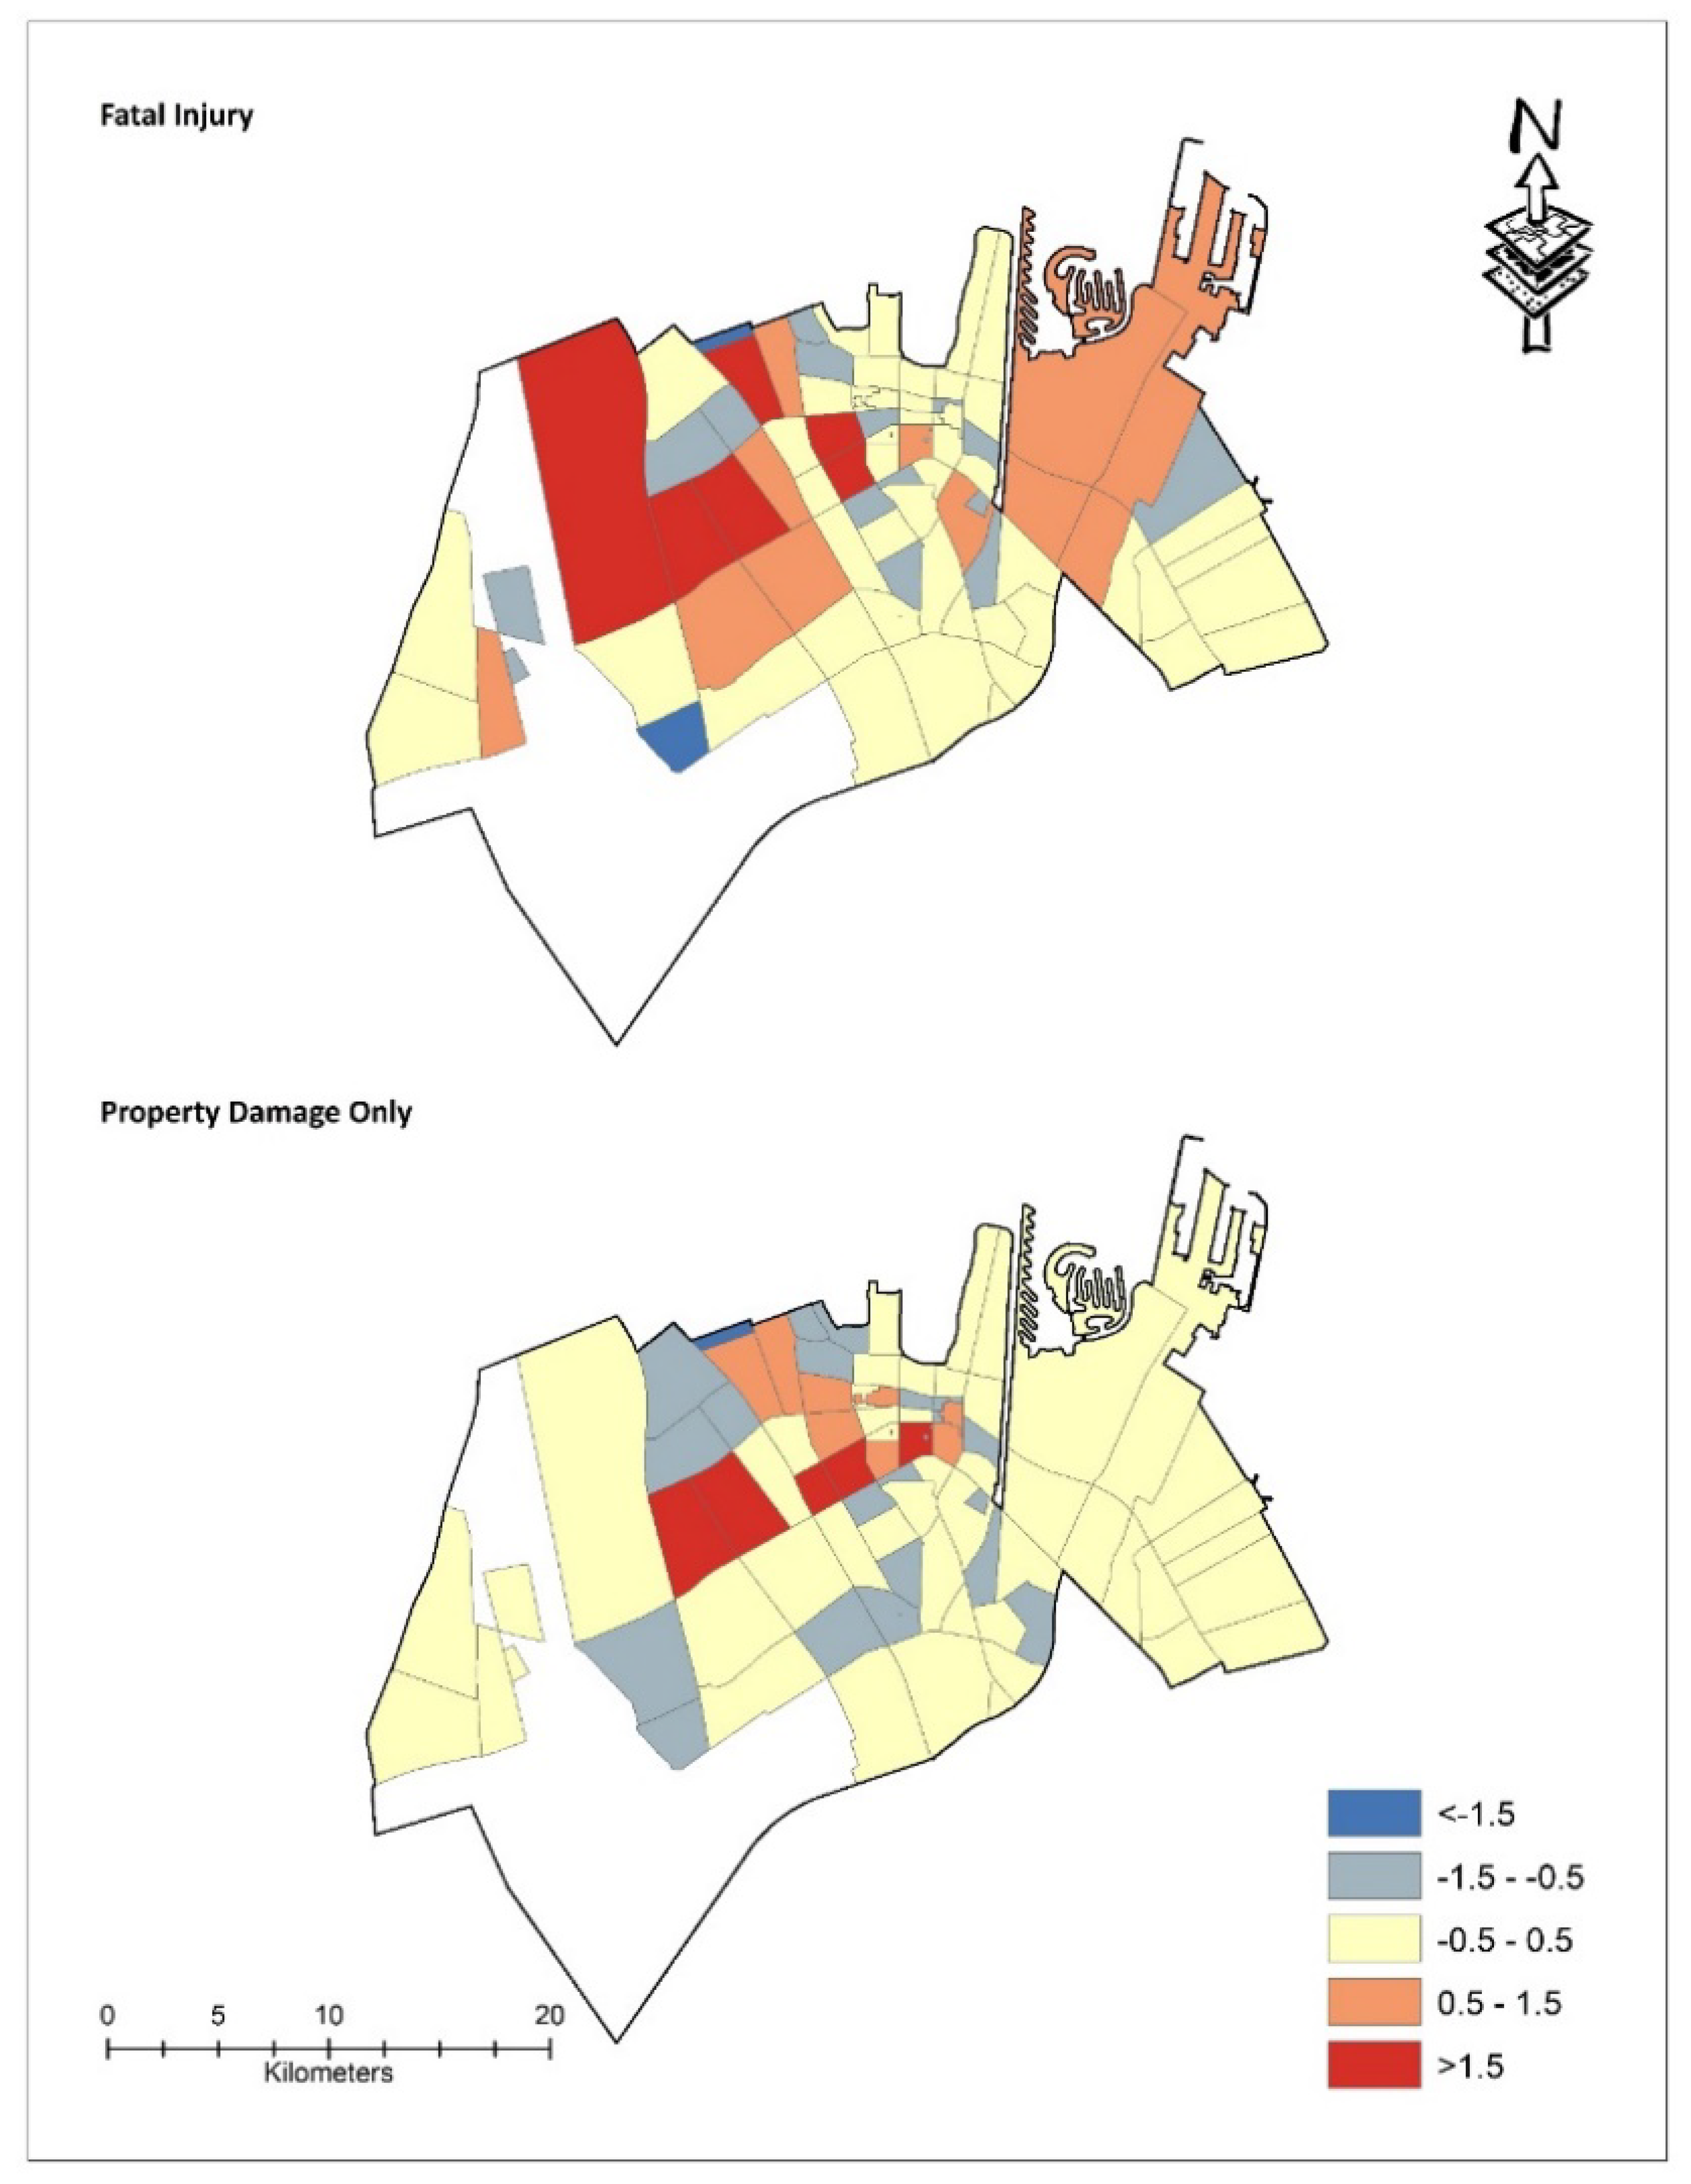
4.3.1. GWR Analysis for Neighborhood Crash Severity

In Figure 7, the SDR values for the relationships between the population and the crash severities (FI and PDO crashes) are presented. It can be seen that fatal and injury (FI) crashes are mainly located in the neighborhoods with residential and mixed residential-commercial land uses where there are relatively high population densities. These neighborhoods are subjected to frequent driving, and the residents are exposed to high traffic while commuting for daily activities. A small proportion of FI crashes also occurred in industrial/employment neighborhoods and zones. Commercial zones have the lowest proportion of these crashes. Property damage only (PDO) crashes are mainly concentrated in residential and industrial/employment land use zones with low population densities and with light and/or slow-moving vehicles. The commercial zones and neighborhoods with public facilities zones have a low share of PDO crashes.

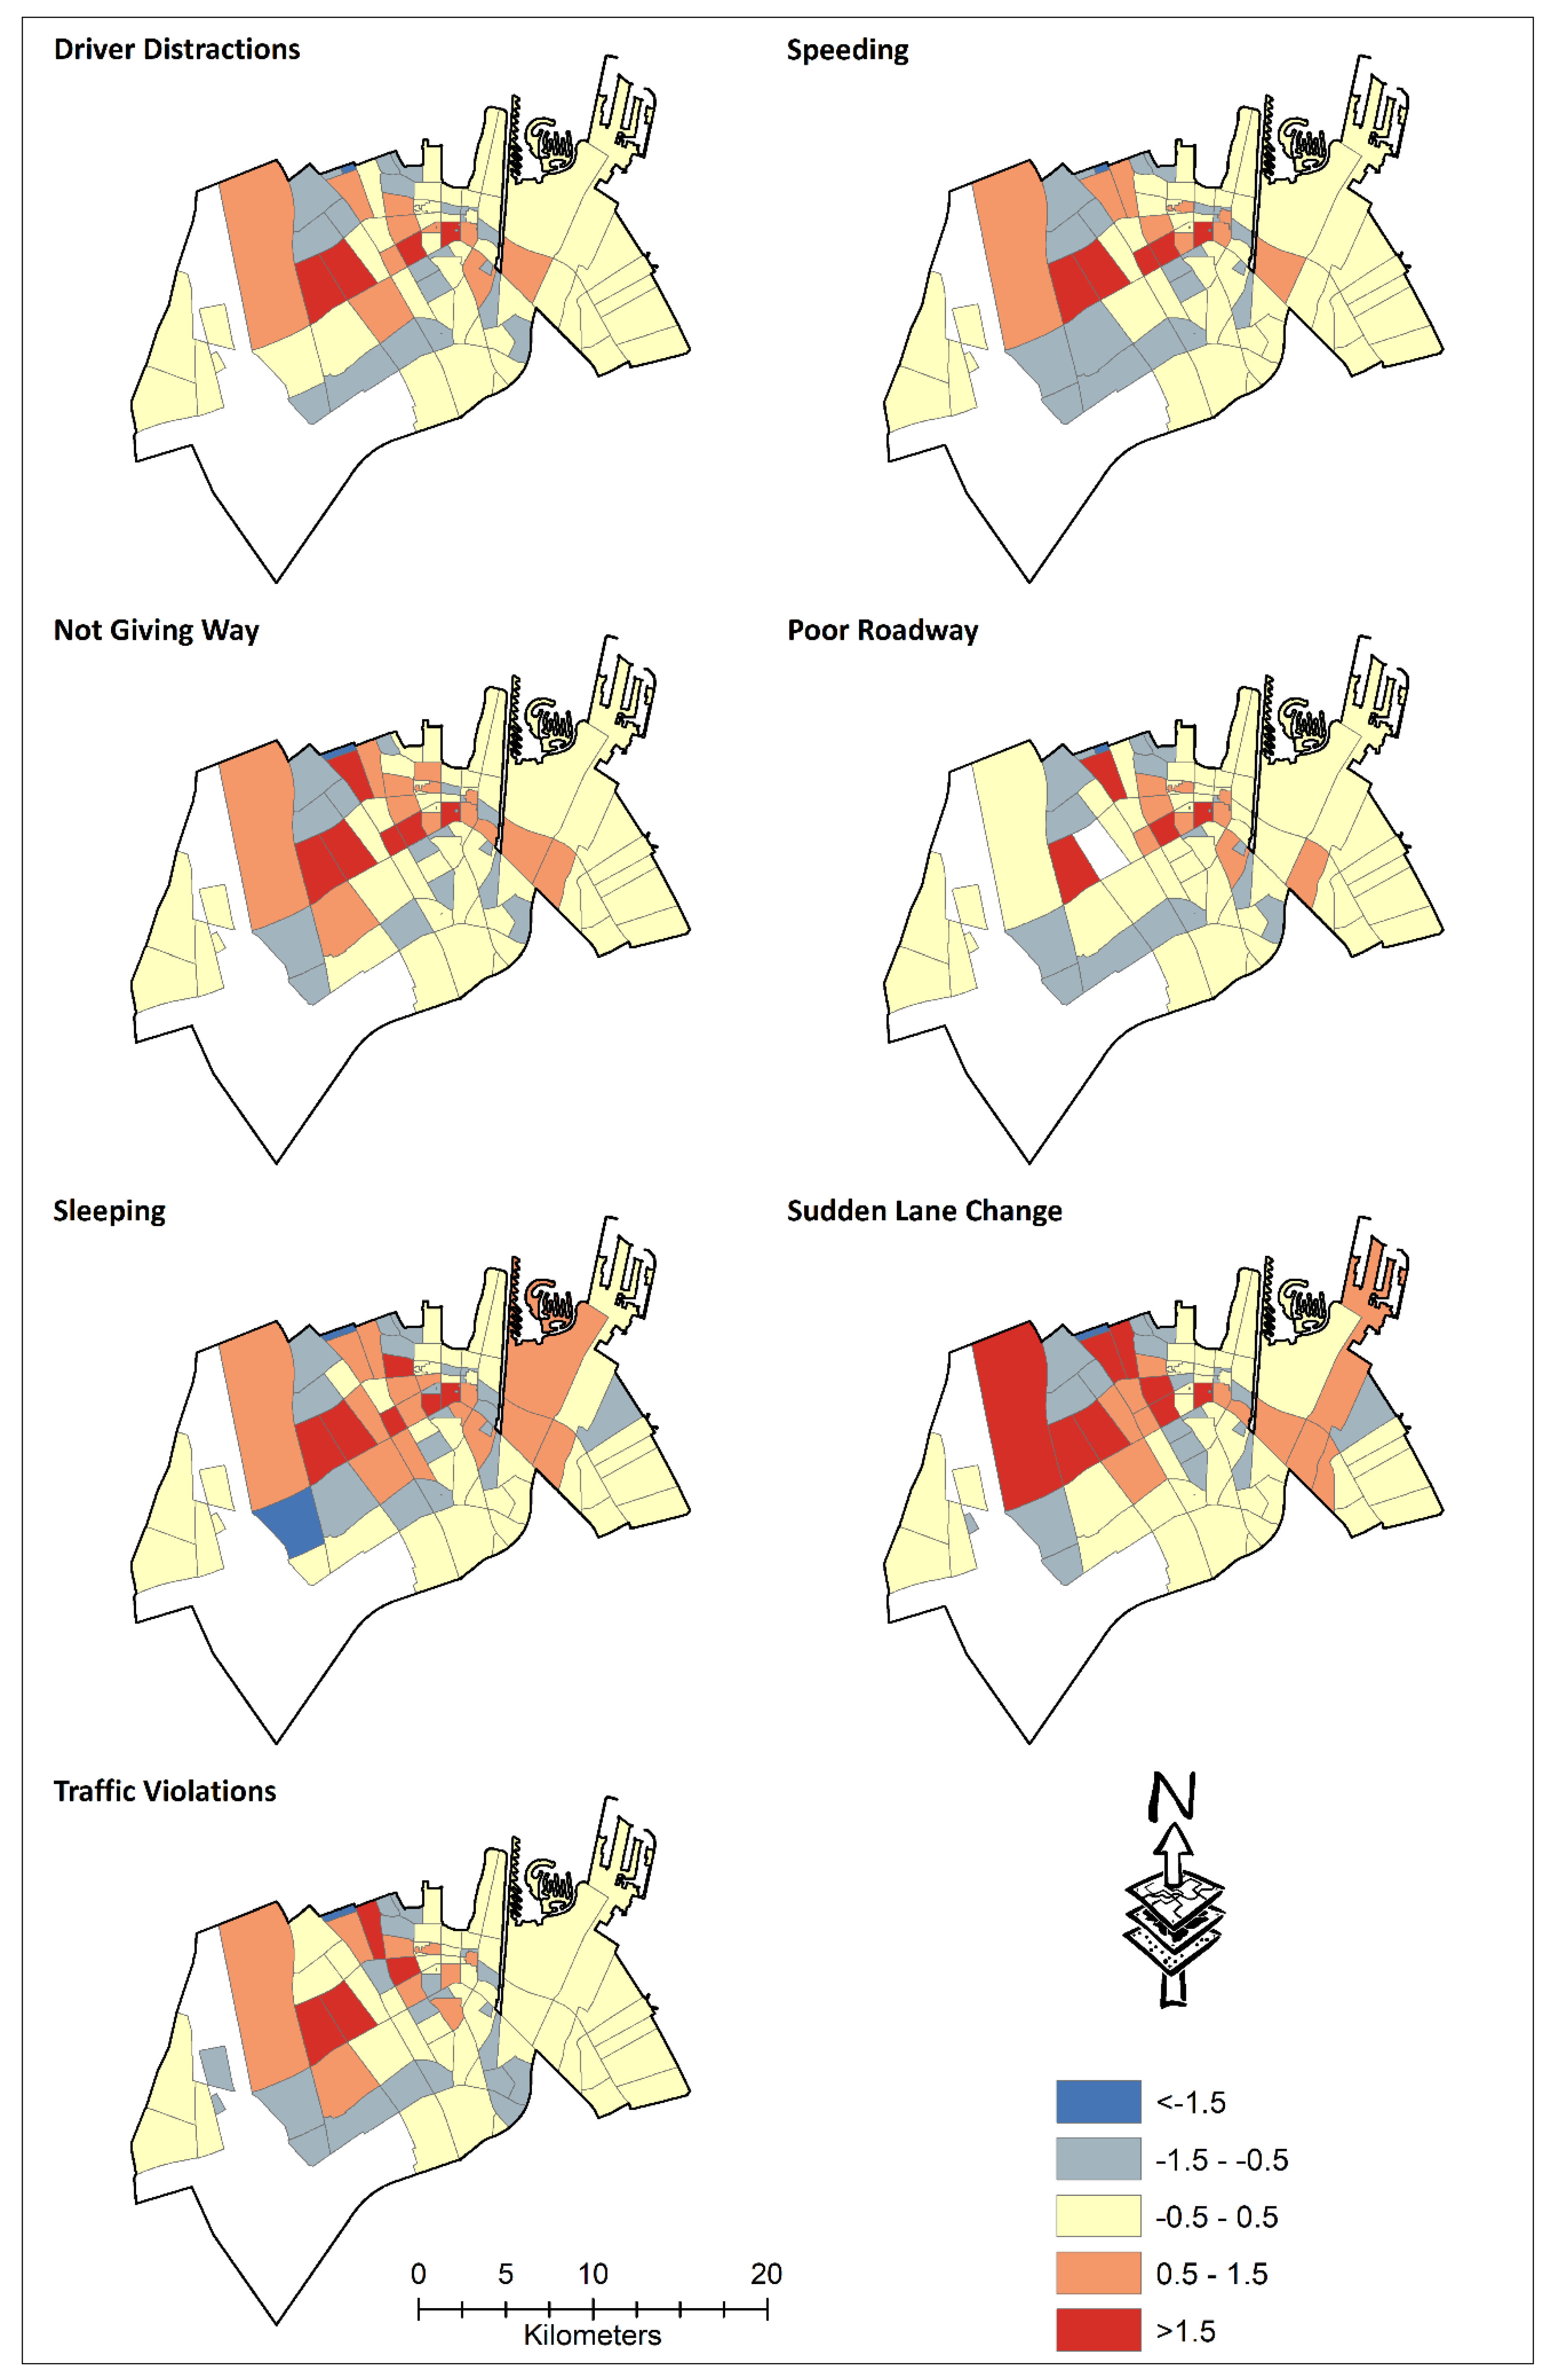
4.3.2. GWR Analysis for Neighborhood Crash Causes

In Figure 8, the GWR analysis for population and predominant crash causes in the study area are shown. It is evident from the figure that distractions, speeding, sleep/fatigue crashes have similar patterns of association with densely populated neighborhoods in the residential areas. Crashes due to sudden lane changes are also more prominent in residential and mixed commercial-residential areas. A small percentage of crashes in residential and industrial/employment zones occurred due to poor roadway and surface conditions.

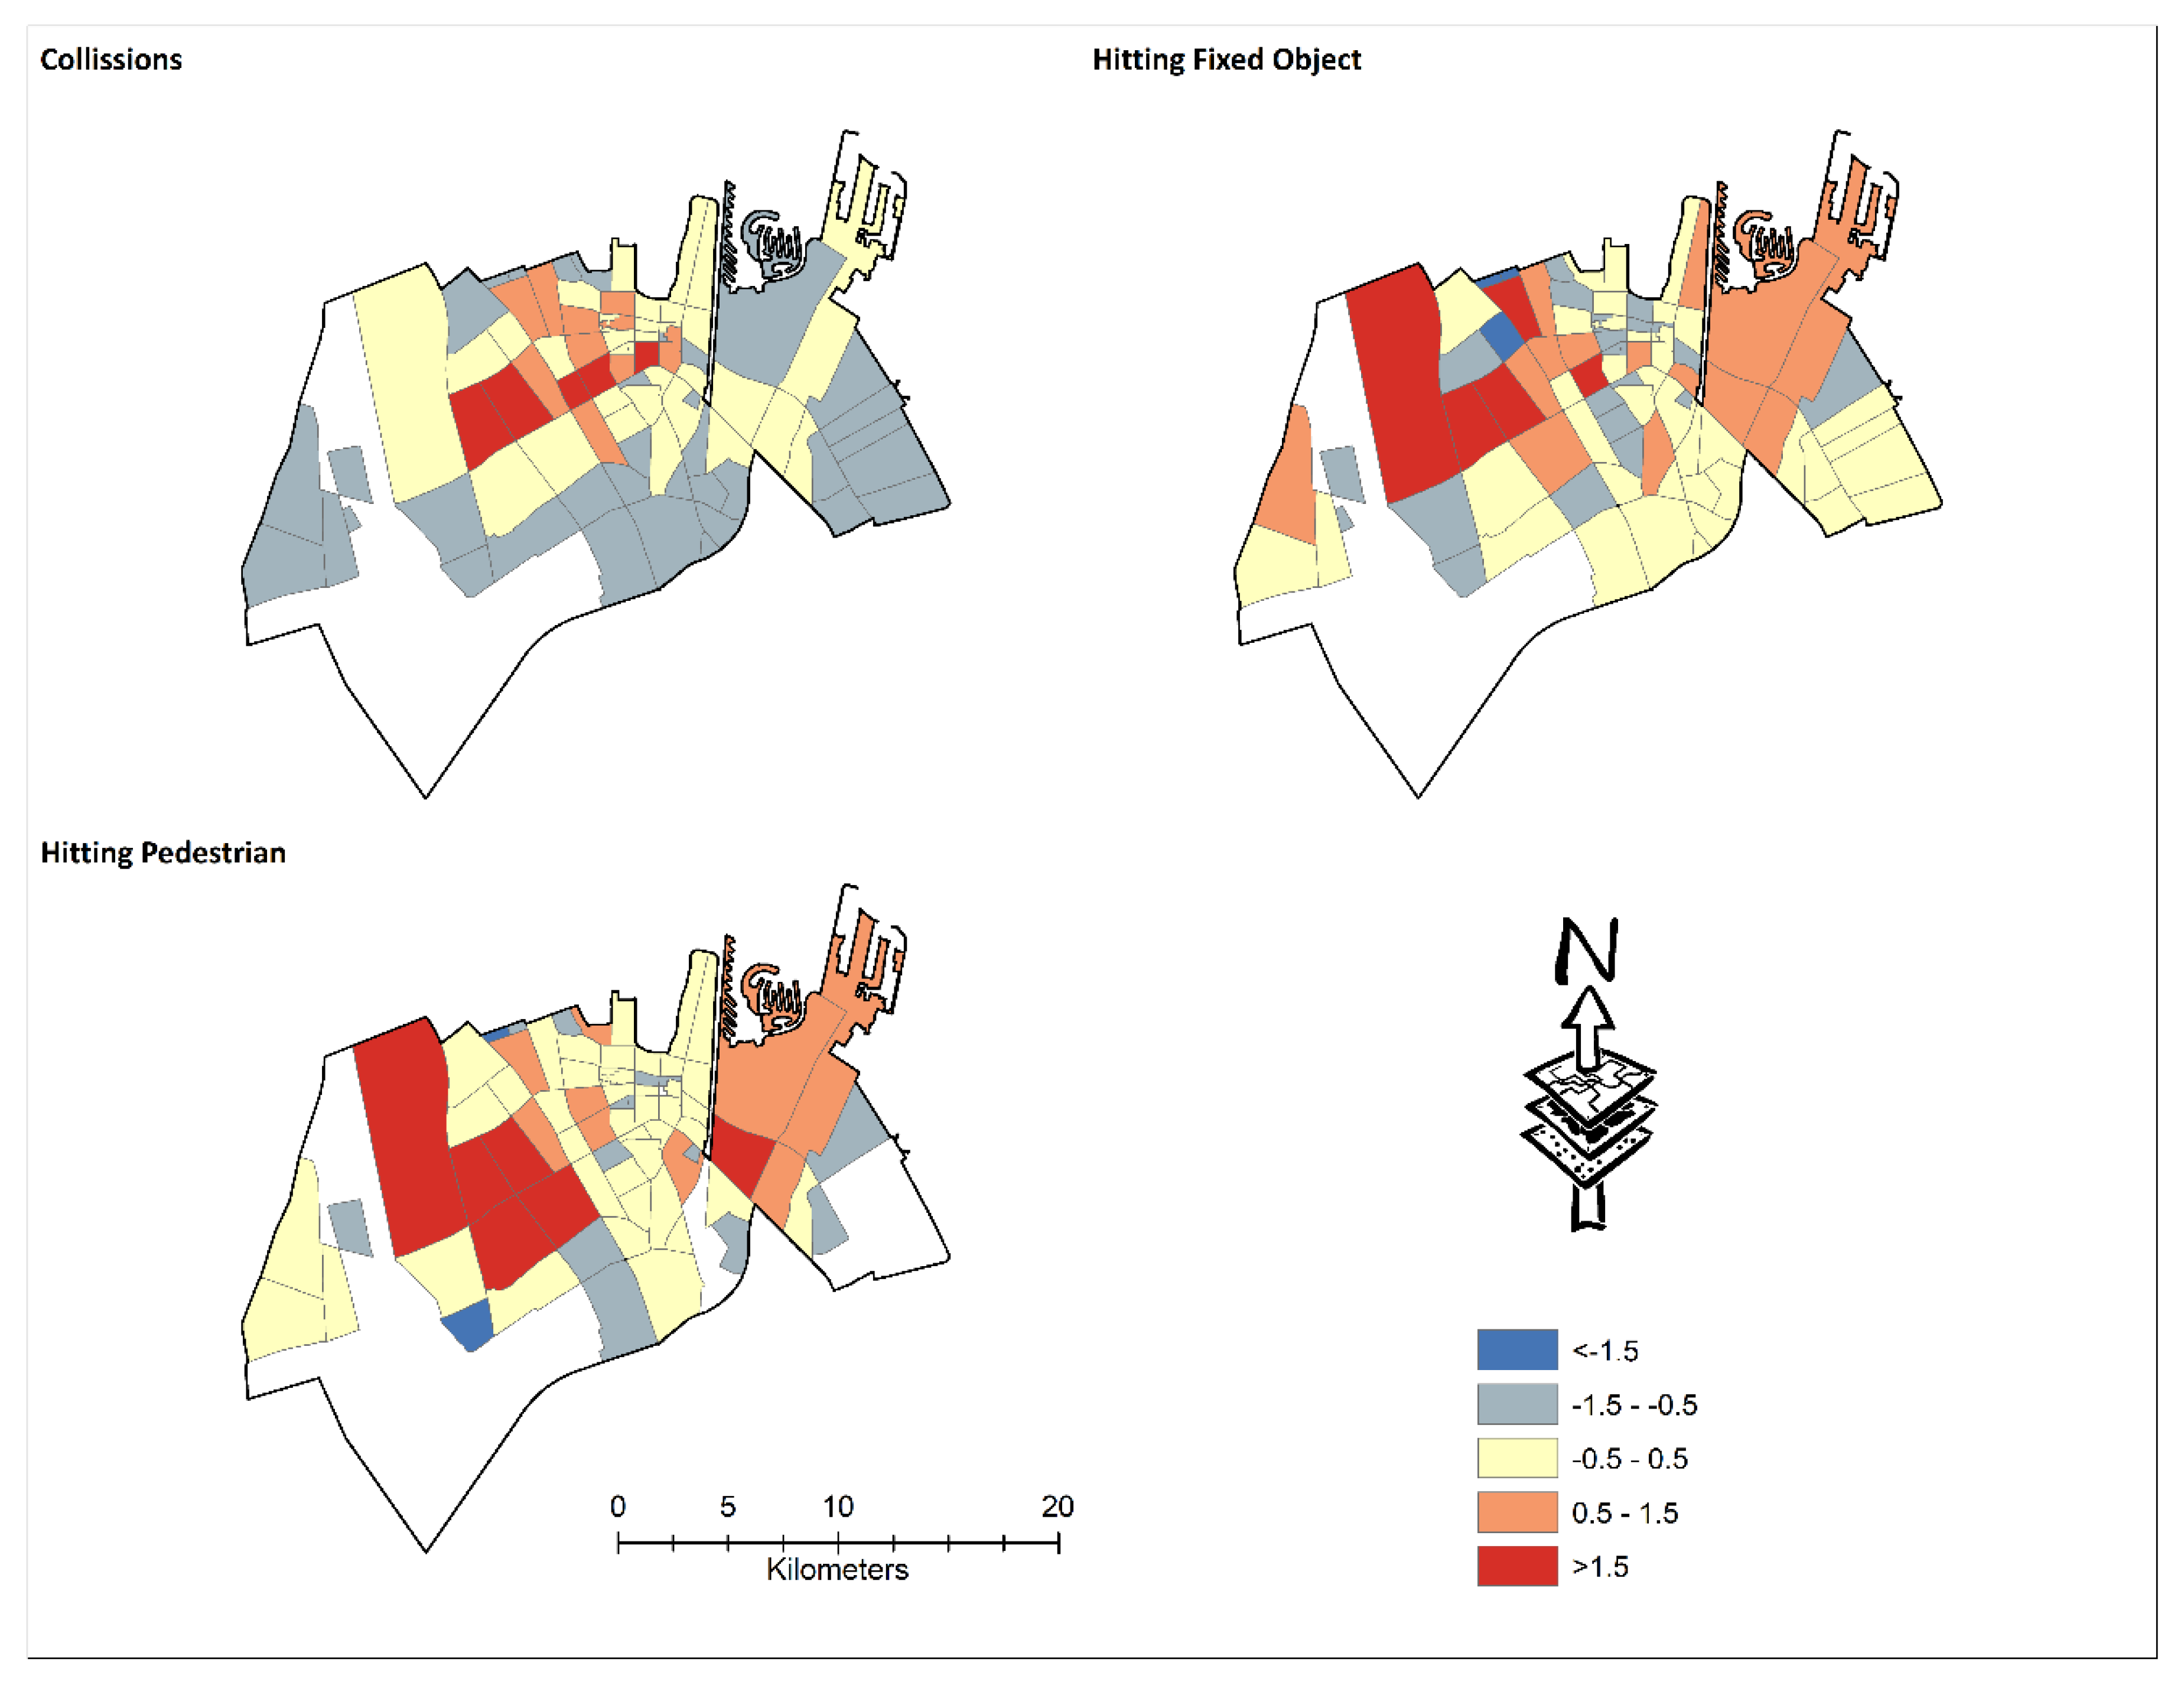
4.3.3. GWR Analysis for Neighborhood Crash Types

Figure 9 portrays the relationship between the population and the distribution of crashes by prevailing crash types. The results show that collisions and hitting fixed objects are predominant in residential neighborhoods with high population densities in the northwestern parts of the study area. The streets are narrow in these areas. The relationship is weak with commercial, mixed commercial-residential, and public facilities. Fixed object crashes have a high positive correlation with sparsely built residential and industrial/employment zones. Mixed commercial-residential and commercial areas in the southeast of the city also have a slight positive affinity with fixed object crashes. Hit pedestrian crashes have a positive association with medium to highly dense residential land use and mixed commercial-residential areas.

5. Conclusions

This study aimed to examine the relationship between traffic crashes with urban population density and land use in the context of the Dammam Metropolitan Area on the eastern coast of the KSA. The GWR analysis was utilized to investigate spatial heterogeneity and non-stationarity of traffic crashes. Crash hotspots and GWR based hazard maps for prevailing crash types, crash causes, and two severity groups (FI and PDO) were developed at the zonal level in the study area. Three crash types and seven predominant crash causes were found significant (>90%) for hotspots mapping. It was found that hotspots for FI crashes were located in residential neighborhoods and near public facility areas with low to medium population densities and along highways with relatively high travel speeds. On the contrary, hotspots for PDO crashes were concentrated in residential and industrial/commercial zones having medium to high-density populations. These areas had significantly high traffic volume with low traveling speed limits. This distribution of hotspots based on crash severity is expected since high population densities in these areas are accompanied by large traffic volumes and low travel speeds, which reduces the chances of severe injuries and fatalities. This observation is consistent with previous studies [27,39,40,41,69]. Lee and Khattak showed that severe crashes are more likely to occur on the outskirts of the city, while low severity crashes are clustered together within the city [69].
Distribution of hotspots and GWR analysis for crash causes revealed that epicenters for crashes considered in this category were located in the CBD of the study area. Crashes due to sudden lane deviation constitute the highest proportion of observed crashes and are mostly located in the residential and mixed commercial-residential areas. Fatigue driving mainly concentrated in medium-density residential and commercial zones accounted for the lowest proportion of crashes in this category. Industrial/employment zones had very few collisions (by all crash causes) when compared to their population densities. Similar observations were also reported by previous studies [42,43]. Similarly, hotspots and GWR analysis by crash types resulted in similar patterns of crash distribution, with CBD being the epicenter for all crash types. Vehicle collisions representing a significant proportion of total crashes were found to be more predominant in high-density residential neighborhoods along with narrow and congested links. However, commercial and public facility zones having low population densities had fewer collisions. Fixed objects and hit pedestrian crashes were prevailing in commercial and mixed commercial and residential areas with medium population densities. A study conducted by Dai et al. reported that pedestrian crashes are clustered together on segments with a greater number of public transit stops, and those located near dense households [70].
Knowledge gained from this study provides useful insights for a better understanding of the complex interrelationship between traffic safety and land use. It can help officials and road safety agencies to pinpoint the high-risk crash locations at the disaggregated level by specific crash characteristics, i.e., crash cause, crash type, and/or crash severity. Such a detailed analysis could also provide essential guidance to policymakers for better planning and management strategies, and efficient use of appropriate resources to enhance the zonal-level safety. One of the drawbacks of the current study is that it did not explicitly include land use in the GWR model. Unfortunately, the percentages of land use within the individual neighborhood were not available, which may be considered in future studies. Future studies could consider the detailed features of the built environment, such as access management tools, pedestrian-oriented tools, and population sociodemographic for assessing spatio-temporal variations of crashes. It would also be interesting to explore the effect of other policy, social, and engineering factors such as police enforcement, traffic arrangements/volumes, infrastructure design, etc., in forthcoming studies. Studies could also compare the performance of GWR with other models such as Bayesian spatial models and ransom parameter model that also account for spatial heterogeneity in identifying crash-prone locations. Finally, studies could focus on a detailed analysis of hotspots for individual vulnerable road users (VRUs) groups such as pedestrians, motorcyclists, etc., in connection with features of the built environment.

Author Contributions

Conceptualization, Muhammad Tauhidur Rahman and Arshad Jamal; methodology, Muhammad Tauhidur Rahman and Arshad Jamal; software, Muhammad Tauhidur Rahman; validation, Arshad Jamal, Hassan M. Al-Ahmadi; formal analysis, Muhammad Tauhidur Rahman and Arshad Jamal; investigation, Arshad Jamal; resources, Muhammad Tauhidur Rahman and Hassan M. Al-Ahmadi.; data curation, Muhammad Tauhidur Rahman and Arshad Jamal; writing—original draft preparation, Muhammad Tauhidur Rahman and Arshad Jamal; writing—review and editing, Muhammad Tauhidur Rahman and Hassan M. Al-Ahmadi; visualization, Arshad Jamal and Hassan M. Al-Ahmadi; supervision, Muhammad Tauhidur Rahman and Hassan M. Al-Ahmadi; project administration, Muhammad Tauhidur Rahman. All authors have read and agreed to the published version of the manuscript.

Funding

This research received no external funding.

Acknowledgments

The authors acknowledge and appreciate the support provided by King Fahd University of Petroleum and Minerals (KFUPM) by providing all the essential resources to conduct this study.

Conflicts of Interest

The authors declare no conflict of interest.

References

  1. World Health Organization. Global Status Report on Road Safety 2018; WHO: Geneva, Switzerland, 2019. [Google Scholar]
  2. Janstrup, K.H. Road Safety Annual Report; OECD Publishing: Paris, France, 2017. [Google Scholar] [CrossRef] [Green Version]
  3. Al Turki, Y.A. How can Saudi Arabia use the Decade of Action for Road Safety to catalyse road traffic injury prevention policy and interventions? Int. J. Inj. Control. Saf. Promot. 2013, 21, 397–402. [Google Scholar] [CrossRef] [PubMed]
  4. Mohamed, H.A. Estimation of socio-economic cost of road accidents in Saudi Arabia: Willingness-to-pay approach (WTP). Adv. Manag. Appl. Econom. 2015, 5, 43. [Google Scholar]
  5. Jamal, A.; Rahman, M.T.; Al-Ahmadi, H.M.; Mansoor, U. The Dilemma of Road Safety in the Eastern Province of Saudi Arabia: Consequences and Prevention Strategies. Int. J. Environ. Res. Public Health 2019, 17, 157. [Google Scholar] [CrossRef] [PubMed] [Green Version]
  6. Gundogdu, I.B. Applying linear analysis methods to GIS-supported procedures for preventing traffic accidents: Case study of Konya. Saf. Sci. 2010, 48, 763–769. [Google Scholar] [CrossRef]
  7. Lord, D.; Washington, S.; Ivan, J. Poisson, Poisson-gamma and zero-inflated regression models of motor vehicle crashes: Balancing statistical fit and theory. Accid. Anal. Prev. 2005, 37, 35–46. [Google Scholar] [CrossRef]
  8. Lord, D.; Mannering, F.L. The statistical analysis of crash-frequency data: A review and assessment of methodological alternatives. Transp. Res. Part A Policy Pract. 2010, 44, 291–305. [Google Scholar] [CrossRef] [Green Version]
  9. Abdulhafedh, A. Road Crash Prediction Models: Different Statistical Modeling Approaches. J. Transp. Technol. 2017, 7, 190–205. [Google Scholar] [CrossRef]
  10. Maher, M.J.; Summersgill, I. A comprehensive methodology for the fitting of predictive accident models. Accid. Anal. Prev. 1996, 28, 281–296. [Google Scholar] [CrossRef]
  11. Miaou, S.-P.; Lum, H. Modeling vehicle accidents and highway geometric design relationships. Accid. Anal. Prev. 1993, 25, 689–709. [Google Scholar] [CrossRef]
  12. Milton, J.; Mannering, F.L. The relationship among highway geometrics, traffic-related elements and motor-vehicle accident frequencies. Transportation 1998, 25, 395–413. [Google Scholar] [CrossRef]
  13. Abdel-Aty, M.; Uddin, N.; Pande, A. Split models for predicting multivehicle crashes during high-speed and low-speed operating conditions on freeways. Transp. Res. Rec. 2005, 1908, 51–58. [Google Scholar] [CrossRef]
  14. Lee, C.; Hellinga, B.; Saccomanno, F. Real-Time Crash Prediction Model for Application to Crash Prevention in Freeway Traffic. Transp. Res. Rec. 2003, 1840, 67–77. [Google Scholar] [CrossRef]
  15. Montella, A. A comparative analysis of hotspot identification methods. Accid. Anal. Prev. 2010, 42, 571–581. [Google Scholar] [CrossRef] [PubMed]
  16. Qu, X.; Meng, Q. A note on hotspot identification for urban expressways. Saf. Sci. 2014, 66, 87–91. [Google Scholar] [CrossRef] [Green Version]
  17. Huang, H.; Chin, H.C.; Haque, M. Empirical Evaluation of Alternative Approaches in Identifying Crash Hot Spots. Transp. Res. Rec. 2009, 2103, 32–41. [Google Scholar] [CrossRef]
  18. Yu, H.; Liu, Z.-H.; Chen, J.; Wang, H. Comparative analysis of the spatial analysis methods for hotspot identification. Accid. Anal. Prev. 2014, 66, 80–88. [Google Scholar] [CrossRef]
  19. Debrabant, B.; Halekoh, U.; Bonat, W.H.; Hansen, D.L.; Hjelmborg, J.B.; Lauritsen, J.M. Identifying traffic accident black spots with Poisson-Tweedie models. Accid. Anal. Prev. 2018, 111, 147–154. [Google Scholar] [CrossRef] [PubMed]
  20. Dong, N.; Huang, H.; Lee, J.; Gao, M.; Abdel-Aty, M. Macroscopic hotspots identification: A Bayesian spatio-temporal interaction approach. Accid. Anal. Prev. 2016, 92, 256–264. [Google Scholar] [CrossRef] [PubMed]
  21. Ghadi, M.; Török, Á. Comparison Different Black Spot Identification Methods. Transp. Res. Procedia 2017, 27, 1105–1112. [Google Scholar] [CrossRef]
  22. Anderson, T.K. Kernel density estimation and K-means clustering to profile road accident hotspots. Accid. Anal. Prev. 2009, 41, 359–364. [Google Scholar] [CrossRef]
  23. Xie, Z.; Yan, J. Detecting traffic accident clusters with network kernel density estimation and local spatial statistics: An integrated approach. J. Transp. Geogr. 2013, 31, 64–71. [Google Scholar] [CrossRef]
  24. Moons, E.; Brijs, T.; Wets, G. Identifying Hazardous Road Locations: Hot Spots versus Hot Zones. In Computer Vision; Springer Science and Business Media LLC: Berlin, Germany, 2009; Volume 5730, pp. 288–300. [Google Scholar]
  25. Shariff, S.R.; Maad, H.A.; Halim, N.N.A.; Derasit, Z. Determining Hotspots of Road Accidents using Spatial Analysis. Indones. J. Electr. Eng. Comput. Sci. 2018, 9, 146–151. [Google Scholar] [CrossRef]
  26. Thakali, L.; Kwon, T.J.; Fu, L. Identification of crash hotspots using kernel density estimation and kriging methods: A comparison. J. Mod. Transp. 2015, 23, 93–106. [Google Scholar] [CrossRef] [Green Version]
  27. Soltani, A.; Askari, S. Exploring spatial autocorrelation of traffic crashes based on severity. Injury 2017, 48, 637–647. [Google Scholar] [CrossRef] [PubMed]
  28. Erdogan, S.; Yilmaz, I.; Baybura, T.; Gullu, M.; Yılmaz, I. Geographical information systems aided traffic accident analysis system case study: City of Afyonkarahisar. Accid. Anal. Prev. 2008, 40, 174–181. [Google Scholar] [CrossRef] [PubMed]
  29. Chen, C.; Li, T.; Sun, J.; Chen, F. Hotspot Identification for Shanghai Expressways Using the Quantitative Risk Assessment Method. Int. J. Environ. Res. Public Health 2016, 14, 20. [Google Scholar] [CrossRef] [PubMed]
  30. Cheng, W.; Washington, S. Experimental evaluation of hotspot identification methods. Accid. Anal. Prev. 2005, 37, 870–881. [Google Scholar] [CrossRef]
  31. Zou, Y.; Zhong, X.; Ash, J.; Zeng, Z.; Wang, Y.; Hao, Y.; Peng, Y. Developing a Clustering-Based Empirical Bayes Analysis Method for Hotspot Identification. J. Adv. Transp. 2017, 2017, 1–9. [Google Scholar] [CrossRef]
  32. Lan, B.; Persaud, B. Fully Bayesian Approach to Investigate and Evaluate Ranking Criteria for Black Spot Identification. Transp. Res. Rec. 2011, 2237, 117–125. [Google Scholar] [CrossRef]
  33. Kim, K.; Yamashita, E. Motor Vehicle Crashes and Land Use: Empirical Analysis from Hawaii. Transp. Res. Rec. 2002, 1784, 73–79. [Google Scholar] [CrossRef]
  34. Zahid, M.; Chen, Y.; Khan, S.; Jamal, A.; Ijaz, M.; Ahmed, T. Predicting Risky and Aggressive Driving Behavior among Taxi Drivers: Do Spatio-Temporal Attributes Matter? Int. J. Environ. Res. Public Health 2020, 17, 3937. [Google Scholar] [CrossRef]
  35. Jamal, A.; Rahman, M.T.; Al-Ahmadi, H.M.; Ullah, H.M.; Zahid, M. Intelligent Intersection Control for Delay Optimization: Using Meta-Heuristic Search Algorithms. Sustainability 2020, 12, 1896. [Google Scholar] [CrossRef] [Green Version]
  36. Elias, W.; Shiftan, Y. The influence of individual’s risk perception and attitudes on travel behavior. Transp. Res. Part A Policy Pract. 2012, 46, 1241–1251. [Google Scholar] [CrossRef]
  37. Zahid, M.; Chen, Y.; Jamal, A.; Al-Ofi, K.A.; Al-Ahmadi, H.M. Adopting Machine Learning and Spatial Analysis Techniques for Driver Risk Assessment: Insights from a Case Study. Int. J. Environ. Res. Public Health 2020, 17, 5193. [Google Scholar] [CrossRef]
  38. Kundakci, E.; Tuydes-Yaman, H. Understanding the Distribution of Traffic Accident Hot Spots in Urban Regions. In Proceedings of the Transportation Research Board 93rd Annual Meeting, Washington, DC, USA, 12–16 January 2014. [Google Scholar]
  39. Ben-Hamouche, M.; Al-janahi, A.; Al-Madani, H. Traffic accidents in Bahrain: A statistical and spatial GIS-based analysis. J. King Saud Univ. 2011, 23, 1–18. [Google Scholar]
  40. Noland, R.B.; Quddus, M. A spatially disaggregate analysis of road casualties in England. Accid. Anal. Prev. 2004, 36, 973–984. [Google Scholar] [CrossRef] [PubMed] [Green Version]
  41. Xie, B.; An, Z.; Zheng, Y.; Li, Z. Incorporating transportation safety into land use planning: Pre-assessment of land use conversion effects on severe crashes in urban China. Appl. Geogr. 2019, 103, 1–11. [Google Scholar] [CrossRef]
  42. Pulugurtha, S.S.; Duddu, V.R.; Kotagiri, Y. Traffic analysis zone level crash estimation models based on land use characteristics. Accid. Anal. Prev. 2013, 50, 678–687. [Google Scholar] [CrossRef]
  43. Yang, B.Z.; Loo, B.P.; Yang, Z. Land use and traffic collisions: A link-attribute analysis using Empirical Bayes method. Accid. Anal. Prev. 2016, 95, 236–249. [Google Scholar] [CrossRef]
  44. Chen, P.; Zhou, J. Effects of the built environment on automobile-involved pedestrian crash frequency and risk. J. Transp. Health 2016, 3, 448–456. [Google Scholar] [CrossRef] [Green Version]
  45. Shafabakhsh, G.A.; Famili, A.; Bahadori, M.S. GIS-based spatial analysis of urban traffic accidents: Case study in Mashhad, Iran. J. Traffic Transp. Eng. 2017, 4, 290–299. [Google Scholar] [CrossRef]
  46. Mohaymany, A.S.; Shahri, M.; Mirbagheri, B. GIS-based method for detecting high-crash-risk road segments using network kernel density estimation. Geo-Spat. Inf. Sci. 2013, 16, 113–119. [Google Scholar] [CrossRef]
  47. Ulak, M.B.; Ozguven, E.E.; Vanli, O.A.; Horner, M.W. Exploring alternative spatial weights to detect crash hotspots. Comput. Environ. Urban Syst. 2019, 78, 101398. [Google Scholar] [CrossRef]
  48. Bíl, M.; Andrášik, R.; Sedoník, J. A detailed spatiotemporal analysis of traffic crash hotspots. Appl. Geogr. 2019, 107, 82–90. [Google Scholar] [CrossRef]
  49. Dereli, M.A.; Erdogan, S. A new model for determining the traffic accident black spots using GIS-aided spatial statistical methods. Transp. Res. Part A Policy Pract. 2017, 103, 106–117. [Google Scholar] [CrossRef]
  50. Yalcin, G.; Duzgun, H.S. Spatial analysis of two-wheeled vehicles traffic crashes: Osmaniye in Turkey. KSCE J. Civ. Eng. 2015, 19, 2225–2232. [Google Scholar] [CrossRef]
  51. Yuan, T.; Zeng, X.; Shi, T. Identifying Urban Road Black Spots with a Novel Method Based on the Firefly Clustering Algorithm and a Geographic Information System. Sustainability 2020, 12, 2091. [Google Scholar] [CrossRef] [Green Version]
  52. Butt, A.; Ahmad, S.S.; Shabbir, R.; Erum, S. GIS based surveillance of road traffic accidents (rta) risk for Rawalpindi city: A geo-statistical approach. Kuwait J. Sci. 2017, 44, 129–134. [Google Scholar]
  53. Le, K.G.; Liu, P.; Lin, L.-T. Determining the road traffic accident hotspots using GIS-based temporal-spatial statistical analytic techniques in Hanoi, Vietnam. Geo-Spat. Inf. Sci. 2019, 1–12. [Google Scholar] [CrossRef] [Green Version]
  54. Zheng, L.; Robinson, R.M.; Khattak, A.; Wang, X. All accidents are not equal: Using geographically weighted regressions models to assess and forecast accident impacts. In Proceedings of the 3rd International Conference on Road Safety and Simulation, Indianapolis, IN, USA, 14–16 September 2011; pp. 14–16. [Google Scholar]
  55. Soroori, E.; Moghaddam, A.M.; Salehi, M. Modeling spatial nonstationary and overdispersed crash data: Development and comparative analysis of global and geographically weighted regression models applied to macrolevel injury crash data. J. Transp. Saf. Secur. 2020, 1–25. [Google Scholar] [CrossRef]
  56. Li, Z.; Wang, W.; Liu, Z.-H.; Bigham, J.M.; Ragland, D.R. Using Geographically Weighted Poisson Regression for county-level crash modeling in California. Saf. Sci. 2013, 58, 89–97. [Google Scholar] [CrossRef]
  57. Li, Z.; Lee, Y.; Lee, S.H.; Valiou, E. Geographically-Weighted Regression Models for Improved Predictability of Urban Intersection Vehicle Crashes. In Proceedings of the Transportation and Development Institute Congress 2011: Integrated Transportation and Development for a Better Tomorrow, Chicago, IL, USA, 13–16 March 2011; pp. 1315–1329. [Google Scholar]
  58. Pirdavani, A.; Brijs, T.; Bellemans, T.; Wets, G. Spatial analysis of fatal and injury crashes in Flanders, Belgium: Application of geographically weighted regression technique. In Proceedings of the 92th Annual Meeting of Transportation Research Board, Washington, DC, USA, 13–17 January 2013. [Google Scholar]
  59. Li, L.; Zhu, L.; Sui, D.Z. A GIS-based Bayesian approach for analyzing spatial–temporal patterns of intra-city motor vehicle crashes. J. Transp. Geogr. 2007, 15, 274–285. [Google Scholar] [CrossRef]
  60. Huang, Y.; Wang, X.; Patton, D. Examining spatial relationships between crashes and the built environment: A geographically weighted regression approach. J. Transp. Geogr. 2018, 69, 221–233. [Google Scholar] [CrossRef]
  61. Ye, Y.; Zuo, Z.; Yuan, X.; Zhang, S.; Zeng, X.; An, Y.; Chen, B. Geographically weighted regression model for urban traffic black-spot analysis. In Proceedings of the 2017 IEEE International Geoscience and Remote Sensing Symposium (IGARSS), Forth Worth, TX, USA, 23–28 July 2017; pp. 4866–4869. [Google Scholar]
  62. Rahman, M.T.; Aldosary, A.S.; Mortoja, G. Modeling Future Land Cover Changes and Their Effects on the Land Surface Temperatures in the Saudi Arabian Eastern Coastal City of Dammam. Land 2017, 6, 36. [Google Scholar] [CrossRef]
  63. General Authority for Statistics Population Statistics Kingdom of Saudi Arabia: Population Statistics by Areas. Available online: https://www.stats.gov.sa/en/43 (accessed on 15 July 2020).
  64. Traffic General Directorate. Number of Registered Vehicles in the Kingdom by Region; General Authority for Statistics: Riyadh, Saudi Arabia, 2018.
  65. Rahman, M.T.; Nahiduzzaman, K.M. Examining the Walking Accessibility, Willingness, and Travel Conditions of Residents in Saudi Cities. Int. J. Environ. Res. Public Health 2019, 16, 545. [Google Scholar] [CrossRef] [Green Version]
  66. Iyanda, A.E.; Osayomi, T. Is there a relationship between economic indicators and road fatalities in Texas? A multiscale geographically weighted regression analysis. GeoJournal 2020. [Google Scholar] [CrossRef]
  67. Ratrout, N. Tire condition and drivers’ practice in maintaining tires in Saudi Arabia. Accid. Anal. Prev. 2005, 37, 201–206. [Google Scholar] [CrossRef]
  68. Gazzete, S. Tire Blowouts Cause 30 Percent of Accidents on Saudi Roads: 2013. Available online: https://saudigazette.com.sa/article/58576 (accessed on 3 September 2020).
  69. Lee, M.; Khattak, A.J. Case Study of Crash Severity Spatial Pattern Identification in Hot Spot Analysis. Transp. Res. Rec. J. Transp. Res. Board 2019, 2673, 684–695. [Google Scholar] [CrossRef]
  70. Dai, D.; Jaworski, D. Influence of built environment on pedestrian crashes: A network-based GIS analysis. Appl. Geogr. 2016, 73, 53–61. [Google Scholar] [CrossRef]
Figure 1. Study area within the City of Dammam.
Ijgi 09 00540 g001
Figure 2. Population and land use map of the study area.
Ijgi 09 00540 g002
Figure 3. Temporal distribution of crashes in the study area (2009–2016): (a) crashes, injuries, and fatalities versus time, (b) mean monthly crashes versus time, (c) mean weekday/weekend crashes versus time, (d) mean hourly crashes versus time.
Ijgi 09 00540 g003aIjgi 09 00540 g003bIjgi 09 00540 g003c
Figure 4. Distribution of hotspots by crash severity: property damage only (PDO) (top); fatal and injury (FI) (bottom).
Ijgi 09 00540 g004
Figure 5. Distribution of hotspots by crash causes.
Ijgi 09 00540 g005
Figure 6. Distribution of hotspots by crash types.
Ijgi 09 00540 g006
Figure 7. Distribution of the standard deviations of the residuals (SDR) values for crash severity distribution.
Ijgi 09 00540 g007
Figure 8. Distribution of the SDR values for different crash causes.
Ijgi 09 00540 g008
Figure 9. Distribution of the SDR values for different crash types.
Ijgi 09 00540 g009
Table 1. Nearest neighbor index (NNI) values and the number of incidences within each hotspot zones.
VariablesNo. of IncidencesObserved Mean Distance (m)Mean/Expected Random Distance (m)NNIZ-Value# of Incidences Within Hotspot Zones% of Incidences Within the Hotspot Zones
Crash Severity
FI2706102.9203.950.50−50.3284131.1
PDO883348.52112.850.43−102.48470053.2
Crash Types
Collisions790248.72119.310.41−100.60421053.3
Fixed object1479141.65275.770.51−35.7825417.2
Hit pedestrians900206.29353.710.58−23.9117419.3
Crash Causes
Driver distraction966182.20345.540.53−27.7629330.3
Sudden lane change321182.52187.220.44−60.60141043.9
Not giving way252999.39212.830.47−58.8496238.0
Speeding1920118.13243.630.49−42.9089046.4
Sleeping657217.40415.980.52−23.2913119.9
Poor roadway1430141.78282.640.50−35.7753137.1
Traffic violations786212.58375.900.56−23.4522428.5

