A Gamification-Based Approach on Indoor Wayfinding Research


Department of Geography, Ghent University, 9000 Ghent, Belgium
*
Author to whom correspondence should be addressed.
ISPRS Int. J. Geo-Inf. 2020, 9(7), 423; https://doi.org/10.3390/ijgi9070423
Submission received: 30 May 2020
/
Revised: 22 June 2020
/
Accepted: 26 June 2020
/
Published: 30 June 2020
(This article belongs to the Special Issue Gaming and Geospatial Information)
Abstract
:Indoor environments can be very complex. Due to the challenges in these environments in combination with the absence of mobile wayfinding aids, a great need exists for innovative research on indoor wayfinding. In this explorative study, a game was developed in Unity to investigate whether the concept of gamification could be used in studies on indoor wayfinding so as to provide useful information regarding the link between wayfinding performance, personal characteristics, and building layout. Results show a significant difference between gamers and non-gamers as the complexity of the player movement has an important impact on the navigation velocity in the game. However, further analysis reveals that the architectural layout also has an impact on the navigation velocity and that wrong turns in the game are influenced by the landmarks at the decision points: navigating at deeper decision points in convex spaces is slower and landmarks of the categories pictograms and infrastructural were more effective in this particular building. Therefore, this explorative study, which provides an approach for the use of gamification in indoor wayfinding research, has shown that serious games could be successfully used as a medium for data acquisition related to indoor wayfinding in a virtual environment.
1. Introduction
Buildings are typically characterized by a much smaller scale level and a higher degree of detail compared to outdoor environments. Additionally, the field of vision is much more limited, and indoor environments can vary a lot more in size and shape. As a result, building complexity can possibly lead to a loss of orientation, and indoor wayfinding is more complex compared to wayfinding in large outdoor areas. Due to the challenges in these indoor environments, in combination with the absence of mobile wayfinding aids, there is a great need for innovative research on indoor wayfinding. Therefore, the concept of big data has recently become very important due to both the amount of available data and the speed in which these could be collected. Big data create opportunities and challenges for a data analysis with the aim of acquiring useful information for various purposes. One of these purposes is wayfinding research, in particular in the indoor wayfinding domain. In this domain, a new possibility for data acquisition has recently emerged, called gamification. This technique includes a relatively new concept that is defined as the use of game design elements in non-game contexts [1]. Several studies have tried to gain a better insight in cognitive route planning and communication for indoor wayfinding. The use of gamification for indoor wayfinding, however, is still in its initial phase, requiring more research on its opportunities in scientific studies.
Therefore, this explorative study used a gamified approach to collect data on the user’s wayfinding capabilities. The game was developed from scratch, and this study covers all facets of gamification research from the game design to data analysis. This way, both the possibilities and weaknesses of this technique are explored, and the results could help future researchers who are considering gamification for data acquisition.
1.1. Indoor Environments and Spatial Cognition
Regarding research on wayfinding, the term legibility is often used in the literature. It is mainly used in studies on indoor wayfinding and, according to Weisman [2], defined as how easily individuals find their way in an indoor environment. In the study by Weisman [2], three different factors are named that determine the legibility. These factors are differentiation of appearance, visual access, and layout complexity, which are all closely related to the concept of gamification since they could be easily adjusted in the virtual environment of a game.
As for differentiation of appearance, landmarks can be seen as the key to the process of planning movement in a goal-oriented and efficient way, often called wayfinding. In the study by Passini [3], wayfinding is also described as a dynamic process, involving complex human behavior and various cognitive skills. Planning and executing a route indoors might prove challenging. It involves a decision-making process whereby possible routes and/or route segments are appraised and selected in order to reach a certain destination [4]. To illustrate this process, Downs and Stea [5] described a four-step framework consisting of orientation, route selection, route control, and recognition of destination. Firstly, orientation means locating oneself with respect to nearby orientation points (i.e., landmarks) and the chosen destination. Secondly, the most optimal route is selected to reach a destination as effortlessly and efficiently as possible [4]. Thirdly, route control is the constant verification that an individual is following the selected route by linking the environmental representation with reality by the presence of corresponding features in the environment (e.g., landmarks). Fourthly, a person must be aware that he/she has reached the chosen destination in order to conclude this wayfinding process [4,5]. Important to note is that landmarks are the key to this process of comprehending the spatial structure of a building, constructing a mental map, and recognizing locations and orientation. They structure the human cognitive map of the environment and are used to reason about spatial information in a simplified way. Therefore, they are irrefutably important during indoor wayfinding [6].
As for visual access and layout complexity, the study by Viaene [6] emphasizes that a building imposes specific wayfinding challenges and that the process of planning movement in a goal-oriented and efficient way is often troublesome in an indoor environment. In order to better understand wayfinding behavior in such environments, a method called space syntax could be used. It covers three elementary aspects of wayfinding: access graphs, axial maps, and isovist (or visibility) fields [7]. In general, space syntax provides formal descriptions through quantitative methods and it indicates the spatial intelligibility of a space, also described as the property of the space, that allows an observer to understand it in such a way as to be able to find his or her way [8]. So as to meet the specific needs, different methods of space syntax have been introduced. The ones mostly used include the inter connectivity density (ICD), visibility graph analysis (VGA), and isovists [9]. The latter has been used in different studies, for example, the research by Wiener and Franz [10] correlating environmental characteristics with wayfinders’ spatial preferences.
Furthermore, personal characteristics could influence wayfinding behavior and have an effect on the manner in which people experience space [11]. In different studies, the effects of gender, age, and familiarity with the building have been applied to investigate the differences between user groups. For example, the study by De Cock et al. [12] includes personal factors and relates decision point characteristics to the perceived complexity of indoor wayfinding.
Where most algorithms in indoor wayfinding systems are limited to the currently known shortest path algorithms, recent studies tried to gain a better insight into the cognitive route planning by means of online surveys or real-life experiments [13,14]. However, they make use of traditional research mediums that have a number of disadvantages. In the real-life experiments, the number of participants is limited, while in the online surveys, the participants are not really immersed in the environment. The game aspect could solve both problems, as it attracts more participants and those participants are more involved in the task at hand.
1.2. Conceptualizing Gamification
Although there is no universal definition of gamification, the definition of Deterding et al. [1] is widely accepted and refers to gamification as the use of game design elements in non-game contexts. Zichermann and Cunningham [15] suggest gamification is to establish brand, engage users, and influence their behavior by using game mechanics in areas other than traditional gaming contexts. It is important to note that alternative terms have also been used for gamification, such as serious games [16]. Deterding et al. [1] separate gamification from serious games and describe them as the design of full-fledged games for non-entertainment purposes. Kapp [16], however, considers the use of serious games as a form of gamification that he defines as a careful and considered application of game thinking to solve problems and encourage learning using all the elements of games that are appropriate. This shows that the boundary between a serious game and gamification can often be small and is somewhat empirical and subjective: is Foursquare a game or a gamified application? Whether someone “plays” or “uses” Foursquare is a matter of perception, so there is a lack of an unambiguous definition for the concept of gamification. The end result of gamification may or may not be a fully-fledged game and players may use it in different ways [17]. Moreover, gamification is more about motivating people to take actions [1], perhaps in a structured way, and follow specific rules to achieve variable outcomes.
In this study, the use of a serious game in scientific research was considered as a form of gamification and thus a specific subset of the concept. A serious game was created to facilitate data acquisition for scientific research in the indoor wayfinding domain. While some participants may experience the serious game as fun and a form of entertainment, others may see it purely as participation in a scientific study based on the principle of a gamified application.
1.3. Relevant Work
Although the concept is relatively new in scientific research, the practice of gamification has probably been used for as long as games have existed. Before 2002, gamification was barely known, but recently it has been recognized as a powerful tool for data acquisition and a training application in several research domains. During the past decade, applications such as Foursquare went viral, with millions of downloads, and gamification became a popular technique so as to support the user engagement in game-based applications. Recently, it has also become a more popular subject for academic inquiry, which is reflected in the growing amount of research during the past ten years [18].
The user data of gamified mobile applications provide a large data source and offer a number of opportunities for scientific studies. Researchers identified, for example, that the creation of competition combined with a reward system (e.g., receiving coins in the mobile Swarm game) is a promising method to motivate and retain volunteers [19]. In addition, regarding data acquisition for scientific research, gamification applications utilize such a reward system, which is commonly related to the use of badges as rewards [20].
The healthcare domain furthermore investigates the manner in which serious games could be used for the rehabilitation of spatial wayfinding after brain damage. The work represented in [21], for example, focuses on virtual sessions including various wayfinding exercises in the form of a serious game combined with psychological support offered by a domain specialist. Another interesting work in the healthcare domain is the so called Sea Hero Quest mobile game, a multi-platform adventure game designed specifically to help advance the understanding of loss in spatial navigation, and therefore understand one of the first symptoms of dementia [22].
As for scientific research within geography, the use of gamification and serious games provides interesting opportunities for research on movement behavior and wayfinding. Existing studies already applied volunteered geographical information (VGI) of a gamified platform, in particular Foursquare data, to conduct research on mobility and travel behavior [23]. Furthermore, the study by McKenzie [24] learns that the Foursquare game-based data could be utilized to identify the frequently visited and, in other words, popular locations in a specific area. Unlike our serious game, the use of outdoor environments is one of the main themes in literature regarding gamified applications and research on wayfinding behavior. The work represented in [25,26], for example, investigates how so called mobile geogames can support users to enhance their map comprehension, orientation, and wayfinding skills in urban areas. By developing the Ori-Gami app, the authors mainly focus on spatial literacy, also known as the skill of learning about and improving interaction with one’s surroundings as a key competency to be acquired in geography education [26]. The work represented in [27,28,29,30] are examples of additional mobile geogames with purposes including data acquisition, leisure, and education related to the geography subject.
Regarding indoor environments, related work often focuses on building design for human-aware environments by creating a gamified process of crowd simulation, path traces, and heatmaps of evacuation dynamics [31,32]. These works are examples of analysis tools to assist architects and designers in generating and analyzing human-aware design options. By providing a means to implement the design process as gamified levels with built-in architectural constraints, a planner, environment designer, or architect can convert a design problem into a playable game to provide a fun and interactive collaborative platform for architectural building design.
1.4. Research Goal
While related work on wayfinding mainly makes use of gamification for research in large outdoor areas [25,26,33], this study focused on the more challenging indoor environment. Therefore, the goal of this research was to develop a serious indoor navigation game in the Unity 3D software development kit. In the first step, the wayfinding data was collected from several participants who played the game. Next, this study investigated whether an analysis of the acquired data could result in useful information regarding the link between wayfinding performance, personal characteristics, and building layout in an indoor environment. By doing so, this study might provide new insights for further research and the use of serious games in terms of scientific research on indoor wayfinding.
2. Materials and Methods
2.1. Unity Game Development
2.1.1. Game Concept
In order to play the game, called “Indoor Navigation Simulator”, participants needed to create an account by following a registration process. The next step was logging into the game, where the goal of the game was explained first and a tutorial could be played so as to get a better feeling of the control system. Participants, namely students and staff of the Geography Department, had to play three different levels. The order in which the participants needed to play was randomized, each level covered a different part of the building, and all levels had the same difficulty. Each level started by showing the participants an instruction video, in which they saw an avatar navigating through the indoor environment and following a planned route from the origin to the destination. Participants could only watch this video once, and before watching, they were given a hint to look at recognizable environmental features. The ultimate goal of the game was to walk the same route as in the instruction video, as fast as possible, so as to obtain a high score in the ranking.
2.1.2. Registration and Questionnaire
The first step in the game development was the design of a registration scene in which personal information of the participants could be acquired by use of a basic questionnaire. In this scene, the participants choose a user name and are asked for their age and study discipline. Additionally, the participants are asked two questions: Do you often have trouble with indoor wayfinding and do you often play videogames? Every participant received a unique ID, which was important for the storage of the data whilst playing the game. Important to note is that if the participants played multiple times, the data were always related to their unique ID. The participants were not able to play without completing the registration and log-in. To ensure this, the play button could only be clicked when the participants had completed their game log-in. Furthermore, the input verification was implemented in the registration scene, obligating the participants to answer all the questions before being able to register.
2.1.3. Virtual Environment
The second step in the game development was designing a virtual environment. This environment was established in Autodesk AutoCAD and consisted of a single floor with a reception, cafeteria, and a varying amount of rooms based on an existing hospital floor. The dimensions were designed in such a way that a normally scaled avatar could easily pass and navigate through the building within an acceptable time. Figure 1 represents the designed floorplan of the indoor environment, including the used dimensions in meters on a scale of 1:300.
In order to create a realistic environment, different game objects were added in the Unity 3D environment. The doors and stairs were implemented in the game and the floor was given a material with a wooden texture. Various artificial lights were set up and the stairs had a metallic texture. Furthermore, the roof was attached, including various domes, to give the participants a realistic indoor feeling while wayfinding. Important to note is that the link with reality was still very small and the used model was only a simplified version of the building. Therefore, information about participants being familiar with the building was not taken into account, nor were participants informed about the origin of the environment.
2.1.4. Avatar Implementation and Player Movement
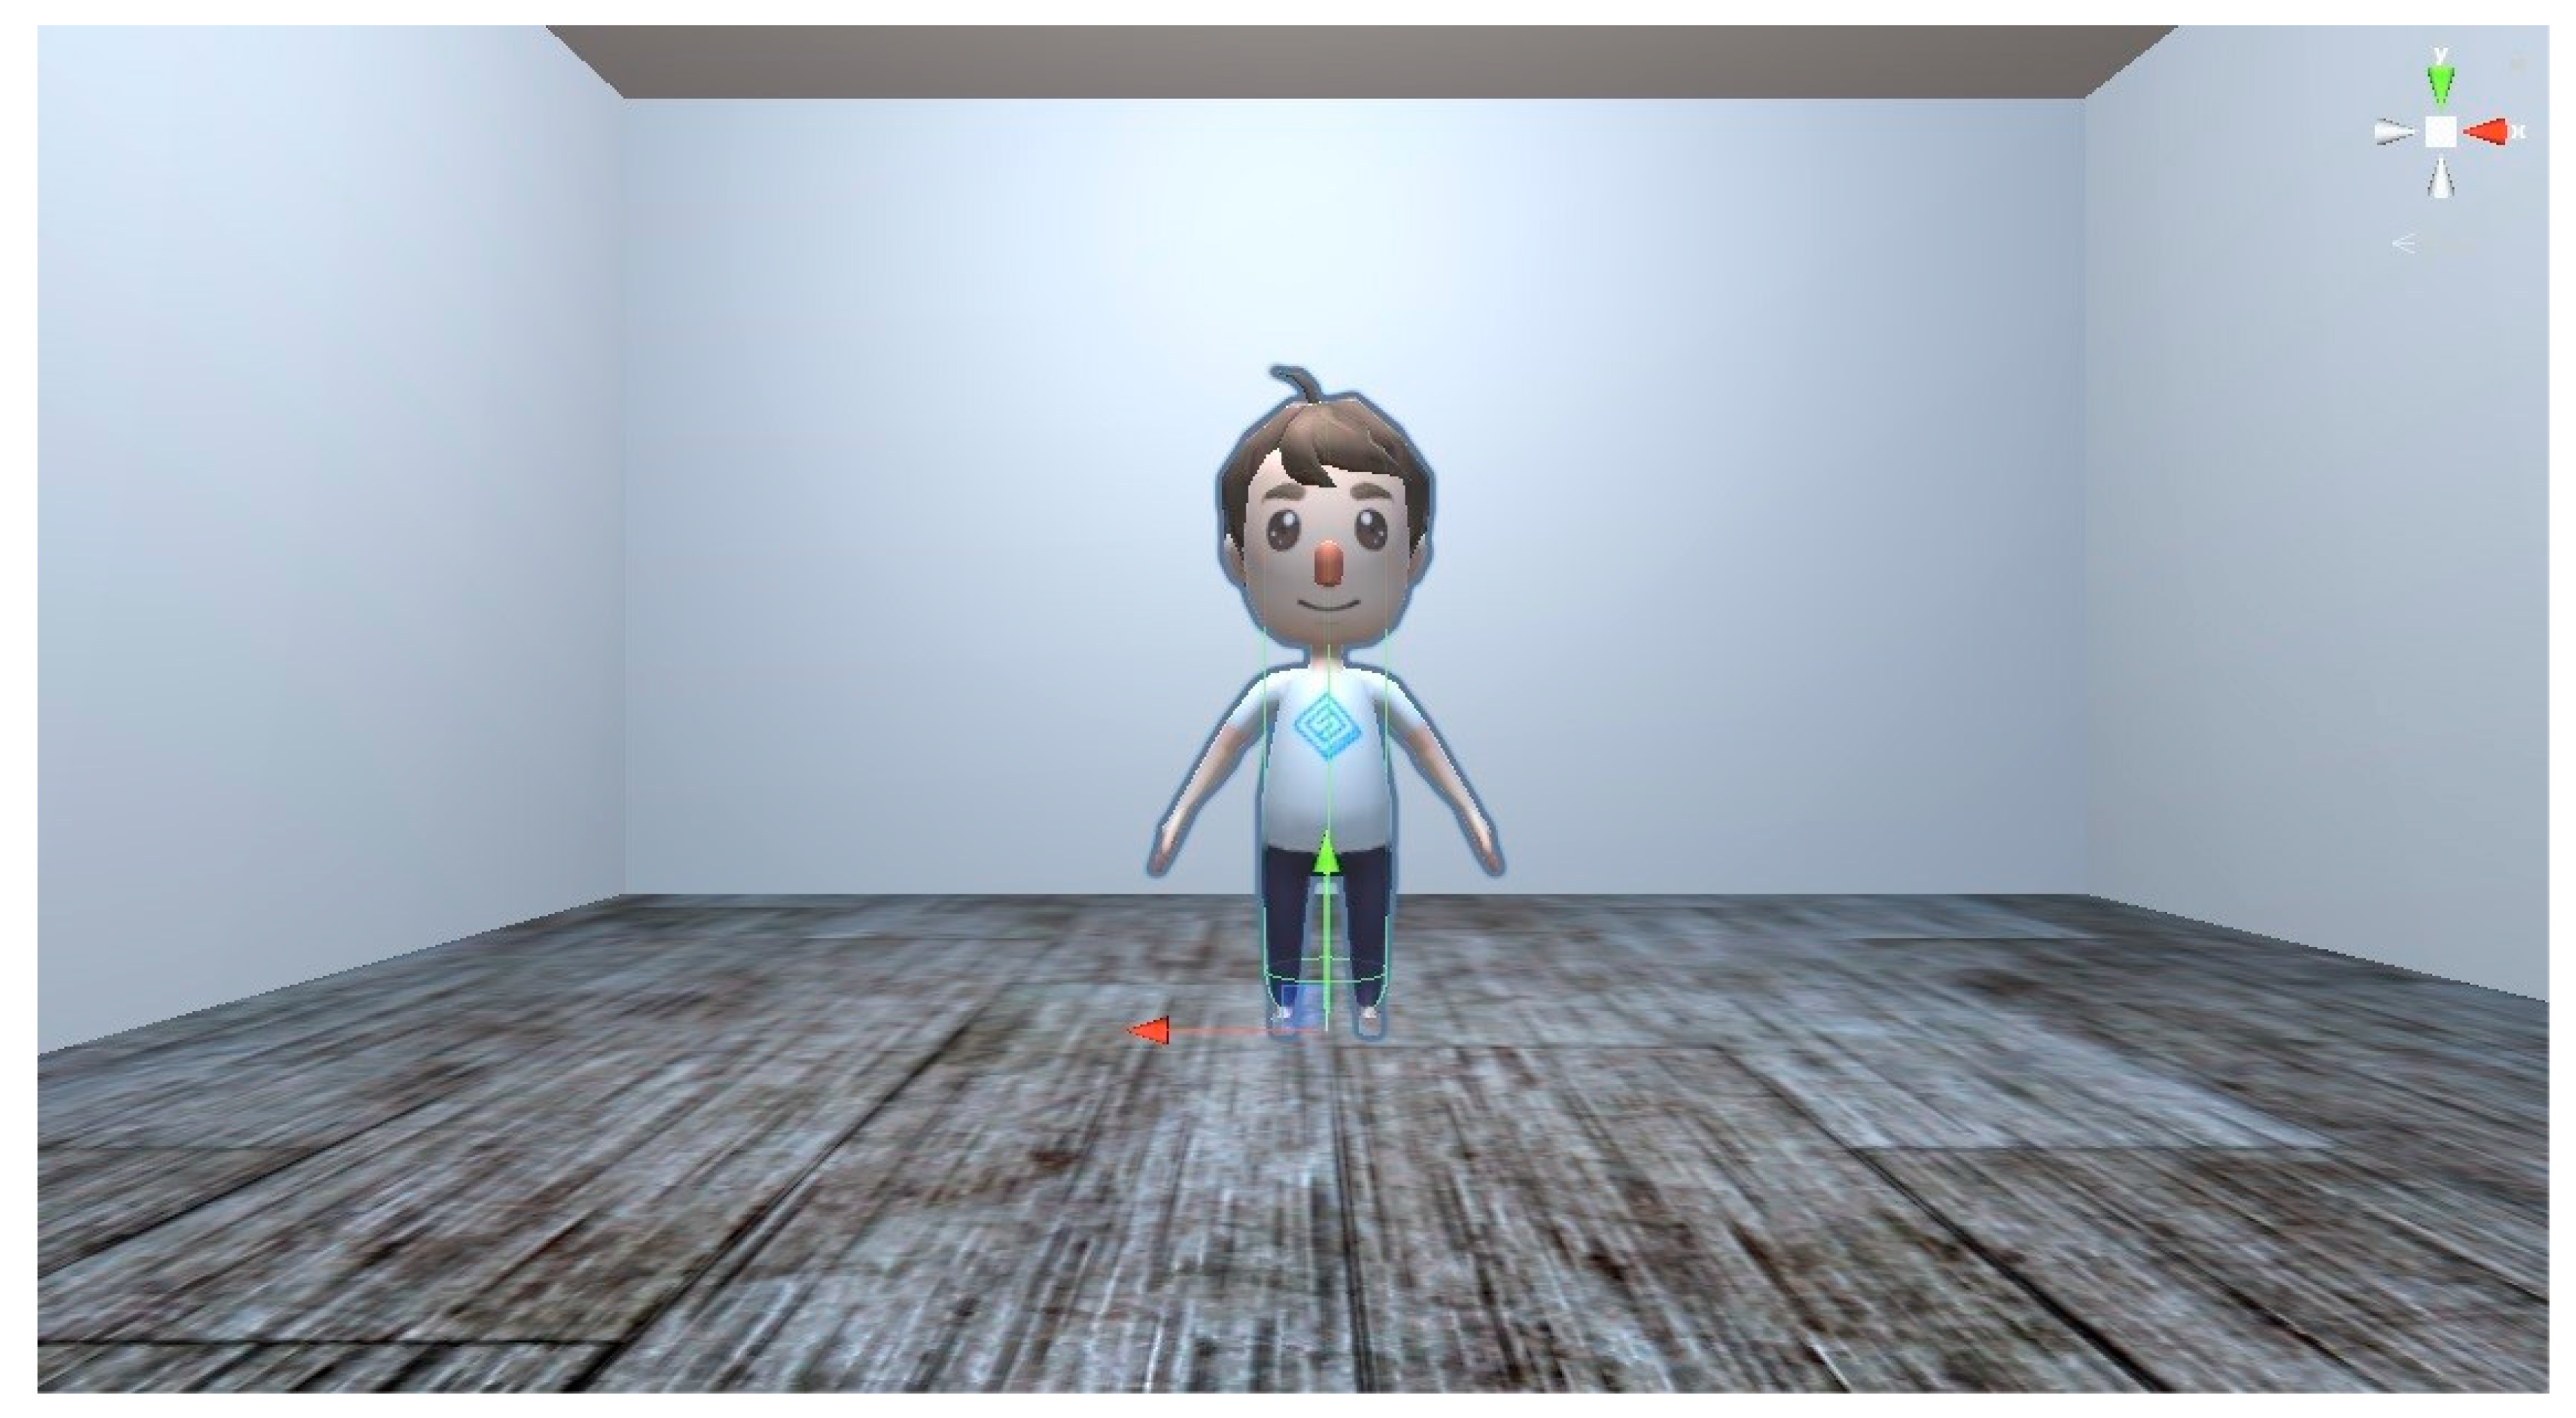
The third step was the implementation of an avatar and his movement so as to give the participants the opportunity to navigate through the building. For this study, an animation figure was used as the avatar, imported from the Unity asset store. The avatar was given realistic characteristics such as the influence of gravity as a result of a so-called rigidbody. To make sure the avatar was not pulled through the surface or could not walk through the walls, a mesh collider was applied to both the avatar and the 3D-model of the building. By doing so, one of the game boundaries was created that made movement through walls impossible. Furthermore, the scripting interface of the rigidbody was applied to add forces to the avatar and to control it in a physically realistic way. The forward and backward forces, linked to the input of the forward and backward arrow key, respectively, were scripted and appended to the avatar. These forces were combined with the rotation of the avatar, linked to the input of the left or right arrow keys, and employed to implement the player movement in the game. Figure 2 illustrates the used avatar and includes information on the orientation of the x- and y-axes of the local coordinate reference system used in the Unity. The acquisition and storage of data is further explained in the next section.
2.1.5. Level Development
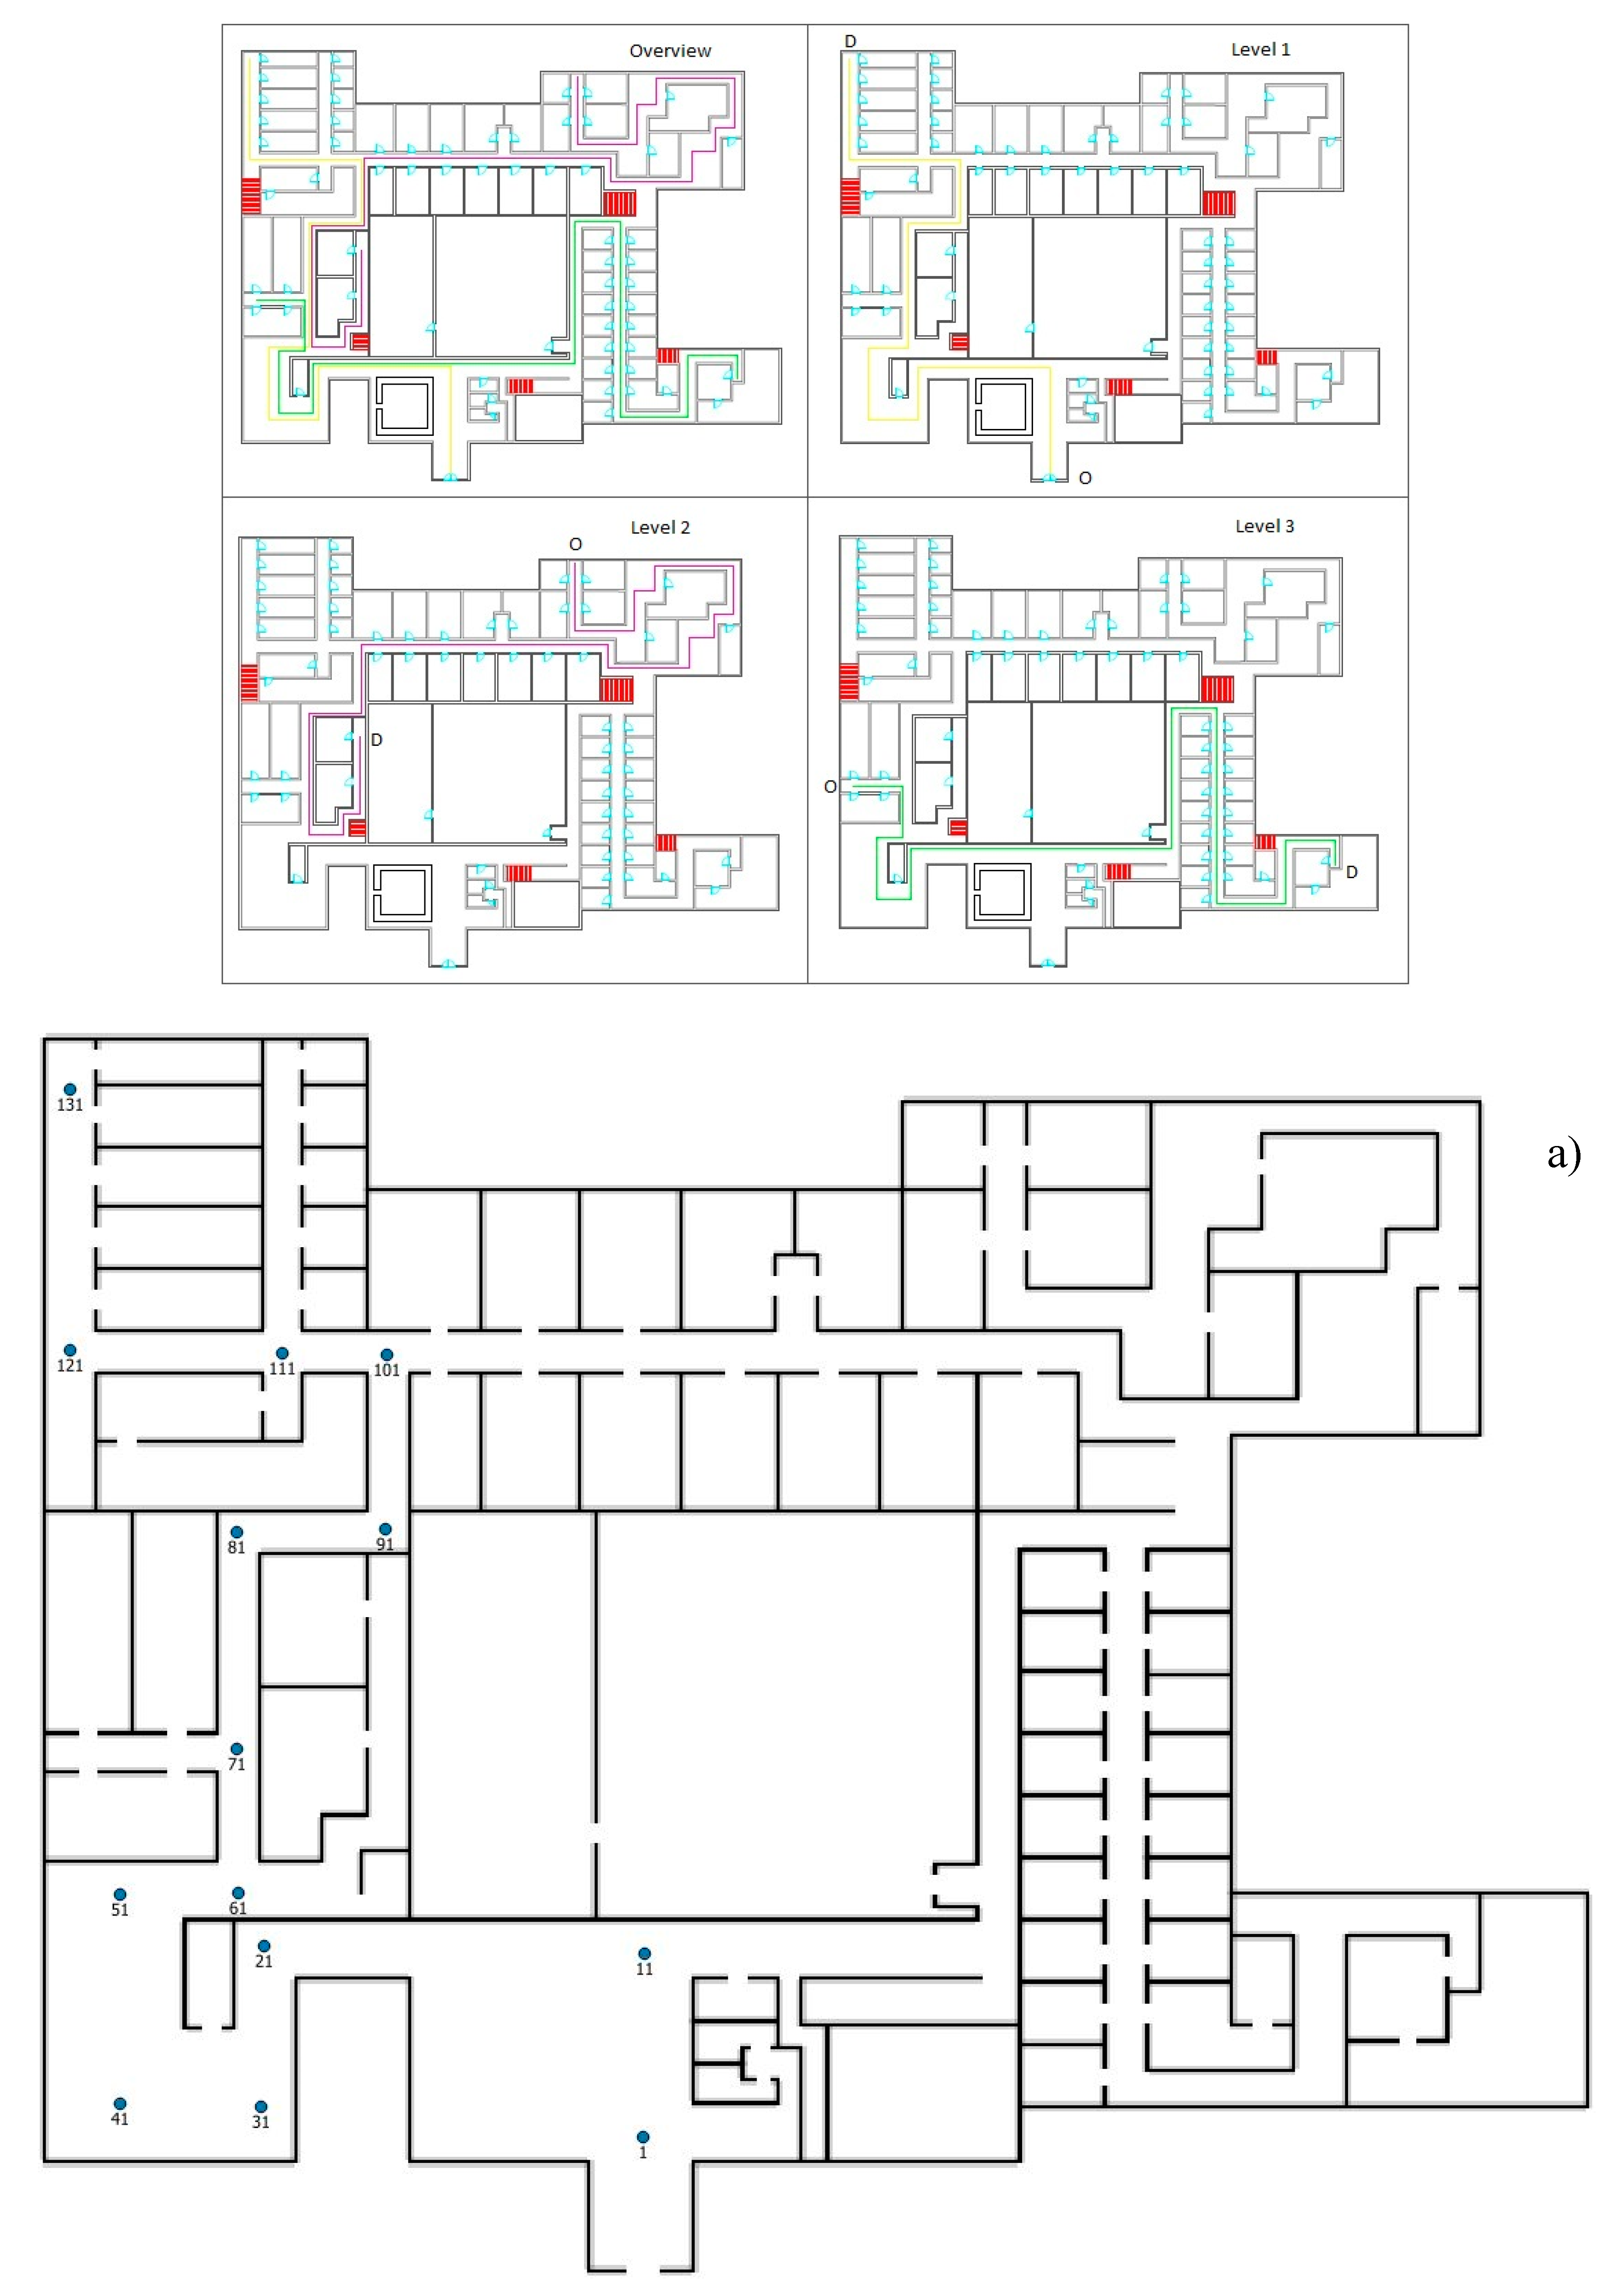
In the fourth step, based on the floor plan of the building (Figure 1), three different routes were developed that completely cover the building. Some parts of the routes overlapped, so players could approach certain decision points from different directions, depending on the level. Each route had approximately the same length and, therefore, featured a similar level of difficulty. During each level, the position of the player’s avatar was extracted, and the participants were tracked by storing their x-, y-, and z-coordinates together with a timestamp in a PgAdmin database. To be able to link this data to the routes and decision points (DP) in the building, invisible triggers were put after each decision point. These triggers were set as box colliders that enabled the “OnTriggerEnter” function. A script was created that automatically increased the DP integer by one if a collision between the avatar and a trigger occurred. Starting from zero, the decision point value kept increasing until the last trigger in a level was reached. The latter was called the end trigger, which automatically reset the decision point integer to zero, stored information into the database, and started the next scene in the game.
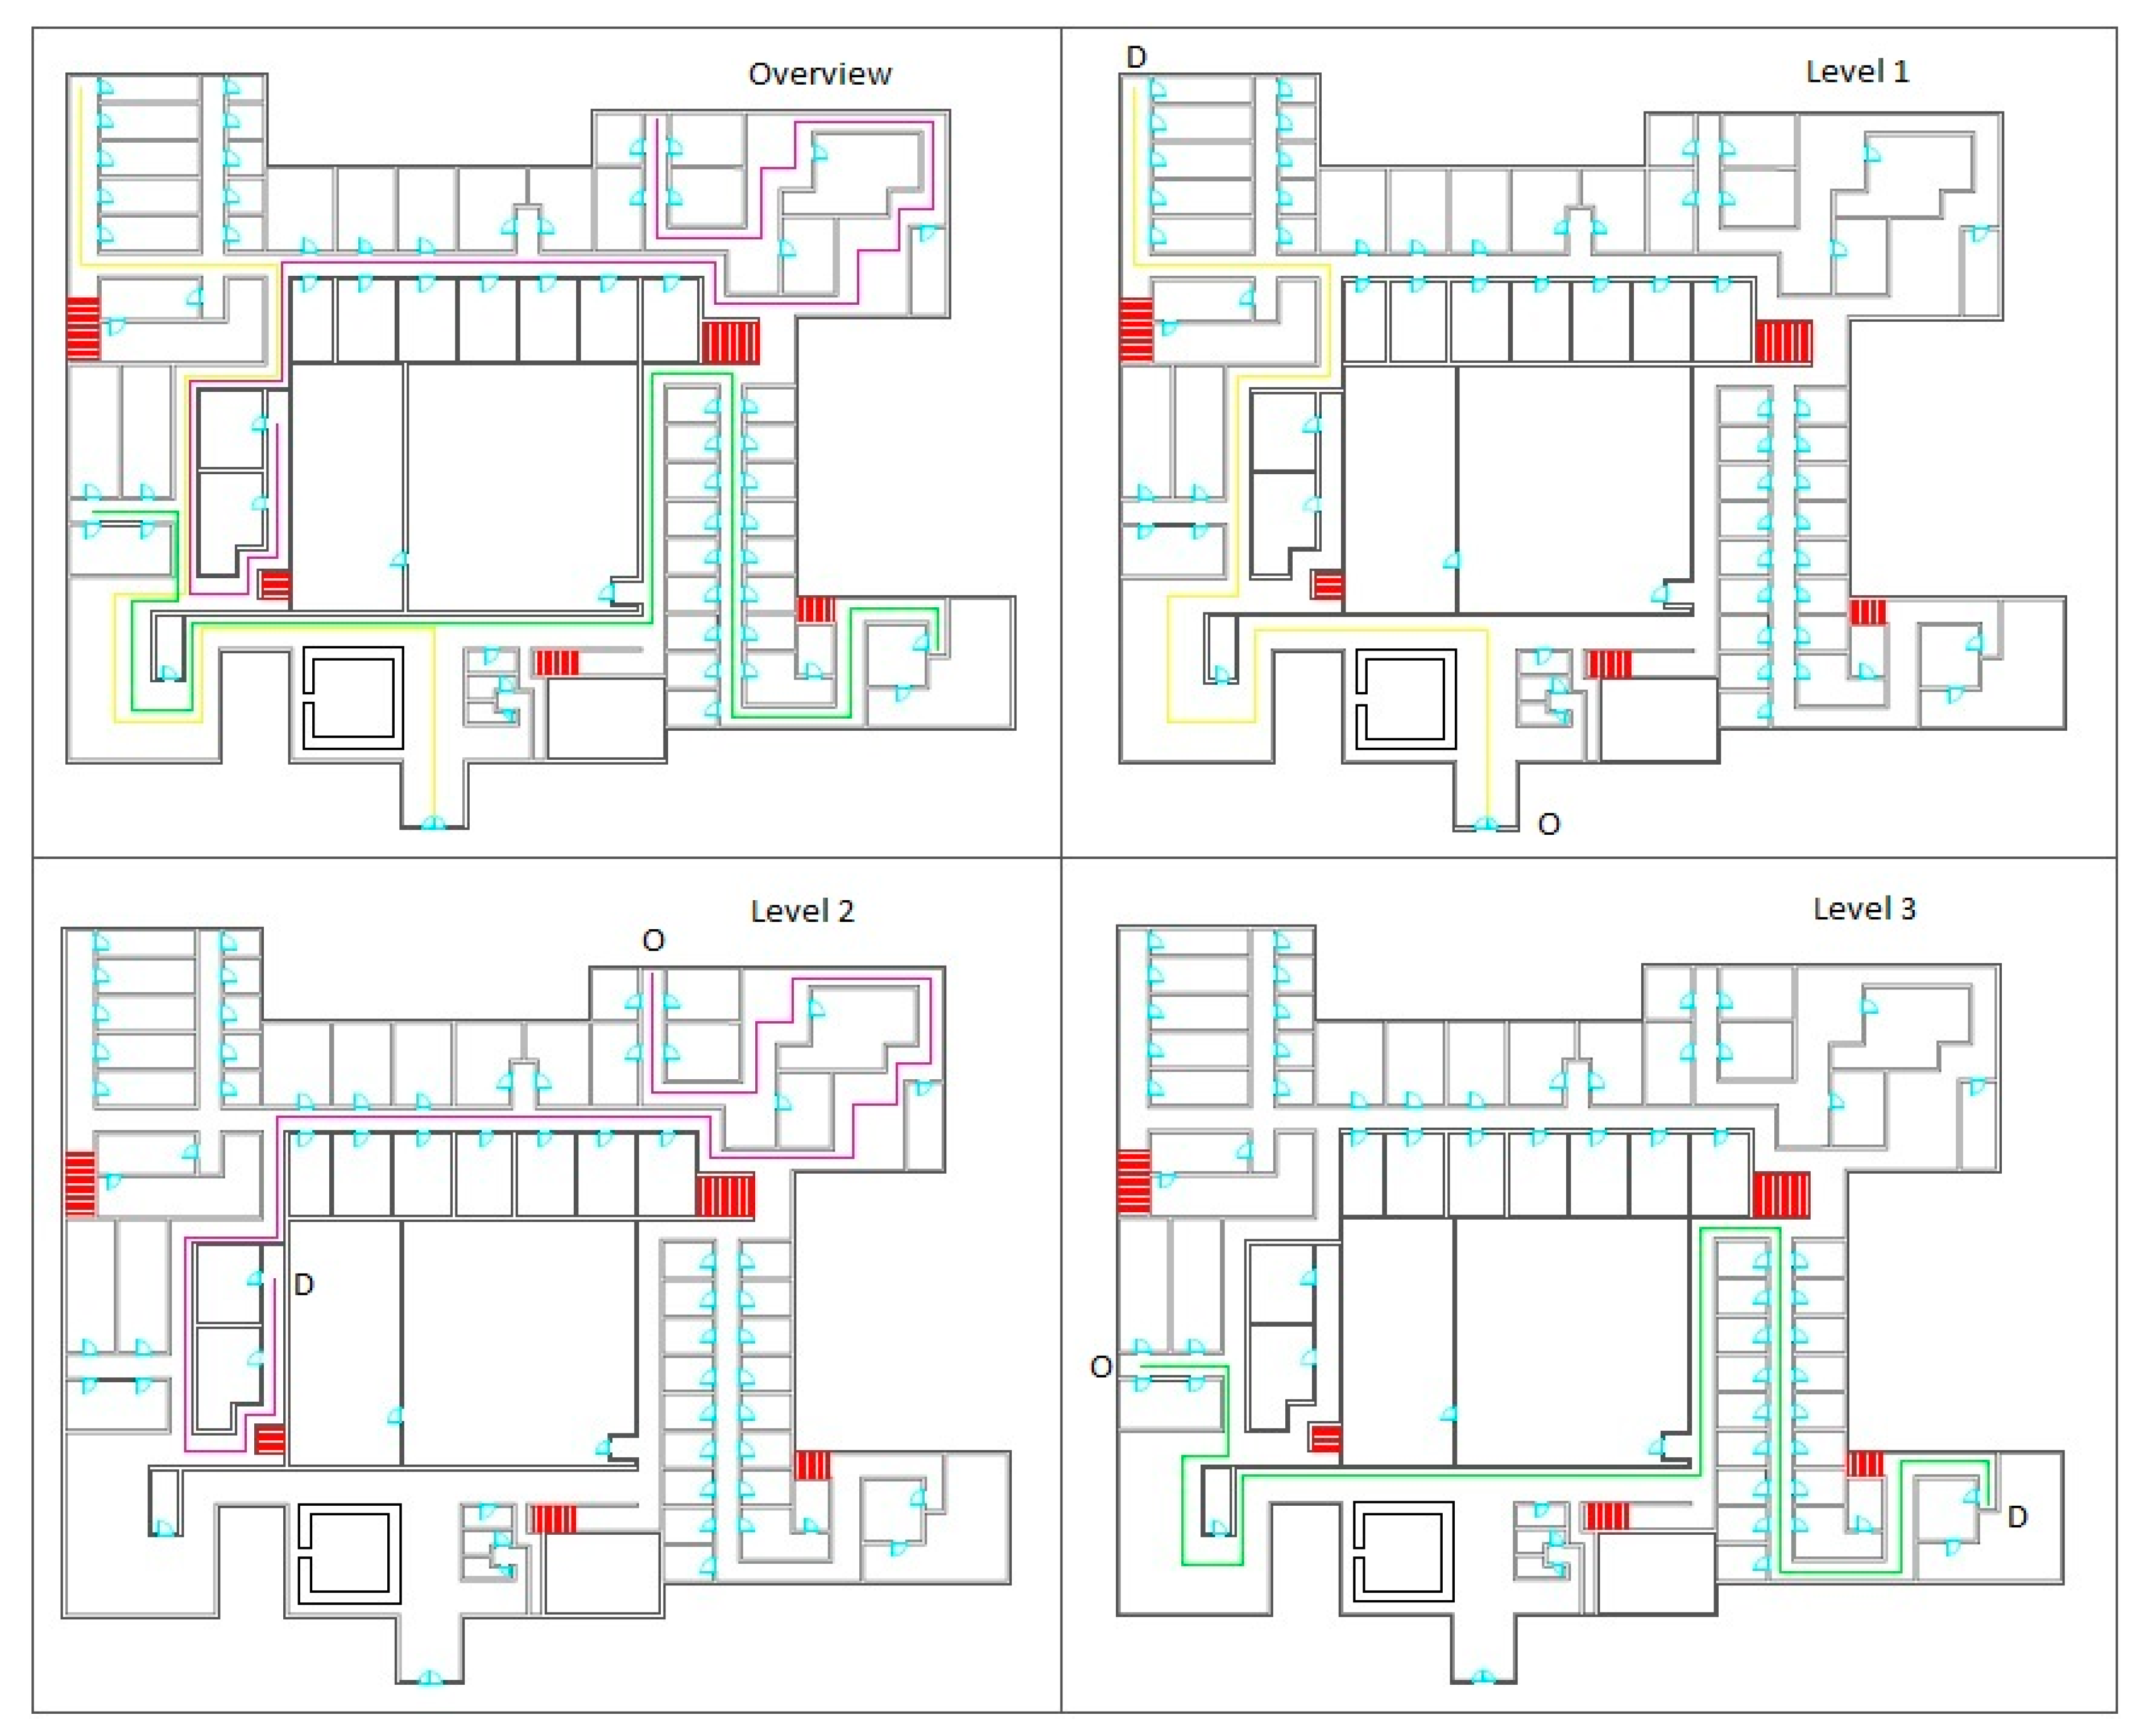
Furthermore, so as to investigate the wayfinding performance, the levels were developed to automatically detect the wrong turns and to acquire information about when and where these were made by a participant. Since it suffices to know when and where a participant made a wrong turn, the game automatically asked the participants to turn around when they were mistaken. Figure 3 illustrates the three indoor routes used for the different game levels.
2.1.6. Landmarks
As discussed during the introduction, a movement in a goal-oriented and efficient way is often troublesome in an indoor environment. In order to overcome these difficulties, the participants need various cognitive skills and the ability to memorize different instructions over time. One of these skills is the recognition of remarkable environmental features or landmarks. In this case study, these were various game objects in the building that structured the human cognitive map of the environment and were used for the orientation and formation of the mental map. Therefore, in the fifth step, 21 different landmarks were used on 32 decision points, and 18 decision points had no landmarks. Table 1 demonstrates an overview of the different landmarks, related to the level and decision points at which they occurred in the game. Appendix A additionally provides an overview of all decision points in the three different levels and represents those by means of their unique ID as a combination of the DP integer and the level in which they occurred (Unique ID in Table 1).
2.1.7. Ranking and Game Competition
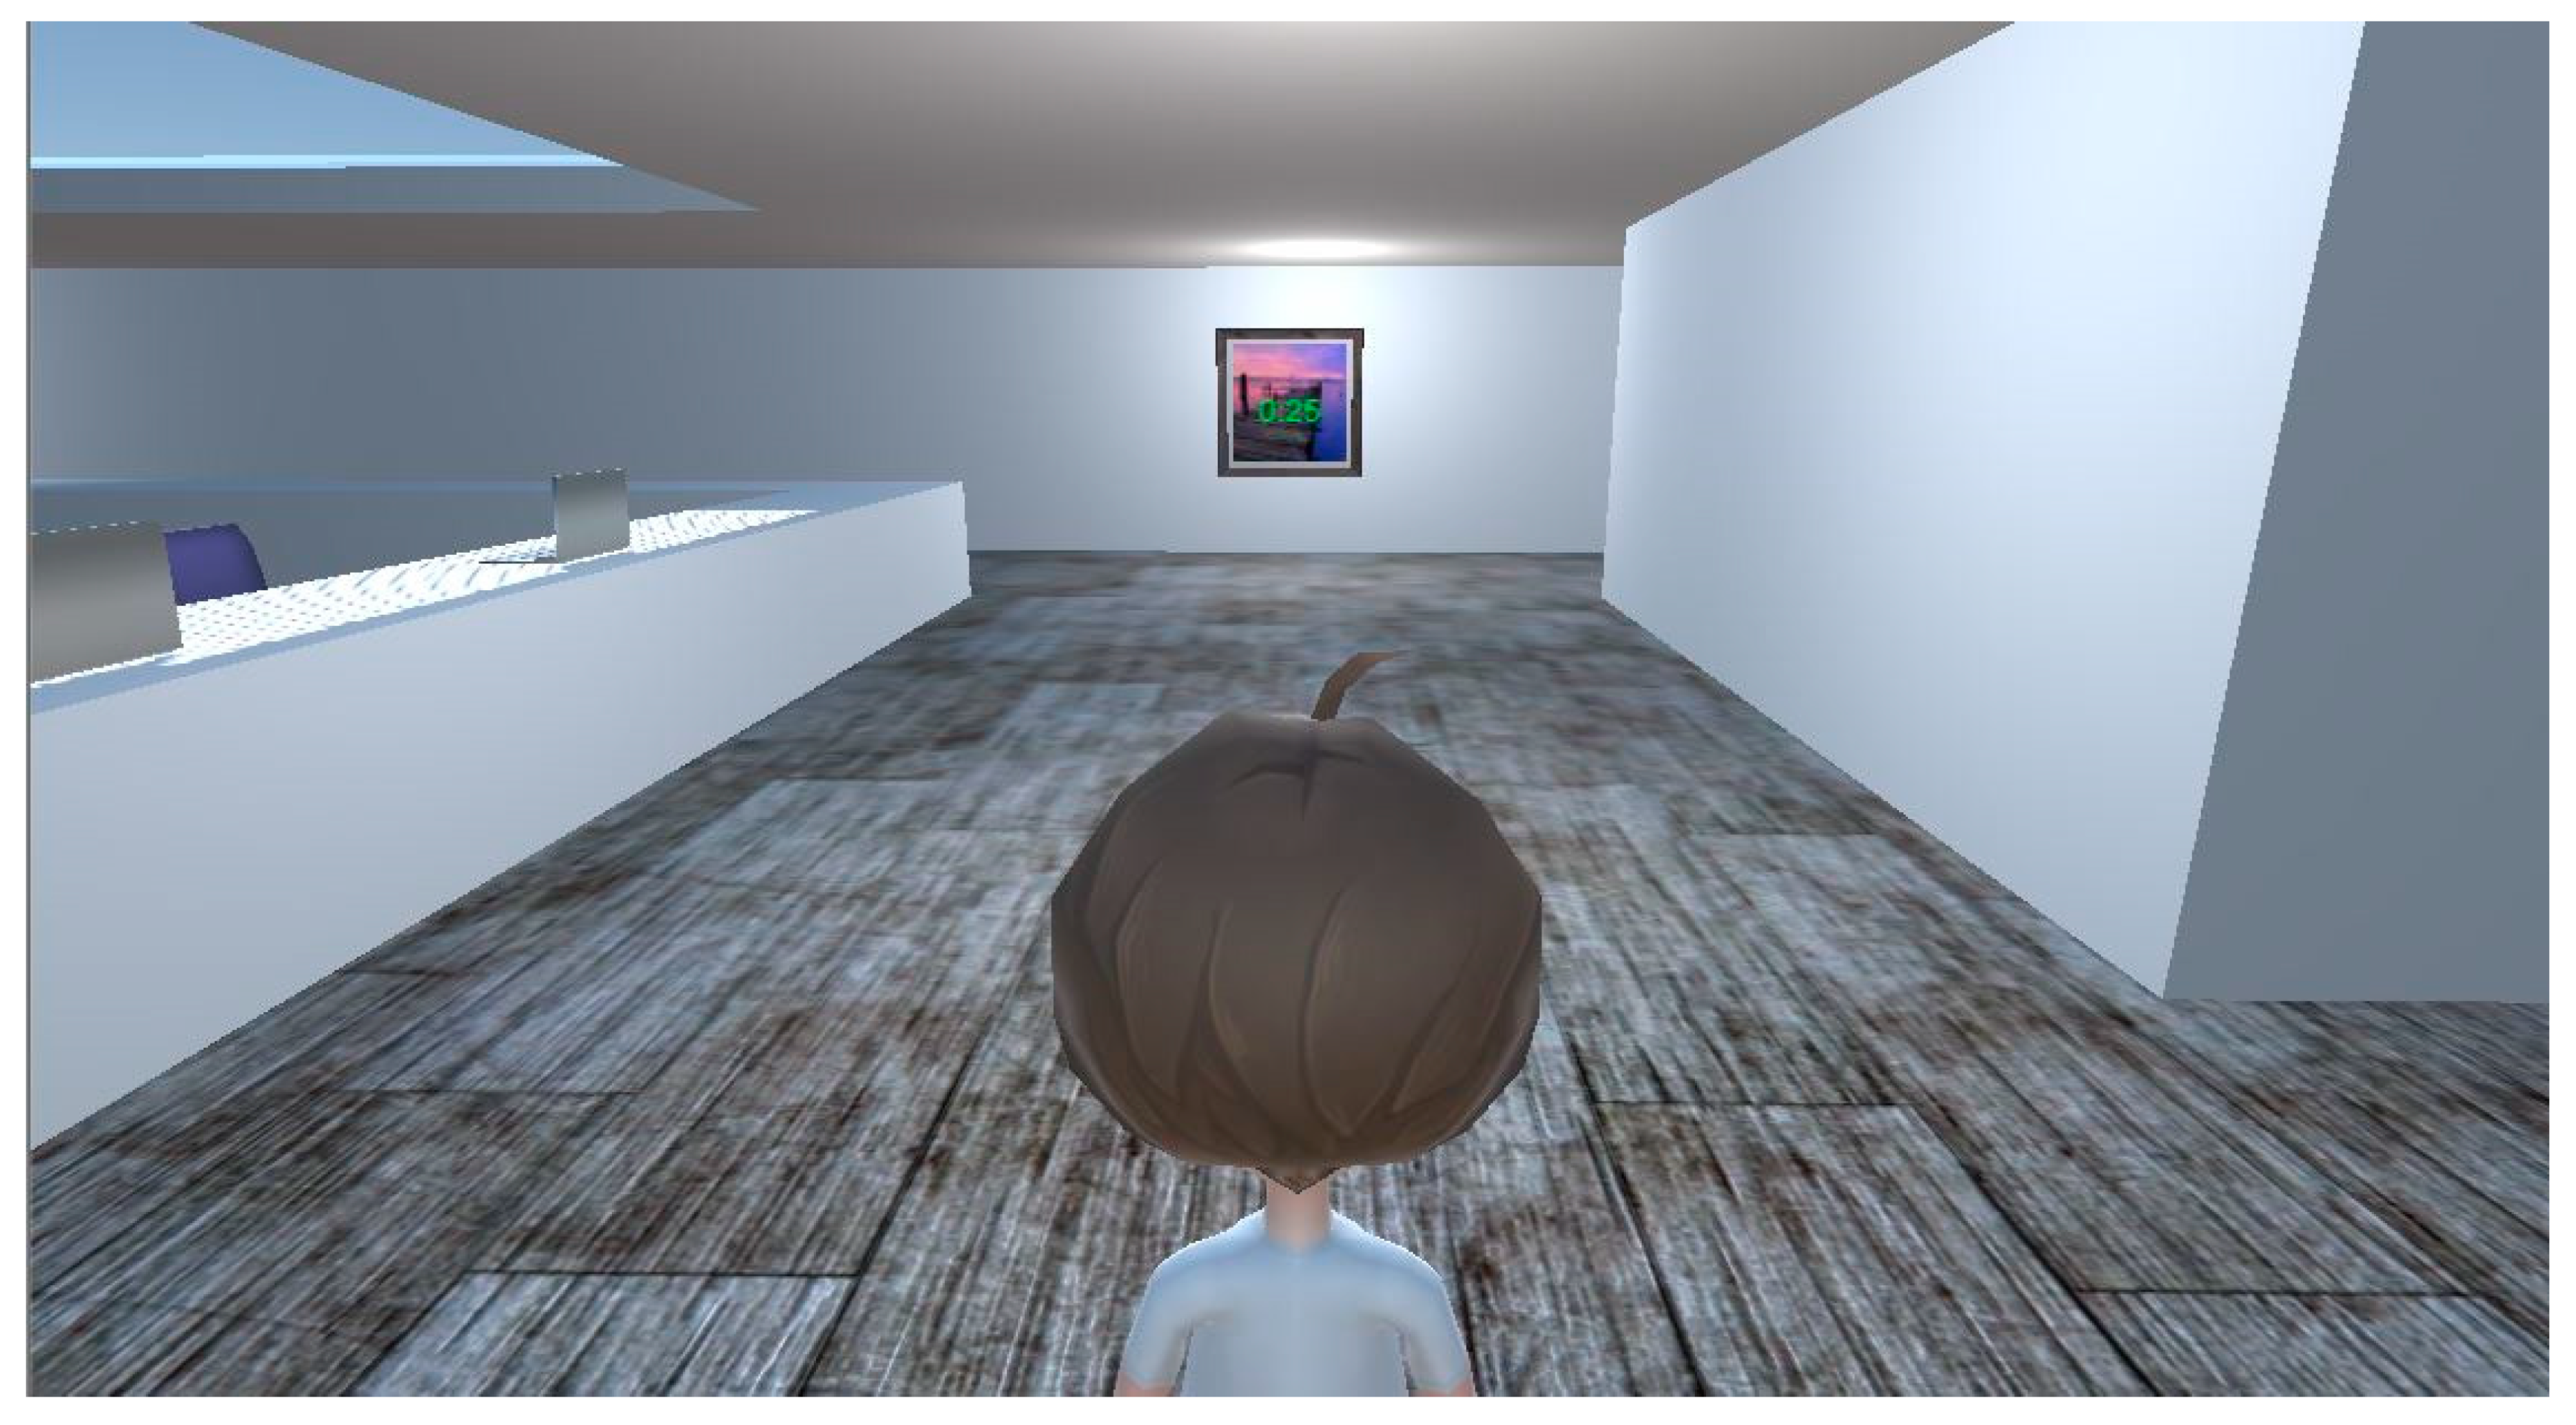
The competition was embedded during the sixth step by means of a ranking so as to create a social game component. The ranking was based on a top ten of the best total timing results of the participants and aimed to create a competition between various individuals striving for the best time. Since the competition and the creation of a social component is one of the main game characteristics, it was of high importance to implement this final attachment. The ranking was built by use of Structured Query Language (SQL) and moreover a query, selecting the ten records with the smallest total timestamp. The names and best total timing outcomes of ten distinct participants were shown and could be accessed before and/or after playing the game. This way, participants tended to be more stimulated to aim for a better time and might play multiple times, intending to reach a higher score. Figure 4 gives an overview of the developed “indoor navigation simulator” game and represents a participant finding his way in one of the levels aiming to achieve a high score.
2.2. Game Testing and Distribution
Throughout the lengthy process of game production, the game construction was tested by internal team members, which was called the alpha testing phase. When the latter satisfied the needs of the alpha testing, a next testing phase, namely the beta testing phase, was conducted by means of a pilot test on eight participants [34]. During the test, no bugs occurred in the game and the data were successfully acquired. Afterwards, the participants of the pilot test were asked for potential improvements to the game, which mostly resulted in comments on the player movement difficulty by non-gamers. Therefore, a tutorial was created in which participants could practice their movements in a simplified indoor environment, aiming to give the participants a first experience with the movement mechanism of the game.
Finally, the game was built with target platform windows in a x86-64 architecture. The screen width and height of, respectively, 1440 and 900 pixels were chosen, and the quality level was set to ultra-high. The Unity 3D software development kit automatically built the game, resulting in an executive file and its corresponding data files. The “Inno Setup Compiler” software was used to create an installer based on all game files and the corresponding executive file. The final product was the installation set-up for the game, named the “Indoor Navigation Simulator Setup (x86)”. This executive file and the installation manual were sent to all students and staff of the Geography department at Ghent University. During data-acquisition, the game was played by 52 different participants, resulting in more than 20,000 collected point locations related to the indoor environment. Various wrong turns were registered, and 11 participants played the game more than once, creating the opportunity for research on a learning effect.
2.3. Data Processing
In this section, the measures for data cleaning are explained first in the pre-processing subsection, as well as the calculation of the navigation velocities before performing statistical tests. Finally, the data analysis phase is described with a focus on the user and decision point characteristics’ investigation, the effectiveness of the landmarks on indoor wayfinding, and the correlation between the wayfinding performance and building layout.
2.3.1. Pre-Processing
In general, approximately 20 percent of the data could not be used due to an unforeseen server failure as a result of VPN connection errors or too many simultaneous server requests. After data cleaning, 41 individual datasets could be applied for the user characteristics’ analysis and decision point characteristics’ analysis, 11 datasets might be useful for a learning effect analysis.
The navigation velocity is utilized in statistical analysis since it gives the opportunity to compare different decision points with each other. This value is calculated by means of time and Euclidean distance between the tracked point locations. As for the research on user characteristics, the traveling distance and time regarding the 3 levels were calculated for each participant so as to obtain their overall navigation velocity as the average of the three different levels.
2.3.2. Statistical Analysis
In the statistical analysis, the influence of the user and decision point characteristics on the wayfinding behavior was investigated. Additionally, the effectiveness of the landmarks and architecture on wayfinding performance was studied, followed by research on a learning effect by playing the game. Five different steps were executed based on various measures such as the navigation velocity and wrong turns of the participants. It is important to notice that the calculated navigation velocities were not normally distributed and thus non-parametric tests were used in this study.
In the first step of the analysis, the influence of the personal characteristics on the total navigation velocity and amount of wrong turns was looked into. If the Kruskal–Wallis test indicated a difference between various groups of participants, pairwise, one-sided Mann–Whitney U-tests with Bonferroni correction were used to determine between which groups the differences lay. In order to investigate the difference between the proportions of wrong turns in the groups, a two-proportion z-test was used. The groups were formed by the answers to the questions, namely, whether the participants often get lost or not and whether or not they often play games. Additionally, the learning effect was investigated by means of participants’ data who played the game multiple times. The total navigation velocities, aggregated for all three levels and the amounts of wrong turns, were compared for different tries by use of a graphical representation. Moreover, two-sided Mann–Whitney U-tests were executed so as to investigate the significance of such effects and to conclude whether they are present in this study.
In a second step, the influence of the decision point characteristics was tested by determining whether there were any significant differences between the velocities of the participants at different decision points or landmark categories. All decision points were classified in two ways: according to the decision point topology and according to the required wayfinding action. First of all, based on the decision point topology, a distinction was made between a single-turn (i.e., a turn with only one wayfinding option), a multiple-turn (i.e., a turn with more than one wayfinding option), and finally the start and end of each level. A Kruskal–Wallis and pairwise one-sided Mann–Whitney U-test were used so as to examine the significant differences between the groups. Second of all, based on the required wayfinding action, a distinction was made between going straight forward, turning to the left, and turning to the right. As for this categorization, both the wrong turns and the differences between the navigation velocities were analyzed with, respectively, a Chi-square goodness-of-fit test and a Kruskal–Wallis test accompanied with pairwise one-sided Mann–Whitney U-tests.
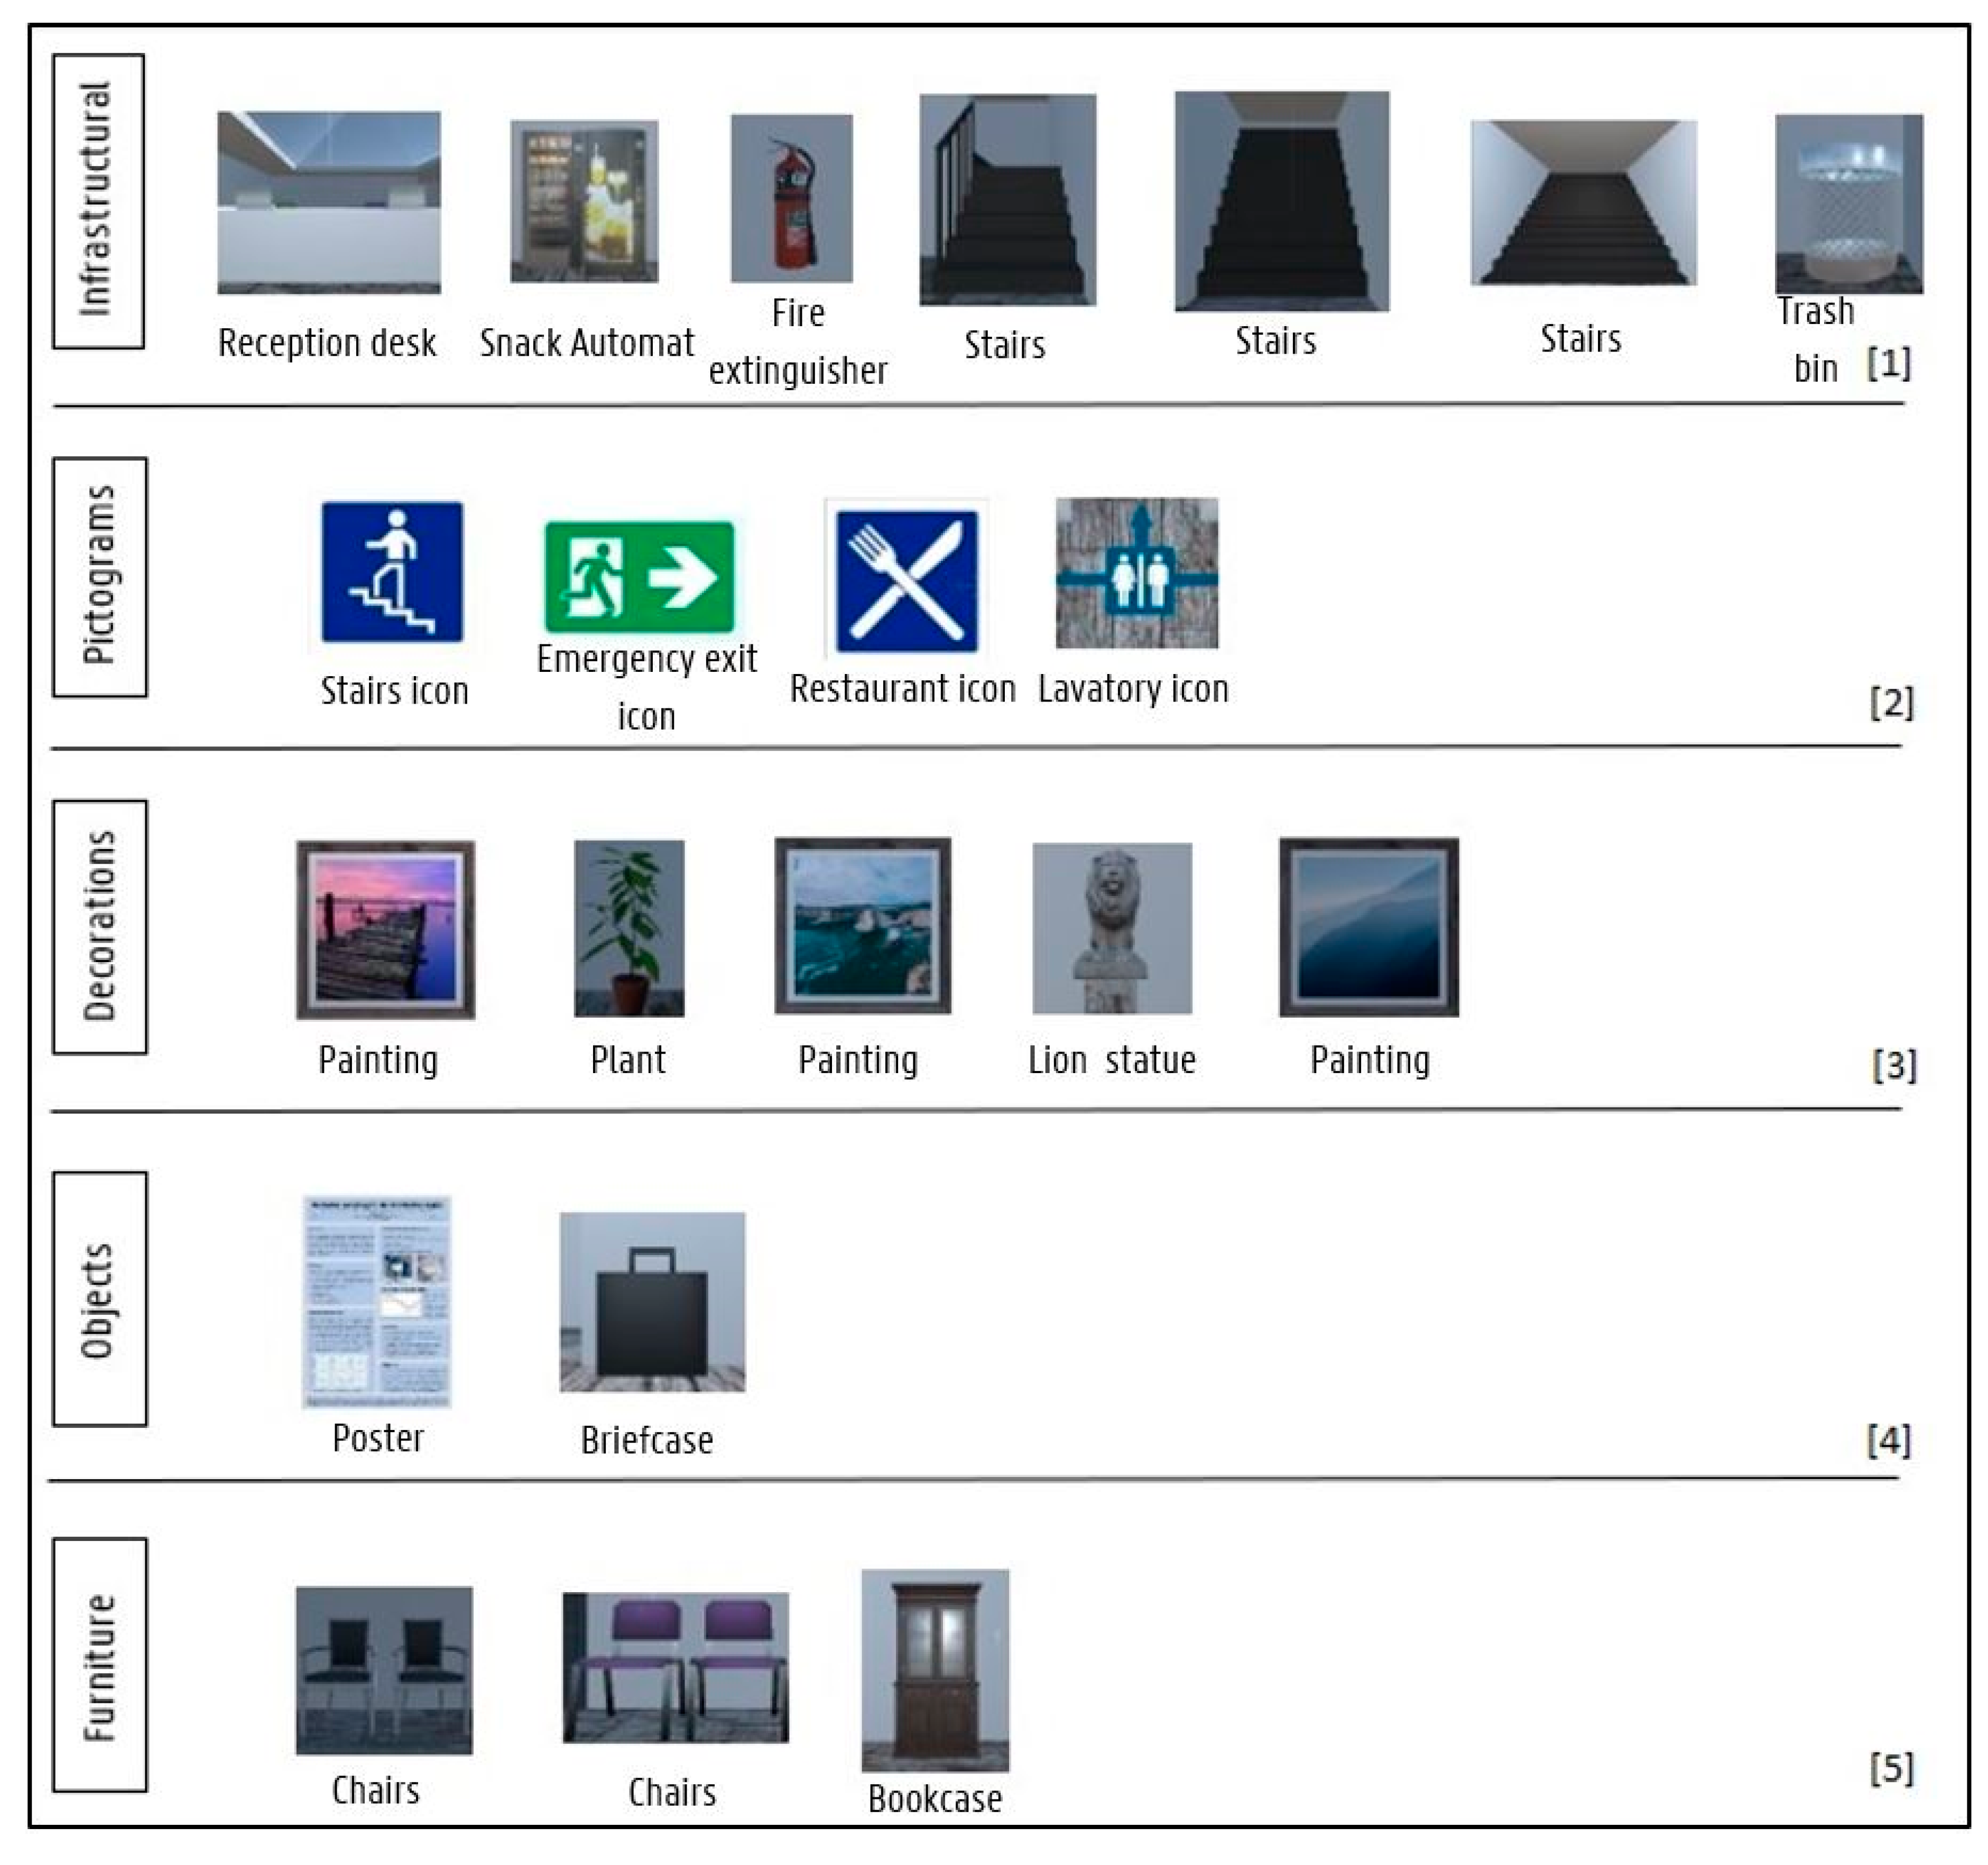
In a third step, the landmarks were divided into different groups in order to explore the landmarks’ effectiveness on the indoor wayfinding performance. Following the study by Viaene [6], six different categories of landmarks were employed: infrastructural, pictograms, decorations, objects, furniture, and no landmark at all. The differences between the velocities and wrong turns in the landmark categories were analyzed using the same tests as in the previous step. Figure 5 illustrates the categorization of the landmarks by means of the corresponding images.
In a fourth step, the correlation between the mean visual depth (MVD) measures and the navigation velocities at different decision points was analyzed. The MVD is a global VGA measure that is calculated as the mean global number of visual turns to reach one specific point from every other point in the building. It was calculated with the isovist.org software as values between 4 (shallow or well-integrated) and 10 (deep or badly integrated) [35]. Since the calculated navigation velocities were not normally distributed, the Spearman rank correlation coefficient was used for this analysis. At first, the Spearman rank correlation between the computed navigation velocity and the MVD measure was determined for all decision points. Next, the same test was executed on the decision points located in the deep spaces on the one hand and in shallow spaces on the other hand to investigate the difference in navigation velocity between these two groups. It is quite important to note that, for this case study, deep spaces were mainly located in convex spaces and shallow spaces were mainly located in the narrow hallways. Figure 6 summarizes the statistical analysis and gives an overview of the used measures and conducted tests in each step.
3. Results
3.1. User Characteristics
Table 2 gives an overview of the user characteristics, including data on the age category, education level, answers to the general questions during the registration, and the wrong turns during wayfinding in the first try. The participants provided their own estimation of wayfinding capabilities by answering the questionnaire but were also divided into groups based on their effective presentation (at least one wrong turn), which was not always the same.
The resulting p values of the Kruskal–Wallis tests on the differences between the user groups can be found in Table 3. Based on these tests, the difference between two types of groups was insignificant: groups based on the first question (i.e., Do you often have trouble with indoor wayfinding?) and groups of mistaken and non-mistaken participants (i.e., at least one wrong turn) in their first try. The first finding means that there were no significant differences in the navigation velocities of the participants based on their wayfinding capabilities’ estimation. The second result suggests that although participants made a wrong turn, their navigation velocities did not differ significantly from the participants that did not make a wrong turn
Furthermore, the difference between the groups based on the second question (i.e., Do you often play video games?) was proven significant and, therefore, a pairwise one-tailed Mann–Whitney U test was executed in order to determine which group was characterized by a significantly higher navigation velocity. As could be expected, the participants who often play games had a significantly higher navigation velocity in the three different levels. Despite the creation of a tutorial after the beta testing and the feedback on the difficulty of player movements, a significant difference could still be found between the gamers and the non-gamers group.
Additionally, a two-proportions z-test was executed to investigate a statistically significant difference between the number of wrong turns in the groups based on the questions during registration. The results show there was no significant difference in the proportion of wrong turns between the groups (Table 4).
As for the learning effect in the game, 11 participants played multiple times, but only 3 of them more than twice. Therefore, only the differences between the first and second try were investigated. Figure 7 illustrates the total navigation velocity of the participants in tries 1 and 2, aggregated for all three game levels. In most cases, the differences between both tries were only minimal, with the exception of the players with ID 13, 23, 24, and 42. It is important to note that only 5 out of 11 participants reported to have experience in playing games.
The results indicate a trend towards a slightly higher total navigation velocity in the second try and thus a better wayfinding in the building, but according to the two-tailed Mann–Whitney U-test, this trend is not statistically significant (p = 0.670).
Finally, Table 5 gives an overview of the number of wrong turns made by the participants in their first and second tries. In most cases, the numbers of wrong turns were not very different. This observation is supported by the statistical analysis with the two-tailed Mann–Whitney U-test (p = 0.972).
3.2. Decision Point Characteristics
The results of the statistical analysis can be found in Table 6. The Kruskal–Wallis test shows that there is a significant difference in the velocities of the participants in different categories of decision points based on the topology on one hand and the required wayfinding action on the other hand. Therefore, pairwise one-tailed Mann–Whitney U-tests were executed so as to determine which categories were characterized by significant higher navigation velocities.
The results show that the participants had the highest navigation velocity at multiple-turns, followed by single-turns and they moved the slowest at the start or end of a route. An additional analysis on the start/end category reveals that the low navigation velocity was mostly caused by the start decision points and not the end decision points (p = 0.000). Furthermore, Table 6 shows that the navigation velocity was significantly higher at the decision points in which the participants were asked to go straight forward, compared with the decision points for which the wayfinding instructions required the participant to turn left or right.
Finally, Table 7 illustrates the results of the statistical analysis on the amount of wrong turns in the decision point categories according to the required wayfinding action. As for the topology-based decision points’ categorization, the amount of wrong turns was not taken into account since no wrong turns could be made at single turns. The Chi-square goodness-of-fit test was used to determine whether the sample, being the observed amount of wrong turns in each decision point category, was consistent with a hypothesized distribution. Since not every category had the same number of decision points, the expected distribution was not evenly distributed. It was calculated as the product of the total number of wrong turns and the proportion of multiple-turns of a specific landmark category compared with the total number of multiple-turns.
The null hypothesis assumes that the observed amount of wrong turns follows the expected distribution, proportional with the number of decision points in each category. The alternative hypothesis on the other hand assumes that the amount of wrong turns is distributed significantly differently. The results show that the null hypothesis could be rejected in this analysis (p = 0.000). As a result, one could argue that significantly less wrong straight forward actions and substantially more wrong left-turn actions were made than would be expected, while the number of wrong right-turn actions was quite similar to the expected number.
3.3. Landmark Effectiveness
Regarding the investigation of the effectiveness of landmarks on the indoor wayfinding performance, the significant results of the statistical analysis on navigation velocity are shown in Table 8. The p values of the executed Kruskal–Wallis tests show that there was a significant difference in the participants’ navigation velocity at the decision points with landmarks from the different categories: infrastructural, pictograms, decorations, objects, furniture, no landmark at all. Therefore, pairwise one-tailed Mann–Whitney U-tests were executed to determine which categories were characterized by significantly higher navigation velocities. It is important to note that all landmarks were characterized with the same level of difficulty and they could all be easily identified during wayfinding. Furthermore, the decision points at the start of a level were not taken into account in this analysis. The previous test showed that it took a while for participants to start moving at the beginning of a route, thus, including the starting points could bias the test results with the navigation velocity as a measure.
The results show that, compared to the decision points containing landmarks from the categories no landmark, infrastructural, pictograms, decorations, and furniture, the navigation velocity at the decision points containing landmarks from the objects category was significantly higher according to the Mann–Whitney U-tests. Furthermore, compared to the decision points containing landmarks from the furniture category, the navigation velocity at the decision points containing landmarks from the categories no landmark and infrastructural also were significantly higher.
Table 9 represents the results of the statistical analysis on the amount of wrong turns at the decision points in the landmark-based categories. The Chi-square goodness-of-fit test was used, analogous to the analysis of the required wayfinding actions. It is important to note that the no landmark category was characterized by no wrong turns. The Chi-square goodness-of-fit test requires that all observed or expected frequencies in each category should be 5 at least. As a result, the no landmark category was not considered in this test, and the proportions were adjusted to the total amount of decision points, excluding the ones in the no landmark category.
The analysis shows that the null hypothesis could be rejected (p = 0.000). As a result, one could argue that the distribution of wrong turns in the landmark type-based categories of decision points was significantly different than the expected distribution of wrong turns. More wrong turns were made than expected at the decision points with a landmark from the categories decorations, objects, and furniture. The landmarks from the categories pictograms and infrastructural were characterized by less wrong turns than expected.
3.4. Building Layout and Architecture
In order to determine the link between the theoretical complexity of the floorplan, quantified by the mean visual depth measure and navigation velocity, the correlation between these two values was analyzed. The general spearman rank correlation coefficient and the coefficient for the decision points in deep and shallow spaces can be found in Table 10. It is important to note that the decision points at the start of the levels, characterized by a significantly lower navigation velocity, were not taken into account since they could bias the results, as mentioned in Section 3.2.
For all decision points in the building, a significant Spearman rank correlation with a coefficient of −0.063 could be found. In general, these results shows that Y (the navigation velocity) tends to decrease when X (the mean visual depth measure) increases. However, when a distinction is made between the deep and shallow spaces, this trend is no longer significant for the shallow spaces, but it increases for the deep spaces. Figure 8 illustrates the location of these decision points including information on the correlated space syntax measurements.
4. Discussion
4.1. User Characteristics
In this study, a number of conclusions could be drawn from the results of research on differences in user characteristics. First of all, there were no significant differences in the total navigation velocities of the participants divided in groups based on the estimation of their wayfinding capabilities. Secondly, no significant difference was found in the proportions of wrong turns over the number of participants in the groups based on questions 1 (i.e., Do you often have trouble with indoor wayfinding?) and 2 (i.e., Do you often play video games?). Therefore, the estimated wayfinding capabilities and the practical wayfinding capabilities did not have a significant impact on the navigation velocity. Since similar conclusions were made in a previous study by De Cock et al. [9], these results are consistent with the literature.
In contrast, the experience of the participants with games did render some significant differences. From the results of post hoc pairwise testing, it could be concluded that the participants that often play games had a significantly better, as in higher, total navigation velocity in the three different levels, despite the tutorial video that was introduced after the beta testing phase. This shows that most of the time, the navigation velocity and not wrong turns is influenced by the game experience of the participants. Therefore, this study indicated that wrong turns are a more objective measure for the wayfinding performance in a gamification project and that the participants’ experience with player control also has to be taken into account. A previous study by Powers et al. [36] confirms this finding by providing evidence that game training can enhance specific perceptual and motor skills, including visual and spatial processing and hand–eye coordination.
Regarding the analysis on a learning effect by playing the game, no significant difference in the amount of wrong turns made by the participants in their first and second attempt could be found. As for the total navigation velocities, there seems to be a small trend of a higher total navigation velocity in the second try, but no significant difference could be seen. As a result, no significant learning effect was noticed in this case study, although more than half of these participants were non-gamers. It is important to note that a small number of participants played multiple times. Since the Kruskal–Wallis test has a low power for small samples, a bigger sample could have yielded different results and thus caution is necessary regarding this conclusion.
4.2. Decision Point Characteristics
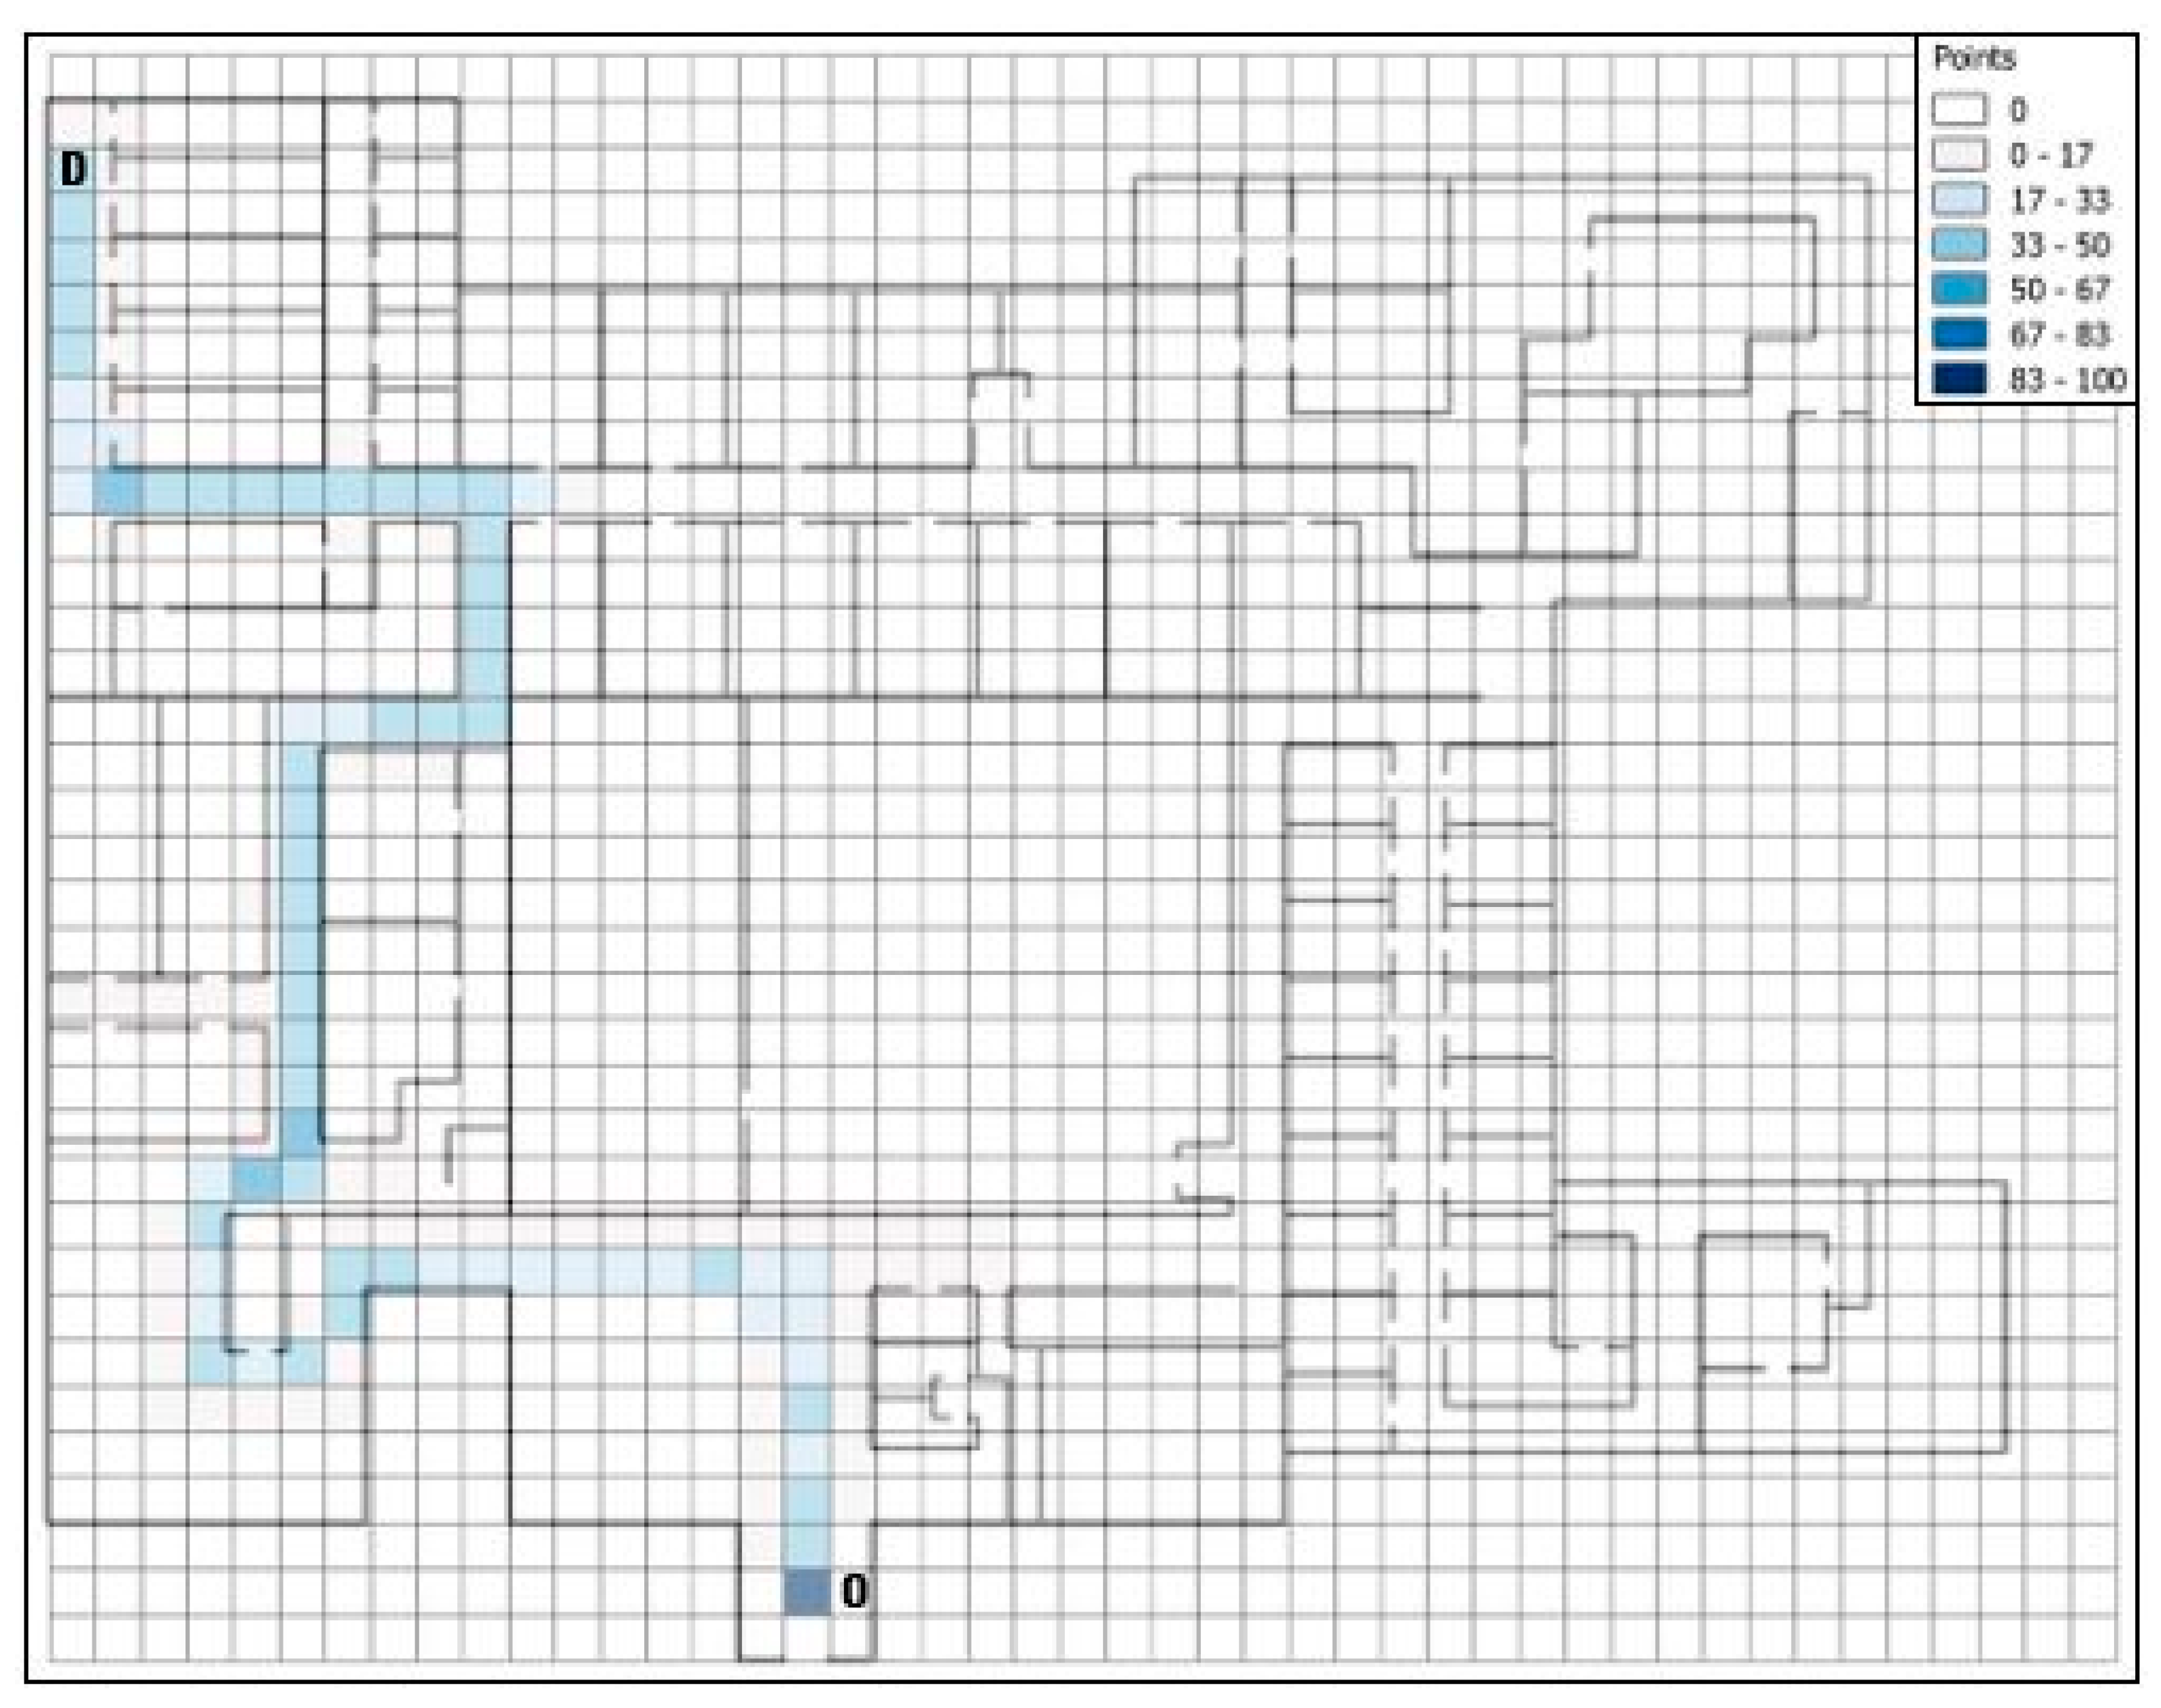
In general, the navigation velocity of the participants was higher in the categories single-turn and multiple-turn compared to the navigation velocity at the decision points at the start and end of a level. Although research by De Cock et al. [12] shows that starting and ending a route is less complex and, therefore, a higher navigation velocity is expected, this study shows rather the opposite. Further analysis demonstrates that the low navigation velocity was mostly caused by the start decision points. A possible explanation for this observation is the time lag between the start of a level and the start of wayfinding by the participants. When the participants click the play game button, it takes a few seconds to move their player by use of the arrow keys. Since the timer in the level immediately starts after clicking this button, a time lag of a few seconds could generally lower the navigation velocity at the decision points at the beginning of each level. The heat flow of the movement in level 1 with a resolution of 2 m (Figure 9), for example, graphically confirms this determination. A higher density in tracked point locations was clearly present at the beginning of the level compared with the neighboring raster cells.
As for the multiple-turn category, the results show that the navigation velocity in this category was significantly higher compared to the decision points in the single-turn category. At the single-turns, only one navigational turn was possible and thus a higher navigation velocity could be expected compared to the decision points with multiple options, but this was not the case. In order to explain this, the individual decision points in the multiple-turn category were analyzed. There were 26 decision points in the single-turn category and 16 decision points in the multiple-turn category. It is important to note that of these 16 decision points, 8 of them required the participant to go straight forward. This study has shown that going straight forward is characterized by significantly higher navigation velocity. As a result, going straight forward is faster and the significantly higher navigation velocity at multiple-turn decision points could be triggered by the high number of straight forward wayfinding actions. Again, this confirms that gaming experience has an important influence on the navigation velocity.
Next, the analysis of the amount of wrong turns at the decision point categories based on the required wayfinding action showed a significant variation from the expected distribution. In general, the amount of wrong turns was less than expected concerning going straight forward, which suggests that going straight forward is not only easier in terms of player movement but also regarding the route remembrance. As for taking a turn to the left, more wrong turns were observed than expected. Table 11 gives an overview of the wrong turns made at different decision points categorized by means of the decision point topology and landmark type. From this table, it becomes clear that the decision point with ID 83 (bookcase) was an outlier showing the largest number of wrong turns. One possible explanation for the large number of errors could be the influence of this outlier. Another possible explanation could be given by a study by Groepel-Klein and Bartmann [37], which shows that stores characterized by a clockwise movement and, thus, turns to the right seem to be more efficient. It is possible that the anti-clockwise movement explains the amount of wrong turns made by the participants when taking a turn to the left in the “Indoor Navigation Simulator” game. Although caution is necessary with this statement because the indoor game environment is different than the environment of a store. In general, it is possible that the anti-clockwise movement is more complex, and some participants may have more difficulties with the formation of the mental map when they have to go to the left.
4.3. Landmark Effectiveness
Regarding the analysis of the landmark effectiveness, the results show a significant difference in the navigation velocities in different landmark categories. A post hoc pairwise testing revealed that the category objects had the largest share in this significance and was characterized by a significantly higher navigation velocity compared to all other categories.
The previous step in the analysis showed the impact of the complexity of the player movement when making a turn. Going straight forward, which is required for the briefcase (DP 73), was less complex and resulted in a higher navigation velocity. Taking a turn, which is the instruction on the scientific poster in levels 1 (DP 101) and 2 (DP 102), is more complex and could cause a lower navigation velocity. In order to fully comprehend the higher navigation velocity in the objects category, the player movements and distribution of wrong turns in the other categories should be analyzed. Therefore, Table 12 gives a quantitative overview of the categorization based on the different types of landmarks, containing the distribution of wrong turns and the movement complexity in terms of percentages of cases that require a turn.
Compared to the turning percentages of the categories no landmark, furniture, and decorations, which are respectively 78%, 100%, and 100%, the turning percentage of the objects category was lower (67%). More turns indicated a lower navigation velocity and thus this observation could confirm the previously found significantly higher navigation velocity at the decision points containing a landmark from the objects category compared to these three categories. The turn comparison also explains the higher navigation velocity at the decision points in the no landmark and infrastructural categories compared to the decision points in the furniture category. As for the categories infrastructural and pictograms, the turn percentage was equal to or lower than that of the objects category. This observation does not support the previously found significantly lower navigation velocity at the decision points containing an infrastructural landmark or pictogram. Therefore, the difference in navigation velocity between the object and infrastructural decision points on the one hand and the object and pictogram decision points on the other hand was not influenced by the player movement complexity.
The wrong turns constitute another possible effect on the navigation velocity. As for the decision points containing a landmark from the categories decorations, objects, and furniture, the participants made more wrong turns than expected. Regarding the categories infrastructural and pictograms, the participants did better than expected and made fewer wrong turns. As already mentioned before, an unexplained significant difference in navigation velocity existed between these last two categories and that of the objects category, the latter characterized by a significantly higher navigation velocity. Since there were more wrong turns in the objects category than expected and fewer in the categories infrastructural and pictograms, the wrong turns also have no influence on these significant differences in navigation velocity. Therefore, the heat flows of the player movements were analyzed. A higher density in a grid cell represents more tracked point locations and thus a lower navigation velocity or even standing still, which might be caused by doubt or insecurity of the participant. Figure 10 is a representation of the heat flow for level 1. The grid cells containing a pictogram as a landmark (cell IDs 32, 122, and 221) are clearly characterized by a higher density compared with the neighboring grid cells. This confirms that the participants needed more time to navigate past these decision points and thus stopped for a longer period of time, probably for orientation. Moreover, according to the analysis of the wrong turns, the participants made fewer wrong turns at the decision points containing a pictogram than would be expected. The pictograms are, therefore, landmarks, whereby more thought was given to the choice but ultimately the right choice was made.
In general, the number of turns explains the majority of significant differences in navigation velocity. As a result, the impact of the player movements and gaming experience has a dominant influence on the navigation velocity measure. However, the player movement has little influence on the wrong turns. Since more wrong turns were made at the decision points with a landmark from the categories decorations, objects, and furniture, these categories were not very effective in this case study. The landmarks from the categories pictograms and infrastructural on the other hand can be seen as effective landmarks in this building. As for the pictograms category, the significant difference in navigation velocity compared with that of the objects category was probably caused by higher densities because of the orientation or more doubt and insecurity. The significant difference in navigation velocity between the objects and infrastructural categories cannot be explained by the player movement complexity, wrong turns, or high densities at the grid cells (standing still).
4.4. Building Layout and Architecture
In general, a small negative correlation coefficient was found, indicating that Y (the navigation velocity) tends to decrease when X (the mean visual depth measure) increases. Although this overall coefficient was small, it seems that the navigation velocity was lower in the deeper, badly integrated zones of the building. When these deeper zones were investigated separately, this presumption was reinforced by a slightly larger correlation coefficient. As for the more integrated decision points, this effect was no longer significant.
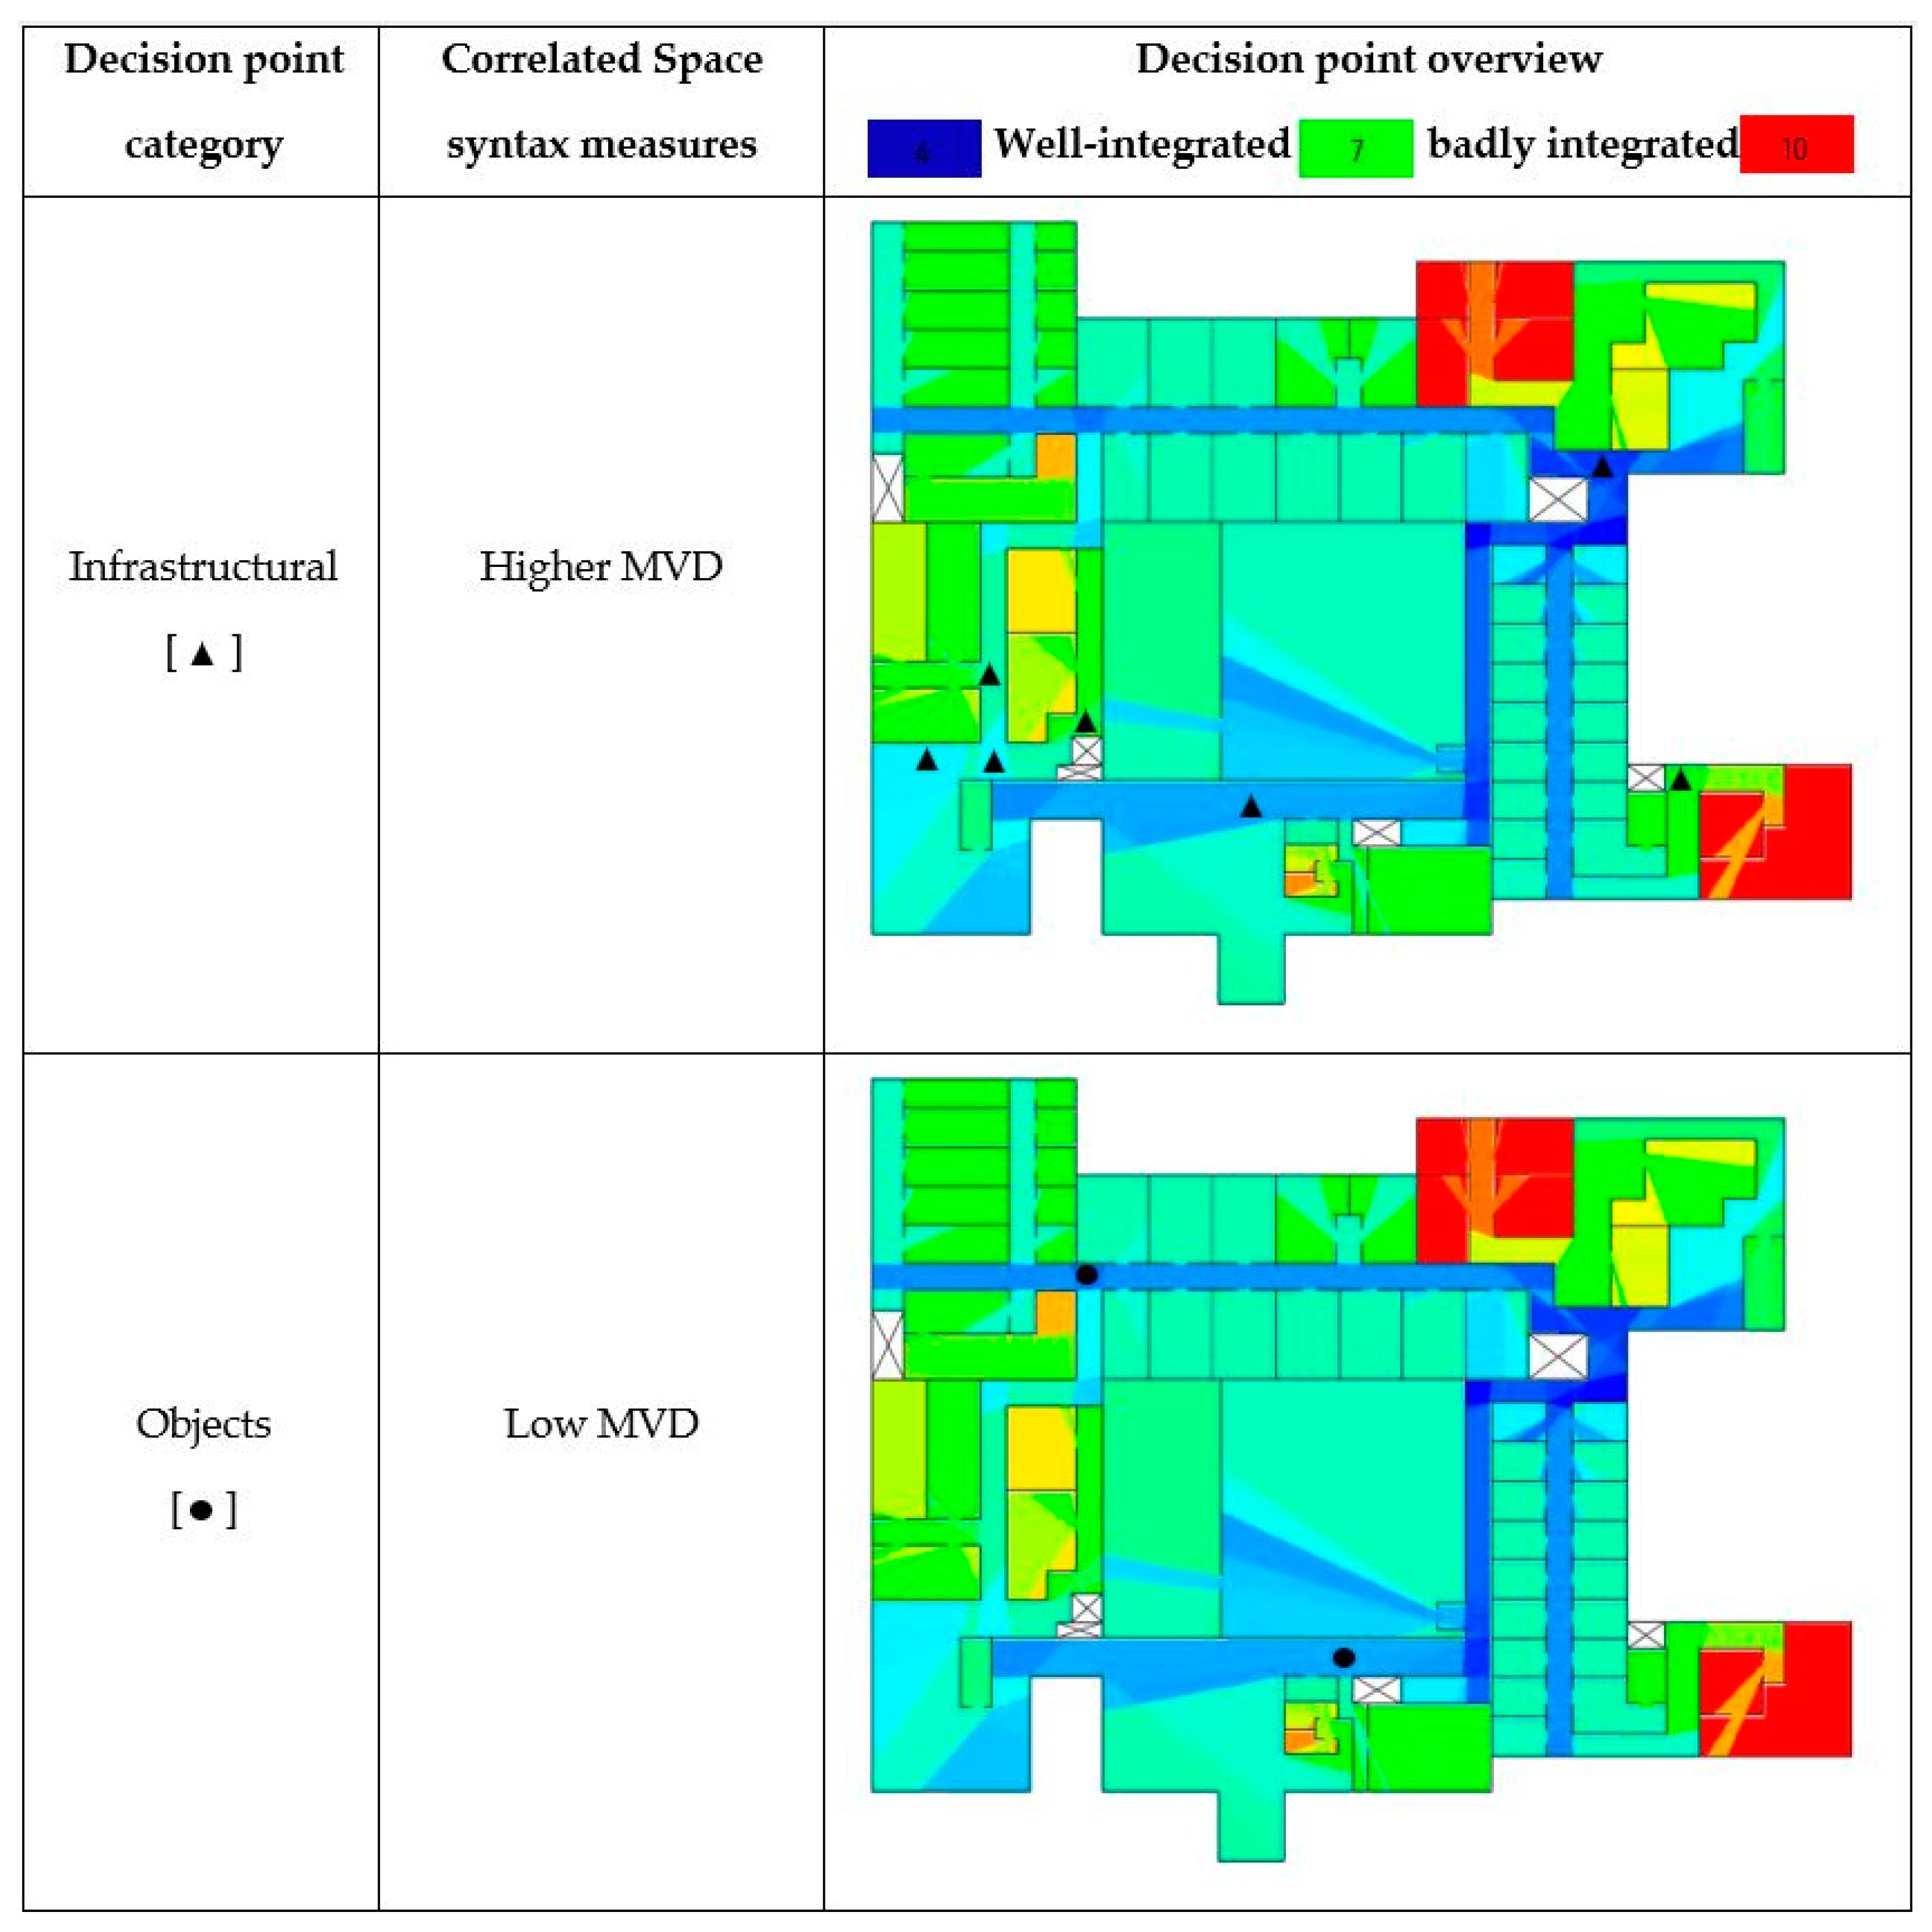
In this case study (based on a real building), the deeper decision points mainly lay in the convex spaces and the well-integrated decision points were mainly found in the narrow hallways. This means that navigating at deeper decision points in the convex spaces was slower and there seemed to be more doubt about making a turn than for that at more integrated decision points in the convex spaces. In the shallow spaces, on the other hand, it seems there was no noticeable variation in the navigation velocity influenced by the space syntax, so the participants mainly maintained a constant navigation velocity. This interpretation is in line with the findings from a study by De Cock et al. [12], in which the turns in the convex spaces are perceived as more complex than the turns in the narrow corridors. This might furthermore explain why the navigation velocity at the infrastructural landmarks was significantly lower than in the objects category, since the former are mainly located in the convex spaces (mean MVD of this category = 6,19) and the latter in the narrow hallways (mean MVD of this category = 5,37). According to the correlation coefficients, the navigation velocity at the infrastructural decision points decreased according to their deeper location in the building, while the navigation velocity at the object decision points remained continuous, which might have led to a significantly higher navigation velocity. Table 13 reinforces these findings by representing the average MVD values and navigation velocities for the infrastructural and objects categories, including several examples of the infrastructural decision points in the deeper zones with a clearly lower navigation velocity.
Figure 11 gives an overview of the locations of the infrastructural and objects decision points in the building, including information on the mean visual depth values.
To conclude, this research has shown that wayfinding might be harder at the deep convex spaces than it is in the shallow convex spaces. This complies with the findings of other research on indoor wayfinding, whereby more integrated spaces with high visual access were rated as less complex [12,38,39,40]. Despite the strong impact of player movement complexity, determined in the previous steps of this study, it can thus be said that decision point characteristics, landmarks, and building layout also seemed to have an important influence on indoor wayfinding in this case study.
4.5. Limitations and Future Research
In this study, the data-acquisition was conducted by means of a serious game that gave participants the opportunity to navigate through a fictional indoor environment. The advantage of using a game is the variety of possibilities that could be implemented during the development. The disadvantage, on the other hand, is a time-consuming development process that requires a lot of knowledge and experience so as to create a realistic environment (it took 2 months to develop one floor with only walls, a player, lighting, and landmarks). As mentioned in a study by van der Kuil et al. [21], the movements within the virtual world should be as realistic as possible in order to stimulate participation. More than 50 people participated in this study, which is more compared to the number of participants in most real-life experiments. A disadvantage is that they did not navigate in a real environment, which creates a less immersive experience, although the game experience is still far more immersive as compared to a static experiment, such as an online survey.
This research focused on a fictional indoor environment with only one floor. Despite the fact that the game was developed to be realistic, the link with reality is still limited. Future research can focus on more realistic models of existing buildings with multiple floors and make use of detailed Building Information Models (BIM). These models could be implemented in the development of a game from which the acquired data can be compared to a real-life study in the same building, for example based on the use of a location-based system. It could be interesting to analyze a correlation between the real and virtual world (i.e., do paths and places causing navigational problems in the real world also cause them in the virtual one?). Furthermore, this study shows a link between architecture and performance and thus a correlation with the mean visual depth measures. The concept of space syntax introduces multiple methods that could also prove useful in future works. Additionally, virtual reality might be applied so as to create a more realistic movement and to stimulate participation by use of a game. Finally, gamification could be combined with simulations in addition to the mentioned real-life experiments, for example, in studies on human behavior during an evacuation.
5. Conclusions
This study focused on the concept of gamification and its use in research on indoor wayfinding in order to provide useful information regarding the link between the wayfinding performance, personal characteristics, decision point characteristics, use of landmarks, and building layout in a virtual environment. By means of the “Indoor Navigation Simulator” game, a variety of data was acquired such as the personal characteristics of the participants, 3D-point locations, timestamps, and wrong turns. The data analysis explored the possibilities of gamification-based data in wayfinding research. As for the personal characteristics, no significant differences based on the estimation of wayfinding capabilities, nor a learning effect were found. Regarding the experience in playing games, a significant difference was seen between the gamers and non-gamers groups and thus a link between the wayfinding performance and game experience. As a result, the complexity of the player movement had an important impact on the investigated navigation velocity. Going straight forward was faster and characterized by easier movements compared to taking a turn, as this player movement was more complex. Moreover, the amount of wrong turns was less than expected for going straight forward, which suggests that going straightforward is not only easier in terms of the player movements but also concerning route remembrance. A further analysis on the wayfinding errors demonstrated that more wrong turns were made than expected at the decision points with a landmark from the categories decorations, objects, and furniture. Landmarks of the categories pictograms and infrastructural were more effective in this particular building, as fewer wrong turns were made than would be expected. Finally, a significant correlation was found between the wayfinding performance and the mean visual depth measure, indicating a link with the architectural layout of the building. In this building, wayfinding at deeper decision points in the convex spaces was slower and there seemed to be more doubt about making a turn than at the more integrated decision points in the convex spaces.
By means of a serious game, this study shows the manner in which serious games could be used in research on indoor wayfinding. By connecting the game to a server and database, a large variety of information could be acquired and utilized in a statistical analysis so as to investigate the link between the wayfinding performance, personal characteristics, and building layout in a virtual environment. Although the development of the game is time-consuming and there are some limitations, the advantages of the game medium are numerous: the game factor attracts more participants, some willing to play multiple times, and the participants engaged more in the environment compared to using pictures or passive building exploration. This explorative study provides an approach for the use of gamification in indoor wayfinding research, and the results might be used by researchers who are considering games as a research medium.
Author Contributions
Conceptualization, Methodology, Analysis & Writing, Dries De Leeuw; Analysis, Review & Editing, Laure De Cock; Supervision, Philippe De Maeyer. All authors have read and agreed to the published version of the manuscript.
Funding
This research was funded by Research Foundation Flanders (FWO), grant number FWO17/ASP/242.
Conflicts of Interest
The authors declare no conflict of interest.
Data Availability Statement
The data that support the findings of this study are available in data.mendeley.com with the identifier DOI: jk7vjgjz6y/2.
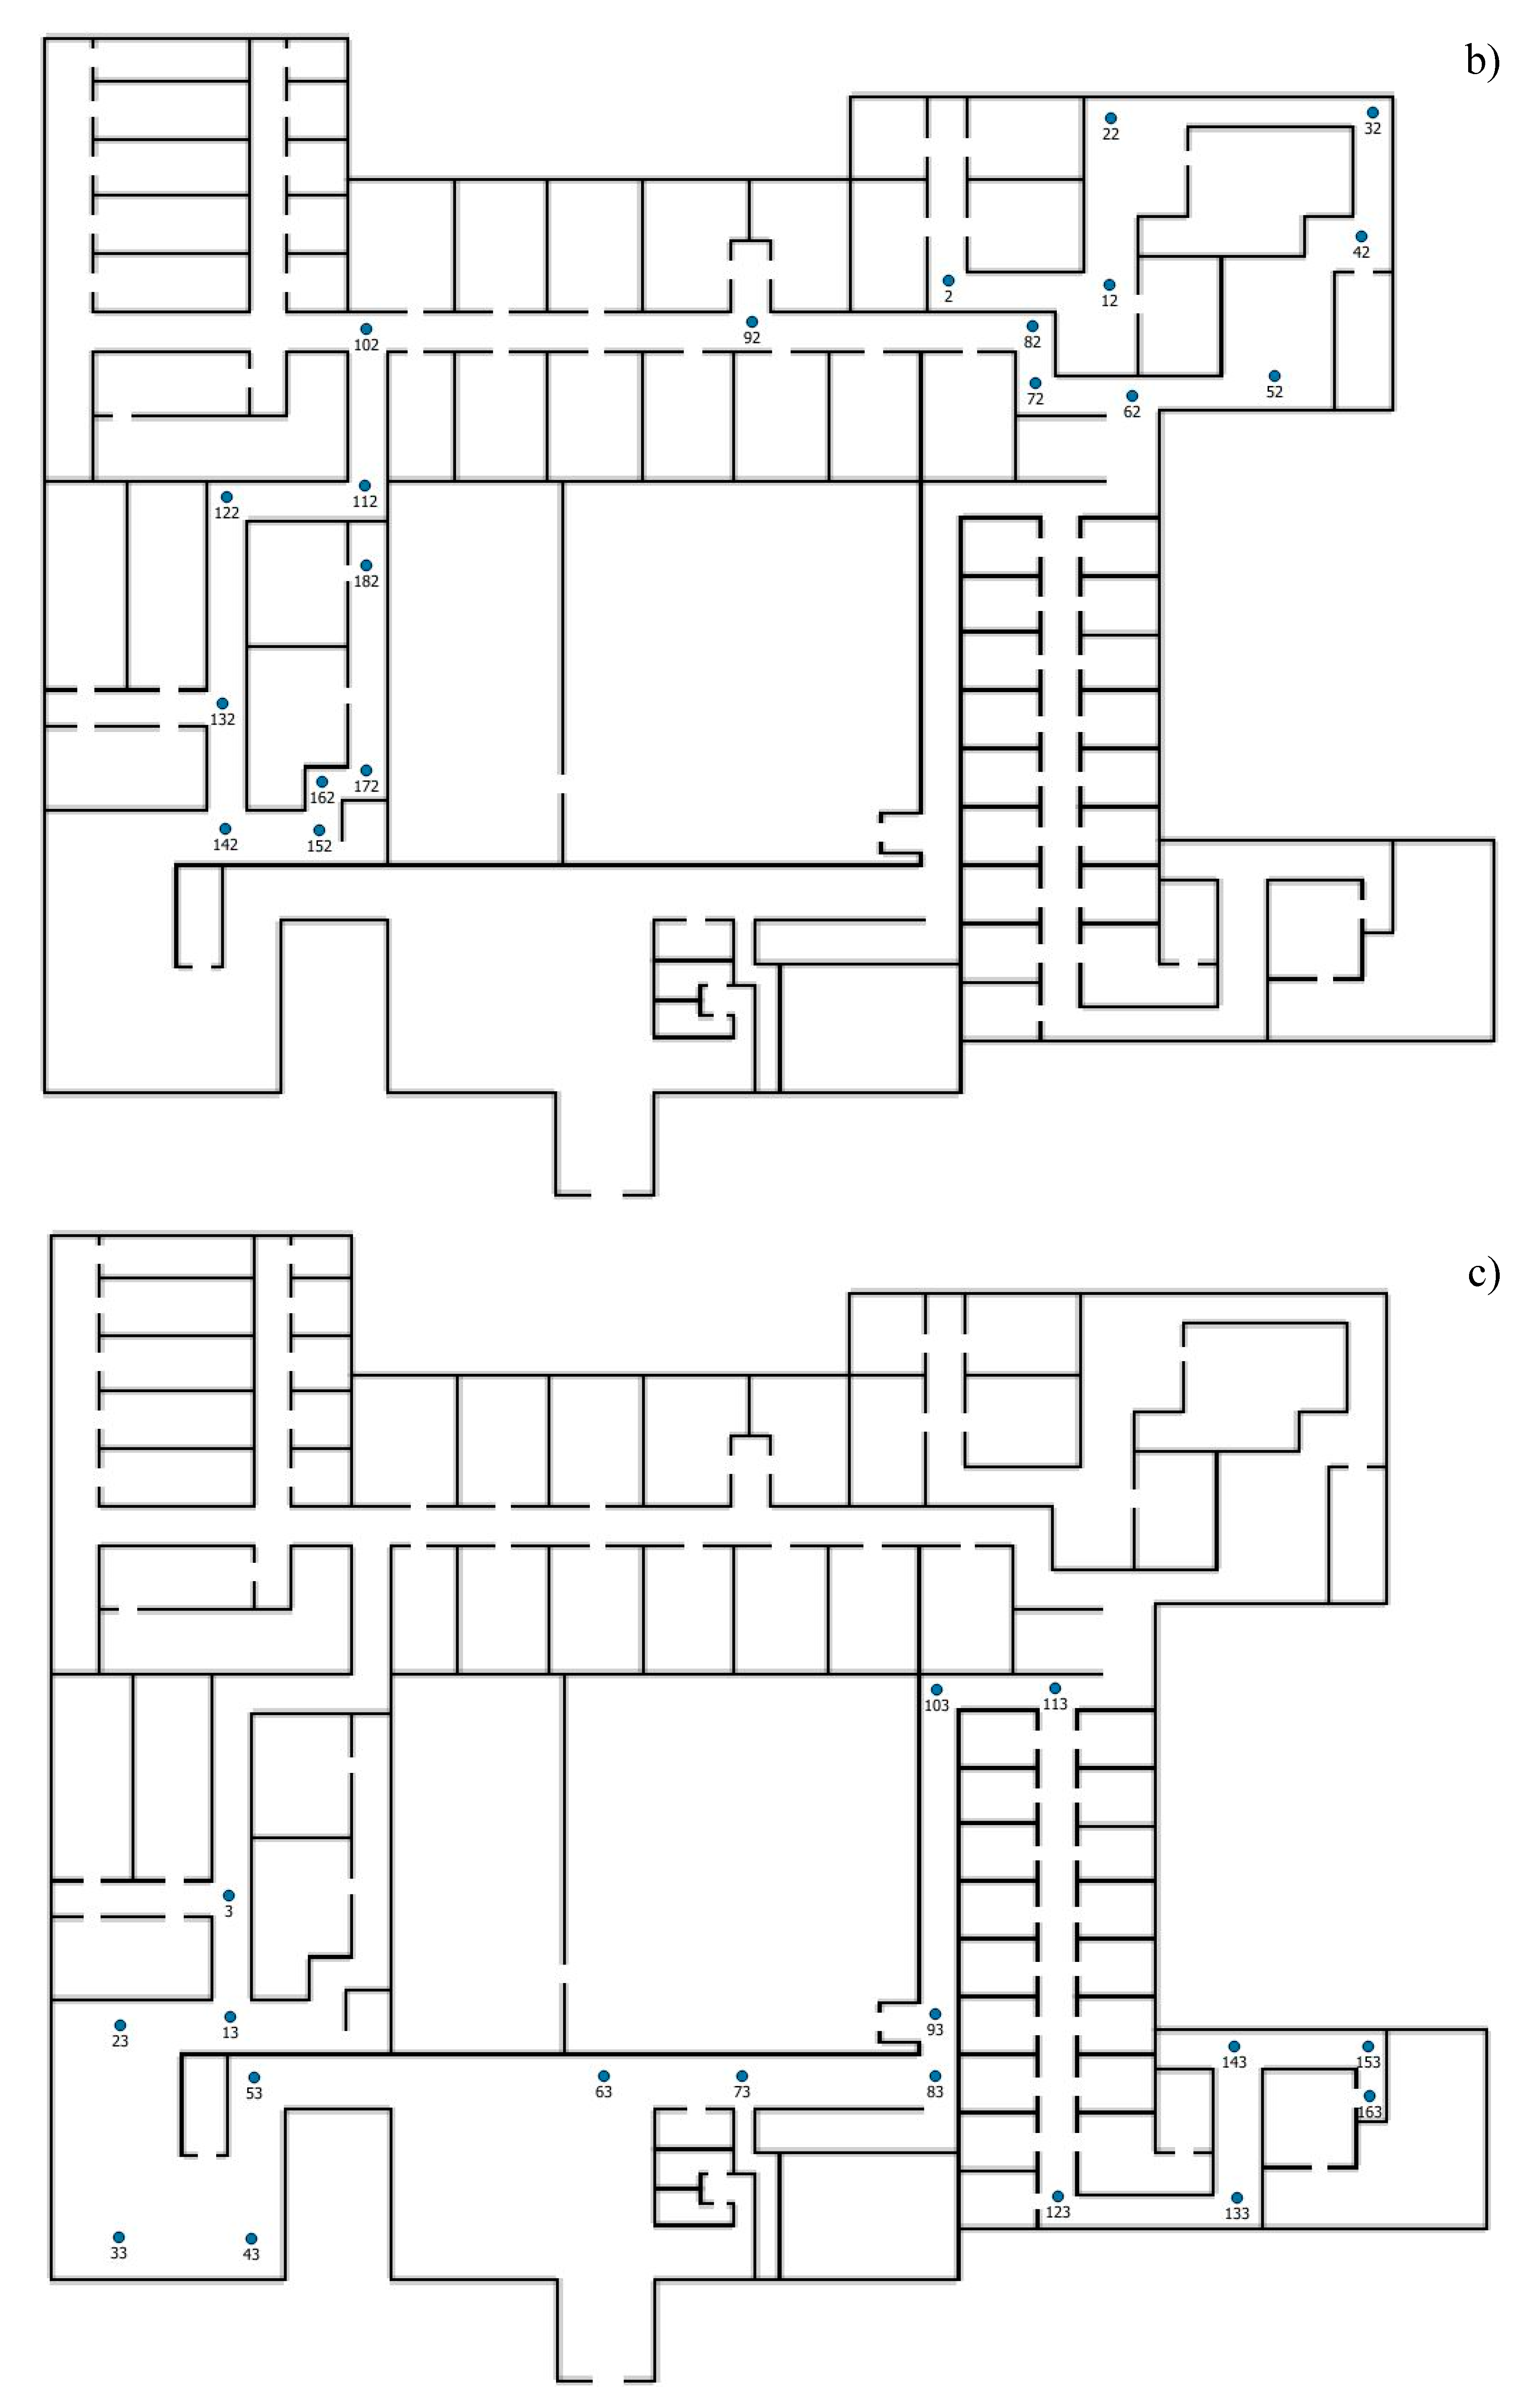
Appendix A
Figure A1.
Overview of the decision points in level 1 (a), level 2 (b), and level 3 (c) represented by their unique IDs.
Figure A1.
Overview of the decision points in level 1 (a), level 2 (b), and level 3 (c) represented by their unique IDs.

References
- Deterding, S.; Sicart, M.; Nacke, L.; O’Hara, K.; Dixon, D. Gamification using game-design elements in non-gaming contexts. In Proceedings of the CHI’11 Extended Abstracts on Human Factors in Computing Systems, Vancouver, BC, Canada, 7–12 May 2011; pp. 2425–2428. [Google Scholar] [CrossRef]
- Weisman, J. Evaluating architectural legibility: Way-finding in the built environment. Environ. Behav. 1981, 13, 189–204. [Google Scholar] [CrossRef]
- Passini, R. Wayfinding: A conceptual framework. Urban Ecol. 1981, 5, 17–31. [Google Scholar] [CrossRef]
- Farr, A.C.; Kleinschmidt, T.; Yarlagadda, P.; Mengersen, K. Wayfinding: A simple concept, a complex process. Transp. Rev. 2012, 32, 715–743. [Google Scholar] [CrossRef] [Green Version]
- Downs, R.M.; Stea, D. Image and Environment: Cognitive Mapping and Spatial Behavior; Transaction Publishers: Piscataway, NJ, USA, 1973. [Google Scholar]
- Viaene, P. Indoor Landmarks: The Study and Implementation of Wayfinding Aids; Ghent University Faculty of Sciences: Ghent, Belgium, 2018. [Google Scholar]
- Lorenz, B.; Ohlbach, H.J.; Stoffel, E.P. A hybrid spatial model for representing indoor environments. In Proceedings of the International Symposium on Web and Wireless Geographical Information Systems, Hong Kong, China, 4–5 December 2006; pp. 102–112. [Google Scholar]
- Bafna, S. Space syntax: A brief introduction to its logic and analytical techniques. Environ. Behav. 2003, 35, 17–29. [Google Scholar] [CrossRef]
- Li, R.; Klippel, A. Using space syntax to understand knowledge acquisition and wayfinding in indoor environments. In Proceedings of the 9th IEEE International Conference on Cognitive Informatics, Beijing, China, 7–9 July 2010; pp. 302–307. [Google Scholar] [CrossRef] [Green Version]
- Wiener, J.M.; Franz, G. Isovists as a means to predict spatial experience and behaviour. In Proceedings of the International Conference on Spatial Cognition, Frauenchiemsee, Germany, 11–13 October 2004; pp. 42–57. [Google Scholar] [CrossRef] [Green Version]
- Montello, D.R. Spatial cognition and architectural space: Research perspectives. Archit. Des. 2014, 84, 74–79. [Google Scholar] [CrossRef]
- De Cock, L.; Ooms, K.; Van de Weghe, N.; Vanhaeren, N.; Pauwels, P.; De Maeyer, P. Identifying what constitutes complexity perception of decision points during indoor route guidance. Int. J. Geogr. Inf. Sci. 2020, 1–19. [Google Scholar] [CrossRef]
- Vanhaeren, N.; De Cock, L.; Lapon, L.; Van de Weghe, N.; Ooms, K.; De Maeyer, P. On the Right Track: Comfort and Confusion in Indoor Environments. ISPRS Int. J. Geo-Inf. 2020, 9, 132. [Google Scholar] [CrossRef] [Green Version]
- De Cock, L.; Ooms, K.; Van de Weghe, N.; Vanhaeren, N.; De Maeyer, P. User Preferences on Route Instruction Types for Mobile Indoor Route Guidance. ISPRS Int. J. Geo-Inf. 2019, 8, 482. [Google Scholar] [CrossRef] [Green Version]
- Zichermann, G.; Cunningham, C. Gamification by Design: Implementing Game Mechanics in Web and Mobile Apps; O’Reilly Media, Inc.: Sebastopol, CA, USA, 2011. [Google Scholar]
- Kapp, K.M. The Gamification of Learning and Instruction: Game-Based Methods and Strategies for Training and Education; John Wiley & Sons: Hoboken, NJ, USA, 2012. [Google Scholar]
- Xu, F.; Buhalis, D.; Weber, J. Serious games and the gamification of tourism. Tour. Manag. 2017, 60, 244–256. [Google Scholar] [CrossRef]
- Hamari, J.; Koivisto, J.; Sarsa, H. Does gamification work? A literature review of empirical studies on gamification. In Proceedings of the 47th International Conference on System Sciences, Waikoloa, HI, USA, 6–9 January 2014; pp. 3025–3034. [Google Scholar] [CrossRef]
- Newman, G.; Wiggins, A.; Crall, A.; Graham, E.; Newman, S.; Crowston, K. The future of citizen science: Emerging technologies and shifting paradigms. Front. Ecol. Environ. 2012, 10, 298–304. [Google Scholar] [CrossRef] [Green Version]
- Bowser, A.; Hansen, D.; He, Y.; Boston, C.; Reid, M.; Gunnell, L.; Preece, J. Using gamification to inspire new citizen science volunteers. In Proceedings of the First International Conference on Gameful Design, Research, and Applications, New York, NY, USA, 2–4 October 2013; pp. 18–25. [Google Scholar] [CrossRef]
- Van der Kuil, M.N.; Visser-Meily, J.M.; Evers, A.W.; Van der Ham, I.J. A usability study of a serious game in cognitive rehabilitation: A compensatory navigation training in acquired brain injury patients. Front. Psychol. 2018, 9, 846. [Google Scholar] [CrossRef] [PubMed] [Green Version]
- Spiers, H.; Hornberger, M.; Bohbot, V.; Dalton, R.; Hölscher, C.; Manley, E.; Weiner, J. Sea Hero Quest; Glitchers: London, UK, 2016. [Google Scholar]
- Noulas, A.; Scellato, S.; Mascolo, C.; Pontil, M. An empirical study of geographic user activity patterns in foursquare. In Proceedings of the Fifth International AAAI Conference on Weblogs and Social Media, Barcelona, Spain, 17–21 July 2011. [Google Scholar]
- McKenzie, G. Gamification and location-based services. In Proceedings of the Workshop on Cognitive Engineering for Mobile GIS, Belfast, ME, USA, 12 September 2011. [Google Scholar]
- Schwering, A.; Münzer, S.; Bartoschek, T.; Li, R. Gamification for spatial literacy: The use of a desktop application to foster map-based competencies. In Proceedings of the 17th AGILE International Conference on Geographic Information Science-Workshop Games, Castellón, Spain, 3–6 June 2014. [Google Scholar]
- Bartoschek, T.; Schwering, A.; Li, R.; Münzer, S.; Carlos, V. OriGami: A mobile geogame for spatial literacy. In Geogames and Geoplay; Springer: Cham, Switzerland, 2018; pp. 37–62. [Google Scholar]
- Schlieder, C.; Kiefer, P.; Matyas, S. Geogames: Designing location-based games from classic board games. IEEE Intell. Syst. 2006, 21, 40–46. [Google Scholar] [CrossRef]
- Schlieder, C. Representing the meaning of spatial behavior by spatially grounded intentional systems. In Proceedings of the International Conference on GeoSpatial Sematics, Mexico City, Mexico, 29–30 November 2005. [Google Scholar]
- Feulner, B.; Kremer, D. Using geogames to foster spatial thinking. In Proceedings of the GI_Forum—Geospatial Innovation for Society, Salzburg, Germany, 6–10 July 2014. [Google Scholar]
- Bell, M.; Chalmers, M.; Barkhuus, L.; Hall, M.; Sherwood, S.; Tennent, P.; Hampshire, A. Interweaving mobile games with everyday life. In Proceedings of the SIGCHI Conference on Human Factors in Computing Systems, New York, NY, USA, 5–10 April 2006; pp. 417–426. [Google Scholar]
- Chakraborty, N.; Haworth, B.; Usman, M.; Berseth, G.; Faloutsos, P.; Kapadia, M. Crowd sourced co-design of floor plans using simulation guided games. In Proceedings of the Tenth International Conference on Motion in Games, Barcelona, Spain, 8–10 November 2017; pp. 1–5. [Google Scholar]
- Usman, M.; Schaumann, D.; Haworth, B.; Berseth, G.; Kapadia, M.; Faloutsos, P. Interactive spatial analytics for human-aware building design. In Proceedings of the 11th Annual International Conference on Motion, Interaction, and Games, Limassol, Cyprus, 8–10 November 2018; pp. 1–12. [Google Scholar]
- Yesiltepe, D.; Dalton, R.; Ozbil, A.; Dalton, N.; Noble, S.; Hornberger, M.; Spiers, H. Usage of Landmarks in Virtual Environments for Wayfinding: Research on the influence of global landmarks. In Proceedings of the 12th International Space Syntax Symposium, Beijing, China, 8–13 July 2019. [Google Scholar]
- Ramadan, R.; Widyani, Y. Game development life cycle guidelines. In Proceedings of the International Conference on Advanced Computer Science and Information Systems, Kuta, Indonesia, 28–29 September 2013; pp. 95–100. [Google Scholar] [CrossRef]
- McElhinney, S. Isovist_2.1: A Basic User Guide, v1.1. Available online: http://www. isovists.org/user_guide/ (accessed on 3 March 2020).
- Powers, K.L.; Brooks, P.J.; Aldrich, N.J.; Palladino, M.A.; Alfieri, L. Effects of video-game play on information processing: A meta-analytic investigation. Psychon. Bull. Rev. 2013, 20, 1055–1079. [Google Scholar] [CrossRef] [PubMed] [Green Version]
- Groeppel-Klein, A.; Bartmann, B. Anti-clockwise or clockwise? The impact of store layout on the process of orientation in a discount store. Eur. Adv. Consum. Res. 2007, 8, 415–416. [Google Scholar]
- Dogu, U.; Erkip, F. Spatial factors affecting wayfinding and orientation: A case study in a shopping mall. Environ. Behav. 2000, 32, 731–755. [Google Scholar] [CrossRef]
- Baskaya, A. Wayfinding in an unfamiliar environment: Different spatial settings of two polyclinics. Environ. Behav. 2004, 36, 839–867. [Google Scholar] [CrossRef] [Green Version]
- Marquardt, G.; Schmieg, P. Dementia-friendly architecture: Environments that facilitate wayfinding in nursing homes. Am. J. Alzheimer’s Dis. Other Dement. 2009, 24, 333–340. [Google Scholar] [CrossRef] [PubMed] [Green Version]
Figure 1.
Floor plan of the indoor environment.
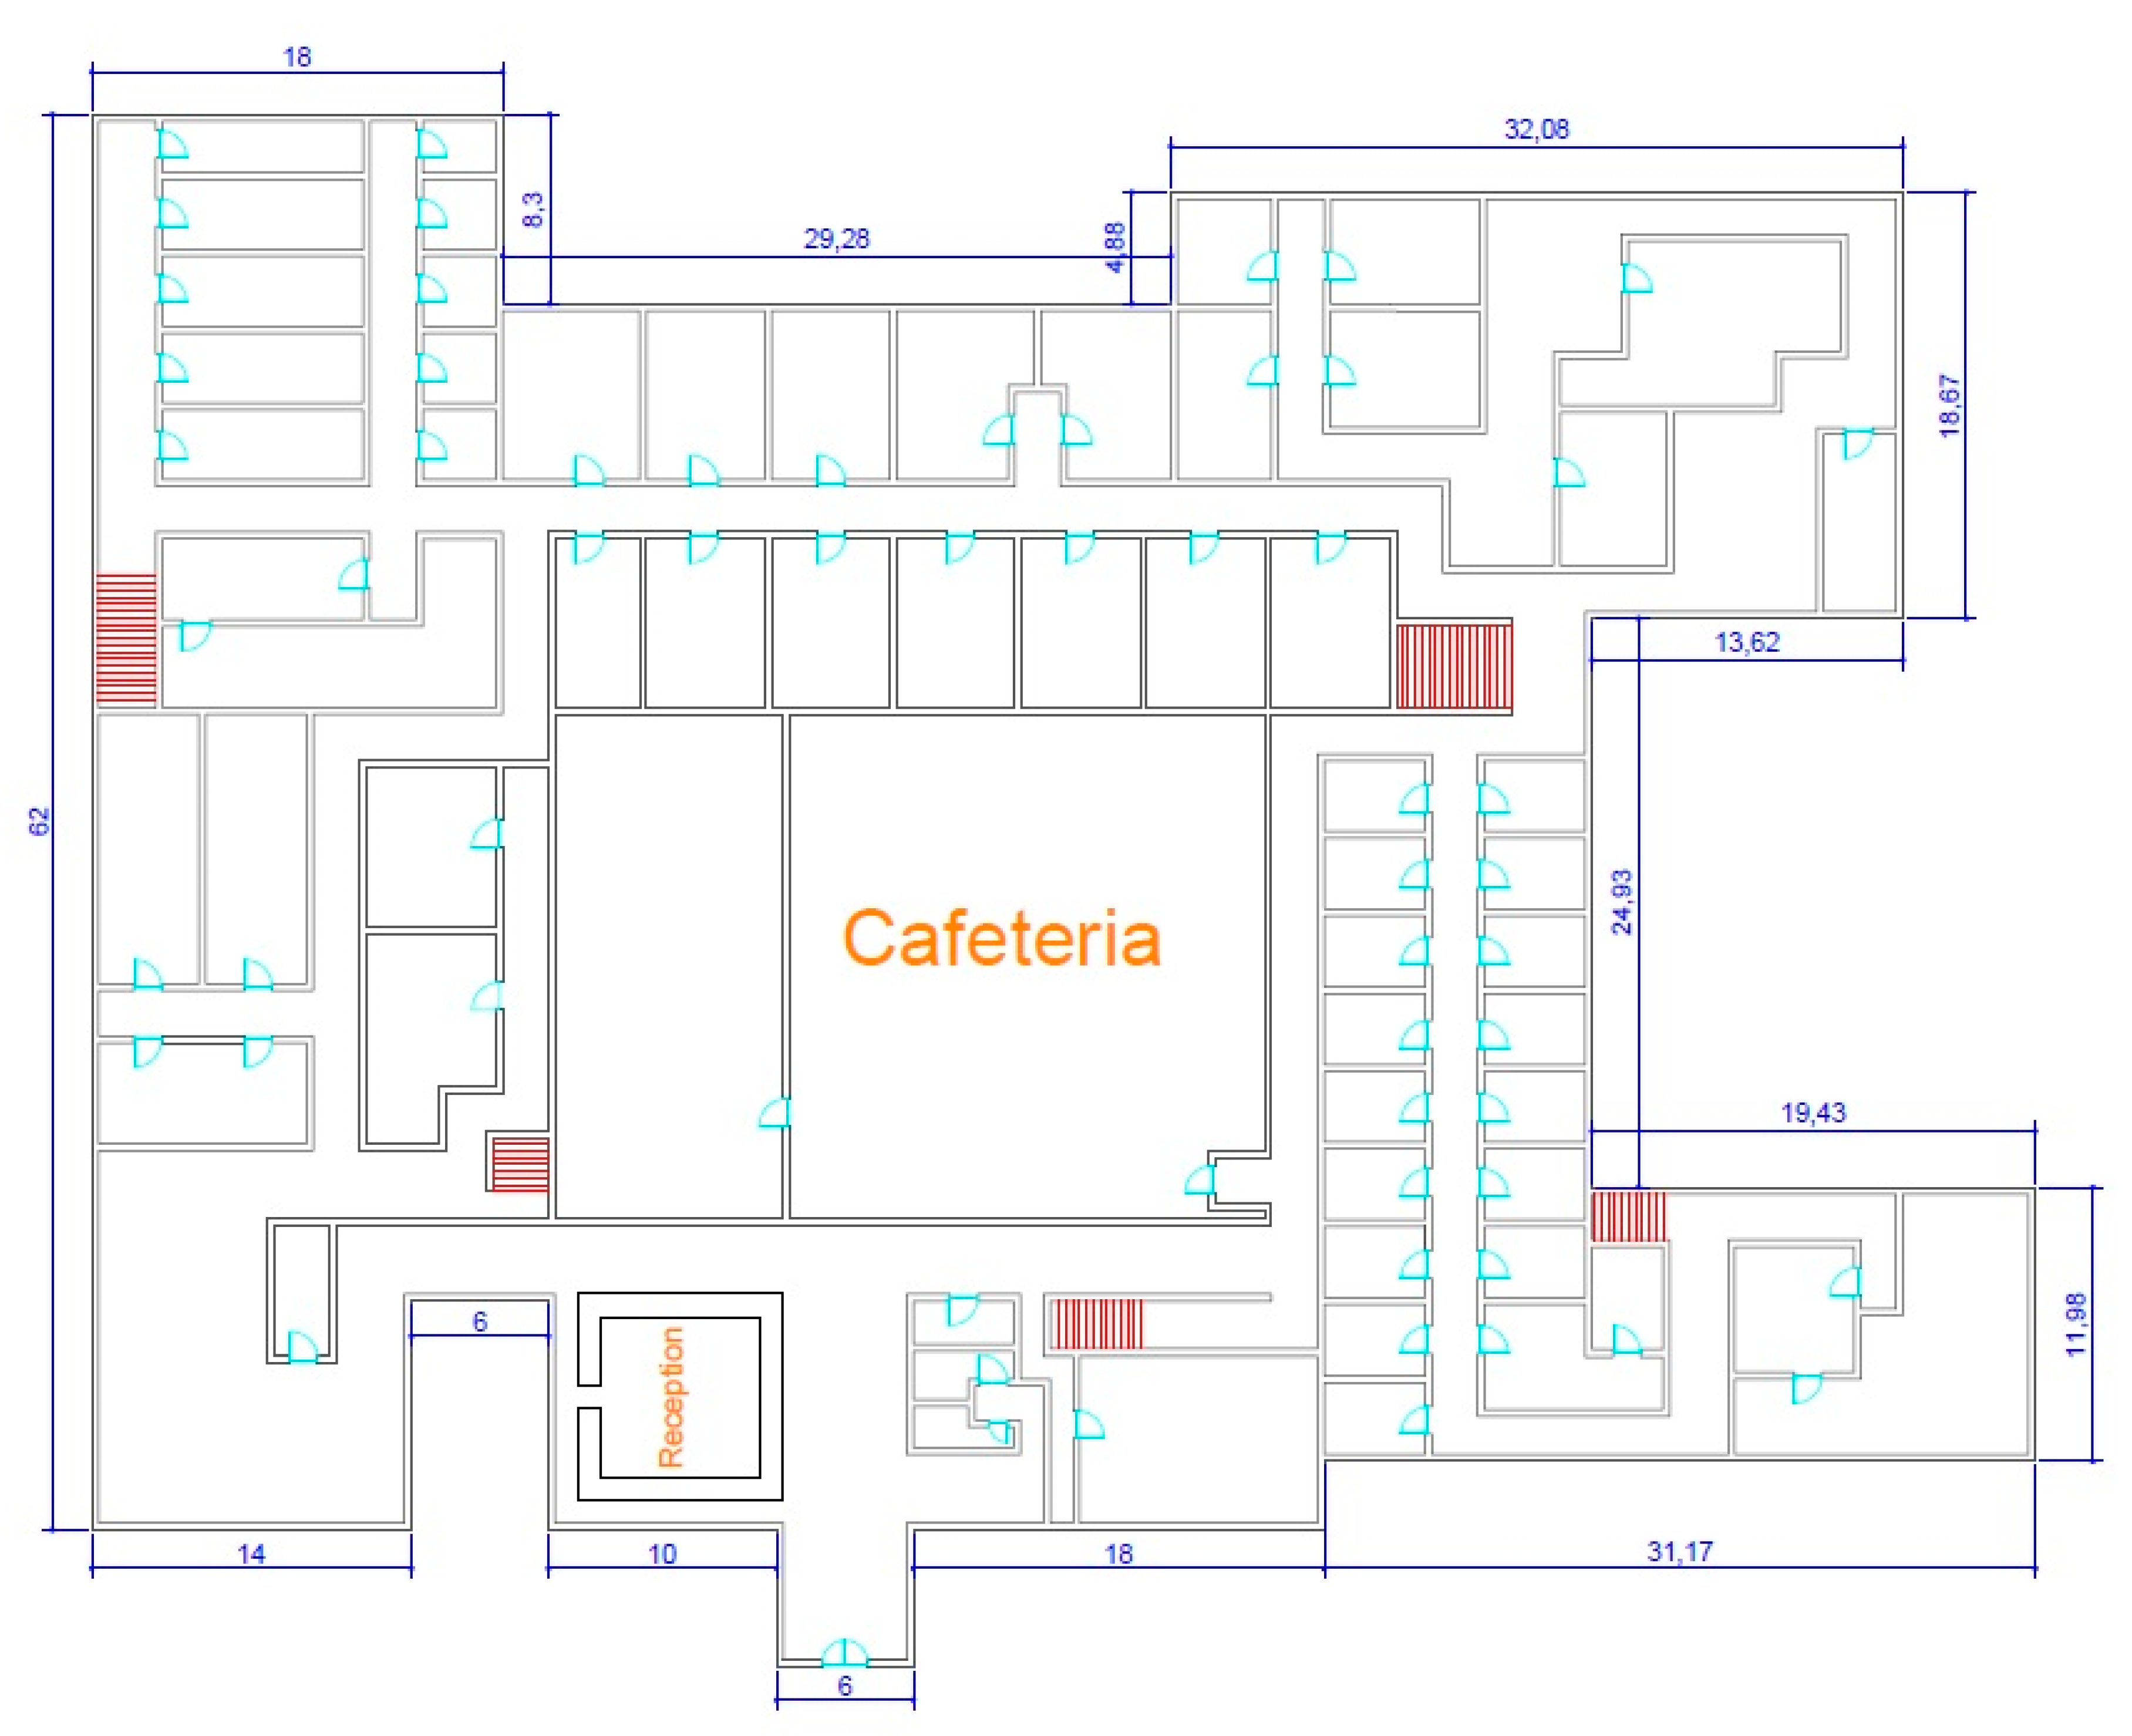
Figure 2.
Avatar implementation and orientation of the local coordinate reference system.

Figure 3.
Illustration of the indoor route design from origin (O) to destination (D) for all three levels.
Figure 3.
Illustration of the indoor route design from origin (O) to destination (D) for all three levels.

Figure 4.
Indoor navigation simulator game example.

Figure 5.
Landmark categorization.

Figure 6.
Flowchart of the statistical analysis.
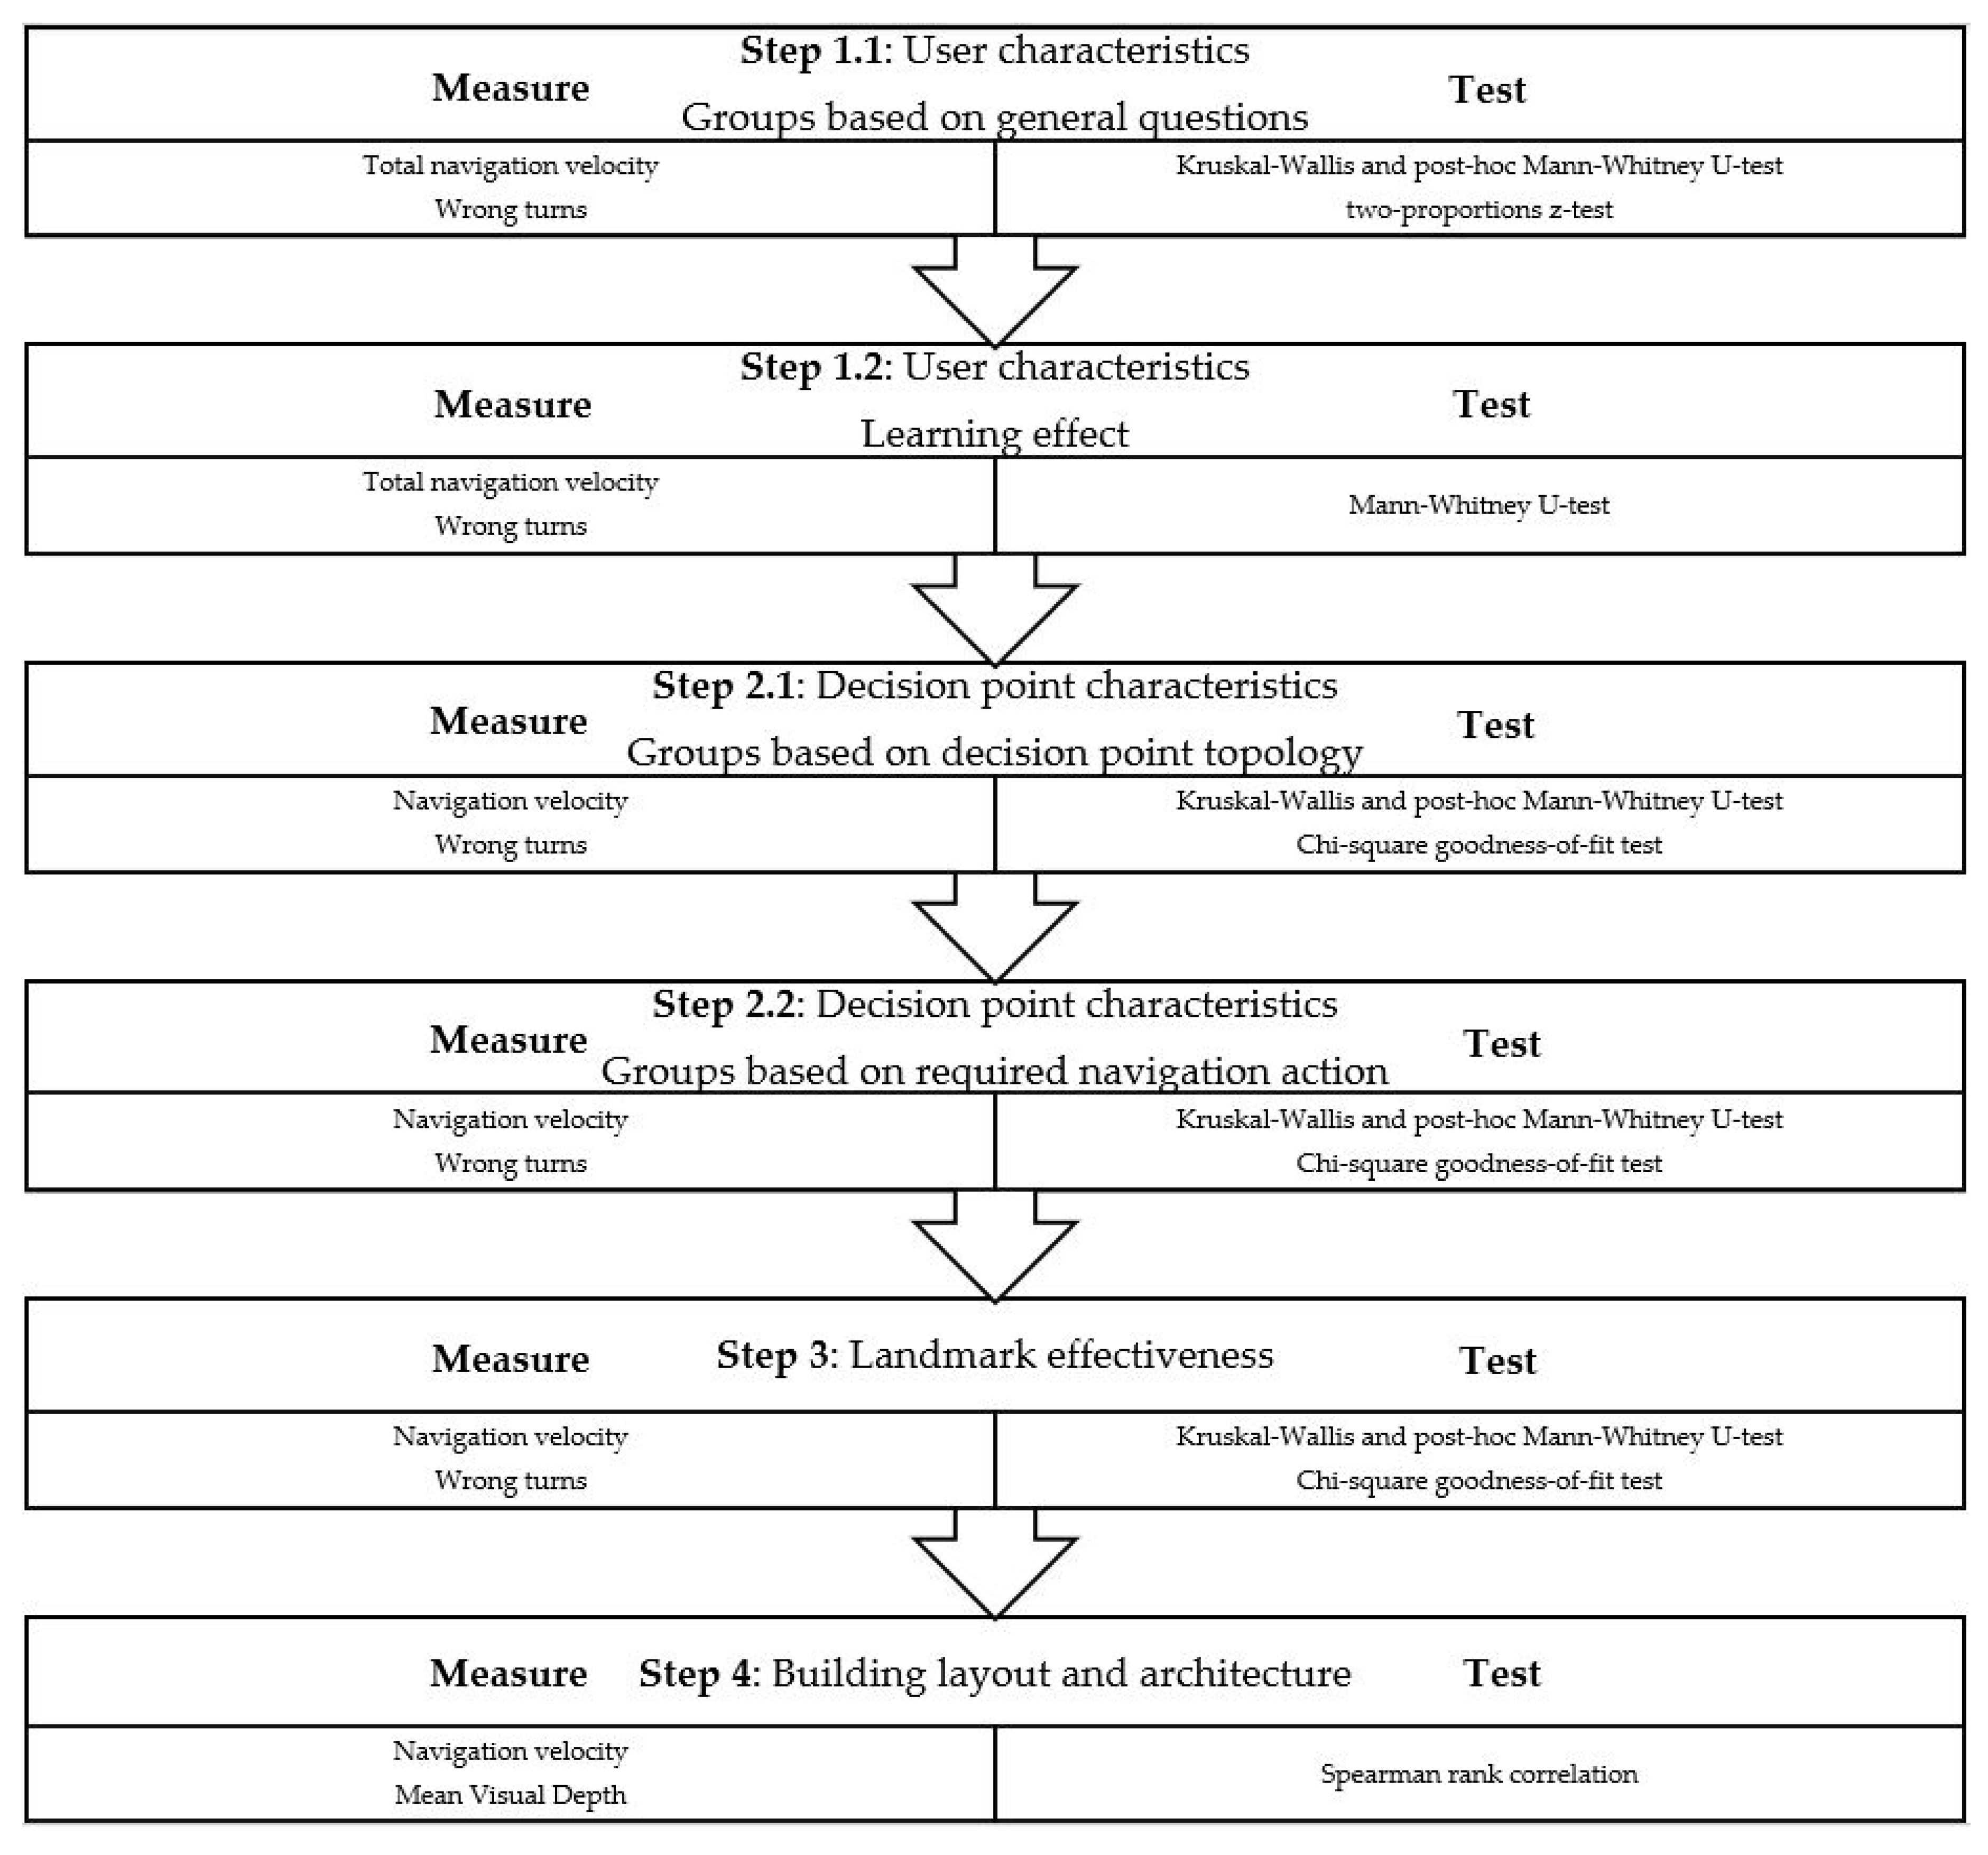
Figure 7.
Total navigation velocity in tries 1 and 2 for all three levels.
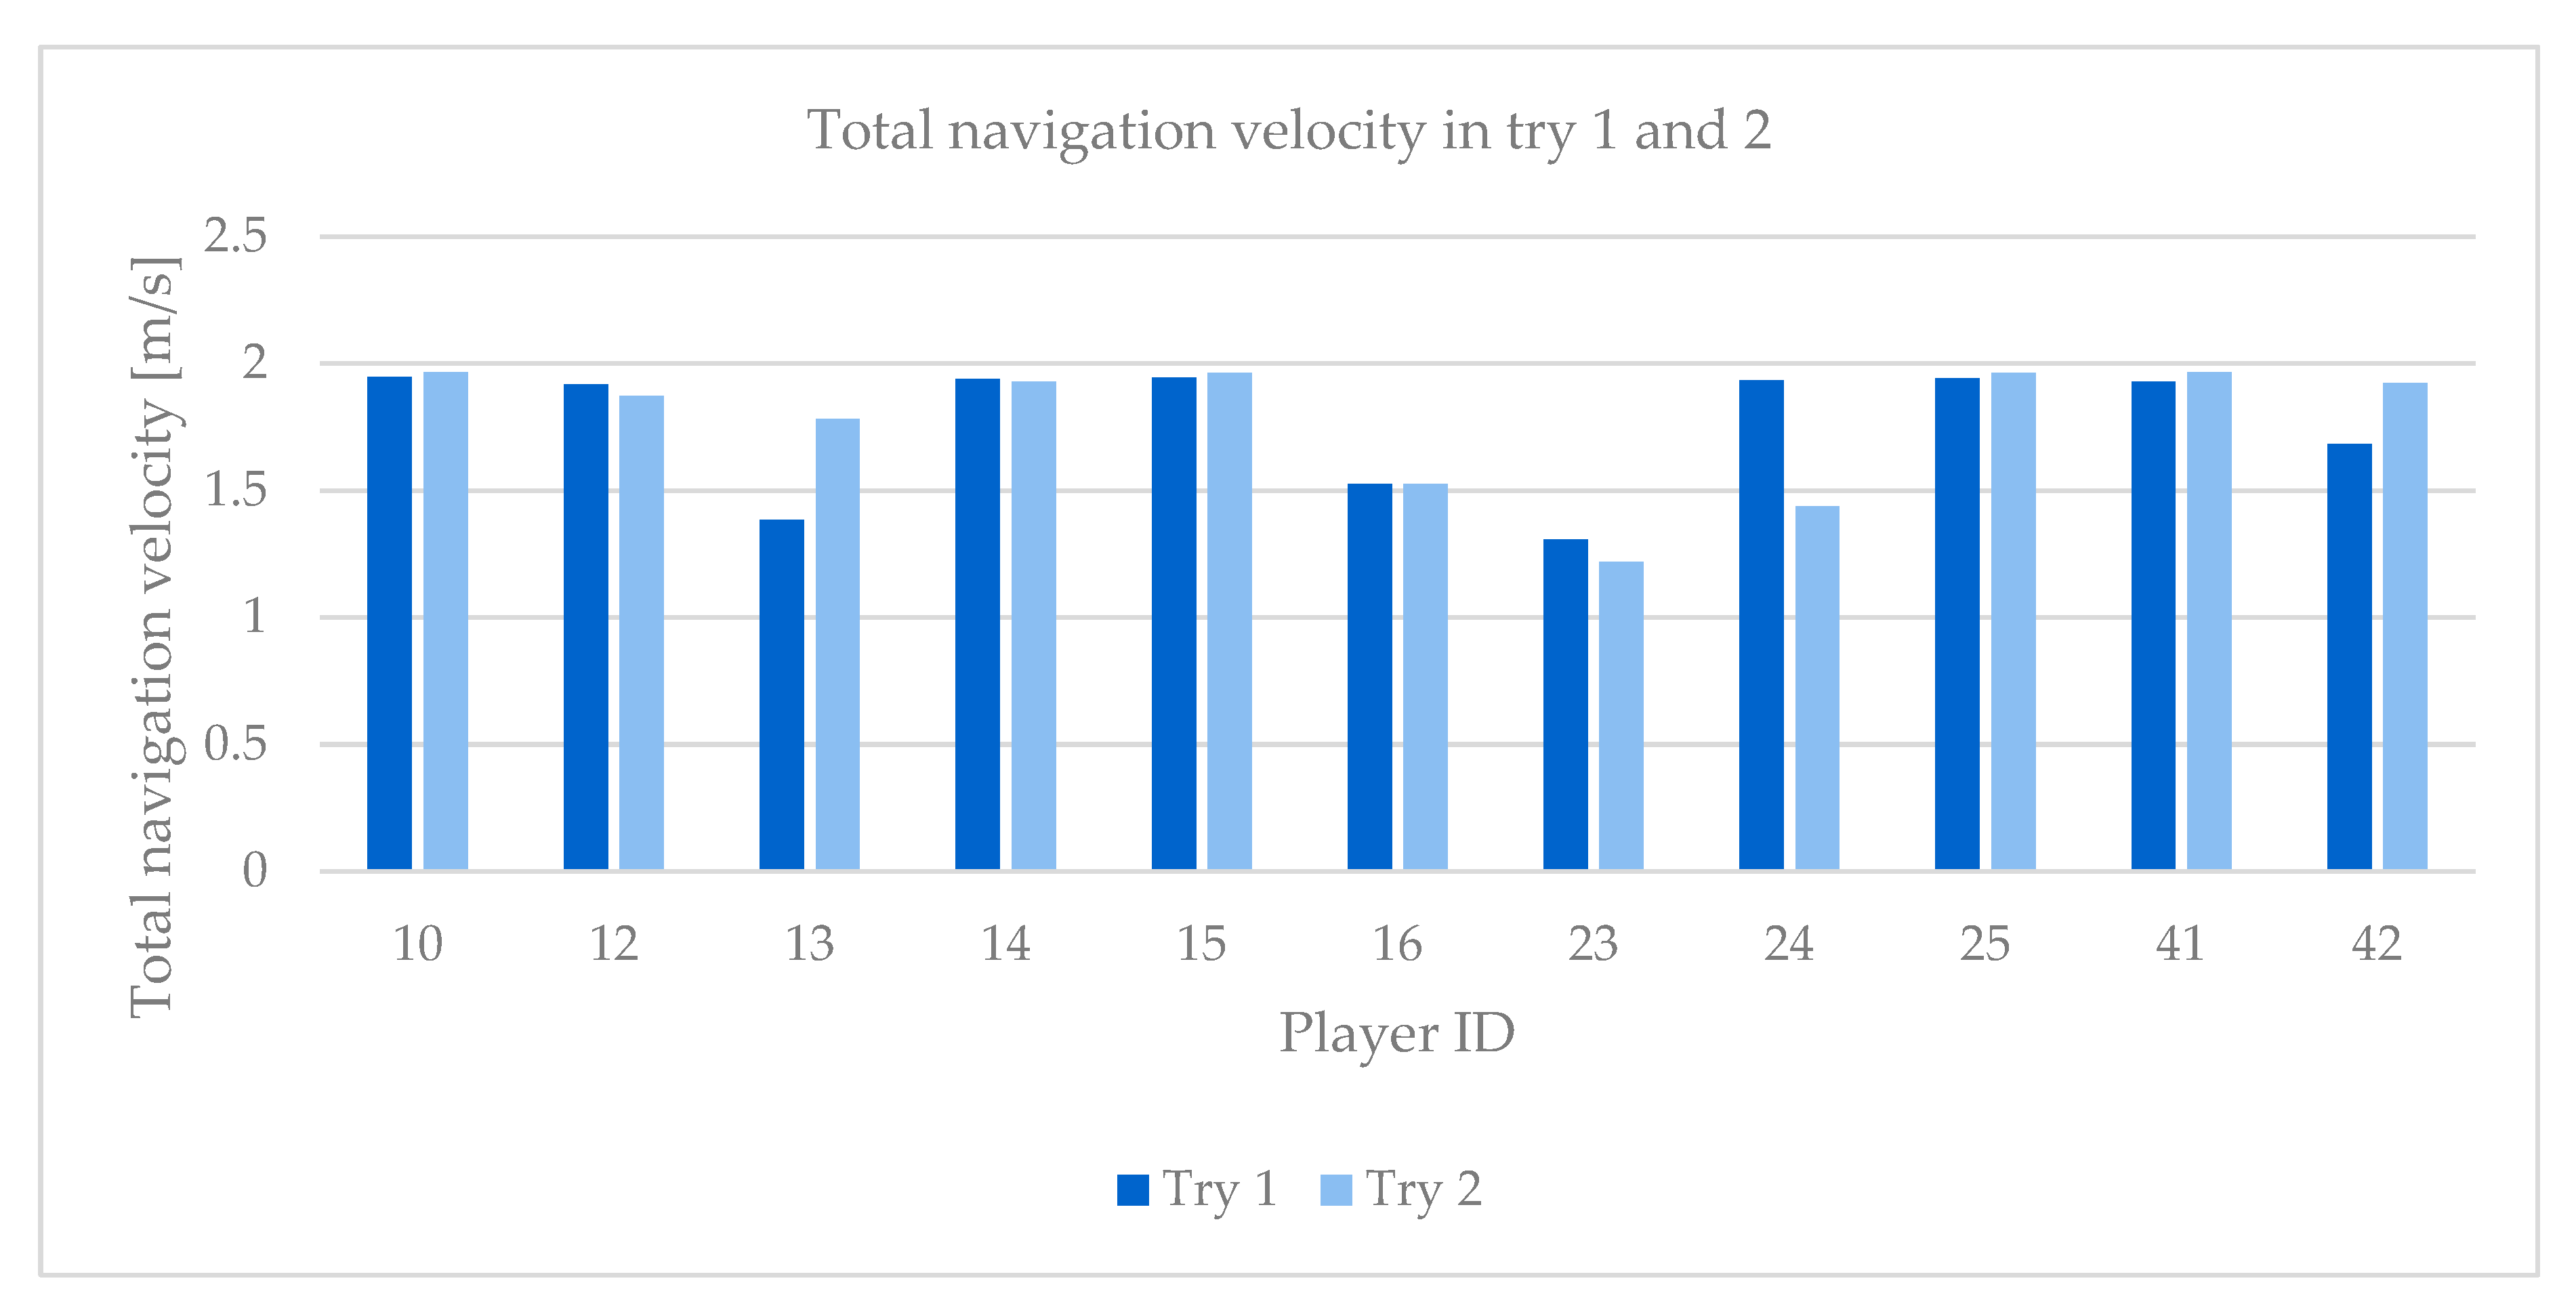
Figure 8.
Decision points in deep and shallow spaces.
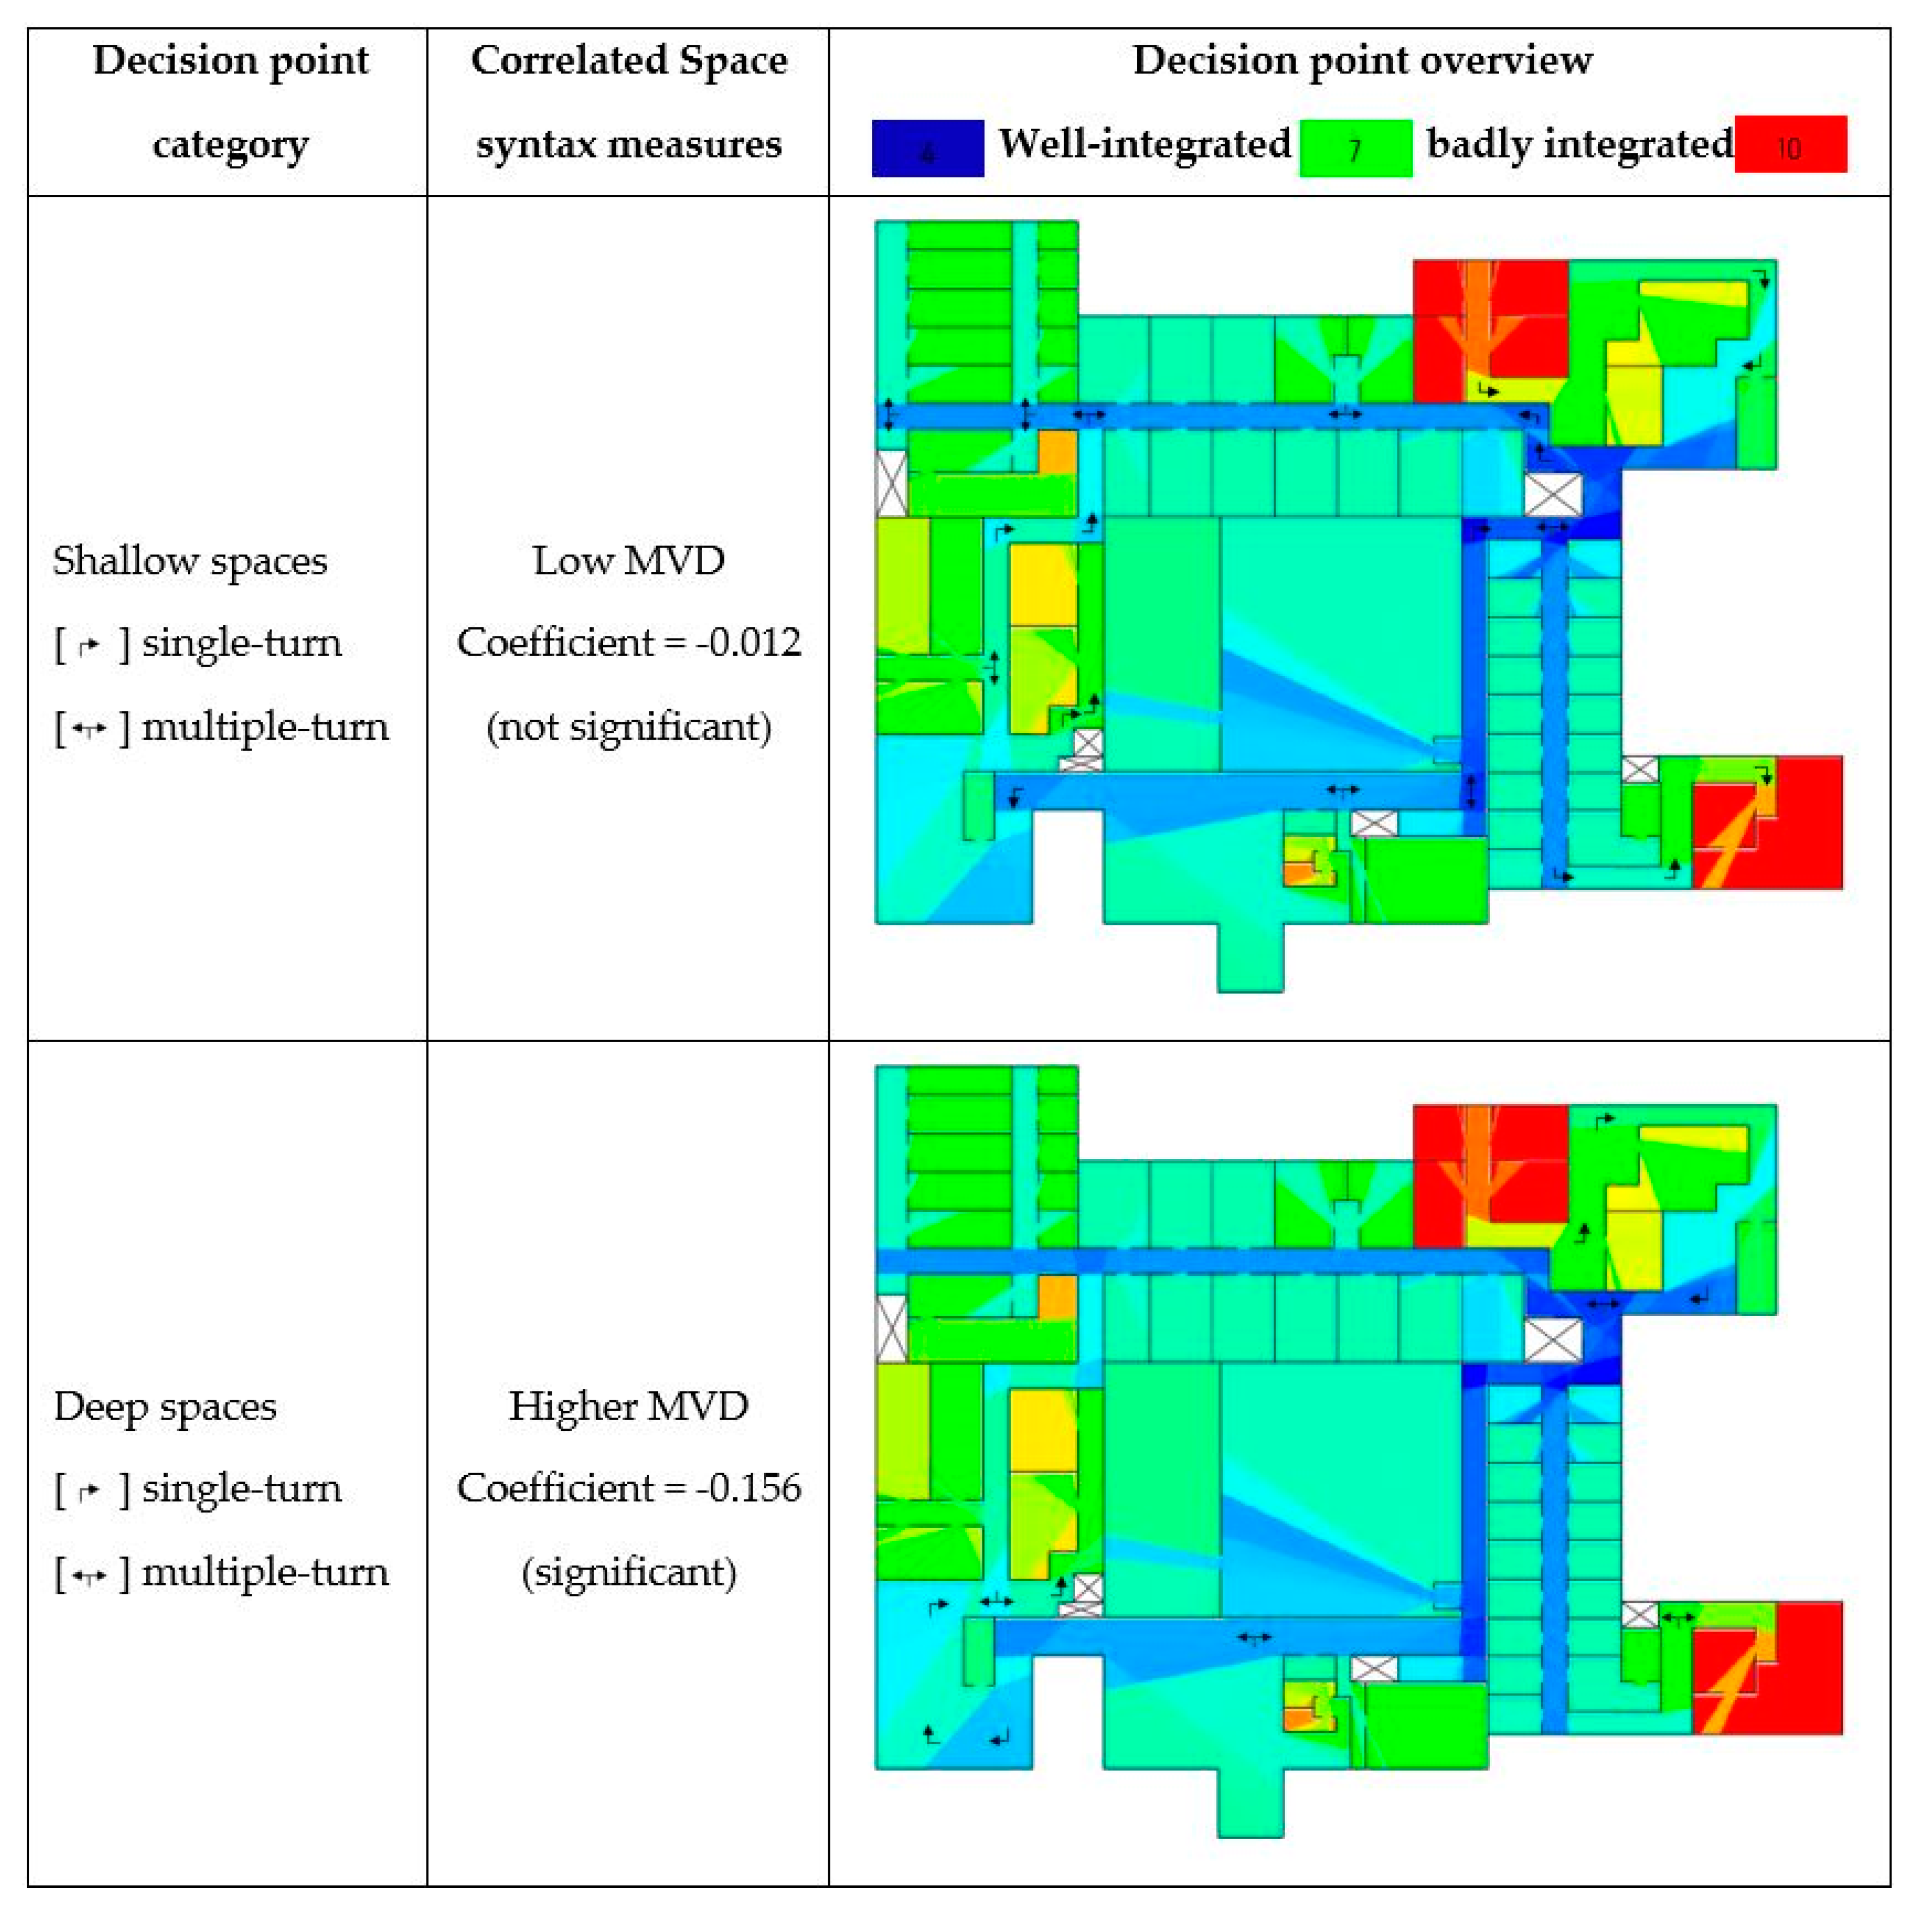
Figure 9.
Heat flow of the movement from the origin (O) to the destination (D) in level 1 with resolution of 2 m.
Figure 9.
Heat flow of the movement from the origin (O) to the destination (D) in level 1 with resolution of 2 m.

Figure 10.
Heat flow of the movement from the origin (O) to the destination (D) in level 2 with a resolution of 5 m and red squares emphasizing the higher densities in the cells that contain a pictogram.
Figure 10.
Heat flow of the movement from the origin (O) to the destination (D) in level 2 with a resolution of 5 m and red squares emphasizing the higher densities in the cells that contain a pictogram.
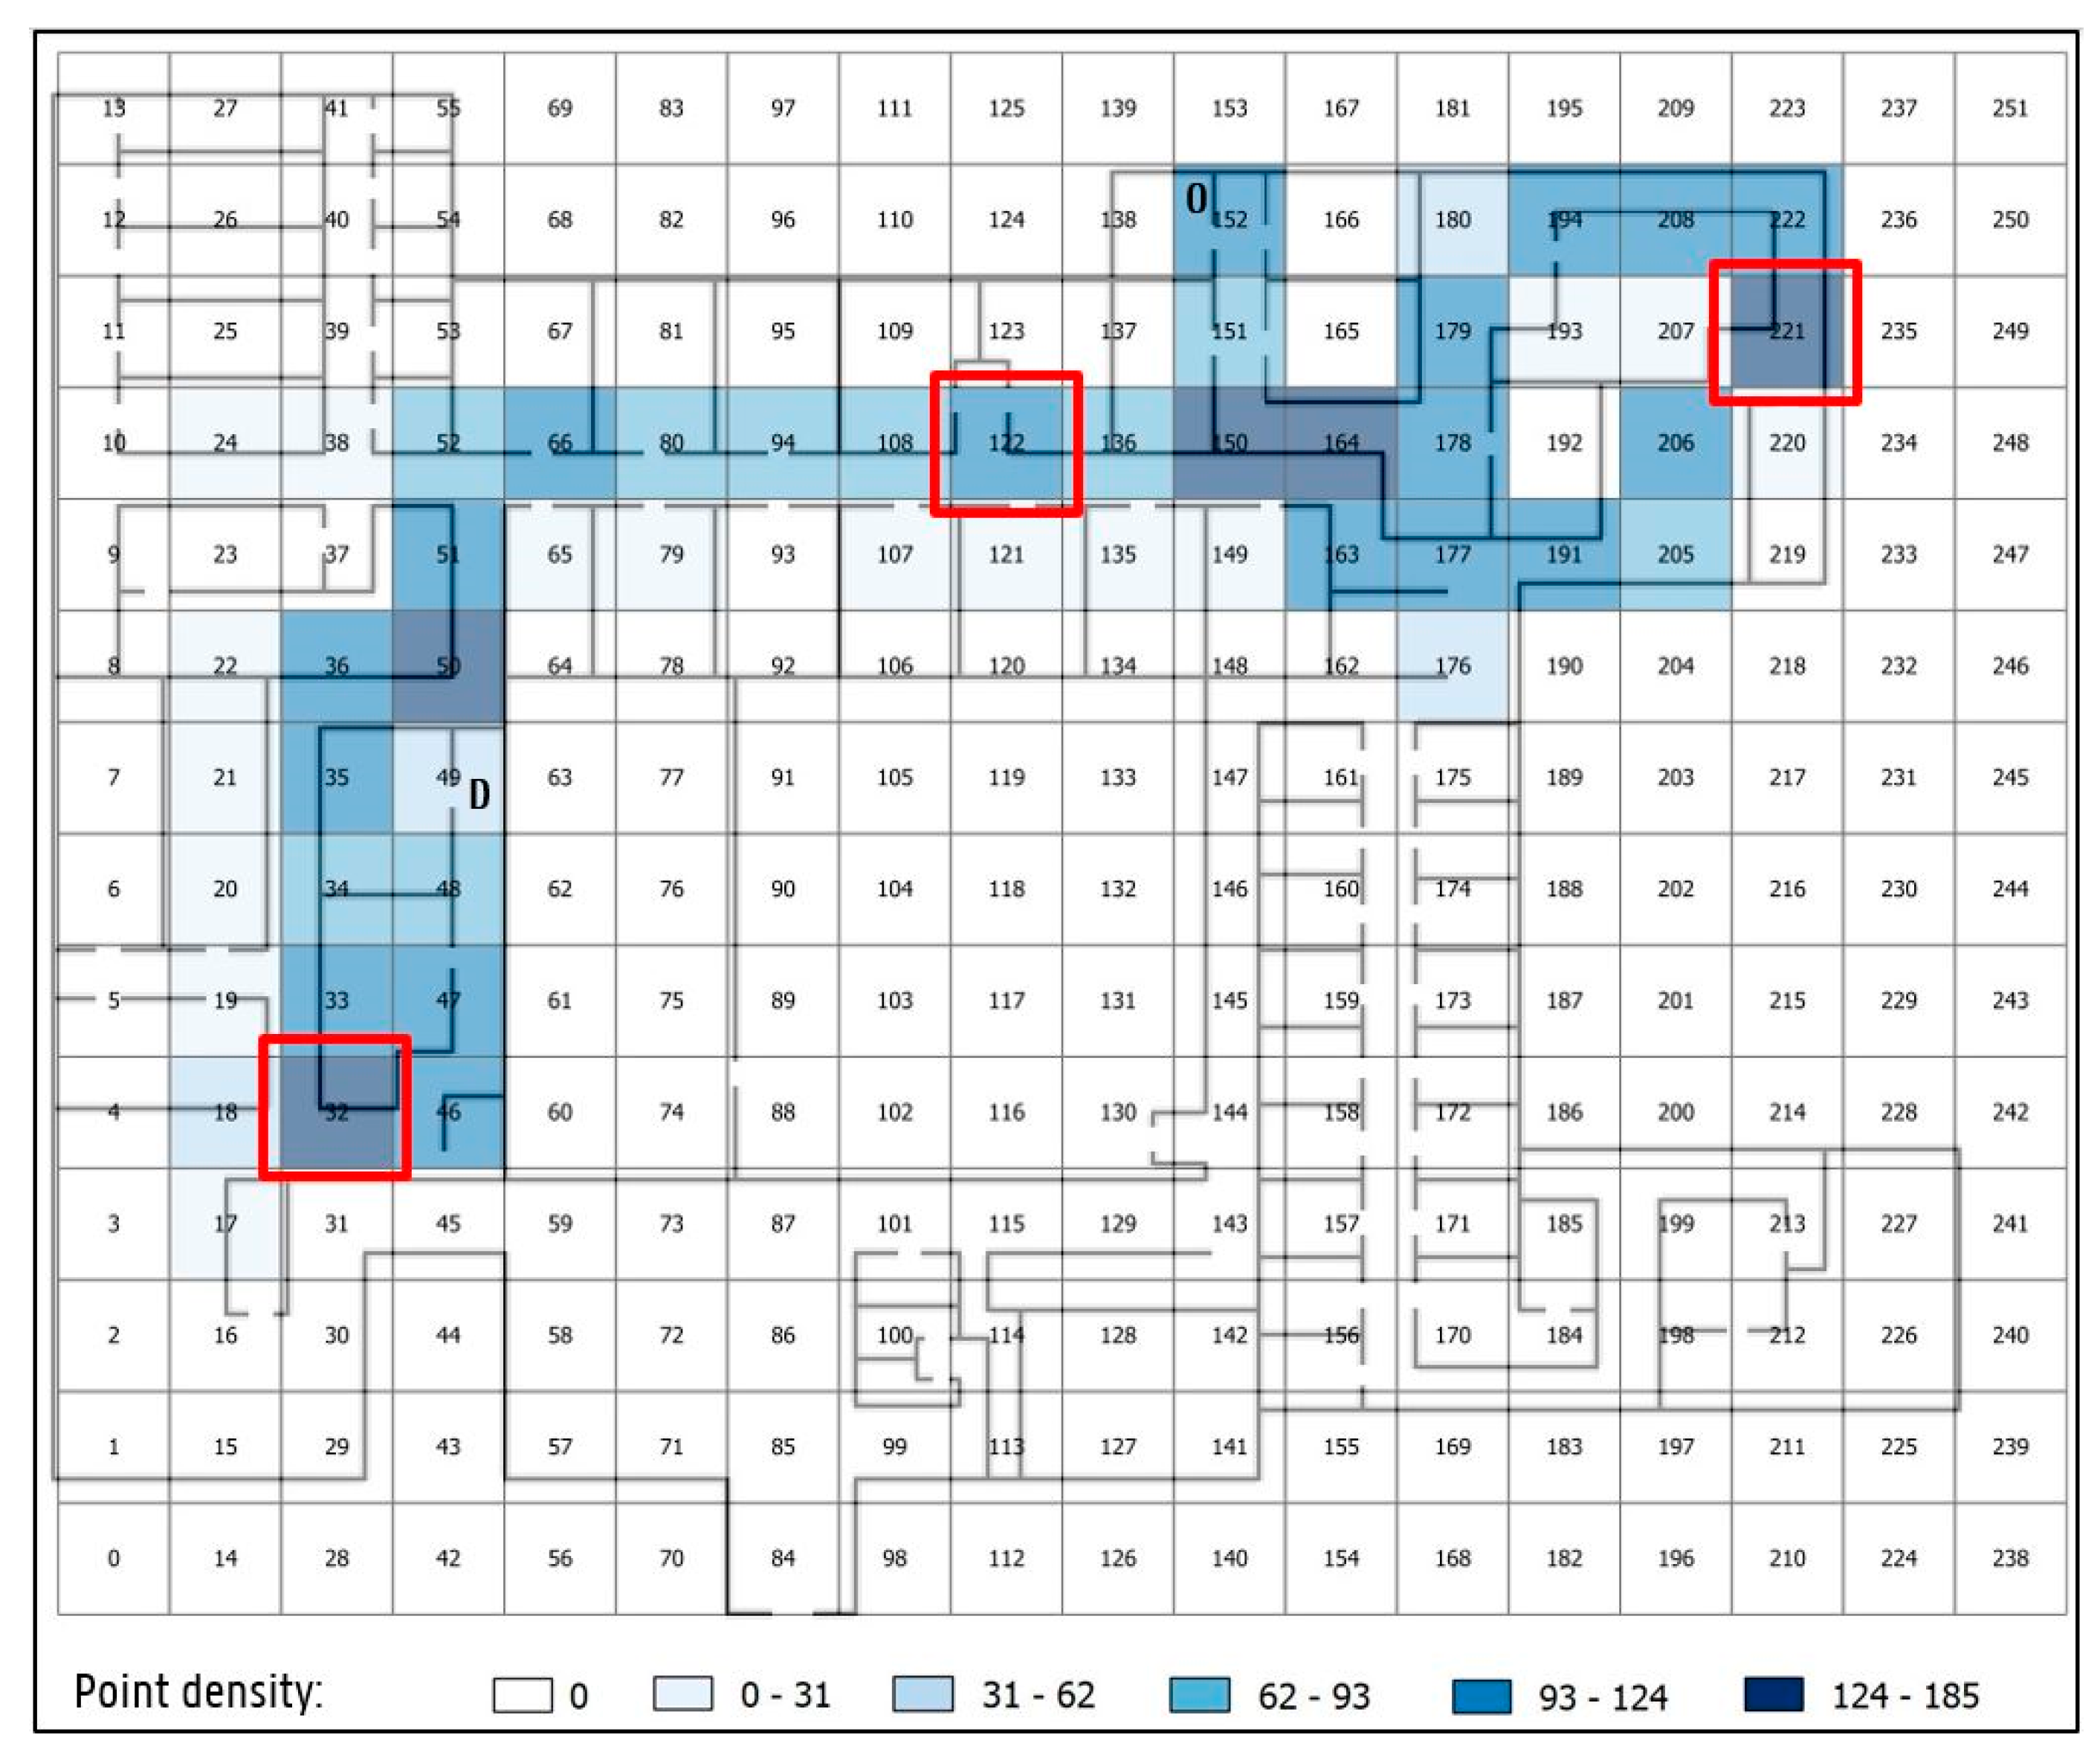
Figure 11.
Visualization of infrastructural and object decision points.

Table 1.
Landmark overview.
| Number | ID | Landmark | DP | Level | Unique ID |
|---|---|---|---|---|---|
| 1 | 1 | Reception Desk | 0 | 1 | 1 |
| 2 | 2 | Painting 1 | 1 | 1 | 11 |
| 3 | 3 | Plant | 3 | 1 | 31 |
| 4 | 4 | Chairs | 4 | 1 | 41 |
| 5 | 5 | Snack Automat | 5 | 1 | 51 |
| 6 | 6 | Stairs | 6 | 1 | 61 |
| 7 | 7 | Fire Extinguisher | 7 | 1 | 71 |
| 8 | 8 | Poster | 10 | 1 | 101 |
| 9 | 9 | Stairs Icon | 12 | 1 | 121 |
| 10 | 10 | Waiting Chairs | 1 | 2 | 12 |
| 11 | 3 | Plant | 3 | 2 | 32 |
| 12 | 11 | Emergency Exit Icon | 4 | 2 | 42 |
| 13 | 12 | Painting 2 | 5 | 2 | 52 |
| 14 | 13 | Stairs | 6 | 2 | 62 |
| 15 | 14 | Lavatory Icon | 9 | 2 | 92 |
| 16 | 8 | Poster | 10 | 2 | 102 |
| 17 | 7 | Fire Extinguisher | 13 | 2 | 132 |
| 18 | 9 | Stairs Icon | 14 | 2 | 142 |
| 19 | 6 | Stairs | 15 | 2 | 152 |
| 21 | 7 | Fire Extinguisher | 0 | 3 | 3 |
| 22 | 9 | Stairs Icon | 1 | 3 | 13 |
| 23 | 5 | Snack Automat | 2 | 3 | 23 |
| 24 | 4 | Chairs | 3 | 3 | 33 |
| 25 | 3 | Plant | 4 | 3 | 43 |
| 26 | 2 | Painting 1 | 6 | 3 | 63 |
| 27 | 16 | Briefcase | 7 | 3 | 73 |
| 28 | 17 | Bookcase | 8 | 3 | 83 |
| 29 | 18 | Restaurant Icon | 9 | 3 | 93 |
| 30 | 19 | Lion Statue | 11 | 3 | 113 |
| 31 | 20 | Painting 3 | 13 | 3 | 133 |
| 32 | 21 | Stairs | 14 | 3 | 143 |
Table 2.
User characteristics.
| Age Category | Education Level | At least One Wrong Turn | |||
|---|---|---|---|---|---|
| 18–20 | 27% | Higher | 98% | Yes | 83% |
| 21–25 | 56% | Primary | 2% | No | 17% |
| 26–30 | 10% | ||||
| 30+ | 7% | ||||
| General questions | |||||
| Do you often have trouble with indoor wayfinding? | Do you often play video games? | ||||
| Yes | 24% | 32% | |||
| No | 76% | 68% | |||
Table 3.
Significance of differences between the groups of participants based on their navigation velocities over the the different levels.
Table 3.
Significance of differences between the groups of participants based on their navigation velocities over the the different levels.
| Groups of Participants | p Values |
|---|---|
| One-tailed significance values resulting from a Kruskal–Wallis test | |
| Question (1) Do you often have trouble with indoor wayfinding? | 0.832 |
| At least one wrong turn | 0.332 |
| Question (2) Do you often play video games? | 0.000 * |
| One-tailed significance value resulting from a Mann–Whitney U-test (with Bonferroni correction) | |
| Question (2) Yes > No | 0.000 * |
* Significant at the 95% confidence level.
Table 4.
Significance of differences between the groups of participants based on the proportion of wrong turns over the amount of participants in the group.
Table 4.
Significance of differences between the groups of participants based on the proportion of wrong turns over the amount of participants in the group.
| Groups of Participants | p Values |
|---|---|
| * Two-proportions z-test | |
| Question (1) Do you often have trouble with indoor wayfinding? | 0.465 |
| Question (2) Do you often play video games? | 0.804 |
* Significant at the 95% confidence level.
Table 5.
Number of wrong turns made by participants in tries 1 and 2.
| Player ID | Try 1 | Try 2 |
|---|---|---|
| 10 | 2 | 0 |
| 12 | 0 | 0 |
| 13 | 3 | 0 |
| 14 | 0 | 2 |
| 15 | 1 | 0 |
| 16 | 0 | 2 |
| 23 | 0 | 3 |
| 24 | 0 | 1 |
| 25 | 1 | 2 |
| 41 | 0 | 0 |
| 42 | 1 | 0 |
Table 6.
Significance of differences between the categories of decision points based on the navigation velocity of the participants at each decision point.
Table 6.
Significance of differences between the categories of decision points based on the navigation velocity of the participants at each decision point.
| Groups of Decision Points | p Values |
|---|---|
| One-tailed significance values resulting from a Kruskal–Wallis test | |
| Categorization based on the topology | 0.000 * |
| Categorization based on the required wayfinding action | 0.000 * |
| One-tailed significance values resulting from a Mann–Whitney U-test (with Bonferroni correction) | |
| Topology-based | |
| Single-turn > Multiple-turn | 0.999 |
| Single-turn > Start/end | 0.000 * |
| Multiple-turn > Single-turn | 0.000 * |
| Multiple-turn > Start/end | 0.000 * |
| Start/end > Single-turn | 0.999 |
| Start/end > Multiple-turn | 0.999 |
| Wayfinding action-based | |
| Straightforward > Turn right | 0.000 * |
| Straightforward > Turn left | 0.000 * |
| Turn right > Turn left | 0.999 |
| Turn right > Straight forward | 0.999 |
| Turn left > Turn right | 0.999 |
| Turn left > Straight forward | 0.999 |
* Significant at the 95% confidence level.
Table 7.
Chi-square goodness-of-fit test between the observed and the expected amounts of wrong turns in the decision point groups categorized on the required wayfinding action.
Table 7.
Chi-square goodness-of-fit test between the observed and the expected amounts of wrong turns in the decision point groups categorized on the required wayfinding action.
| Group | Observed | Expected | |
| Straightforward | 13 | 29.7 | |
| Turn left | 38 | 19.8 | |
| Turn right | 15 | 16.5 | |
| Chi-square | 0.000 * | ||
* Significant at the 95% confidence level.
Table 8.
Significant differences between the landmark categories based on the navigation velocity of the participants at each decision point.
Table 8.
Significant differences between the landmark categories based on the navigation velocity of the participants at each decision point.
| Groups of Landmarks | p Values |
|---|---|
| One-tailed significance value resulting from a Kruskal–Wallis test | |
| Categorization | 0.000 * |
| One-tailed significance values resulting from a Mann–Whitney U-test (with Bonferroni correction) | |
| No landmark > Furniture | 0.008 * |
| Infrastructural > Furniture | 0.018 * |
| Objects > No landmark | 0.000 * |
| Objects > Infrastructural | 0.000 * |
| Objects > Pictograms | 0.000 * |
| Objects > Decorations | 0.000 * |
| Objects > Furniture | 0.000 * |
* Significant at the 95% confidence level.
Table 9.
Chi-square goodness-of-fit test between the observed and expected amounts of wrong turns in the landmark type-based categories.
Table 9.
Chi-square goodness-of-fit test between the observed and expected amounts of wrong turns in the landmark type-based categories.
| Group | Observed | Expected | |
|---|---|---|---|
| Infrastructural | 20 | 27.79 | |
| Pictograms | 11 | 17.36 | |
| Decorations | 11 | 6.95 | |
| Objects | 13 | 10.42 | |
| Furniture | 11 | 3.47 | |
| Chi-square | 0.000 * | ||
* Significant at the 95% confidence level.
Table 10.
Spearman rank correlation coefficient of the mean visual depth (MVD) and navigation velocity.
Table 10.
Spearman rank correlation coefficient of the mean visual depth (MVD) and navigation velocity.
| Groups | Correlation Coefficient |
|---|---|
| Spearman rank correlation | |
| General coefficient | −0.063 * |
| Deep spaces | −0.156 * |
| Shallow spaces | −0.012 |
* Significant at the 99% confidence level.
Table 11.
Overview of the wrong turns at the decision points with corresponding landmark type and topology-based categorization.
Table 11.
Overview of the wrong turns at the decision points with corresponding landmark type and topology-based categorization.
| Decision Point (Unique ID) | Wrong Turns | Landmark Type-Based Category | Topology-Based Category |
|---|---|---|---|
| 3 | 4 | Infrastructural | Turn right |
| 11 | 4 | Decorations | Turn left |
| 13 | 4 | Pictograms | Turn right |
| 61 | 4 | Infrastructural | Turn left |
| 62 | 8 | Infrastructural | Straight forward |
| 71 | 3 | Infrastructural | Straight forward |
| 83 | 11 | Furniture | Turn left |
| 92 | 1 | Pictograms | Straight forward |
| 101 | 7 | Objects | Turn left |
| 102 | 6 | Objects | Turn left |
| 113 | 7 | Decorations | Turn right |
| 132 | 1 | Infrastructural | Straight forward |
| 142 | 6 | Pictograms | Turn left |
Table 12.
Quantitative overview of the categorization based on the different types of landmarks.
| Landmark Category | Decision Points that Require a Turn (%) | Observed Wrong Turns | Expected Wrong Turns |
|---|---|---|---|
| No landmark | 78% | - | - |
| Infrastructural | 58% | 20 | 27.79 |
| Pictograms | 67% | 11 | 17.36 |
| Decorations | 100% | 11 | 6.95 |
| Objects | 67% | 13 | 10.42 |
| Furniture | 100% | 11 | 3.47 |
Table 13.
Quantitative overview of the MVD values and navigation velocities.
| Landmark Category | Mean MVD Value | Mean Navigation Velocity (m/s) |
|---|---|---|
| Infrastructural | 6.19 | 1.79 |
| Objects | 5.37 | 1.85 |
| Infrastructural Decision Point (ID) | MVD value | navigation velocity (m/s) |
| 61 | 6.01 | 1.96 |
| 152 | 6.44 | 1.82 |
| 172 | 6.93 | 1.58 |
| 143 | 7.23 | 1.11 |
© 2020 by the authors. Licensee MDPI, Basel, Switzerland. This article is an open access article distributed under the terms and conditions of the Creative Commons Attribution (CC BY) license (http://creativecommons.org/licenses/by/4.0/).
Share and Cite
MDPI and ACS Style
De Leeuw, D.; De Maeyer, P.; De Cock, L. A Gamification-Based Approach on Indoor Wayfinding Research. ISPRS Int. J. Geo-Inf. 2020, 9, 423. https://doi.org/10.3390/ijgi9070423
AMA Style
De Leeuw D, De Maeyer P, De Cock L. A Gamification-Based Approach on Indoor Wayfinding Research. ISPRS International Journal of Geo-Information. 2020; 9(7):423. https://doi.org/10.3390/ijgi9070423
Chicago/Turabian StyleDe Leeuw, Dries, Philippe De Maeyer, and Laure De Cock. 2020. "A Gamification-Based Approach on Indoor Wayfinding Research" ISPRS International Journal of Geo-Information 9, no. 7: 423. https://doi.org/10.3390/ijgi9070423
Note that from the first issue of 2016, this journal uses article numbers instead of page numbers. See further details here.