An Efficient Probabilistic Registration Based on Shape Descriptor for Heritage Field Inspection


1
School of Remote Sensing & Geomatics Engineering, Nanjing University of Information Science & Technology, 219 Ningliu Road, Nanjing 210044, China
2
Department of Geoscience and Remote Sensing, Delft University of Technology, Stevinweg 1, 2628 CN Delft, The Netherlands
3
State Key Laboratory of Information Engineering in Surveying, Mapping, and Remote Sensing, Wuhan University, Wuhan 430079, China
4
College of Geological Engineering and Geomatics, Chang’an University, Xi’an 710054, China
5
Jiangxi College of Applied Technology, Ganzhou 341000, China
*
Author to whom correspondence should be addressed.
ISPRS Int. J. Geo-Inf. 2020, 9(12), 759; https://doi.org/10.3390/ijgi9120759
Submission received: 26 October 2020
/
Revised: 13 December 2020
/
Accepted: 17 December 2020
/
Published: 19 December 2020
(This article belongs to the Special Issue Cultural Heritage Mapping and Observation)
Abstract
:Heritage documentation is implemented by digitally recording historical artifacts for the conservation and protection of these cultural heritage objects. As efficient spatial data acquisition tools, laser scanners have been widely used to collect highly accurate three-dimensional (3D) point clouds without damaging the original structure and the environment. To ensure the integrity and quality of the collected data, field inspection (i.e., on-spot checking the data quality) should be carried out to determine the need for additional measurements (i.e., extra laser scanning for areas with quality issues such as data missing and quality degradation). To facilitate inspection of all collected point clouds, especially checking the quality issues in overlaps between adjacent scans, all scans should be registered together. Thus, a point cloud registration method that is able to register scans fast and robustly is required. To fulfill the aim, this study proposes an efficient probabilistic registration for free-form cultural heritage objects by integrating the proposed principal direction descriptor and curve constraints. We developed a novel shape descriptor based on a local frame of principal directions. Within the frame, its density and distance feature images were generated to describe the shape of the local surface. We then embedded the descriptor into a probabilistic framework to reject ambiguous matches. Spatial curves were integrated as constraints to delimit the solution space. Finally, a multi-view registration was used to refine the position and orientation of each scan for the field inspection. Comprehensive experiments show that the proposed method was able to perform well in terms of rotation error, translation error, robustness, and runtime and outperformed some commonly used approaches.
1. Introduction
Precise documentation of cultural heritage objects is essential for their protection and scientific studies during the restoration and renovation process. To meet the requirements for these applications, highly accurate 3D surface information is required [1]. Lots of measurement systems and technologies are used to collect the information [2,3,4,5]. Among them, laser scanner is an efficient tool to collect accurate 3D point clouds, widely used for cultural heritage objects without damaging their original structure and the environment [6,7,8,9]. When scanning complex objects, optical constraints, such as self-occlusion, field of view (FOV), and depth of field (DOF), bring difficulties to scanning work. These constraints may result in various data quality issues (e.g., data missing, resolution variations, excessive outliers). To ensure the data quality and save on labor costs, field inspection (i.e., on-spot checking the data quality) is often carried out to determine the need for extra scanning [10]. To facilitate inspection of all collected point clouds, especially checking the quality issues in overlaps between adjacent point clouds, all point clouds should be registered together. Thus, a fast and robust registration method is needed that would transform different scans (each scan has one point cloud) into the same coordinate system.
In this study, we propose a novel registration method tailored for field inspection by embedding the principal direction descriptor and curve constraints into the probabilistic framework. The main contributions are as follows: (1) We present a fast and discriminative descriptor to reject incorrect matches, ensuring a global optimum. Compared to local frames of commonly used eigenvectors, the proposed local frame, based on principal directions, introduces fewer distortions and is particularly suitable for cultural heritage objects with severely curved surfaces. (2) The proposed pairwise registration is designed on a probabilistic framework, which exploits the advantages in terms of good generality, high accuracy, and strong robustness. (3) We embedded curve constraints into the probabilistic framework, which constrains the solution space effectively, leading to faster convergence and higher registration accuracy.
The scope of this work covers the fields of feature descriptor and point cloud registration. These aspects are reviewed as follows. In past decades, feature descriptors have been extensively studied. The descriptors were firstly and widely used in 2D images. This category includes 2D point descriptors such as FAST, BRISK (an extension of the FAST algorithm), 2D Scale-Invariant Feature Transform (SIFT) descriptor, and 2D blob descriptors such as ASIFT (the descriptor which considers the affinity), Speeded Up Robust Features (SURF) and CenSurE (center-surround filers) [11,12]. Besides, Chen et al. proposed a simple and robust 2D Weber Local Descriptor (WLD) descriptor. For a given image, two components: differential excitation and orientation are used to construct a concatenated WLD histogram [13]. In the field of 3D point cloud, many researchers construct a local reference frame to describe the geometric information of local surface. Inside this category, the most popular descriptors include signature-based [14], spin image-based [15], shape context-based [16], and Tensor-based descriptors [17]. Moreover, lots of descriptors use statistics or histograms to describe the characteristics of local surface. Examples include the Fast Point Feature Histograms (FPFH) [18], Signature of Histograms of Orientations (SHOT) [19]. Furthermore, many descriptors use dimension reduction to enhance computational efficiency. Examples include principal component analysis (PCA)-based [20] descriptors, binary string-based descriptors [21], and covariance matrix-based descriptors [22]. The above descriptors have demonstrated their superior performance in specific applications. However, most existing feature descriptors still suffer from either low descriptiveness or efficiency. Therefore, an efficient and robust descriptor specifically designed for field inspection is required.
Many automatic registration methods have been developed for 3D laser scanning point clouds. These methods can roughly be classified into two categories based on the involved information, i.e., image-integrated methods and laser point-based methods [23]. Image-integrated methods incorporate attribute information (e.g., color, intensity, reflectance, temperature) from images into 3D laser points to match the correspondences. Therefore, the relation between the images and the 3D laser points is needed. Generally, a calibration procedure between the camera and the laser scanner is implemented to build this relation [24,25,26,27,28]. For example, Park et al. [29] introduced a virtual camera to locally parametrize the 3D point clouds and extend a photometric objective to aligning color images to point clouds. Akca et al. [30] built the relation between intensity images and 3D laser points manually and proposed an extension of the Generalized Gauss-Markoff model to simultaneously match the surface geometry and intensity information. Although image-integrated methods perform well, they are susceptible to the degradation of images (e.g., distortion, illumination).
The laser point-based methods can be further divided into coarse registration and fine registration according to the registration errors. The aim of coarse registration is to estimate an initial transformation between two point clouds. Most coarse registration methods are based on geometric primitives (e.g., feature point, linear and planar feature). In this category, the feature point-based methods are more popular due to their flexibility and broad applicability. Generally, they use 3D detectors (e.g., 3D Harris [31], 3D SIFT [32], 3D SURF [33], curvature and curvature change-based [34,35], heat kernel signature (HKS)-based [36], local surface patches (LSP)-based [37], and Laplace Beltrami scale space (LBSS)-based [38] detectors) to extract key points from the original point clouds, and use the above 3D descriptors to measure the similarity to determine the correspondences. For example, Hussnain et al. used an adaptive variant of Harris-operator to detect corner points and used LATCH binary descriptor to describe them. Finally, the relative Euclidean-distance and angles between sets of points were exploited to match them [39]. Petricek et al. [40] proposed two types of detectors based on the covariance matrix of points and normal respectively. They computed the saliency based on the eigenvalues to extract key-points, and constructed the descriptor based on local reference frames to determine the correspondences for registration. He et al. [41] estimated the curvature of each point based on its eigenvalues to extract key-points. Then Tsallis entropy of spin image and the reflection intensity of laser sensor were combined to match key points to realize the registration. There are many detector and descriptor-based methods proposed to register TLS point clouds. For instance, Dong et al. calculated a local descriptor—binary shape context (BSC)—and a global descriptor—vector of locally aggregated descriptor (VLAD)—to describe the local and global characteristics of each point. Then an adjacent graph is formed to register multiple point clouds iteratively [42]. Bueno et al. calculated an eigenvector-based descriptor that describes the linear, planar and scattered characteristics of local surface. The change of curvature is another point descriptor used. These two 3D descriptors are used to detect key points and then a 4 Points Congruent Sets registration is performed [43]. Many methods have been used to register cultural heritage. For example, Shanoer et al. realized the registration by the manual selection of at least three corresponding points [44]. Tournas et al. proposed a target point-based registration for cultural heritage documentation. These methods have better accuracy, but they are labor intensive and time consuming [45]. In contrast, without any targets, Shao et al. used Super4PCS (i.e., randomly selecting four coplanar points and matching all the 4-point configurations with similar geometric properties) algorithm to realize coarse registration [46]. Bae et al. proposed to use the change of geometric curvature and approximate normal vector to search for possible corresponding points for registration. This method was applied for deformation monitoring of large Buddha [47]. These methods work well for specific applications, but for the filed inspection, a more stable and efficient registration method is still required.
Linear and planar feature-based methods have also attracted interest from researchers [48]. Among this category, canny edge detection [49,50], Hough transform [51,52], line segment detector [53] were extended to detect linear features in 3D point clouds. For example, Date et al. [54] used straight lines to register point clouds for bridges. They extracted horizontal and vertical lines based on planar regions and used two pairs of nonparallel lines to solve the transformation. Similarly, Cui et al. [55] applied linear features to register the panoramic images and LiDAR point clouds collected by a mobile mapping system (MMS). Moreover, many methods have been proposed to detect planar features. For instance, Vosselman and Dijkman used a 3D version of the Hough transform to extract roof planes for 3D reconstruction [56]. Vosselman et al. proposed to group neighborhood points that share the same property (e.g., surface normal) to detect smooth surfaces from scan line datasets and improved the surfaces by extending the split-and-merge method in image [57]. Pu and Vosselman proposed knowledge-based feature constraints to detect linear and planar features of building façade (e.g., walls, doors, roofs) from laser point clouds. Then concave polygons were fitted to reconstruct these components [58]. Khoshelham [59] used a normalization algorithm to fit planes. A closed-form solution based on point-plane correspondences was proposed to determine the transformation. Similar works can also be found in [60,61]. Linear and planar feature-based methods perform well for urban and industrial scenes with lots of regular structures but operate poorly for free-form objects with less line/plane features.
Most recently, deep learning-based methods have been extensively explored. These techniques learn high-level feature information from a large volume of data for registration. For example, Zhang et al. [62] divided the point clouds into regular grids and used a 3D convolution network to extract features for matching. Pujol-Miró et al. [63] proposed a multiview-based method, which generates multiple views from different angles using a single point cloud. Image convolutional neural networks have been used to determine the correspondences between views. PointNet [64] and PointNet++ [65] are pioneering methods that directly process unordered point clouds. T-Net and different feeding orders have also been proposed to make the process transform-invariant. Similarly, researchers have proposed PPFNet [66], PointNetLK [67], and CorsNet [68] for point cloud registration. Other commonly used methods include the random sample consensus (RANSAC) [69], the lifting optimization method [70], the branch-and-bound (BnB)-based method [71], and the simultaneous localization and mapping (SLAM) method [72].
Within the category of coarse registration methods, the probabilistic registration method is a well-known and promising approach. Different from the traditional one-to-one matching strategy, one-to-many matching patterns are allowed. More combinations of correspondences are considered to improve the flexibility and robustness of the technique. Most of the previous studies were based on the Expectation-Maximization (EM) algorithm. For example, Evangelidis et al. [73] proposed a joint registration of multiple point clouds (JR-MPC). They used a Gaussian mixture model (GMM) to describe the distribution of one point cloud and assigned points from the other point cloud to the GMM. The EM algorithm was then used to estimate both the GMM and the transformation parameters. Myronenko et al. [74] introduced the coherent point drift (CPD) algorithm for the point cloud registration, using GMM centroids to describe one point cloud and fitting it to the other point cloud by maximizing a likelihood function. The use of the CPD algorithm was able to generate accurate and robust results. The variants of CPD include the automatic estimation of outliers [75] and computational efficiency improvements [76].
After the initial transformation, fine registration can then be used to further refine the transformation. The iterative closest point (ICP) algorithm [77,78] is a well-known fine registration method that matches correspondence by searching the nearest point and solves the transformation parameters by minimizing the distance errors iteratively. Because the original ICP algorithm has many limitations, many variants have been proposed, mainly focusing on improving computational expense, correspondence establishment, and robustness [79,80]. The normal distribution transform (NDT) algorithm is another widely used fine registration method. It was first used for robotic localization in 2D space before it was extended into 3D space [81]. NDT uses multiple Gaussian distributions to describe different point clouds and estimate the transformation parameters by maximizing the similarity between Gaussian distributions. The variants of NDT mainly improve the computational time and the convergence basin [82,83].
2. Materials and Methods
2.1. Processing Pipeline of Digital Documentation
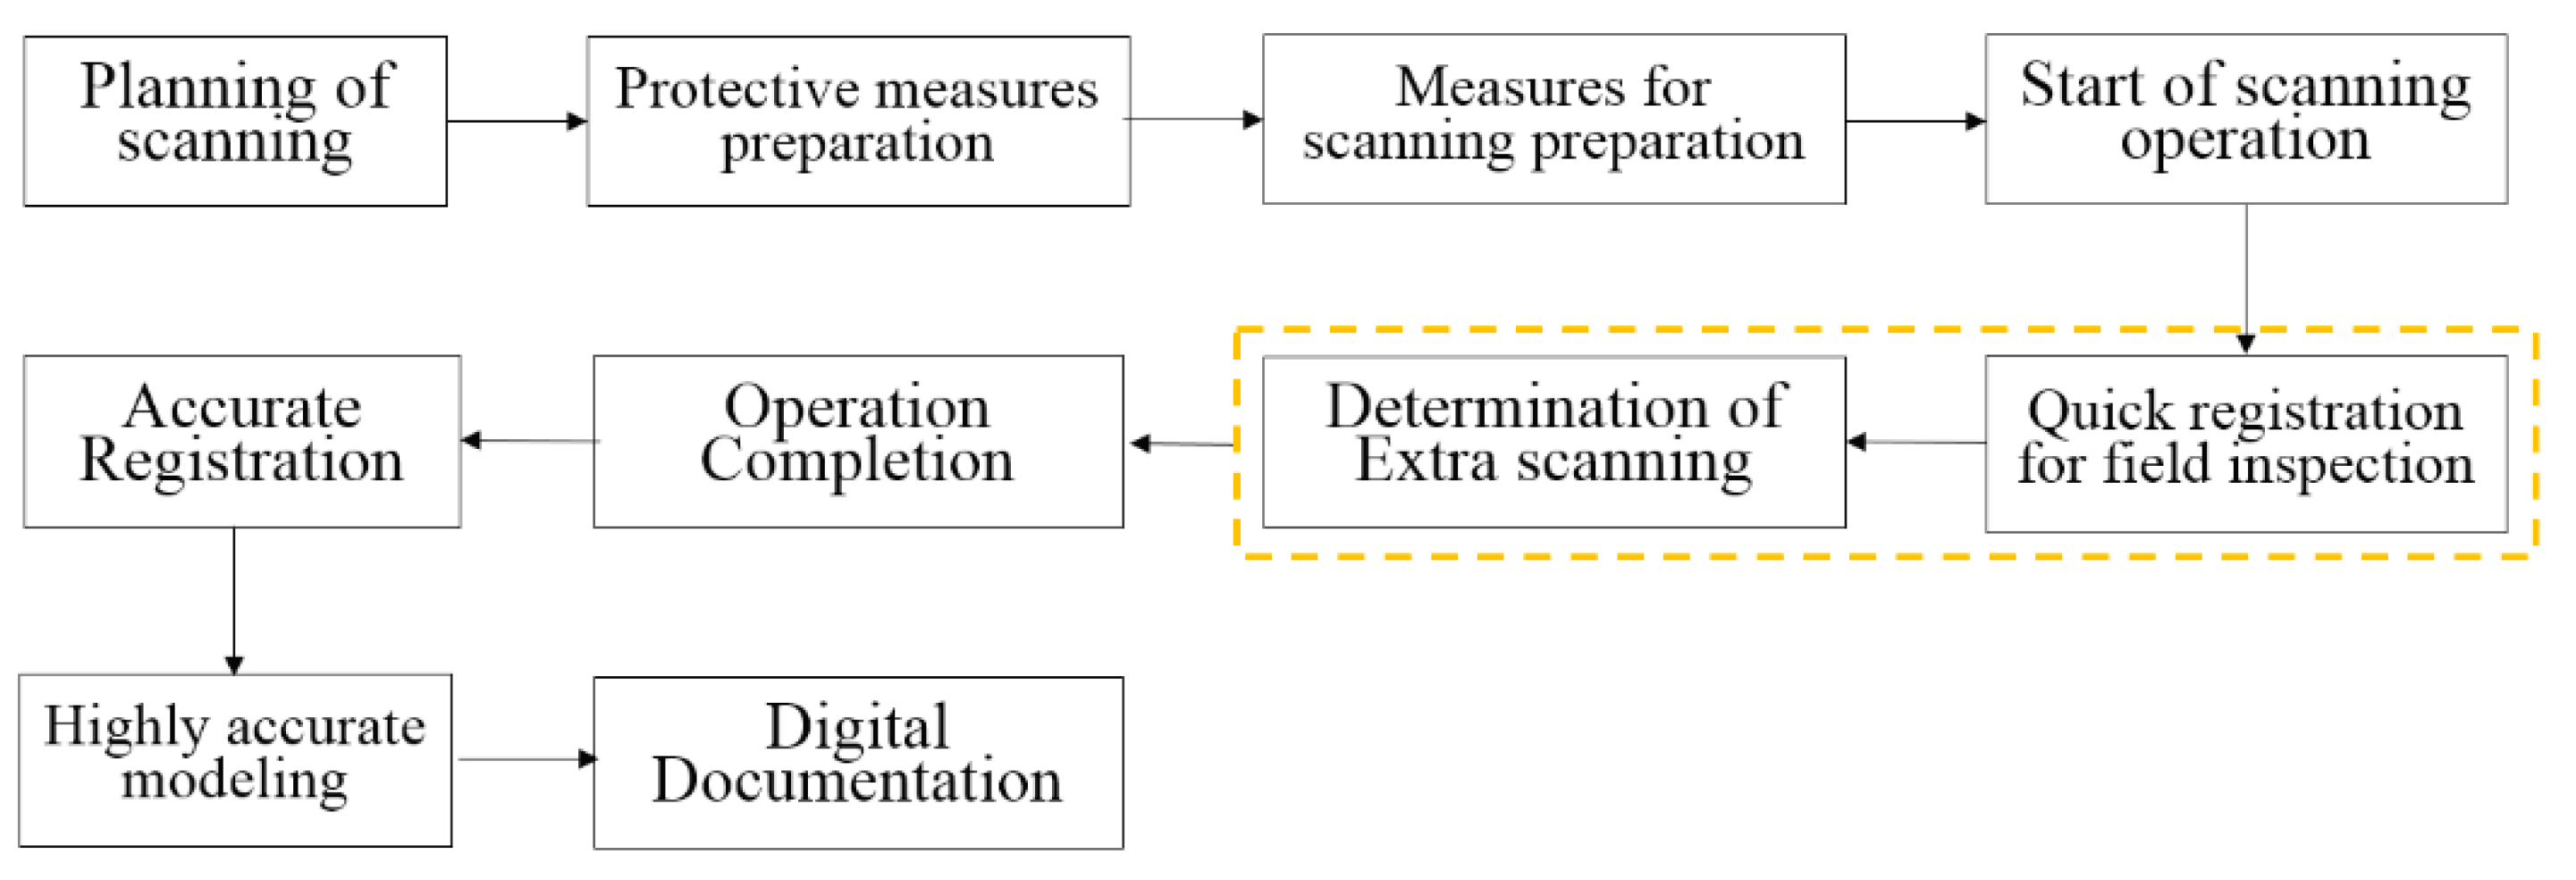
To better show the research content of this article. The whole processing pipeline of our digital documental is shown in Figure 1. The pipeline consists of the following steps, namely planning of scanning, preparation of protective measures, measures for scanning preparation, field inspection, accurate registration, accurate modeling and digital documentation.
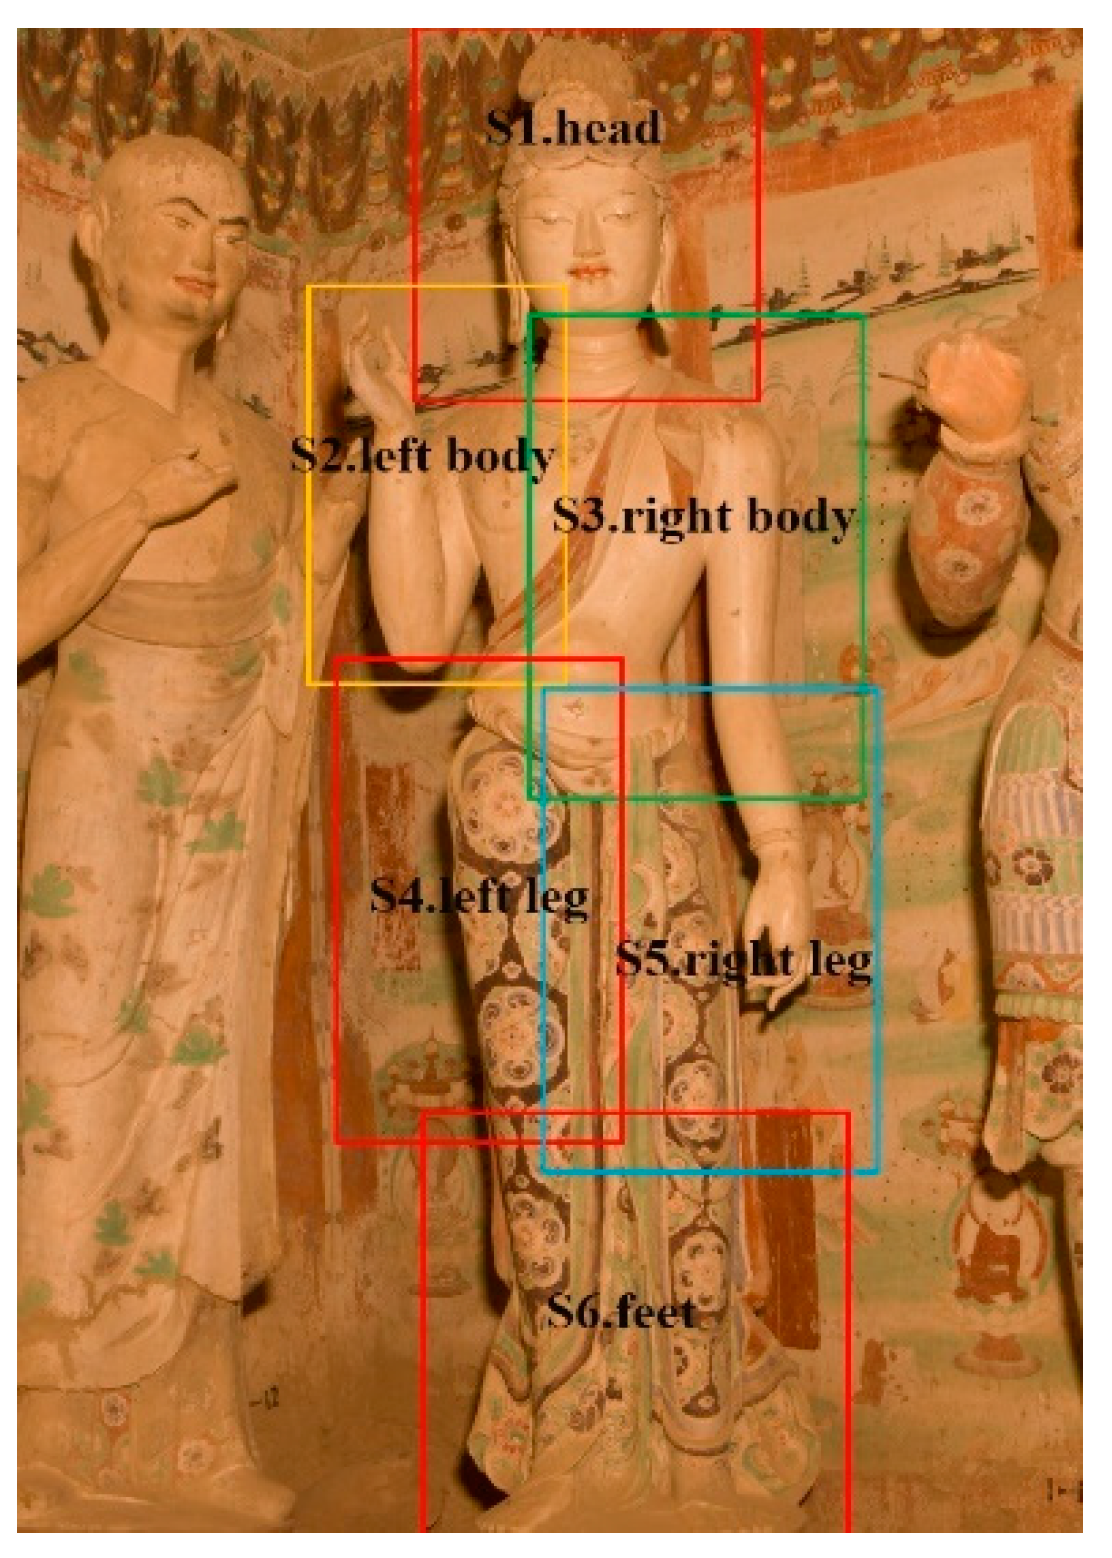
(1) Planning of scanning. In this step, the number of stations and the scanning area of each station were planned. Take the data acquisition in Mogao Grottoes for example, the following steps were employed. (a) Take photos covering the operation area. According to the characteristics of the scene, a scanning order was determined (as Figure 2 shows). (b) For each Buddha, its shape and surroundings were taken into account to determine the number of stations and the scanning area of each station. Generally, for the Buddha with complex shape, more stations were planned to ensure the data quality, and vise verse. Moreover, the space needed for the target net and its fixed support should also be taken into account. (c) To facilitate recording and operation, the planned stations were named after the parts of body (as Figure 3 shows).
(2) Preparation of protective measures. For the effective protection of cultural heritage objects, many necessary facilities (e.g., glass fender, air monitor, protective blanket) were prepared and distributed.
(3) Measures for scanning preparation. This step prepares the facilities (e.g., power unit, lighting equipment, work shelf) for scanning operation. For each station, a special target net was made for scanning, which should be close to the shape of scanning area. To protect the historical artifacts, the target nets were not allowed to touch them. Thus, a fixed support used for hanging and fixing them is needed and designed for each station (as Figure 4 shows).
(4) Field inspection. To ensure the data quality and save on labor costs, this step uses a rapid registration for field inspection to determine the need for extra scanning. Even though detailed plans were designed in advance, long hours of scanning and limited working space challenge the data collector’s endurance, energy and concentration. In this case, signal loss, target net movement and resolution variations caused by manual errors are difficult to avoid, which will further lead to data degradation issues. Therefore, field inspection is required in the practical applications.
(5) Accurate post-registration in interior work. In this step, data preprocessing (e.g., noise removal, down sampling, duplicates removal) is carried out. Then a manual registration and a fine registration is used to get high accurate alignment (submillimeter level) for accurate modeling.
(6) Accurate modeling. Based on the accurate alignment, this step is used to construct tin-based meshes, which includes many model optimization procedures (e.g., holes filling, bridging, rendering by normal vectors, nails removal).
(7) Digital documentation. This step stores the original data, data acquisition diary, accurate 3D models, description files, and the final report.
2.2. Experimental Point Cloud Datasets and Work Flow
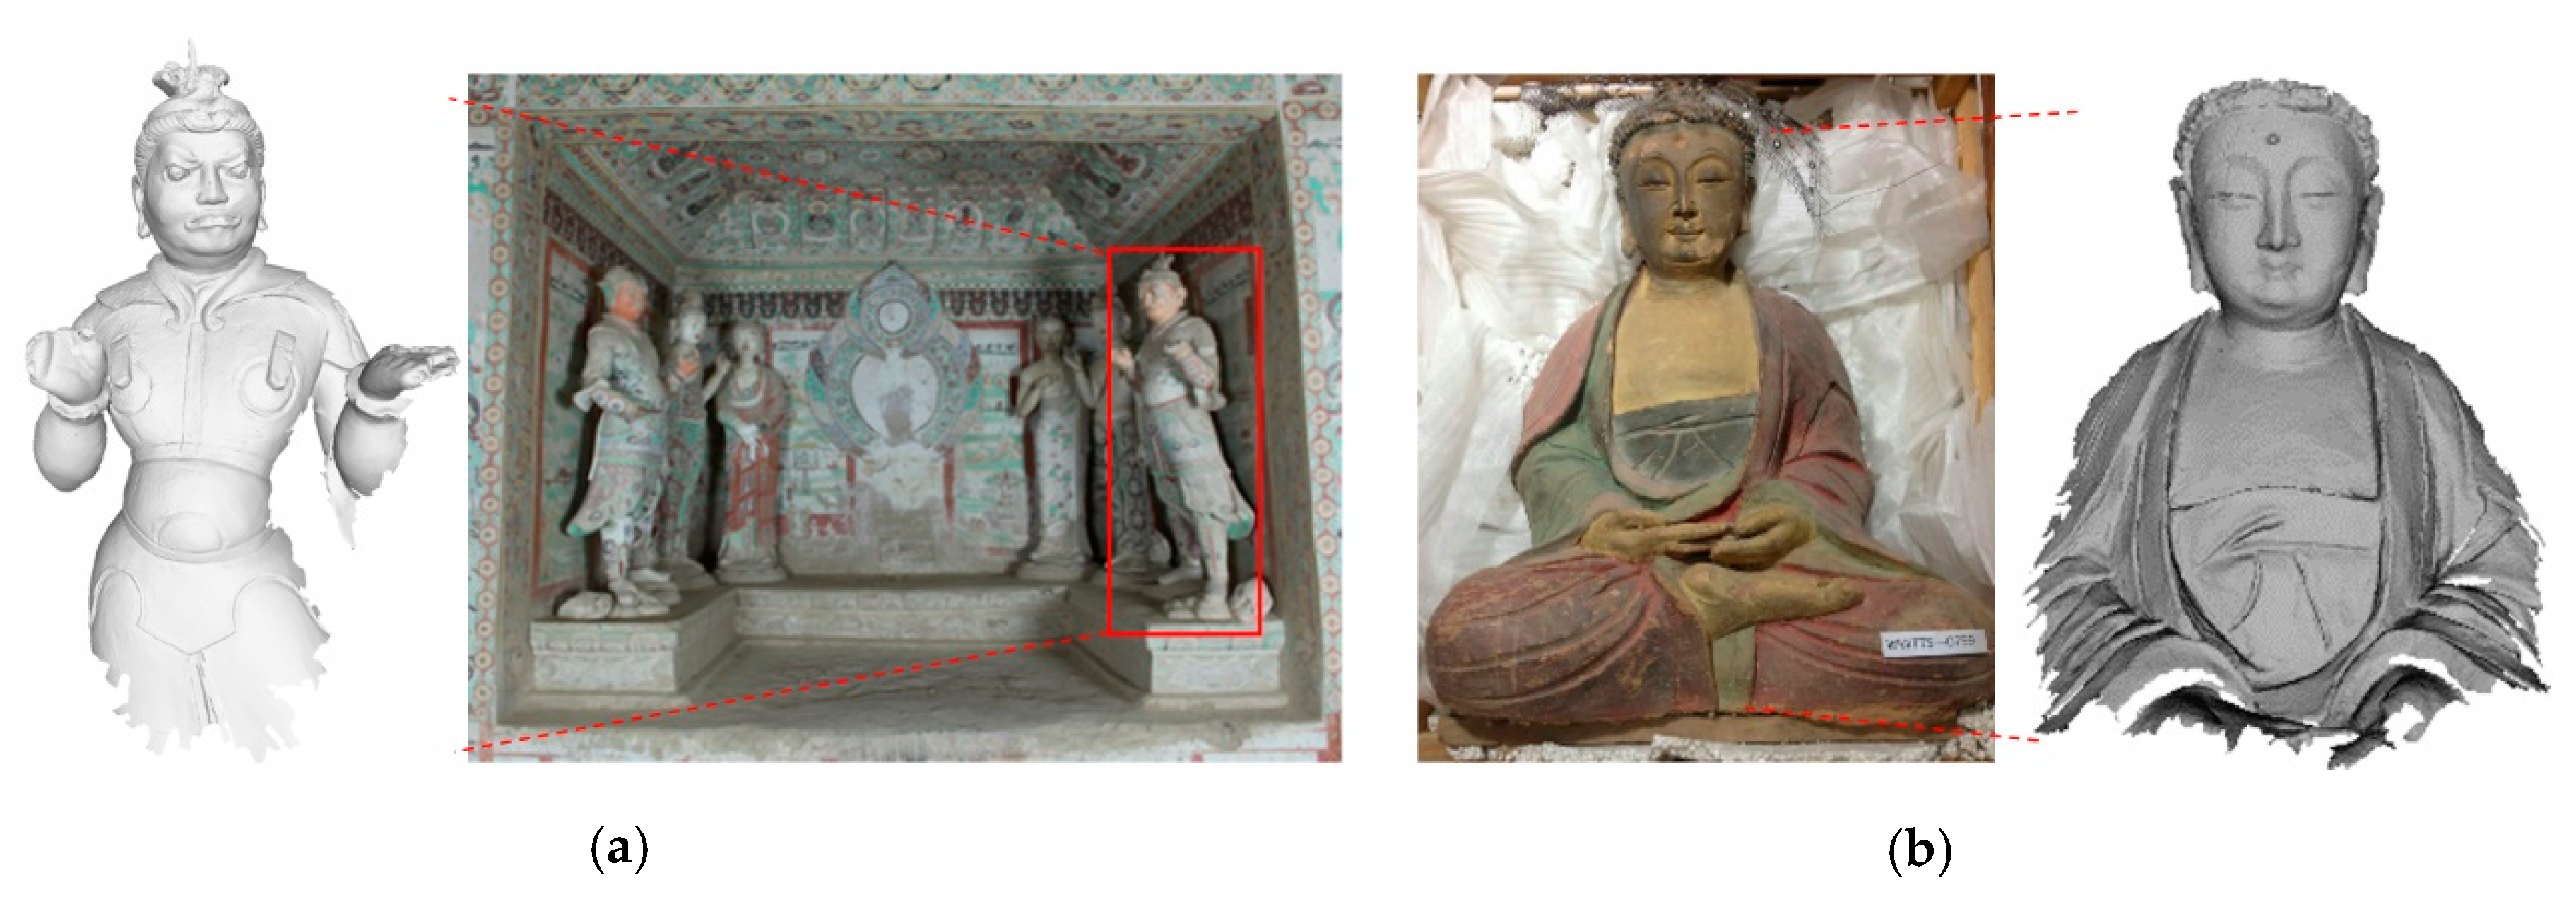
The proposed method was used on scan data from the Mo Kao Grotto at Dunhuang and Wuwei museum in evaluating its performance. All the point clouds were collected using HandySCAN 3D (a hand-held scanner from Creaform, Lévis, Quebec, Canada). Before scanning, a target net was set up to help position the laser beam cross of each moment. Adjacent scans had different overlaps and initial positions. Scans over the General from the Mo Kao Grotto and the Buddha from the Wuwei museum were used for field inspection. We collected the General data in July 2012 and the Buddha data in October 2014. Six scans were set up for each, and 0.67 and 1.44 million points were collected separately. The average point density for the General was about 1.0 mm, and 0.8 mm for the Buddha. The General was 1.6 m in height and 0.9 m in width, while the Buddha in Wuwei museum was 1.4 m in height and 1.2 m in width. The illustration of the scanned point clouds for the General and the Buddha is shown in Figure 5.
The proposed method mainly includes three parts: the descriptor construction and similarity measurement, the construction of probabilistic framework encoding curve constraints, and the multi-view adjustment method and inspection. The workflow is shown in Figure 6.
2.3. Problem Formulation
To obtain the complete data of cultural heritage objects for field inspection, pairwise registration was employed as a fundamental kernel problem. To make the method easy to understand, we formulate the general problem of pairwise registration as follows, given two overlapping point clouds P and Q. Assume there are M correspondences between them given by , where denotes one correspondence. The expression to estimate the rigid transformation parameters R and T is as follows:
where denotes the transformation; is a rotation matrix; and, is a translation vector. To estimate the transformation parameters, this study constructed an objective function that encodes the candidate correspondences assigned by the matching probability matrix between P and Q:
The transformation parameters and covariance are solved in an iterative way within a probabilistic framework.
2.4. Principal Direction Descriptor of Local Surface
Correspondence establishment between different scans is a precondition of registration. Considering the requirements for field inspection, a fast and robust 3D descriptor tailored for cultural heritage objects (e.g., a free-form object like Buddha) is needed. This section introduces the proposed principal direction descriptor of the local surface.
2.4.1. Construction of Local Frame
Curvature quantifies curvedness and indicates the undulation of the surface, which is important in various applications (e.g., shape analysis, object recognition, anisotropic texture mapping). Curvature is characterized by two perpendicular principal directions (i.e., maximum and minimum principal directions), encoding abundant geometric information of the local surface. These geometric data are intrinsic properties that are invariant to rigid body transformation. Along the principal directions, the surface bends the most. These characteristics make them suitable as the local frame for the descriptors. However, the complex estimation algorithm limits their application.
The principal directions indicate the courses with the steepest and slowest surface change within the local surface. Instead of using complex parametric quadratic surface fitting, we propose a fast and simple estimation method. Assume that p0 is one point from the point cloud, NP indicates its neighborhood point set with N neighbors within a radius r, and pi is one of the neighbors. Let be the normal vector of p0, estimated by the principal components analysis (PCA) algorithm, and the direction is unified by the consistent propagation algorithm. To ensure robustness, the point density and distance of each neighbor are also considered. Tp is the tangent plane of p0. The maximum principal direction is estimated as:
Here, is the projected unit vector from p0 to pi within Tp, which can be written as:
is the weight of point density of pi, is the weight of slope of pi, written as:
Here, Ni is the number of neighborhood points of pi within radius r. The point density weight implies that the sparser neighborhood point set is, the larger the weight, and vice versa. is the L2 norm of the projection of onto Tp. is the L2 norm of the projection of onto . is the coefficient that balances the point density weight and the slope weight (suggest ). implies that the steeper the value of pi, the larger the weight, and vice versa.
The minimum principal direction is estimated as:
Here is the cross product. Then, a local frame, with , as u and v axis and pi as the origin, is constructed.
2.4.2. Generation of Descriptor Images and Similarity Measurement
To improve the efficiency of probabilistic registration, a sampling method [84] is used to sample each scan to about 2000 points. For each sampled point, its neighborhood points of raw point cloud (about 400 points are suggested) is used to generate the descriptor images: density and distance feature images. We transform the neighborhood point set of pi into the local frame to obtain their local coordinates, written as:
These transformed points are divided into M × M grids (M = 27 is suggested). To better describe the shape of local surface, the size of each grid is set about the mean point span. Each grid records the projection distance (from the neighbor to the tangent plane) of each neighbor and the number of points falling within. Next, we calculate the distance and density features of each grid to form shape images. To reduce the noise sensitivity, only points whose distance is within three times the Root Mean Square Error (RMSE) are kept. The distance feature is the mean distance within this grid, and the density feature is the number of qualified points. We calculate the gray values of the density image and the distance image as:
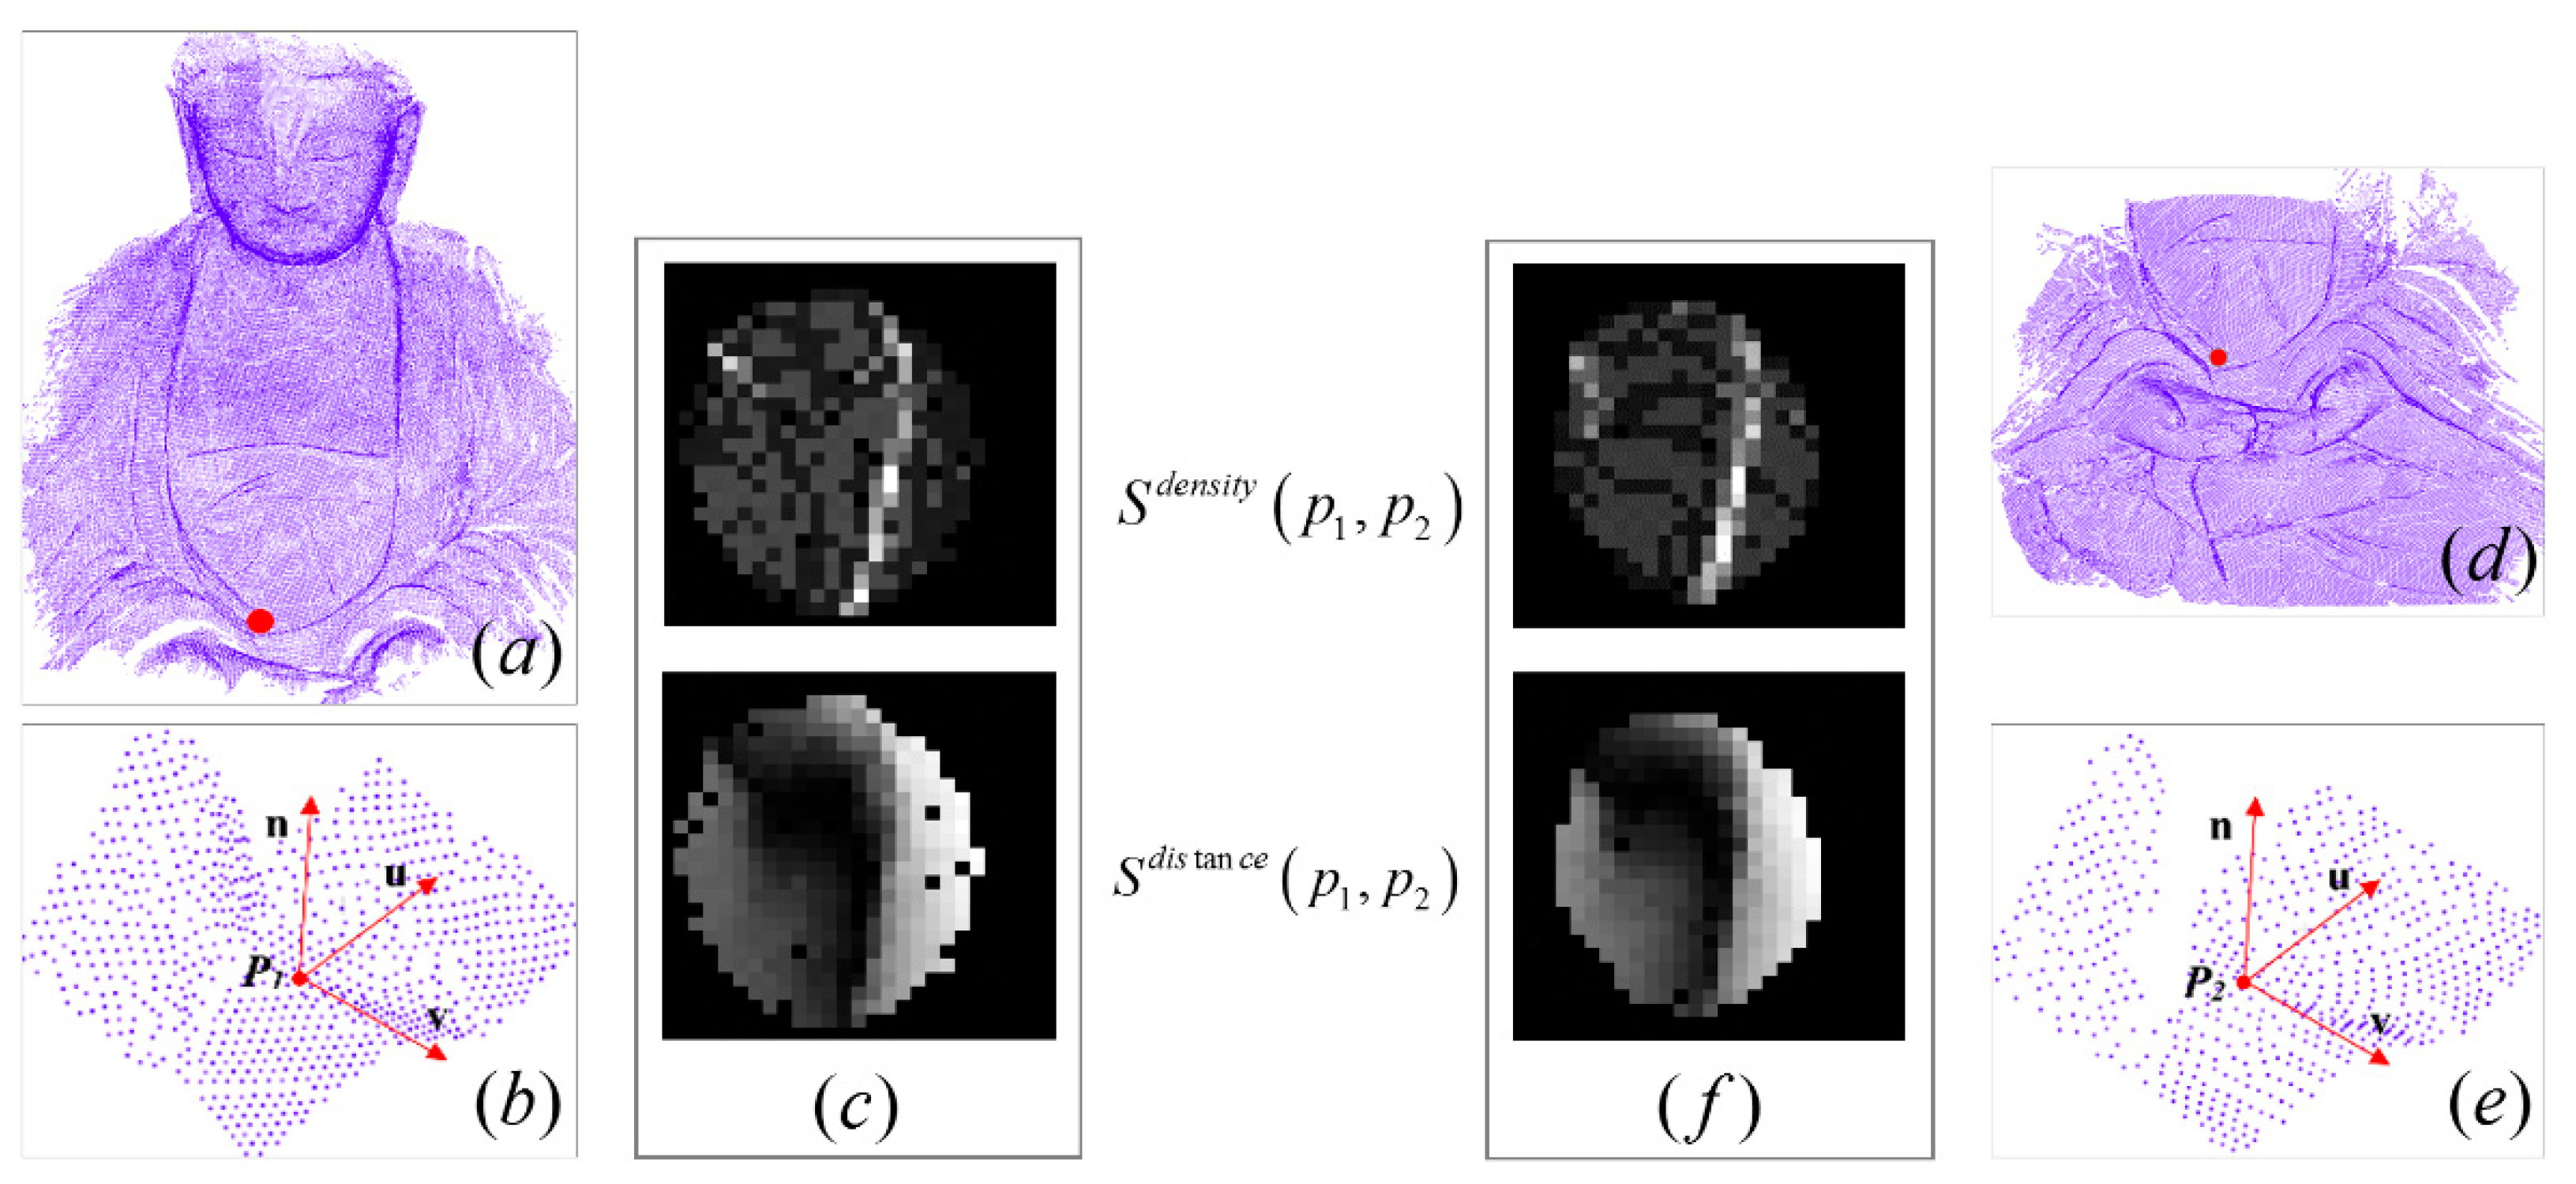
Here, and are the maximum and minimum density values, while and are the maximum and minimum distance values from all grids, as shown in Figure 7.
For the two density images a and b, the similarity between them is measured according to the correlation coefficient. A similar procedure is used for the similarity between two distance images . The final similarity between the two descriptors is calculated by combining the similarities:
Here, and are the weights that balance the density term and the distance term (suggest: ).
2.5. Spatial Curves Extraction from a Free-Form Object
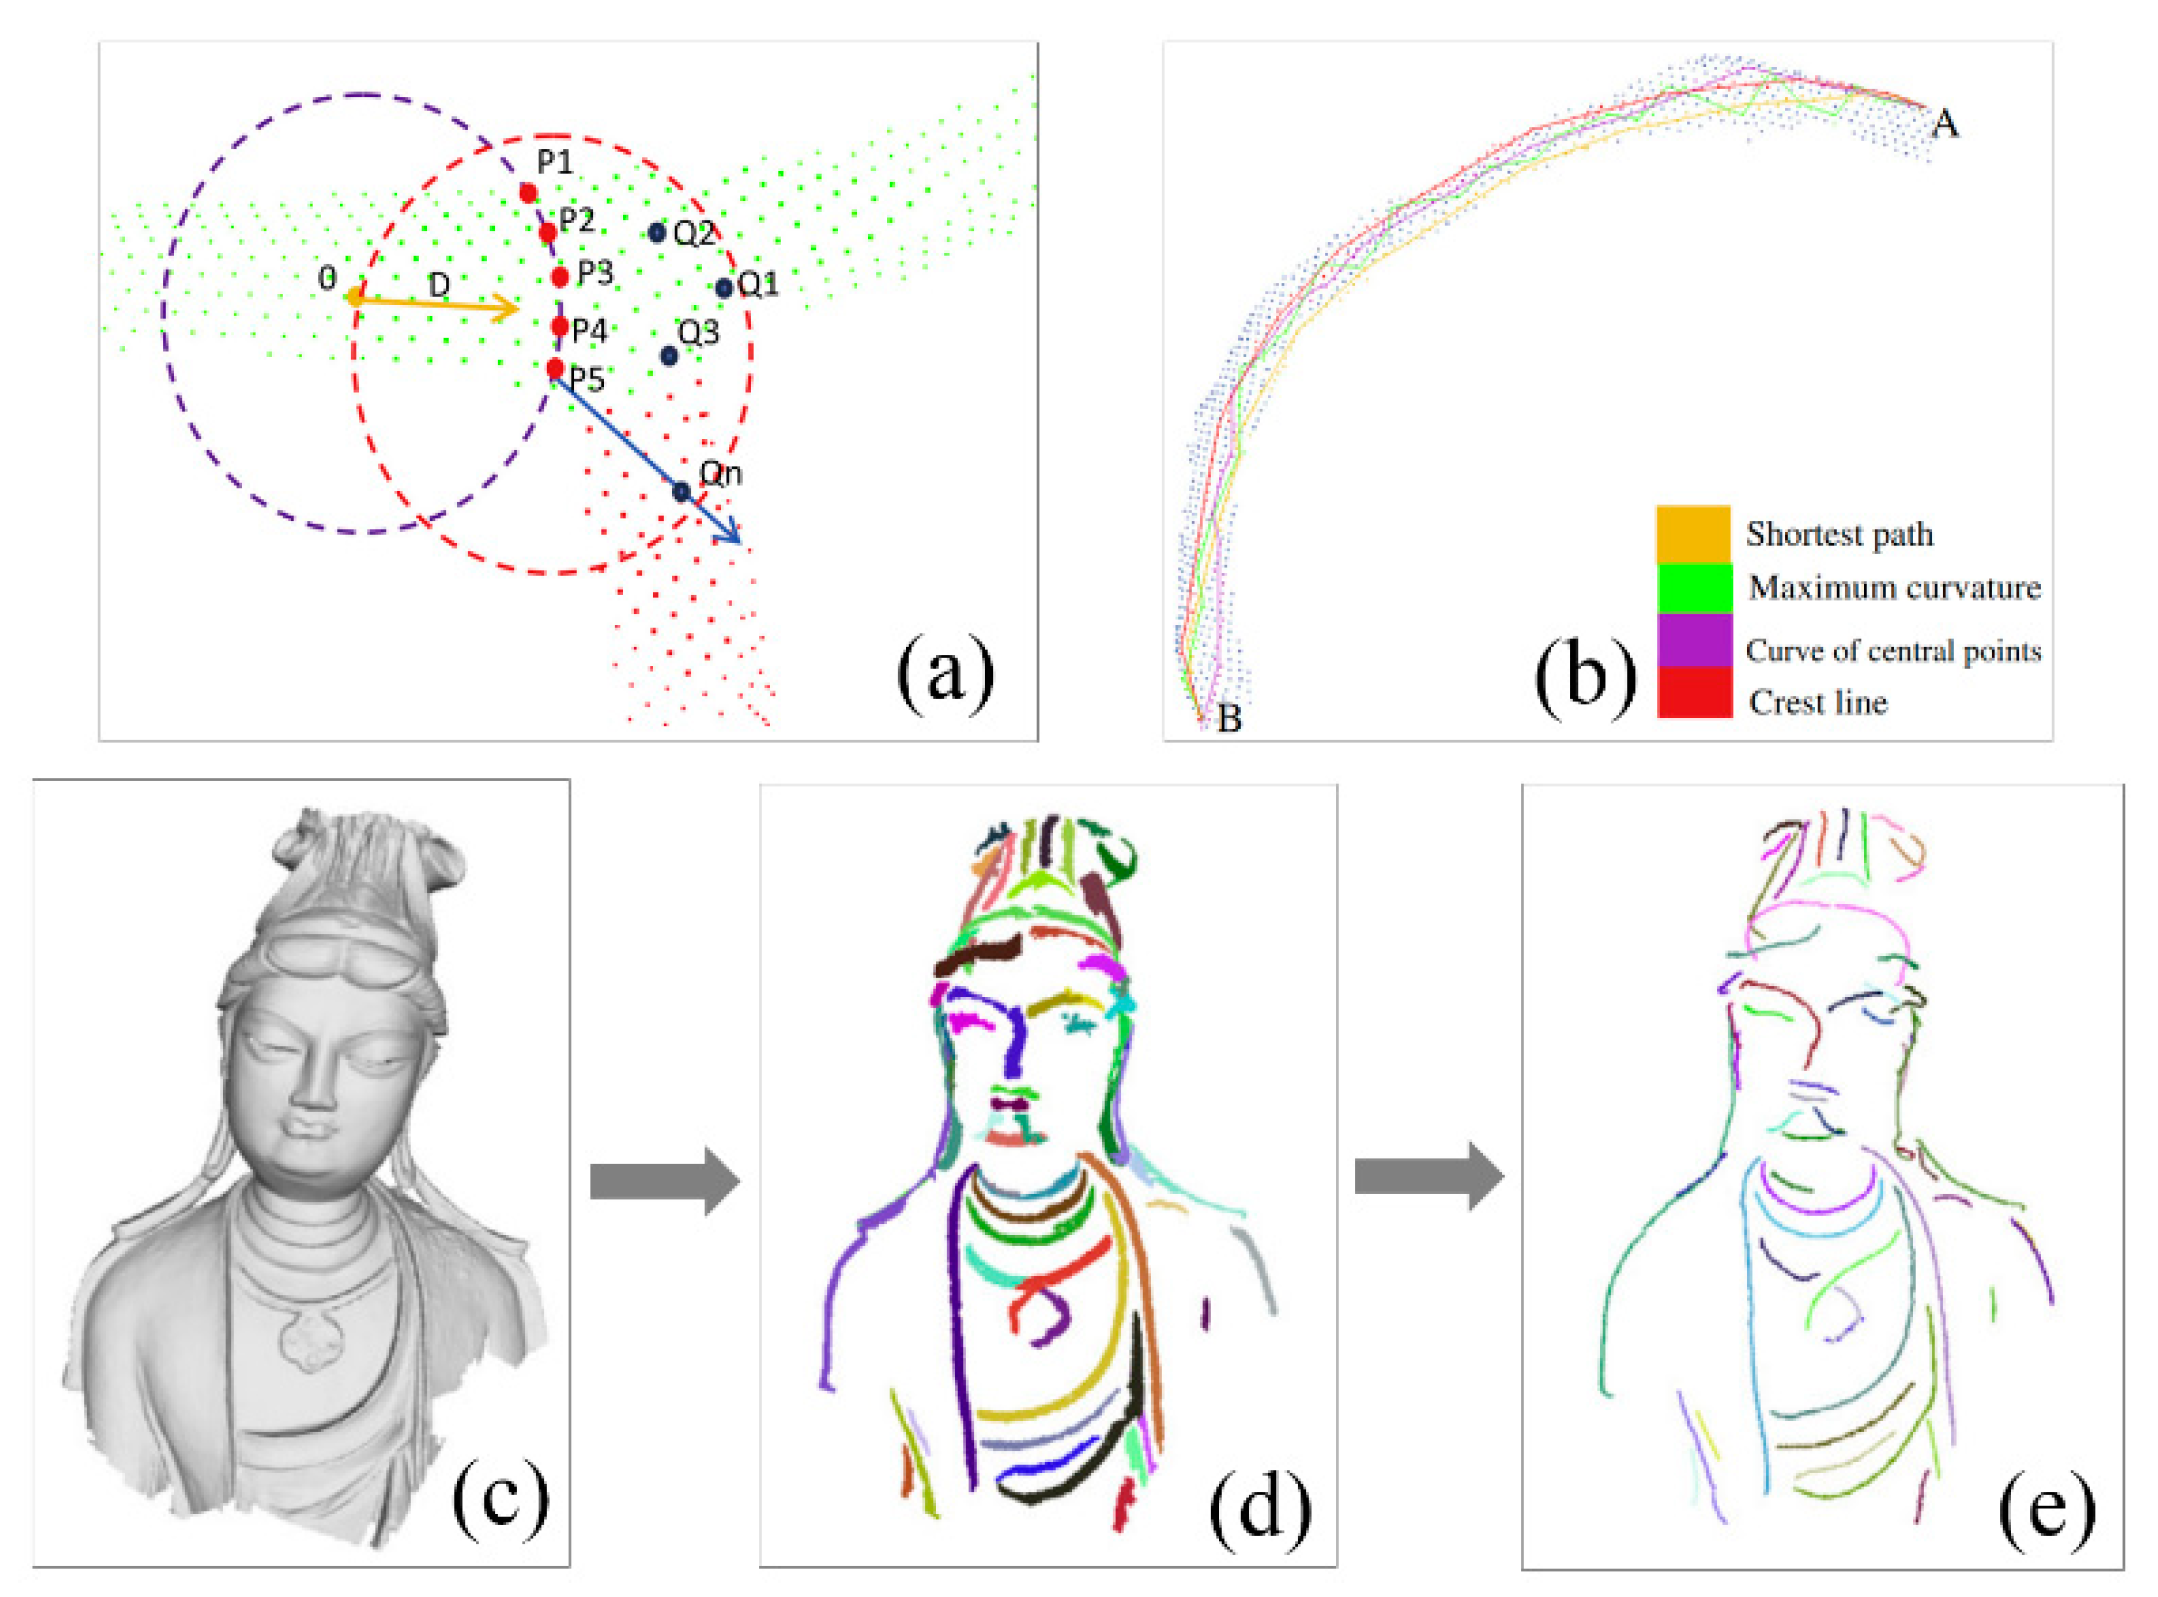
Spatial curves are common and important geometric primitives in free-form artifact objects (e.g., Buddha). To improve robustness, our developed method [23] was used to extract spatial curves. In the algorithm, curvature and several geometric constraints are combined to extract complete and accurate curves. A brief diagram is shown in Figure 8, illustrating how we made our method self-contained.
2.6. Improved Pairwise Probabilistic Registration
Probabilistic registration treats the registration problem as a GMM’s (Gaussian Mixture Model) probability density estimation problem. Based on the original probabilistic framework of registration [74], this section embeds the principal direction descriptor into the posterior matching probability and integrates the curve constraints to improve performance. To make the discussion concise, we only present the improvements in this section.
2.6.1. Probabilistic Registration Based on Principal Direction Descriptor
Take one point cloud Y3×M as the centroid of the component of a GMM, and the other point cloud X3×N is assumed to be generated by these components. For each point pair, a matching probability is assigned. If the two-point clouds are optimally aligned, the sum of the probabilities should be maximum. Registration can be realized by minimizing the objective function, written as:
where represents the transformation, and is the covariance controlling the motion of each iteration. These variables are unknowns that will be determined by the EM algorithm. E-step estimates the transformation parameters and uses Bayes’ theorem to calculate the posterior matching probability, while M-step maximizes the lower bound of Equation 10 to estimate and . indicates the transformation of the current iteration. Np is the summation of matching probability P entries, D = 3 is the dimension of a 3D point. is the posterior probability that indicates the correspondence determination. We embed the principal direction descriptor in the posterior matching probability as:
Here, the Euclidean distance and the similarity of the descriptor are combined to calculate the , written as:
where w1 is the weight coefficient that balances the Euclidean distance term and the descriptor term, and w indicates the amount of noise and outliers (w = 0.2 is suggested). All posterior probabilities form a matching probability matrix P. The E-step and M-step are iterated to obtain the unknowns.
2.6.2. Spatial Curve Constraints
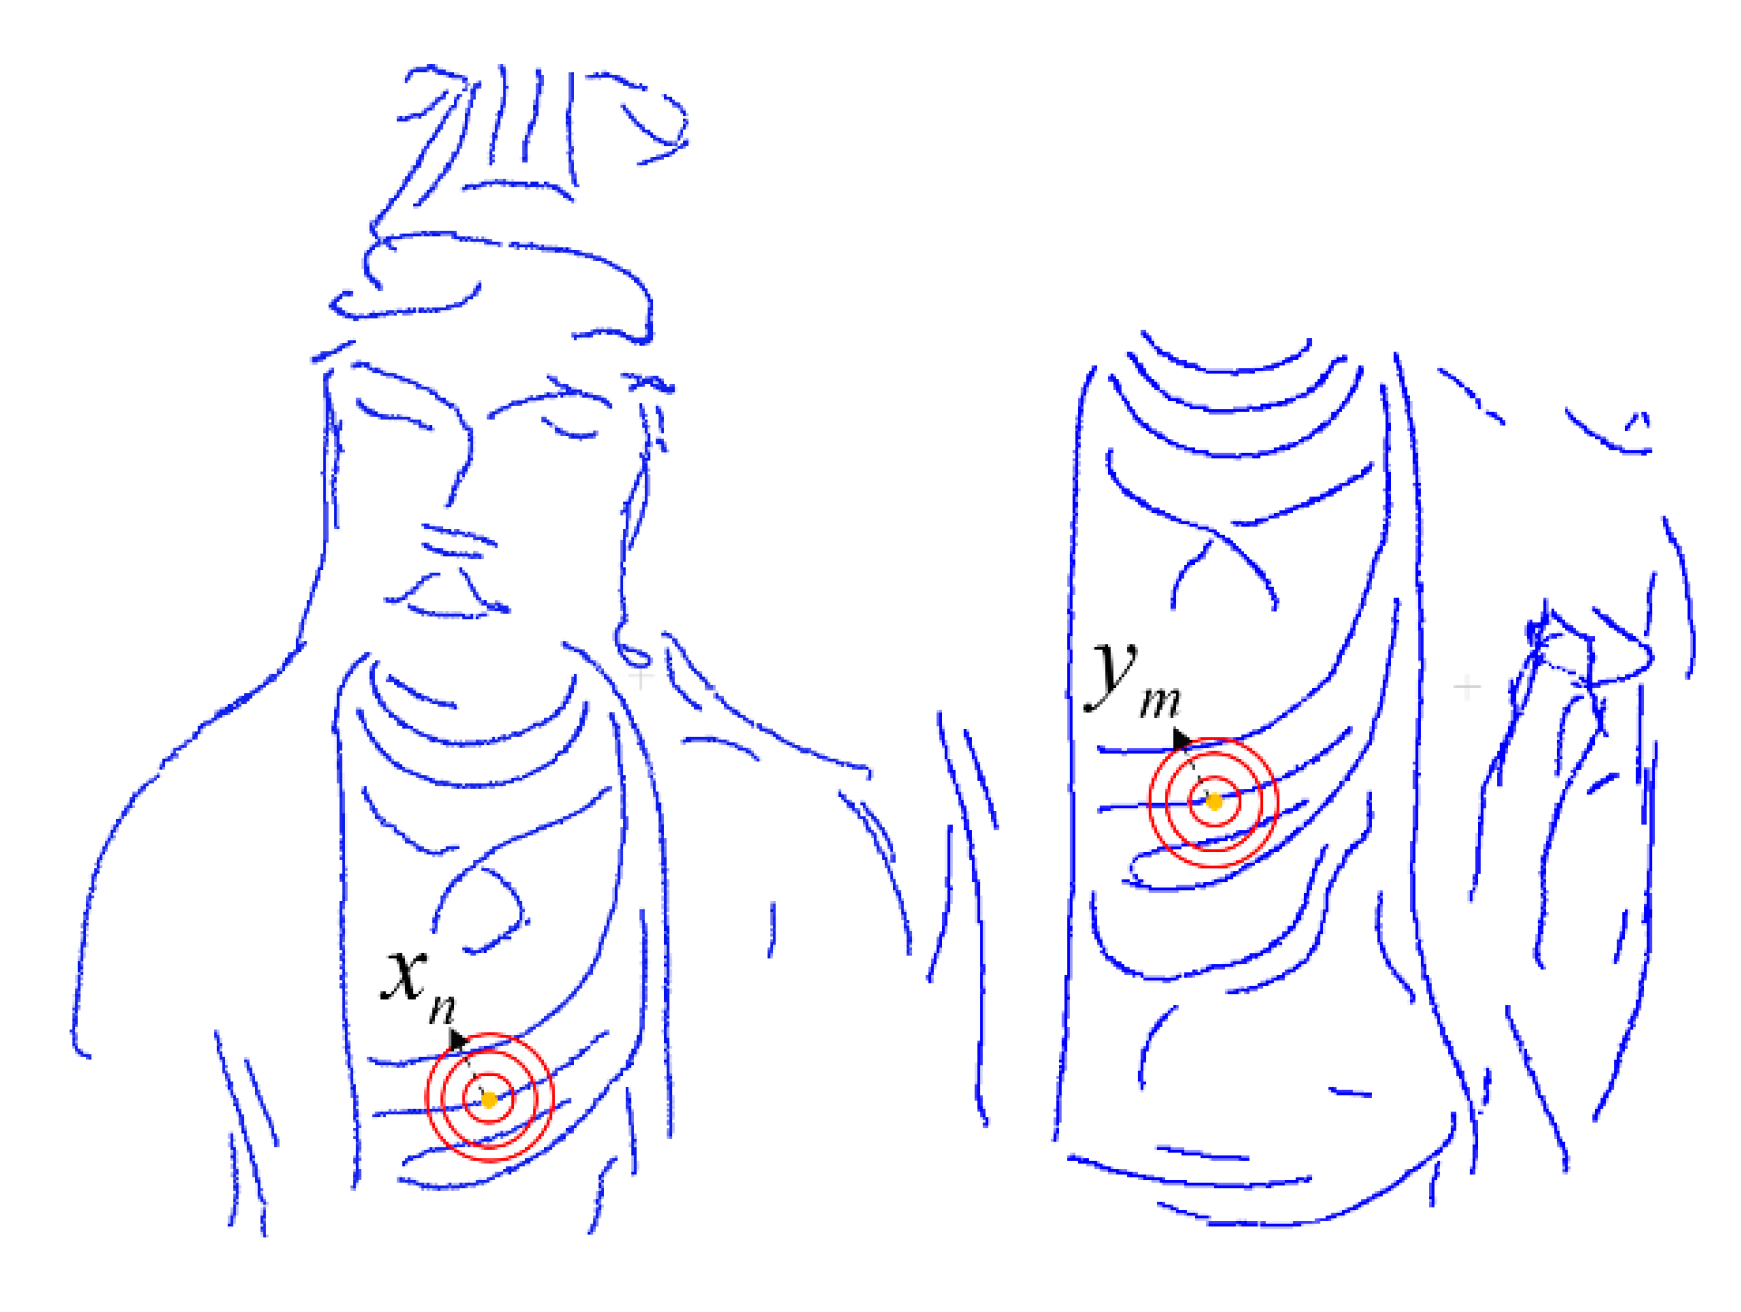
This section embeds the curve constraints into the probabilistic framework to further improve the robustness and effectiveness. Assume that a candidate matching pair is xn and ym. If only one of them (xn or ym) belongs to a spatial curve, the matching probability is determined by considering the Euclidean distance (shown in Equation 13). If both of them belong to a spatial curve, the similarity of neighborhood distribution is also considered within the matching probability and is written as:
Here, represents the similarity between two descriptors of xn and ym, and is the integrated similarity of curve points within three neighborhood scales. If this candidate matching pair (xn and ym) are true correspondence, this term will be large. w1 and w2 are the weight coefficients that balance the three terms in Equation (13). If neither xn and ym are curve points, we can calculate their probability according to Equation (11). Equation (13) implies that if this candidate matching pair (xn and ym) are not true correspondence, their matching probability will be low, and vice versa. is written as:
Here, N1, N2, and N3 are the number of curve points from three scales (with different neighborhood radii); xi is one neighborhood curve point of xn; and, yj is its nearest point after the current transformation. We then calculate according to Equation (12). Equation (14) demonstrates that for one true correspondence, their neighborhood curve points should also be similar within three scales (as shown in Figure 9). This correspondence would be given a large matching probability.
2.7. Multi-Scan Registration and Field Inspection
Based on the pairwise registration results, we constructed an undirected graph to describe the topology between scans. Each node indicates one scan, while the edge connecting two nodes indicates the two scans with overlap. For one pair of scans S1 and S2, we determined each point’s (in S1) nearest point in S2 to calculate the overlapping ratio. For example, if the overlapping ratio between S1 and S2 is 30%, which is larger than the 5% threshold, a new edge is generated to connect them. The weight of this edge is given by the overlapping ratio. A graph was constructed based on all scans. We then used the adjustment method in [85] to refine the position of each scan.
After obtaining a complete point cloud of one artifact object, field inspection was carried out to determine if there are places with missing or quality degraded data. Extra scanning work was executed based on the inspection results. An image of actual fieldwork activity and the software interface for inspection are shown in Figure 10.
3. Results
To demonstrate the performance of the proposed method, we carried out experiments based on the datasets introduced in Section 2. The implementation details of the experiments are described in this section.
3.1. Correspondence Establishment
For a probabilistic registration method, the transformation solved after the first iteration is important. Good first transformation can efficiently reduce the solution space and improve registration efficiency. Otherwise, it requires more iterations and easily falls into a local minimum. To determine a good first transformation, well matched correspondences should be input for the first iteration. For this purpose, we developed a matching mechanism that combines the descriptor-based matching strategy and curve constraint based rejection scheme for the suppression of incorrect matches. To demonstrate the matched correspondences for the first iteration, we selected the top 2000 pairs of correspondences based on the matching probability matrix. According to the number of incorrect correspondences, 40 matches were randomly selected and are shown in Figure 11.
As shown in Figure 11, incorrect ratios of matches from the first iteration were measured at 18.5%, 20%, 21.4%, and 15.8%. For a probabilistic method, this amount of incorrect matches is considered acceptable, which means a good transformation can be obtained. Moreover, these experimental data represent the common appearances of free-form cultural heritage, some even have obvious curved surface (i.e., Figure 11c). The mean incorrect ratios of matches is controlled within 20%, this is because the local frame of the principal direction descriptor is suitable for describing the local geometric properties. These results demonstrate the distinctiveness and descriptiveness of the proposed descriptor and the effectiveness of the matching mechanism. Note that during the iterations, the transformed point clouds gradually shift towards the correct position, and more and more correct correspondences can be matched.
3.2. Registration Results
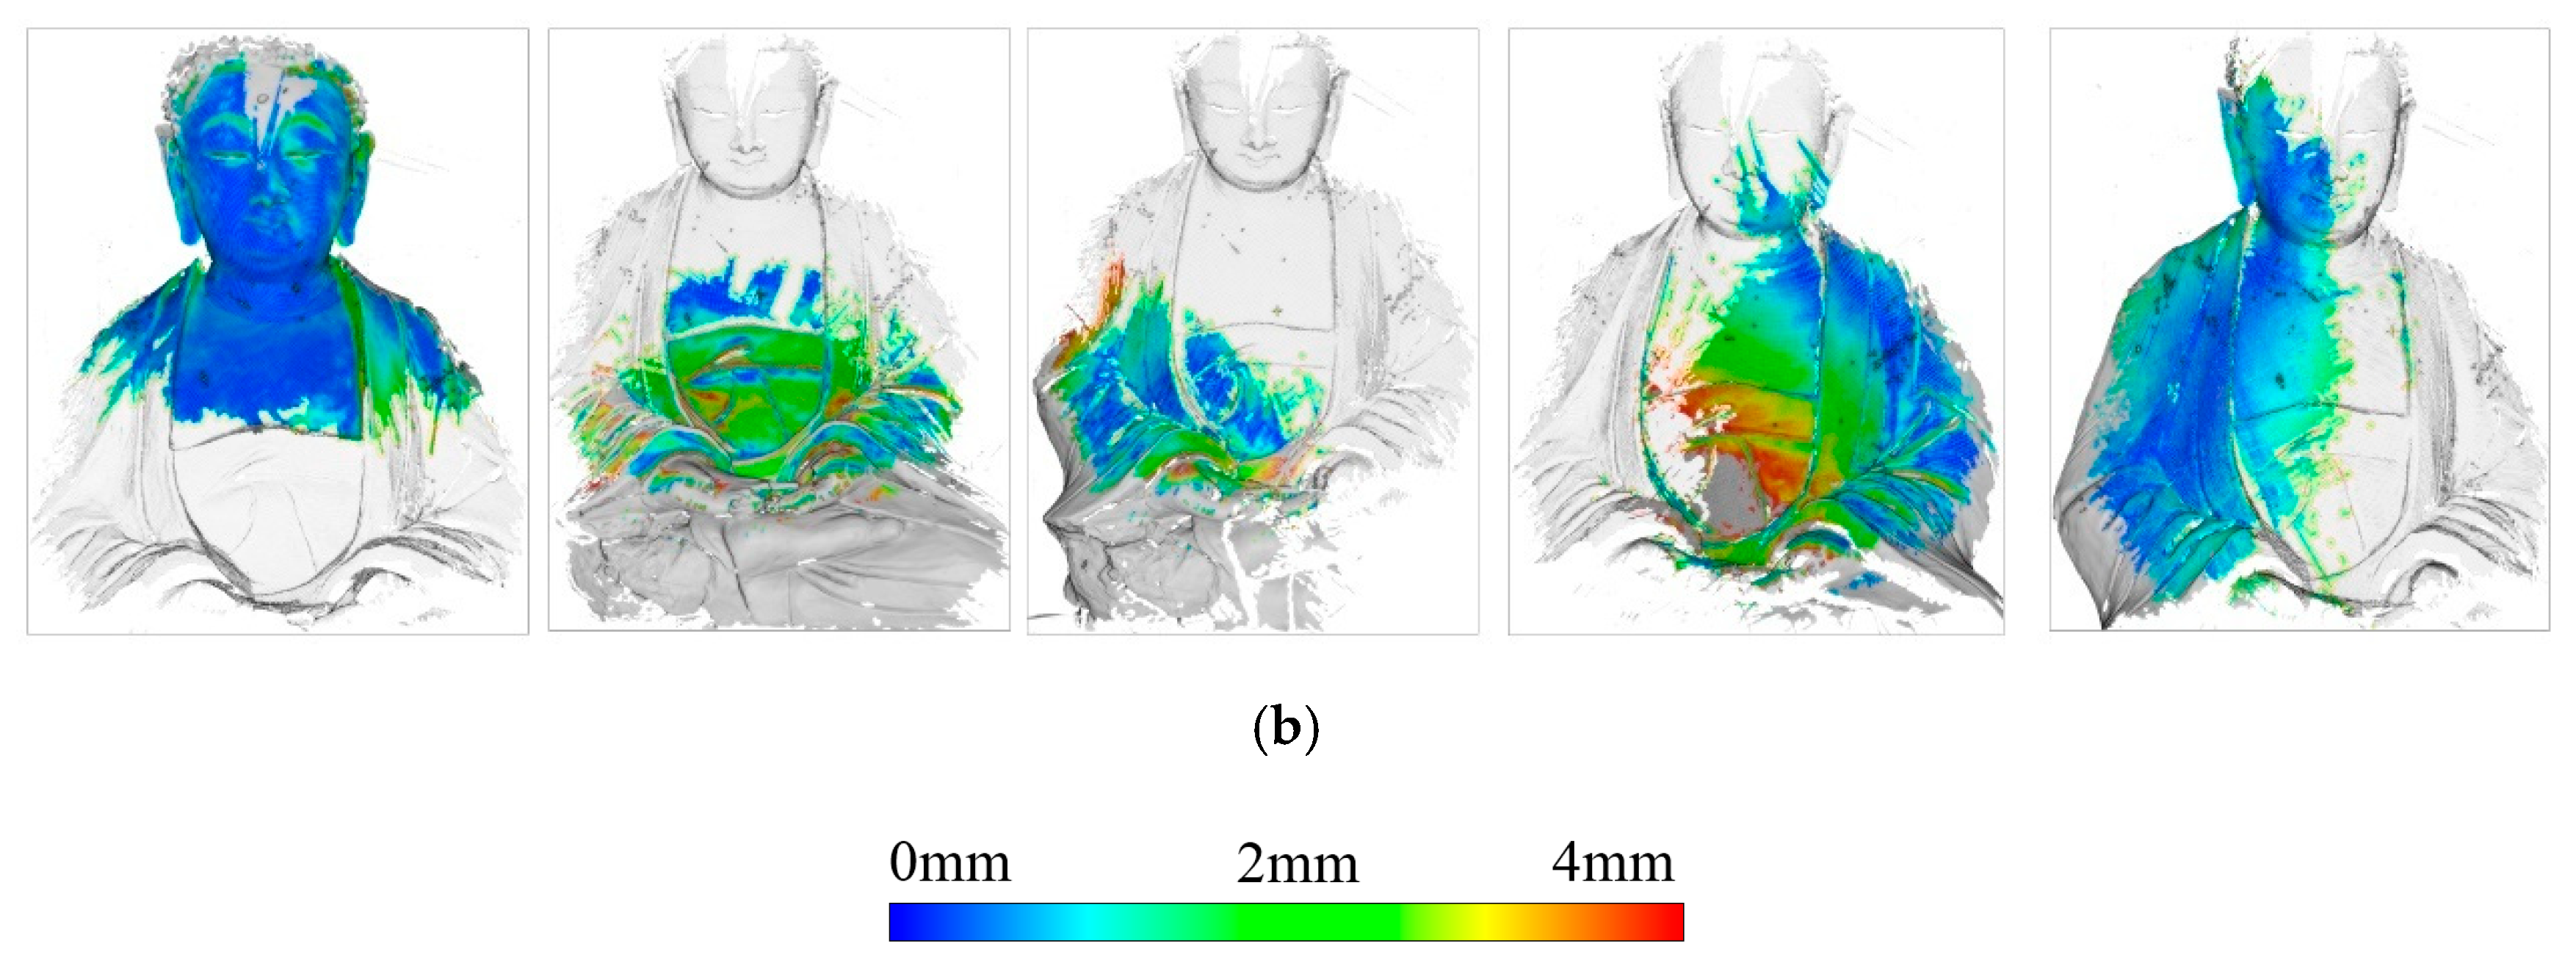
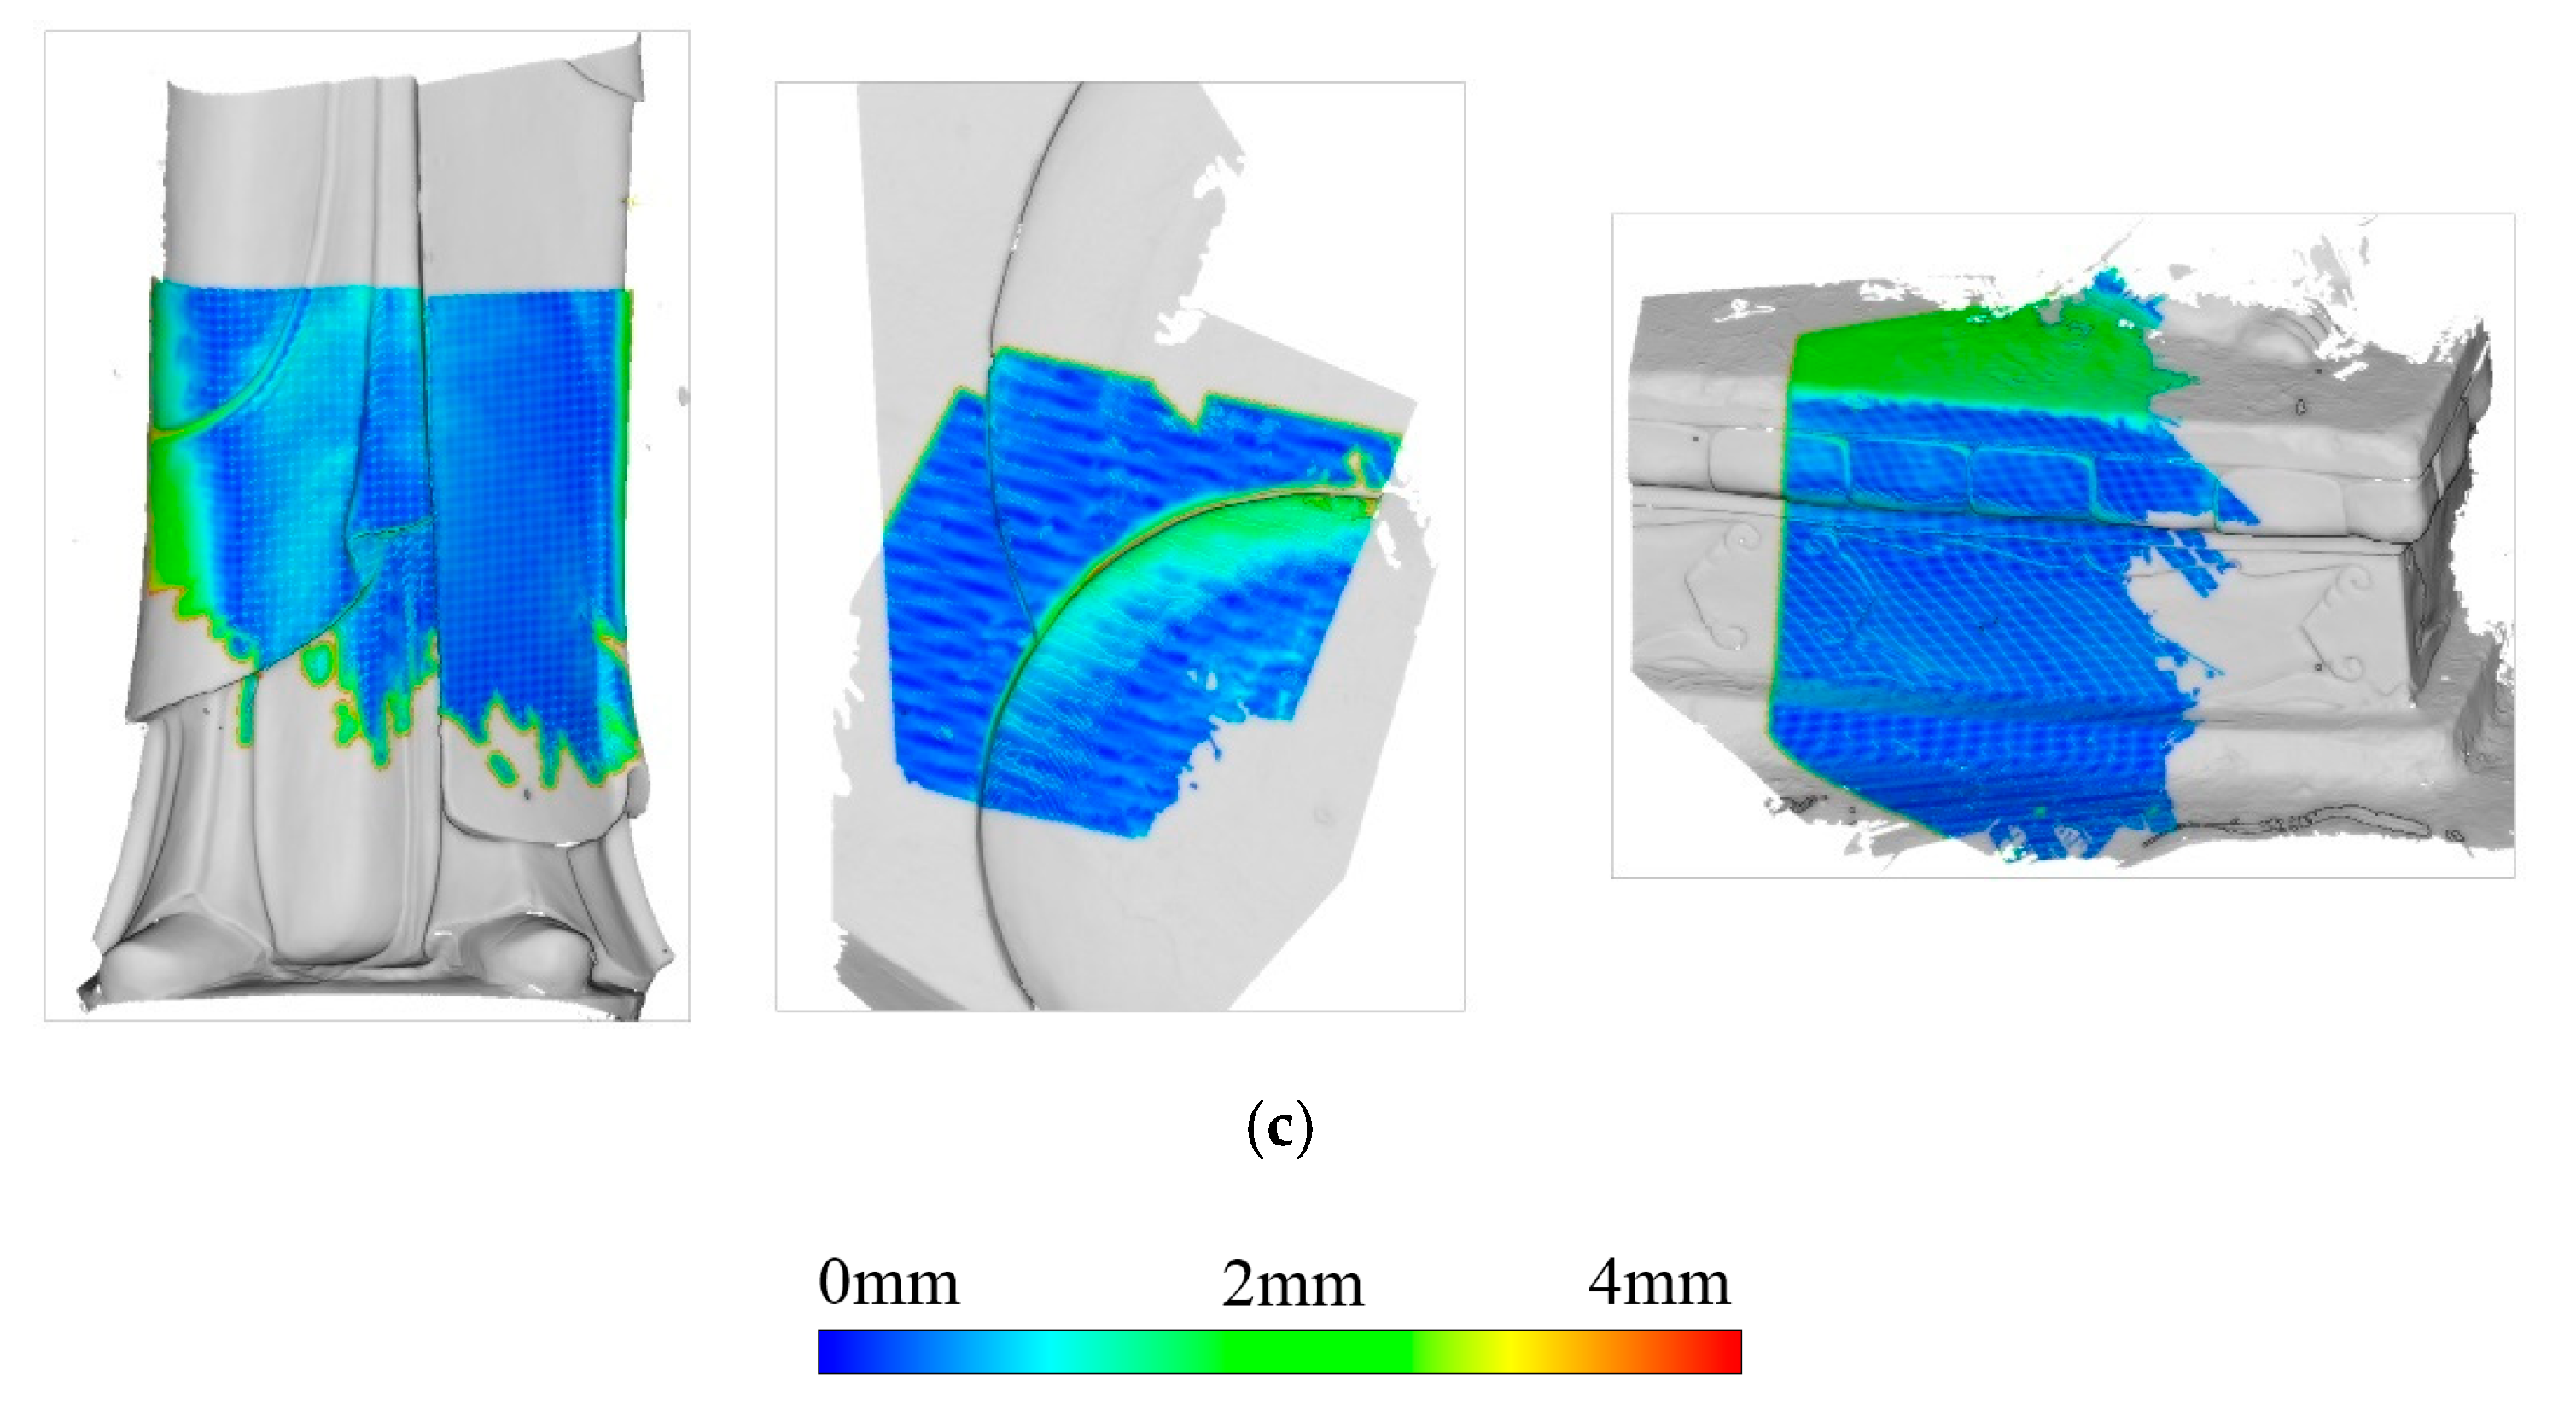
To improve the effectiveness of registration, we used the Geomagic Studio software (Geomagic, Chapelhill, NC, USA) to sample each scan uniformly to a 3.0 mm average point density (about 6000 points). The registration accuracy of the General and the Buddha data is shown in Figure 12. The color is rendered using the distance from one point in the target point cloud to its nearest point of the transformed template point cloud in the overlap areas. To qualitatively demonstrate the registration errors, the results of manual registration were used to evaluate the registration accuracy. Manual registration was performed by manually selecting the corresponding points from the adjacent scans, followed by the ICP refinement. Table 1 provides the evaluation results of the registration performance.
These scans have different overlaps, varying levels of noise, and different initial positions and orientations. Figure 12 and Table 1 indicate that all the pairs of scans do not fall into local convergence and are registered successfully. Column Std. from Table 1 shows that their mean registration errors are within 2.0 mm, demonstrating a good distribution of registration errors. Although several scans have few curves (for example, General data scan 3&4, and 4&5 in Figure 7a) or limited overlaps (for example, 21% for General scan 1&2, and 23% for Buddha scan 2&5), they were still able to get good results (about 0.5 mm mean error for the General data and about 1.5 mm mean error for Buddha data). The above results suggest that the proposed method has good stability. By statistical analysis, considering the actual size of cultural heritage object (about 1.5 m in height and 1.0m in width), the mean errors and std. values are sufficient for the application of field inspection.
Note that the scan 5&6 for the General and scan 2&7 for the Buddha have relatively large errors (1.21 and 2.43 mm, respectively), which were probably caused by repetitive structures resulting in ambiguous correspondences and affecting registration accuracy. The registration errors of the multi-view method are 0.38 mm and 0.69 mm, demonstrating the method’s effectiveness. In addition, Table 1 shows that the number of iterations needed for convergence is within 10, and the runtime is about 1 minute for each pair of scans. These results suggest that our approach method provides a very fast and efficient technique that is tailored and suitable for field inspection.
3.3. Field Inspection Result
To ensure the reliability of the inspection, we performed a multi-view method to further refine the position of each scan. Figure 13 shows the generated images for the General and the Buddha after undergoing the multi-view method. The red circles indicate the problem places identified by inspection. As shown in the figure, many geometric details (e.g., defects) have been preserved well. Through field inspection, we are able to identify the places with missing data (for example, areas A and B in General data, and areas C and D in Buddha data) and those with poor quality (for example, area E in Buddha data). To satisfy the requirements for high accurate heritage documentation, these areas would require extra field scanning.
4. Discussion
4.1. Pairwise Registration Comparison
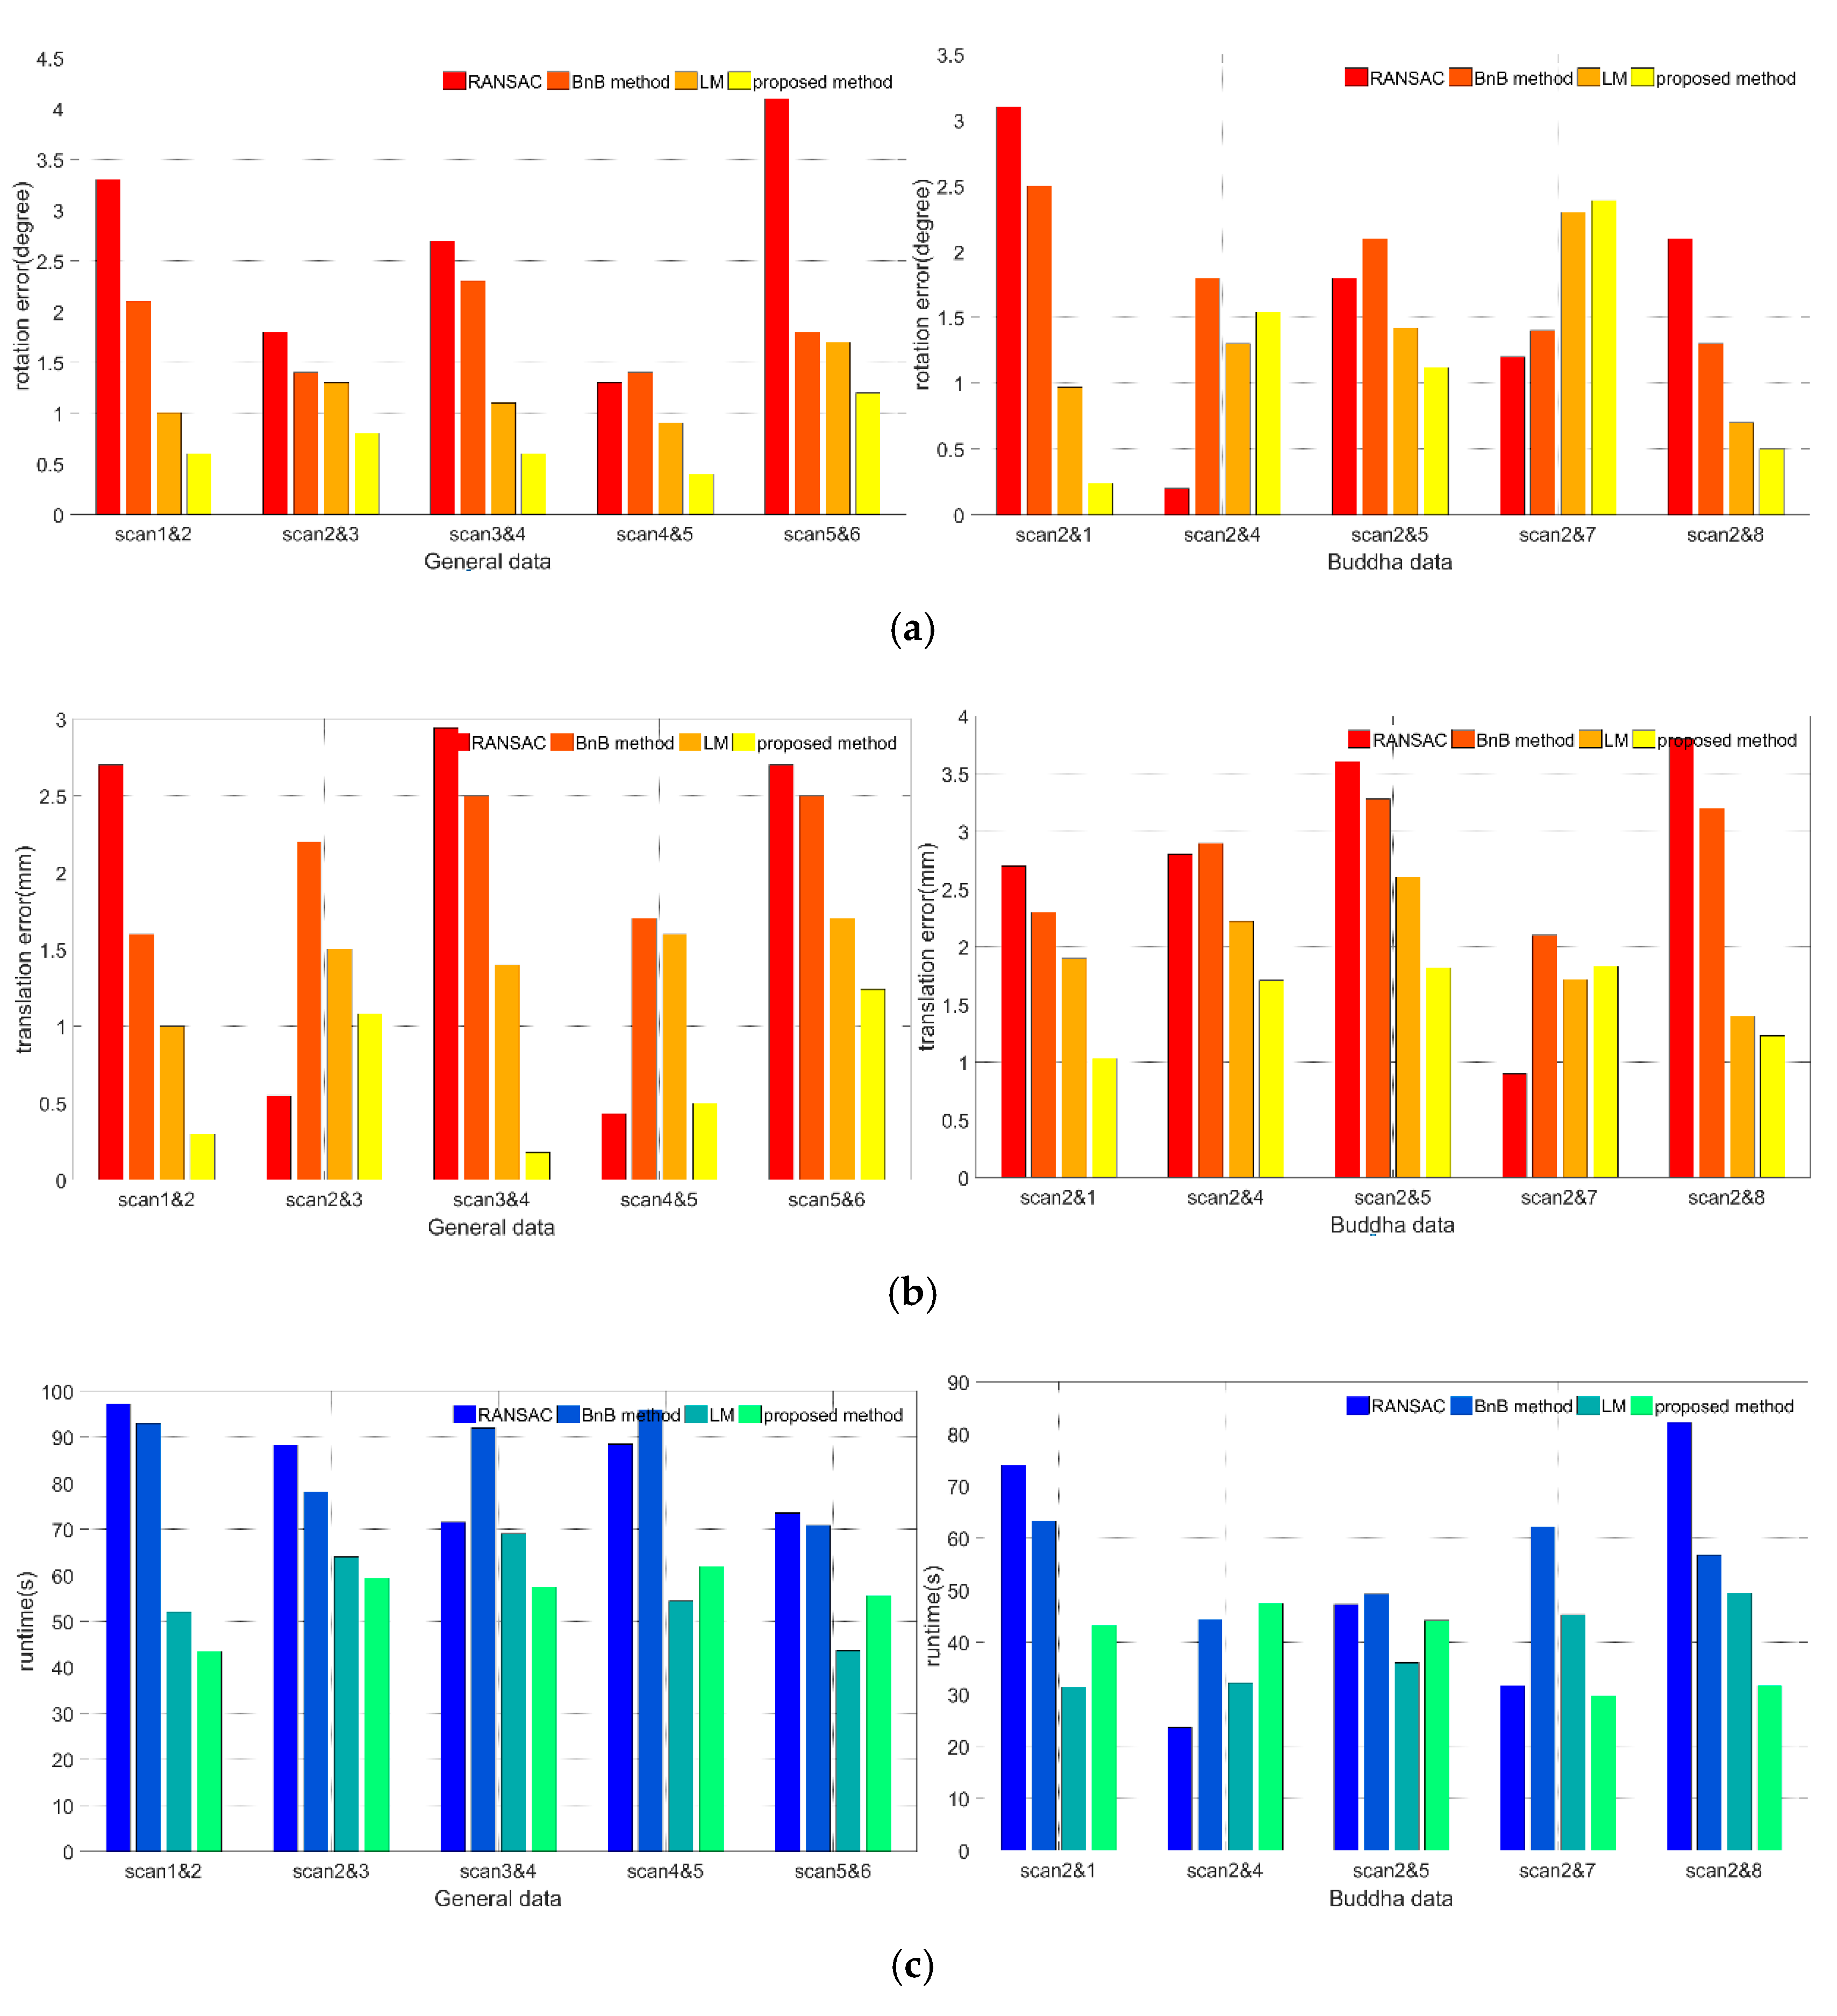
To further evaluate the method’s performance, we compared the proposed method to other pairwise registration methods, including the popular RANSAC method [69], the BnB method [71], and the LM method (lifting method) [70]. The codes can be obtained from the link (https://github.com/ZhipengCai/Demo---Practical-optimal-registration-of-terrestrial-LiDAR-scan-pairs). The following parameters of the compared methods are tuned to get best performance. Specifically, in RANSAC method, the probability of searching a valid sample set is 0.98; In BnB method, 300×300×300 grids are used for 3D Distance Transform (DT) computation, and the convergence threshold is set to 0.01; In LM method, the annealing rate is set to 1.2. The transformation parameters of manual registration were used to evaluate the proposed method. To ensure the reliability, manual registration was performed by carefully selecting some corresponding points from adjacent scans, and the registration result was further refined by the ICP method. The rotation and translation errors were calculated by the deviations from the transformation parameters of manual registration using: and . Figure 14 shows the translation and rotation errors and the runtime for each method. The experiments were implemented on a computer with 16 GB RAM and an Intel Core i7-6700HQ @2.60 GHz CPU.
As shown in Figure 14a,b, the proposed method performed the best. LM method had a competitive performance both in rotation and translation estimation. This is because LM is also a softassign-based optimization method, but our method is specialized for the free-form cultural heritage objects that geometric properties and curve constraints are combined efficiently, leading to a better result. The RANSAC method could sometimes generate better results than the proposed method (for example, in scan 2&4 for the Buddha data in Figure 14a; in scan 2&3 and 4&5 for the General data in Figure 14b). This result was probably dependent on the randomly selected primitives. The BnB method had the worst performance. Given that the BnB method’s main advantage is obtaining global optimization in a large solution space, the tested scans had small initial positions and orientations, which are more suited for the proposed method. Figure 14c shows that the LM method performs the best among the compared methods, and the proposed approach performed competitively. The runtime for the RANSAC method was not stable (for example, scan 2&4, 2&7 of Buddha data needs the least runtime). In conclusion, the proposed method is efficient both in accuracy and in runtime.
4.2. Evaluation of Robustness Performance
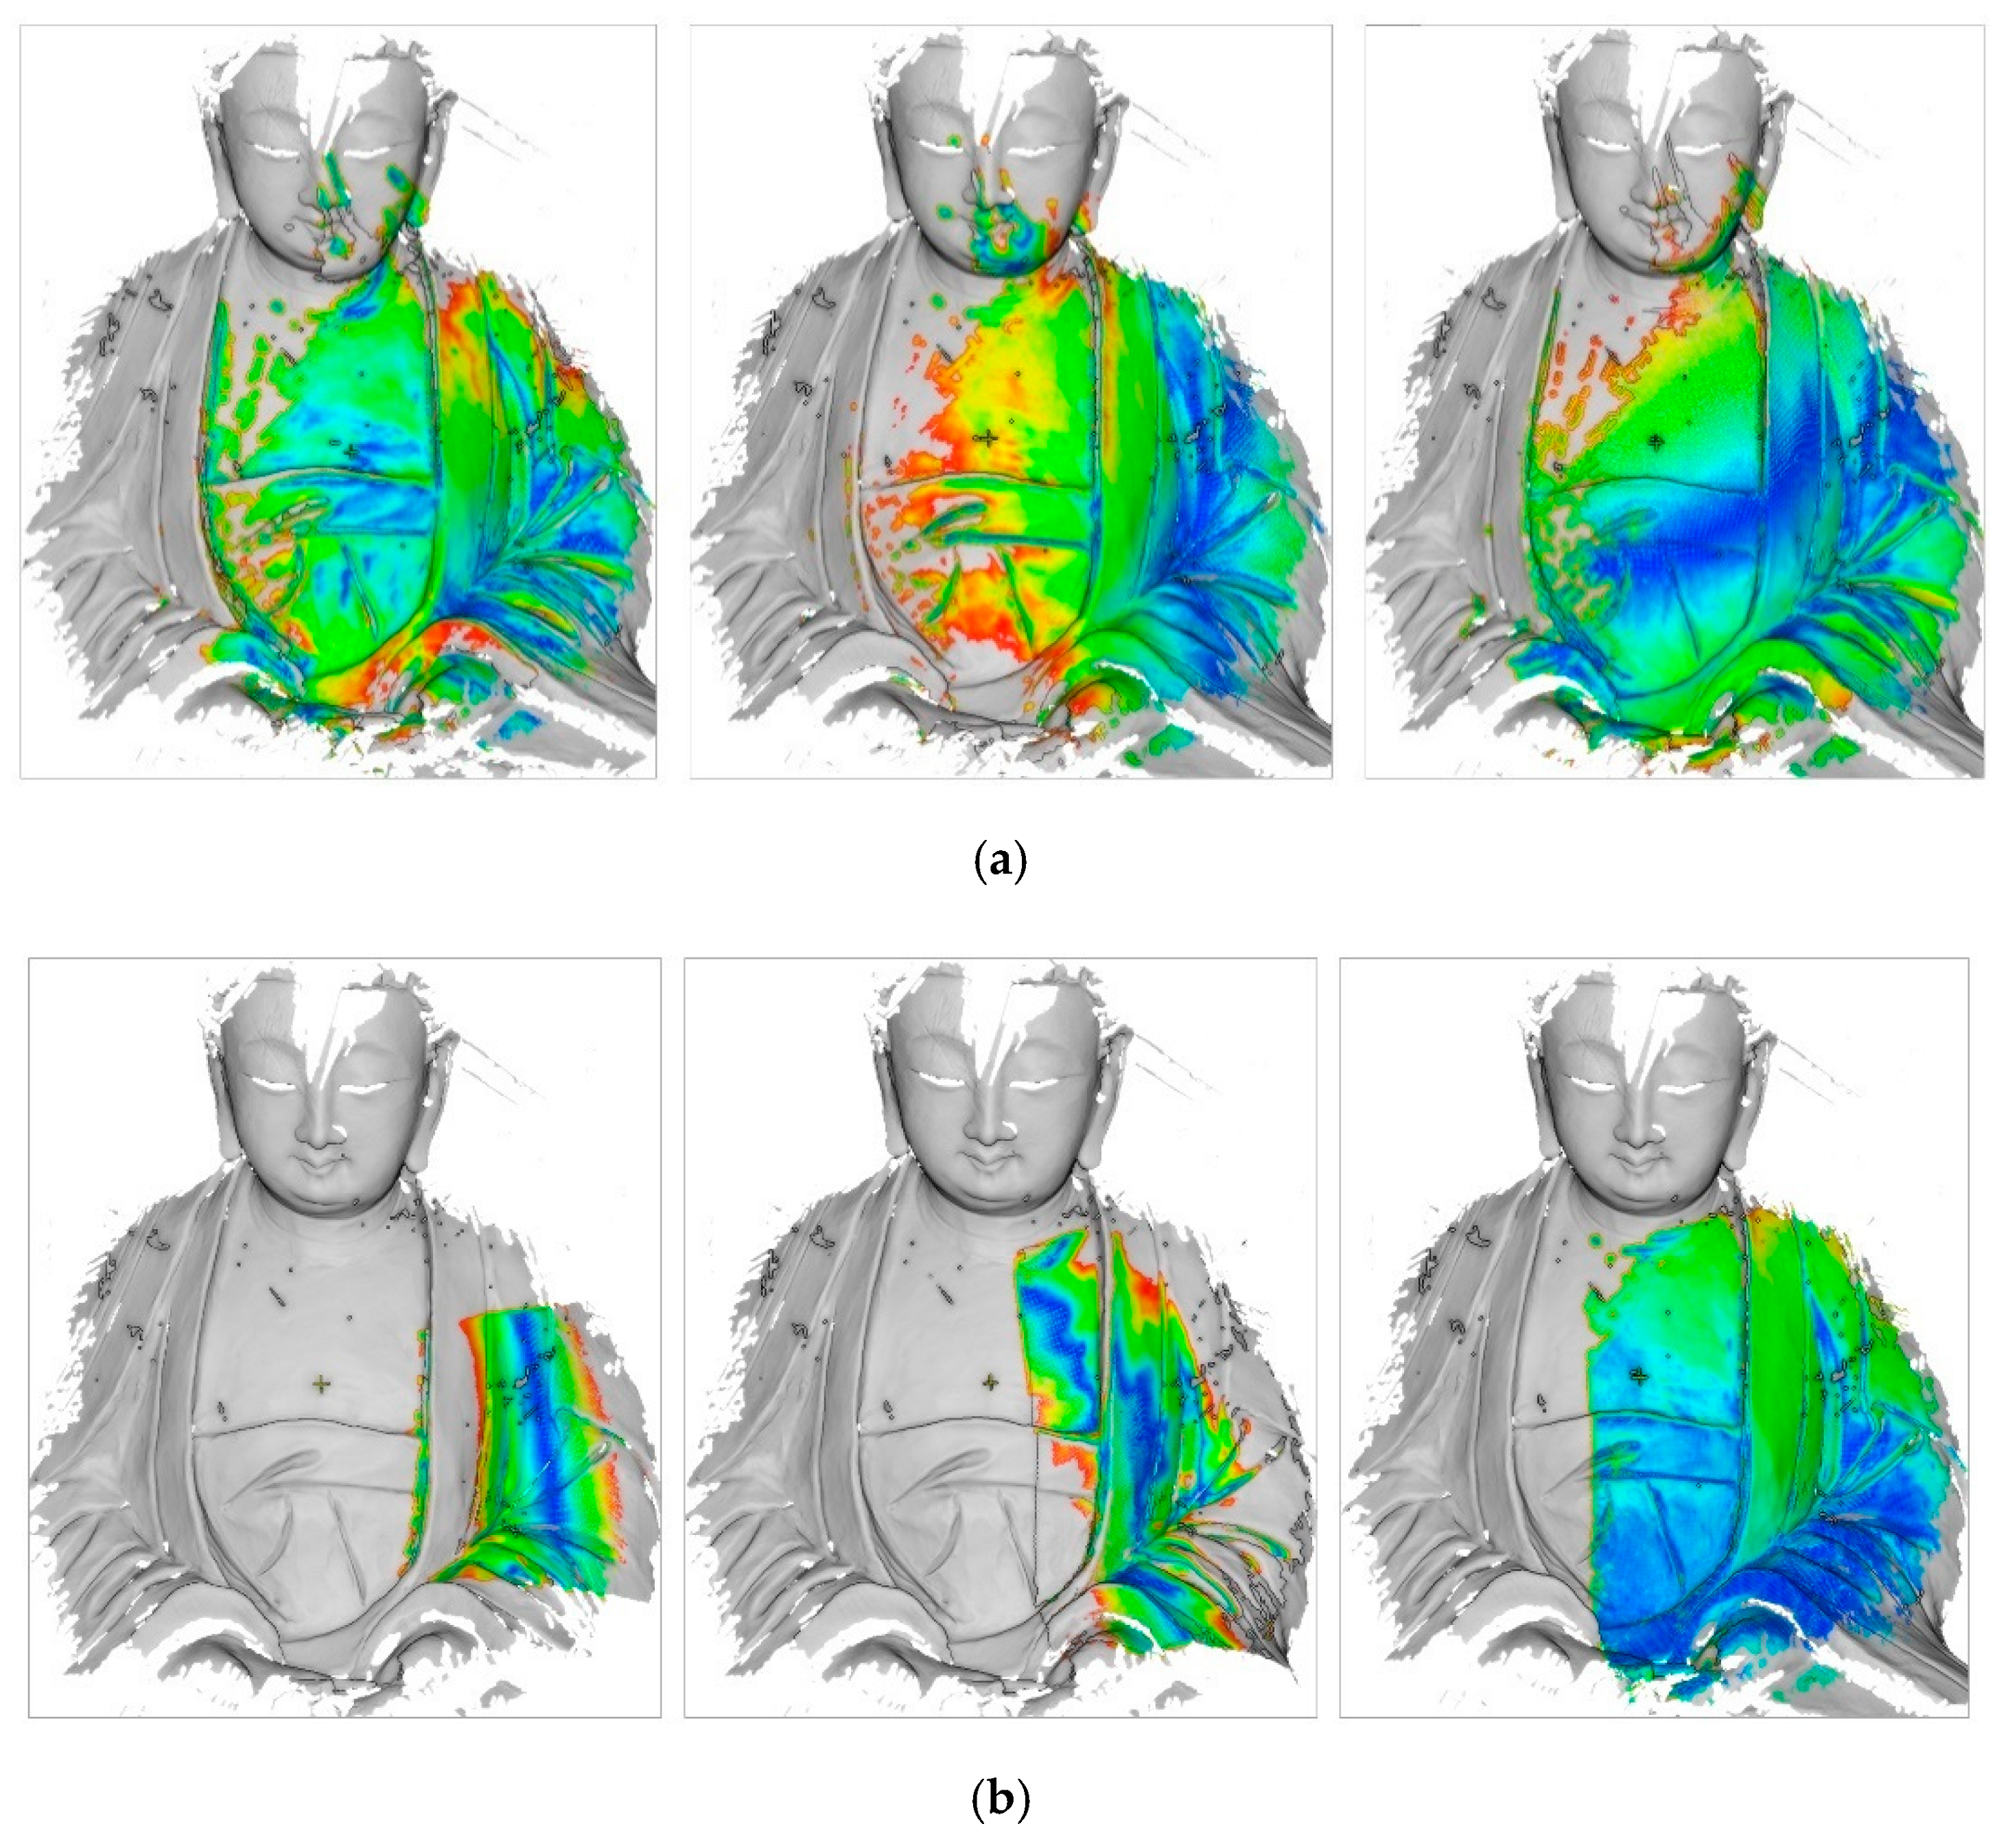
To test the robustness of the proposed method comprehensively, we simulated various datasets for testing. The pairwise registration results are shown in Figure 15. Figure 15a shows the registration with different amounts of noise (8%, 4%, and 2% Gaussian noise are added to the original point clouds). Figure 15b shows the registration for different overlaps (i.e., 30%, 55%, and 80%) of the original point clouds. Figure 15c shows the registration results on objects with few curves.
As shown in Figure 15, the point clouds for all the situations were registered successfully. Figure 15a shows the proposed method is robust to noise and outliers. Although the middle column gets relatively poor results (i.e., about 2.0 mm), the point clouds can still be aligned together. Figure 15b shows the proposed method performs robustly for different overlap ratios. However, for the 30% overlap ratio (the left column in Figure 15a), the proposed method generated comparatively poor results, indicating that the overlap value can affect the method’s accuracy. In Figure 15c, the method performs well, indicating that the accuracy and robustness of the method are not dependent on the curves. The curves can be used to improve efficiency but do not affect robustness. Considering the results, the method shows good robustness, as it is able to exploit the advantages of the probabilistic method.
4.3. Ablation Study
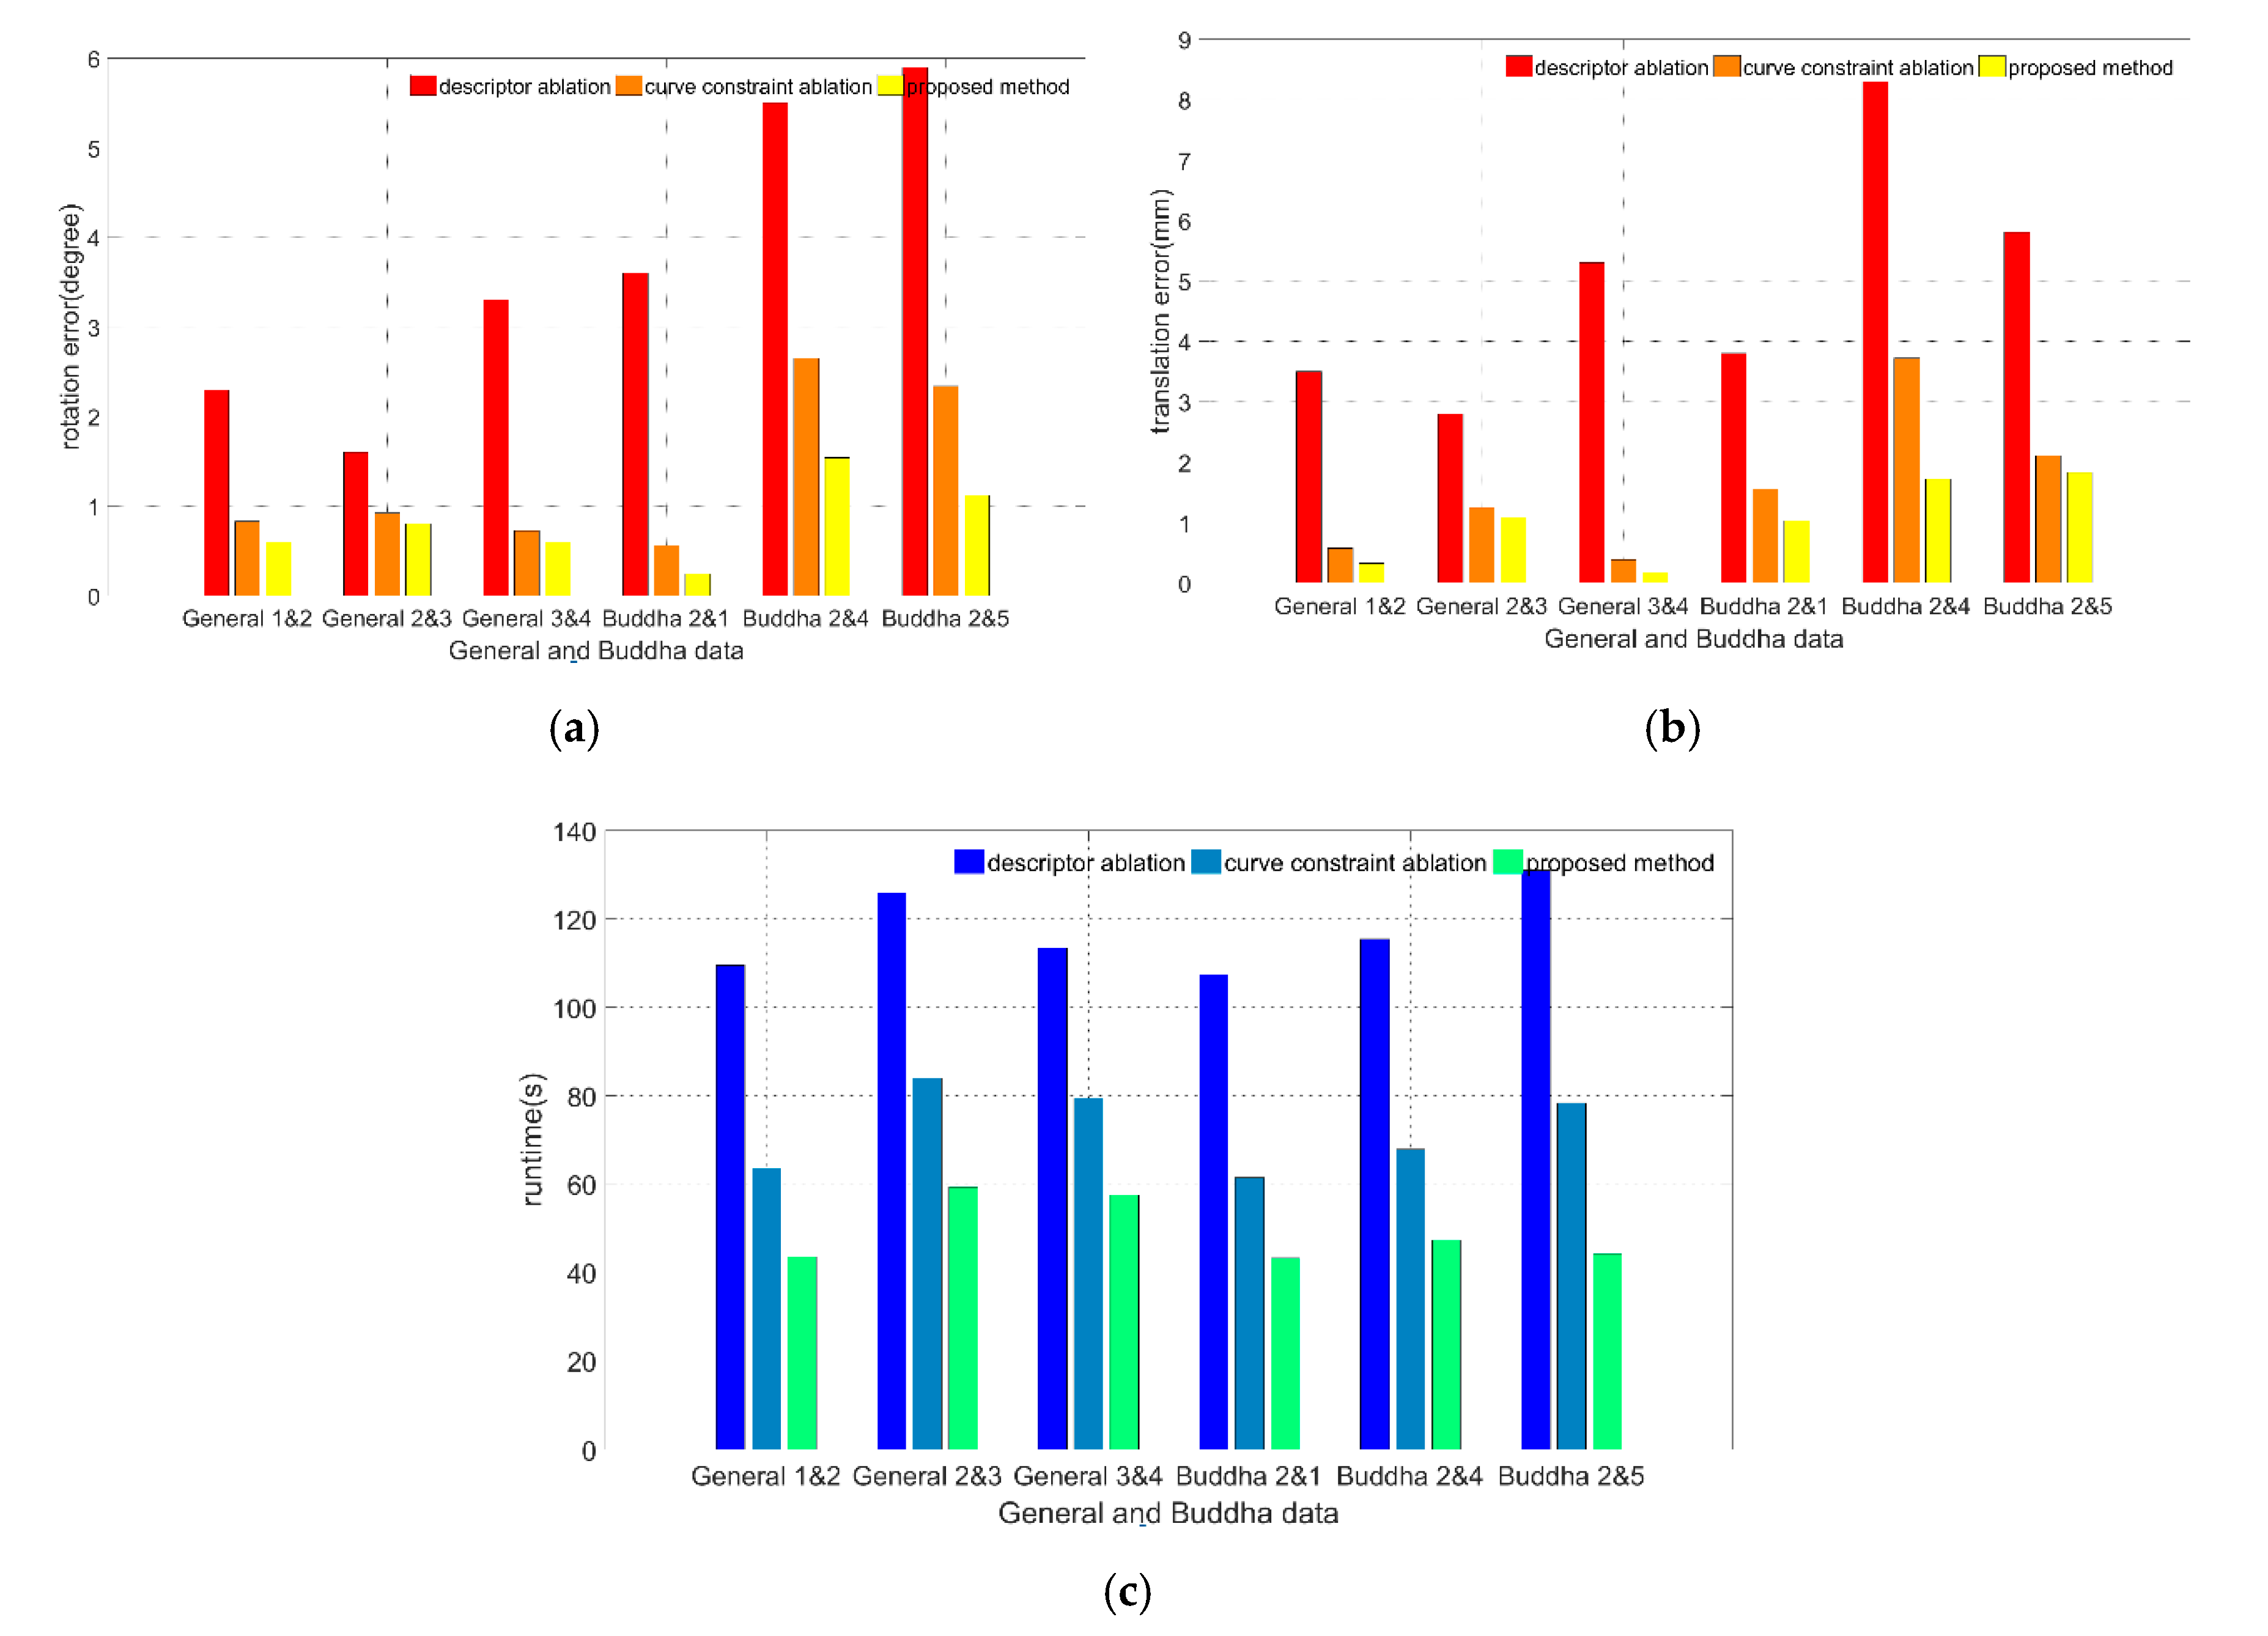
To directly show the contributions of the proposed method, an ablation study was implemented, consisting of two components: the descriptor ablation and the curve constraint ablation. Descriptor ablation is used to check the role of the proposed descriptor by removing the principal direction descriptor from the method and preserving the Euclidean term and the curve constraint term. For the curve constraint ablation, the role of the curve constraints is tested by removing them. Three pairs of scans were randomly selected from the General and the Buddha data for testing. The translation and rotation errors were then calculated based on the true value of the transformation, as discussed in Section 4.1. The results of the ablation study are shown in Figure 16.
As shown in Figure 16, the results indicate that the descriptor and the curve constraints contribute significantly to the effectiveness and registration accuracy. Specifically, without the descriptor term, the method would result in considerably larger registration errors (almost three times than the proposed method) and would require more time (almost twice than the proposed method). For scans 2&4 and 2&5 of the Buddha data in Figure 16a,b, even the correct convergence cannot be ensured, which could suggest that the descriptor rejects much of the incorrect matches, thereby avoiding local convergence and improving efficiency. On the other hand, without the curve constraints, the registration errors are similar to the proposed method. However, the runtime needed for convergence is significantly increased. This suggests that the curve constraints efficiently limit the solution space, leading to much faster convergence. In conclusion, the above experiments demonstrate that the descriptor and curve constraints improve the accuracy, robustness, and effectiveness of the alignment.
5. Conclusions and Future Work
Heritage documentation, aimed at the conservation and protection of invaluable cultural heritage objects, is implemented by recording historical monuments and artifacts in digital forms. As a commonly used approach, laser scanning is able to collect highly accurate 3D data without damaging these historical artifacts. During data collection, inspection is important in order to check the integrity and quality of the scanned data. To fulfill this aim, this paper proposed a fast and robust probabilistic registration by combining shape descriptor and curve constraints for free-form objects (e.g., Buddha) and validated its performance using real-world artifact datasets. Comprehensive experiments showed that the proposed method performed well in terms of robustness and runtime and outperformed commonly used approaches. Although the method was able to provide satisfactory results, it still had difficulty for ambiguous objects with repetitive structures, which led to incorrect correspondences and transformation.
For future work, we are planning to design a more robust shape descriptor with good descriptiveness particularly suited for large-scale heritage monuments. We are also planning on improving the probabilistic framework to make it more general and scientific and extend its usefulness to other applications (e.g., train track matching, oil tank deformation monitoring, or reconstruction of cultural heritage). Color information can also be used in combination with our probabilistic method to improve its performance in the future research.
Author Contributions
Yufu Zang designed the algorithms as described in this paper and was responsible for the main organization and writing of the paper. Xiongwu Xiao, Bijun Li, Jianfeng Zhu, and Fancong Meng contribute to the conceptualization, data curation, and investigation. Yufu Zang and Xiongwu Xiao revised the manuscript. All authors have read and agreed to the published version of the manuscript.
Funding
This research was funded by the National Natural Science Foundation of China (Grant No. 41701529), Open Research Fund of State key Laboratory of Information Engineering in Surveying, Mapping and Remote Sensing, Wuhan University (Grant No. 18S02), and the National Natural Science Foundation of China (Grant No. 91638203).
Conflicts of Interest
The authors declare no conflict of interest.
References
- Alshawabkeh, Y.; El-Khalili, M.; Almasri, E.; Bala’Awi, F.; Al-Massarweh, A. Heritage documentation using laser scanner and photogrammetry. The case study of Qasr Al-Abidit, Jordan. Digit. Appl. Archaeol. Cult. Herit. 2020, 16, e00133. [Google Scholar] [CrossRef]
- Guarneri, M.; Ceccarelli, S.; De Collibus, M.F.; Francucci, M.; Ciaffi, M. Multi-wavelengths 3D laser scanning for pigment and structural studies on the frescoed ceiling the triumph of divine providence. ISPRS Int. Arch. Photogramm. Remote Sens. Spat. Inf. Sci. 2019, 2, 549–554. [Google Scholar] [CrossRef] [Green Version]
- Tumeliene, E.; Nareiko, V.; Suziedelyte-Visockiene, J. Photogrammetric measurements of heritage objects. ISPRS Ann. Photogramm. Remote Sens. Spat. Inf. Sci. 2017, 4, 71–76. [Google Scholar] [CrossRef] [Green Version]
- Kushwaha, S.K.P.; Dayal, K.R.; Raghavendra, S.; Pande, H.; Tiwari, P.S.; Agrawal, S.; Srivastava, S.K. 3D Digital documentation of a cultural heritage site using terrestrial laser scanner—A case study. In Applications of Geomatics in Civil Engineering; Springer: Singapore, 2020; pp. 49–58. [Google Scholar]
- Barrile, V.; Bilotta, G.; Meduri, G.M.; De Carlo, D.; Nunnari, A. Laser Scanner Technology, Ground-Penetrating Radar and Augmented Reality for the Survey and Recovery of Artistic, Archaeological and Cultural Heritage. ISPRS Ann. Photogramm. Remote Sens. Spat. Inf. Sci. 2017, 4, 123–127. [Google Scholar] [CrossRef] [Green Version]
- Selbesoglu, M.O.; Bakirman, T.; Gokbayrak, O. Deformation Measurement Using Terrestrial Laser Scanner For Cultural Heritage. ISPRS Int. Arch. Photogramm. Remote Sens. Spat. Inf. Sci. 2016, 89–93. [Google Scholar] [CrossRef] [Green Version]
- Ceccarelli, S.; Guarneri, M.; De Collibus, M.F.; Francucci, M.; Ciaffi, M.; Danielis, A. Laser Scanners for High-Quality 3D and IR Imaging in Cultural Heritage Monitoring and Documentation. J. Imaging 2018, 4, 130. [Google Scholar] [CrossRef] [Green Version]
- Klapa, P.; Mitka, B.; Zygmunt, M. Application of Integrated Photogrammetric and Terrestrial Laser Scanning Data to Cultural Heritage Surveying. IOP Conf. Ser. Earth Environ. Sci. 2017, 95, 32007. [Google Scholar] [CrossRef] [Green Version]
- Jo, Y.H.; Hong, S. Three-Dimensional Digital Documentation of Cultural Heritage Site Based on the Convergence of Terrestrial Laser Scanning and Unmanned Aerial Vehicle Photogrammetry. ISPRS Int. J. Geo-Inf. 2019, 8, 53. [Google Scholar] [CrossRef] [Green Version]
- Rüther, H.; Held, C.; Bhurtha, R.; Schröder, R.; Wessels, S. Challenges in heritage documentation with terrestrial laser scanning. In Proceedings of the 1st AfricaGEO Conference, Capetown, South Africa, 30 May 2011. [Google Scholar]
- Markiewicz, J.; Zawieska, D. Analysis of the Selection Impact of 2D Detectors on the Accuracy of Image-Based TLS Data Registration of Objects of Cultural Heritage and Interiors of Public Utilities. Sensors 2020, 20, 3277. [Google Scholar] [CrossRef]
- Markiewicz, J.S.; Markiewicz, Ł.; Foryś, P. The comparision of 2D and 3D detectors for TLS data registration–preliminary results. Int. Arch. Photogramm. Remote Sens. Spat. Inf. Sci. 2019, XLII-2/W9, 467–472. [Google Scholar] [CrossRef] [Green Version]
- Chen, J.; Shan, S.; He, C.; Zhao, G.; Pietikäinen, M.; Chen, X.; Gao, W. WLD: A Robust Local Image Descriptor. IEEE Trans. Pattern Anal. Mach. Intell. 2009, 32, 1705–1720. [Google Scholar] [CrossRef]
- Zhu, J.; Fang, Y. Reference Grid-assisted Network for 3D Point Signature Learning from Point Clouds. In Proceedings of the 2020 IEEE Winter Conference on Applications of Computer Vision (WACV), Snowmass Village, CO, USA, 1–5 March 2020; pp. 211–220. [Google Scholar]
- Li, X.; Liu, J.; Zhao, H. Point cloud registration by discrete spin image and normal alignment radial feature. In Proceedings of the 15th ACM SIGGRAPH Conference on Virtual-Reality Continuum and Its Applications in Industry, Zhuhai, China, 3–4 December 2016; Volume 1, pp. 373–379. [Google Scholar]
- Wang, F.; Ye, Y.; Hu, X.; Shan, J. Point cloud registration by combining shape and intensity contexts. In Proceedings of the 2016 9th IAPR Workshop on Pattern Recognition in Remote Sensing (PRRS), Cancun, Mexico, 4 December 2016; pp. 1–6. [Google Scholar] [CrossRef]
- Cejnog, L.W.X.; Yamada, F.A.A.; Vieira, M.B. Wide Angle Rigid Registration Using a Comparative Tensor Shape Factor. Int. J. Image Graph. 2017, 17, 1750006. [Google Scholar] [CrossRef]
- Rusu, R.B.; Blodow, N.; Beetz, M. Fast Point Feature Histograms (FPFH) for 3D registration. In Proceedings of the 2009 IEEE International Conference on Robotics and Automation, Kobe, Japan, 12–17 May 2009; pp. 3212–3217. [Google Scholar]
- Tombari, F.; Salti, S.; Di Stefano, L. Unique signatures of histograms for local surface description. In European Conference on Computer Vision; Springer: Berlin/Heidelberg, Germany, 2010; pp. 356–369. [Google Scholar]
- Ragb, H.K.; Asari, V.K. Multi-feature fusion and PCA based approach for efficient human detection. In Proceedings of the 2016 IEEE Applied Imagery Pattern Recognition Workshop, Washington, DC, USA, 18–20 October 2016; pp. 1–6. [Google Scholar] [CrossRef]
- Dong, Z.; Yang, B.; Liu, Y.; Liang, F.; Li, B.; Zang, Y. A novel binary shape context for 3D local surface description. ISPRS J. Photogramm. Remote Sens. 2017, 130, 431–452. [Google Scholar] [CrossRef]
- Cirujeda, P.; Cid, Y.D.; Mateo, X.; Binefa, X. A 3D Scene Registration Method via Covariance Descriptors and an Evolutionary Stable Strategy Game Theory Solver. Int. J. Comput. Vis. 2015, 115, 306–329. [Google Scholar] [CrossRef]
- Yang, B.; Zang, Y. Automated registration of dense terrestrial laser-scanning point clouds using curves. ISPRS J. Photogramm. Remote Sens. 2014, 95, 109–121. [Google Scholar] [CrossRef]
- Takimoto, R.Y.; Tsuzuki, M.S.G.; Vogelaar, R.; Martins, T.C.; Sato, A.K.; Iwao, Y.; Gotoh, T.; Kagei, S. 3D reconstruction and multiple point cloud registration using a low precision RGB-D sensor. Mechatronics 2016, 35, 11–22. [Google Scholar] [CrossRef]
- Huhle, B.; Magnusson, M.; Strasser, W.; Lilienthal, A.J. Registration of colored 3D point clouds with a Kernel-based extension to the normal distributions transform. In Proceedings of the 2008 IEEE International Conference on Robotics and Automation, Pasadena, CA, USA, 19–23 May 2008; pp. 4025–4030. [Google Scholar]
- Della Corte, B.; Bogoslavskyi, I.; Stachniss, C.; Grisetti, G. A General Framework for Flexible Multi-Cue Photometric Point Cloud Registration. In Proceedings of the 2018 IEEE International Conference on Robotics and Automation (ICRA), Brisbane, Australia, 21–25 May 2018; pp. 1–8. [Google Scholar]
- Servos, J.; Waslander, S.L. Multi-Channel Generalized-ICP: A robust framework for multi-channel scan registration. Robot. Auton. Syst. 2017, 87, 247–257. [Google Scholar] [CrossRef] [Green Version]
- Zaganidis, A.; Sun, L.; Duckett, T.; Cielniak, G. Integrating Deep Semantic Segmentation Into 3-D Point Cloud Registration. IEEE Robot. Autom. Lett. 2018, 3, 2942–2949. [Google Scholar] [CrossRef] [Green Version]
- Park, J.; Zhou, Q.-Y.; Koltun, V. Colored Point Cloud Registration Revisited. In Proceedings of the 2017 IEEE International Conference on Computer Vision (ICCV), Venice, Italy, 22–29 October 2017; pp. 143–152. [Google Scholar]
- Akca, D. Registration of point clouds using range and intensity information. In Recording, Modeling and Visualization of Cultural Heritage; Taylor & Francis: Abingdon, UK, 2006; pp. 115–126. [Google Scholar]
- Sipiran, I.; Bustos, B. Harris 3D: A robust extension of the Harris operator for interest point detection on 3D meshes. Vis. Comput. 2011, 27, 963–976. [Google Scholar] [CrossRef]
- Urschler, M.; Bauer, J.; Ditt, H.; Bischof, H. SIFT and shape context for feature-based nonlinear registration of thoracic CT images. In International Workshop on Computer Vision Approaches to Medical Image Analysis; Springer: Berlin/Heidelberg, Germany, 2006; pp. 73–84. [Google Scholar]
- Tong, L.; Ying, X. 3D Point Cloud Initial Registration Using Surface Curvature and SURF Matching. 3D Res. 2018, 9, 41. [Google Scholar] [CrossRef]
- Sun, J.; Zhang, J.; Zhang, G. An automatic 3D point cloud registration method based on regional curvature maps. Image Vis. Comput. 2016, 56, 49–58. [Google Scholar] [CrossRef]
- Bueno, M.; Martínez-Sánchez, J.; González-Jorge, H. Detection of geometric keypoints and its application to point cloud coarse registration. Int. Arch. Photogramm. Remote Sens. Spat. Inf. Sci. 2016, 41, 187–194. [Google Scholar] [CrossRef]
- Li, P.; Ma, H.; Ming, A. A non-rigid 3D model retrieval method based on scale-invariant heat kernel signature features. Multimed. Tools Appl. 2017, 76, 10207–10230. [Google Scholar] [CrossRef]
- Zhai, Y.; Han, S.; Liu, F.; Li, W.; Guo, S.; Lai, Z. Target recognition of ladar range images using modified local surface patches. Opt. Laser Technol. 2020, 130, 106359. [Google Scholar] [CrossRef]
- Wang, G.; Zhang, X.; Su, Q.; Shi, J.; Caselli, R.J.; Wang, Y. A novel cortical thickness estimation method based on volumetric Laplace–Beltrami operator and heat kernel. Med. Image Anal. 2015, 22, 1–20. [Google Scholar] [CrossRef] [Green Version]
- Hussnain, Z.; Oude Elberink, S.; Vosselman, G. Automatic Feature Detection, Description and Matching from Mobile Laser Scanning Data and Aerial Imagery. ISPRS Int. Arch. Photogramm. Remote Sens. Spat. Inf. Sci. 2016, XLI-B1, 609–616. [Google Scholar] [CrossRef]
- Petricek, T.; Svoboda, T. Point cloud registration from local feature correspondences—Evaluation on challenging datasets. PLoS ONE 2017, 12, e0187943. [Google Scholar] [CrossRef] [Green Version]
- He, Y.; Mei, Y. An efficient registration algorithm based on spin image for LiDAR 3D point cloud models. Neurocomputing 2015, 151, 354–363. [Google Scholar] [CrossRef]
- Dong, Z.; Yang, B.; Liang, F.; Huang, R.; Scherer, S. Hierarchical registration of unordered TLS point clouds based on binary shape context descriptor. ISPRS J. Photogramm. Remote Sens. 2018, 144, 61–79. [Google Scholar] [CrossRef]
- Bueno, M.; González-Jorge, H.; Martínez-Sánchez, J.; Lorenzo, H. Automatic point cloud coarse registration using geometric keypoint descriptors for indoor scenes. Autom. Constr. 2017, 81, 134–148. [Google Scholar] [CrossRef]
- Shanoer, M.M.; Abed, F.M. Evaluate 3D laser point clouds registration for cultural heritage documentation. Egypt. J. Remote Sens. Space Sci. 2018, 21, 295–304. [Google Scholar] [CrossRef]
- Tournas, E.; Tsakiri, M. Automatic 3D point cloud registration for cultural heritage documentation. In Proceedings of the Laser Scanning; IAPRS: Paris, France, 2009; Volume XXXVIII(3), p. W8. [Google Scholar]
- Shao, J.; Zhang, W.; Mellado, N.; Grussenmeyer, P.; Li, R.; Chen, Y.; Wan, P.; Zhang, X.; Cai, S. Automated markerless registration of point clouds from TLS and structured light scanner for heritage documentation. J. Cult. Herit. 2019, 35, 16–24. [Google Scholar] [CrossRef] [Green Version]
- Bae, K.-H.; Lichti, D.D. A method for automated registration of unorganised point clouds. ISPRS J. Photogramm. Remote Sens. 2008, 63, 36–54. [Google Scholar] [CrossRef]
- Yu, H.; Zhen, W.; Yang, W.; Scherer, S. Line-Based 2-D–3-D Registration and Camera Localization in Structured Environments. IEEE Trans. Instrum. Meas. 2020, 69, 8962–8972. [Google Scholar] [CrossRef]
- Awad, M.M. A Morphological Model for Extracting Road Networks from High-Resolution Satellite Images. J. Eng. 2013, 2013, 1–9. [Google Scholar] [CrossRef] [Green Version]
- Babawuro, U.; Beiji, Z. Satellite imagery quality evaluation using image quality metrics for quantitative cadastral analysis. Int. J. Comput. Appl. Eng. Sci. 2011, 1, 391–395. [Google Scholar]
- Babawuro, U.; Beiji, Z. Satellite imagery cadastral features extractions using image processing algorithms: A viable option for cadastral science. Int. J. Comput. Sci. Issues 2012, 9, 30–38. [Google Scholar]
- Grigillo, D.; Kanjir, U. Urban object extraction from digital surface model and digital aerial images. Proc. ISPRS 2012, 22, 215–220. [Google Scholar] [CrossRef] [Green Version]
- Wu, J.; Jie, S.; Yao, W.; Stilla, U. Building boundary improvement for true orthophoto generation by fusing airborne LiDAR data. In Proceedings of the Joint Urban Remote Sensing Event (JURSE), Munich, Germany, 11–13 April 2011. [Google Scholar]
- Date, H.; Yokoyama, T.; Kanai, S.; Hada, Y.; Nakao, M.; Sugawara, T. Efficient Registration of Laser-Scanned Point Clouds of Bridges Using Linear Features. Int. J. Autom. Technol. 2018, 12, 328–338. [Google Scholar] [CrossRef]
- Cui, T.; Ji, S.; Shan, J.; Gong, J.; Liu, K. Line-Based Registration of Panoramic Images and LiDAR Point Clouds for Mobile Mapping. Sensors 2017, 17, 70. [Google Scholar] [CrossRef]
- Vosselman, G.; Dijkman, S. 3D building model reconstruction from point clouds and ground plans. Int. Arch. Photogramm. Remote Sens. Spat. Inf. Sci. 2001, 34, 37–44. [Google Scholar]
- Vosselman, G.; Gorte, B.G.; Sithole, G.; Rabbani, T. Recognising structure in laser scanner point clouds. Int. Arch. Photogramm. Remote Sens. Spat. Inf. Sci. 2004, 46, 33–38. [Google Scholar]
- Pu, S.; Vosselman, G. Knowledge based reconstruction of building models from terrestrial laser scanning data. ISPRS J. Photogramm. Remote Sens. 2009, 64, 575–584. [Google Scholar] [CrossRef]
- Khoshelham, K. Closed-form solutions for estimating a rigid motion from plane correspondences extracted from point clouds. ISPRS J. Photogramm. Remote Sens. 2016, 114, 78–91. [Google Scholar] [CrossRef]
- Eslami, M.; Saadatseresht, M. A New Tie Plane-Based Method for Fine Registration of Imagery and Point Cloud Dataset. Can. J. Remote Sens. 2020, 1–18. [Google Scholar] [CrossRef]
- Xu, Y.; Boerner, R.; Yao, W.; Hoegner, L.; Stilla, U. Automatic coarse registration of point clouds in 3D urban scenes using voxel based plane constraint. ISPRS Ann. Photogramm. Remote Sens. Spat. Inf. Sci. 2017, 4. [Google Scholar] [CrossRef] [Green Version]
- Zhang, Z.; Sun, L.; Zhong, R.; Chen, D.; Xu, Z.; Wang, C.; Qin, C.-Z.; Sun, H.; Li, R. 3-D Deep Feature Construction for Mobile Laser Scanning Point Cloud Registration. IEEE Geosci. Remote Sens. Lett. 2019, 16, 1904–1908. [Google Scholar] [CrossRef]
- Pujol-Miró, A.; Casas, J.R.; Ruiz-Hidalgo, J. Correspondence matching in unorganized 3D point clouds using Convolutional Neural Networks. Image Vis. Comput. 2019, 83, 51–60. [Google Scholar] [CrossRef]
- Charles, R.Q.; Su, H.; Kaichun, M.; Guibas, L.J. PointNet: Deep Learning on Point Sets for 3D Classification and Segmentation. In Proceedings of the 2017 IEEE Conference on Computer Vision and Pattern Recognition (CVPR), Honolulu, HI, USA, 21–26 July 2017; pp. 77–85. [Google Scholar]
- Qi, C.R.; Yi, L.; Su, H.; Guibas, L.J. Pointnet++: Deep hierarchical feature learning on point sets in a metric space. In Advances in Neural Information Processing Systems; NIPS: Long Beach, CA, USA, 2017; pp. 5099–5108. [Google Scholar]
- Deng, H.; Birdal, T.; Ilic, S. Ppf-foldnet: Unsupervised learning of rotation invariant 3d local descriptors. In European Conference on Computer Vision; Springer: Munich, Germany, 2018; pp. 602–618. [Google Scholar]
- Aoki, Y.; Goforth, H.; Srivatsan, R.A.; Lucey, S. PointNetLK: Robust and efficient point cloud registration using PointNet. In Proceedings of the IEEE Conference on Computer Vision and Pattern Recognition, Long Beach, CA, USA, 15–20 June 2019; pp. 7163–7172. [Google Scholar]
- Kurobe, A.; Sekikawa, Y.; Ishikawa, K.; Saito, H. CorsNet: 3D Point Cloud Registration by Deep Neural Network. IEEE Robot. Autom. Lett. 2020, 5, 3960–3966. [Google Scholar] [CrossRef]
- Theiler, P.W.; Wegner, J.D.; Schindler, K. Keypoint-based 4-Points Congruent Sets–Automated marker-less registration of laser scans. ISPRS J. Photogramm. Remote Sens. 2014, 96, 149–163. [Google Scholar] [CrossRef]
- Zhou, Q.-Y.; Park, J.; Koltun, V. Fast global registration. In European Conference on Computer Vision; Springer: Cham, Switzerland, 2016; pp. 766–782. [Google Scholar]
- Yang, J.; Li, H.; Jia, Y. Go-ICP: Solving 3D Registration Efficiently and Globally Optimally. In Proceedings of the 2013 IEEE International Conference on Computer Vision, Sydney, Australia, 1–8 December 2013; pp. 1457–1464. [Google Scholar]
- Kim, P.; Chen, J.; Cho, Y.K. SLAM-driven robotic mapping and registration of 3D point clouds. Autom. Constr. 2018, 89, 38–48. [Google Scholar] [CrossRef]
- Evangelidis, G.D.; Horaud, R. Joint Alignment of Multiple Point Sets with Batch and Incremental Expectation-Maximization. IEEE Trans. Pattern Anal. Mach. Intell. 2017, 40, 1397–1410. [Google Scholar] [CrossRef] [PubMed] [Green Version]
- Myronenko, A.; Song, X.; Carreira-Perpinán, M.A. Non-rigid point set registration: Coherent point drift. In Advances in Neural Information Processing Systems; NIPS: Vancouver, BC, Canada, 2007; pp. 1009–1016. [Google Scholar]
- Wang, P.; Wang, P.; Qu, Z.; Gao, Y.; Shen, Z. A refined coherent point drift (CPD) algorithm for point set registration. Sci. China Inf. Sci. 2011, 54, 2639–2646. [Google Scholar] [CrossRef] [Green Version]
- Lu, M.; Zhao, J.; Guo, Y.; Ou, J.; Li, J. A 3D point cloud registration algorithm based on fast coherent point drift. In Proceedings of the 2014 IEEE Applied Imagery Pattern Recognition Workshop (AIPR), Washington, DC, USA, 1–6 October 2004. [Google Scholar]
- Besl, P.; McKay, N.D. A method for registration of 3-D shapes. IEEE Trans. Pattern Anal. Mach. Intell. 1992, 14, 239–256. [Google Scholar] [CrossRef]
- Chen, Y.; Medioni, G. Object modeling by registration of multiple range images. In Proceedings of the 1991 IEEE International Conference on Robotics and Automation, Sacramento, CA, USA, 9–11 April 1991; pp. 2724–2729. [Google Scholar]
- Dong, J.; Peng, Y.; Ying, S.; Hu, Z. LieTrICP: An improvement of trimmed iterative closest point algorithm. Neurocomputing 2014, 140, 67–76. [Google Scholar] [CrossRef]
- Xie, Z.; Xu, S.; Li, X. A high-accuracy method for fine registration of overlapping point clouds. Image Vis. Comput. 2010, 28, 563–570. [Google Scholar] [CrossRef]
- Takeuchi, E.; Tsubouchi, T. A 3-D Scan Matching using Improved 3-D Normal Distributions Transform for Mobile Robotic Mapping. In Proceedings of the 2006 IEEE/RSJ International Conference on Intelligent Robots and Systems, Beijing, China, 9–15 October 2006; pp. 3068–3073. [Google Scholar]
- Stoyanov, T.; Magnusson, M.; Andreasson, H.; Lilienthal, A.J. Fast and accurate scan registration through minimization of the distance between compact 3D NDT representations. Int. J. Robot. Res. 2012, 31, 1377–1393. [Google Scholar] [CrossRef]
- Das, A.; Waslander, S.L. Scan registration using segmented region growing NDT. Int. J. Robot. Res. 2014, 33, 1645–1663. [Google Scholar] [CrossRef]
- Zang, Y.; Lindenbergh, R.; Yang, B.; Guan, H. Density-Adaptive and Geometry-Aware Registration of TLS Point Clouds Based on Coherent Point Drift. IEEE Geosci. Remote Sens. Lett. 2019, 17, 1628–1632. [Google Scholar] [CrossRef]
- Zang, Y.; Yang, B.; Li, J.; Guan, H. An Accurate TLS and UAV Image Point Clouds Registration Method for Deformation Detection of Chaotic Hillside Areas. Remote Sens. 2019, 11, 647. [Google Scholar] [CrossRef] [Green Version]
Figure 1.
Processing pipeline of digital documentation (orange box shows the research content of this article).
Figure 1.
Processing pipeline of digital documentation (orange box shows the research content of this article).

Figure 2.
Scanning order of the niche area.
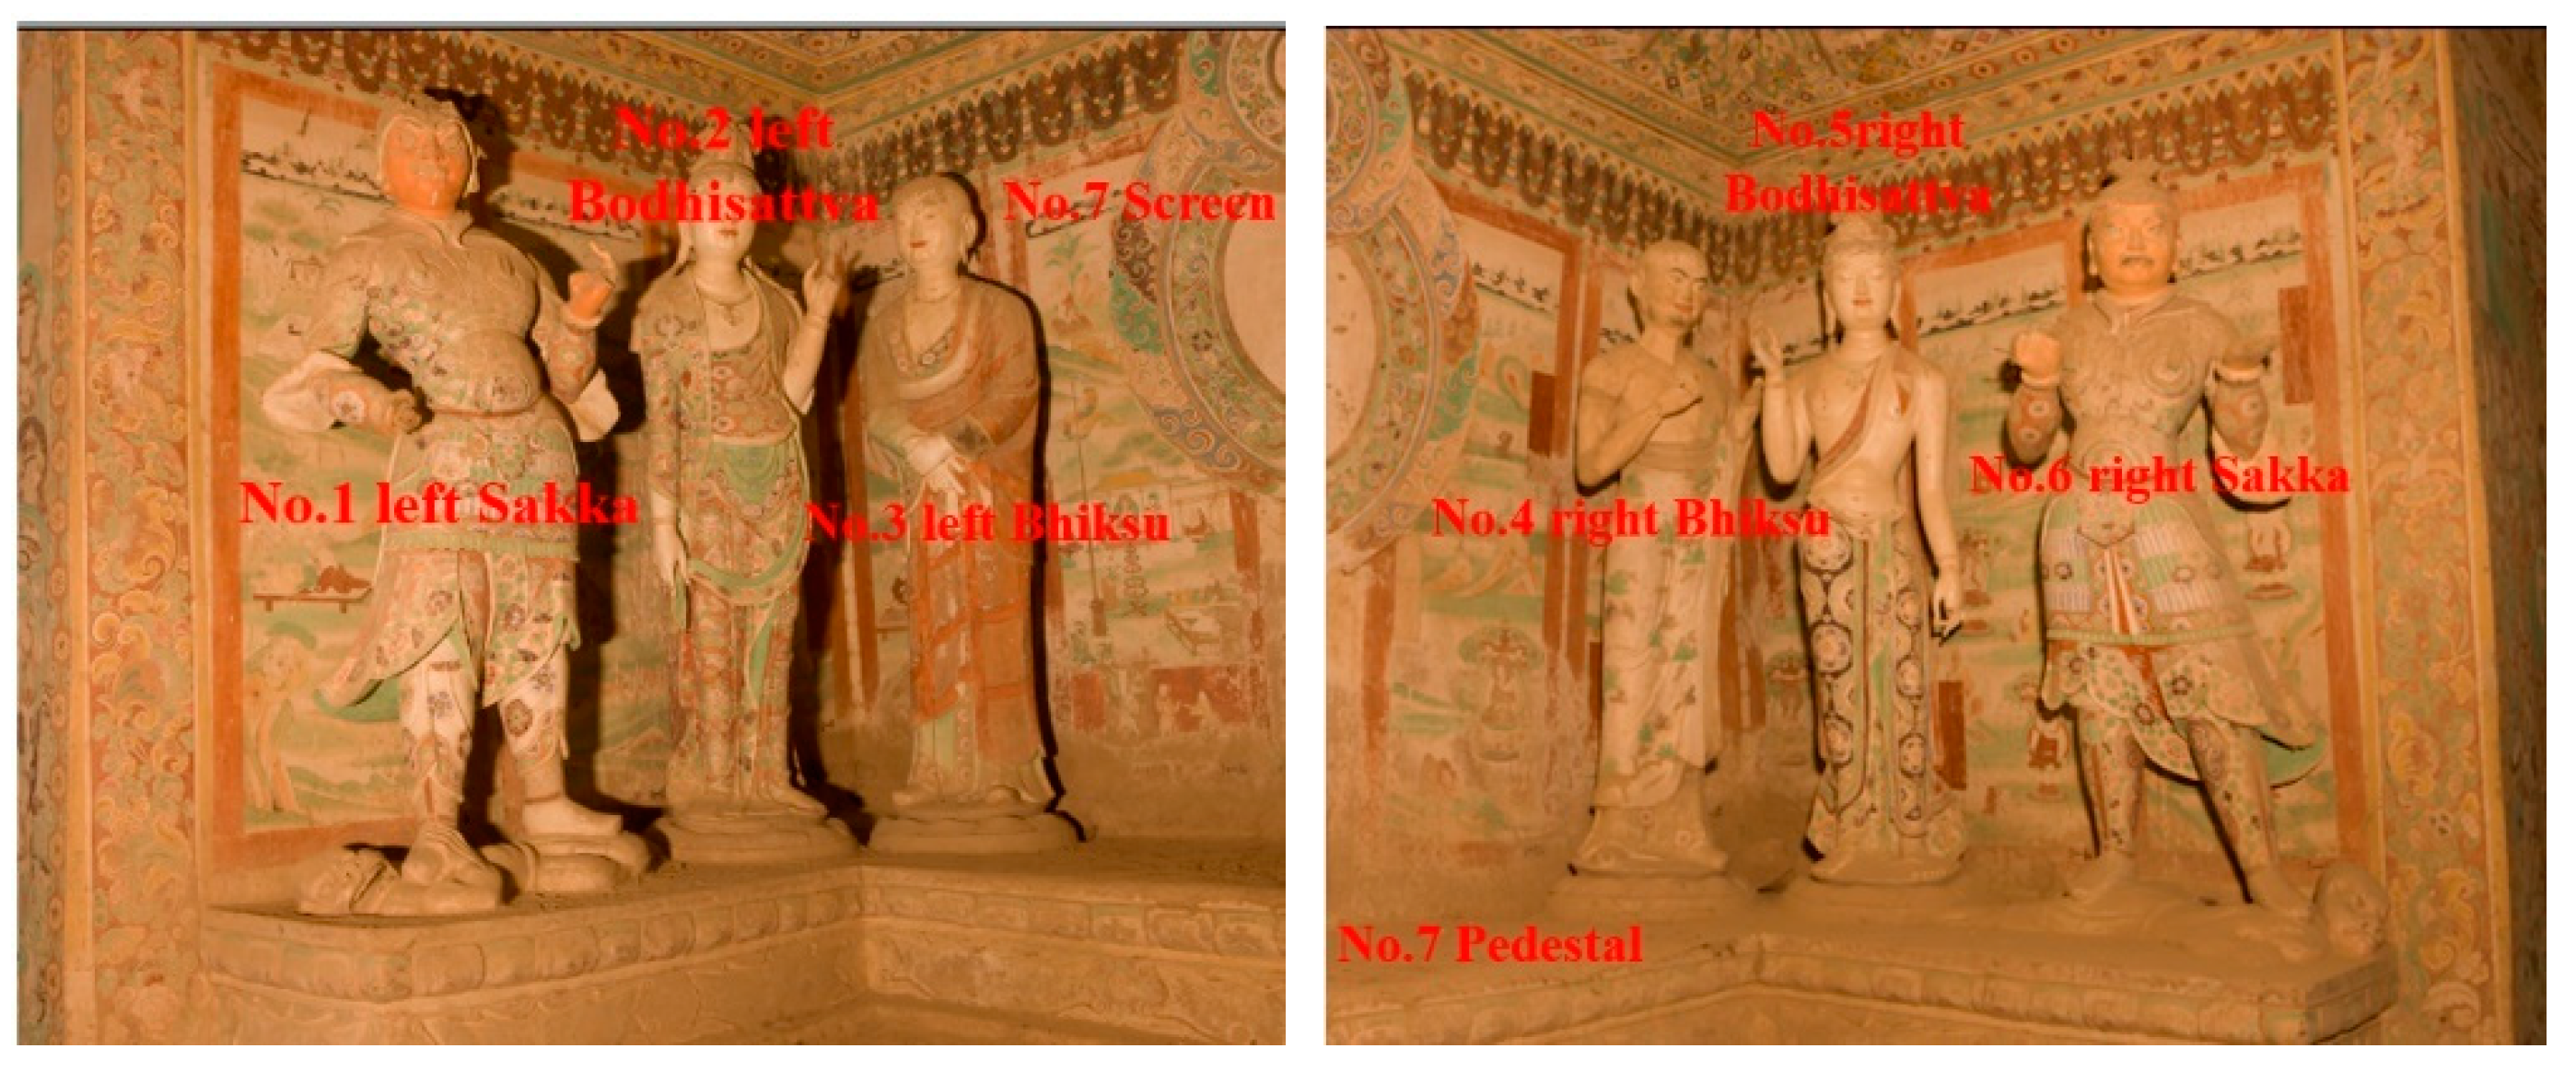
Figure 3.
Stations planned for right Bodhisattva.

Figure 4.
Design of the target net and fixed support.
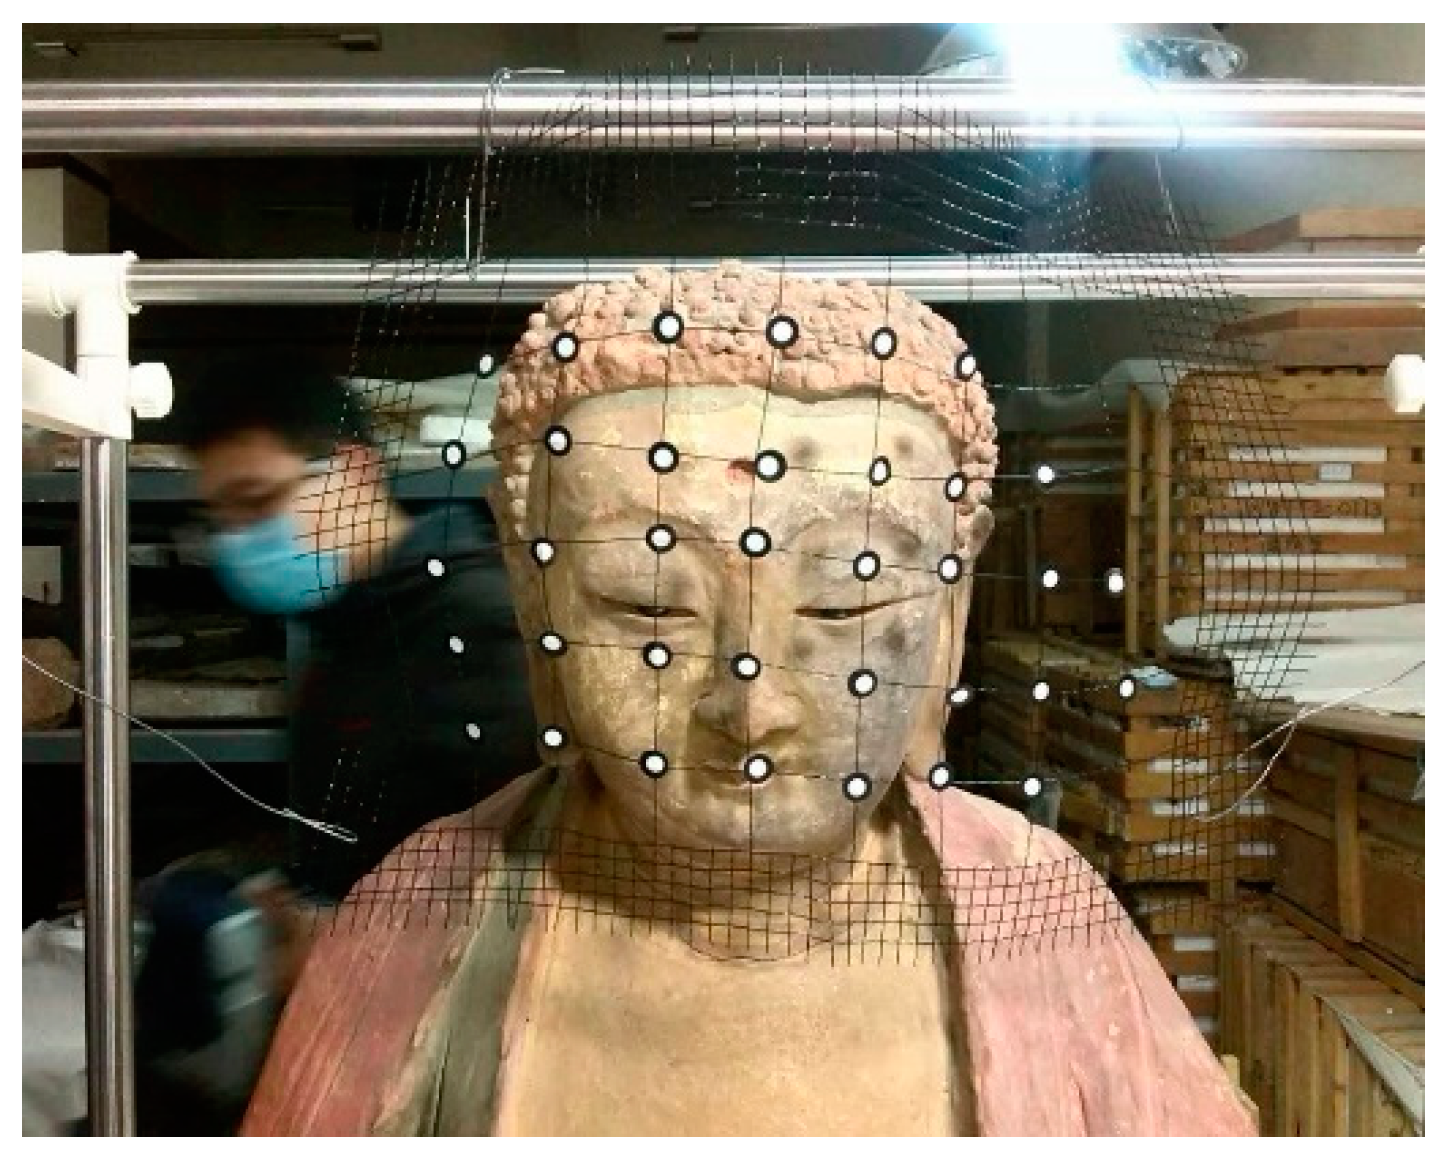
Figure 5.
Illustration of General and Buddha data. (a) General data in Mo Kao Grotto (b) Buddha data from the Wuwei museum.
Figure 5.
Illustration of General and Buddha data. (a) General data in Mo Kao Grotto (b) Buddha data from the Wuwei museum.

Figure 6.
The workflow of the proposed method.
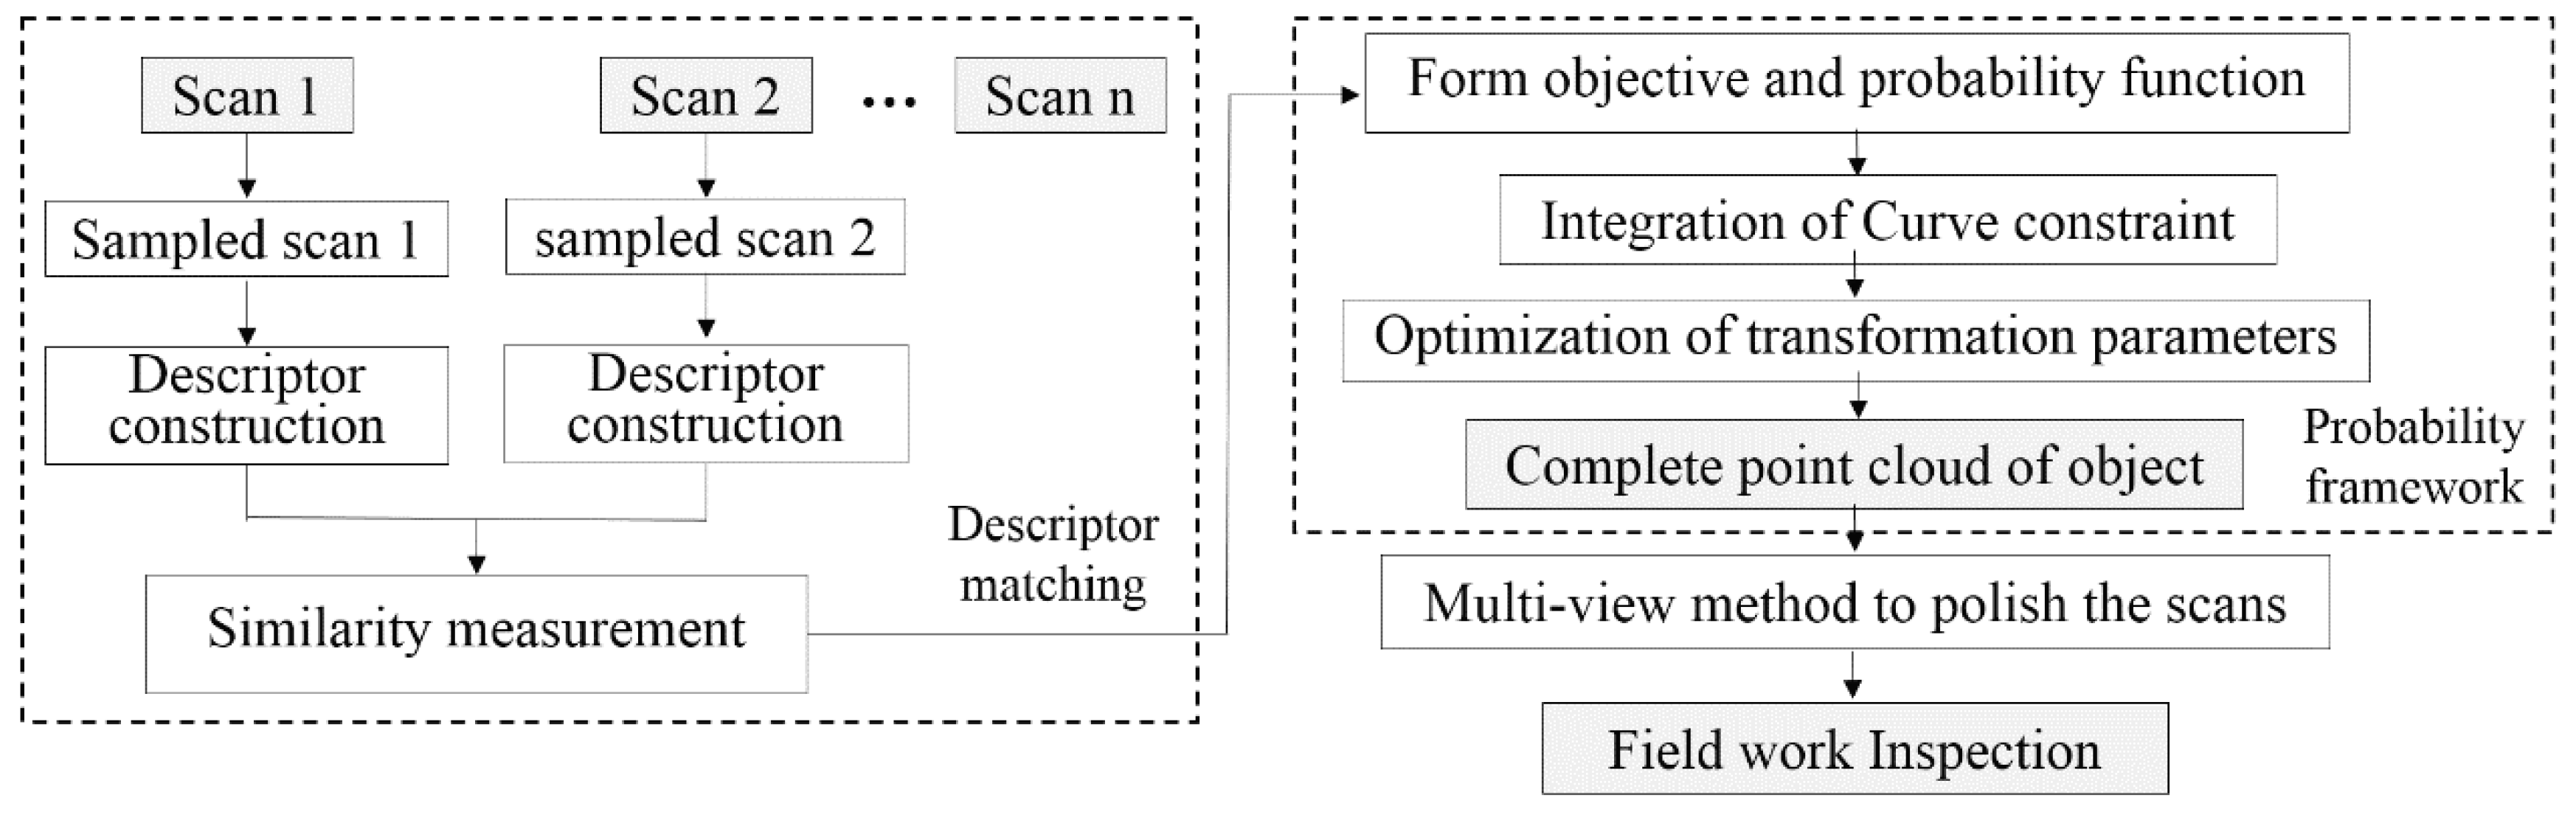
Figure 7.
Illustration of Principal direction descriptor, (a,d) show the correspondences from two adjacent point clouds, (b,e) are the constructed local frames, (c,f) are the density image and distance feature image.
Figure 7.
Illustration of Principal direction descriptor, (a,d) show the correspondences from two adjacent point clouds, (b,e) are the constructed local frames, (c,f) are the density image and distance feature image.

Figure 8.
Schematic diagram of curve extraction. (a) cluster classification; (b) curves extraction from clusters; (c) source point cloud; (d) classified clusters; (e) curves extracted.
Figure 8.
Schematic diagram of curve extraction. (a) cluster classification; (b) curves extraction from clusters; (c) source point cloud; (d) classified clusters; (e) curves extracted.

Figure 9.
Schematic diagram of curve constraints: red circles indicate neighborhood areas of three scales from two point clouds.
Figure 9.
Schematic diagram of curve constraints: red circles indicate neighborhood areas of three scales from two point clouds.

Figure 10.
Illustration of fieldwork and software interface of inspection, (a) on-site scanning, (b) field inspection (red box denotes the detected area with issues).
Figure 10.
Illustration of fieldwork and software interface of inspection, (a) on-site scanning, (b) field inspection (red box denotes the detected area with issues).
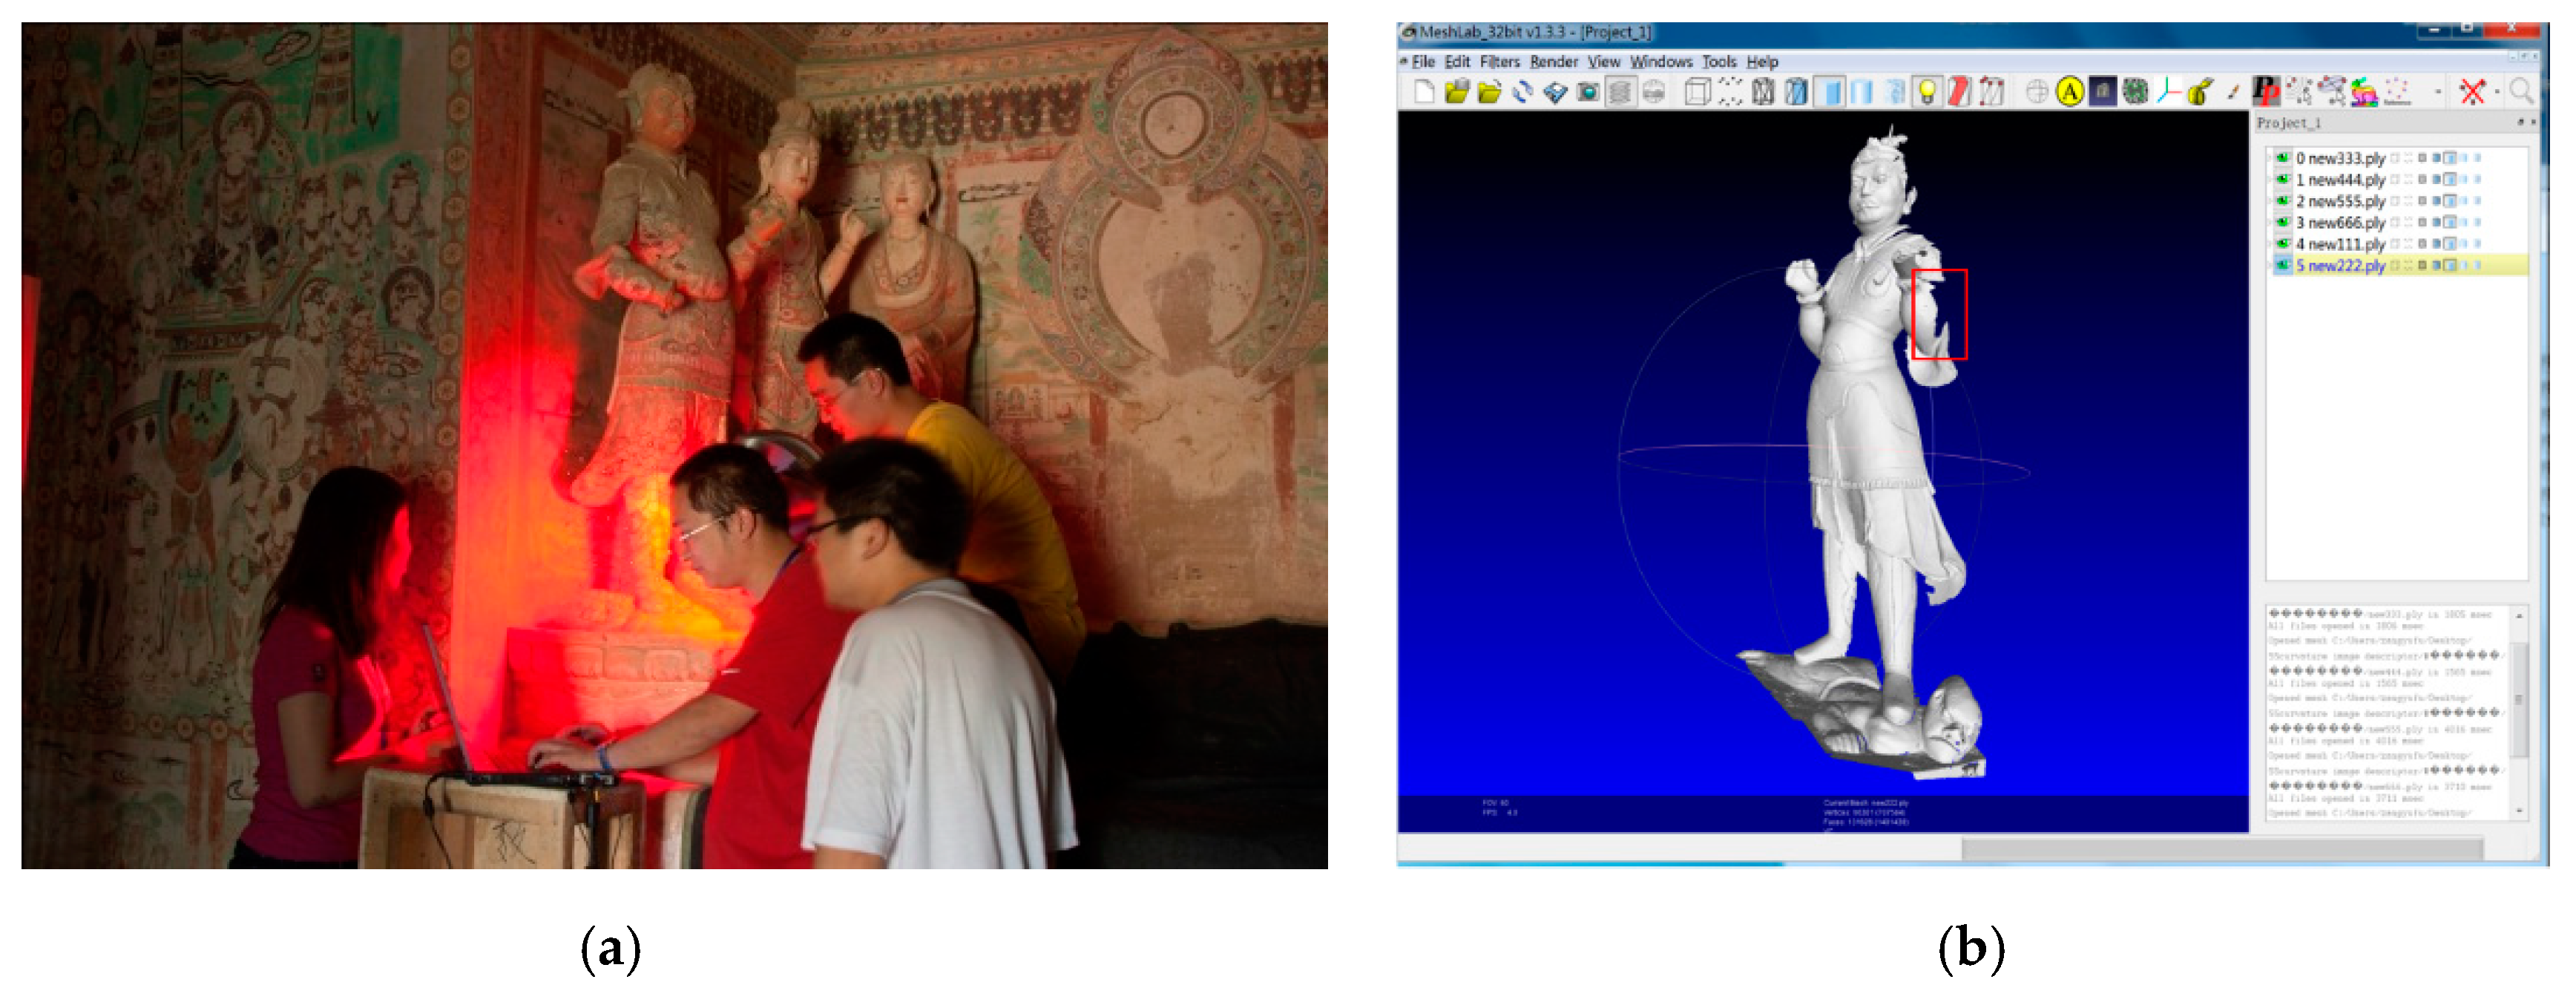
Figure 11.
Correspondence establishment of the first iteration: (a) 18.5% incorrect ratio, (b) 20% incorrect ratio, (c) 21.4% incorrect ratio, (d) 15.8% incorrect ratio, green lines indicate the correct matches, while red lines indicate the incorrect matches.
Figure 11.
Correspondence establishment of the first iteration: (a) 18.5% incorrect ratio, (b) 20% incorrect ratio, (c) 21.4% incorrect ratio, (d) 15.8% incorrect ratio, green lines indicate the correct matches, while red lines indicate the incorrect matches.
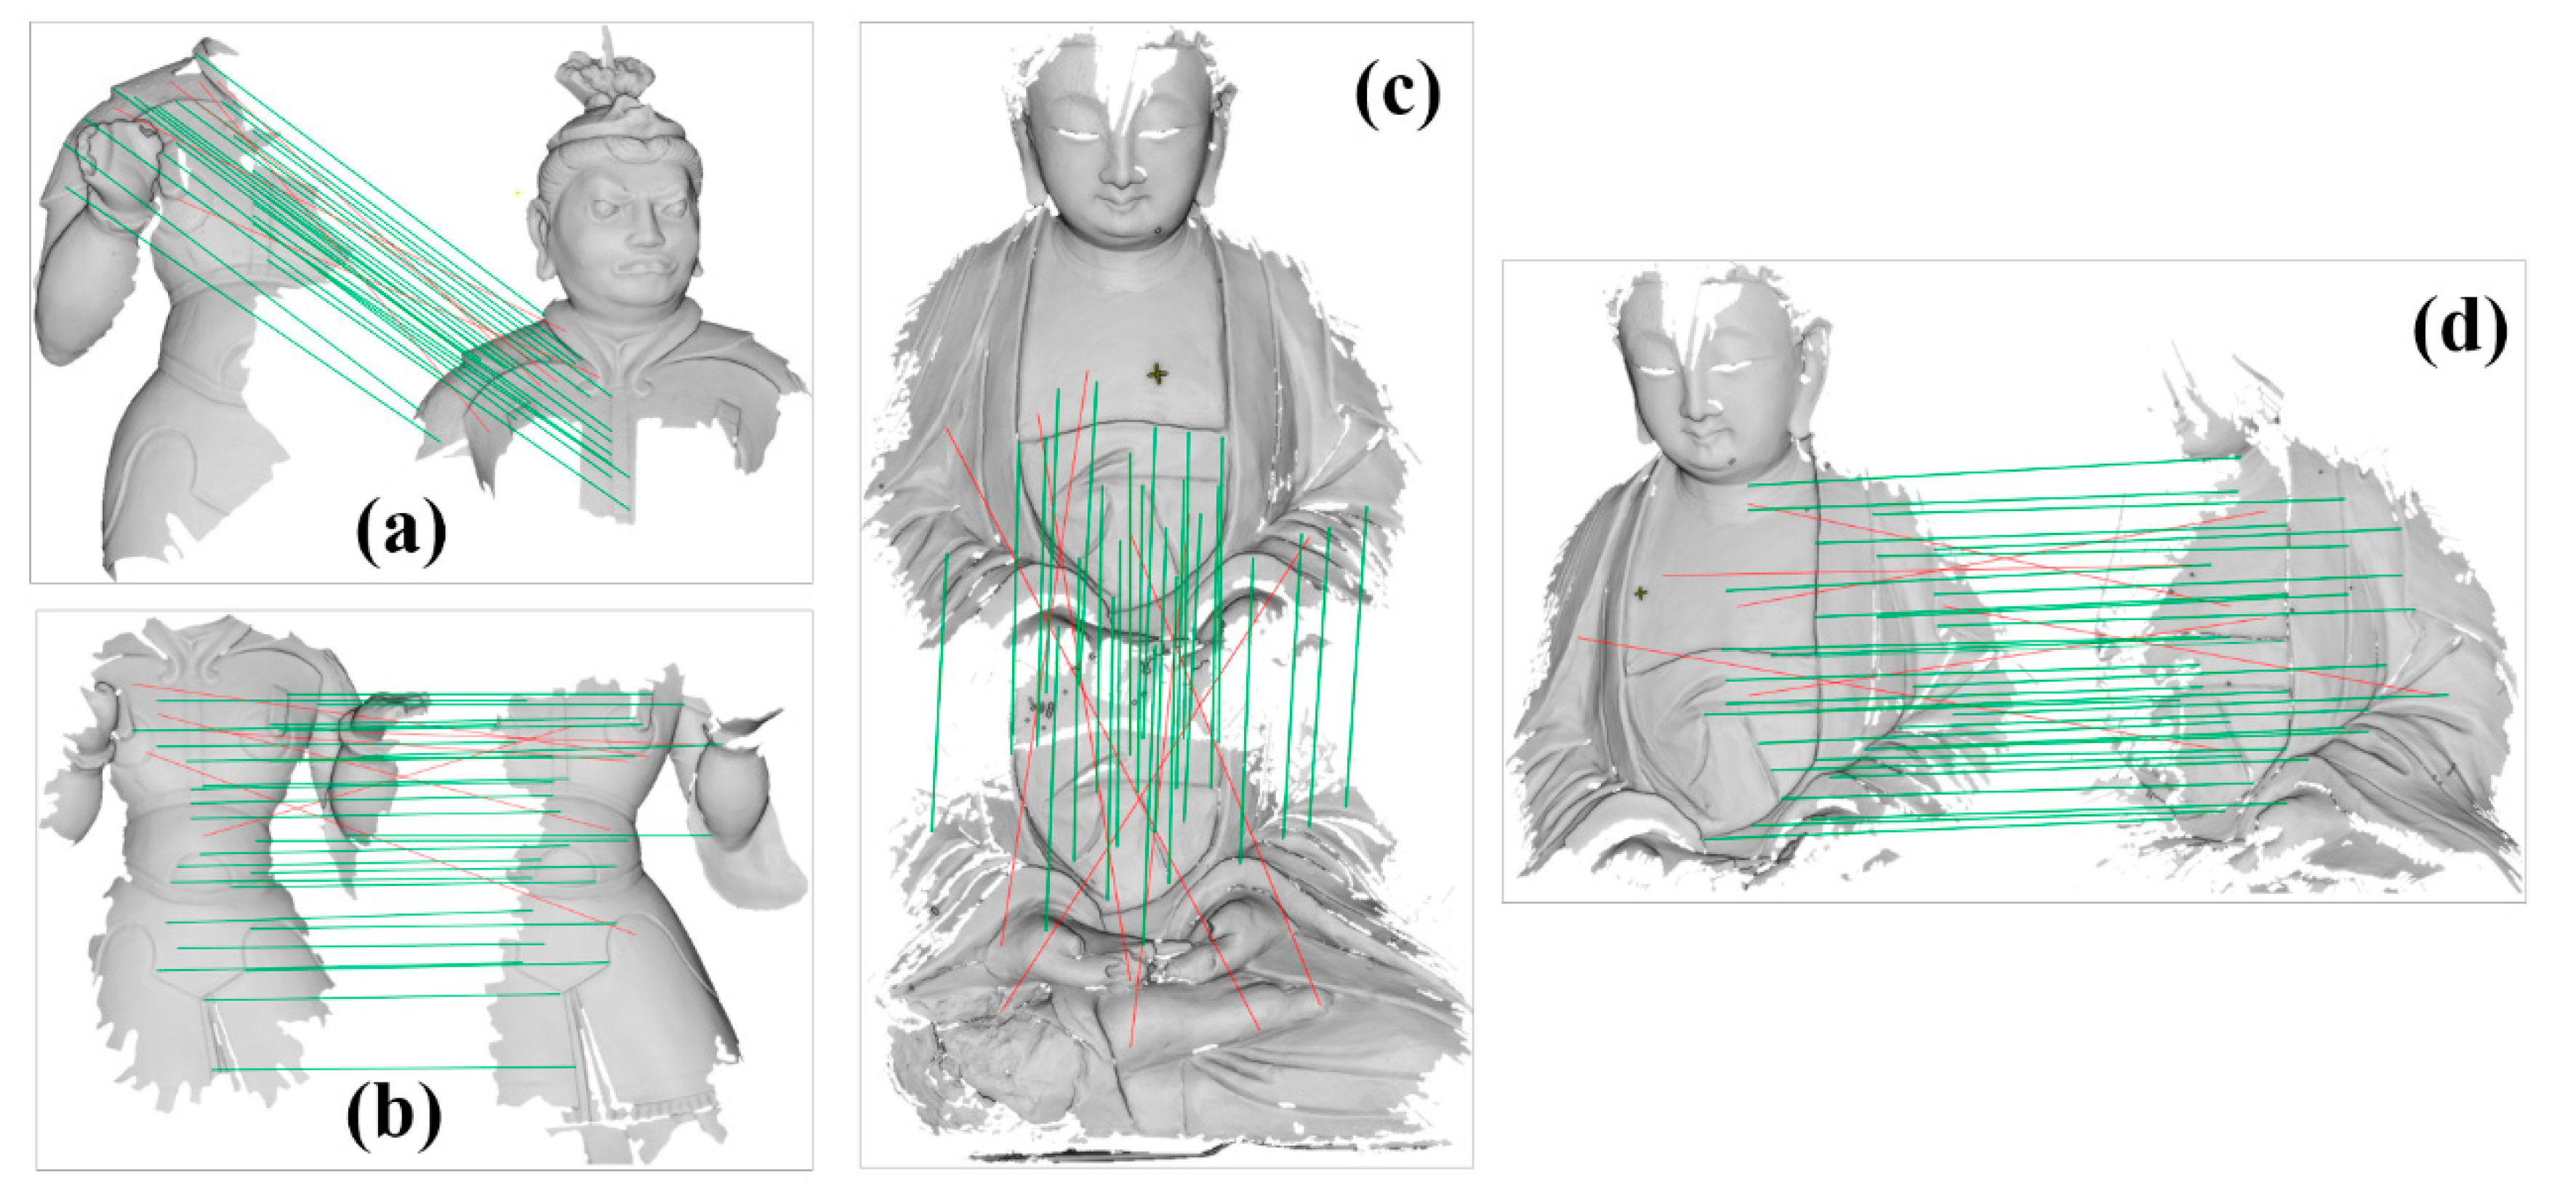
Figure 12.
Pairwise registration results of General and Buddha data: (a) General data: scan 1&2, scan 2&3, scan 3&4, scan 4&5, scan 5&6, (b) Buddha data: scan 2&1, scan 2&4, scan 2&5, scan 2&7, scan 2&8, respectively.
Figure 12.
Pairwise registration results of General and Buddha data: (a) General data: scan 1&2, scan 2&3, scan 3&4, scan 4&5, scan 5&6, (b) Buddha data: scan 2&1, scan 2&4, scan 2&5, scan 2&7, scan 2&8, respectively.
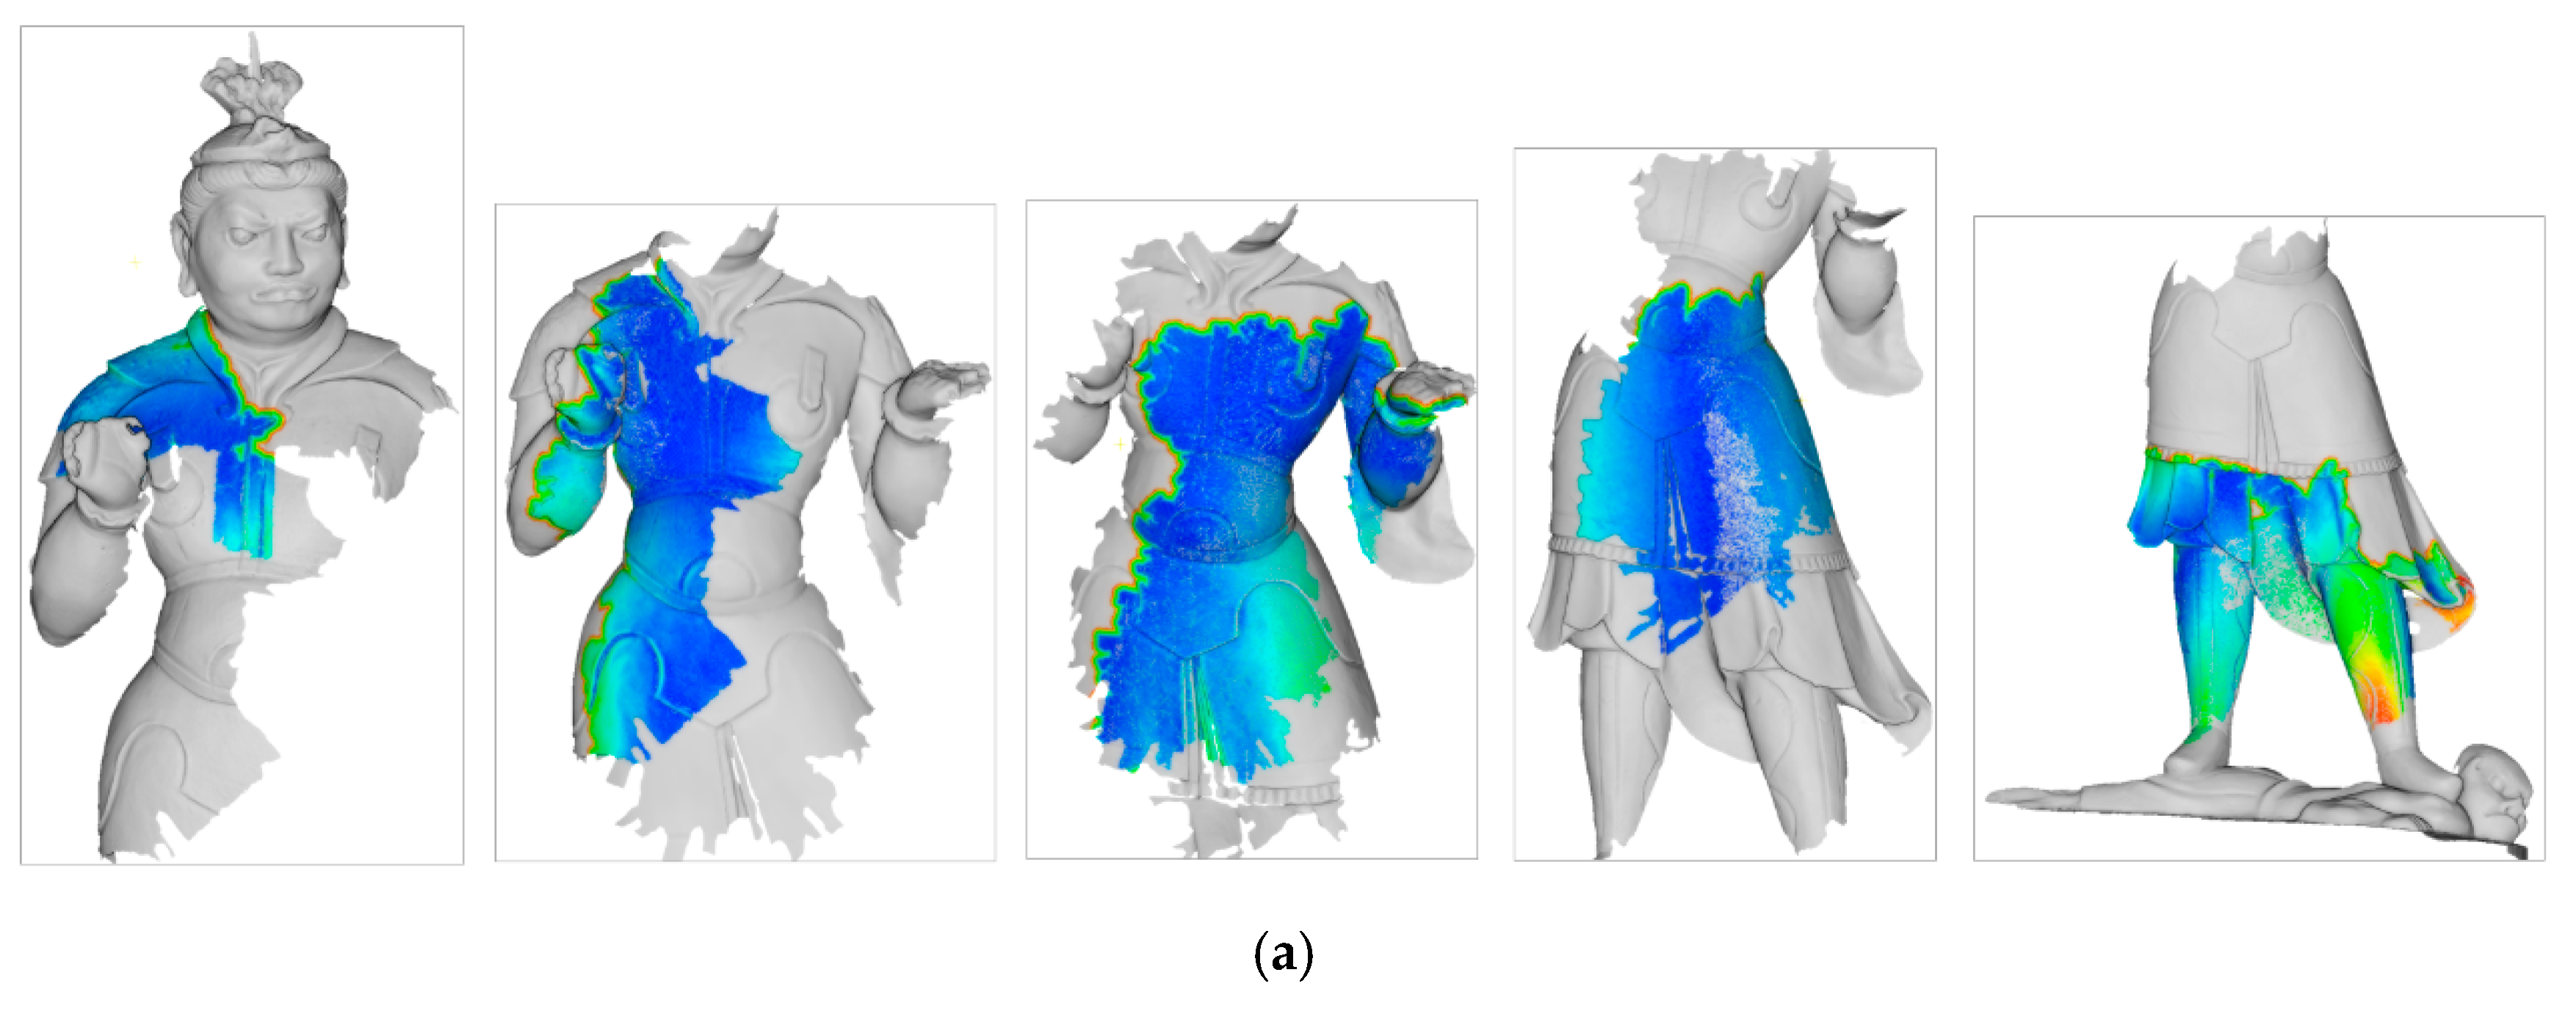

Figure 13.
Inspection of General and Buddha data (A–E) denote the detected areas with quality issues).
Figure 13.
Inspection of General and Buddha data (A–E) denote the detected areas with quality issues).
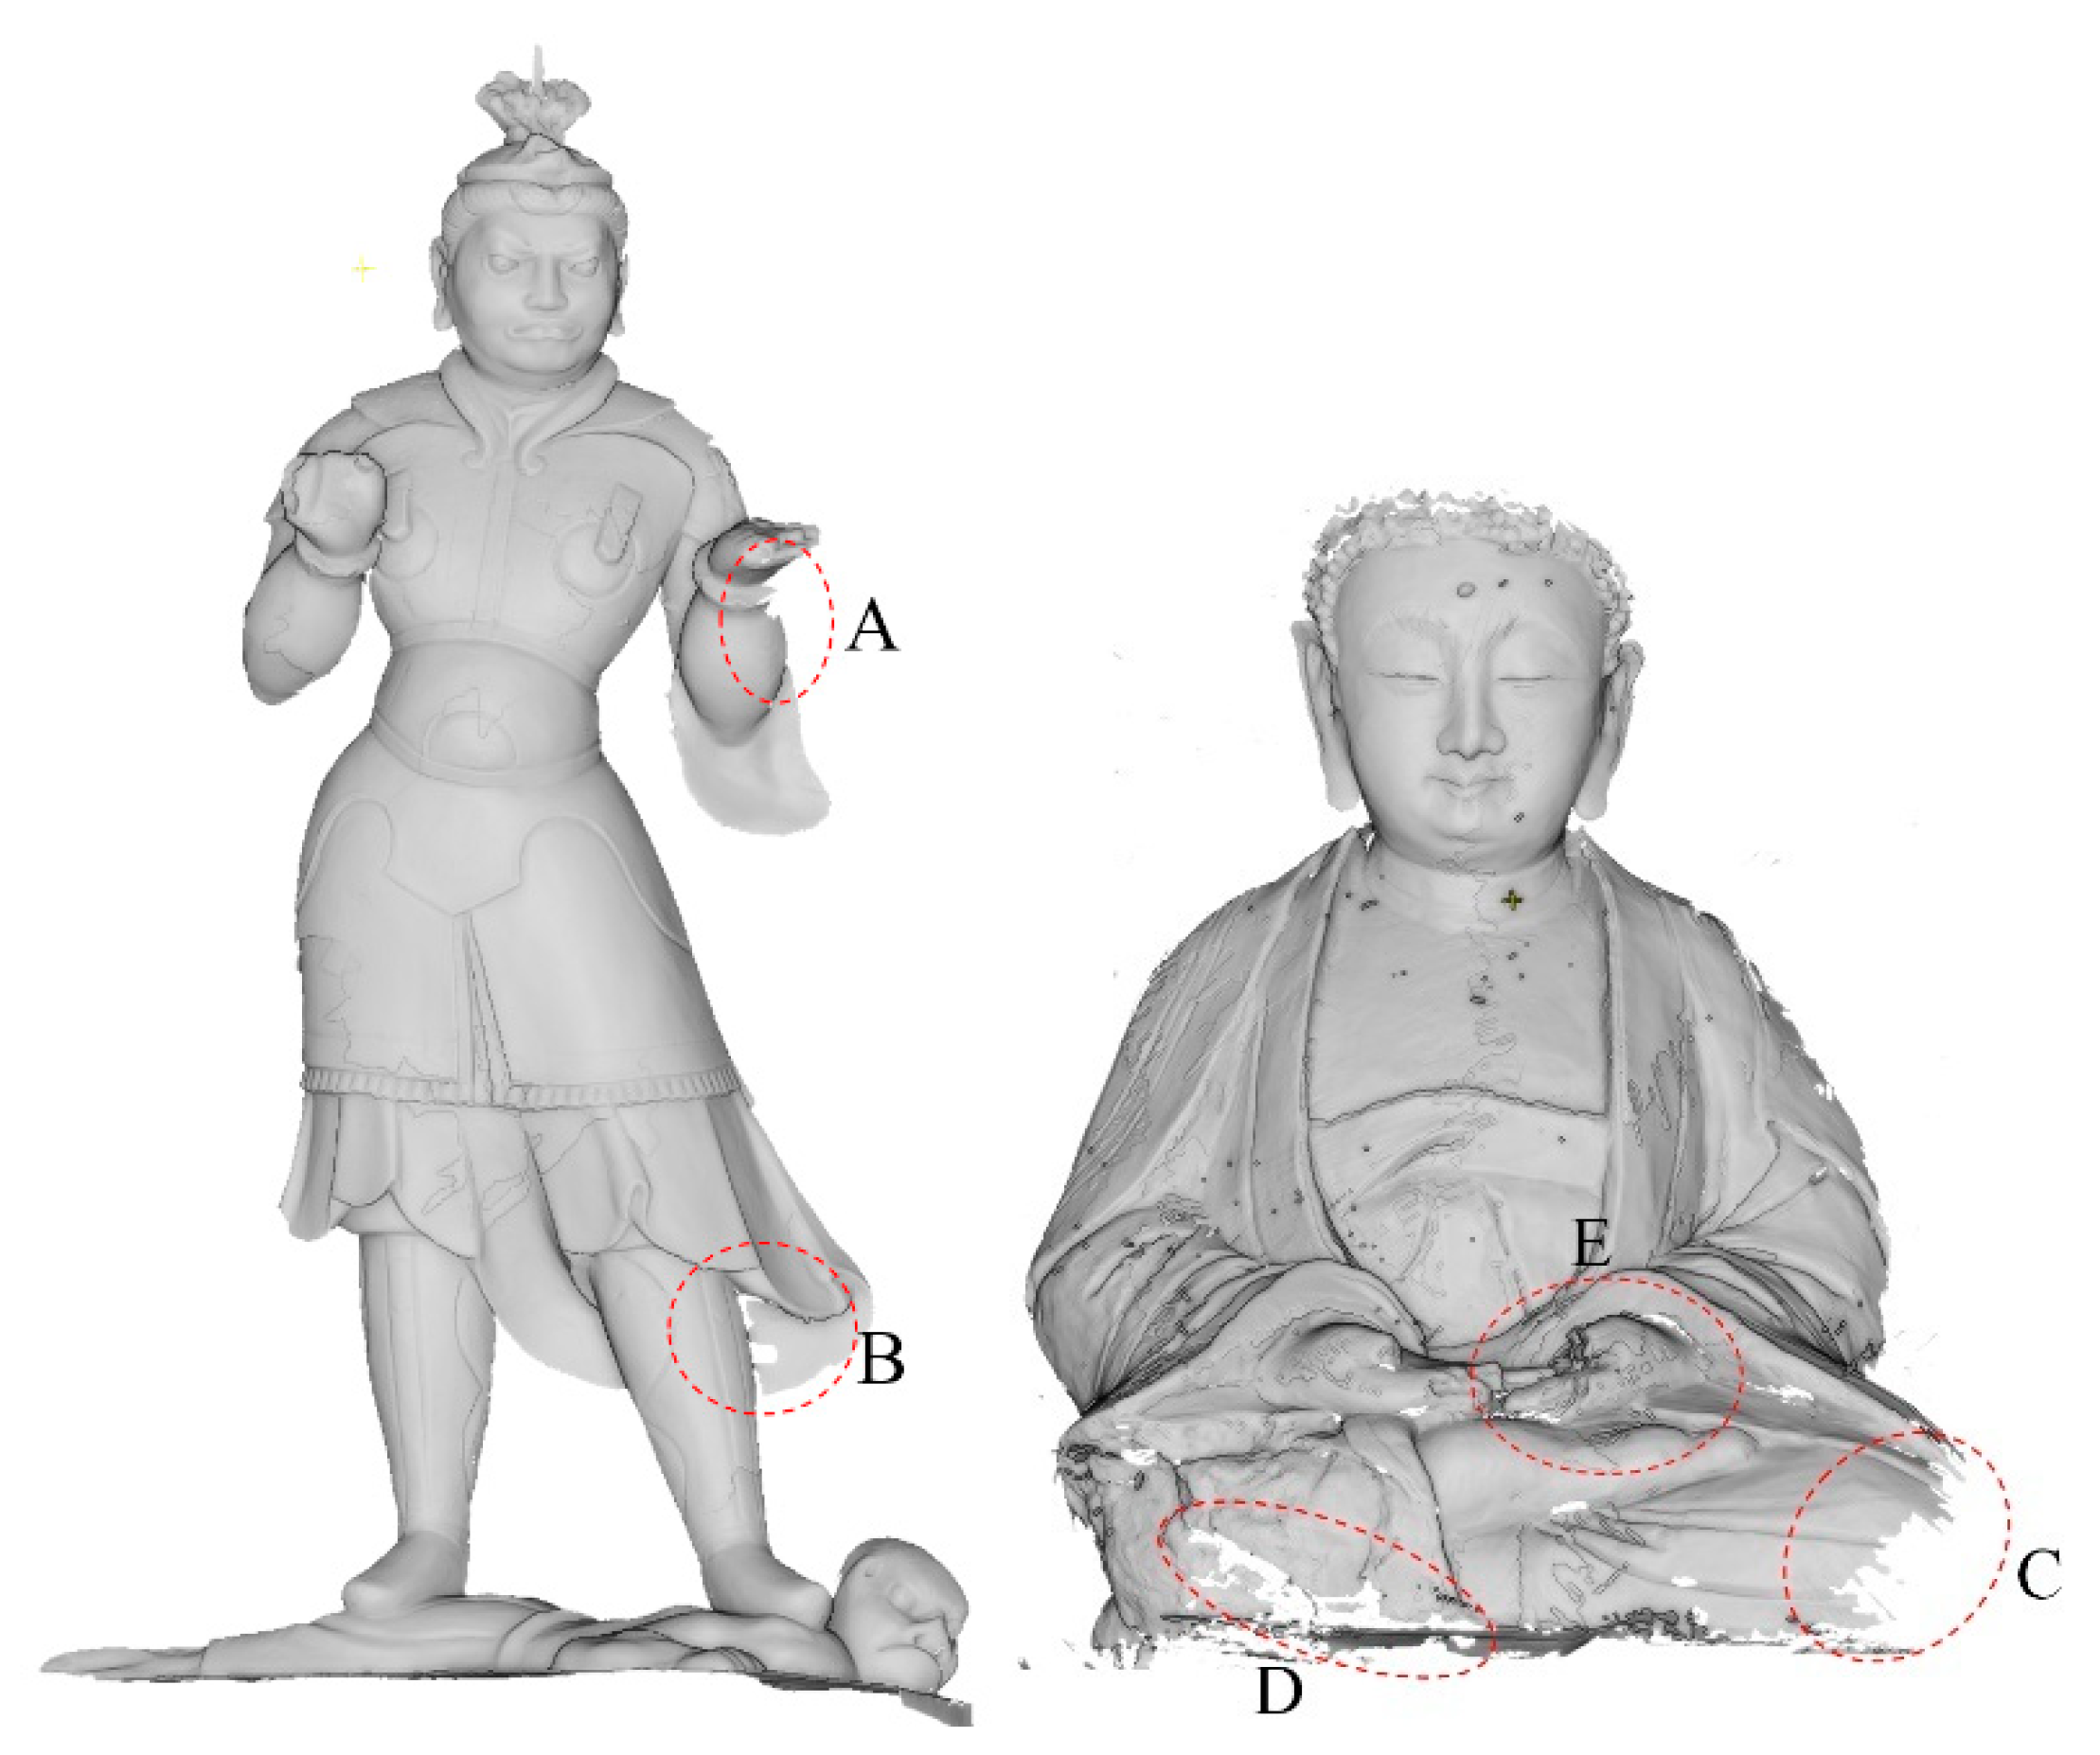
Figure 14.
Comparison of the pairwise registration methods of General and Buddha: (a) rotation errors, (b) translation errors, (c) runtime.
Figure 14.
Comparison of the pairwise registration methods of General and Buddha: (a) rotation errors, (b) translation errors, (c) runtime.

Figure 15.
Evaluation of the robustness performance. (a) different noise; (b) different overlaps; (c) objects with few curves.
Figure 15.
Evaluation of the robustness performance. (a) different noise; (b) different overlaps; (c) objects with few curves.


Figure 16.
Results of ablation study: (a) rotation error evaluation, (b) translation error evaluation, and (c) runtime evaluation.
Figure 16.
Results of ablation study: (a) rotation error evaluation, (b) translation error evaluation, and (c) runtime evaluation.


Table 1.
Evaluation of registration results.
| Datasets | Methods | Scans | Overlap (%) | Sampled Points of Scans | Mean (mm) | Std. (mm) | Iterations | Runtime (s) |
|---|---|---|---|---|---|---|---|---|
| General data | Pairwise method | 1&2 | 21 | 3532/6946 | 0.52 | 0.23 | 6 | 43.5 |
| 2&3 | 42 | 6946/5942 | 0.56 | 0.34 | 7 | 59.3 | ||
| 3&4 | 65 | 5942/6234 | 0.51 | 0.31 | 8 | 57.4 | ||
| 4&5 | 41 | 6234/7213 | 0.48 | 0.12 | 6 | 61.9 | ||
| 5&6 | 46 | 7213/5268 | 1.21 | 0.78 | 7 | 55.5 | ||
| Multi-view method | / | / | / | 0.38 | 0.27 | / | 27.5 | |
| Buddha data | Pairwise method | 2&1 | 42 | 6138/4282 | 0.23 | 0.11 | 6 | 43.2 |
| 2&4 | 37 | 6138/6021 | 1.83 | 1.20 | 8 | 47.4 | ||
| 2&5 | 23 | 6138/4827 | 1.56 | 1.03 | 7 | 44.2 | ||
| 2&7 | 51 | 6138/4903 | 2.43 | 1.67 | 5 | 29.6 | ||
| 2&8 | 52 | 6138/4109 | 0.51 | 0.32 | 5 | 31.7 | ||
| Multi-view method | / | / | / | 0.69 | 0.53 | / | 23.5 |
Publisher’s Note: MDPI stays neutral with regard to jurisdictional claims in published maps and institutional affiliations. |
© 2020 by the authors. Licensee MDPI, Basel, Switzerland. This article is an open access article distributed under the terms and conditions of the Creative Commons Attribution (CC BY) license (http://creativecommons.org/licenses/by/4.0/).
Share and Cite
MDPI and ACS Style
Zang, Y.; Li, B.; Xiao, X.; Zhu, J.; Meng, F. An Efficient Probabilistic Registration Based on Shape Descriptor for Heritage Field Inspection. ISPRS Int. J. Geo-Inf. 2020, 9, 759. https://doi.org/10.3390/ijgi9120759
AMA Style
Zang Y, Li B, Xiao X, Zhu J, Meng F. An Efficient Probabilistic Registration Based on Shape Descriptor for Heritage Field Inspection. ISPRS International Journal of Geo-Information. 2020; 9(12):759. https://doi.org/10.3390/ijgi9120759
Chicago/Turabian StyleZang, Yufu, Bijun Li, Xiongwu Xiao, Jianfeng Zhu, and Fancong Meng. 2020. "An Efficient Probabilistic Registration Based on Shape Descriptor for Heritage Field Inspection" ISPRS International Journal of Geo-Information 9, no. 12: 759. https://doi.org/10.3390/ijgi9120759
Note that from the first issue of 2016, this journal uses article numbers instead of page numbers. See further details here.