Identifying Port Calls of Ships by Uncertain Reasoning with Trajectory Data


Institute of Computing Technology, Chinese Academy of Sciences, Beijing 100190, China
*
Author to whom correspondence should be addressed.
ISPRS Int. J. Geo-Inf. 2020, 9(12), 756; https://doi.org/10.3390/ijgi9120756
Submission received: 12 November 2020
/
Revised: 10 December 2020
/
Accepted: 18 December 2020
/
Published: 18 December 2020
(This article belongs to the Special Issue Spatio-Temporal Models and Geo-Technologies)
Abstract
:Considering that ports are key nodes of the maritime transport network, it is of great importance to identify ships’ arrivals and departures. Compared with partial proprietary data from a port authority or shipping company, approaches based on compulsory Automatic Identification System (AIS) data reported by ships can produce transparent datasets covering wider areas, which is necessary for researchers and policy makers. Detecting port calls based on trajectory data is a difficult problem due to the huge uncertainty inherent in information such as ships’ ambiguous statuses and ports’ irregular boundaries. However, we noticed that little attention has been paid to this fundamental problem of shipping network analysis, and considerable noise may have been introduced in previous work on maritime network assessment based on AIS data, which usually modeled each port as a circle with a fixed radius such as 1 or 2 km. In this paper, we propose a method for identifying port calls by uncertain reasoning with trajectory data, which represents each port with an arbitrary shape as a set of geographical grid cells belonging to berths inside this port. Based on this high-spatial-resolution representation, port calls were identified when a ship was in any of these cells. Our method was implemented with around 14 billion AIS messages worldwide over 8 months, and examples of the results are provided.
1. Introduction
According to the report of the United Nations Conference on Trade and Development [1], transportation between seaports represents over 80% of global trade by volume. Therefore, maritime network analysis has attracted extensive interest, driven by purposes ranging from transportation network dynamic evaluation [2,3,4,5,6] and outlier behavior detection [7] to epidemic risk assessment [8].
Ports are the most important ROIs (Regions of Interest) on oceans where commodities and passengers are exchanged between water and land, and they are nodes of the maritime transportation network. Therefore, the foundation of shipping network analysis is identifying the port calls of ships. To obtain OD (Origin-Destination) records, some previous work on maritime network analysis purchased them from shipping companies such as IHS Markit [9], Clipper Data Ltd [5] and LBH group [10]. These purchased records generated by black boxes have unknown accuracy and only cover some large ships and some global ports. For example, the dataset collected by Haiying et al. [10] covers the loading and discharging events across Australia, Brazil, China, India and South Africa of only 1486 dry-bulk vessels with capacities of 100,000 deadweight tonnes or more.
The requirement for transparency and wider coverage by researchers and policy makers has resulted in more and more work on maritime network analysis based on AIS (Automatic Identification System) data, which capture ships’ arrivals and departures automatically when their positions overlap with a port’s [4,11,12]. In contrast to partial proprietary data from a port authority or shipping company, OD datasets generated based on AIS data broadcast by ships can cover wider areas and ships because AIS is a compulsory system. Besides, the quality of these OD records based on standard AIS data can be estimated and compared if researchers describe their port call detection methods in published work. The AIS [13] is a self-reporting system installed on ships used to broadcast kinematic (dynamic), identity (static) and voyage-related information to nearby ships, base stations and satellites periodically, with 27 types of message in total. Ships of 300 gross tons and upwards on international voyages or 500 tons and upwards for cargos not in international waters and passenger vessels are required to fit AIS transceivers [14]. The identity and voyage information in message types 5 and 24 is input manually and prone to error. For example, Abdallah et al. [12] found that only 38% of the destination fields in AIS data match the ground truth, Abbas et al. [15] discovered that some optional information fields of the AIS data such as destination are not updated in most cases, and 30% of ships were detected as displaying incorrect status information in a VTS (vessel traffic service)-based AIS study. On the other hand, compulsory information fields including SOG (Speed Over Ground), COG (Course Over Ground), Longitude and Latitude in kinematic messages (types 1, 2, 3, 9, 18, 19 and 27) of AIS data are generated by sensors such as GPS (Global Position System) automatically and are highly reliable; see Table 1.
Although databases such as the World Port Index [16] contain the locations of major ports and terminals worldwide, their boundaries are unknown; see Table 2. To decide whether a ship is in port or not automatically, shipping companies such as Elane Inc. [17] draw a rectangle for each port manually to represent its boundar, y as depicted in Figure 1, which is too coarse and prone to error. Haiying Jia et al. [4] decided whether a vessel was in port based on AIS data by setting the SOG threshold as 1 knot and distance threshold as 1 km, which is equivalent to representing each port as a circle with a radius of 1 km. For large ports such as Shanghai, which has coastlines on the order of about 100 km, this method will miss a large proportion of OD events. In the work of Hadzagic et al. [18], each port was associated with a cell (0.25 degrees longitude by 0.25 degrees latitude), and a ship was considered as visiting a port if it was in the cell. As the extent of a cell was as large as about 20 km, ships passing by small ports would be taken as visiting the port mistakenly. In some other work [2,12,19] on calculating port arrival events based on the intersection of port and vessel positions, details such as the values of the port radius or port boundary are not provided.
To improve the accuracy of port call identification based on trajectory data, we need to obtain a precise boundary for every port first. When studying a restricted area, consulting experts and authorities is a simple and effective method of obtaining detailed information about port areas. Vries et al. [20] integrated geographical domain knowledge along the Dutch west coast provided by Rijkswaterstaat (part of the Dutch Ministry of Infrastructure and the Environment) to enhance stop region clustering and classification task performance. If global activities are under investigation, it is more efficient to extract port boundaries based on data mining—the number of berths in China alone is as large as 31,705 [21]. In some previous work [22,23,24,25,26], port extraction was achieved by clustering stationary points detected by speed gating. There are two problems in these spatial-clustering-based methods. The first one is the high false-positive rate. When a ship approaches a berth, at anchorage or fishing, its speed can be very low. A speed-gating-based method will have a high false-positive detection rate. The second problem is that the spatial resolution of clustered areas is too coarse for distinguishing waters, berths, anchorages, etc. The extent of a cluster is usually on the order of kilometers, containing berths, anchorages and wide waters at the same time. When a ship is inside a stop cluster area, it is unclear whether it is loading in the port or just passing by. To pick out berth-only stops, Zhihuan et al. [8] excluded stops if their distances to the coastline were larger than 2 km. This method relies on data for global coastlines and may fail to exclude a large portion of anchorages due to the fixed value of the distance threshold.
2. Materials and Methods
2.1. Overall Framework
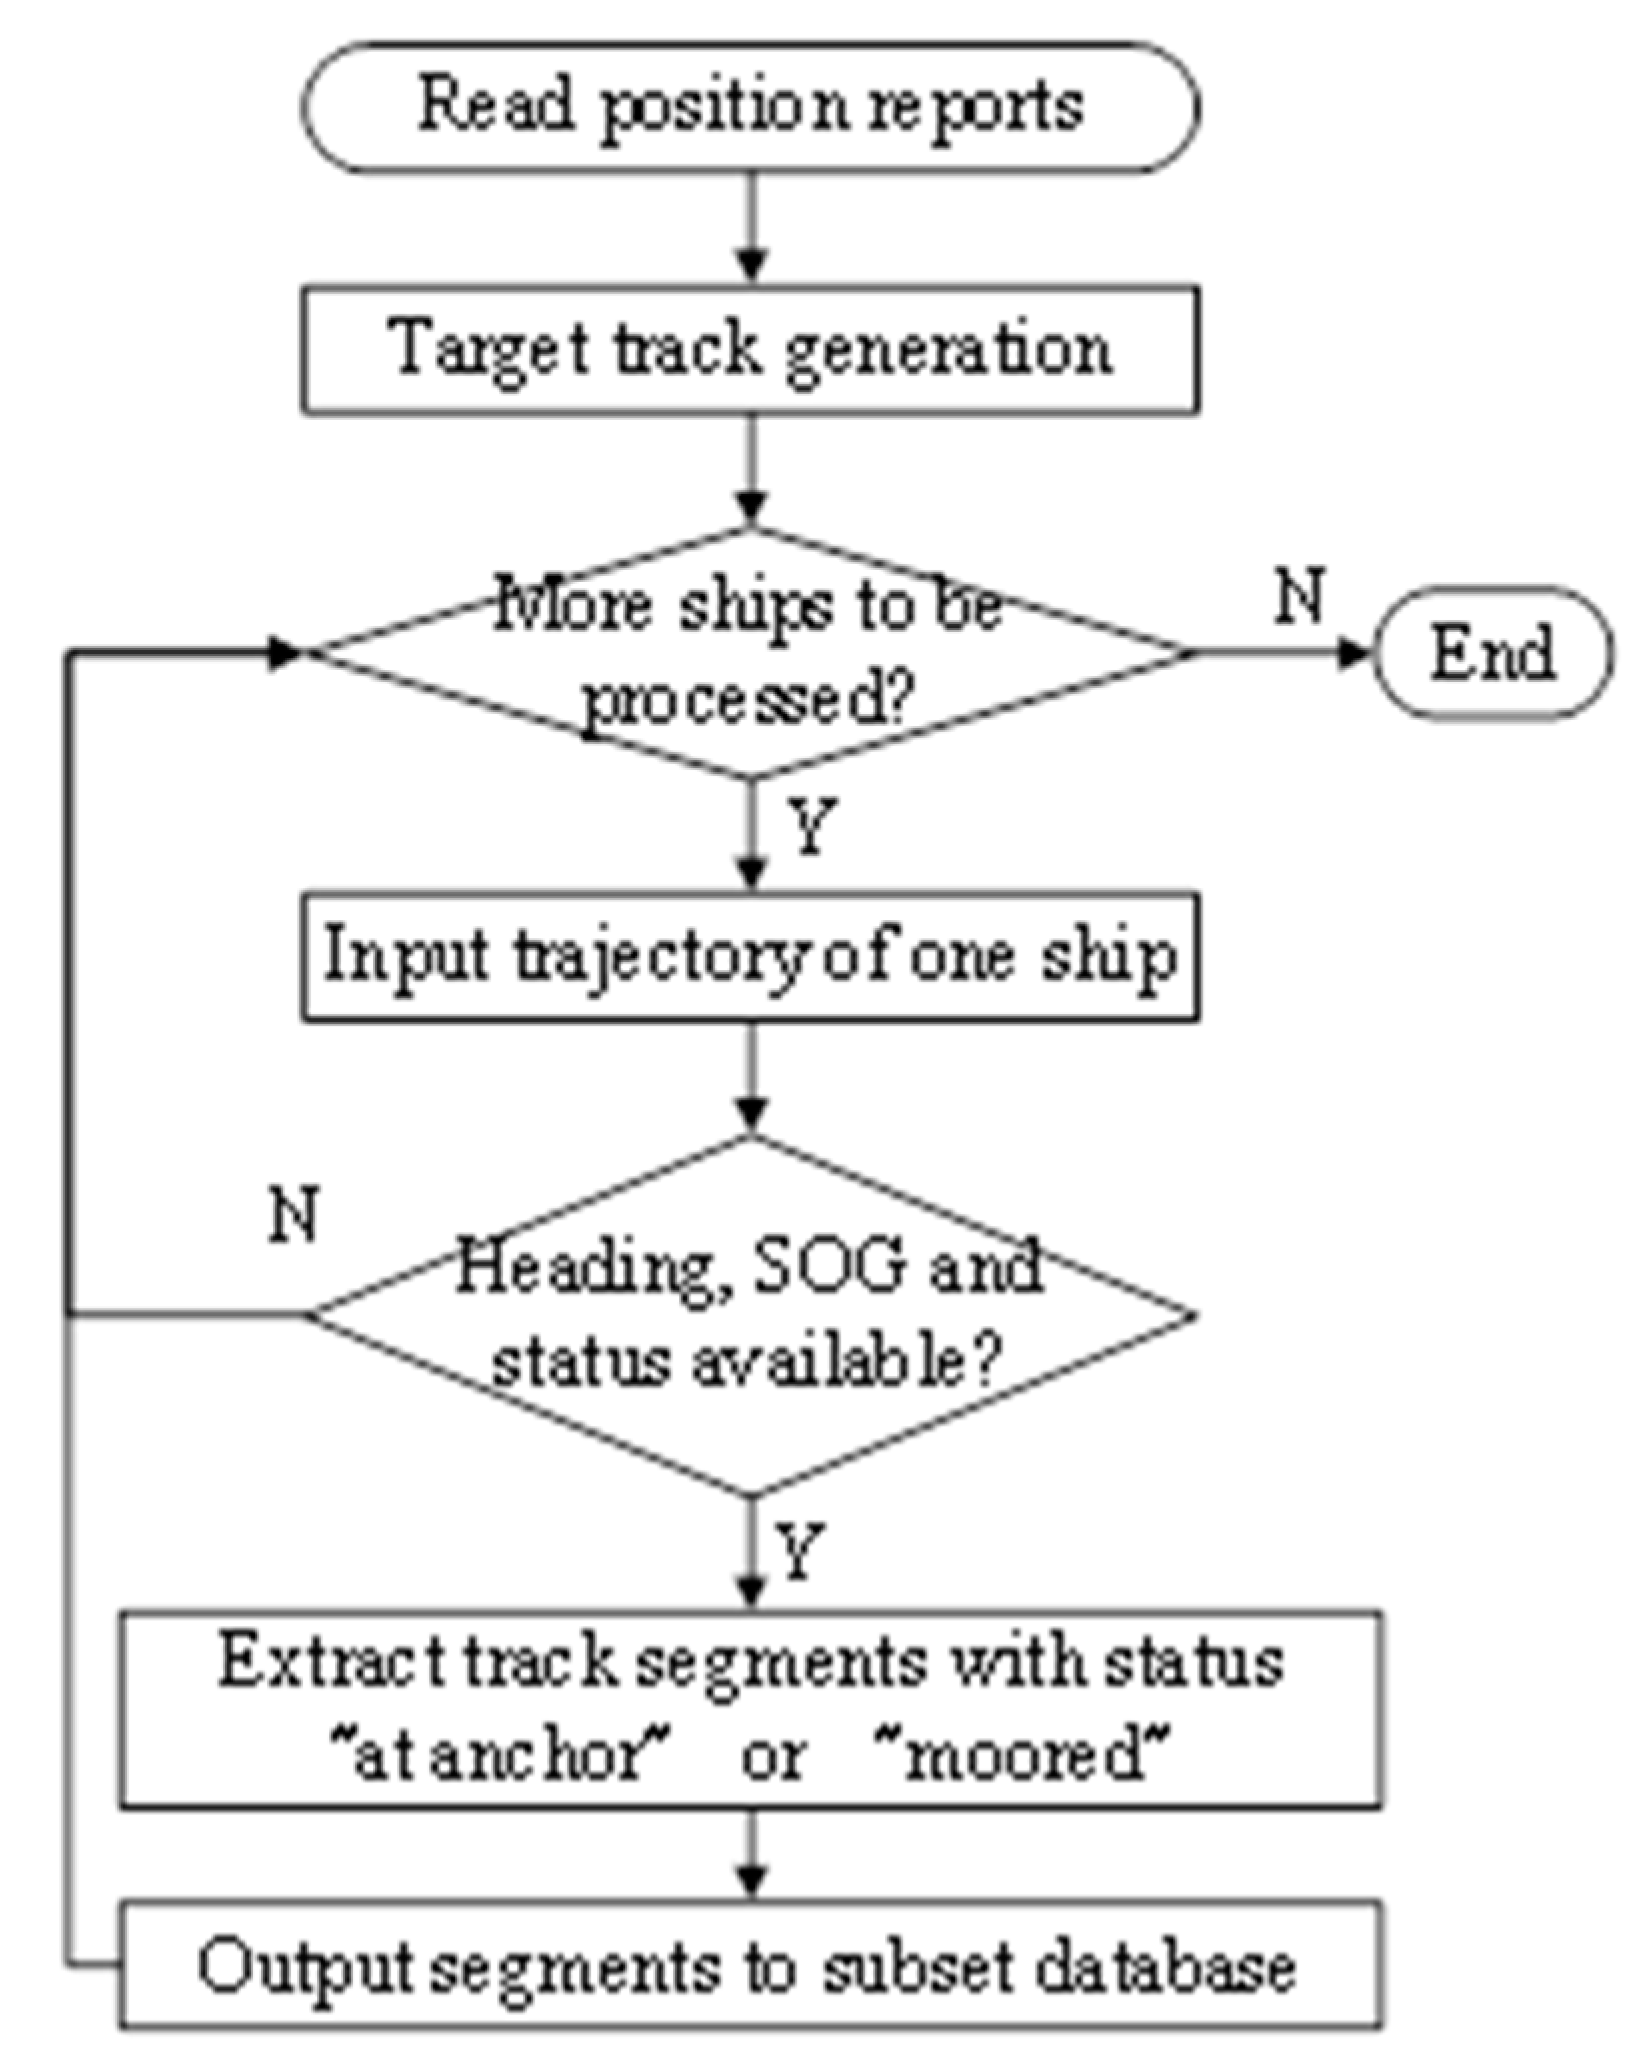
The overall framework of our method is depicted in Figure 2. As the region of loading and unloading in a port is its berths, we represent each port as a set of berths. With a high-spatial-resolution representation of ports mined by uncertainty reasoning, the arrival and departure events can be detected when a ship’s position is inside one of these berths.
As we have described in Section 1, there are 27 types of AIS messages, and only some of them contain trajectory data. Besides, some optional information fields in the message, such as navigational status and true heading, are not available or incorrect. For example, the value of true heading is available only when there is an electronic compass installed and connected to the AIS device. Therefore, we extracted a high-quality subset from historical AIS data first according to the integrity of the information fields. Then, we performed uncertain reasoning on these data to detect berth mooring behavior, which is equivalent to identifying port call events in this high-quality subset trajectory database. The positions of these berth mooring events were aggregated into berths and associated with ports, resulting in a high-resolution port area database. Finally, port call events in all the historical or real-time trajectory data could be identified easily by comparing a ship’s position with the port area database.
2.2. High-Quality Subset Historical Data Extraction
Before detecting the behavior of mooring alongside a berth, we extracted high-quality subset historical trajectory data as candidates; see Figure 3. This process aims to lower the false-positive rate of the mooring behavior detection. Although a large proportion of the trajectory data were discarded, the false-negative rate of the berth location detection was still low due to the benefit of big data.
First of all, we read position reports from the historical AIS database. Although the MMSI (Maritime Mobile Service Identity) number in each position report is assumed to be a unique identifier for a ship, it is not always the case in reality because this information field can be input and modified manually. Our previous work [27] found that MMSIs such as 123456789, 111111111, 999999999, 222222222, 100000000, 888888888, 413000000 and 808664168 had been shared by more than ten vessels worldwide. Therefore, we performed a target track association algorithm on the historical position data, as proposed in the previous paper [27], and assigned each target a unique identifier, generating tracks as input for further processes.
Then, we input the trajectory data of each ship one by one, filtering out those trajectories without valid heading, SOG and navigational status information fields in the position reports. After that, we extracted track segments with navigational statuses “at anchor” or “moored” and output them into a subset database. The reason for incorporating records with the status “at anchor” was that this status was usually mixed up with “moored” in the reports, partially due to the fact that ships anchored outside the port before any berth was available and crews did not update the status field manually when they sailed the ship to berth afterwards. As the navigation status value in the record was not reliable, the true status was further verified by uncertain reasoning in the following steps.
2.3. Berth Mooring Behavior Detection
As we have described in the previous section, the inputs for berth behavior detection are high-quality subset historical track segments. The kinematic AIS data contained in these track segments have valid information fields such as true heading, SOG and navigational status, apart from highly reliable longitude and latitude values output from GPS sensors. Although the values of these information fields are valid, they may be incorrect. Therefore, we detected berth mooring behavior through the information fusion of position, heading and SOG, as described in this section.
Due to positioning noise, wind, waves, tides, etc., the speed of a stopped ship is not always zero and its position is changing all the time; see Figure 4. In addition, we need to distinguish anchoring from berth mooring behavior because the exchange of commodities and people between water and land happens only at berth. When a ship is moored alongside a berth, its movement is much lower than when it is anchored outside the port. As it takes time to load and unload, the mooring event lasts hours or days. Taking these factors into consideration, the berth mooring behavior was detected by fuzzy inference.
In fuzzy inference, the truth of any statement becomes a matter of a degree represented as a membership function. A membership function for a fuzzy set A on the universe of discourse X is defined as A(x): X → [0,1], where each element of X is mapped to a value between 0 and 1. This value, called the membership value or degree of membership, quantifies the grade of membership of the element in X to the fuzzy set A.
The membership that a track segment corresponds to berth mooring is calculated based on two fuzzy rules according to historical data analysis:
(1) IF a ship stayed within a small area for a long time, with a low speed and tiny heading variations, THEN it was moored alongside a berth;
(2) IF many AIS kinematic messages are included in this track segment, THEN the calculated heading variation and extent of area are precise.
Using the annotations in Table 3, these two rules can be rewritten as:
(3) IF extent is small AND time is long AND speed is low AND stdev(heading) is tiny, THEN type is berth mooring;
(4) IF count is large THEN extent’ is approximately extent AND time’ is approximately time AND speed’ is approximately speed AND stdev(heading’) is approximately stdev(heading).
Combining these two rules, the following rule can be deduced:
(5) IF count is large AND extent’ is small AND time’ is long AND speed’ is low AND stdev(heading’) is tiny, THEN behavior is berth mooring.
We use S-membership functions and their complements to represent these increasing and decreasing notions in the fuzzy rule (5). The definition of the S-membership function is:
where a, b and c are real numbers satisfying a < b < c and b = (a + c)/2. After analyzing the historical tracks of ships mooring alongside berths, fuzzy sets in the fuzzy rule are defined as:
large (count) = S(count; 5, 15, 25)
small (extent’) = 1 − S(extent’; 15, 50, 80)
long (time’) = S (time’; 1800, 22500, 43200)
low (speed’) = 1 − S (speed’; 0, 0.05, 0.1)
tiny (stdev(heading’)) = 1 − S (stdev(heading’); 1, 3, 5)
If the membership that a track segment segi belongs to a berth calculated in the following equation is larger than 0, we classify it as berth mooring behavior.
Mooring (segi) = min (large (counti), small (extenti’), long (timei’), low (speedi’), tiny (stdev (headingi’)))
2.4. Berth Location Extraction
With the mooring events detected, we extracted the locations of them and aggregated to ports for performing OD detection with other datasets.
First of all, we discretized space by partitioning the Earth’s surface into grids at a spatial resolution of 0.6 s longitude by 0.6 s latitude, finer than 20 m by 20 m anywhere. The unit of the longitude and latitude in AIS messages is 1/10,000 min, and the spatial resolution of a grid cell in this paper corresponds to 100 units.
The longitude and latitude of celli,j span from −180° + ix to −180° + (i + 1)x and −90° + jx to −90° + (j + 1)x, respectively, where x is 0.6 s. After discretization, a track segment can be represented as one or multiple grid cells:
The membership that a grid cell belongs to a berth is calculated according to the mooring events located in it.
If no track segment has been located in a cell, then the membership is 0. After this step, we assigned a membership value to every grid cell on earth. Then, cells belonging to berths were picked out:
where th is the threshold of the membership value, and we set its value as 0 in this paper. That is to say, a grid cell was regarded as belonging to a berth if its membership value to the fuzzy set Berth was larger than the threshold value.
2.5. Mapping Berths to Ports
After identifying grid cells belonging to berths, a port can be represented as a set of the berth grid cells nearest to it:
where N is the total number of ports worldwide and is the distance between a port and a grid cell. The distance function is a combination of the geospatial and semantic distance:
where dg is the geospatial distance along the Great Circle Route between the central position of the grid cell and port, and ds is the semantic distance between them, which is defined as:
- if (Country(port)!= Country(cell))
- ds = 100000;
- else if (Subdivision(port)!=Subdivision(cell))
- ds =50000;
- else if (UNLocation(port)!=UNLocation(cell))
- ds =500;
- else
- ds = 0;
When a grid cell and a port belong to different countries, subdivisions or UNLocations [28], ds is empirically set as 100,000, 50,000 or 500 m, respectively.
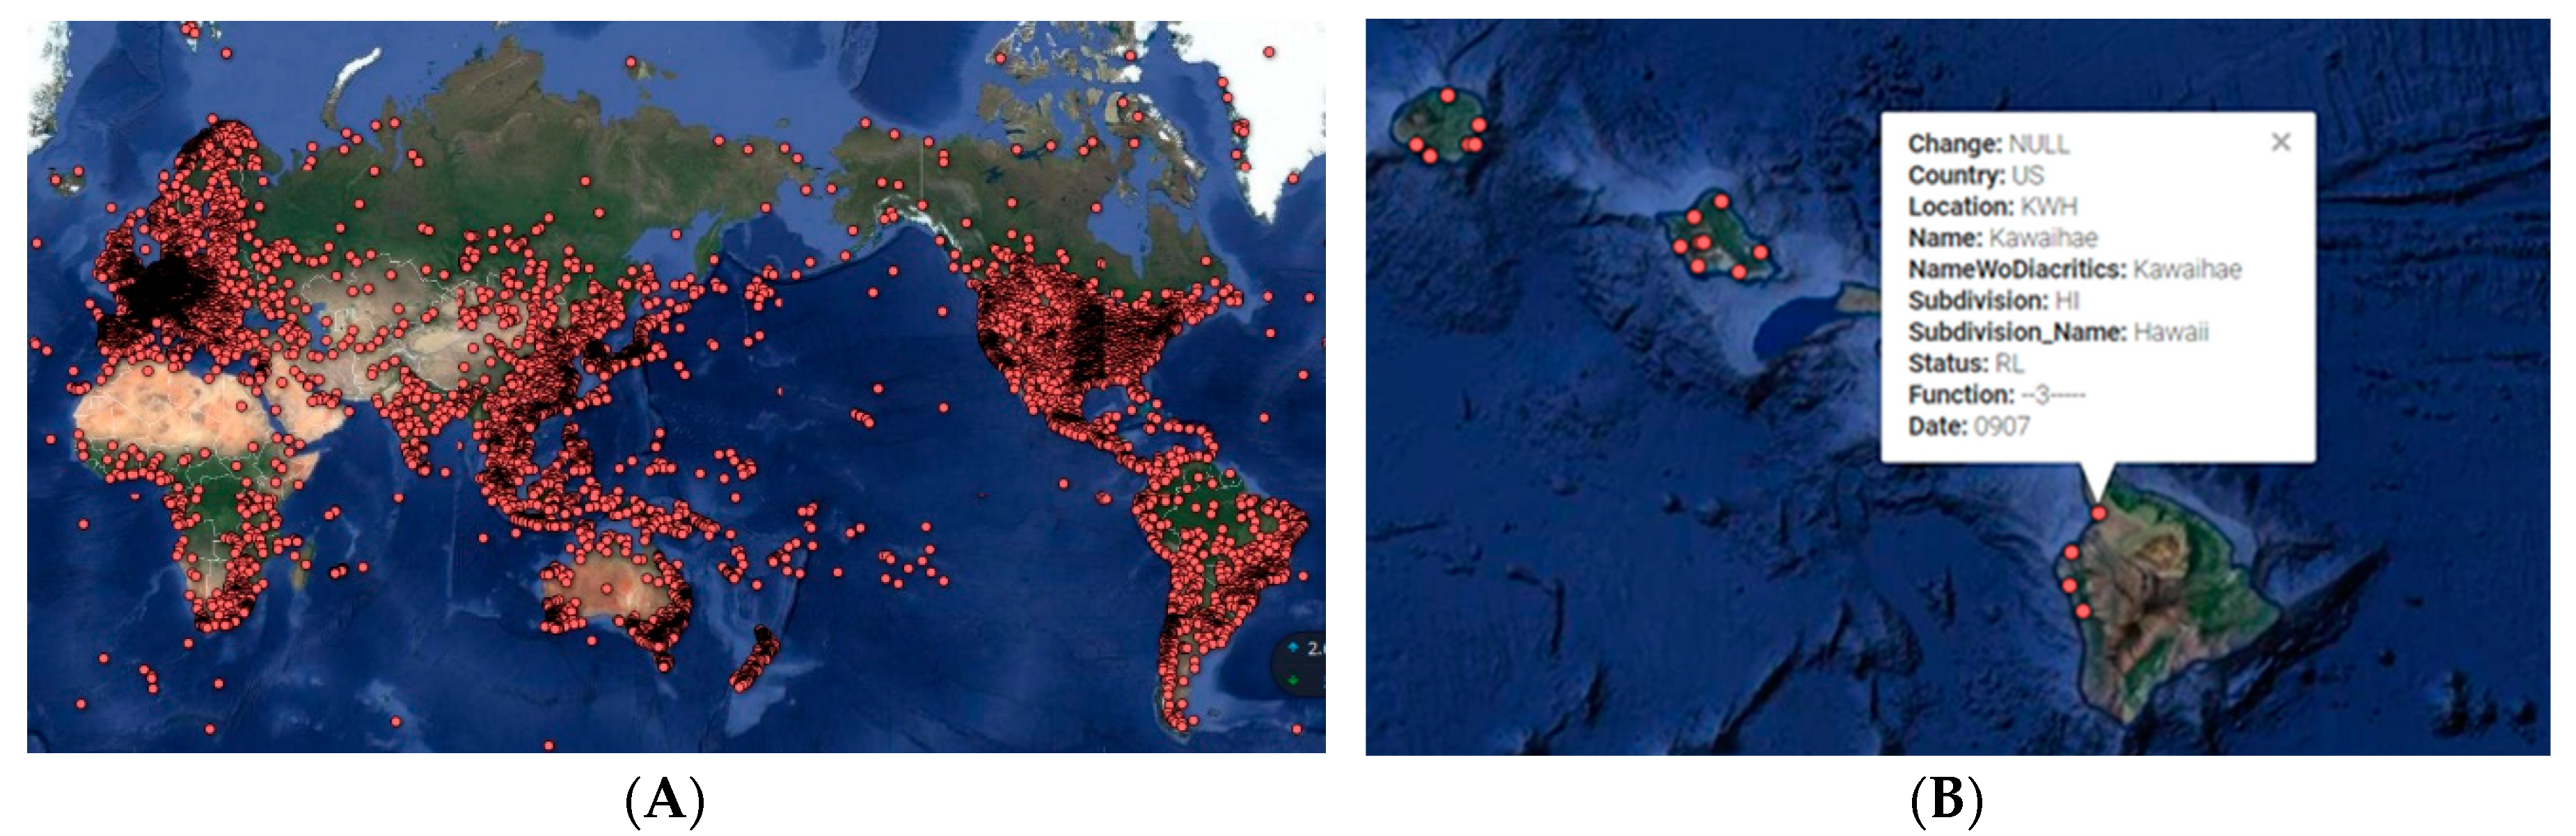
To determine the semantic attributes of grid cells and ports, we matched them with the geographically nearest UN/LOCODE (United Nations Code for Trade and Transport Locations) [28]. The UN/LOCODE is used by most major shipping companies, by freight forwarders and in the manufacturing industry around the world. In the preprocessing step, we deleted UN/LOCODE records whose statuses were RR (request rejected), UR (entry included on user’s request; not officially approved) and XX (entry that will be removed from the next issue of UN/LOCODE). In addition, multiple mistaken locations in China were picked out manually. Finally, we converted the format of the coordinates from a string (“0000lat 00000long”) to two numbers (longitude and latitude in degrees). The final dataset contained 76,000 locations; see Figure 5.
To accelerate the matching, we divided the Earth’s surface into 360*180 containers at a spatial resolution of 1 degree latitude by 1 degree longitude. Then, 76,000 locations, 3685 ports and all the berth grids discovered were put into these containers, performing matching between objects in adjacent containers.
2.6. Port Call Detection
Each mooring event detected as described in Section 2.3 corresponds to a port call in the high-quality subset historical data.
In addition, with a refined port map mined from the high-quality subset data, we could detect historical or real-time port call events by judging whether the position of a ship was inside a berth grid cell; see Figure 6. First of all, we calculated the index of the grid cell that a low SOG position report resided in. Then, we iterated port maps to detect whether this grid cell belonged to any port. To speed up computing, we divided the Earth’s surface into 360*180 containers and only iterated ports in adjacent containers. Considering that the size of a ship may span dozens of cells and to reduce missed detection, we also compared multiple nearby grid cells with port maps.
3. Results
In this work, we used about 14 billion pieces of AIS dynamic data provided by the China Transport Telecommunications & Information Centre (CTTIC). These AIS records were from July 2015 to February 2016, spanning 8 months in total.
MySQL Community Server 5.6.24 was used to store the AIS data and the results of the port mapping. The MySQL Server and program for mooring behavior detection were run on two CentOS servers; each had 2 × Xeon E5 2620v2 CPUs, 16 × 8 GB DDR3 1600 MHz RAM and 8 × 3TB SAS disks. It took about 10 h to complete the task of extracting high-quality subset data, detecting OD events and mining global berths, including retrieving data and writing the results into the database. All these computing tasks were accomplished by C++ programs developed by our team. There were 202,238 grid cells whose memberships to berth were above zero; some of them are depicted in Figure 7. Each of these cells represents one or multiple historical port call events in the high-quality subset data. The matching between 202,238 grids and 3685 ports took 2.3 s.
China’s combined navigable rivers are longer than any other country’s, at 126,300 km [21]. The lower reaches of the Yangtze River (the third longest in the world) with the mined berth grid cells are demonstrated in the left of Figure 7. After the berth-to-UN/LOCODE association, each berth grid had the attribute of country. In the right of Figure 7, the distribution of ports in the US is depicted, with berths in Alaska correctly associated with the US rather than Canada, although they are closer to Canada by geospatial distance alone.
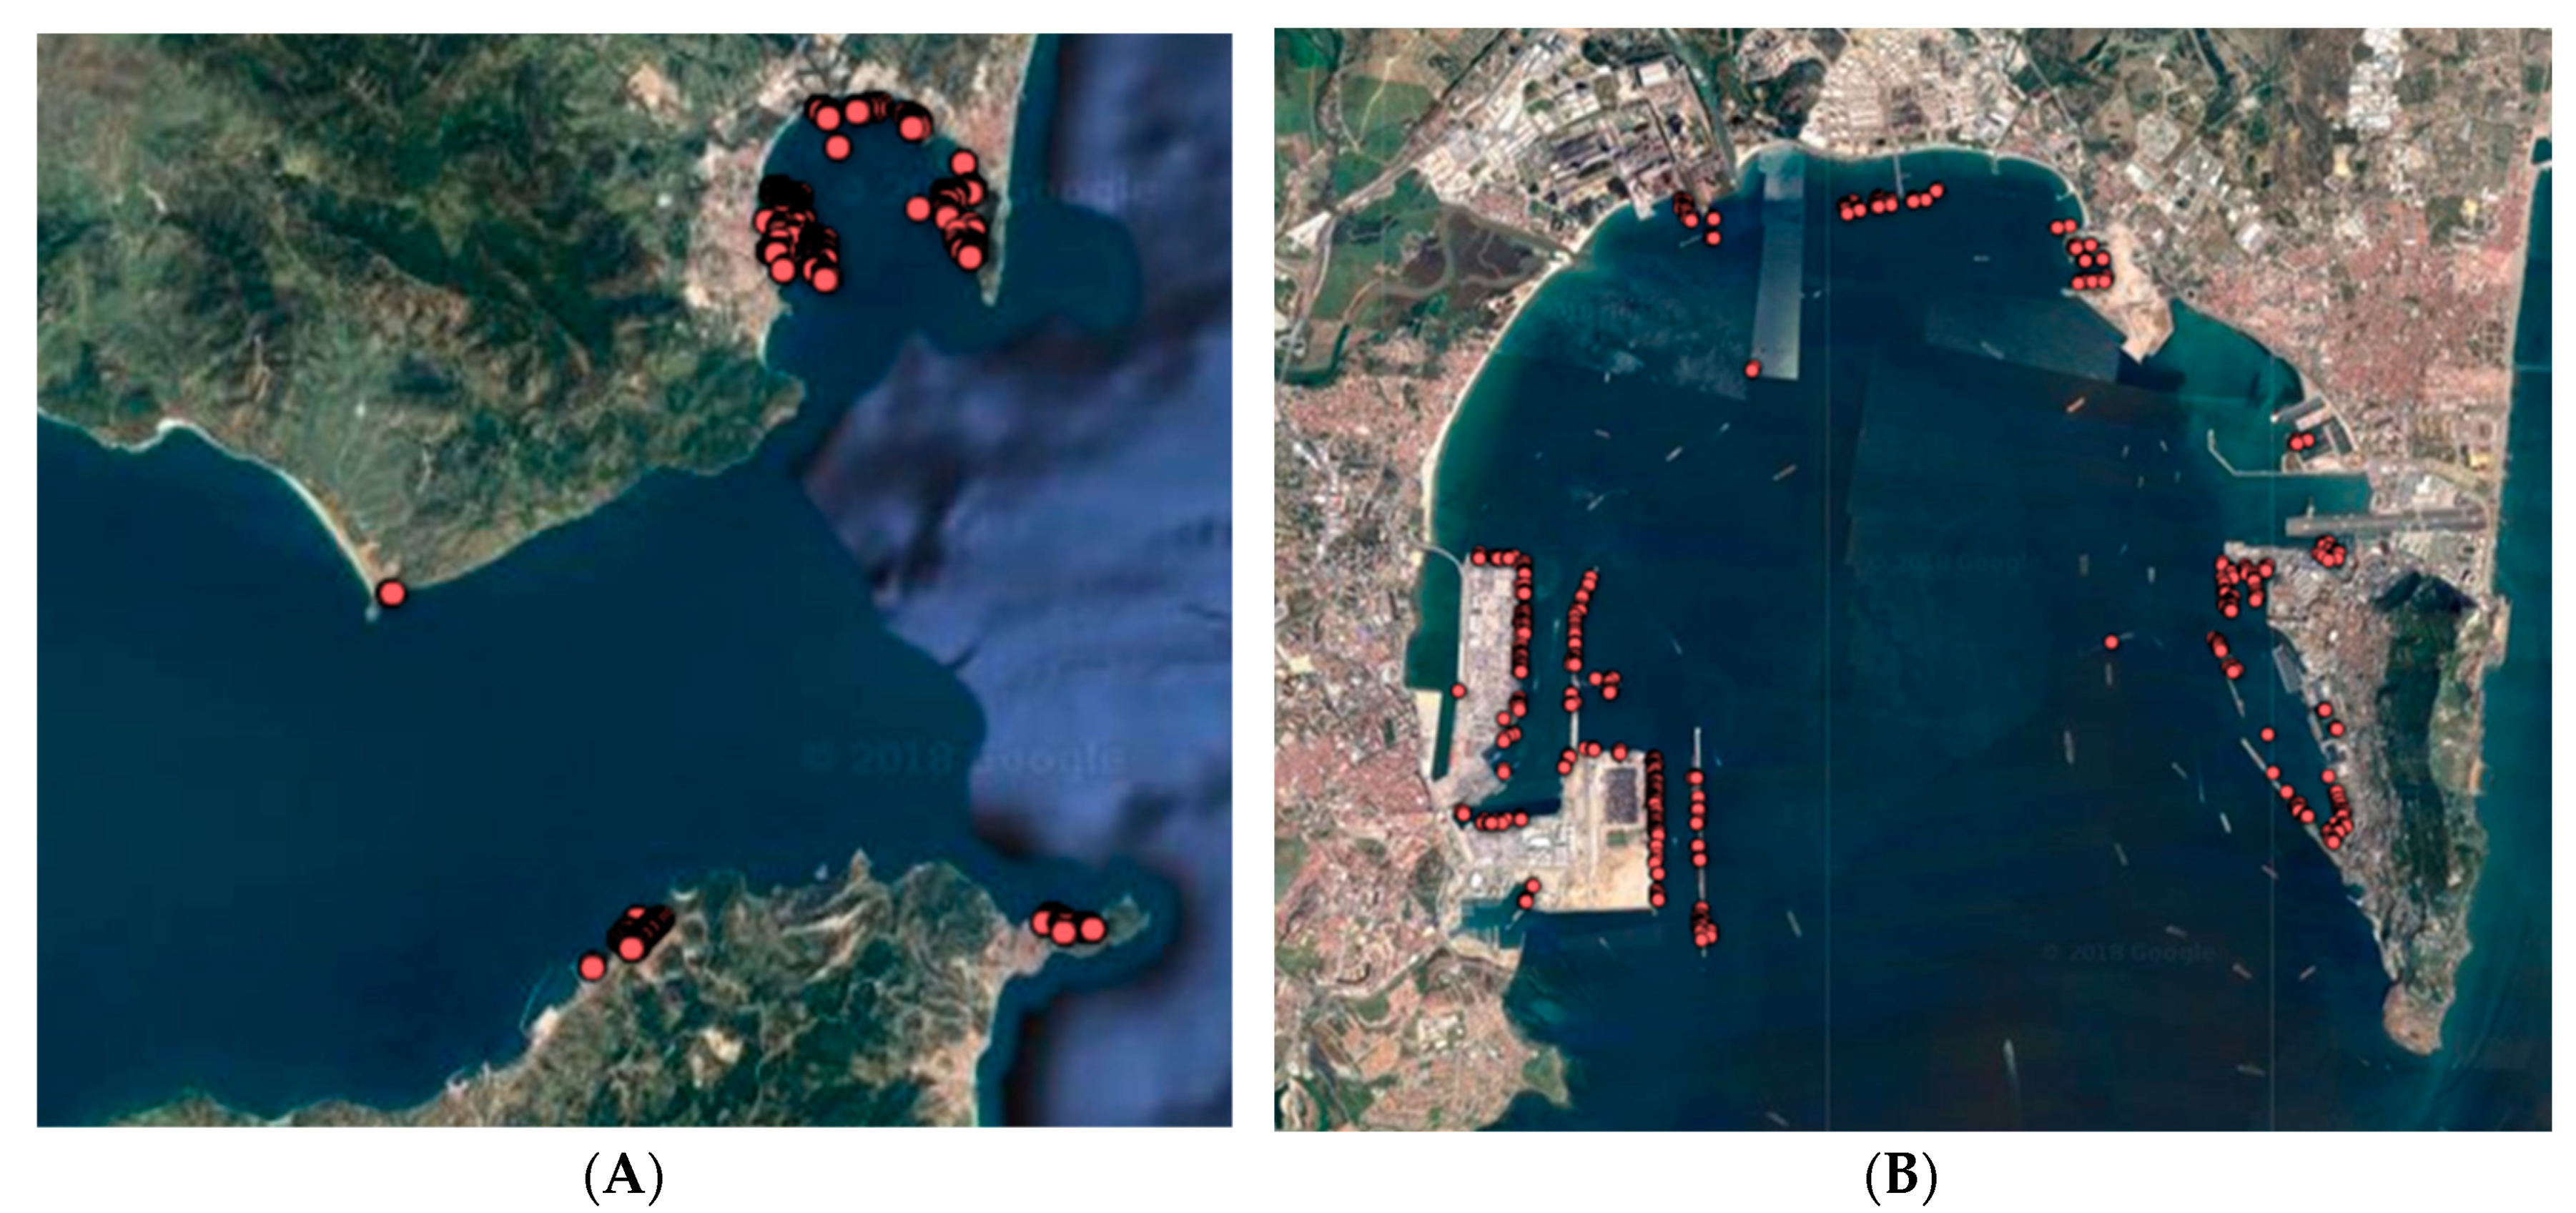
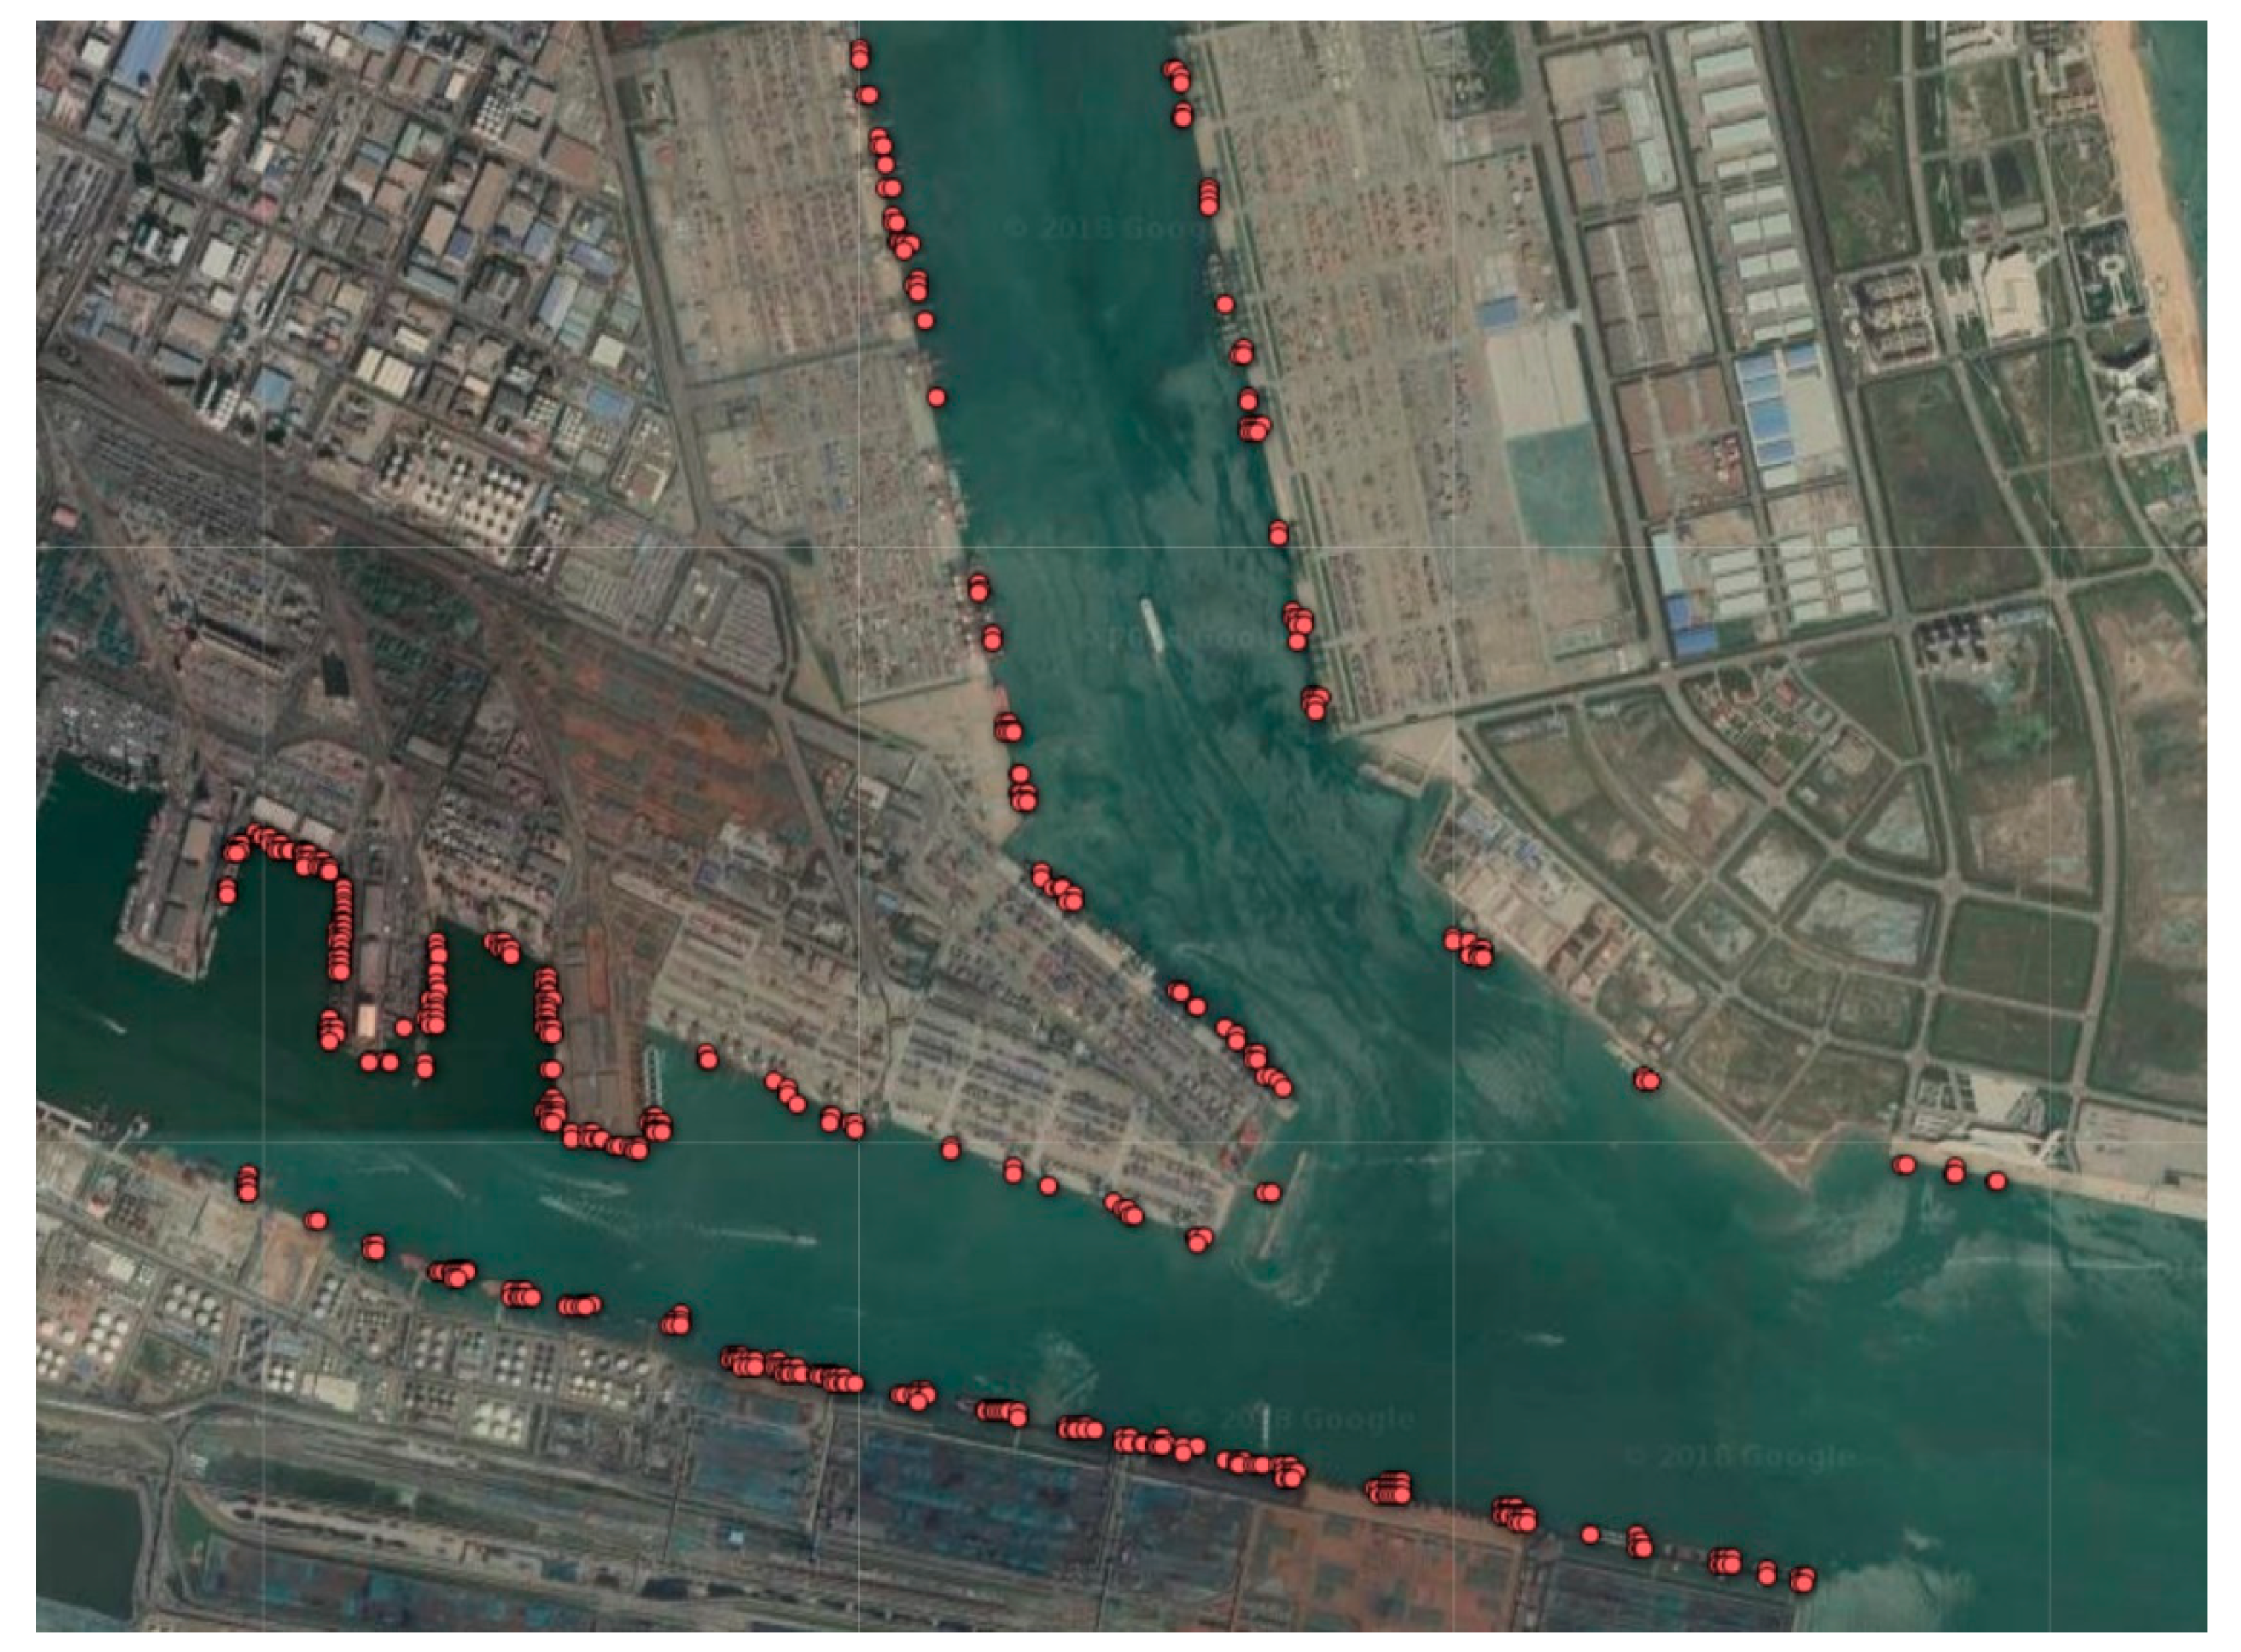
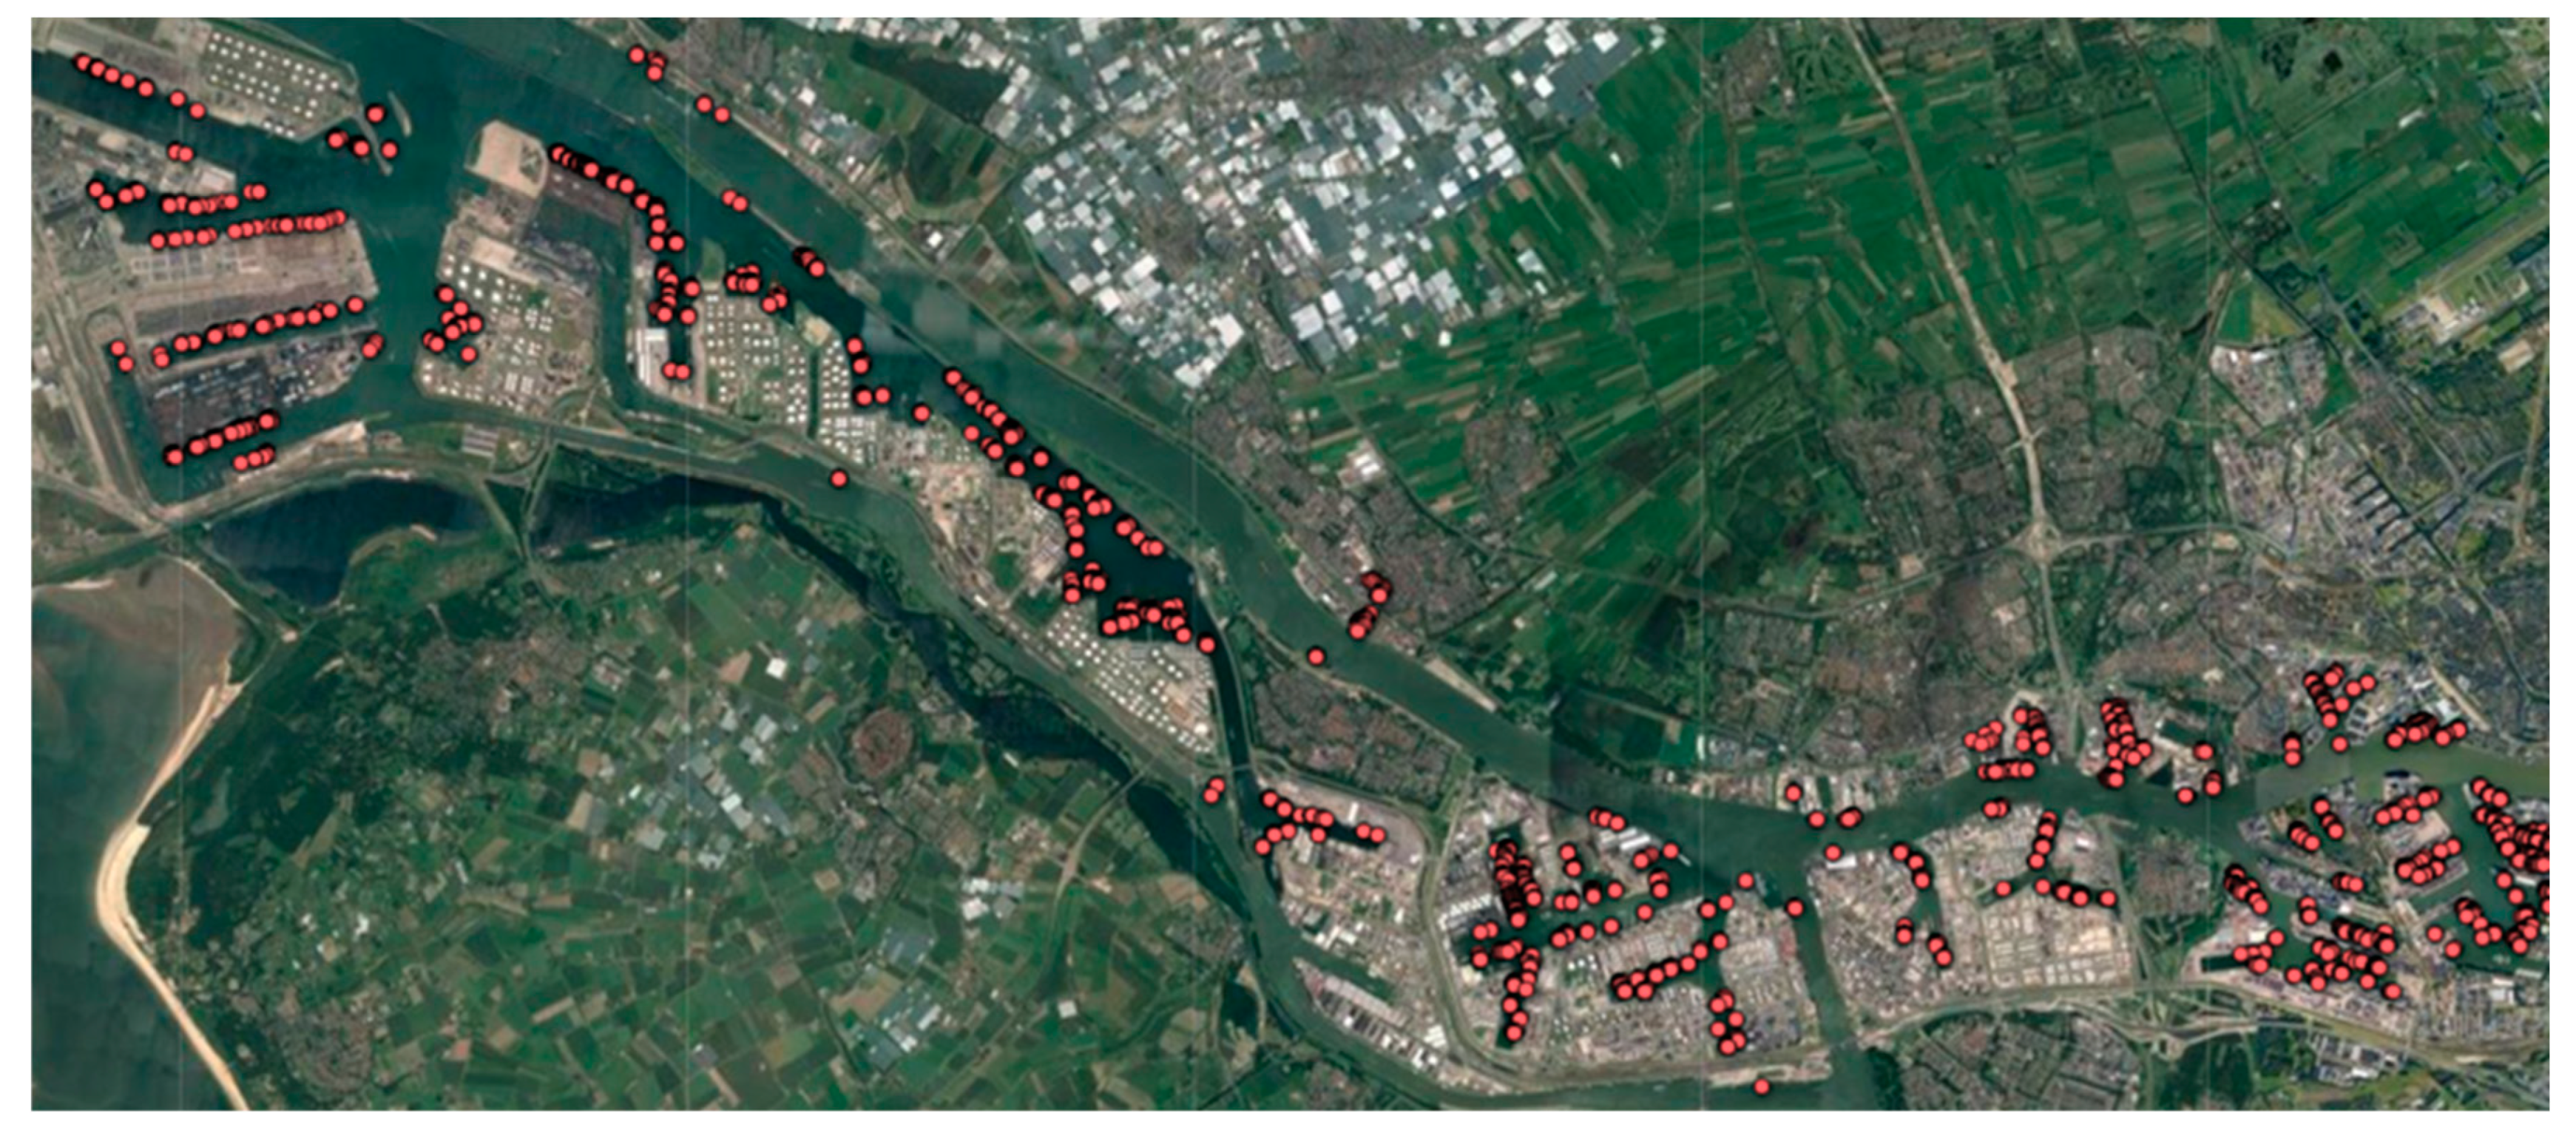
Tianjin is the largest port in North China, and Rotterdam is the largest port in Europe. The results of mapping them from historical port call events are shown in Figure 8 and Figure 9. It can be seen from these figures that our method has a high true-positive rate and a low false-positive rate for OD/berth detection, and the spatial resolution of the ports mined was high enough for OD detection based on the distance between a ship and a berth in the future.
Pallotta et al. [24] detected stationary points during a two-week period over the Strait of Gibraltar, and then clustered them into port and offshore platform objects using Density-Based Spatial Clustering of Applications with Noise (DBSCAN). The spatial resolution and extent of the clustered objects were on the order of kilometers, including both waters and anchorages outside the port. As a comparison, the spatial resolution and extent of the berths detected by our method over the same district were on the order of meters, as shown in Figure 10. The precise positions of berths were detected, and the numbers of false-positive berth grid cells at sea were limited, which is the basis of accurate port call detection according to comparing positions only in the future.
4. Conclusions
The requirements for dataset transparency and wider coverage of researchers and policy makers has resulted in more and more work on maritime network analysis based on AIS data. To analyze ships’ transitions among ports from trajectory data automatically, the ranges of ports are needed by computer programs. Compared with remote-sensing-image-based methods, trajectory mining has the advantage of lower computational complexity and wider spatial coverage. Previous work usually detected ports by clustering stationary points into bounding polygons or drawing rectangles and circles manually. Ports discovered by this kind of method were coarse in extent and spatial resolution, resulting in low-precision port call detection.
In this paper, an uncertain reasoning method for mapping global ports from AIS data is proposed. The results show that this method has high precision in port call/berth detection, and the ports mapped fit well with satellite images. The spatial resolution of the port maps represented as grid cell sets is higher than 20 m, much finer than that of the extracted stationary areas in previous work, which was on the order of kilometers. Each berth grid cell depicted in this paper corresponds to one or multiple port call events in the high-quality subset historical data. Based on these detected berth grid cells, whether a ship is in port or not can be determined automatically and efficiently by comparing its position with nearby berths without uncertain reasoning in subsequent processes. The method described in this paper has already supported multiple studies on maritime transportation network analysis [29,30].
In this paper, 8 months of AIS data were used. Our future work would be to map global ports from a larger dataset, and take ships’ size into consideration, expecting fewer misdetections. After that, we plan to continue our work on analyzing ships’ transit among global ports by combining AIS data with the global ports mapped in this paper. By combining ships’ static information such as the ship type and size, the property of each berth and port can be determined. Based on this extracted contextual knowledge, anomaly detection can be performed.
Author Contributions
Conceptualization, Lin Wu; methodology, Lin Wu; software, Lin Wu; validation, Fei Wang; writing—original draft preparation, Lin Wu; writing—review and editing, Lin Wu; supervision, Fei Wang and Yongjun Xu; project administration, Yongjun Xu; funding acquisition, Fei Wang and Yongjun Xu. All authors have read and agreed to the published version of the manuscript.
Funding
This research was funded by the National Natural Science Foundation of China (NSFC), grant numbers 61902376 and 61602487.
Acknowledgments
The China Transport Telecommunications & Information Centre (CTTIC) is thanked for providing the AIS data.
Conflicts of Interest
The authors declare no conflict of interest.
References
- UNCTAD. Review of Maritime Transport 2017; UNCTAD: Geneva, Switzerland, 2017. [Google Scholar]
- Yu, H.; Fang, Z.; Lu, F.; Murray, A.T.; Zhao, Z.; Xu, Y.; Yang, X. Massive Automatic Identification System Sensor Trajectory Data-Based Multi-Layer Linkage Network Dynamics of Maritime Transport along 21st-Century Maritime Silk Road. Sensors 2019, 19, 4197. [Google Scholar] [CrossRef] [PubMed] [Green Version]
- Filipiak, D.; Węcel, K.; Stróżyna, M.; Michalak, M.; Abramowicz, W. Extracting Maritime Traffic Networks from AIS Data Using Evolutionary Algorithm. Bus. Inf. Syst. Eng. 2020, 62, 435–450. [Google Scholar] [CrossRef]
- Jia, H.; Lampe, O.D.; Solteszova, V.; Strandenes, S.P. Norwegian port connectivity and its policy implications. Marit. Policy Manag. 2017, 44, 956–966. [Google Scholar] [CrossRef] [Green Version]
- Adland, R.; Jia, H.; Strandenes, S.P. Are AIS-based trade volume estimates reliable? The case of crude oil exports. Marit. Policy Manag. 2017, 44, 657–665. [Google Scholar] [CrossRef] [Green Version]
- Xu, M.; Li, Z.; Shi, Y.; Zhang, X.; Jiang, S. Evolution of regional inequality in the global shipping network. J. Transp. Geogr. 2015, 44, 1–12. [Google Scholar] [CrossRef]
- Varlamis, I.; Kontopoulos, I.; Tserpes, K.; Etemad, M.; Soares, A.; Matwin, S. Building navigation networks from multi-vessel trajectory data. GeoInformatica 2020, 1–29. [Google Scholar] [CrossRef]
- Wang, Z.; Yao, M.; Meng, C.; Claramunt, C. Risk Assessment of the Overseas Imported COVID-19 of Ocean-Going Ships Based on AIS and Infection Data. ISPRS Int. J. Geo-Inf. 2020, 9, 351. [Google Scholar] [CrossRef]
- Kaluza, P.; Kölzsch, A.; Gastner, M.T.; Blasius, B. The complex network of global cargo ship movements. J. R. Soc. Interface 2010, 7, 1093–1103. [Google Scholar] [CrossRef] [PubMed]
- Jia, H.; Prakash, V.; Smith, T. Estimating vessel payloads in bulk shipping using AIS data. Int. J. Shipp. Transp. Logist. 2019, 11, 25. [Google Scholar] [CrossRef]
- Kara, Y.; Boyacioglu, M.A.; Baykan, Ö.K. Predicting direction of stock price index movement using artificial neural networks and support vector machines: The sample of the Istanbul Stock Exchange. Expert Syst. Appl. 2011, 38, 5311–5319. [Google Scholar] [CrossRef]
- Abdallah, N.B. Fixing errors in the AIS destination field. In OCEANS 2019—Marseille; Institute of Electrical and Electronics Engineers (IEEE): Marseille, France, 2019. [Google Scholar]
- ITU-R. Technical Characteristics for an Automatic Identification System Using Time-Division Multiple Access in the VHF Maritime Mobile Band, Recommendation ITU-R M.1371-4; ITU: Geneva, Switzerland, 2001. [Google Scholar]
- IMO. International Convention for the Safety of Life at Sea (SOLAS); IMO: London, UK, 1974. [Google Scholar]
- Harati-Mokhtari, A.; Wall, A.; Brooks, P.; Wang, J. Automatic Identification System (AIS): Data Reliability and Human Error Implications. J. Navig. 2007, 60, 373–389. [Google Scholar] [CrossRef]
- National Geospatial-Intelligence Agency of USA. World Port Index; National Geospatial-Intelligence Agency of USA: Springfield, VA, USA, 2019. [Google Scholar]
- Elane. Shipfinder. 2020. Available online: http://www.shipfinder.com/ (accessed on 23 November 2020).
- Hadzagic, M. Maritime Traffic Data Mining Using R. In Proceedings of the 16th International Conference on Information Fusion, Istanbul, Turkey, 9–12 July 2013. [Google Scholar]
- Zissis, D.; Chatzikokolakis, K.; Spiliopoulos, G.; Vodas, M. A Distributed Spatial Method for Modeling Maritime Routes. IEEE Access 2020, 8, 47556–47568. [Google Scholar] [CrossRef]
- De Vries, G.K.D.; Van Someren, M. Machine learning for vessel trajectories using compression, alignments and domain knowledge. Expert Syst. Appl. 2012, 39, 13426–13439. [Google Scholar] [CrossRef]
- UNCTAD. Review of Maritime Transport 2015; UNCTAD: Geneva, Switzerland, 2015. [Google Scholar]
- Cazzanti, L.; Pallotta, G. Mining Maritime Vessel Traffic: Promises, Challenges, Techniques. In OCEANS 2015—Genova; IEEE: Genoa, Italy, 2015. [Google Scholar]
- Le Guillarme, N.; Lerouvreur, X. Unsupervised extraction of knowledge from S-AIS data for maritime situational awareness. In Proceedings of the 16th International Conference on Information Fusion, Istanbul, Turkey, 9–12 July 2013. [Google Scholar]
- Pallotta, G.; Vespe, M.; Bryan, K. Vessel Pattern Knowledge Discovery from AIS Data: A Framework for Anomaly Detection and Route Prediction. Entropy 2013, 15, 2218–2245. [Google Scholar] [CrossRef] [Green Version]
- Pallotta, G.; Vespe, M.; Bryan, K. Traffic Route Extraction and Anomaly Detection from AIS Data. In International COST MOVE Workshop on Moving Objects at Sea; European Cooperation in Science and Technology (COST): Brest, France, 2013. [Google Scholar]
- Pallotta, G.; Vespe, M.; Bryan, K. Traffic knowledge discovery from ais data. In Proceedings of the 16th International Conference on Information Fusion (FUSION, Istanbul, Turkey, 9–12 July 2013. [Google Scholar]
- Wu, L.; Xu, Y.; Wang, Q.; Wang, F.; Xu, Z. Mapping Global Shipping Density from AIS Data. J. Navig. 2017, 70, 67–81. [Google Scholar] [CrossRef]
- United Nations Economic Commission for Europe (UNECE). UN/LOCODE Code List by Country; UNECE: Geneva, Switzerland, 2018. [Google Scholar]
- Peng, P.; Cheng, S.; Chen, J.; Liao, M.; Wu, L.; Liu, X.; Lu, F. A fine-grained perspective on the robustness of global cargo ship transportation networks. J. Geogr. Sci. 2018, 28, 881–889. [Google Scholar] [CrossRef] [Green Version]
- Peng, P.; Yang, Y.; Cheng, S.; Lu, F.; Yuan, Z. Hub-and-spoke structure: Characterizing the global crude oil transport network with mass vessel trajectories. Energy 2019, 168, 966–974. [Google Scholar] [CrossRef]
Figure 1.
Screenshot of the “ships in port” service provided by Elane Inc. The boundary of port Shanghai is represented as the red rectangle, and a ship is regarded as in this port if, and only if, it is inside this rectangle.
Figure 1.
Screenshot of the “ships in port” service provided by Elane Inc. The boundary of port Shanghai is represented as the red rectangle, and a ship is regarded as in this port if, and only if, it is inside this rectangle.
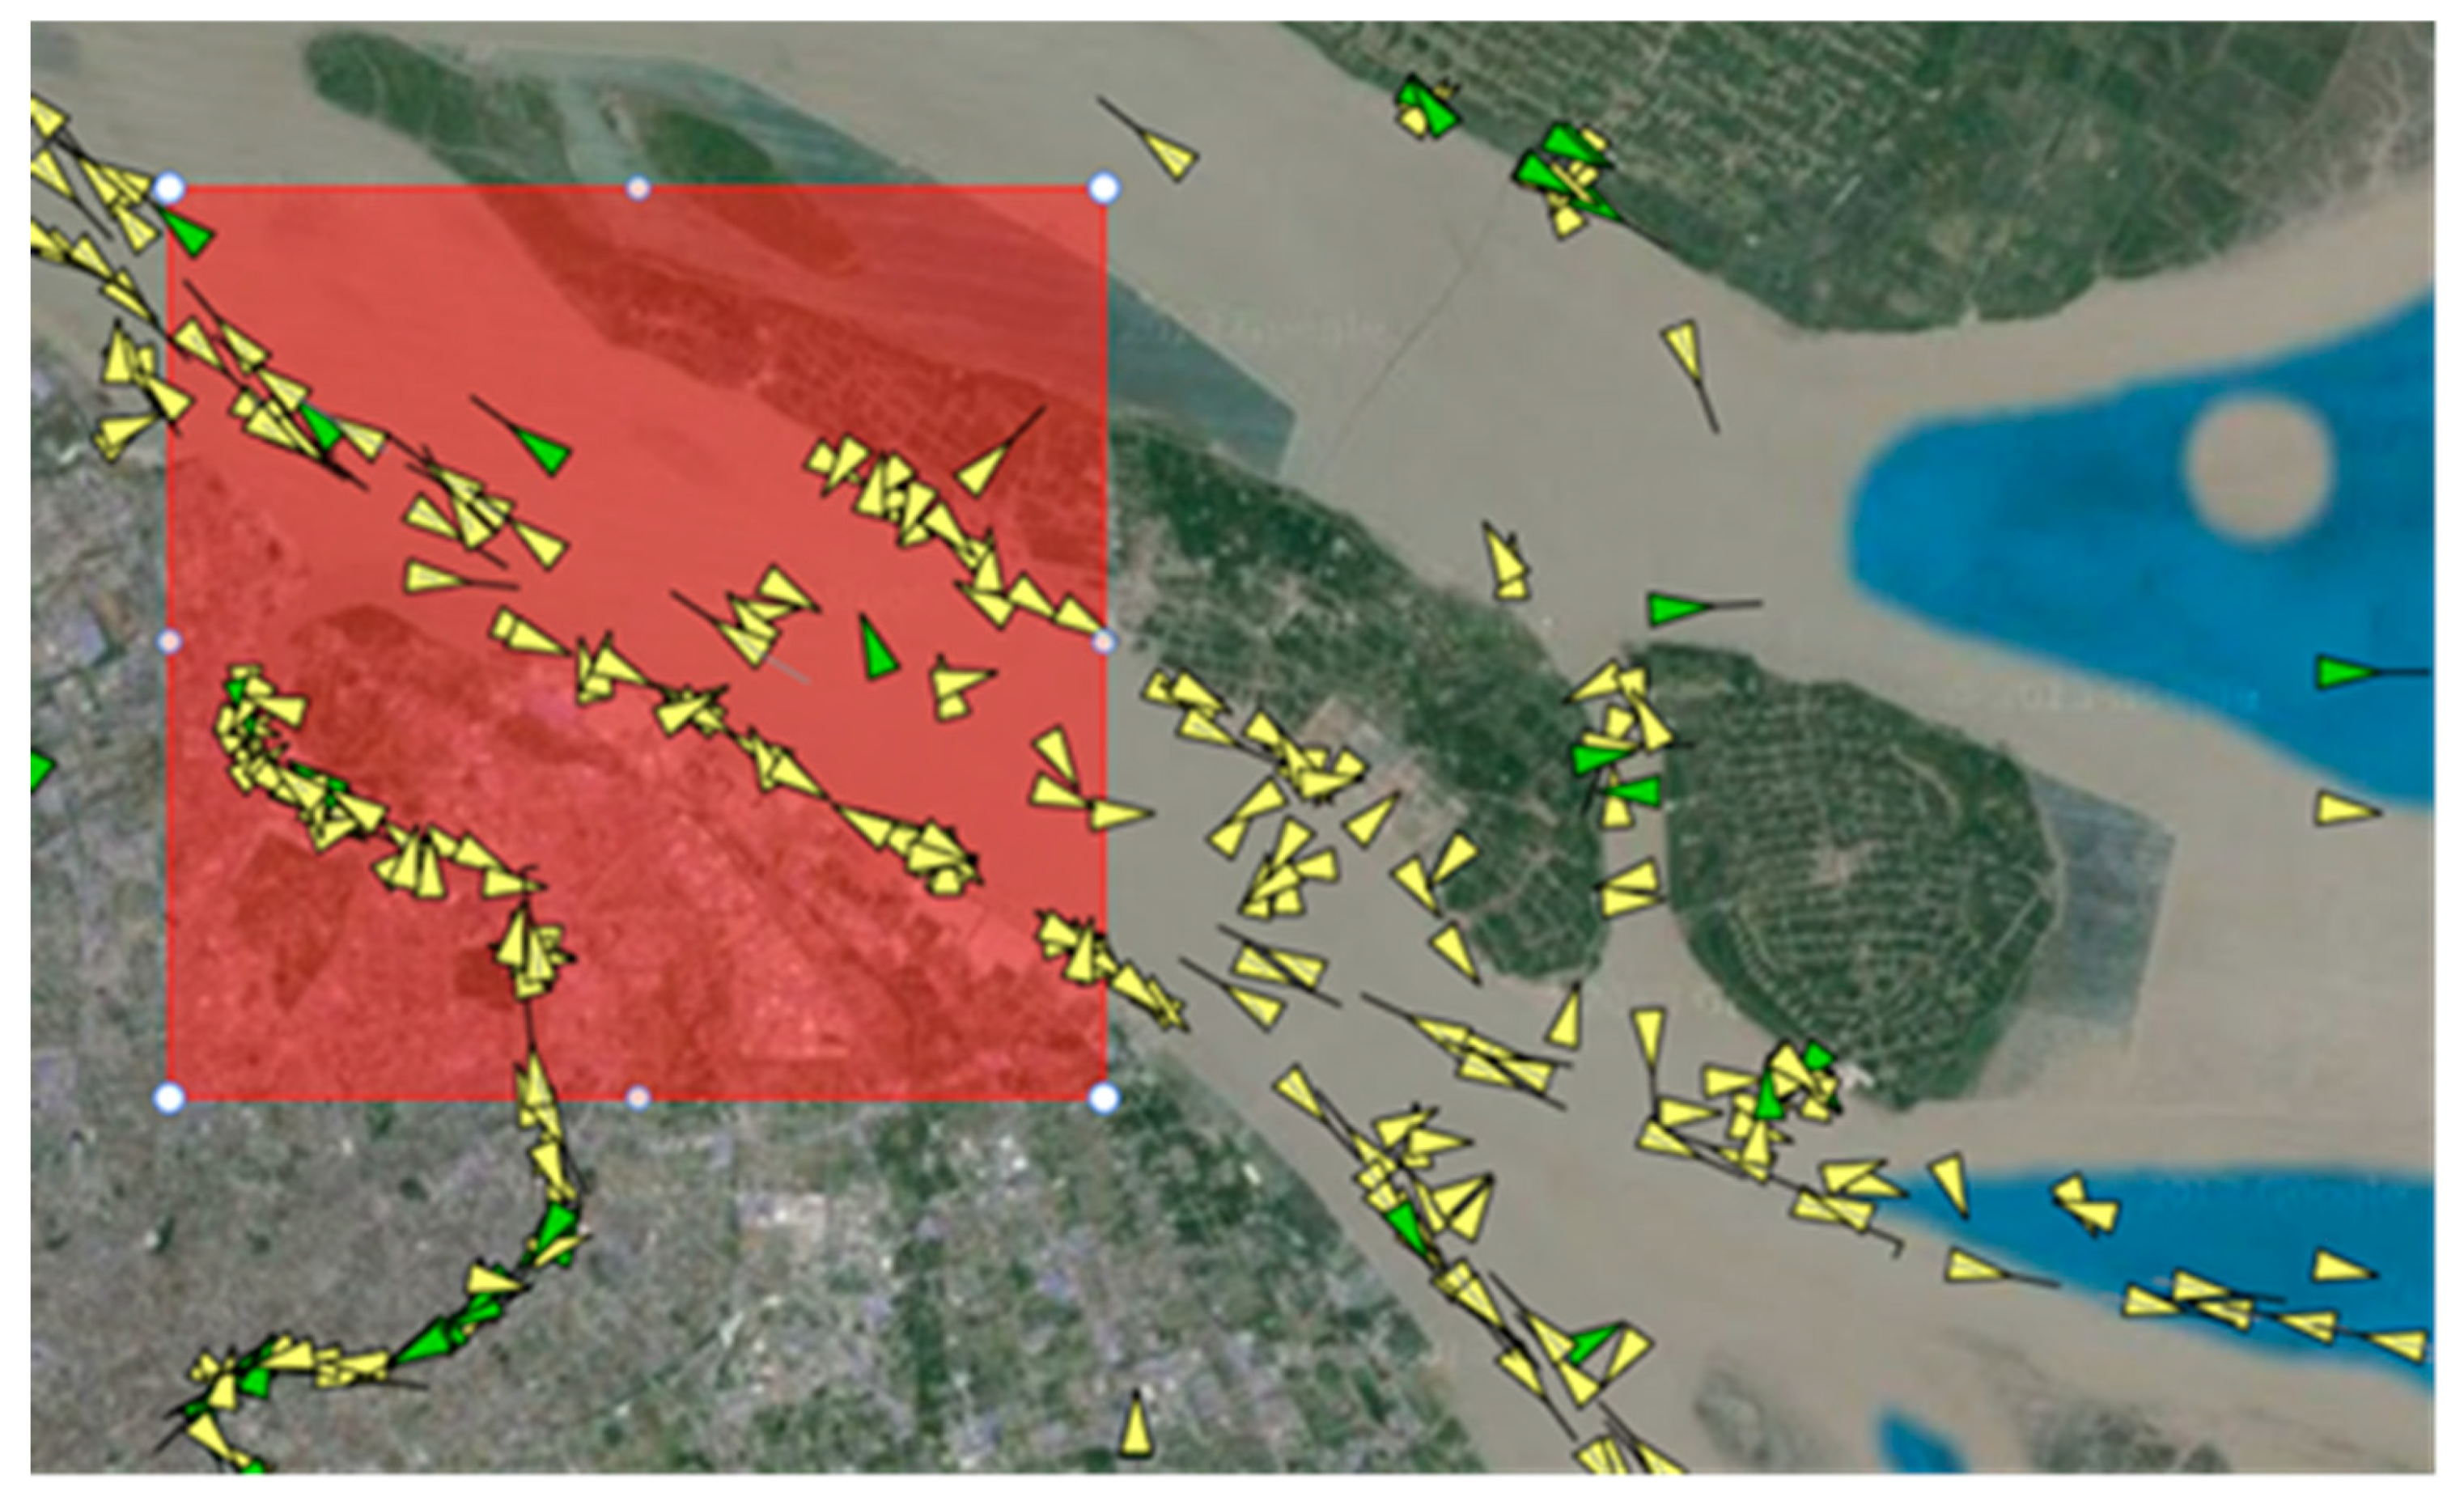
Figure 2.
Overall framework for identifying port arrivals and departures from historical or real-time trajectory data.
Figure 2.
Overall framework for identifying port arrivals and departures from historical or real-time trajectory data.
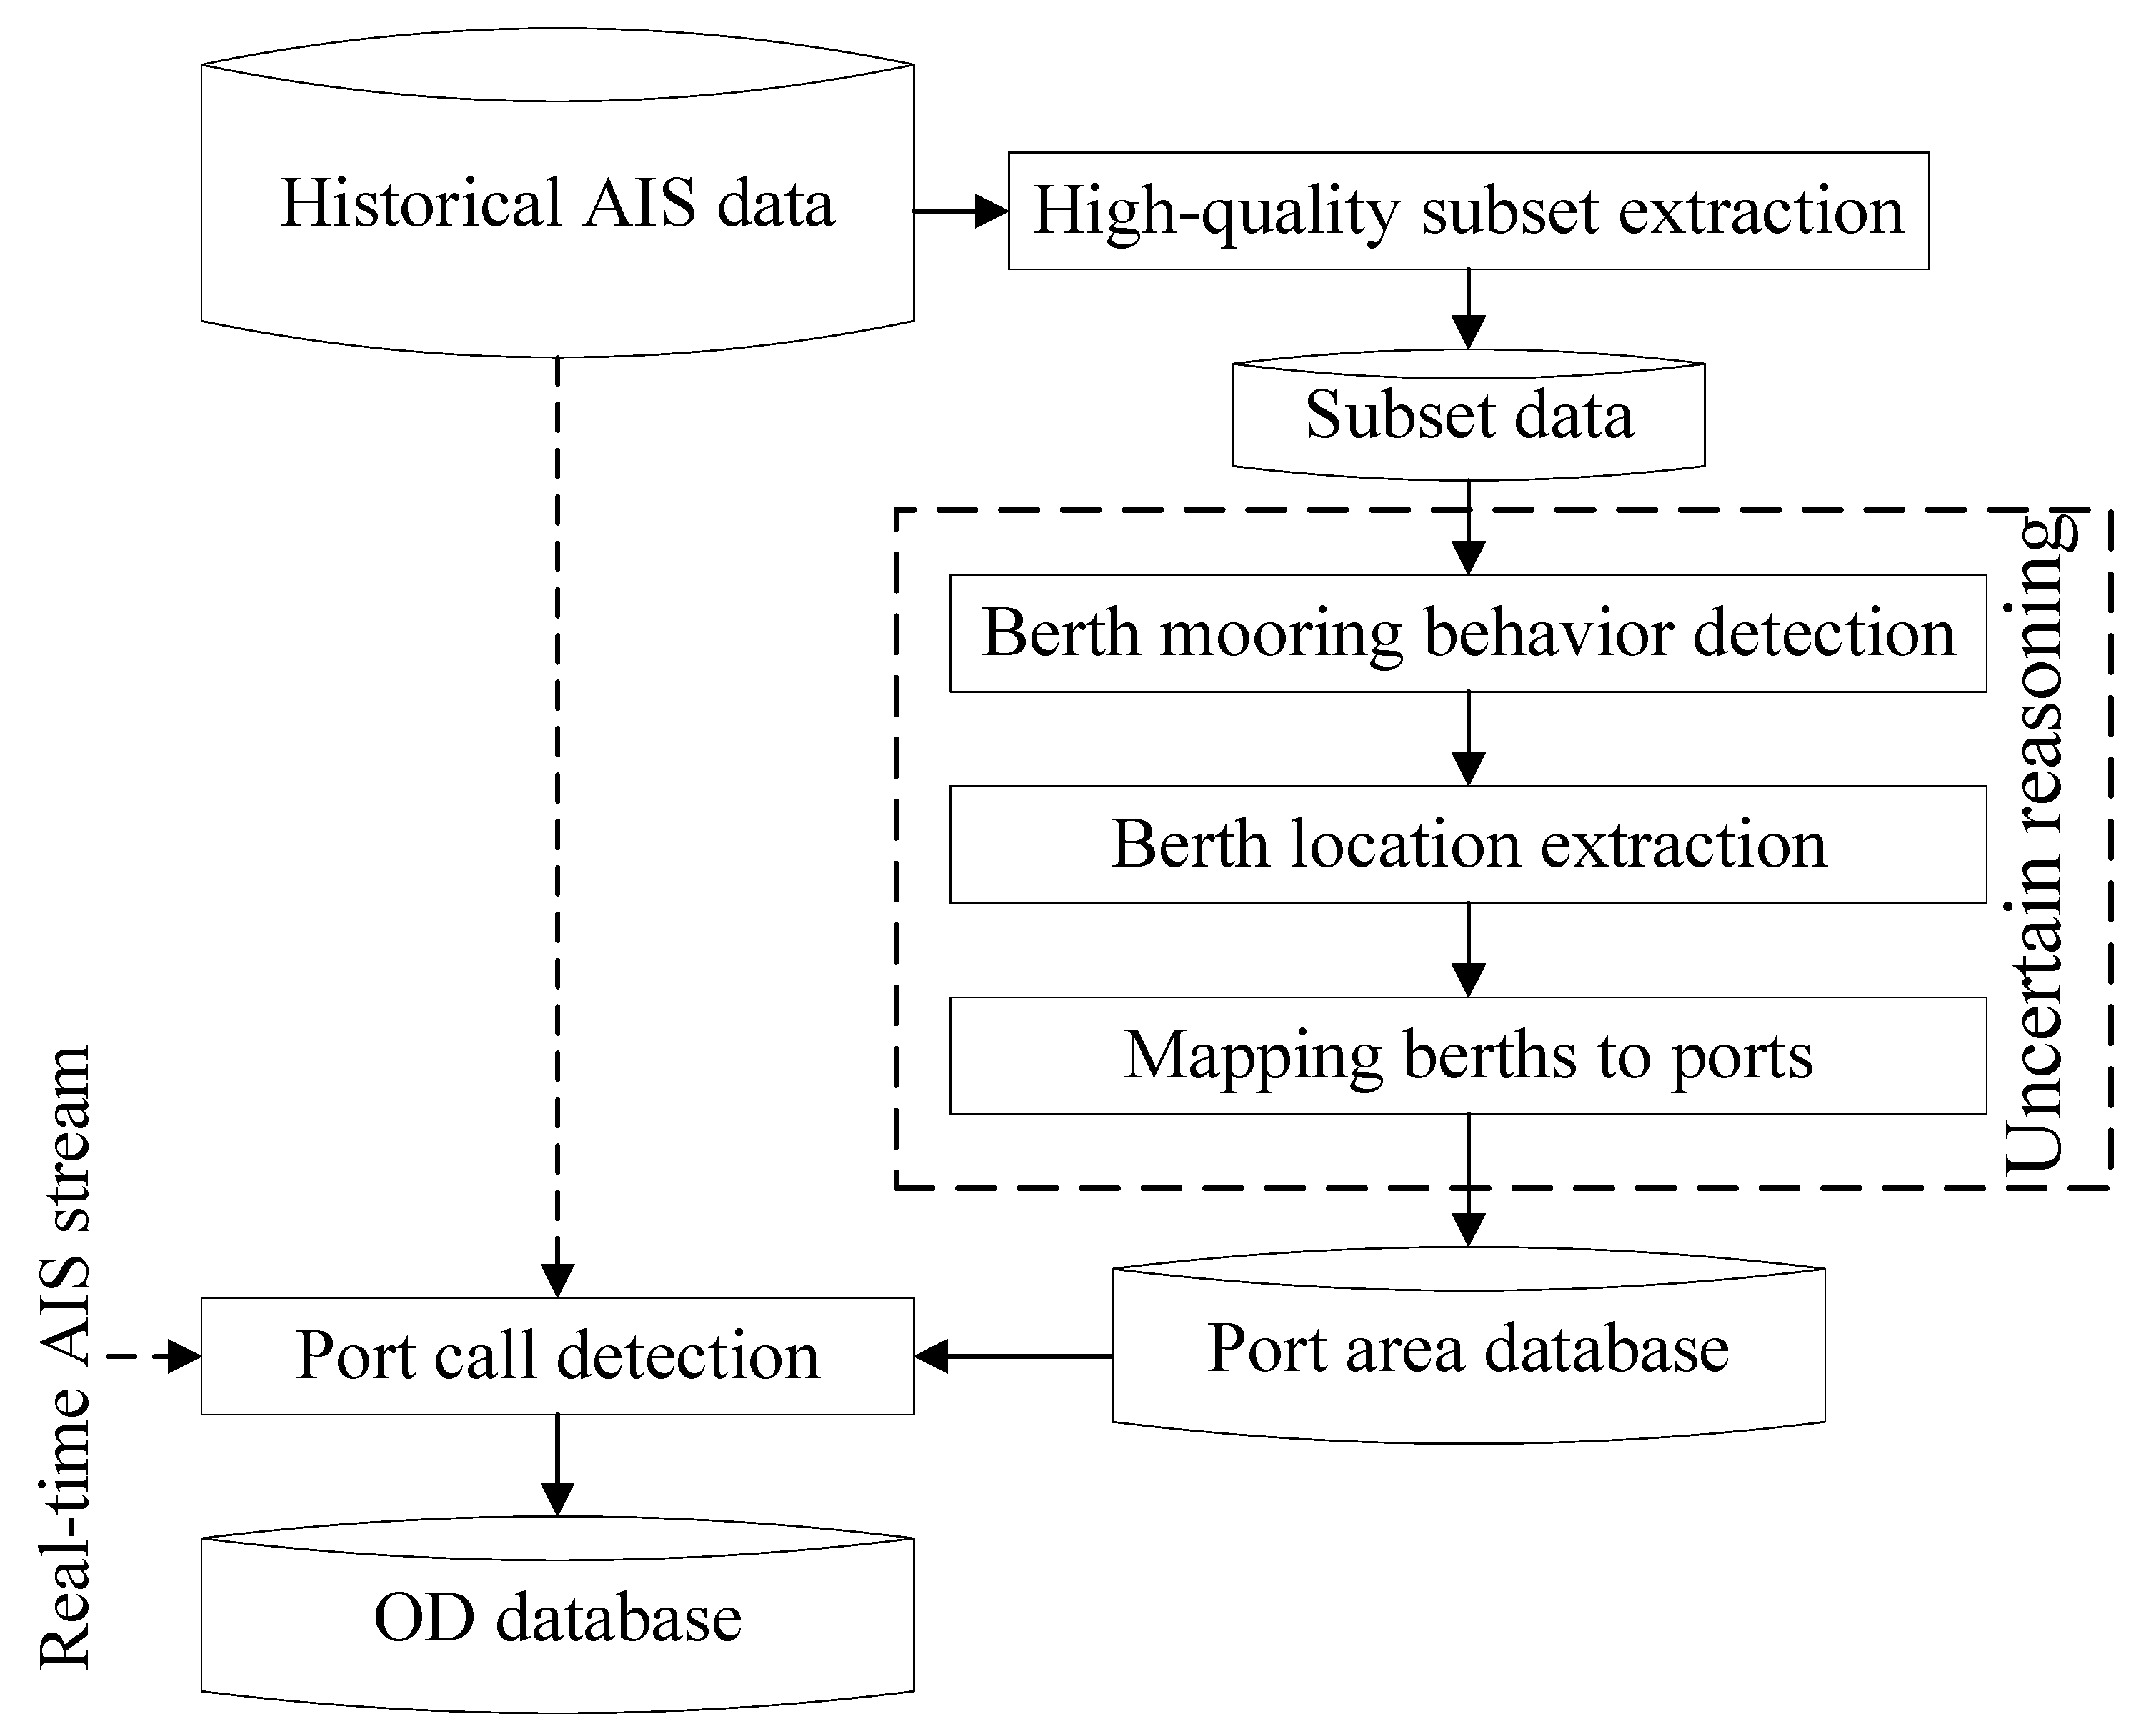
Figure 3.
Process of high-quality historical data extraction, which outputs candidate berth mooring trajectories.
Figure 3.
Process of high-quality historical data extraction, which outputs candidate berth mooring trajectories.

Figure 4.
(A) trajectory of an anchored ship. (B) trajectory of a ship approaching berth, mooring alongside berth and departing.
Figure 4.
(A) trajectory of an anchored ship. (B) trajectory of a ship approaching berth, mooring alongside berth and departing.
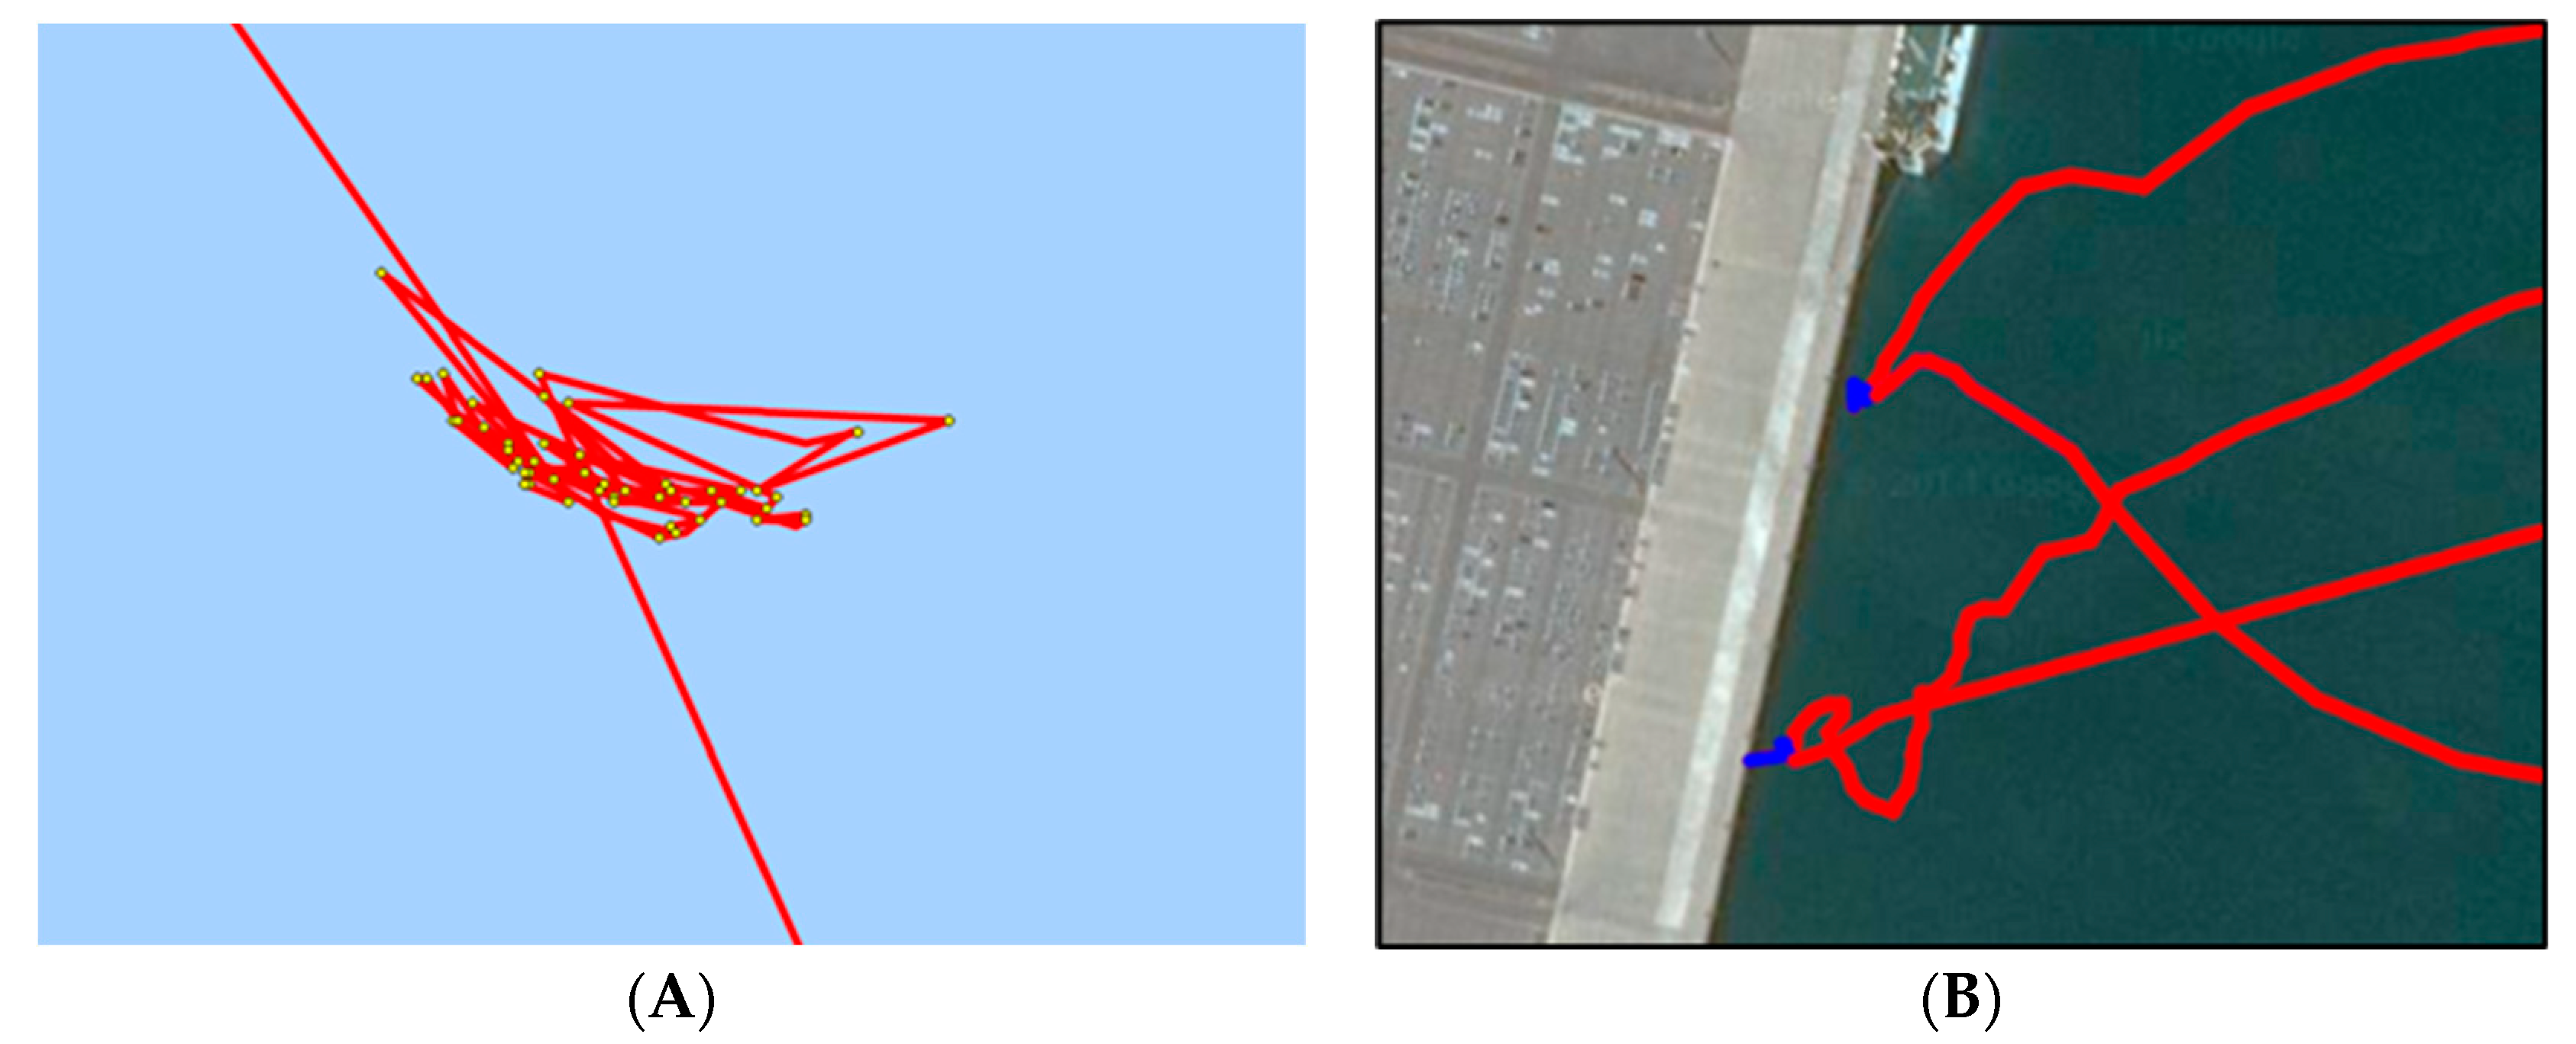
Figure 5.
(A) 76,000 UN/LOCODEs in the world. (B) Information for an example location—Kawaihae in Hawaii, US.
Figure 5.
(A) 76,000 UN/LOCODEs in the world. (B) Information for an example location—Kawaihae in Hawaii, US.

Figure 6.
Flowchart of port call detection with port area database. The map of a port is in the form of grid cell set.
Figure 6.
Flowchart of port call detection with port area database. The map of a port is in the form of grid cell set.
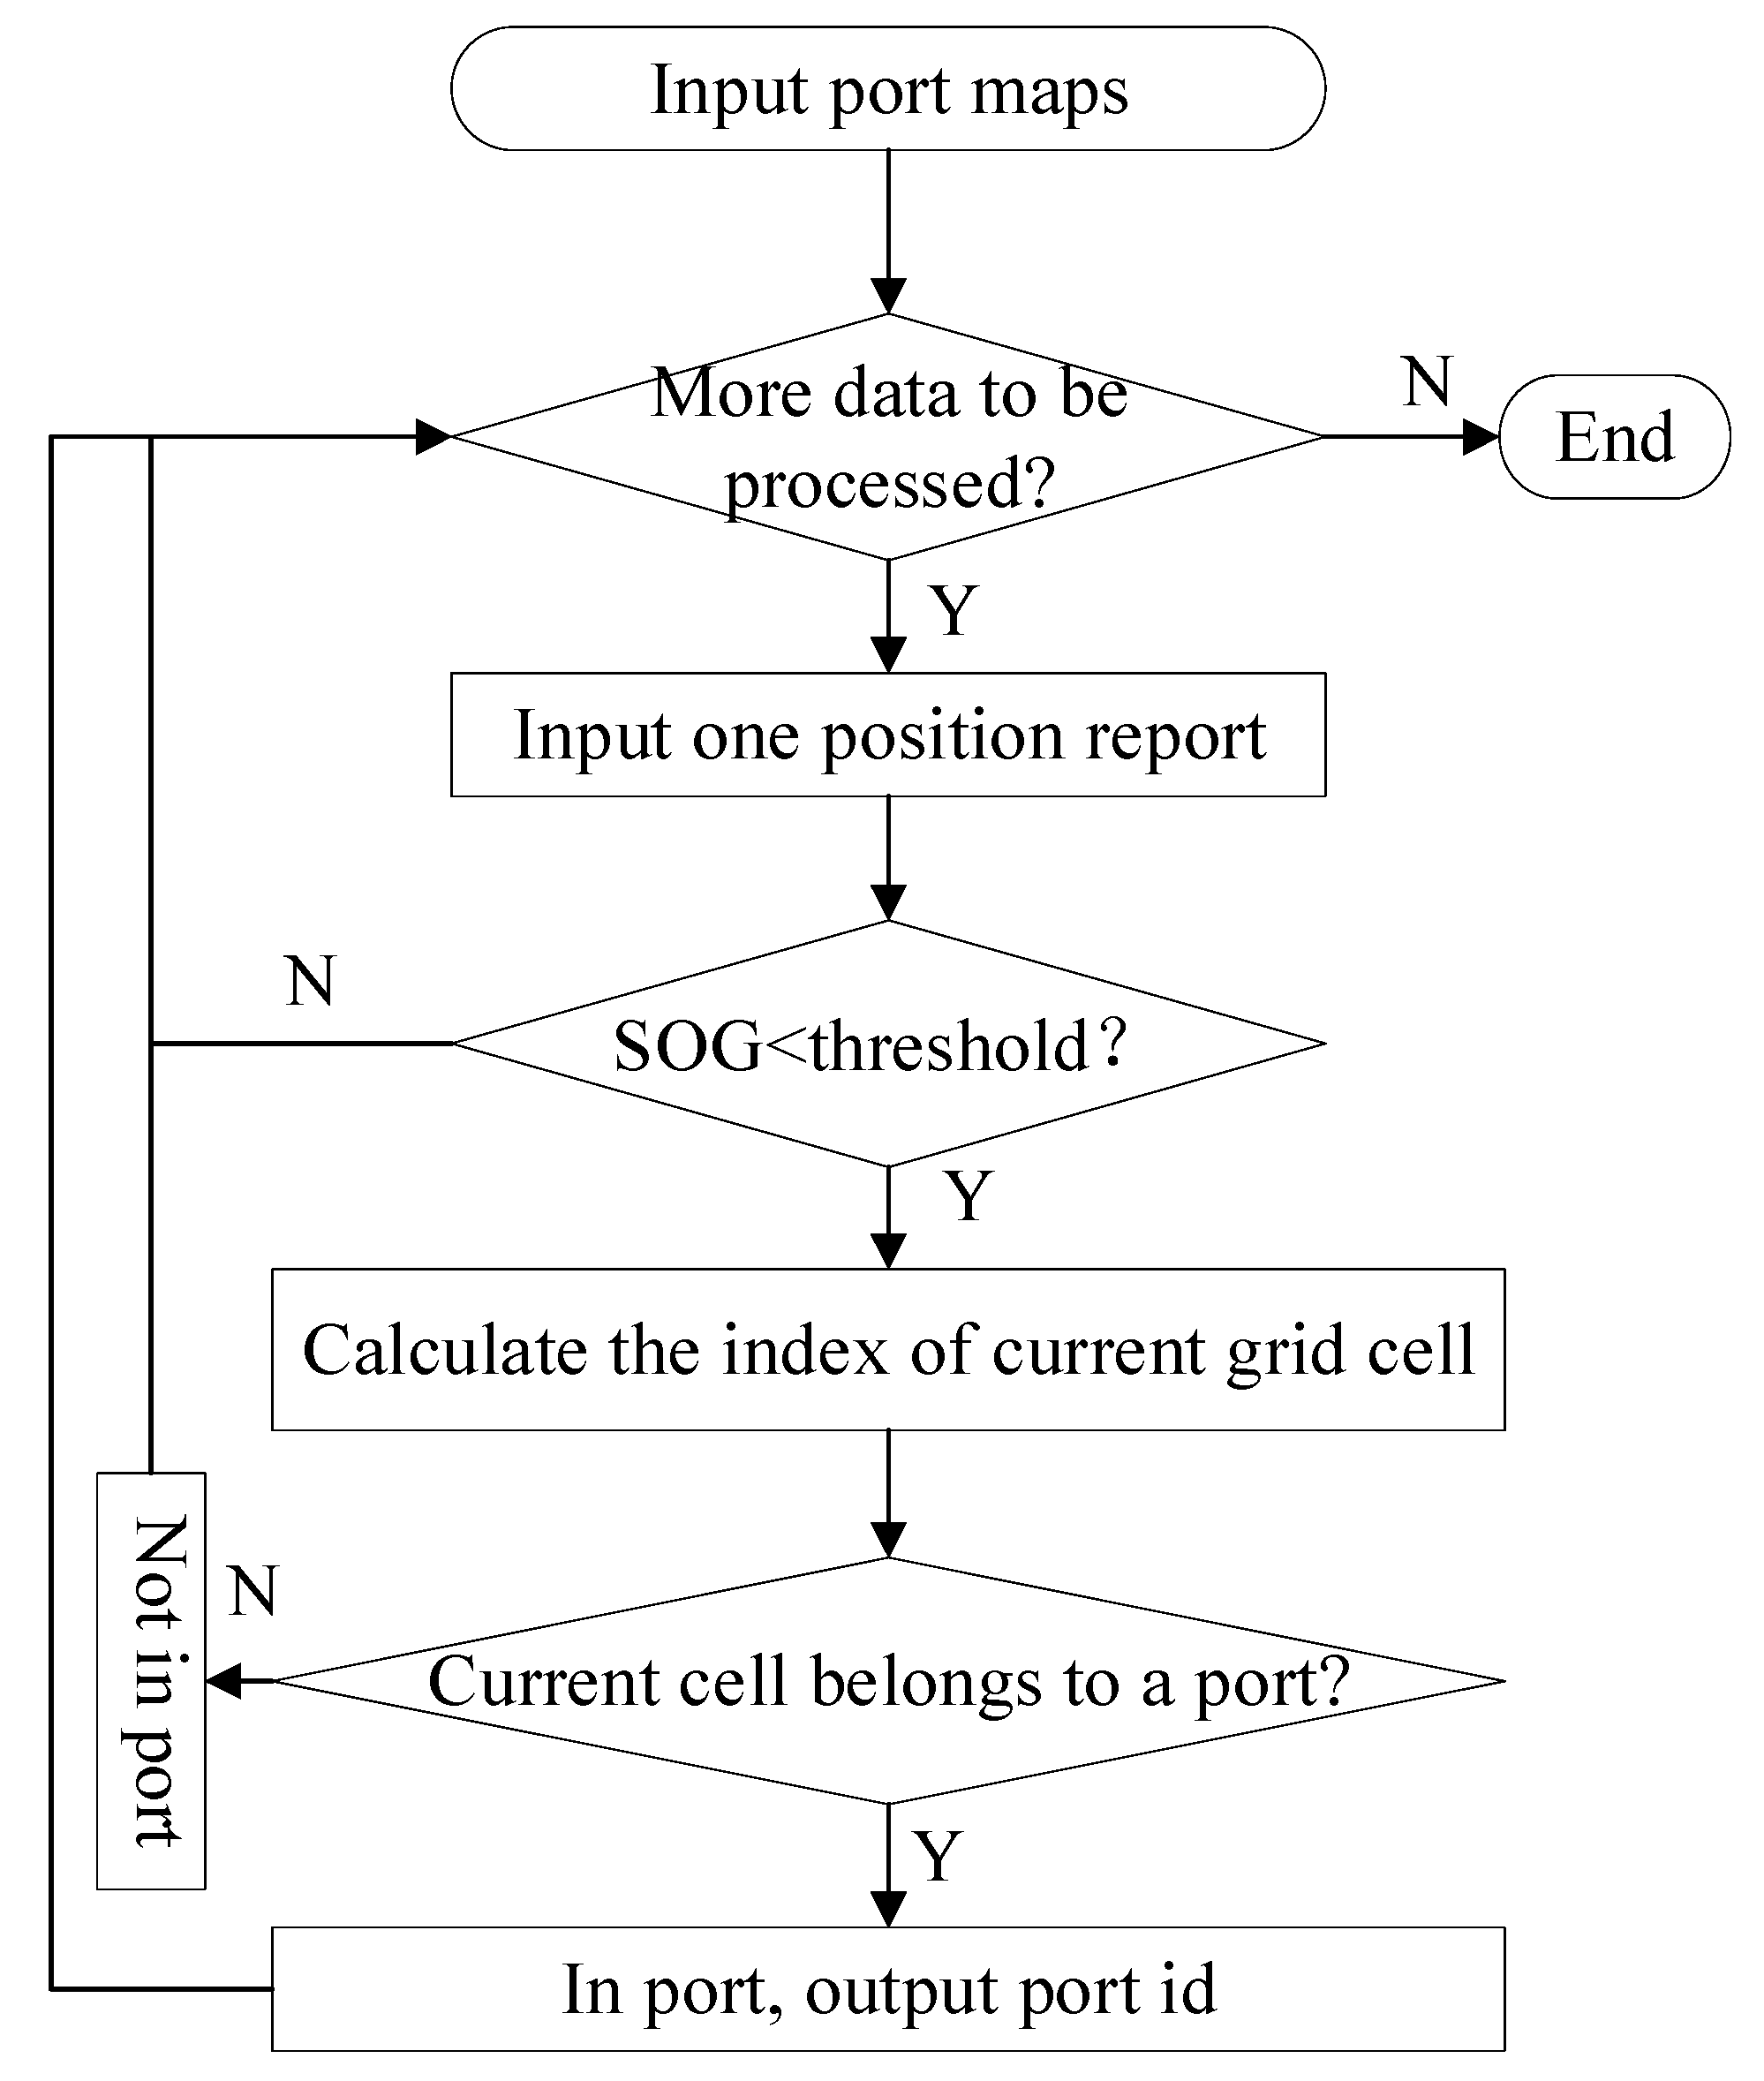
Figure 7.
(A) Berth grid cells/OD events detected along the lower reaches of Yangtze River. (B) Berth grid cells of ports discovered in US. Each red circle represents one grid cell corresponding to one or multiple historical port call events.
Figure 7.
(A) Berth grid cells/OD events detected along the lower reaches of Yangtze River. (B) Berth grid cells of ports discovered in US. Each red circle represents one grid cell corresponding to one or multiple historical port call events.
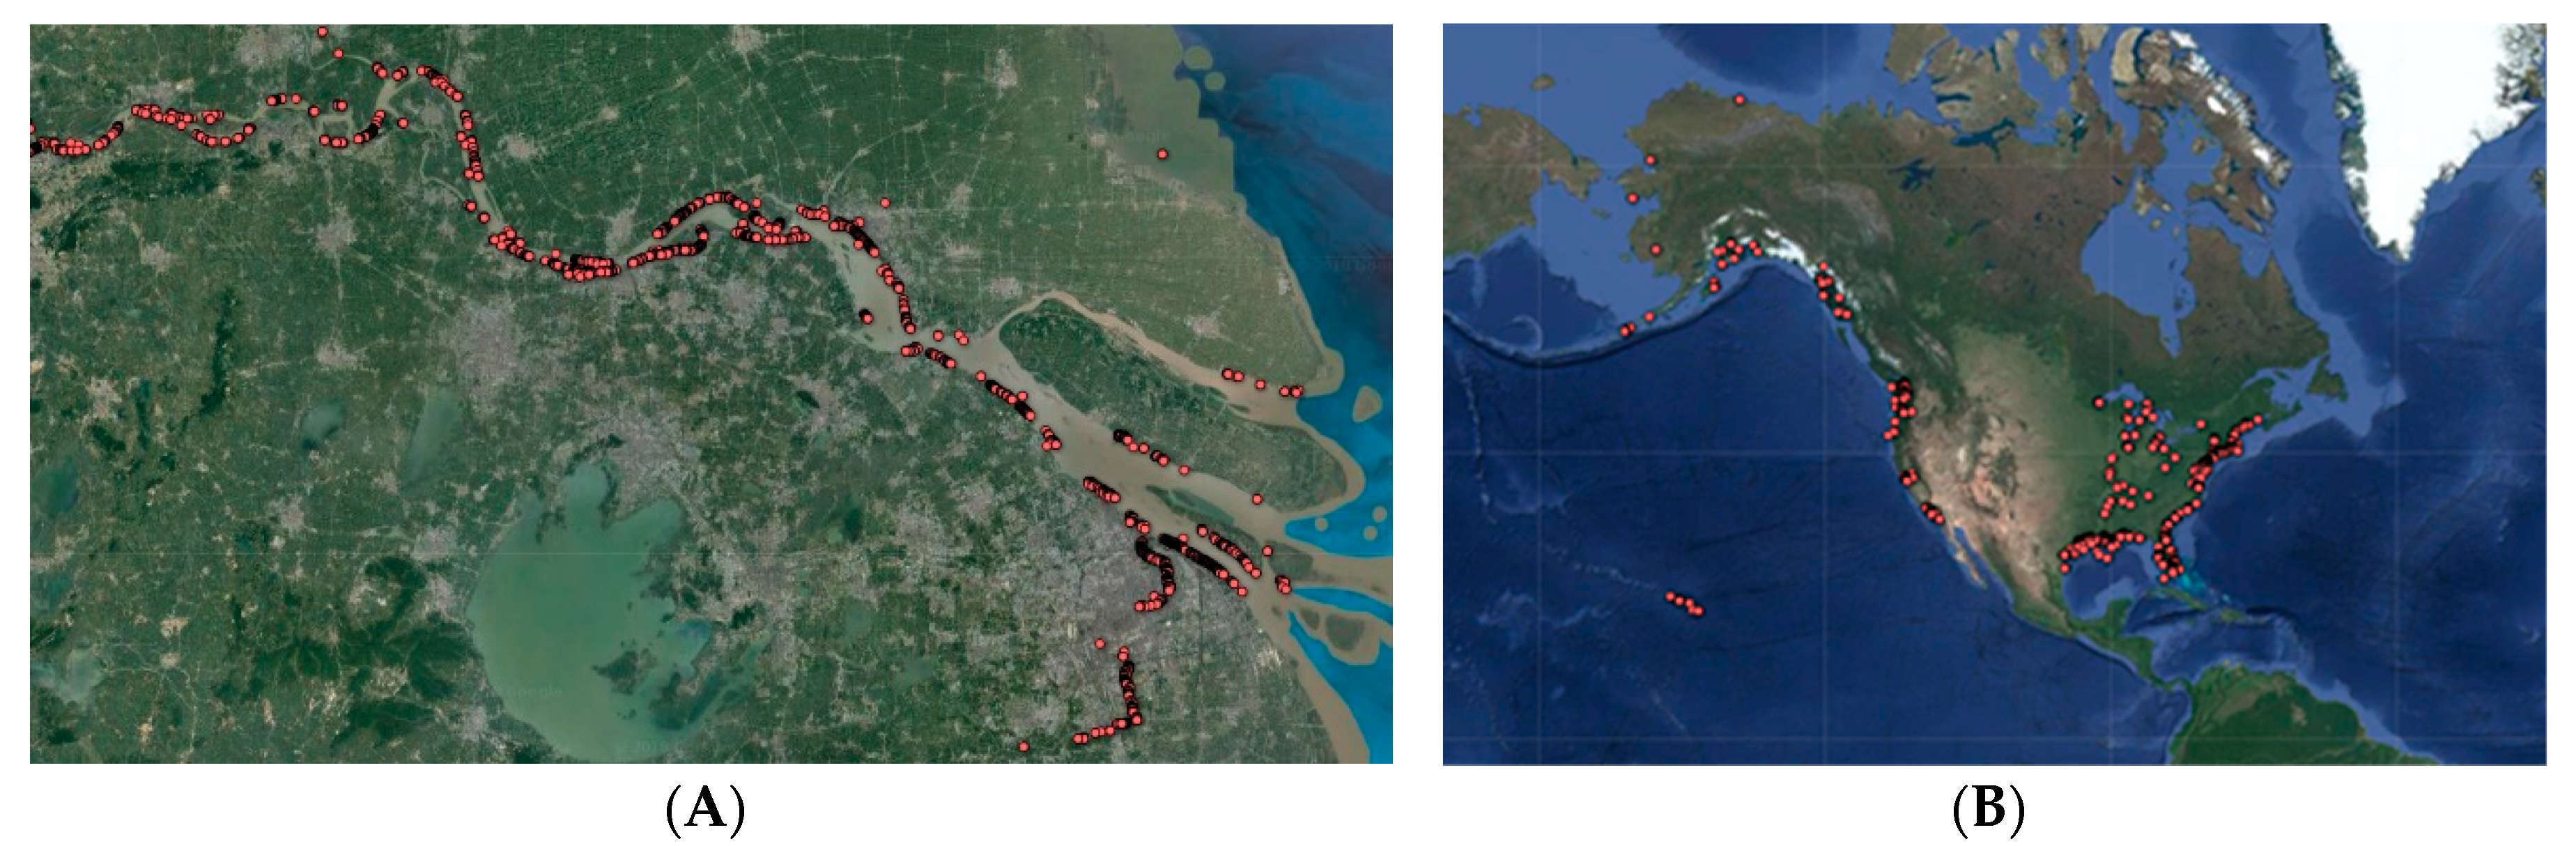
Figure 8.
Berth grid cells/OD events detected in the busiest part of the Tianjin Port. These cells also correspond to positions of historical port call events.
Figure 8.
Berth grid cells/OD events detected in the busiest part of the Tianjin Port. These cells also correspond to positions of historical port call events.

Figure 9.
Berth grid cells/OD events detected around Rotterdam.

Figure 10.
(A) Berths/OD events detected over the Strait of Gibraltar. (B) Berths/OD events in Bay of Gibraltar, which is in the upper right corner of the left figure.
Figure 10.
(A) Berths/OD events detected over the Strait of Gibraltar. (B) Berths/OD events in Bay of Gibraltar, which is in the upper right corner of the left figure.

Table 1.
Primary parameters in position reports (kinematic messages) of Automatic Identification Systems (AISs).
Table 1.
Primary parameters in position reports (kinematic messages) of Automatic Identification Systems (AISs).
| Parameter | Number of Bits | Description |
|---|---|---|
| User ID | 30 | Unique identifier such as MMSI (Maritime Mobile Service Identity) number |
| Navigational status | 4 | 1 = at anchor, …, 5 = moored, … Manually input and not reliable, available only in message types 1, 2, 3 and 27 |
| SOG | 10 | Speed over ground, output from GPS sensor |
| Longitude | 28 | Data output from GPS sensor |
| Latitude | 27 | Data output from GPS sensor |
| COG | 12 | Course over ground |
| True heading | 9 | Heading of the ship, output from electronic compass. Not available in message type 27. |
Table 2.
Primary parameters in World Port Index.
| Parameter | Example Value | Description |
|---|---|---|
| World_port_index_number | 59970 | Index number in the database |
| Main_port_name | SHANGHAI | Name of the port |
| Longitude | 121.50 | Longitude in degrees |
| Latitude | 31.22 | Latitude in degrees |
Table 3.
Annotations of variables in fuzzy rules.
| Variable | Meaning |
|---|---|
| extent | Extent (meters) of the areas a ship stayed in during the stop |
| time | Total time (seconds) the ship stayed stopped |
| speed | Time-weighted average SOG (knots) when the ship stopped |
| stdev(heading) | The standard deviation of the ship’s heading (degrees) |
| extent’ | Calculated extent according to AIS data |
| time’ | Calculated time according to AIS data |
| speed’ | Calculated speed according to AIS data |
| stdev(heading’) | Calculated stdev(heading) according to AIS data |
| count | Count of AIS kinematic records received during the stop |
| type | Type of the behavior |
Publisher’s Note: MDPI stays neutral with regard to jurisdictional claims in published maps and institutional affiliations. |
© 2020 by the authors. Licensee MDPI, Basel, Switzerland. This article is an open access article distributed under the terms and conditions of the Creative Commons Attribution (CC BY) license (http://creativecommons.org/licenses/by/4.0/).
Share and Cite
MDPI and ACS Style
Wu, L.; Xu, Y.; Wang, F. Identifying Port Calls of Ships by Uncertain Reasoning with Trajectory Data. ISPRS Int. J. Geo-Inf. 2020, 9, 756. https://doi.org/10.3390/ijgi9120756
AMA Style
Wu L, Xu Y, Wang F. Identifying Port Calls of Ships by Uncertain Reasoning with Trajectory Data. ISPRS International Journal of Geo-Information. 2020; 9(12):756. https://doi.org/10.3390/ijgi9120756
Chicago/Turabian StyleWu, Lin, Yongjun Xu, and Fei Wang. 2020. "Identifying Port Calls of Ships by Uncertain Reasoning with Trajectory Data" ISPRS International Journal of Geo-Information 9, no. 12: 756. https://doi.org/10.3390/ijgi9120756
Note that from the first issue of 2016, this journal uses article numbers instead of page numbers. See further details here.