1. Introduction
Many studies have underlined the problems regarding overcrowding of first aid facilities and the pressure on emergency rooms which result in weak assistance and care services, since the inappropriate use of emergency rooms by patients with non-serious conditions has a negative impact on the human resources and technologies and on the response times of both the emergency department (ED) and the hospital [
1], [
2] (p. 29).
In fact, high pressure creates unbalances, dysfunction, and difficulties in the possibility of emergency departments to rapidly guarantee a first accurate examination, followed by diagnostic images, laboratory tests, and consultation with a specialist [
3] (p. 1), [
4]. Therefore, emergency department overcrowding is connected with decreased patient safety, possible transmission of infectious disease, and also with a higher potential mortality rate, and it causes boarding and leads to staff burning out [
5] (p. 2), [
6] (p. 213).
Moreover, it has been evidenced that: “ED overcrowding could potentially affect anyone who suffers unexpected severe illness or injury requiring time-sensitive emergency treatment. Manifestations of ED overcrowding include: (1) “boarding” of patients in the ED; (2) increased risk of medical errors; (3) ambulance diversion; (4) threat to disaster preparedness; (5) eroding reliability of the emergency care system” [
7] (p. 403).
In other cases, it has been affirmed that: “ED overcrowding has multiple effects, including placing the patient at risk for poor outcome, prolonged pain and suffering of some patients, long patient waits, patient dissatisfaction, ambulance diversions in some cities, decreased physician productivity, increased frustration among medical staff, and violence” [
8] (p. 63).
Obviously, the causes of overcrowding can be different but synthetically they can be due to external and internal factors. Particularly: “the most cited causes were increasing patient acuity, aging population, high patient volume, hospital bed shortage or closure, and workforce shortage. Internal factors such as poor operations and hospital processes like consultant delays, laboratory delays, inadequate examination spaces, and avoiding hospitalization through extensive therapy in the ED may be partially responsible. Less amenable external factors include government regulations, managed care, reimbursement decreases, access barrier to primary care, increased number of indigent or uninsured patients using ED as their primary source of care, poor coordination between home care services and primary care physicians, increasing prevalence of (… certain diseases), substance abuse and psychiatric disease” [
9] (p. 131).
Generally, conditions of notable overcrowding in emergency rooms have been defined as a global problem and sometimes identified as a national crisis [
3] (p. 1), [
10]. It can be considered as a serious local manifestation of a widespread systemic disease that requires a common task for emergency physicians, regular doctors, hospitals, local health centers, institutional structures as a whole because the aspects to face are many, and to mitigate the problem a shared line of coordinated actions is required [
11] (p. 174).
The emergency department is thus a crucial component of the healthcare safety net, both in ordinary and extraordinary situations and the overcrowding in the “treatment areas threatens public health by compromising patient safety and jeopardizing the reliability of the entire (…) emergency care system” [
7] (p. 402).
In ordinary conditions, the overcrowding determines many dysfunctions of regular attendance and first check and often creates dangerous situations where people who have not serious needs risk being affected by infectious disease, while people who require immediate aid, placed in limited spaces and sometimes without appropriate assistance, see a rise in the possibility of a worsening of their precarious health. Sometimes people improperly use emergency departments as an alternative to their regular doctor (GP) or local healthcare unit and this widespread habit contributes to exacerbating the situation.
In extraordinary situations, the overcrowding also due to anxiety and panic is likely to exasperate all the balances and essential care services, increasing the contagion and lethality of the diseases and creating a waterfall of problems and malfunctions. An emblematic example of this has been provided by the impressive widespread crisis due to SARS-CoV-2, responsible for COVID-19, which coming from Wuhan City (Hubei province, China) has created a worldwide pandemic status and has placed the healthcare systems under unprecedented stress. In this case, the panic and uncertainty has often driven people to overcrowded emergency rooms for testing and swabs (i.e., cell and fluid sampling from nose and throat to identify specific genes for the SARS-CoV-2 virus that causes COVID-19), sometimes also with very mild symptoms, resulting in notable repercussions on an already dramatic situation, with the risk of amplifying the diffusion of the virus.
In fact, some studies have highlighted that the risk of infection increases while patients are waiting for testing in overcrowded waiting rooms [
12] (p. 74) and have evidenced the importance of validating systems, parameters, and algorithms to rapidly identify possible positives and discriminate between patients testing positive and those testing negative [
13] in order to reduce the risk of collapse.
In order to face the myriad of causes and the multiple factors that create this series of problems, “10 putative solutions with commentary on actions at our institution to counter the problem” were put forward considering differences between hospitals of different geographic contexts, as well as among county, teaching, and private hospitals [
14]: expand hospital capacity; stop regulating hospitals to the extreme; provide care only to patients with emergencies; provide alternatives for primary care of the uninsured; stop boarding admitted patients in the emergency department; use evidence-based guidelines to address imaging overutilization; change admission patterns; expand the role of ancillary ED staff and hallway care; call the nurse first; prevent disease and injury. Albeit still to be contextualized and adapted to the realities of the different countries, similar proposals of actions provide input to think proactively about the possible measures which can be adopted and refined to respond to local needs.
There are various contributions which have shown and analyzed specific strategies potentially able to reduce delay and overcrowding in emergency rooms [
3,
15,
16,
17] and other works have underlined that the reduction of the access block in the emergency room would determine an improvement in the hospital inpatient flow and a reduction of the waiting time [
18] (p. 351), that are sometimes vital.
From the point of view of applied research which is able to support a territorial screening, in this contribution, we focus the attention on the situation recorded at the emergency room of the Hospital Policlinico Umberto I in Rome (Italy), with particular attention to 2011, selected as reference year in the time series of data collected since it was the year of the last census, and it makes it possible to calculate specific supporting indexes that also consider official population data. Through GIS applications and retrospective spatial analyses, we have set out to identify the areas of greatest provenance of inappropriate attendance requests, that it is to say, code white in terms of triage: triage process is applied internationally to prioritize the treatment of patients by the severity of their conditions when they enter the ED. At the time of the study, the level of the patient priority was identified by a color: red (very critical), yellow (moderately critical), green (not very critical), and white (not critical).
Working in a GIS environment and using specific functions, first of all for geocoding, and after having conducted manual and automatic data cleaning and data quality long operations, we tested an experimental and replicable model aimed at giving a close-up geographical-sanitary look at the situation. This model has the aim of leading up to an improvement of the situation and a more efficient functioning of the emergency room through the identification, thanks to a multiplicity of ad hoc GIS elaborations, of the territorial sectors in Rome which contribute to amplifying the Policlinico Umberto I emergency room overcrowding; the promotion of a greater and better awareness and knowledge of the services available on the territory; the increased awareness of a closer relationship between patient and GP or local healthcare unit.
2. A Public Health Framework
As mentioned above, ED overcrowding is considered to be one of the key factors that impedes the delivery of high-quality emergency care, with a negative impact on patients’ health.
In the Lazio region (the region of Policlinico Umberto I in Rome), it has been estimated that the increase in ED waiting time is associated with a higher risk of mortality [
19]. However, when dealing with issues of health organization, it is essential to analyze also the resulting costs: it is well established that ED overcrowding increases health care costs [
20] and that the largest share of ED costs is due to non-urgent patients’ assistance [
21].
From an economic point of view, ED activity is a labor-intense activity where the main input in ED activity is human work (doctors, nurses, etc.), in other terms, the labor input exceeds capital and technological input and plays a major role in influencing the total costs incurred by EDs and their production capacity cannot be increased without expenditure on the workforce, which is expensive [
21]. However, too many patients are not urgent cases and use the facility as a substitute for a general practitioner.
Trying to identify the causes of ED overcrowding to find appropriate solutions it is fundamental to understand at what level the obstacle to patient flow in ED is generated.
There are two main determinants of the overcrowding:
- -
“Crowding” or “Overcrowding” (meaning both as a turnout and as a stay of patients inside for ED activities). In practice, this term refers to the level of ED crowding generated by the patients who gradually access it and by those who are going through the therapeutic diagnostic process (input and throughput);
- -
“Boarding”: this term derived from air transport is intended to indicate the phenomenon of the accumulation in ED of patients who have already completed the care pathway in ED but, for various reasons cannot leave it (output) [
22].
The government of the Lazio region has issued a recent decree entitled “Regional plan for the management of overcrowding in the Emergency Room” in which the problem is deeply analyzed [
23].
The report on hospitalization activities for acute patients in Lazio Hospitals of 2018 shows that the accesses in ED were 1,928,168, of which 3.1% in red triage code, 27% in yellow triage code, 65.2% in green triage code, 4.3% in white triage code, and 0.3% not performed. The access mode was 15.6% with NHS ambulance, 78.8% autonomously, and 5.6% with other modes. Yellow code patients waited more than 15 min for the examination in 63.3% of cases, while 40% of code green patients waited more than 60 min [
24]. Given these data on ED accesses, the regional plan emphasizes that overcrowding in the Lazio region is mainly due to the “boarding” effect, highlighting that overcrowding is responsible for the “ambulance block” phenomenon (i.e., stopping the ambulance for more than 30 min), which affects the quality of extra-hospital care and requires additional ambulance shifts and additional financial commitment. Most importantly, patient care is worsened by boarding. Evidence-based research demonstrates that boarding results in the following: delays in care; ambulance diversion; increased hospital lengths of stay; medical errors; increased patient mortality; financial losses to hospital and physician; medical negligence claims [
25].
The literature on the causes of overcrowding in emergency rooms is extensive and has clarified many aspects. Overcrowding is mainly due to causes related to patient characteristics such as age and lifestyle, or to causes related to emergency service delivery such as emergency patient flow and emergency care (e.g., delay in discharging admitted patients and long waiting of emergency patients for diagnostic test results); emergency department staff related causes (e.g., wrong diagnosis, delay of consultants, etc.); premises and materials of ED-related factors (e.g., shortage of beds for admitting emergency patients) [
26]. Much less extensive is the literature on solutions to overcrowding that, however, can be classified into two main groups: organization or management level solutions and operational level solutions. The latter include staffing and motivation, operational level strategies and tactics, service delivery process, and other services and premises [
26]. A recent systematic review of the literature has gathered both scientific evidence on causes and scientific evidence on solutions [
27]. In this systematic review, Morley et al. [
27] (p. 36) conclude that causes of ED overcrowding are well defined, while there is a mismatch between causes and solutions: “more recent studies investigating the effects of timed disposition targets and extending GP opening hours have provided some promising results and warrant further investigation and evaluation, with a particular focus on which interventions worked in which contexts, relative to identified local causes of crowding. A significant finding of this review is the growing body of evidence suggesting elderly patients with complex, multi-morbid conditions represent an increasingly important driver of ED crowding”.
In fact, the epidemiological revolution (greater burden of chronic degenerative diseases and a simultaneous decrease in infectious diseases) mainly resulting from the demographic revolution (increase in life expectancy) has led to an increase in frail elderly people who need continuous prevention and treatment at home. In this context, the geolocation of accesses to EDs can be a very helpful system to identify the areas that generate the most access and where it is necessary to implement territorial health services and to guarantee citizens assistance in the most suitable setting.
3. Materials and Methods
3.1. Source of the Data
The GIPSE information system was implemented in the Lazio region with resolution No. 7628 of 22 December 1998 of the regional council (
http://www.regione.lazio.it/binary/rl_sistemi_informativi_sanitari/tbl_documenti/SIS_DD_7628_22_12_1998.pdf), as a part of the SIES (Sistema Informativo sull’Emergenza Sanitaria) information flow, which produces data on the activities of the EAD/ER network of the Lazio region, guarantees the quality of the data and makes it possible to study the appropriateness of the healthcare services provided. The GIPSE information system collects the identifying and personal data of the patient, including their fiscal code, age, level of education, professional status, domicile, and data on the access to the EAD/PS, including access priority (triage), the principal problem, the outpatient visit (medical or surgical), the procedures carried out, the treatment received, the diagnoses, and the outcome.
3.2. Building-Up of the Dataset
Data on the accesses carried out at the EAD of the Policlinico Umberto I of Rome were extracted for the following variables and include: gender; age; municipality of domicile; municipality of residence, residential address; current address; code assigned at triage. However, as this study was an explorative attempt to utilize this data for geocoding, the analysis was focused on 2011 to allow for a manageable amount of data. Data were extracted via GIPSE in an Excel (XLS) file for each year. The 2011 CSV file was then imported in STATA 15.1 (StataCorp LLC, 4905 Lakeway Drive, College Station, TX, USA) with the built-in importer, using the first row as the variable name and a dataset was created using the proprietary STATA format (DTA file).
3.3. Consolidation of the Dataset
The DTA format was used in STATA 15.1 to proceed with the preparation of the dataset for its utilization in the GIS environment. Overall, 137,290 accesses were retrieved for 2011. The selection of relevant records (i.e., the accesses carried out by people actually living in the municipality of Rome) was performed firstly through the variable of the municipality of domicile and in the second instance through the variable of the municipality of residence (100,794 records).
3.4. Data Cleaning
Given that the residential and domicile address variables are put into the GIPSE system by hand by the triage operator, these data are prone to insertion bias, and thus the records were thoroughly manually reviewed to search for errors and inconsistencies.
The most frequent error found was the missing house number, more commonly in the residential address. If the address in the domicile variable address had the same street name and a proper house number, we assumed that the addresses were the same and therefore the numbers were corrected in the missing ones, otherwise the record was left untouched.
Interestingly, we found several records filled in with not an actual address in the residential and domicile variables, but indeed with various stereotyped formulas that indicate some particular places or groups of people. In particular, the manual review showed 22 types of stereotyped formulas (e.g., homeless persons, tourists, detention facilities, nomad camps, hostels, and fictitious addresses). All the stereotyped formulas were manually homogenized in the spelling, as they appeared in various forms in the database (e.g., police stations were reported as “Stazione di polizia”, “Stazione forze dell’ordine”, and “sfo”). These formulas were used for the following analysis, because of the lack of an effective geospatial correspondence or because they identify populations with possible specific use of the health services different from the ones of the general population.
The cleaned database was finally exported in a format compatible with the GIS environment, i.e., a comma separate values (CSV) file.
3.5. The Use of Python in the Calculation of the Addresses to Be Geocoded
Once the GIPSE table was cleaned of most of the errors, a second round of quality control was then performed in a GIS environment, in order to prepare the data for the next geocoding operation. Basically, geocoding “is the act of turning an address in a point location” [
28] (p. 322), an operation that increases the set of available GIS data sources by the conversion of non-spatial data like an address in a point feature class, such as those that come from census surveys, customer registry, and so on. This operation involves three main components: a reference data—the feature class that represents the features to be searched in the study area, usually streets or points of interest, an address locator—the tool used to convert the addresses in points, and a list of input addresses to be converted.
The address locator requirements depend on its style, a set of rules used to determine the schema of the reference data, that is to say, the set of fields used to store each of the address elements (e.g., street names and numbers, postcode, municipality name, etc.), as well as to define the format of the input address to geocode, which can be stored both in a single field or in multiple ones [
29] (pp. 276–277). With regard to the lack of structure of the addresses stored in the GIPSE table, the geocoding operation was so performed using the ESRI “ArcGIS World Geocoding Service”, a “flexible” web-based address locator that supports different languages with worldwide coverage (
https://doc.arcgis.com/en/arcgis-online/reference/geocode-coverage.htm), a feature that becomes important when the address location is uncertain.
The GIPSE information system stored two types of addresses for each patient, the domicile and the residence, each one composed of two fields: one for the “large scale” elements, such as the street name and its street number, and another one for the city name. Assuming the domicile address to be more accurate, the second round of quality control was aimed to verify the existence of these values in each record, search for the best one, and write it in a separate field.
Due to the number of rows (100,794), a Python expression was hence used to reduce the time of calculation and prevent the risk of typing errors, a practice that is worthwhile for many other reasons such as [
30] (p. 257):
- -
Documenting the steps of a complex analysis by writing down its components (inputs, geoprocessing tools, and their parameters);
- -
Sharing the code with an audience in search of possible issues that can be addressed to optimize the analysis workflow;
- -
Repeat the process with different variables without the need to start again.
As the primary scripting language of the ArcGIS Platform (10.5.1), as well as it is for a FOSS (Free and Open Source Software) software like QGIS, Python (2.7) can be used in ArcGIS for desktop to execute the commands from a separate window instead of browsing the interface searching for the relative buttons. Moreover, the Python scripts can be used to create complex sequences of geoprocessing operations chained together with the countless Python functions. As an FOSS programming language [
31] (pp. 1–2), Python can also be used with many operating systems (Windows, macOS, and Linux) and applications (Excel, AutoCAD, and SQL Server), whose features can be executed directly from the scripts.
Thus, the GIPSE table was imported into an ESRI File geodatabase, in order to convert it into an editable format and to add the field to which the Python expression output values were to be written. Using a database cursor, the expression checked the address values existence for each table row: if one of the domicile values was missing, the residence one was written by the cursor in the new field, while if both the domicile and residence values were missing, the cursor would write the fake address “Madison Square Garden, New York City”, in order to quickly identify the misplaced points later on the map by gathering them in one place. At the end of the geocoding operation, the output point feature class was then added to a map for a final review, using the ESRI World Topographic Map as the base map layer.
Apart from the known points located in the city of New York, there were some other visible misplacements: for instance, some were in Africa, because the country of origin was the only information recorded for some of the homeless patients (e.g., “sfd, GAMBIA”, where “sfd” is the acronym of “Senza Fissa Dimora”, which means a homeless person). Some other addresses were misplaced in the USA due to the similarity with American addresses, such as “via Tivoli 11, MENTANA”, which is a street called Tivoli in the Mentana municipality near Rome that was mismatched with “Tivoli Way, Missoula”, in the American state of Montana.
The points were finally intersected with a layer representing the boundary of the municipality of Rome, in order to delete the misplaced ones inverting the selection of the Select by location tool: thus, 3979 were deleted from the original 100,794 points, resulting in a feature class of 96,815 points, or 96% of the input (the feature class of Rome’s census sections was downloaded from the Italian national institute of statistics website at
http://www.istat.it/storage/cartografia/basi_territoriali/WGS_84_UTM/2011/R12_11_W-GS84.zip).
3.6. Elaboration of Output Products
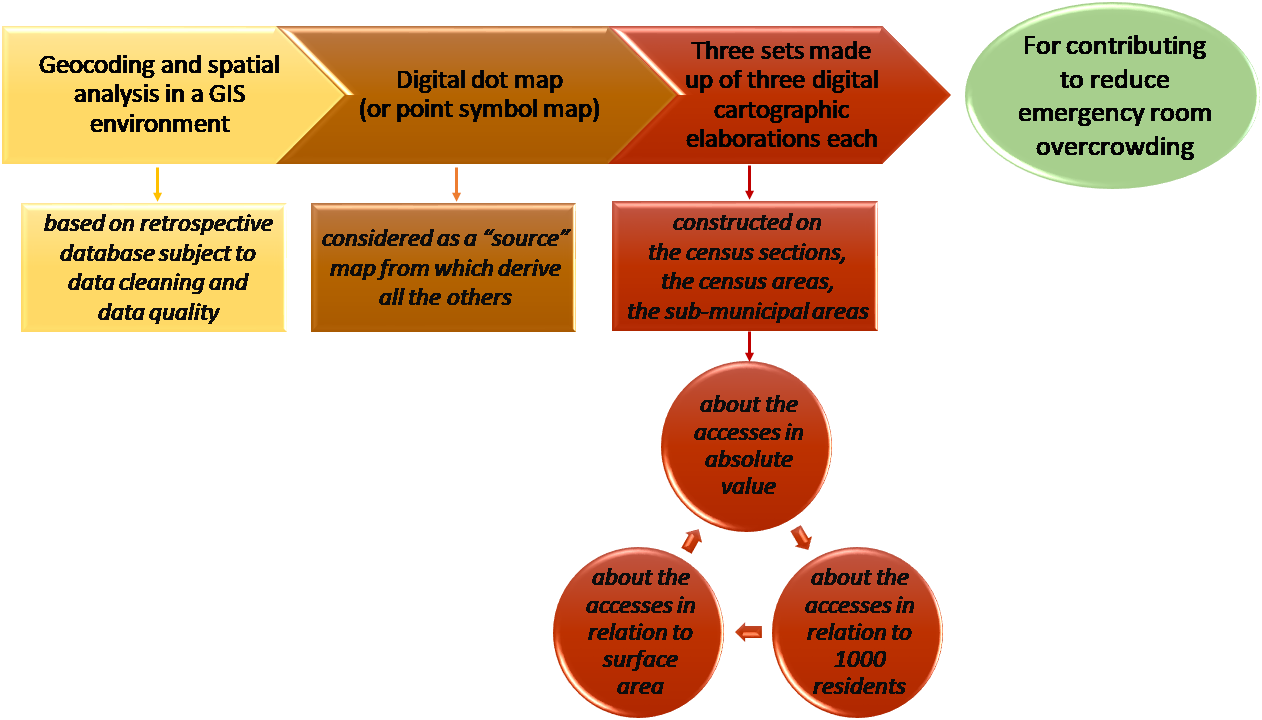
In terms of output products, ten maps were constructed in order to support a territorial screening able to identify and to show with communicative efficacy the sectors of Rome municipality that in 2011 resorted to the Policlinico Umberto I emergency room in cases of code white.
In particular, the first elaboration is a “source” map from which derive all the others. It is the map on which all the codes white recorded in the database have been geolocalized on a satellite image through geocoding, once the database had been harmonized and subject to data cleaning and data quality operations.
There were then three sets made up of three digital cartographic elaborations each, constructed, in terms of territorial bases, on the census sections (CS), the census areas (CEA), and the sub-municipal areas (SCA).
Specifically [
32] (pp. 28–30):
- -
the census sections (CS) are the minimum survey unit of the municipality on the basis of which the census survey is organized. Each CS is made up of a single body bordered by a closed broken line. Starting from the census sections, the geographic and administrative bodies can be reconstructed at a higher level;
- -
the census areas (CEA) are groups of contiguous census sections. The aggregation choices also took into account the demographic and social data, in order to obtain areas with a number of inhabitants of between 13 and 18 thousand barring exceptions, also bearing in mind the suggestions of the municipalities involved;
- -
the sub-municipal areas (SCA) derive from the splitting up of the municipal territory into units of administrative and/or toponomastic decentralization (administrative districts, quarters etc.), and are obtained from the sum of the entire census sections.
The first set of three maps concerned the code white accesses in absolute value divided into classes according to the quantile criterion. This set provided a first very important look at the number of attendances.
The second set of three maps concerned the code white accesses in relation to 1000 residents, divided into classes according to the quantile criterion. This set was therefore useful to have information regarding the number of attendances with respect to the residents.
The third set of three maps concerned the code white accesses in relation to the surface area, divided into classes according to the quantile criterion. This set was useful to have information concerning the density of attendances with respect to the surface area.
A grey background was placed over the maps relative to the census sections, in order to better show the different colors which are referred to an enormous number of little polygons representing the administrative units (CS).
A street-like background with some place names was used for the overlay to the maps relative to the census areas (CEA) and it made it possible to have a considerable number of details regarding places, road axis, and streets which provided a multiplicity of information with progressive zoom.
A satellite background is placed over the maps relative to the sub-municipal areas (SCA) and it enables one to have a general overview and to see buildings, houses, and the elements actually present on the territory with a detailed lens.
3.7. Elaboration Criteria
For the elaboration of the “source” map, that was a dot map (or a point symbol map), in a GIS environment we operated through geocoding in the perspective of the address matching to locate attendances to emergency rooms in code white as points and to visualize the result in a satellite image.
In fact, geocoding can be used to convert each address, referred to a specific event or element of interest, to a point on a digital map. Similar address matching involves the comparison of two different but related datasets: the first one containing the address of sanitary aspects or health events and the second one regarding a foundation database with its own address information. “An address (street name, number, and city, postcode, or other zone) from the first database is compared against the full array of addresses in the second, and a “match” occurs when the two agree”. From a practical point of view, it is an iterative and automatic procedure in which beforehand it is necessary to attempt to match all the addresses and then correct those that, for different kinds of reasons (for example due to missing or incorrect information during the data entry in emergency phase), fail to match. Therefore, generally there were some errors which require apposite interventions and digitization by hand or the application of conventions and rules [
33] (pp. 99–102).
When the data are available and have a good degree of accuracy, geocoding can provide a great added value in sanitary and epidemiological study and offer a wide range of methodological and applicative opportunities. In the case of using geocoding for investigating sanitary and disease clustering, the quality of data is a paramount [
34] (p. 61) in order to avoid poor inputs and results [
35] (p. 88). On the other hand, when the process can contribute to generating highly significant digital maps for the understanding of a pressing problem, we are in front of a virtuous method to show patterns otherwise not recognizable.
In these cases:
- -
Geocoding plays a relevant role in the health science research and interdisciplinary works since it provides and geolocalizes fundamental geographic data that can allow spatially-based investigations and support strategic policy decisions [
36].
- -
“The creation of striking and informative maps accompaniments the proper analysis of spatial epidemiological data” [
37] (p. 29).
The geocoding process enabled us to produce an explicative dot map where each dot corresponds to one attendance in code white and where the high concentration of dots reveals clusters of events and distributive patterns, which were particularly evident in the case of high zoom. Similar maps were instead less clear when the zoom level was low and there are many dots in a limited space because overlap problems emerged, with the risk that “dots hide other dots, obscuring differences in density” making it difficult to distinguish zones with notable and relatively contained concentration. In these cases, the strategy of “area conversion in which points are grouped into geographic areas, and the areas are shaded (or colored) according to the number of events within them” offers an integrated step forward. In this way, there is a shift towards digital choropleth maps that make a comparison among different zones easy on the basis of grouped quantitative data and spatial analysis able to show gradual or sudden variations [
33] (pp. 117–119). Moreover, in this case, the elaboration of digital choropleth maps permits the successive representation of indexes built as a ratio between the number of accesses in code white and number of residents or extension of surface.
As far as concerns the classification criterion, for the choropleth maps, we have always chosen the quantile method, often used in sanitary and epidemiological studies also because it makes it possible to make comparisons among different maps since generally it is characterized by the same frequency of values in each defined class and the same number of administrative area flows in each class.
Regarding the number of classes:
- -
For the first set of maps concerning the code white attendances in absolute value, we used four classes for census sections (we have created four classes, even if the first and the second classes are constituted respectively by only one and two accesses, for the particular characteristics and distribution of the data series that at this level of detail record a very high number of cases of this type and to avoid anomalous breaks. Moreover, it is useful to successively operate according to a suitable unpacking process. In terms of geographical contents, the first and second classes may nevertheless be considered as they were a sort of unique class); five classes for census areas; and three classes for sub-municipal areas.
- -
For the second set of maps, we used eight classes for census sections (according to an unpacking process due to the prominent variability of the values); five classes for census areas; and three classes for sub-municipal areas.
- -
For the third set of maps, we again used eight classes for census sections; five classes for census areas; and three classes for sub-municipal areas.
With regard to the colors, in order to emphasize the differences, we used warm tones of orange and red for progressively higher values, while various green shades for low values, and in the cases with an odd number of classes we used yellow for the central class.
4. Results and Discussion
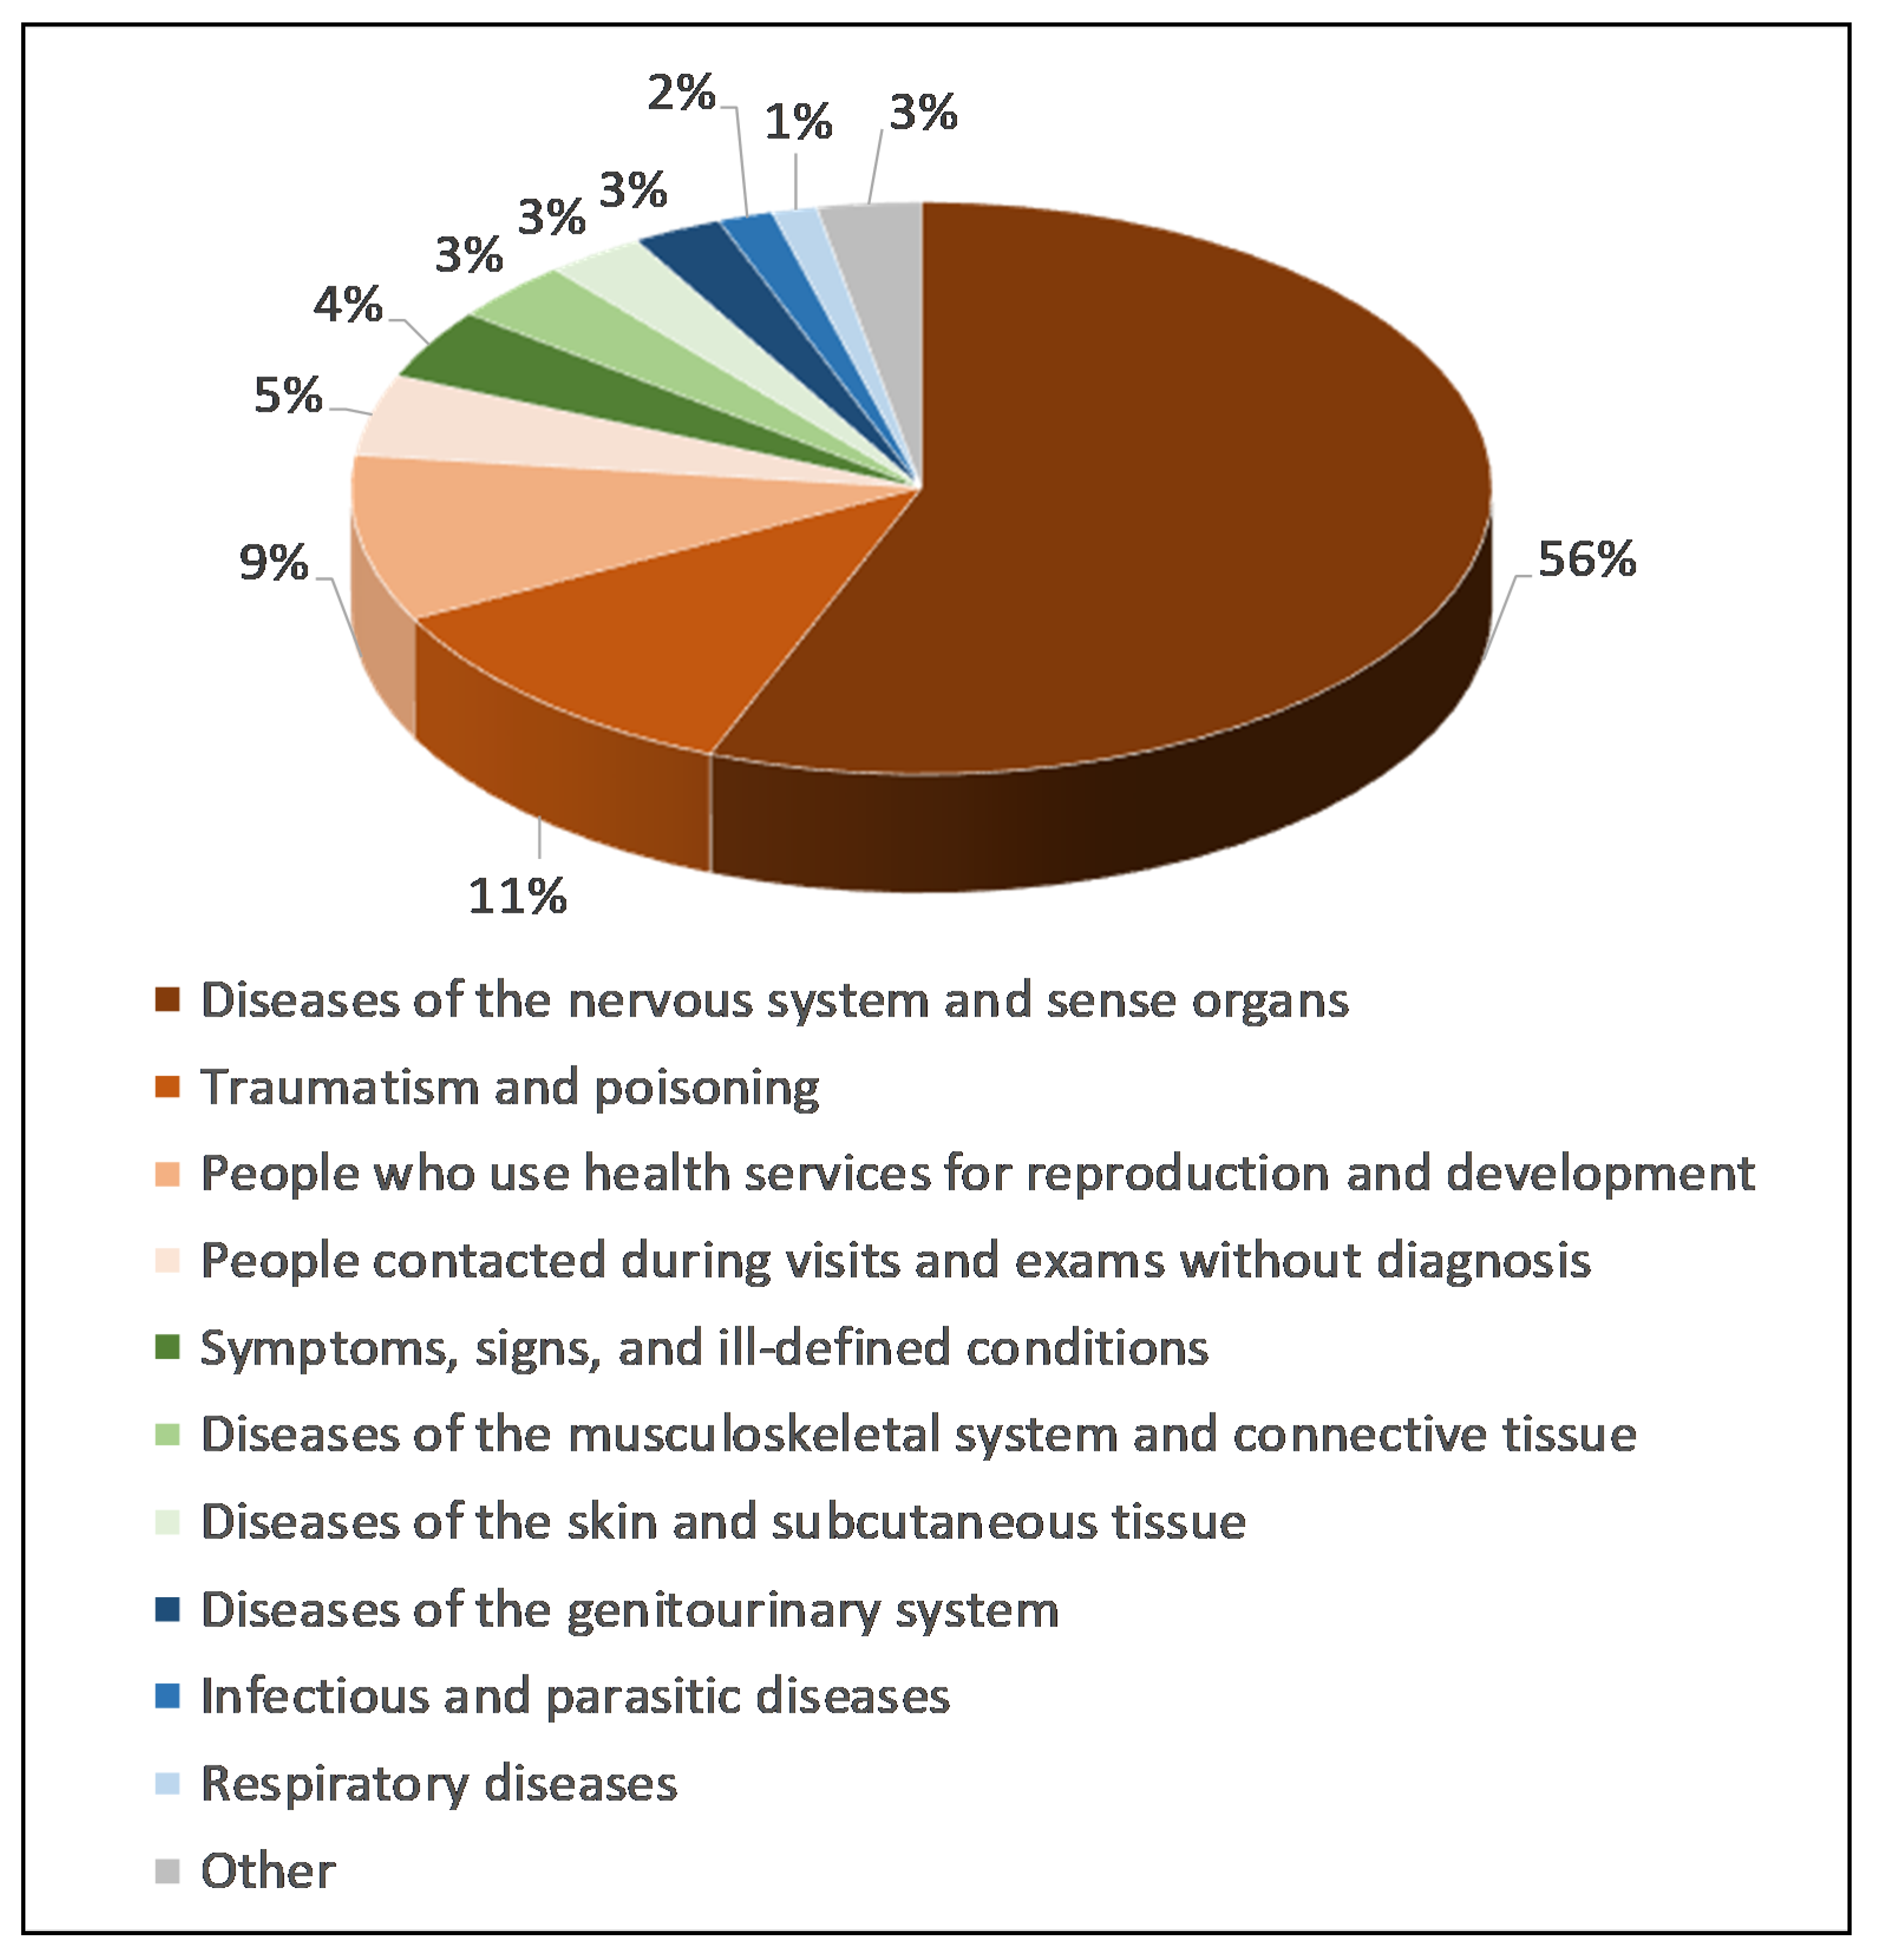
At the end of the data cleaning and data quality operations, 9544 accesses in code white were recorded in 2011 at the Policlinico Umberto I emergency room and of these (
Figure 1):
- -
56% were due to diseases of the nervous system and sense organs;
- -
11% were due to traumas and poisoning;
- -
9% were due to the use of health services for reproduction and development;
- -
Another 21% were due to people contacted during visits and examinations without diagnosis (5%), symptoms, signs, and ill-defined conditions (4%), diseases of the musculoskeletal system and connective tissue (3%), diseases of the skin and subcutaneous tissue (3%), diseases of the genitourinary system (3%), infectious and parasitic diseases (2%), respiratory diseases (1%);
- -
3% were due to other causes.
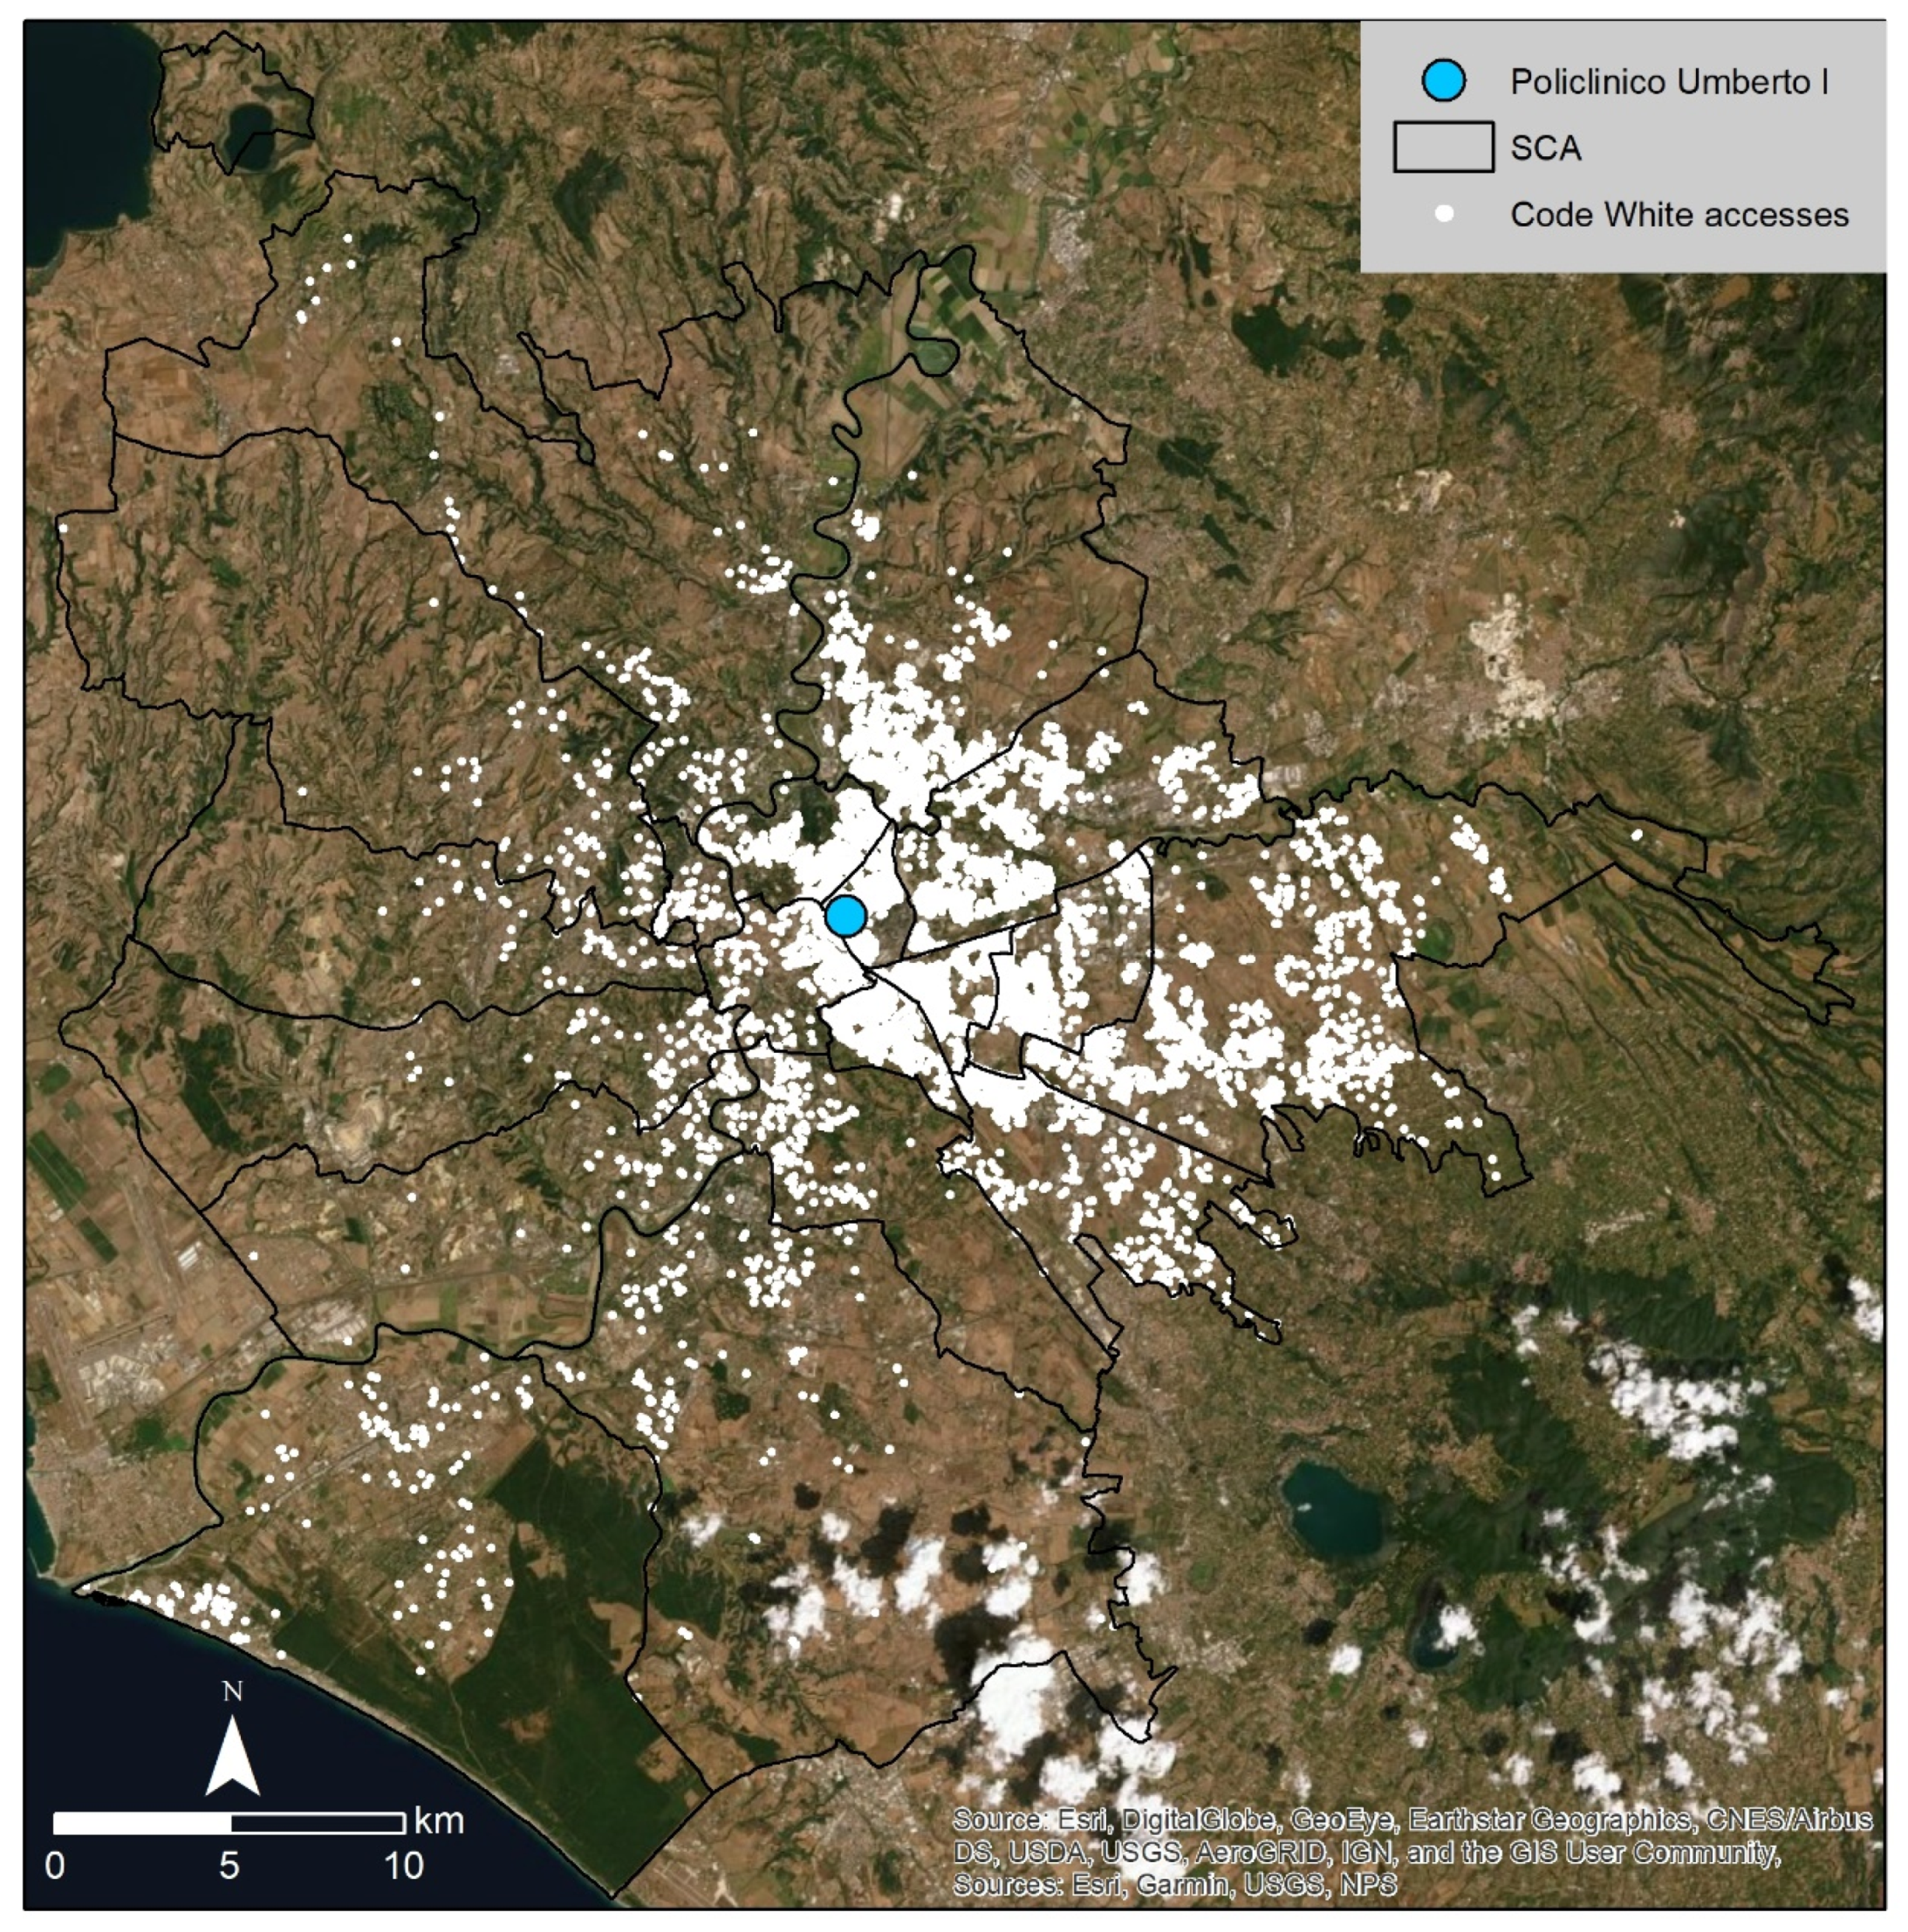
From a cartographic point of view, in a GIS environment, these data have been geolocalized on a satellite image through geocoding in order to produce the “source” map, in the form of a dot map (
Figure 2). As shown in the dot map, the high number of cases determined situations of overlapping and the elaboration immediately showed a tangible difference between the eastern sector, with a very high concentration of accesses in code white, and the western sector, where it was possible to distinguish the single attendances and specific distribution axes. As was foreseeable, the number of attendances tended to diminish with the increase in the distance with respect to the Policlinico Umberto I, but it continues to represent a reference structure also in the case of considerable distances. It is particularly evident in the eastern sector, where the emergency room seems to be used in alternative to the GP or other local healthcare facilities, but its influence was relevant also in situations of remarkable distances. It could be due to the fact that: the emergency room of Policlinico Umberto I reassures and partially attracts patients without other hospitals being able to act as a filter; the triage operations do not require the record of the place where people were at the moment of the accident or symptoms onset, and therefore people living at a certain distance could have chosen Policlinico Umberto I for its nearness in the moment of need. However, the amount of attendances in code white is noteworthy because 9544 in one year means: about 795 attendances per month, and about 26 per day, with a tangible predominance in the eastern sector which is the privileged catchment area. These are relevant data, above all considering that they are avoidable accesses which instead create a burden for the influx of admission operations and the more urgent procedures.
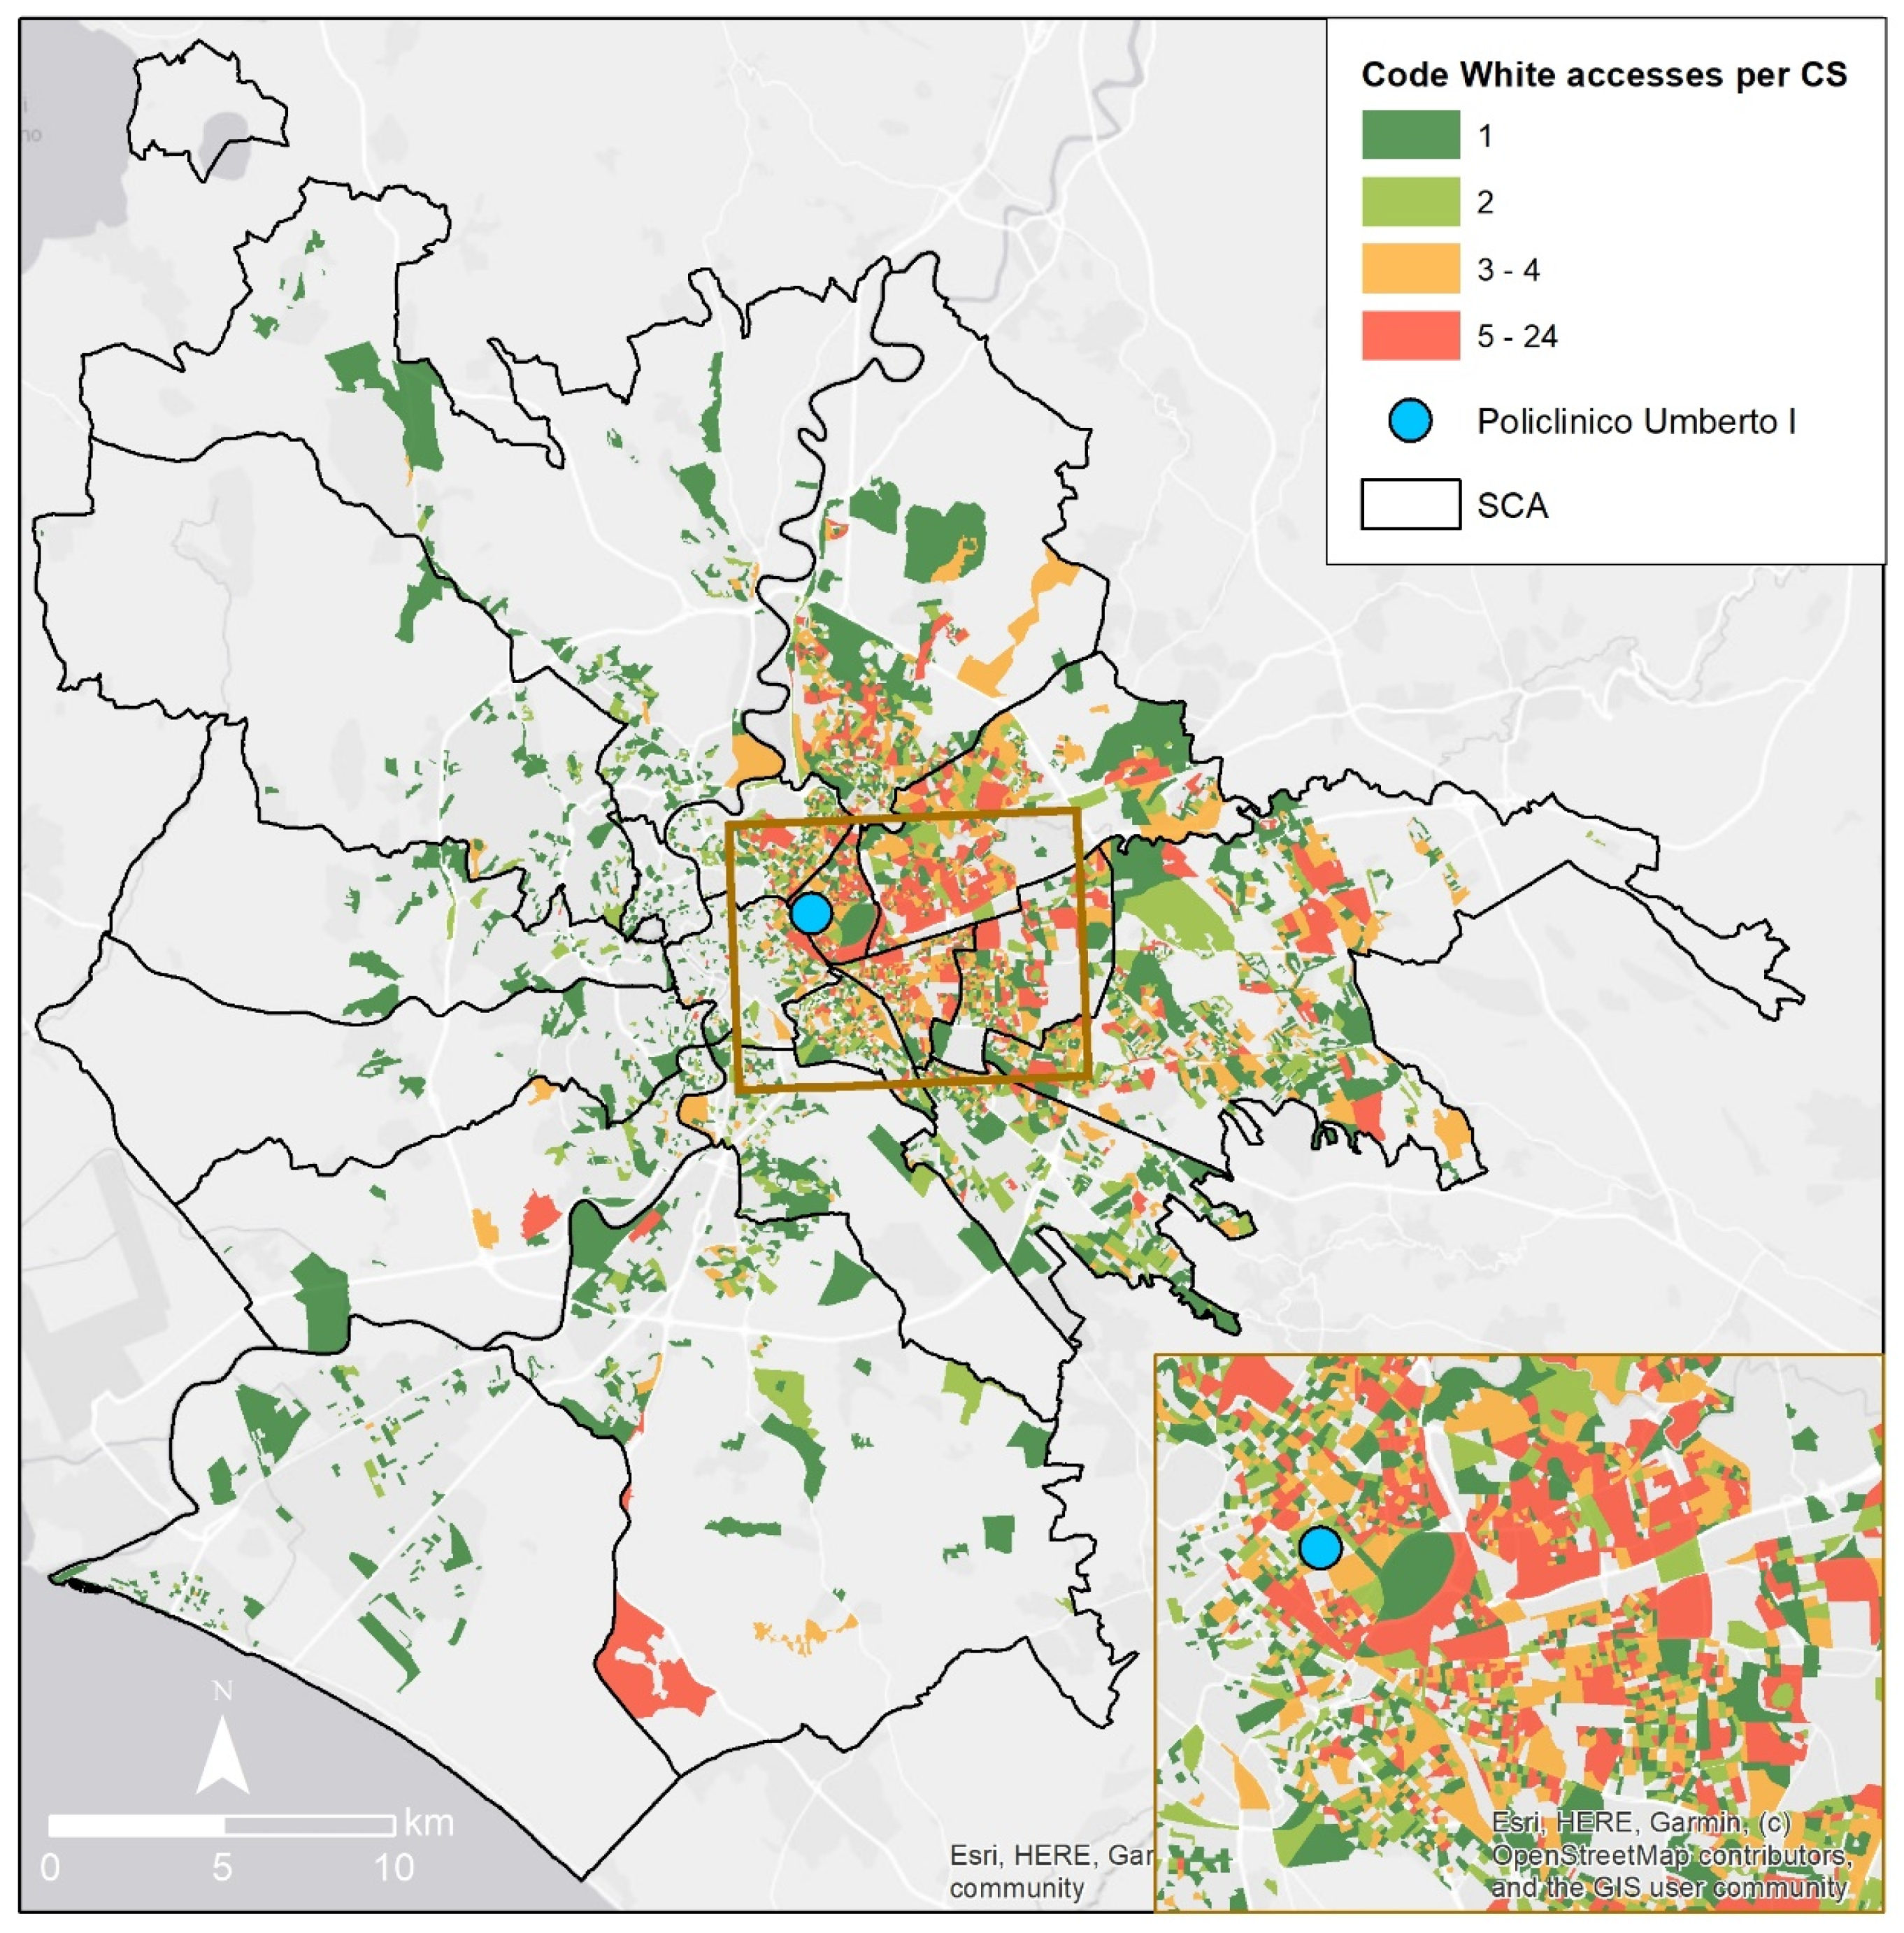
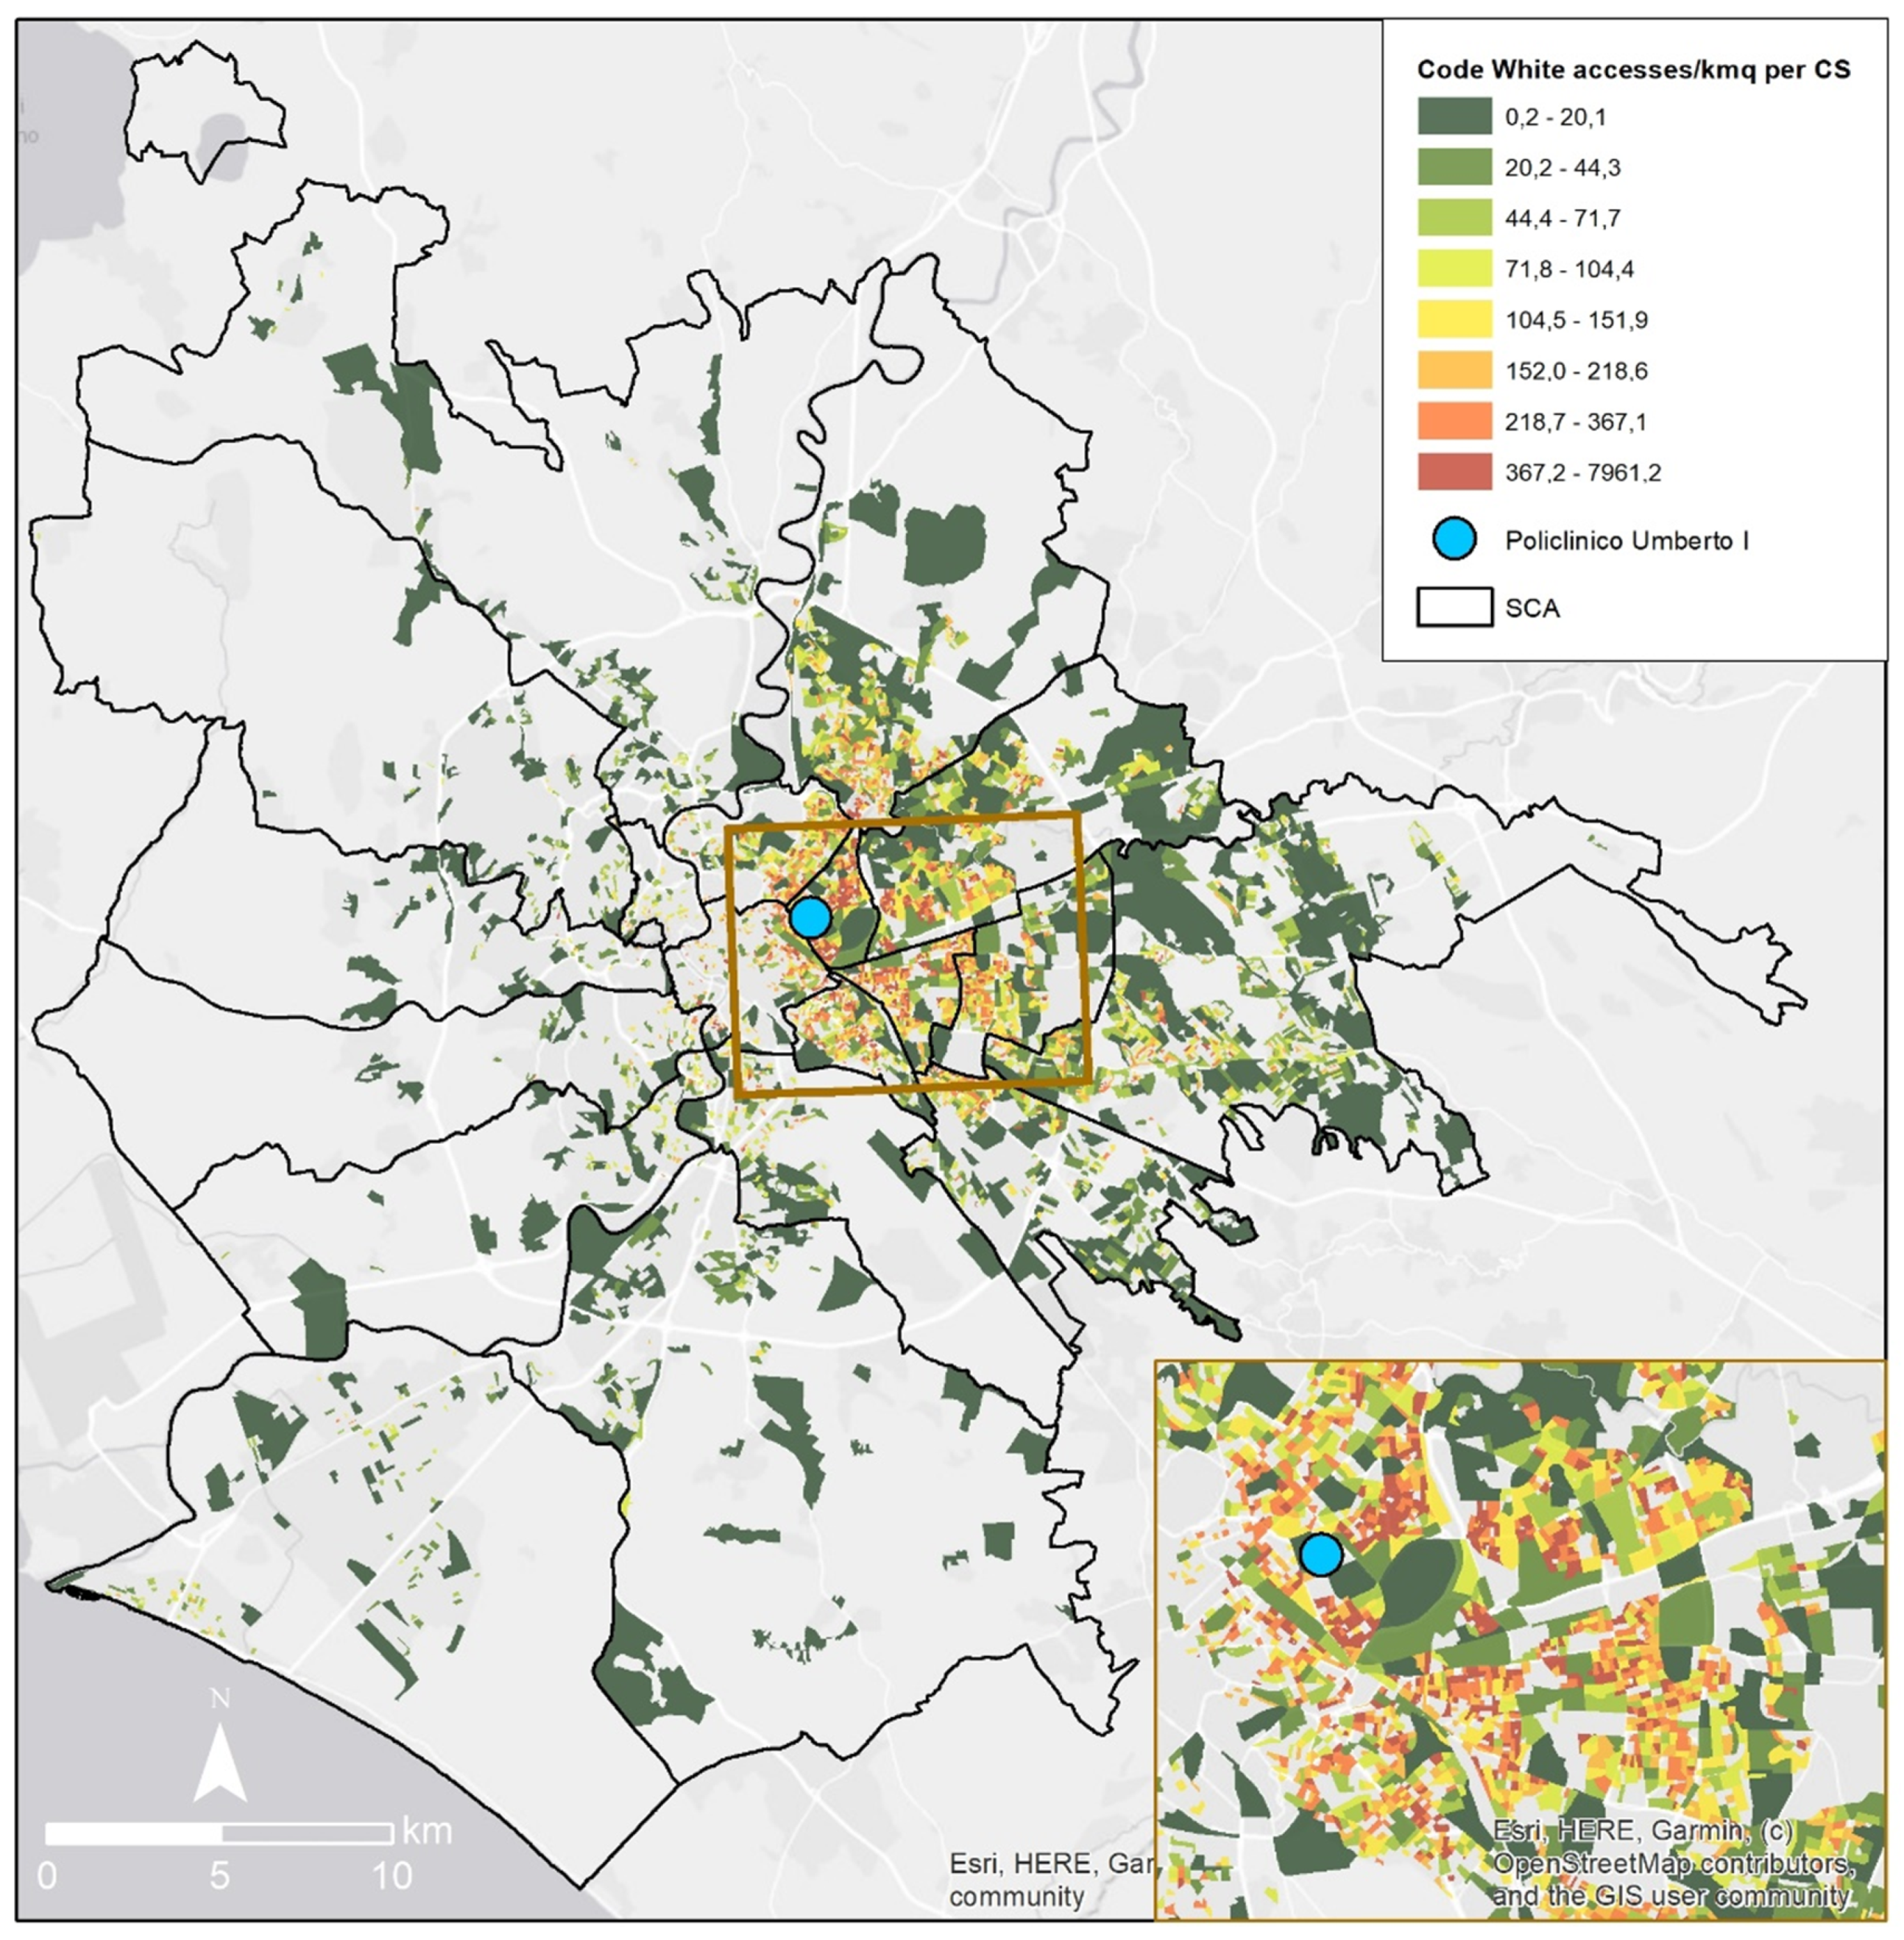
Figure 3, which derives from
Figure 2, shows the code white for emergency room accesses with data aggregated on the basis of census sections and it offers a screening of the different distribution according to the minimum survey unit of the municipality. In the complexity of a highly variegated situation with a considerable number of cases, a similar map underlines details in the details, revealing what the microzones are which improperly use the emergency room of Policlinico Umberto I. This map also makes it possible to make a distinction that, leaving aside the distance factor, shows mixed situations where some contexts record a number of particularly high attendances and that therefore would require specific awareness and education actions in order to rectify people’s behavior. This map confirms the remarkable difference between the eastern (greatly affected) and western sectors; moreover, it shows that also outside the proximity area of the Policlinico Umberto I, in the eastern and northern sectors, there are census sections in the class with the highest number of code white attendances, with these contexts rarely present in the south-western sector too.
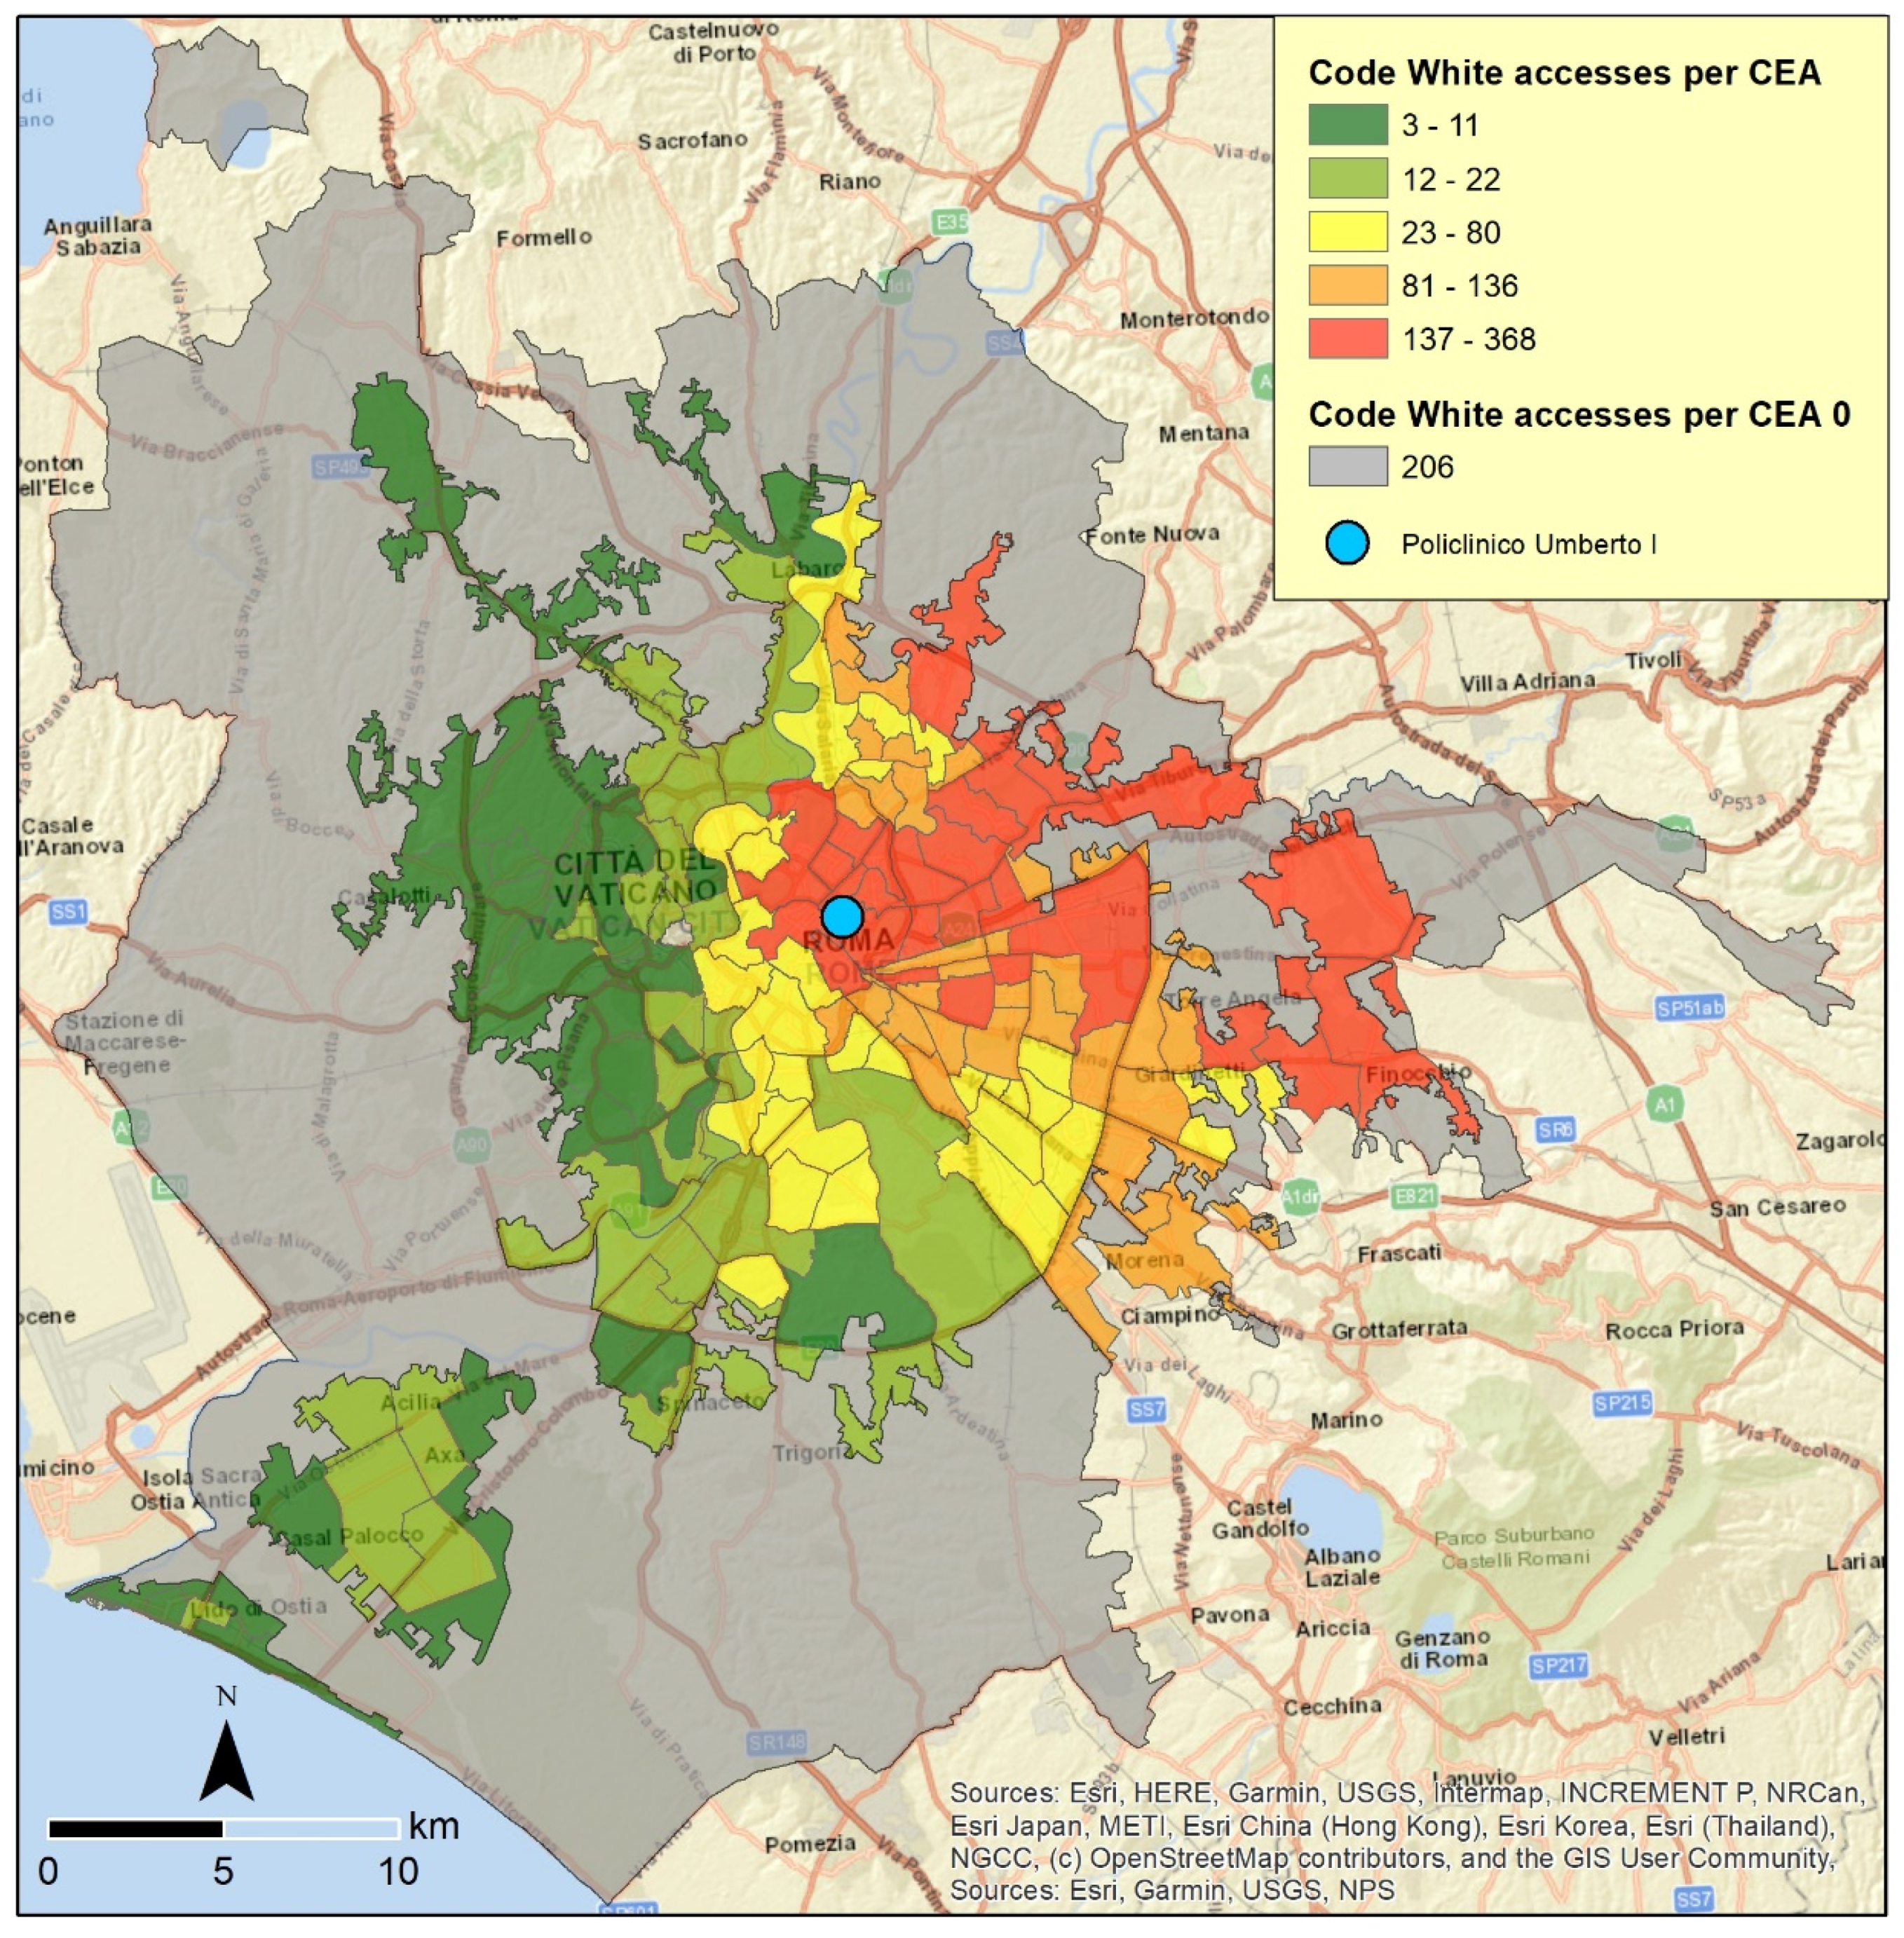
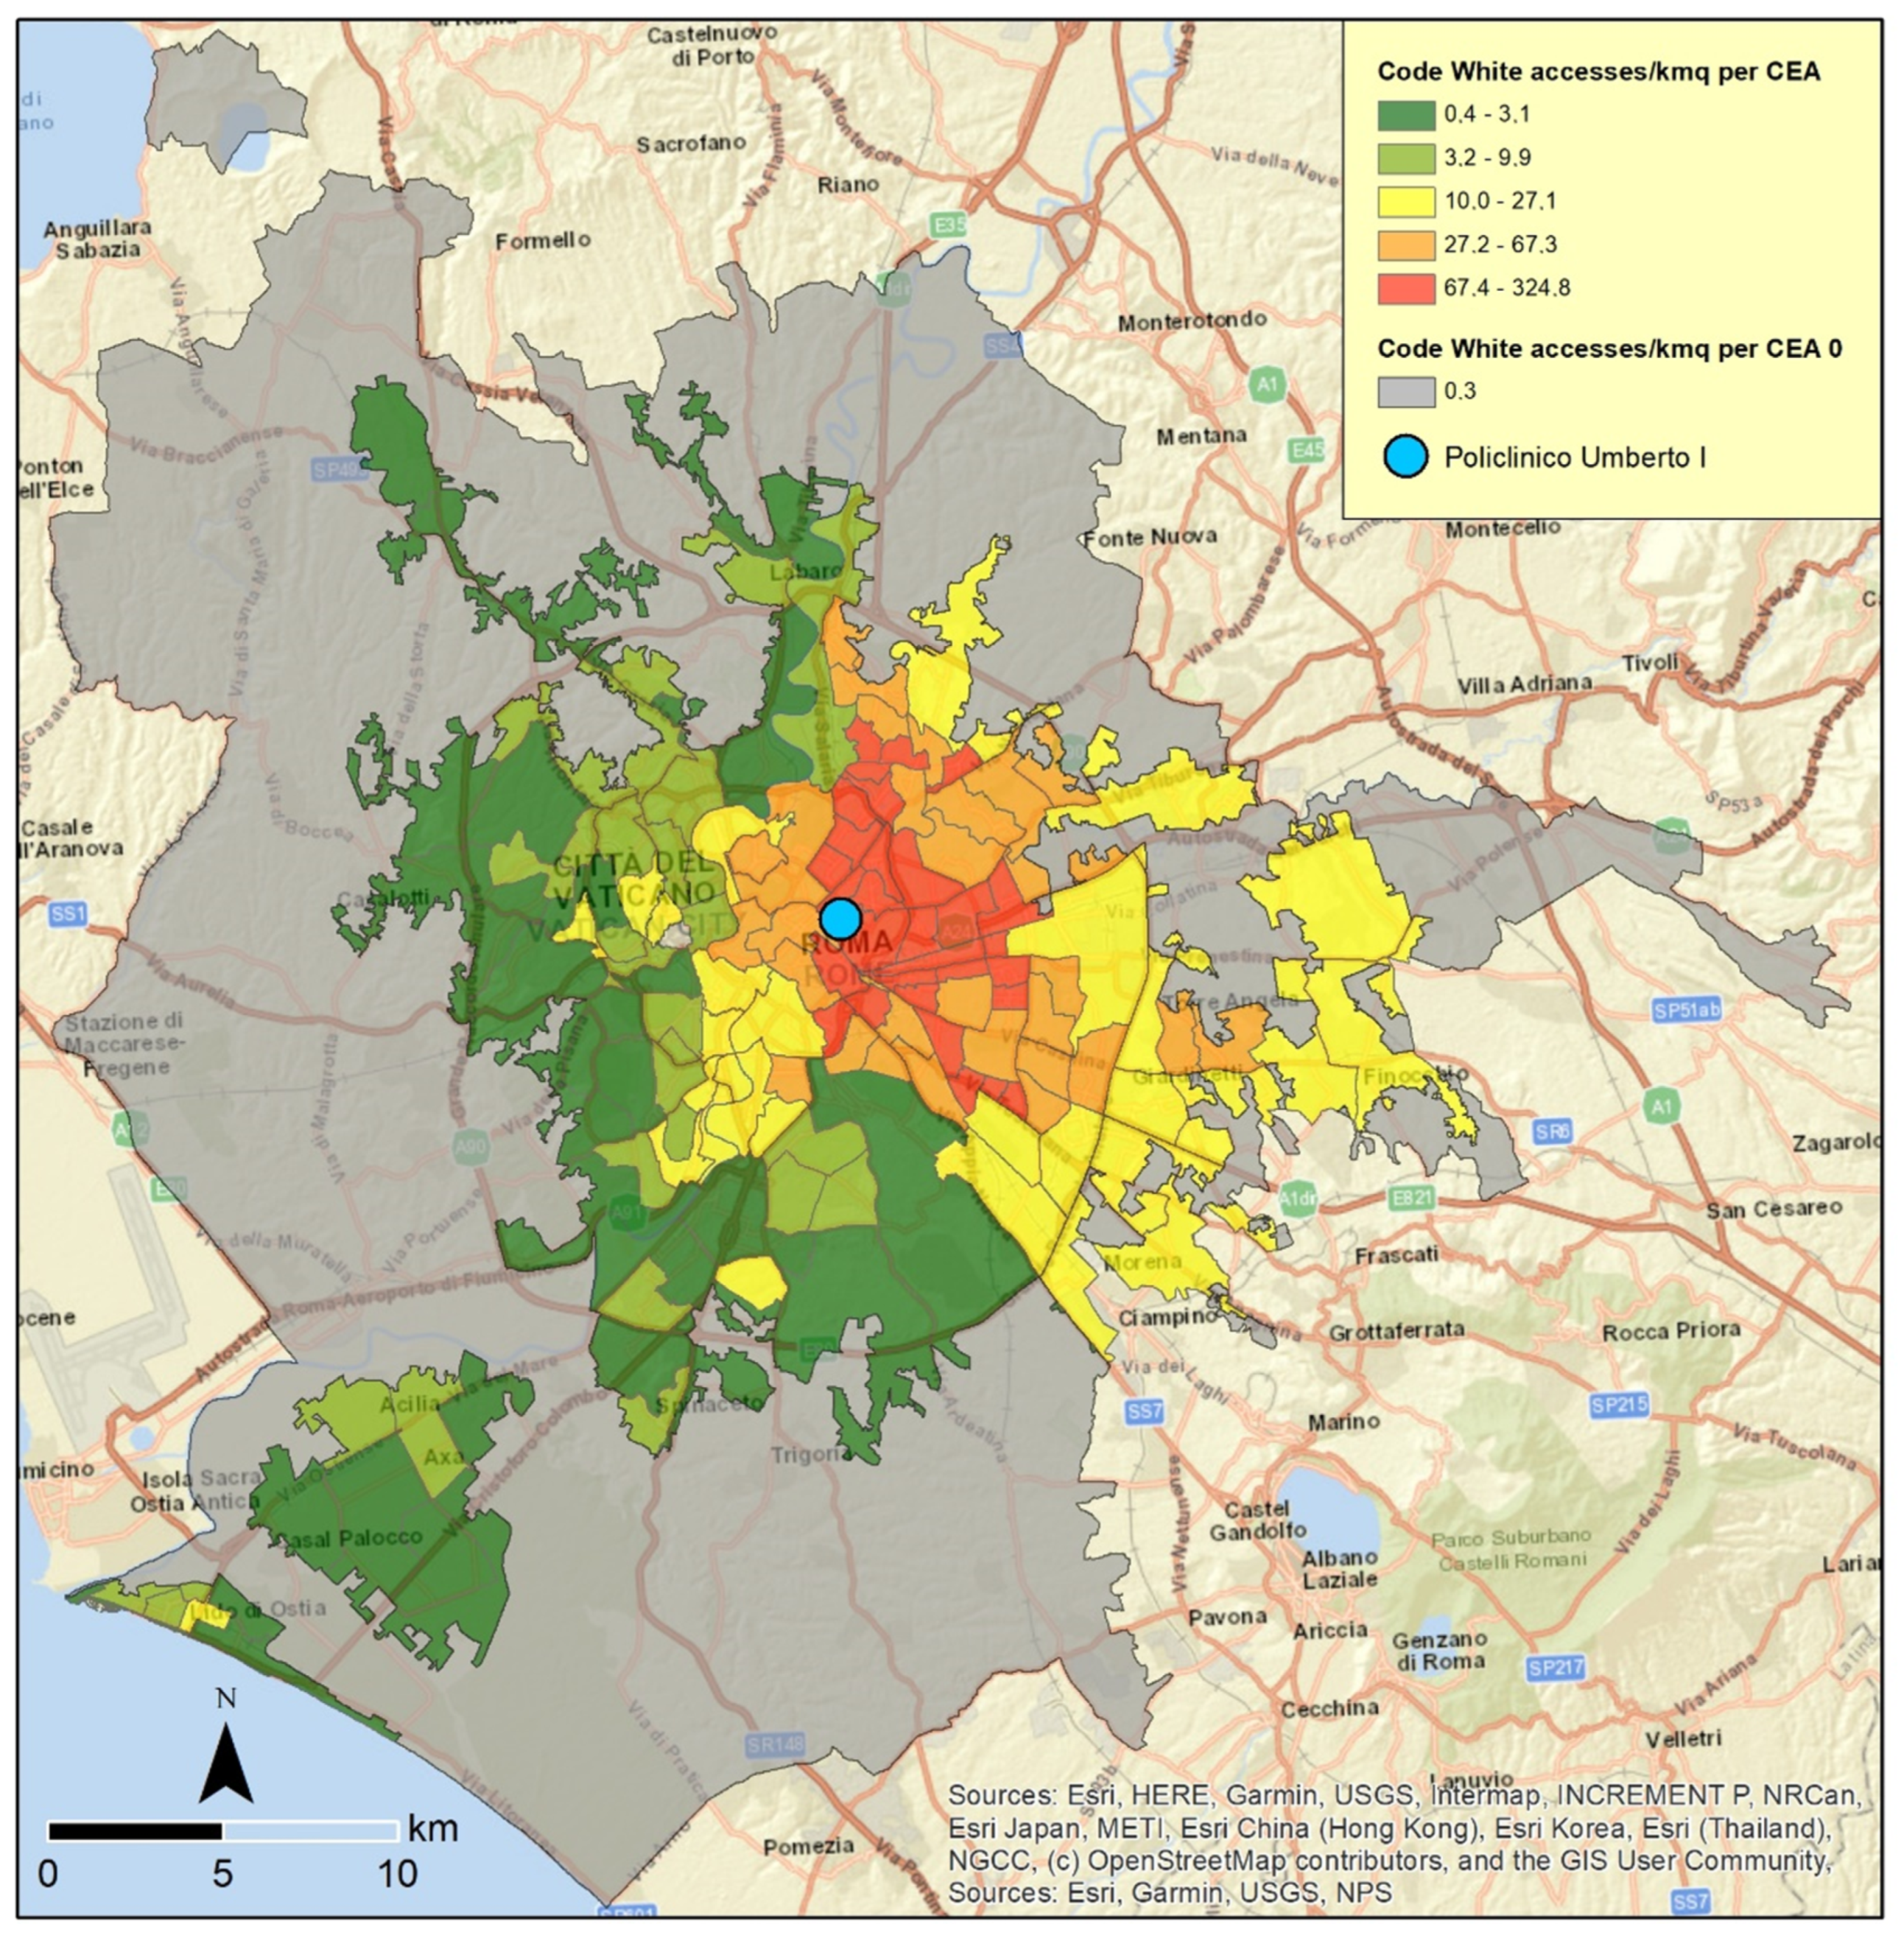
A certain quantitative systematization was then offered by
Figure 4, which shows the code white for emergency room accesses with data aggregated on the basis of census areas, obtained by grouping contiguous census sections. This map reduces the level of detail but increases the communication capacity for understanding territorial dynamics and defining possible intervention measures able to reduce the number of attendances from specific contexts. The subdivision is quite clear: a kind of lineup in the eastern sector (starting immediately to the west of the Policlinico) with the highest values (137–368 accesses); an overlooking area close to north and south of the lineup with high values (81–136); another nearby, irregular and enveloping area with medium values (23–80); and an alternation of census areas with low (12–22) and very low values (3–11) in the western sector. A part (in grey) is evidenced as an enormous census area (ACE 0) because its surface is so extended that it would bring about some misunderstanding.
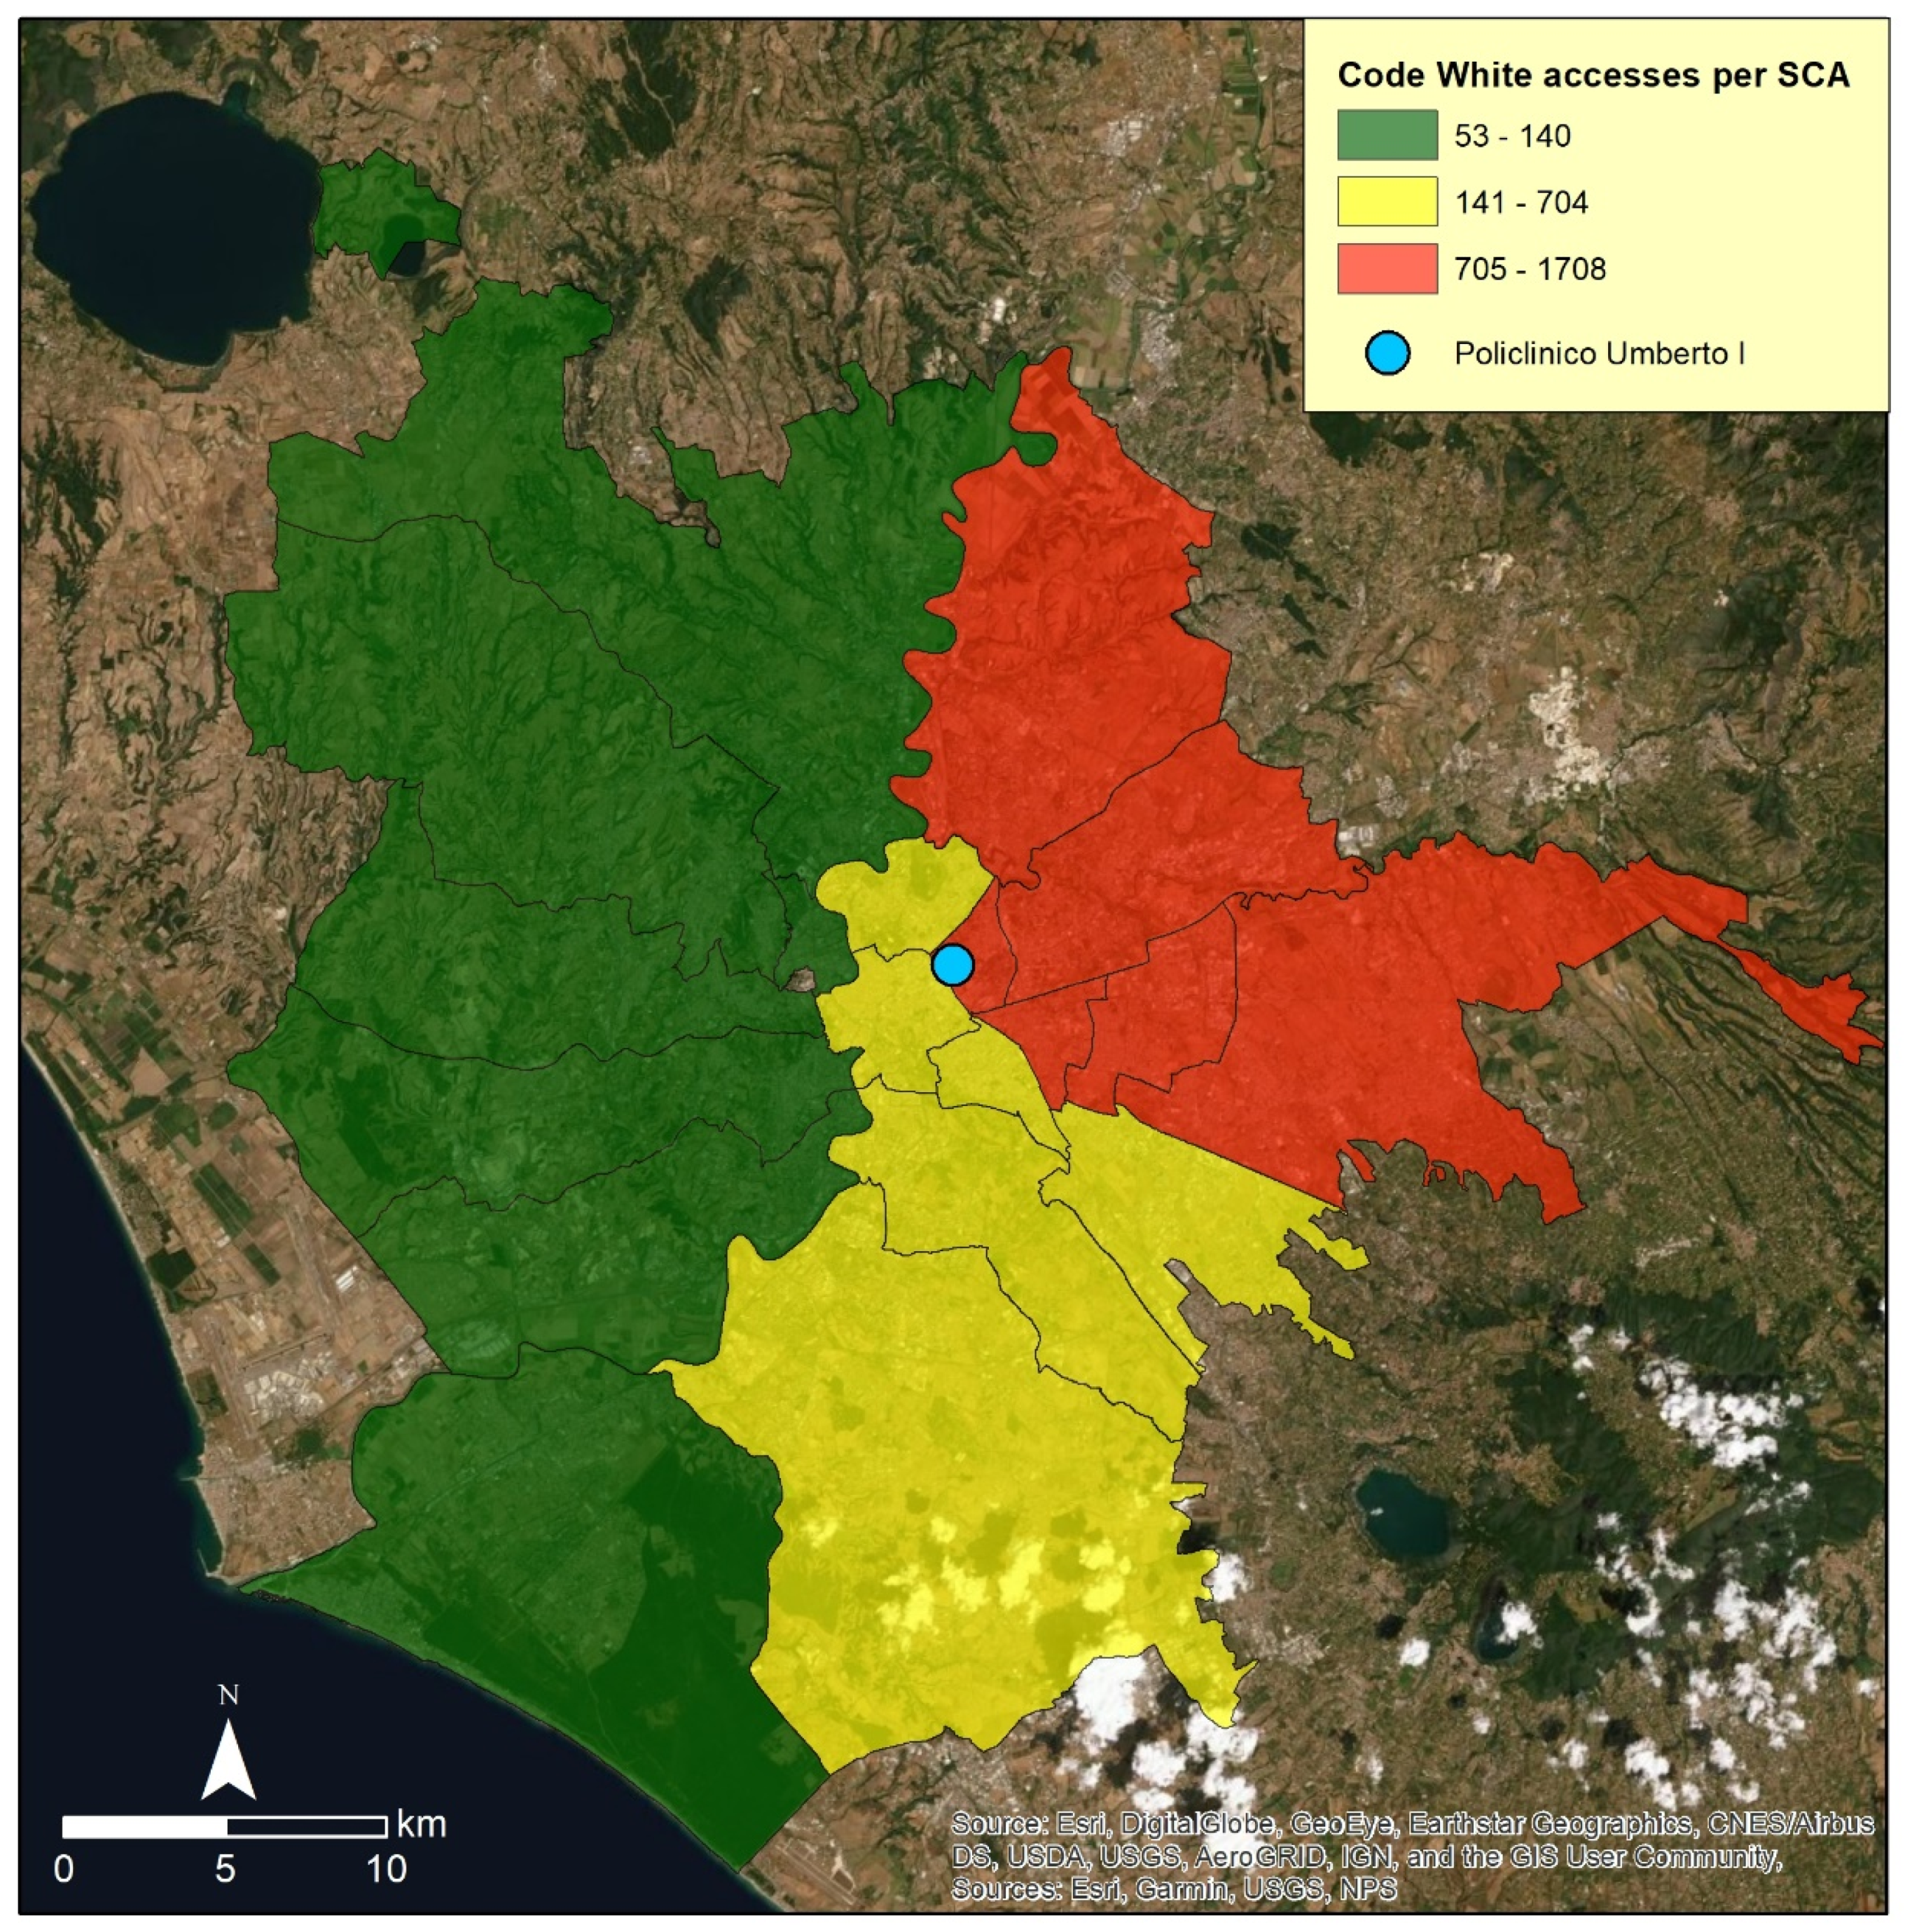
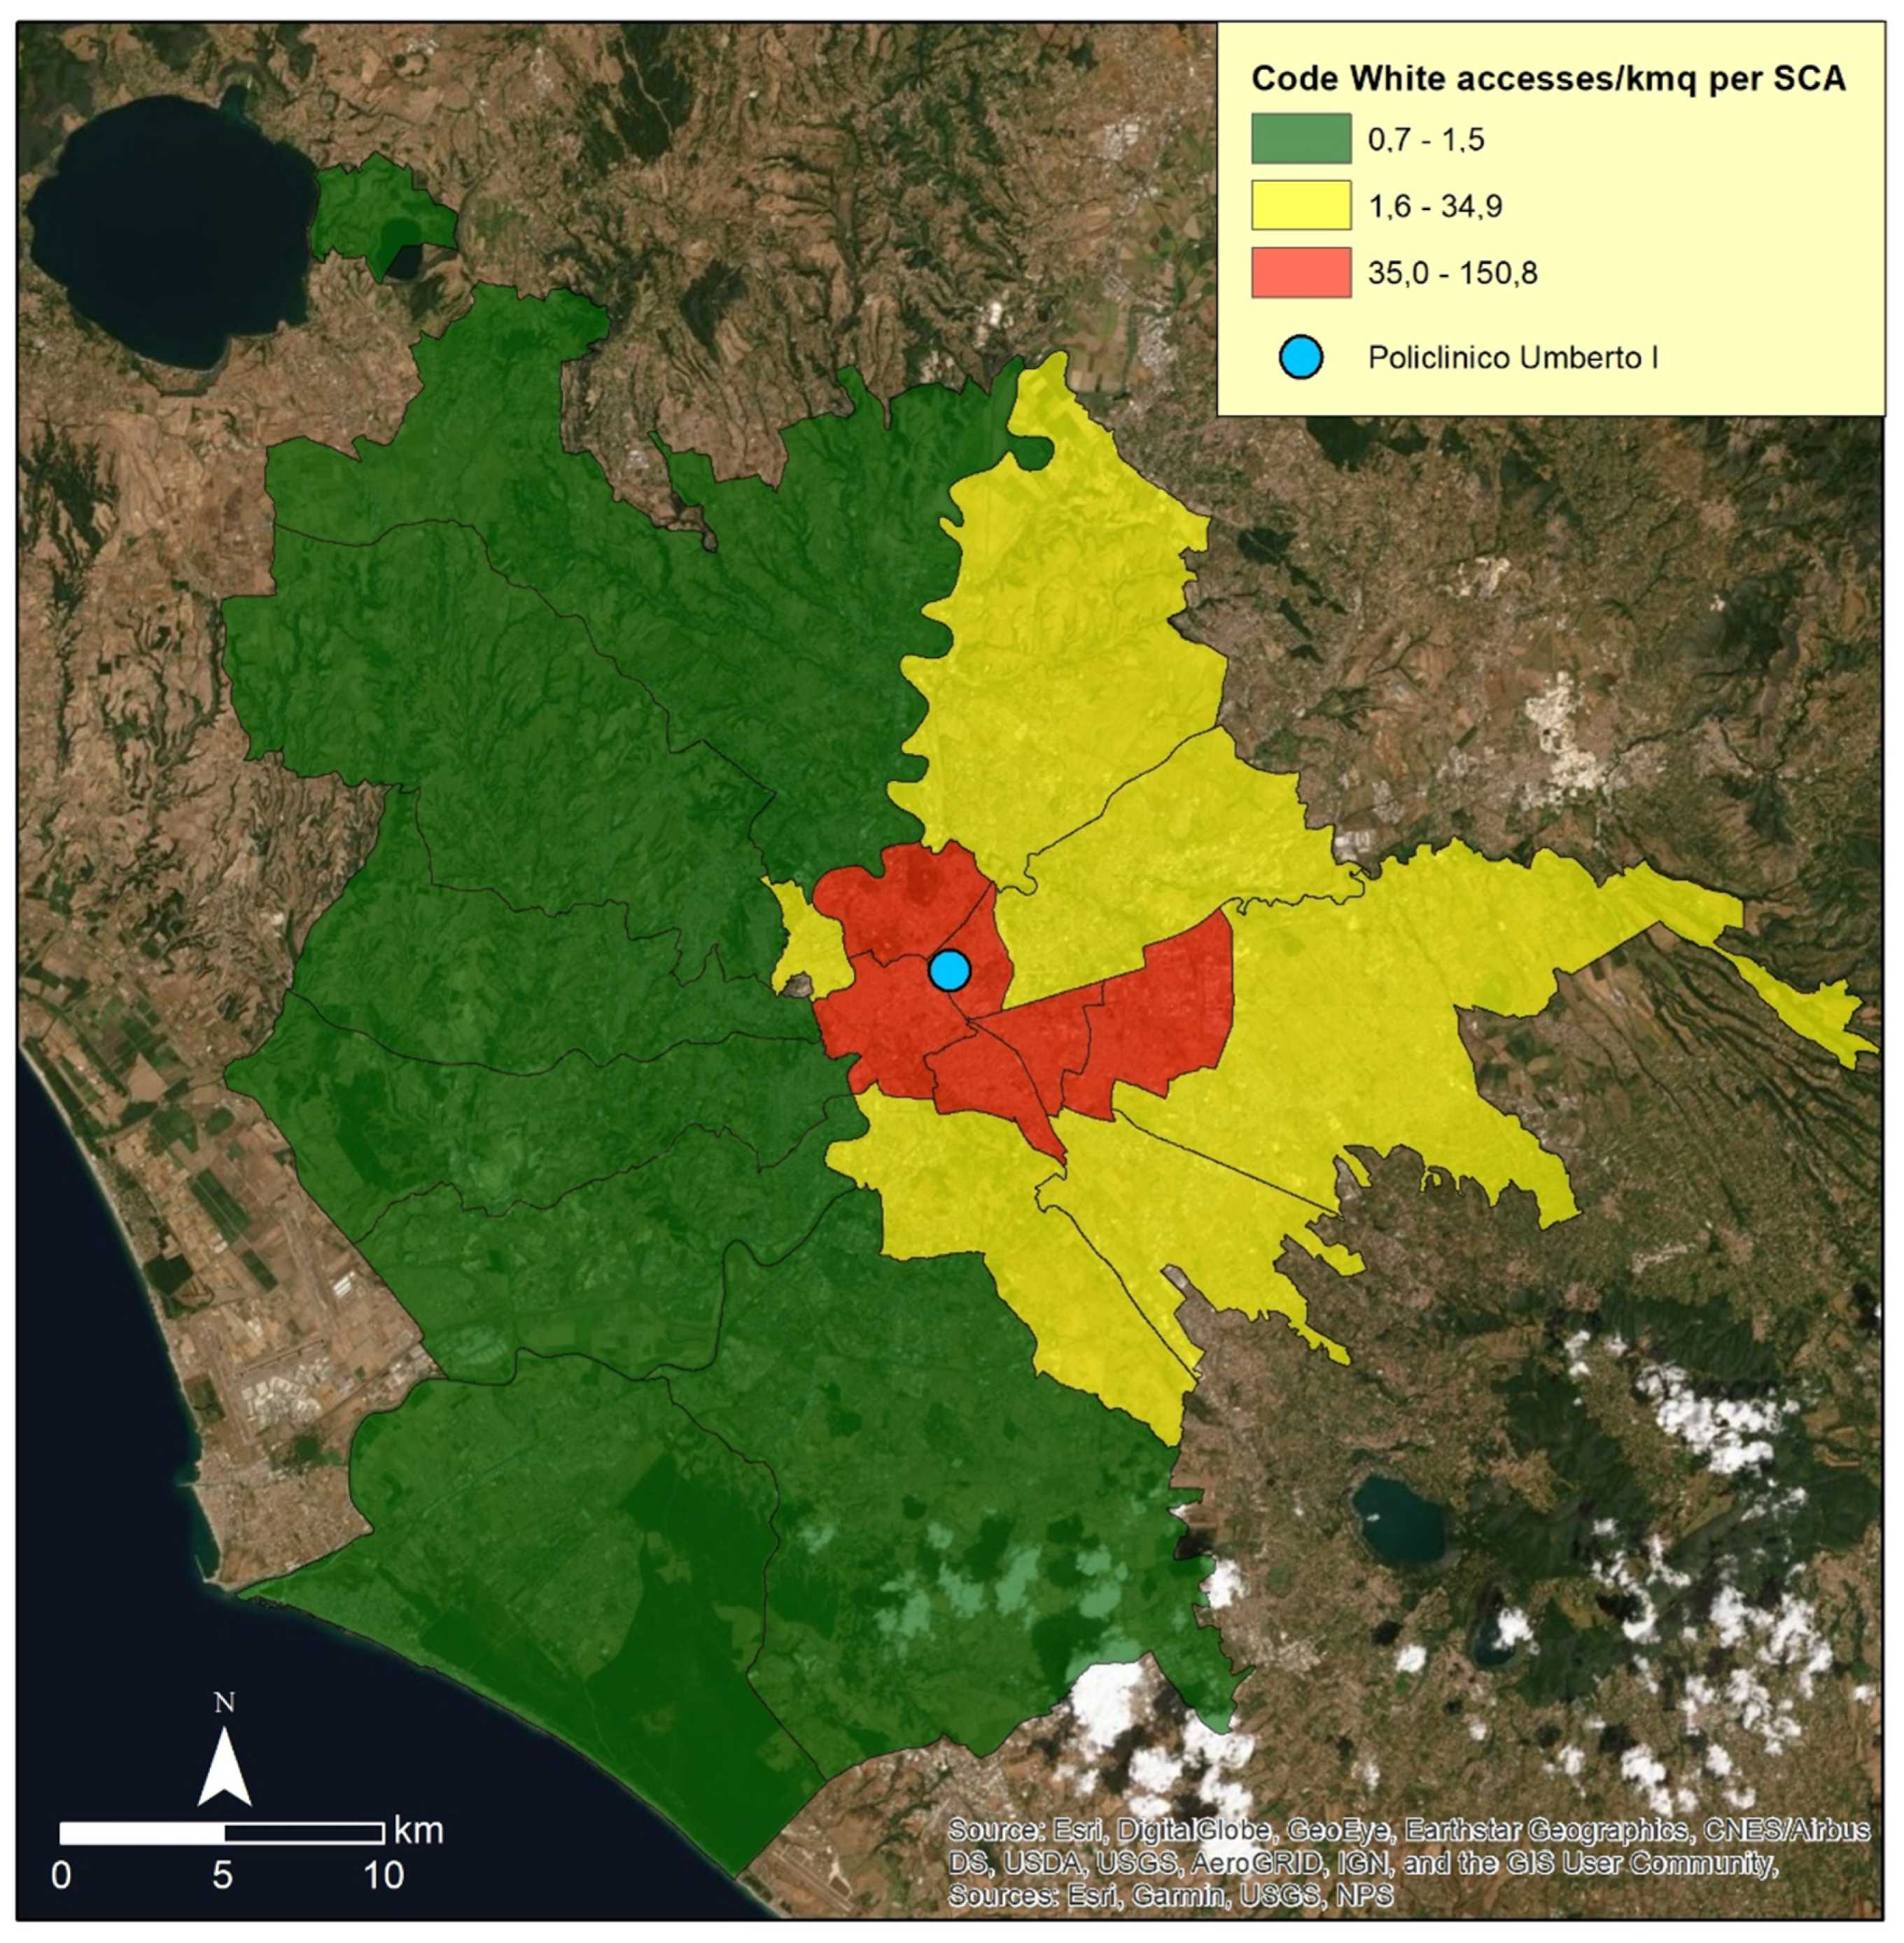
A further level of conciseness is provided by
Figure 5, where the code white data are represented on the basis of sub-municipal areas and which synthetically underline a well-defined tripartition into the eastern sector, with a northern ramification, characterized by sub-municipal areas with the maximum values (705–1708 accesses); the southern sector with medium values (141–704); the western sector, which is territorially the vastest, characterized by sub-municipal areas with the minimum values (53–140).
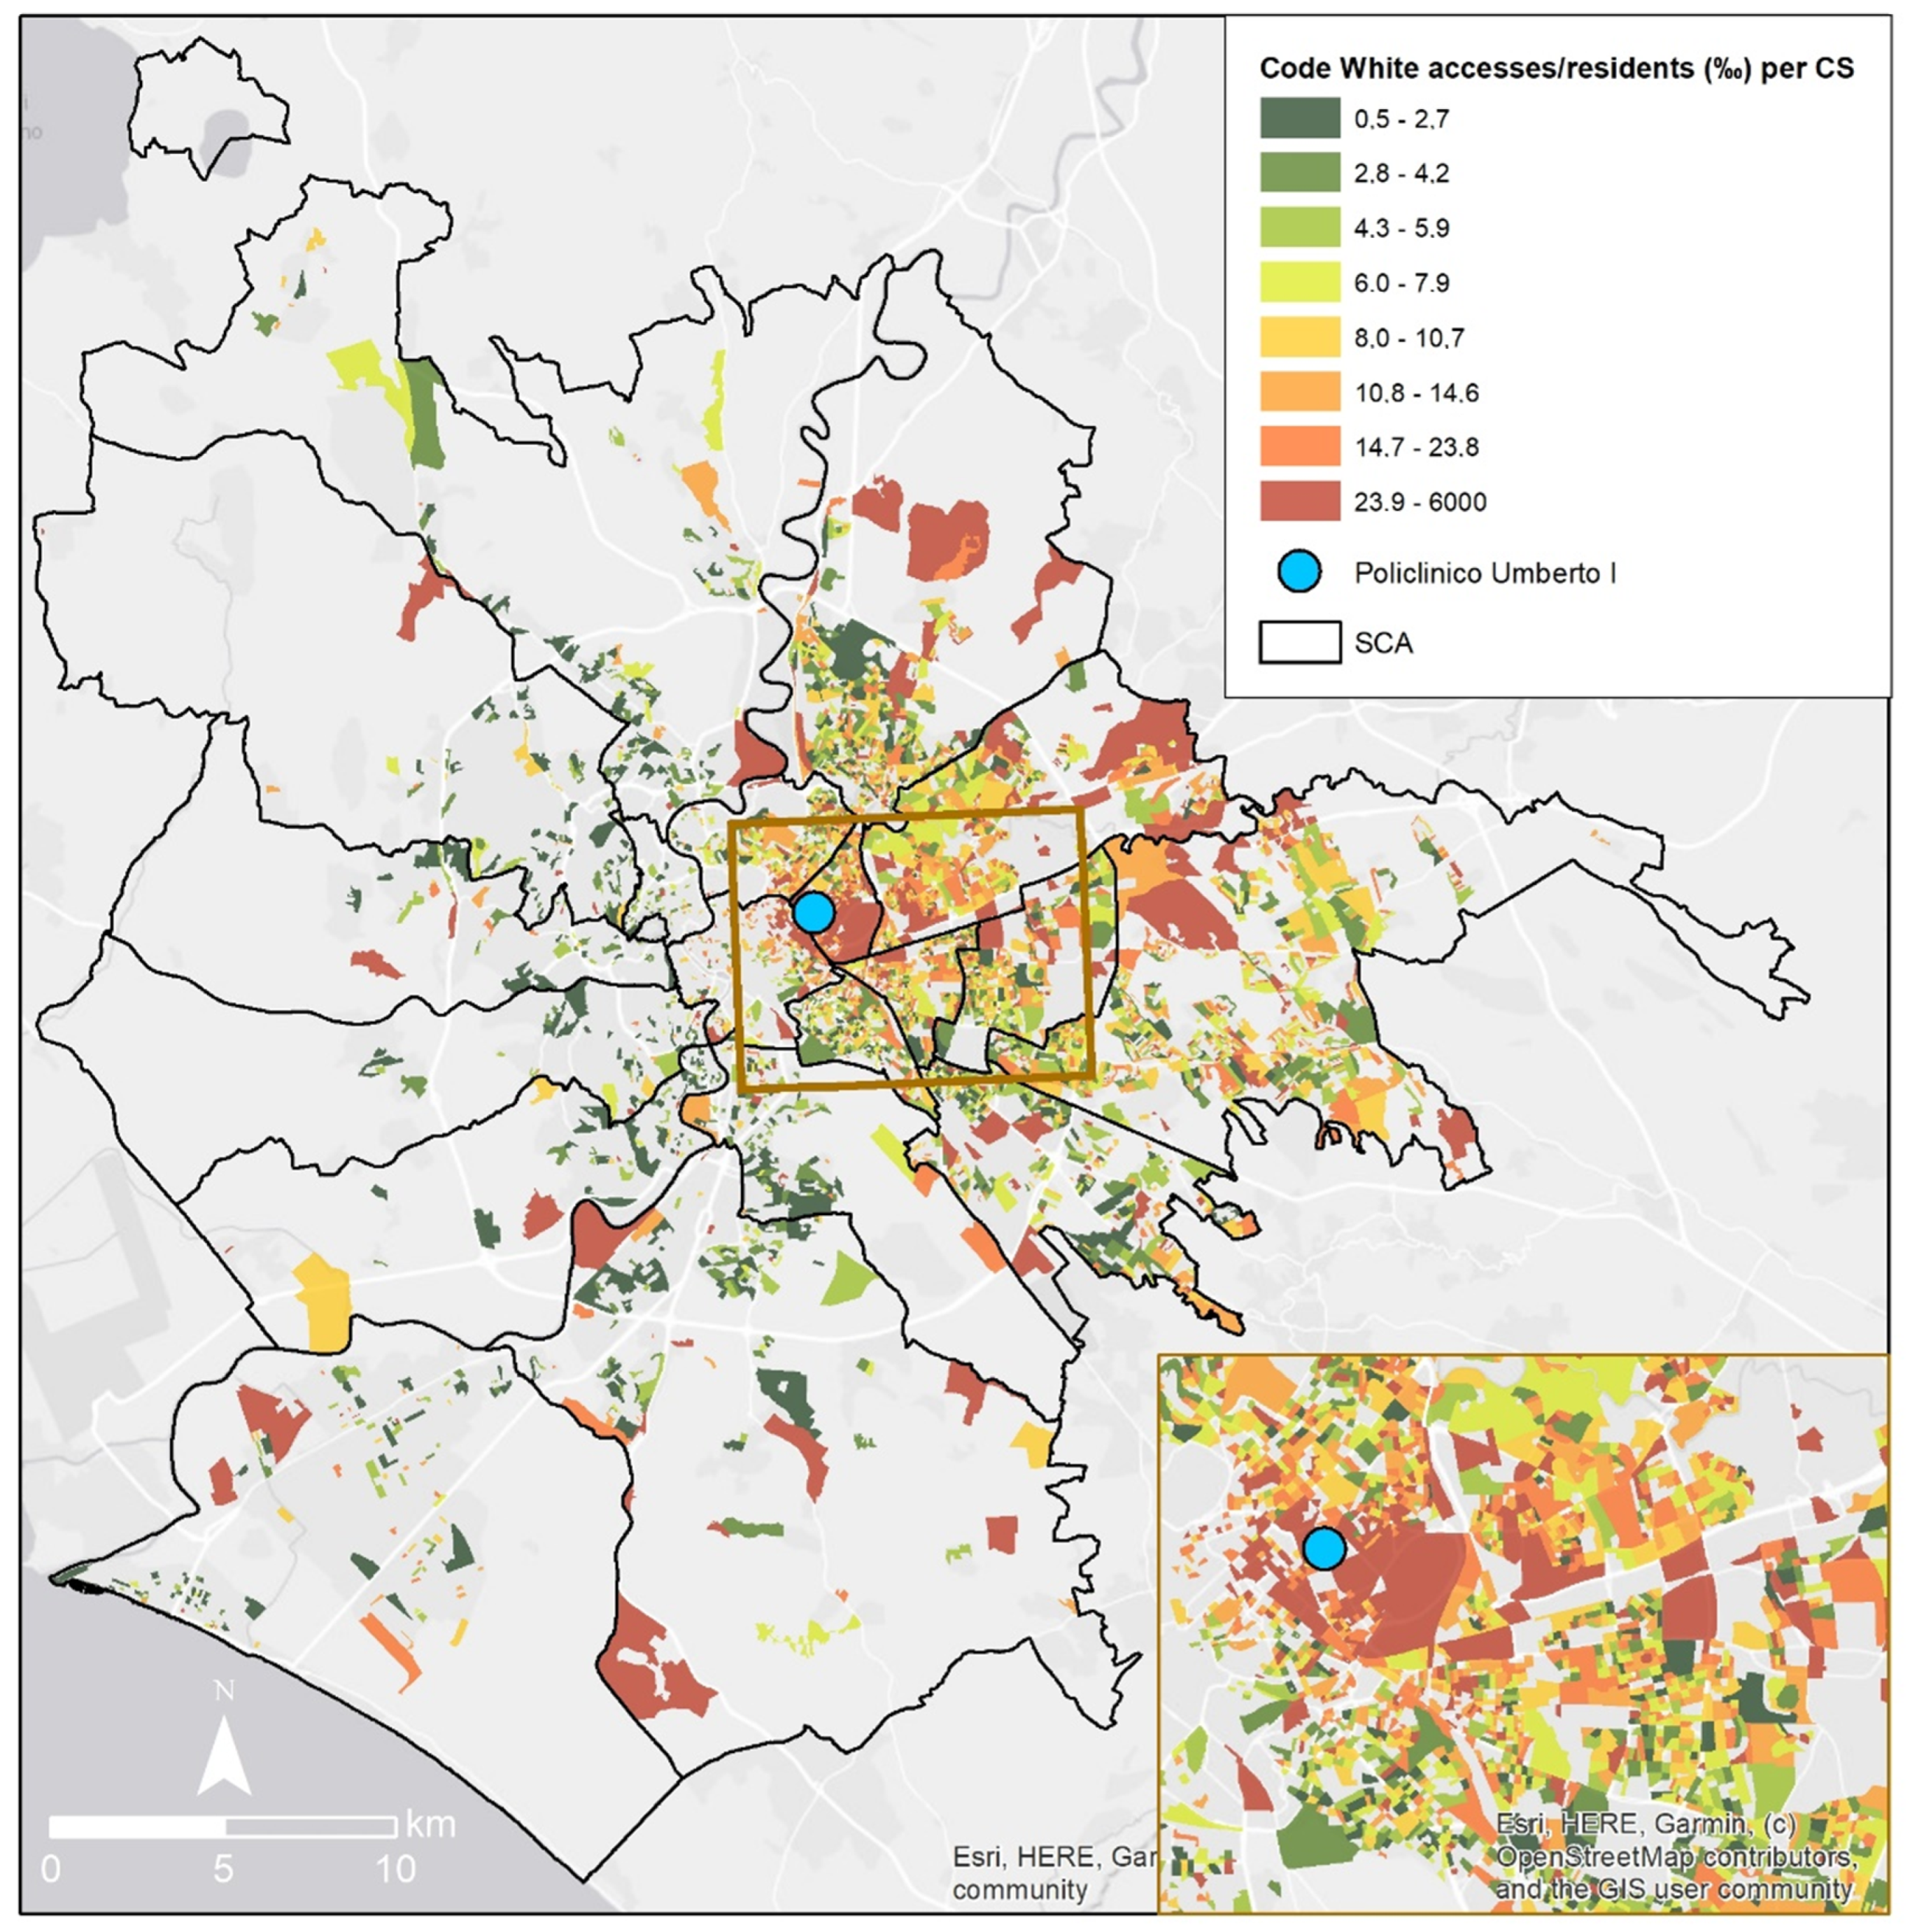
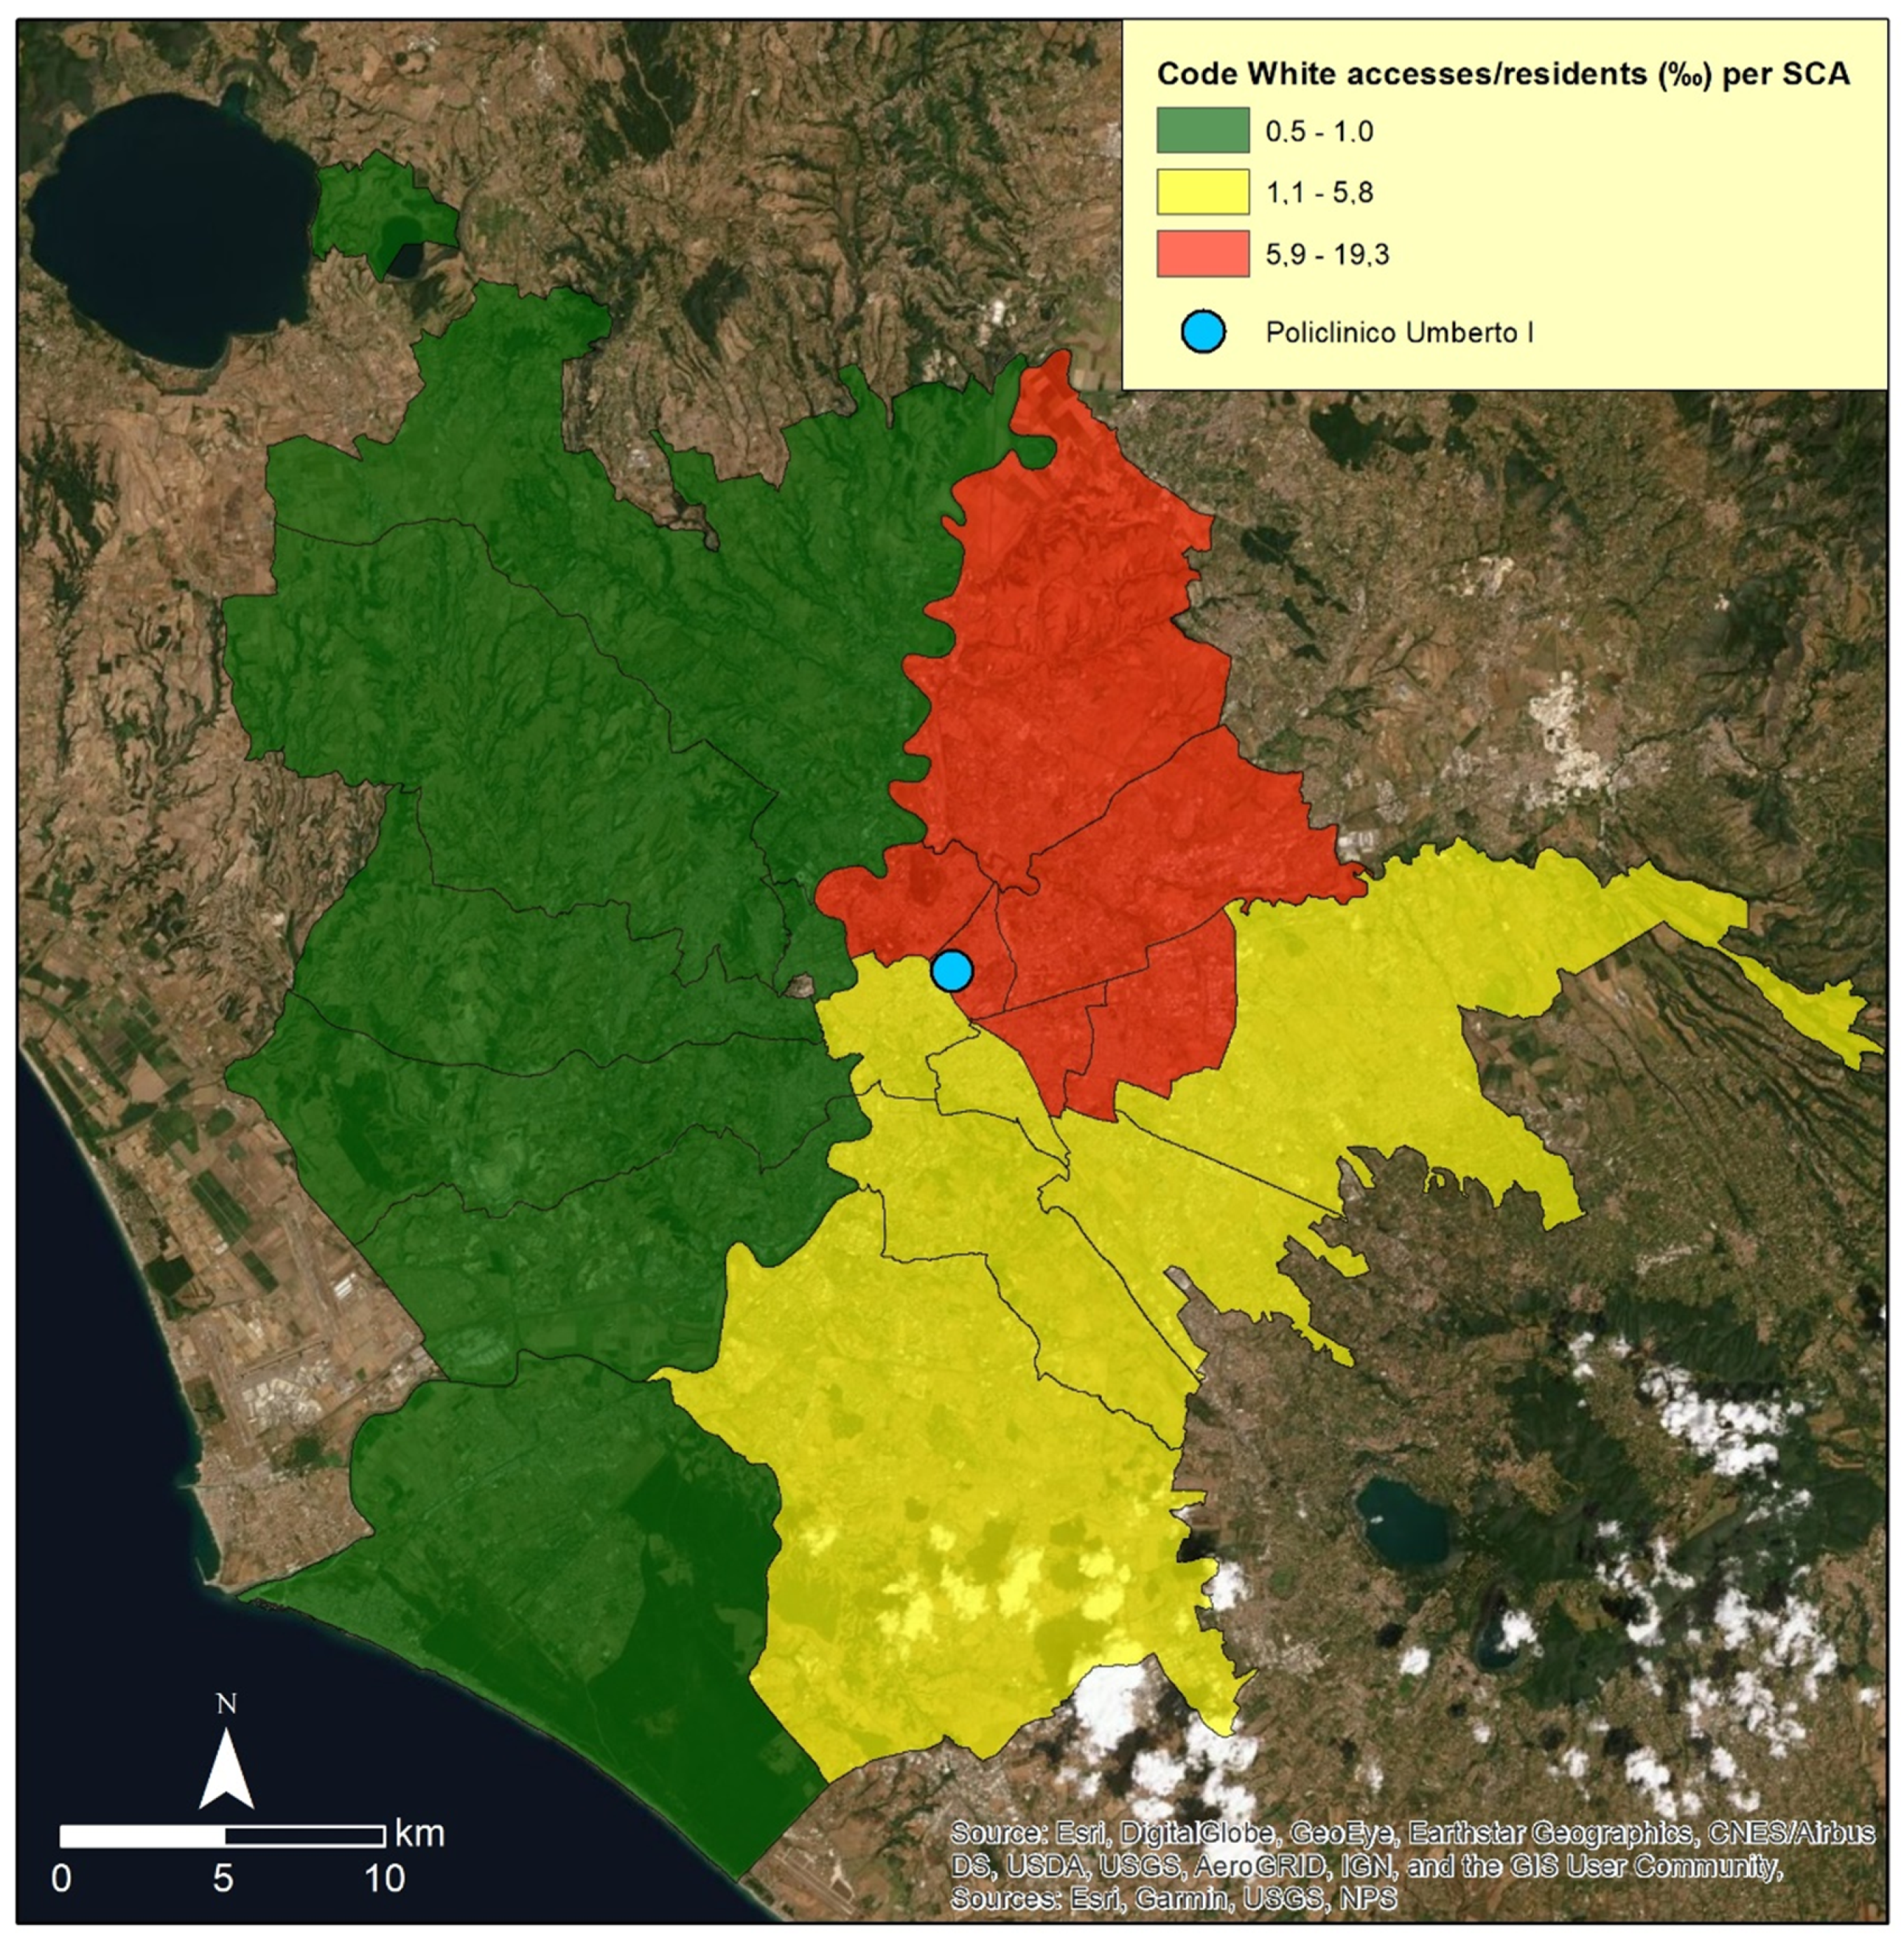
As an integration of the elaborations produced on absolute values,
Figure 6,
Figure 7 and
Figure 8 show the code white data in relation to the number of residents in 2011.
In particular,
Figure 6 underlines the census sections with the warm tones of orange and above all red which frequently use the emergency room of the Policlinico Umberto I even in the case of non-urgent problems. The framework is composite and new microzones with high values appear in a diffused way on the territory becoming noteworthy contexts since characterized by a high number of attendances with respect to the number of residents who therefore should be made more aware of appropriate behavior; a more consolidated GP-patient relationship; a more frequent use of the local healthcare unit. These relative values are affected by the high variability of the number of residents in the numerous census sections; consequently sometimes it can happen that a census section with a very small number of residents is characterized by a low absolute value of accesses in code white and, at the same time, by a high relative value with respect to the number of residents.
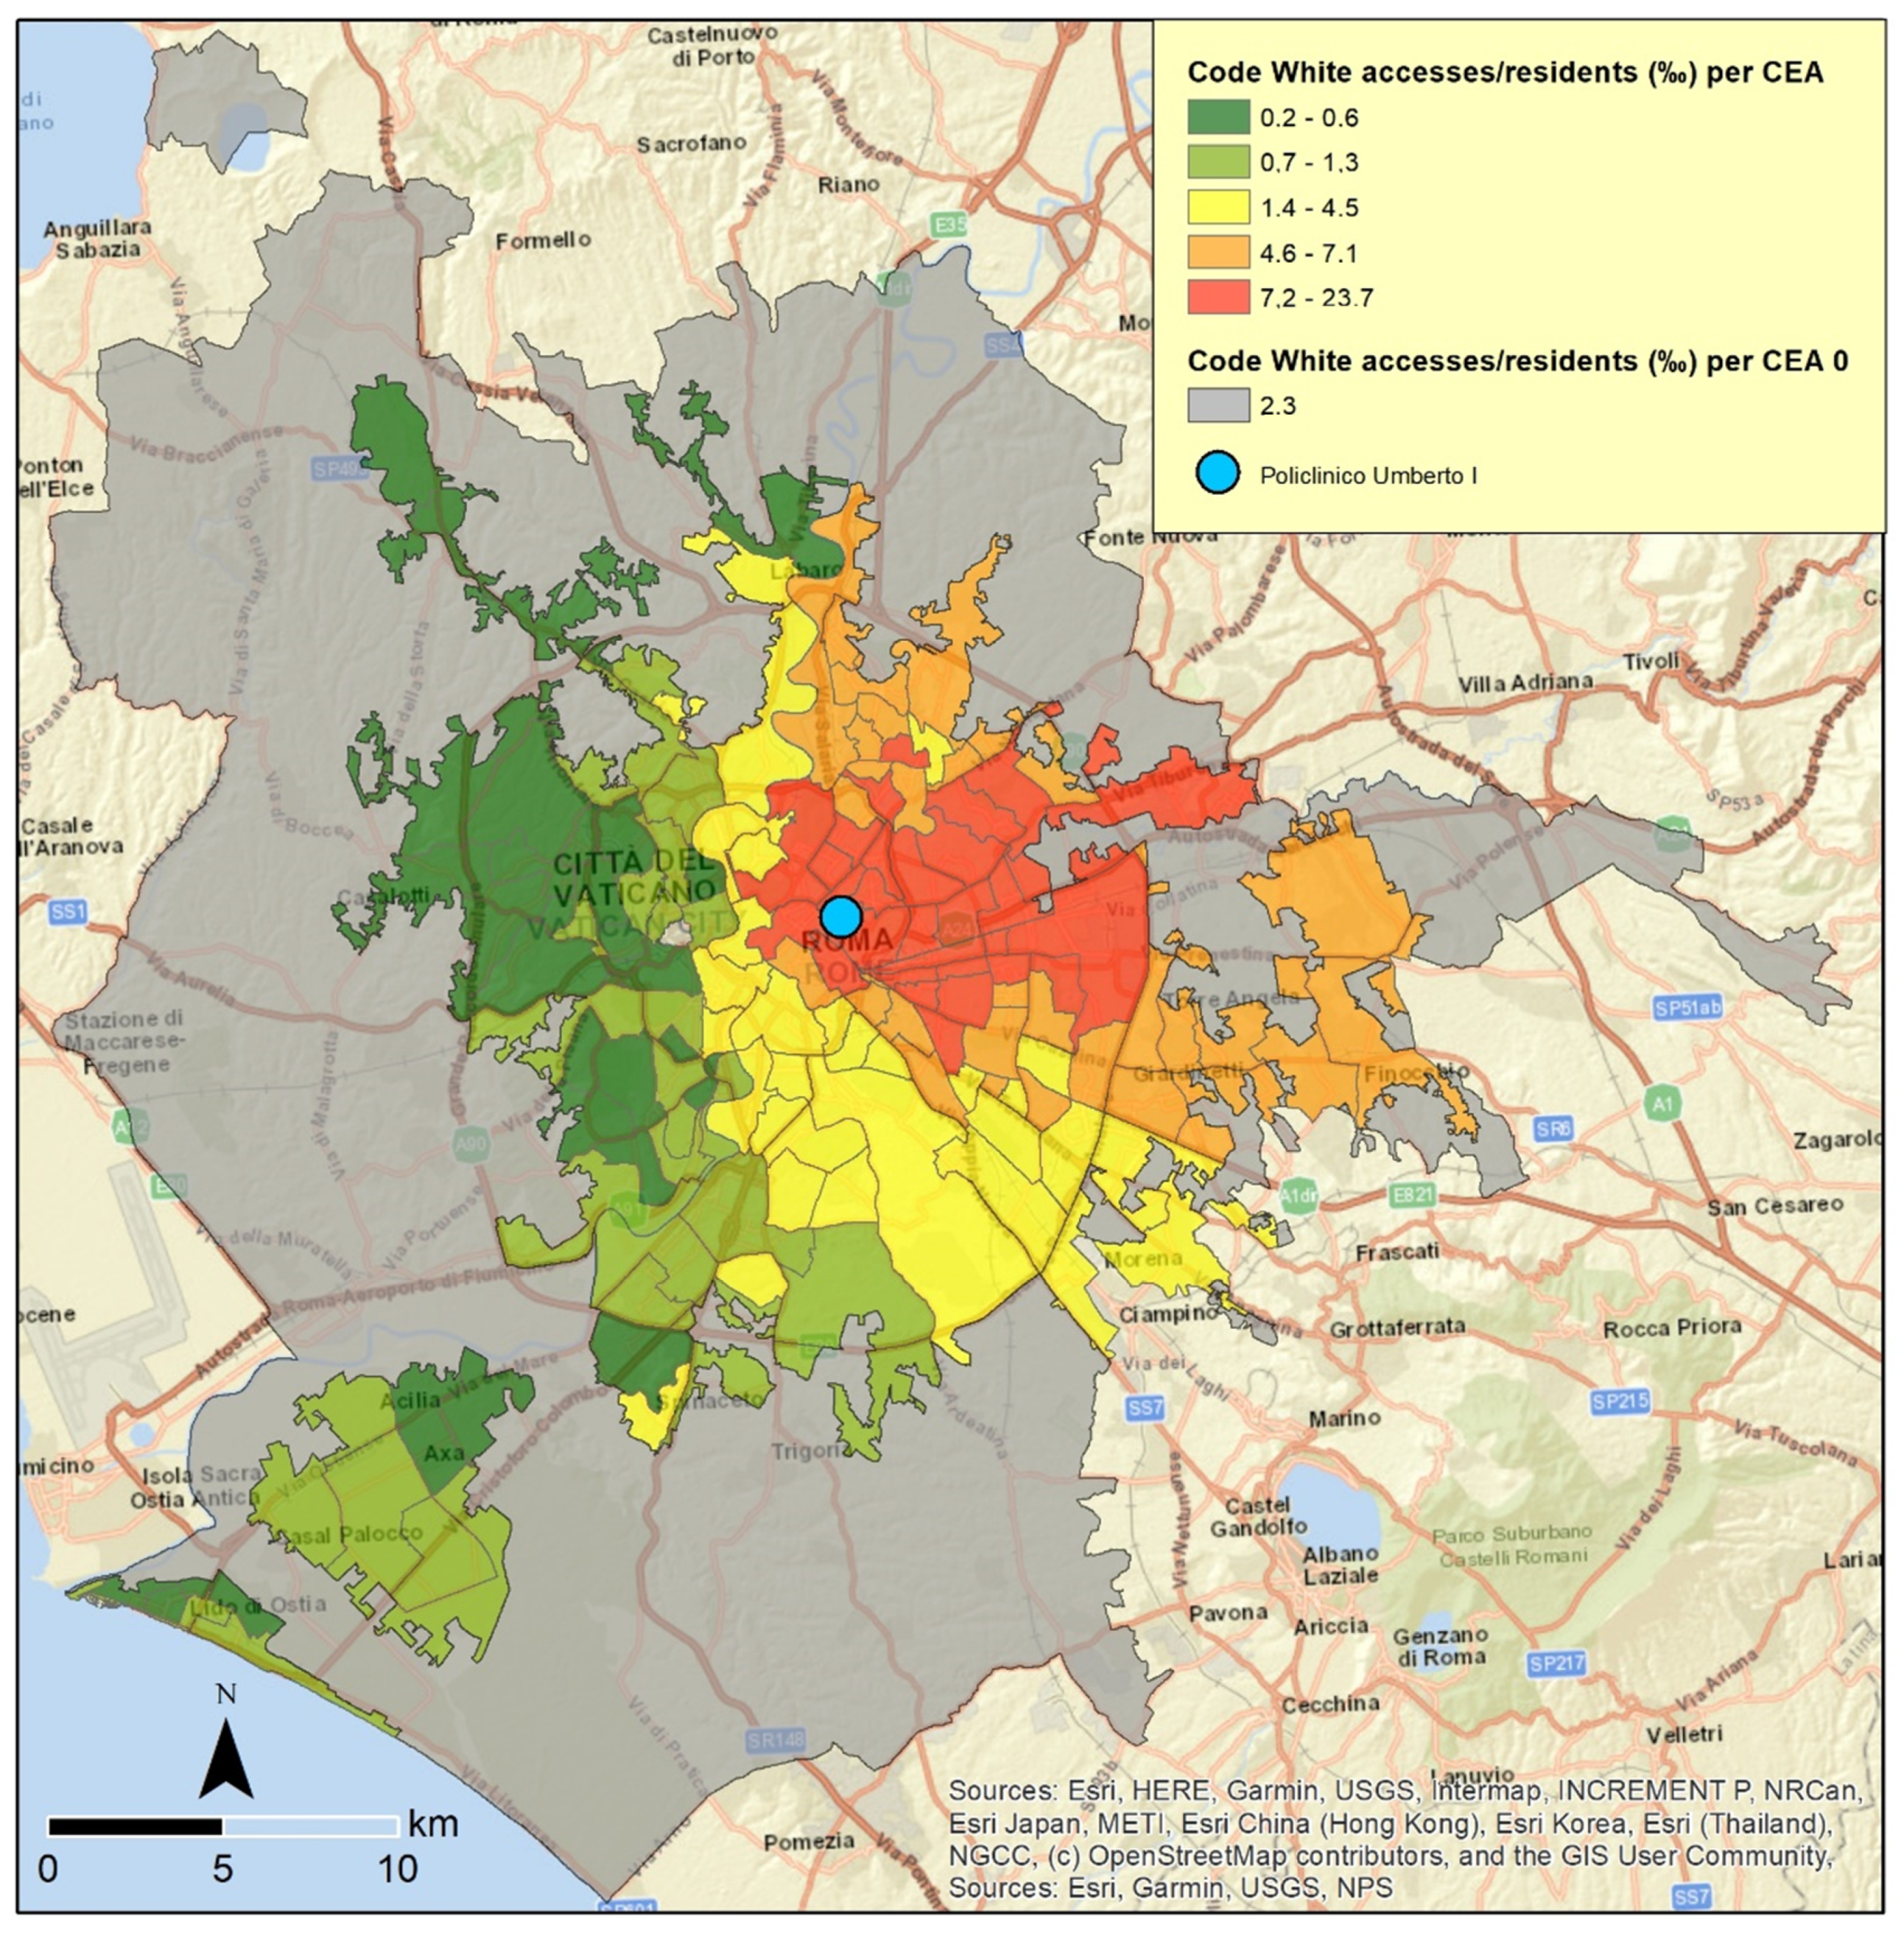
Figure 7 provides a general picture of the scale of the census areas and more or less confirm the situation shown in
Figure 4. The most significant difference is that the whole context made up of the census areas with the maximum values (7.2–23.7‰) is more compact and concentrated near the Policlinico Umberto I, with less external ramifications (outside the large ring road).
Figure 8 produced on the basis of sub-municipal areas, confirms the picture deriving from
Figure 5, with the exceptions of the vast and most external sub-municipal area in the eastern sector, which in
Figure 8 records medium values (while in
Figure 5 the same area is in the class with the maximum values); and a small sub-municipal area immediately to the north of the Policlinico Umberto I which in
Figure 8 is one of the contexts with the maximum values (while in
Figure 5 the same area is characterized by medium values).
As further important elements,
Figure 9,
Figure 10 and
Figure 11 show the situation considering the code white data in relation to the surface (square kilometers; kmq).
From a first general analysis,
Figure 9 would seem to evidence a framework that is strongly distinguished by low values and therefore very different with respect to the framework obtained by Figures 3 and above all 6. In fact, in
Figure 9, the view is affected by the dimension of the census sections and basically the largest census sections are characterized by the lowest values (0.2–20.1 accesses/kmq). The quantile criterion could not provide a map with a numerical prevalence of areas in a specific class and it is a visual effect due to the notable different dimension of the census sections. The census sections with the highest values (367.2–7961.2 accesses/kmq; also 218.7–367.1) have instead very few dimensions and consequently a high level of zoom in needed to show up the details.
Figure 10, based on census areas, if compared with
Figure 4 and
Figure 7, produced at the same representation scale, shows a reshaping of the values in the eastern sector with the increasing of the distance from the Policlinico Umberto I. In fact, in
Figure 4 many areas outside the large ring road had the highest values (fifth class, in red); in
Figure 7 these areas have a reshaping of the values (fourth class, in orange); in
Figure 10 these areas record a further reshaping of the values (third class, that it is to say medium values, in yellow).
Figure 11, concerning sub-municipal areas, highlights a partial reconfiguration if compared with
Figure 5 and
Figure 8, realized at the same representation scale. The sub-municipal areas with the highest values in
Figure 11 tend to surround the Policlinico Umberto I and have limited territorial dimensions (among small sub-municipal areas, only one of these, on the western side with respect to the hospital, records medium values and is represented in yellow).
5. Conclusions and Further Applicative Possibilities
A detailed and multilayer analysis based on the code white accesses in the Policlinico Umberto I emergency room, at different representation scale and in absolute and relative values, makes it possible to highlight a series of aspects which can be useful in terms of social utility for understanding and preventing overcrowding situations and for planning ad hoc actions and measures addressed to residents and local healthcare facilities. A similar piece of work gives inputs to replicate the methodology used and elaboration produced in order to have a wider framework of the actual situation in Rome, where the emergency rooms absorb a huge number of code white attendances which contribute to increasing problems, delaying procedures and decreasing the quality of assistance.
After all, the identification of the determinants and main causes of emergency department overcrowding is a key element in an attempt to reduce this important problem and a set of possible valid and reliable interventions requires a common commitment that would involve different institutions and the community. Strategies to rectify the main determinants need to be evaluated with detailed geographical analysis and by using clinically meaningful actions. Rigorous screening and the standardization of measures, involving different hospitals and health authorities, would allow for a comparison of possible strategies and the adoption of those that are considered as having a certain level of applicability and effectiveness [
38] (p. 39).
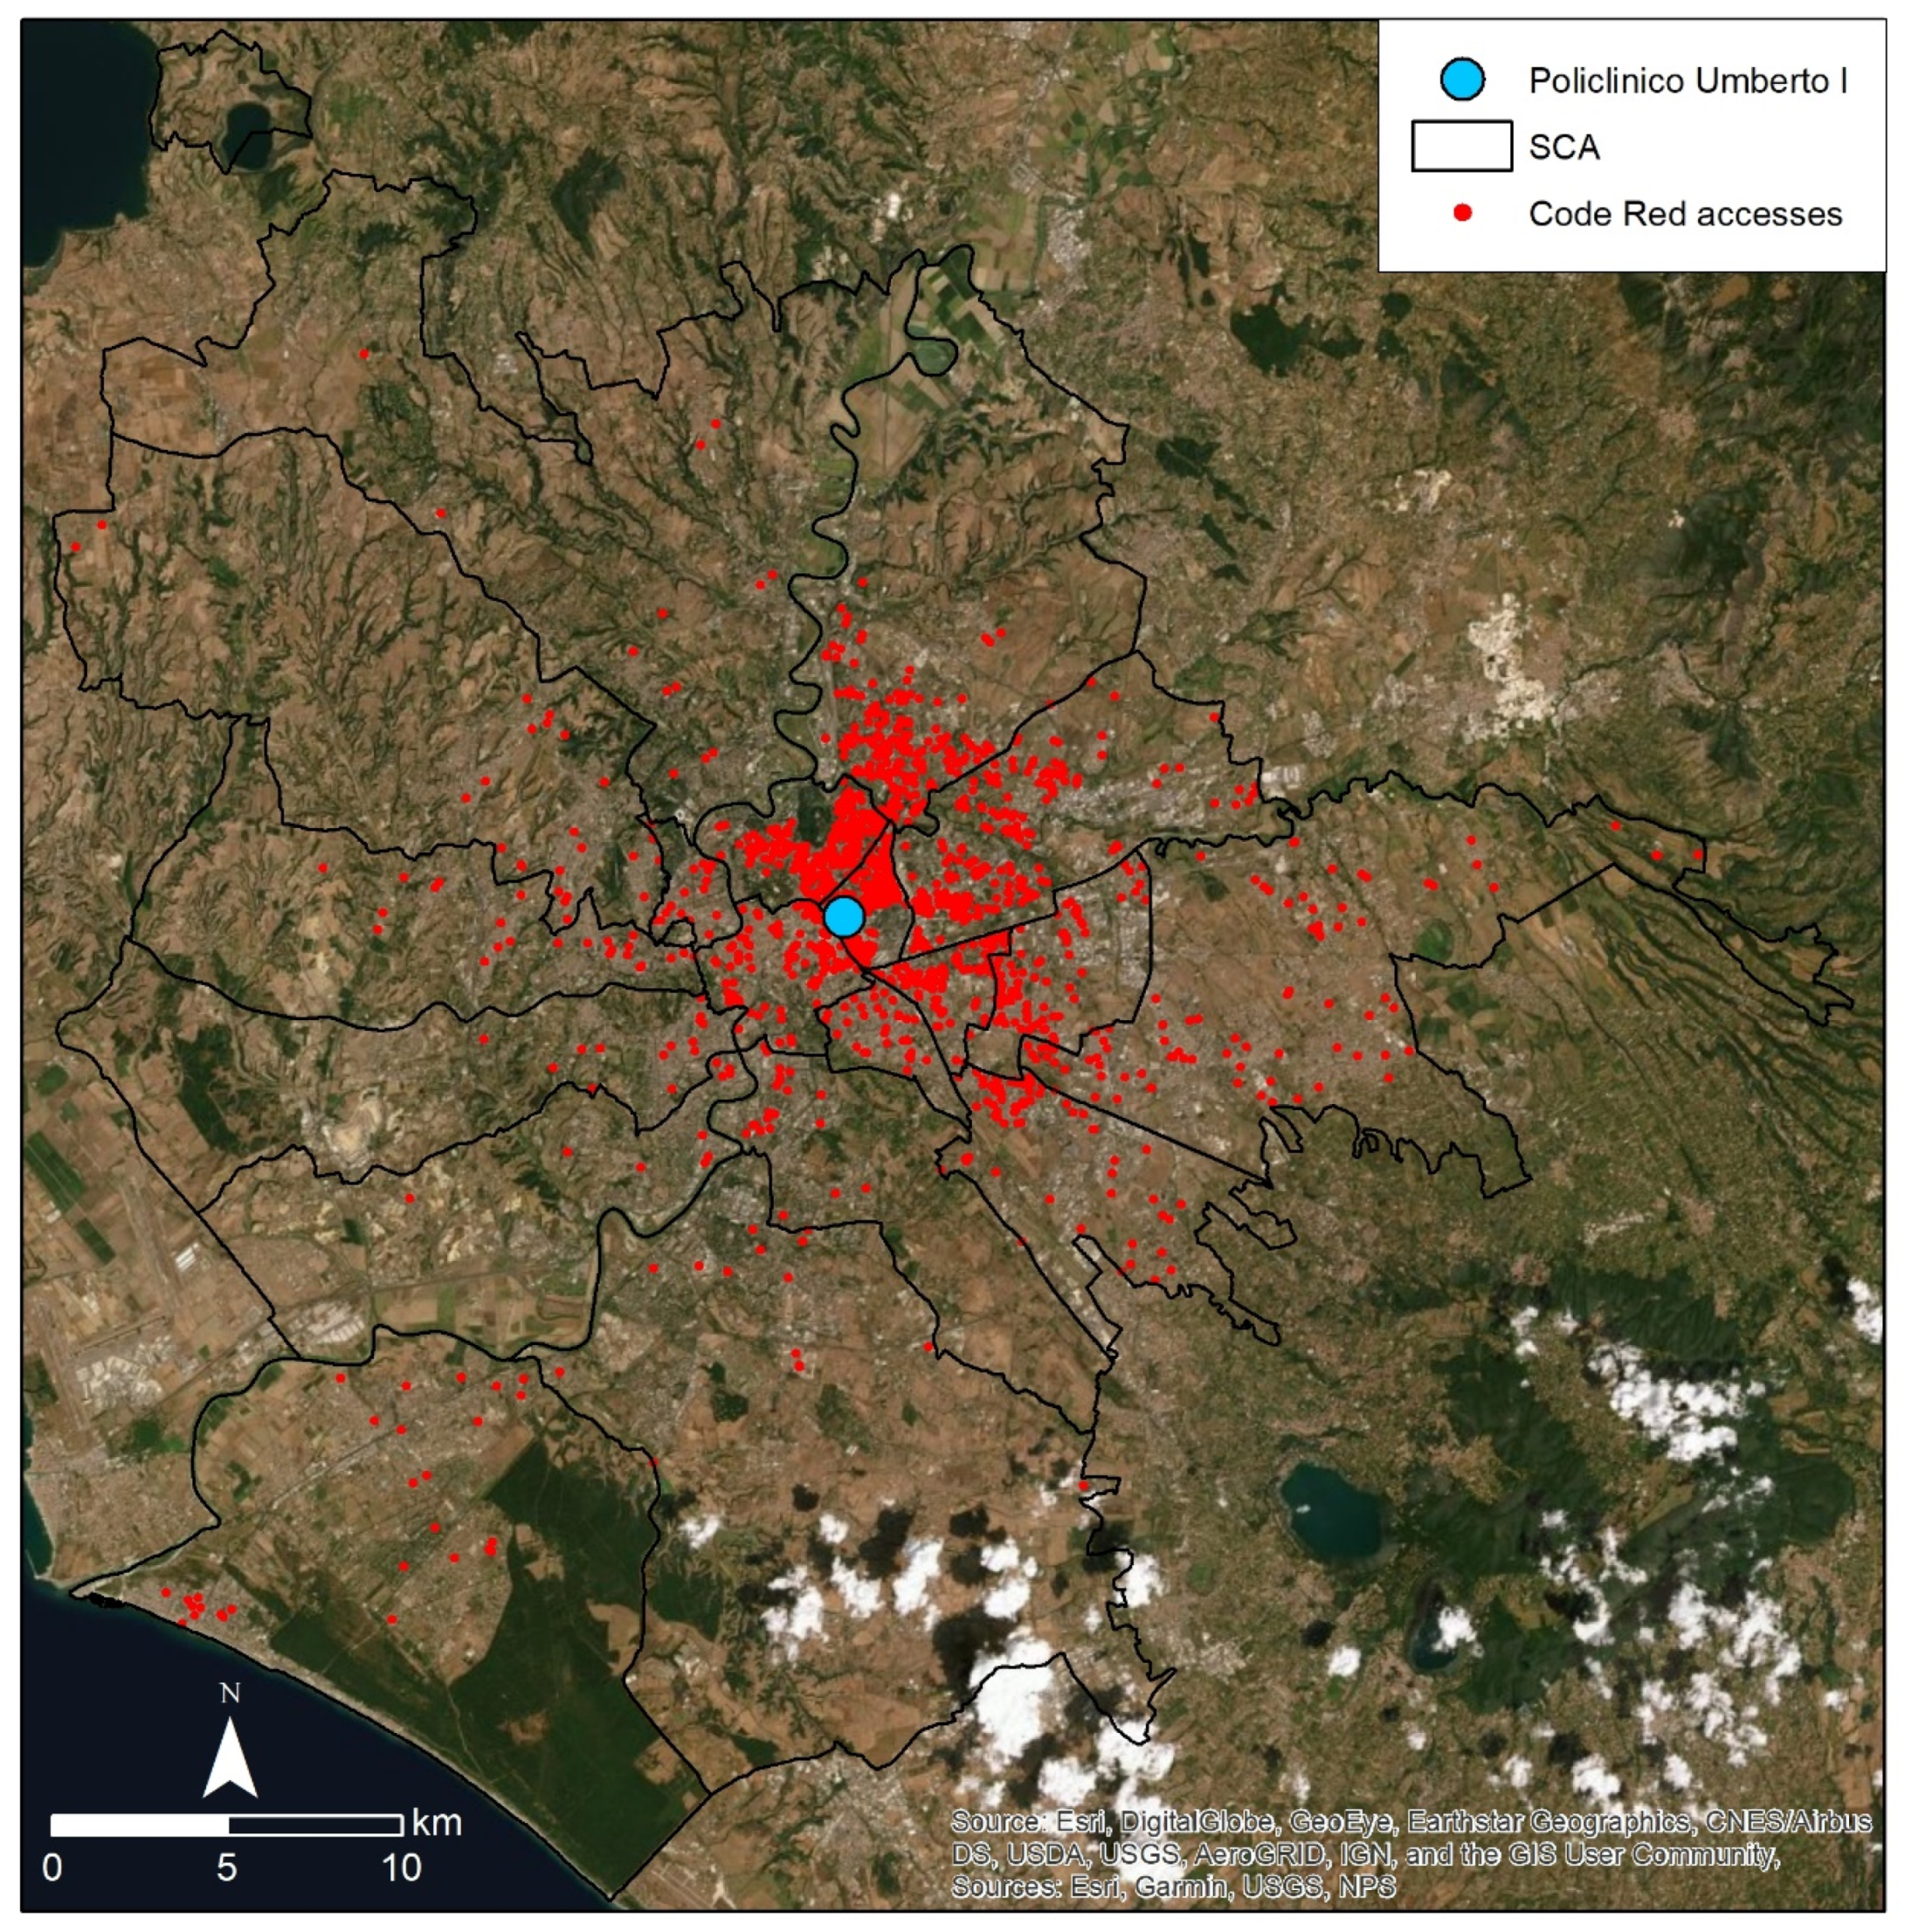
Moreover, the methodology here tested for code white and the data processing and GIS applications can be transferred and adopted also for other code color attendances, for example, code red which identifies a very critical life-threatening status and the need for the highest priority and immediate access.
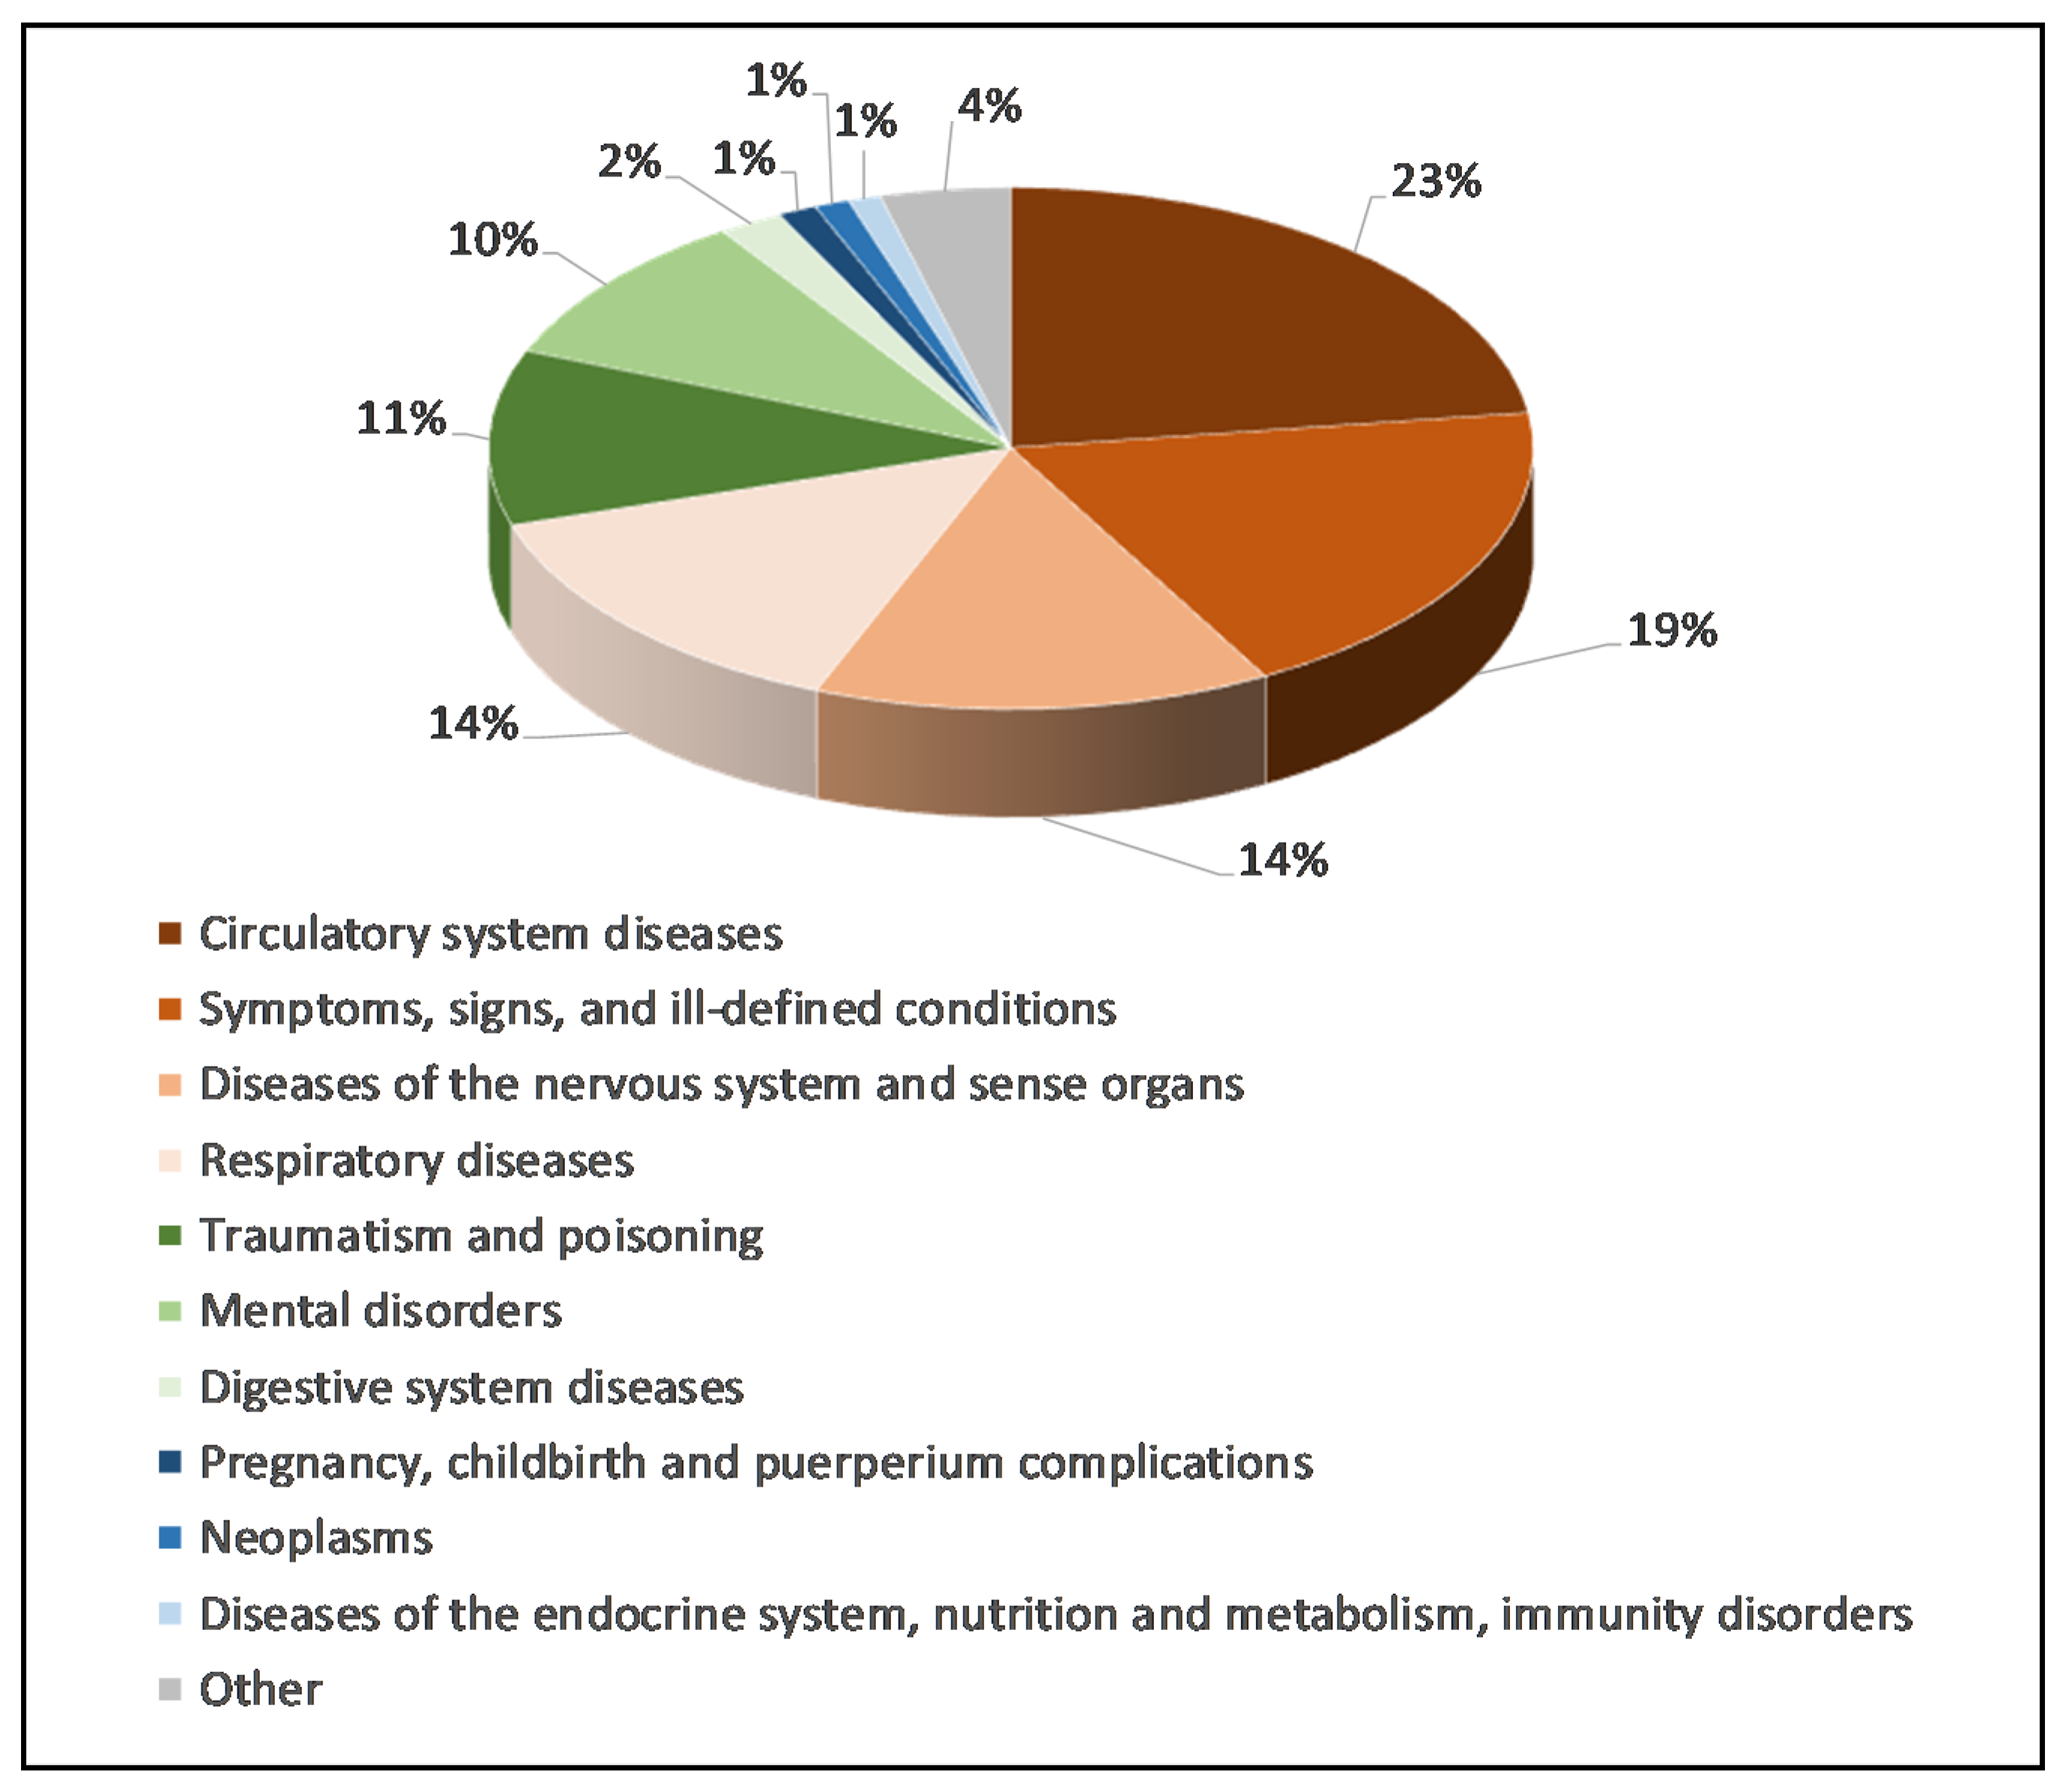
Therefore, by way of a preliminary example, after a subdivision of the accesses by cause (
Figure 12), a dot map concerning the attendances in code red (in 2011) in the Policlinico Umberto I emergency room has been analogously elaborated by geocoding (
Figure 13), after the data cleaning and data quality processes, on the basis of 1584 accesses.
In this case, the main causes of access (which together determine 70% of the attendances) are:
- -
Circulatory system diseases (23%);
- -
Symptoms, signs, and ill-defined conditions (19%);
- -
Diseases of the nervous system and sense organs (14%) and respiratory diseases (14%).
As far as concerns the geographical distribution of the accesses, the dot map based on code red by and large confirms, with a reshaping of the numerousness, the framework derived by
Figure 2, with the zones nearest to the Policlinico Umberto I and the eastern sector particularly affected. Various ramifications are evident also at a relevant distance, but the possibility persists of an attendance coming from a place that is different with respect to the place in which people habitually live (workplace, car accident, etc.) and it confirms the importance of rigorous data collection at the moment of triage. Through the code red accesses, it is nevertheless possible to acquire another kind of information with respect to the code white because it means considering, in addition to a vicinity criterion, also people and relatives who decide to go to the Policlinico Umberto I when their life is at risk and so it is possible to define also the catchment area of very urgent cases.
The methodological process here tested, supported by geocoding with a “source” map, in the form of a dot map where cases are geolocalized on a satellite image or other templates, and successive elaborations in digital choropleth maps, where the data are grouped at different geographical scales according to suitable criteria, finds many application possibilities to study sanitary and epidemiological aspects and problems. Naturally, according to the different situations and circumstances, for example for supporting rapid and direct measures, as in the case of the emergency related to COVID-19, different criteria can be chosen to make a stratification and highlight the areas where the values are particularly high and noteworthy. In fact, it is above all useful to plan a hierarchy of interventions and actions, also creating containment buffer zones of the epidemic.
Also in the case of the ill-fated social-sanitary (and economic) crisis due to SARS-CoV-2, some works have underlined the importance of having specific data concerning the single COVID-19 cases (contagion and death) by domicile (the present address or the place in which people habitually live) and by residence (the usual main residence) in order to produce dynamic digital maps, that can be continuously auto-updated with the daily data, to elaborate models and scenarios and to conduct interdisciplinary analysis at geospatial and evolutionary levels [
39]. Geocoding and other ad hoc functionalities would be able to highlight important details, moving a geographical magnifying glass over the different zones and the deriving applications would be very useful for defining measures and a hierarchy of priorities. In similar situations, an accurate geocoding and the production of related digital dot maps can help to recognize the areas with a relevant concentration of cases, and the aggregation of the data, i.e., for census sections, census areas and sub-municipal areas, or the application of functions as kernel density make it possible (maintaining confidentiality) to detect patterns, clusters, and trends, providing fundamental inputs for epidemiological investigations [
40] (p. 202). A project of an Epidemic Location and Intelligence System (ELIS), recently launched to monitor the spread of COVID-19, has been founded on functionalities regarding data analysis and modeling; geocoding and mapping of tested and confirmed cases availing of suitable address models; visualization of infection diffusion over time; identification of critical areas (i.e., with vulnerable age groups) and zones having capacities and medical resources to effectively tackle the epidemic crisis; epidemic prediction and data communication [
41] (p. 2).
Geocoding and spatial analysis offer a wide set of possible added values in different applications of medical geography and sanitary-epidemiological research; in the present work, we have focused particular attention on the possibilities aimed at reducing emergency room overcrowding, due to code white attendances, through a territorial screening conducted by using the Policlinico Umberto I data in Rome for a pilot study. For the actual potentialities to be made explicit on a vast radius, it would be necessary to have a uniform data collection system available that gives back suitable information, starting from the complete domicile and residence address and the place of provenance at the moment of the problem onset. By processing and elaborating correct building geolocalization and identification data through geocoding and spatial analysis in a multiplicity of situations, it is possible to produce GIS modeling and interdisciplinary research that is considerably useful to support a thorough data and map driven governance and to propose good practices and ad hoc measures, in order to: reduce huge problems; save human lives; recognize what the areas are where specific problems and phenomena are densely concentrated, and which require rapid and heavy interventions.
Moreover, for this pilot study, we have used retrospective data, looking to optimize and maximize the results obtainable with previous surveys. In the case of perspective data, detected with specifically devised methods, it is possible to actively contribute even more to strategic urban planning processes, based on data ad hoc conveniently collected, cataloged, and then elaborated and analyzed. Some shared choices for the sanitary data standardization and recording, in the optic of a geo-information approach based on interdisciplinary view and GIS applications, can favorably help to the development of smart contexts and to a re-equilibrium of territorial disparities.
Future research should focus on the possibility of implementing a spatial analysis system that allows for near-real-time analysis of emergency room access. This system would make it possible to identify areas of the emergency room catchment area from which inappropriate cases come, in order to alert the territorial services and GPs of that specific area as soon as possible. This continuous monitoring should, however, lead to an identification of deficiencies that could direct health policies towards a better management of territorial services and a reduction in overcrowding in the emergency room.
The present work is a pilot study based on a singular but relevant case for the amount of the data, flows, and related management-logistical and perceptive-emotional problems, which can provide useful insights also into the perspective of testing processes, methods, tools, and functions to be readapted in other sanitary-epidemiological emergency contexts, in the optic of the case study research and applications, theorized in 1984 and recently implemented in the design and operative potentialities since a similar approach is gaining the spotlight in medical geography and social science [
42,
43].


