Site Selection for Pre-Hospital Emergency Stations Based on the Actual Spatiotemporal Demand: A Case Study of Nanjing City, China


Abstract
:1. Introduction
2. Literature Review
3. Introduction of the Model and Method
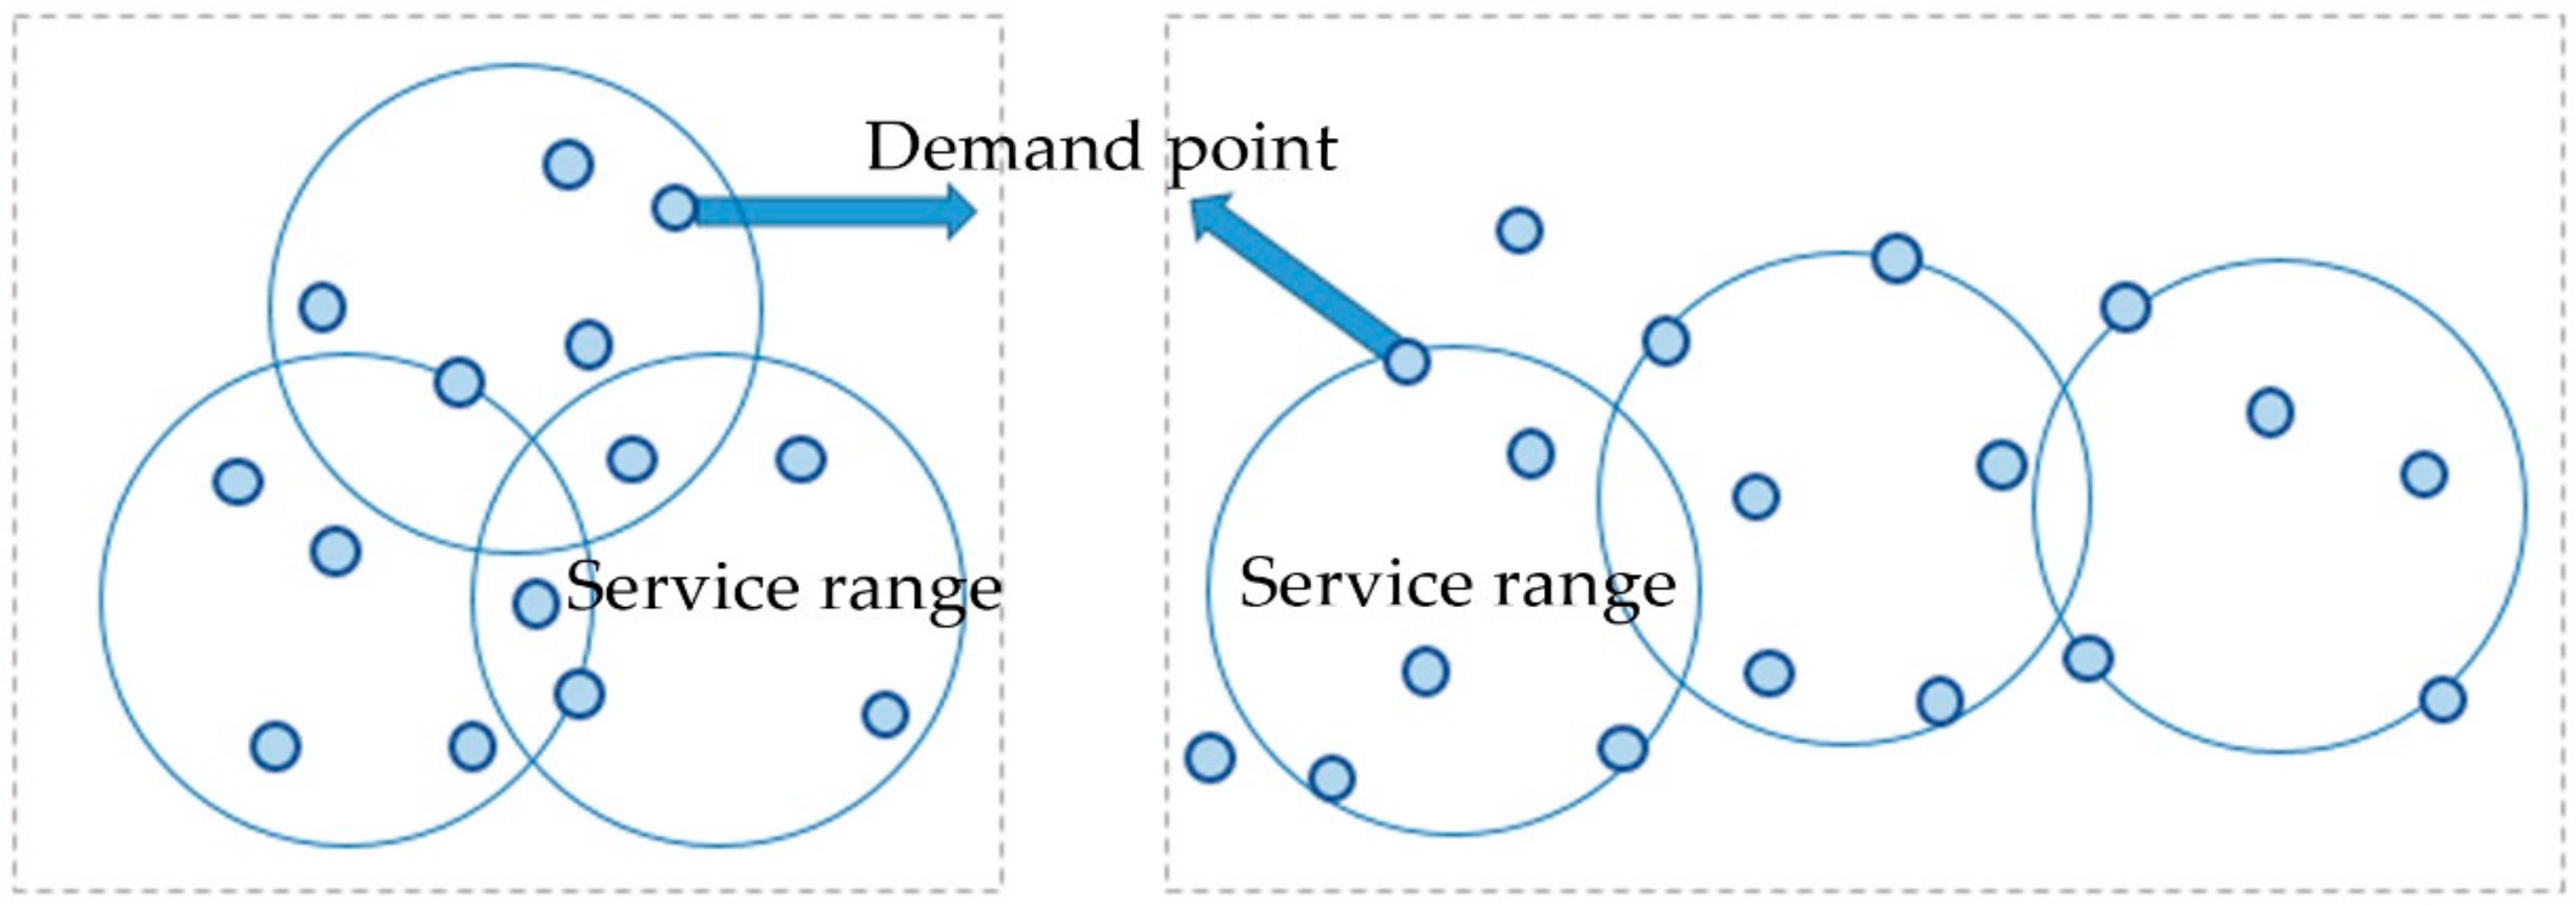
3.1. Set Covering Model
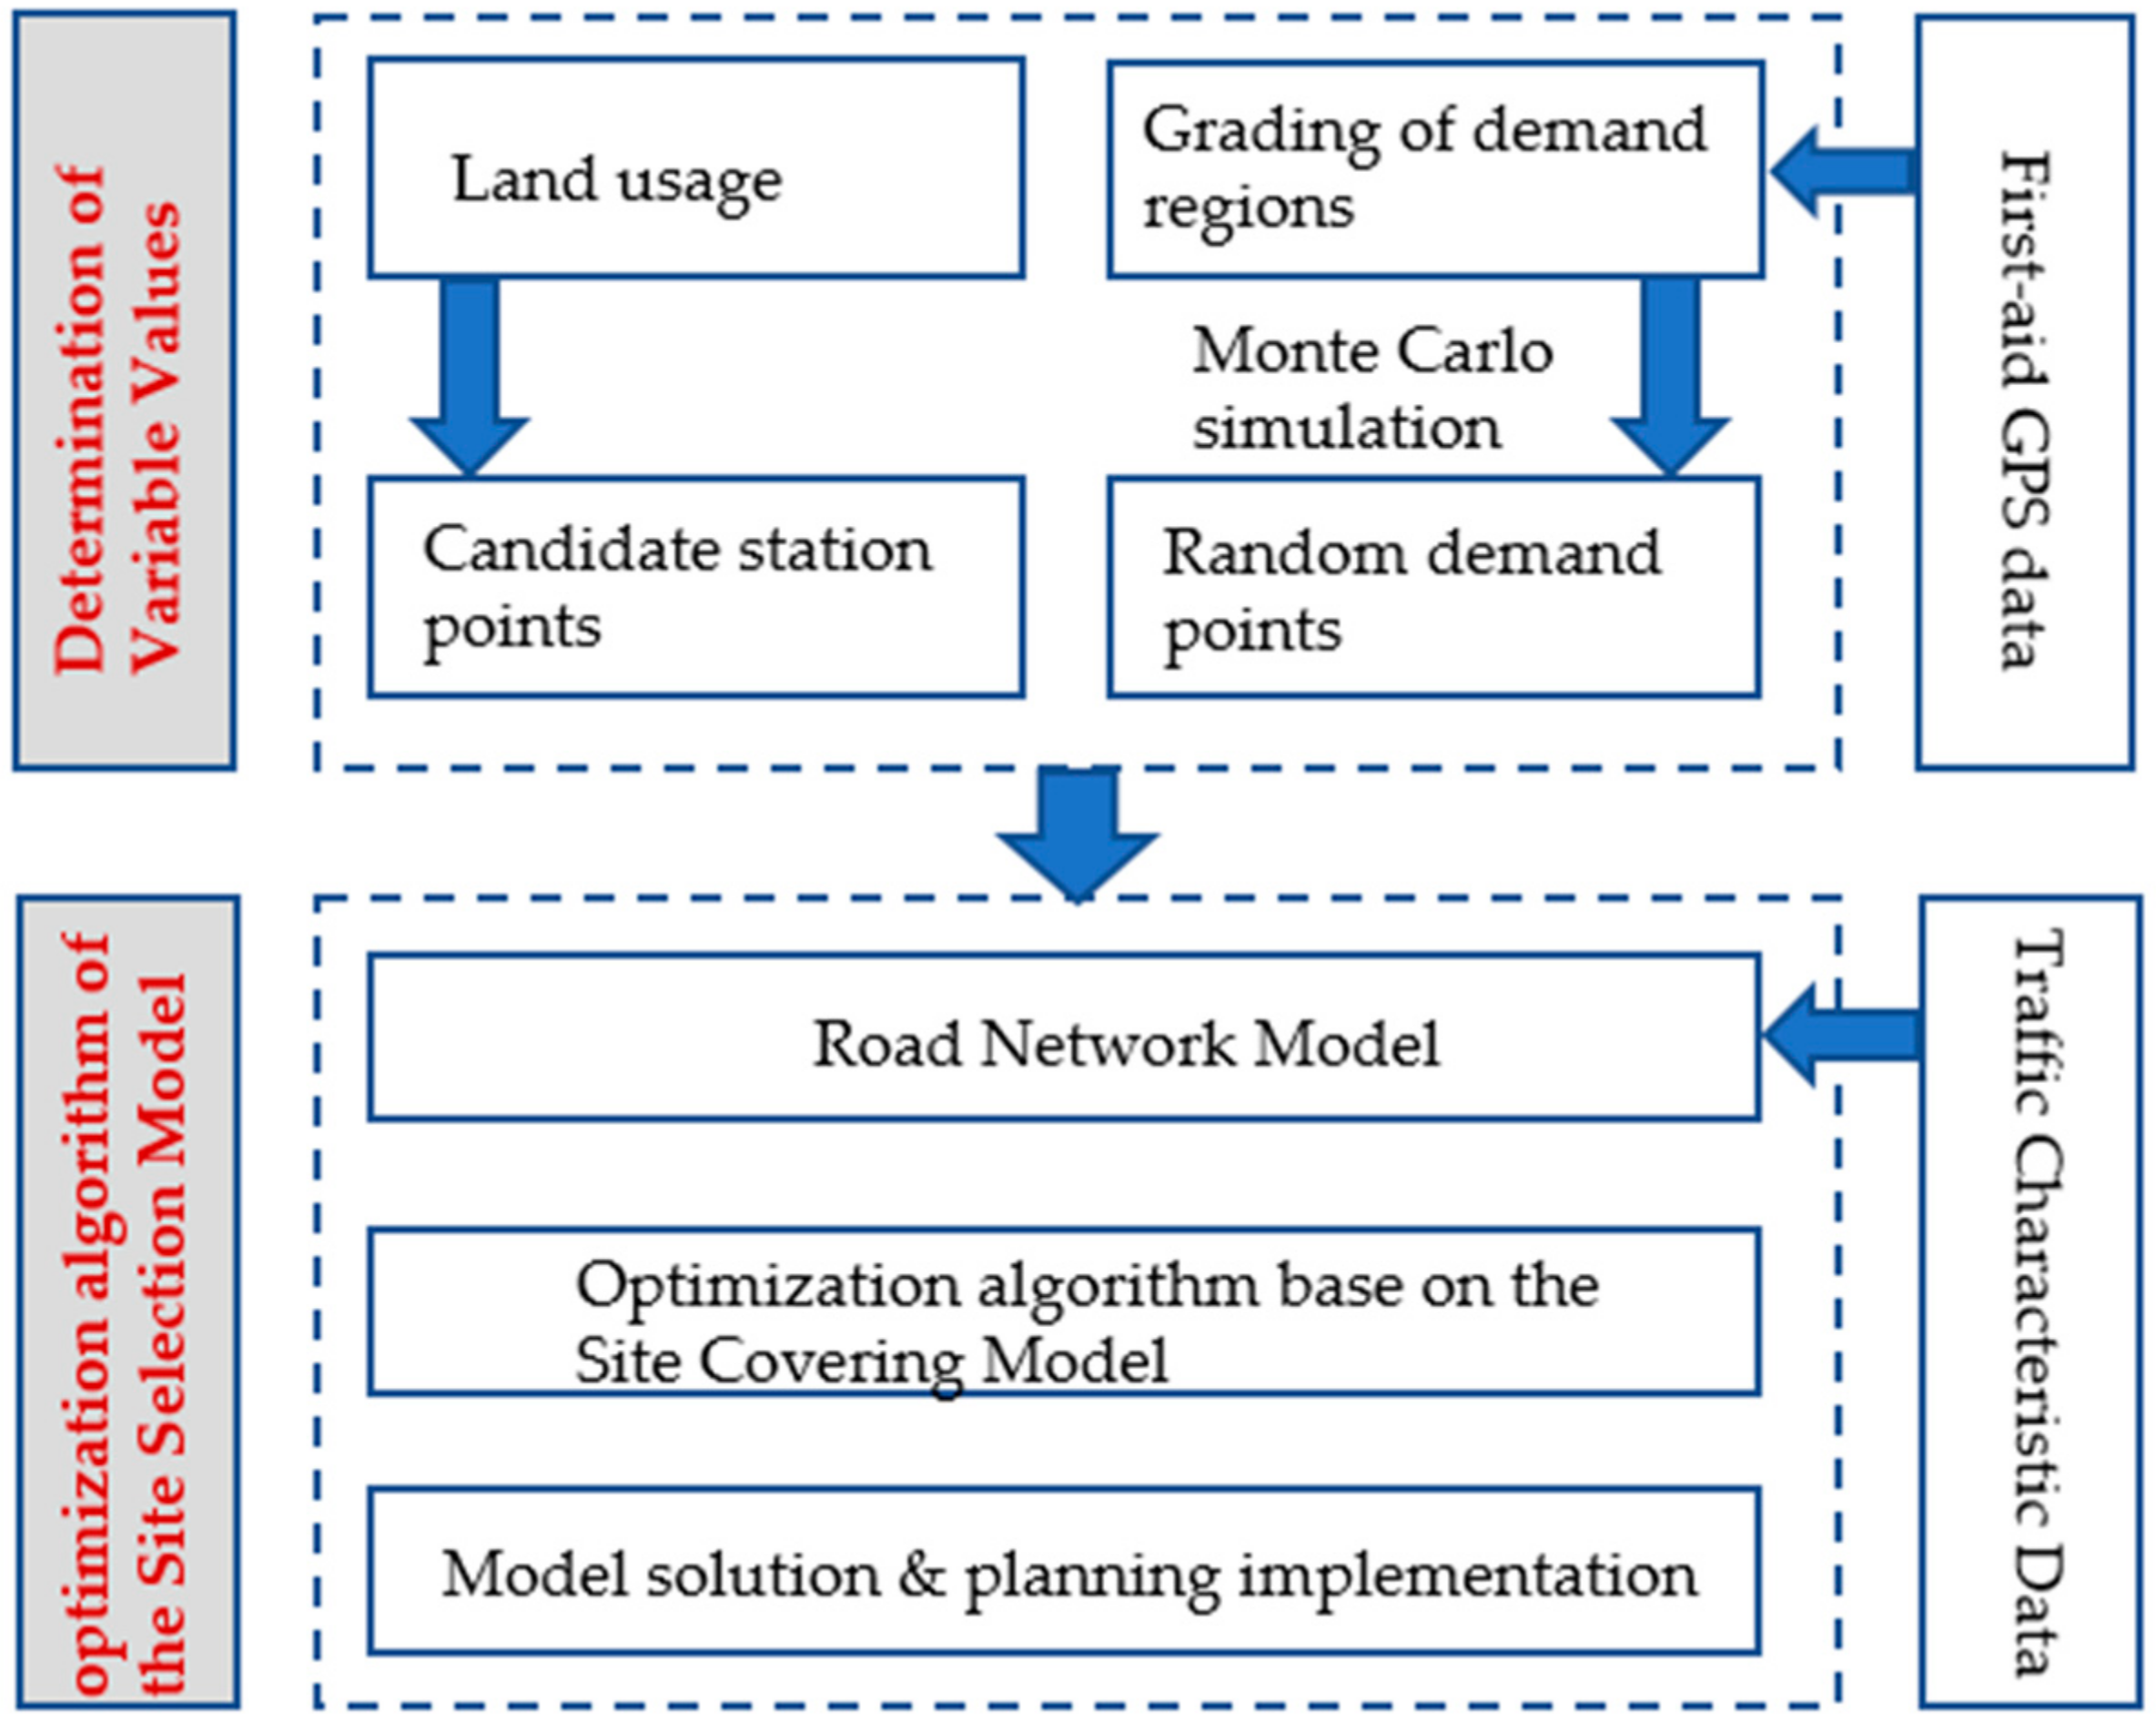
3.2. Steps of the Algorithm
3.2.1. Determination of Variable Values (Demand Points and Candidate Points)
3.2.2. Building the Site Selection Model
4. Data Sources
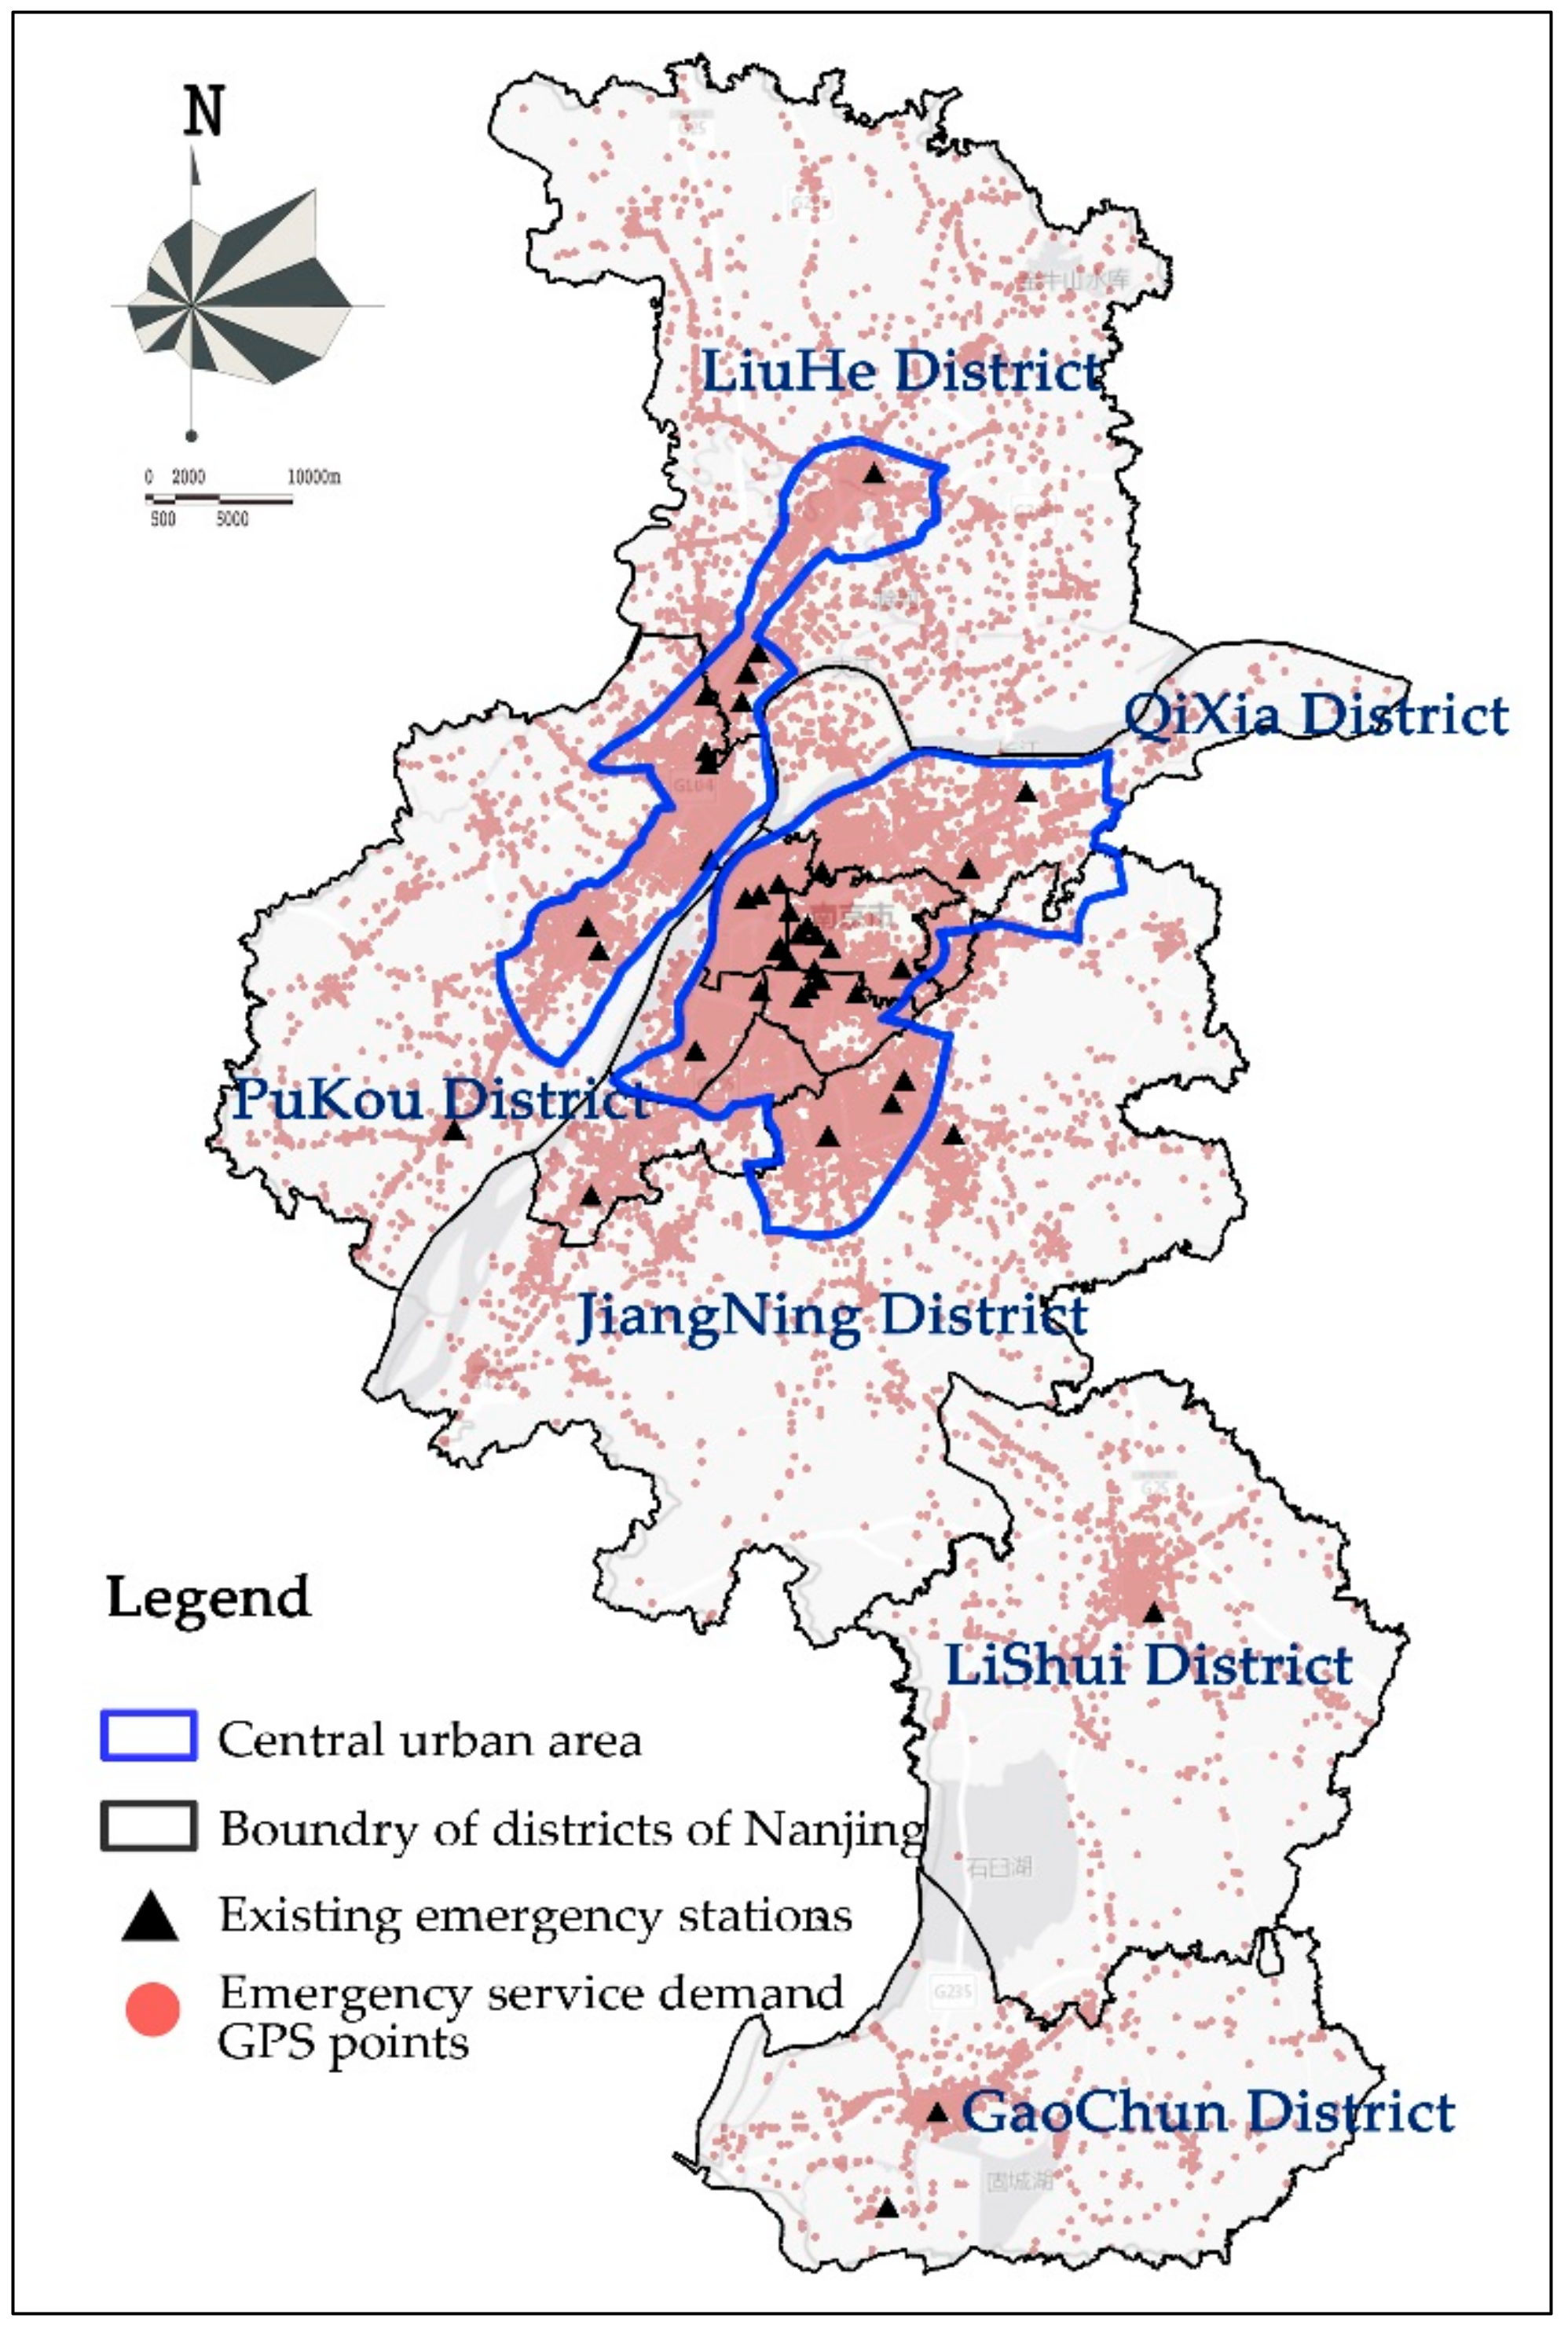
4.1. Research Area
4.2. Data Sources and Processing
4.2.1. GPS Data of Ambulances
4.2.2. Obtaining Real-Time Traffic Data through the Gaode Map Open API
5. Factor Analysis and Results
5.1. Determination of
5.2. Generated Results after Substituting Data into the Model
5.2.1. Selecting Candidate Station Sites According to Land Use Planning and Writing the Selected Sites in the Set M
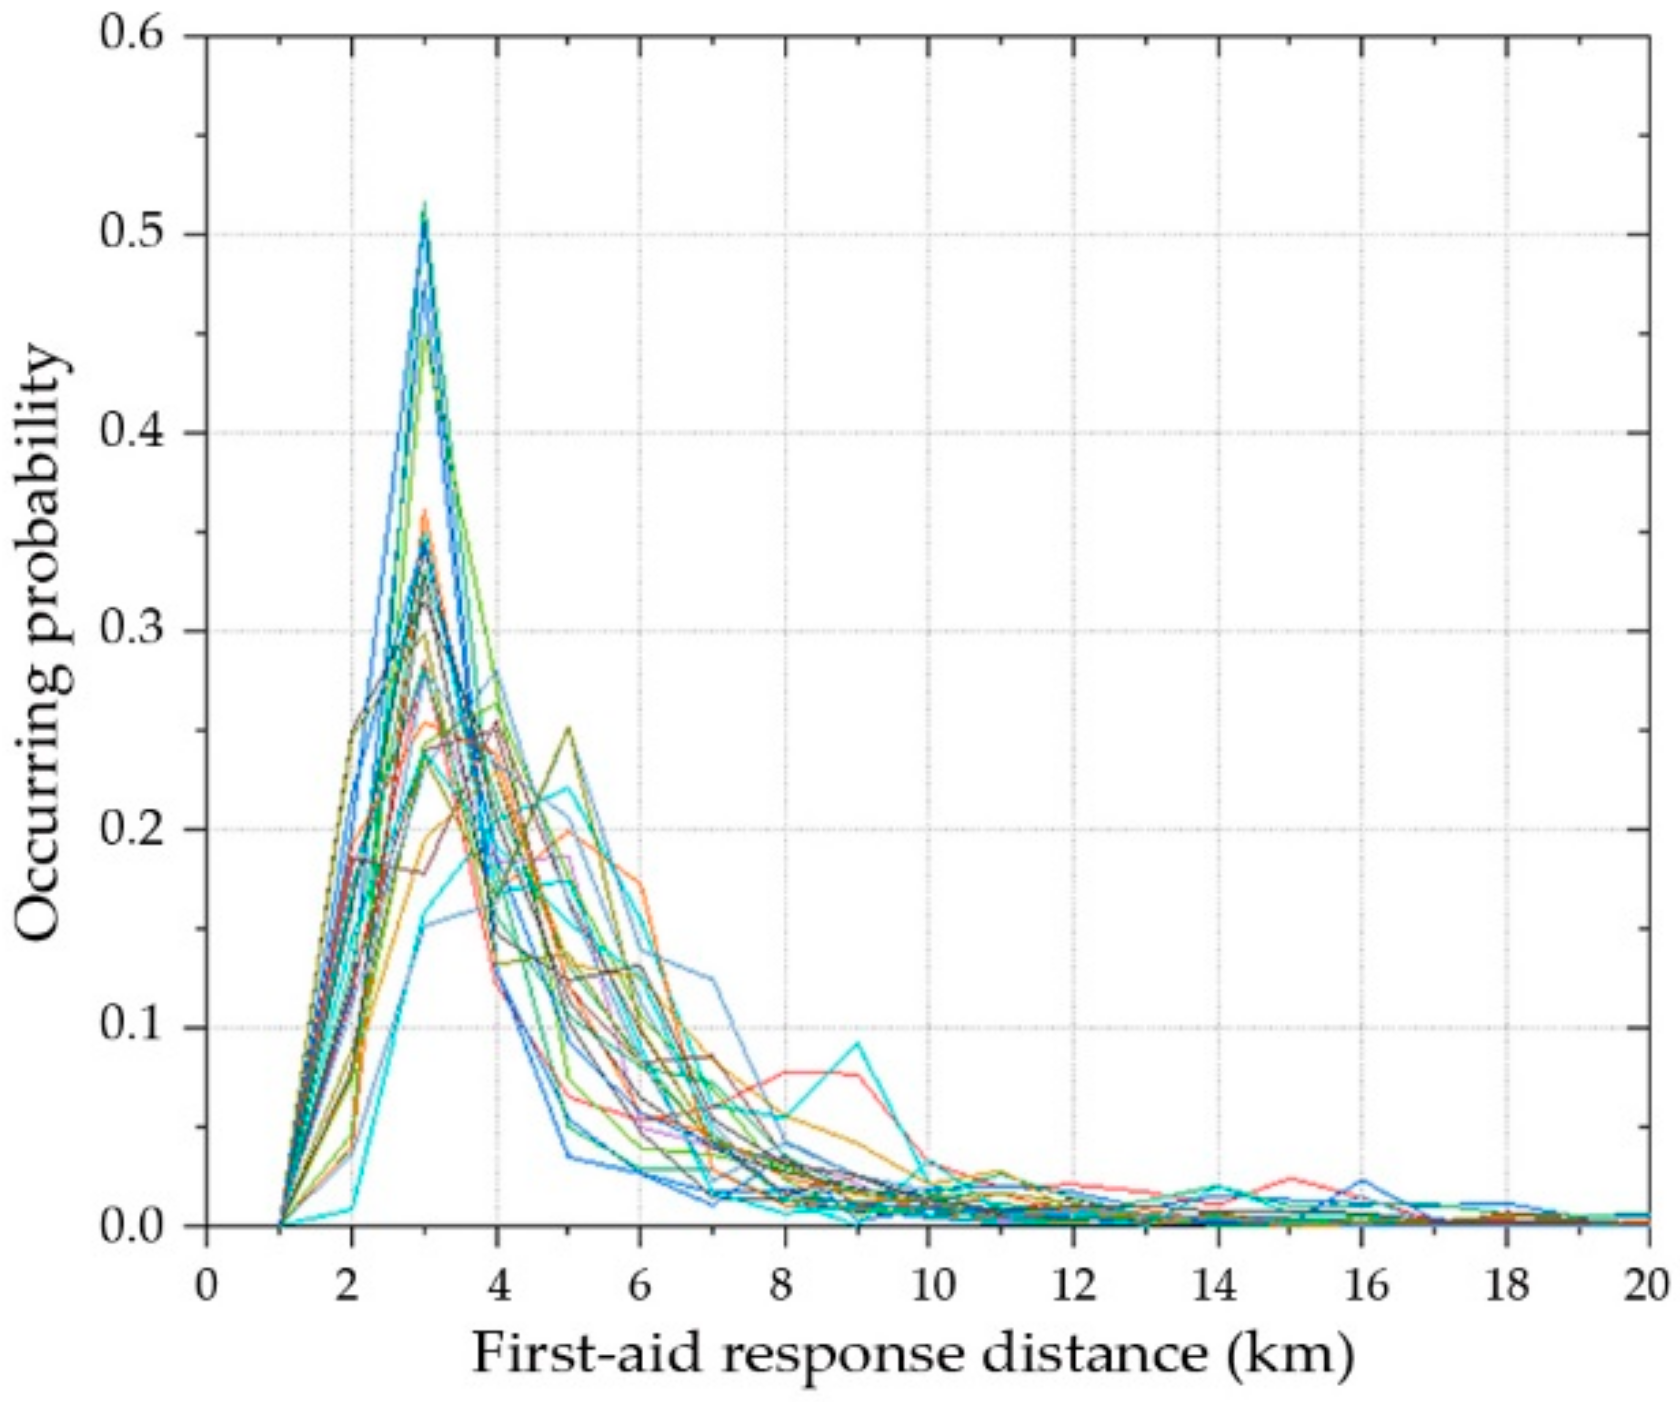
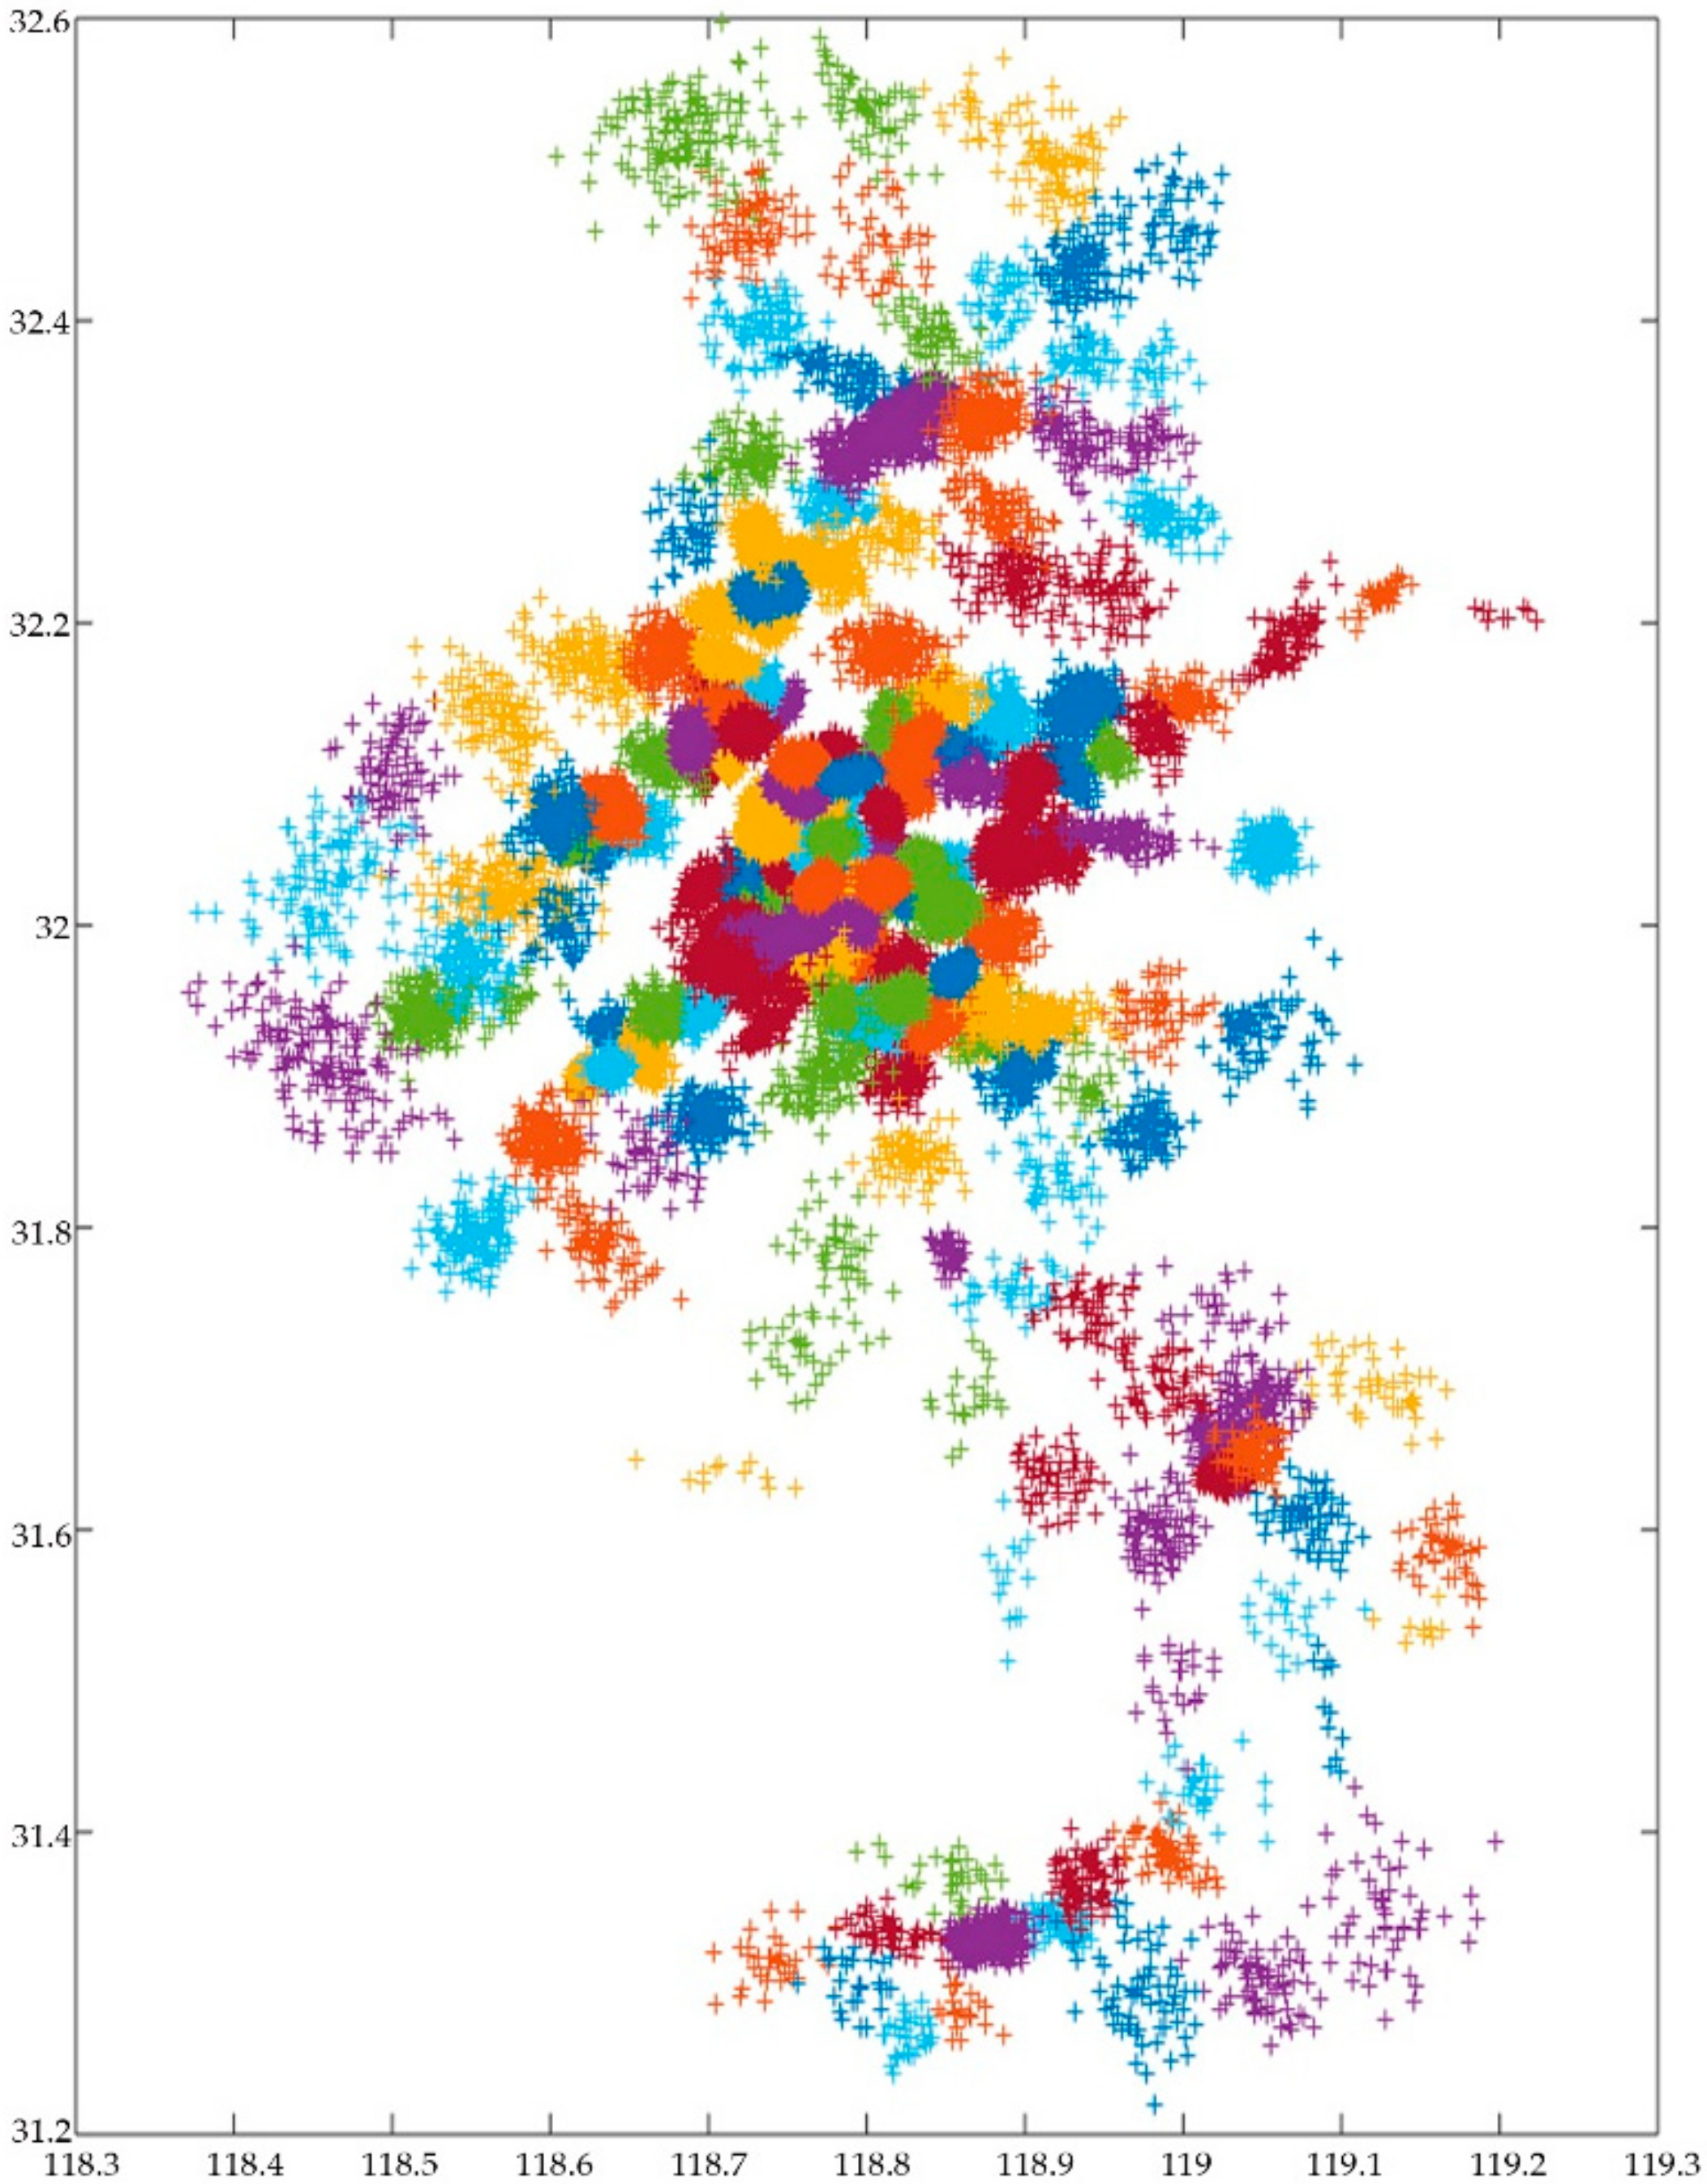
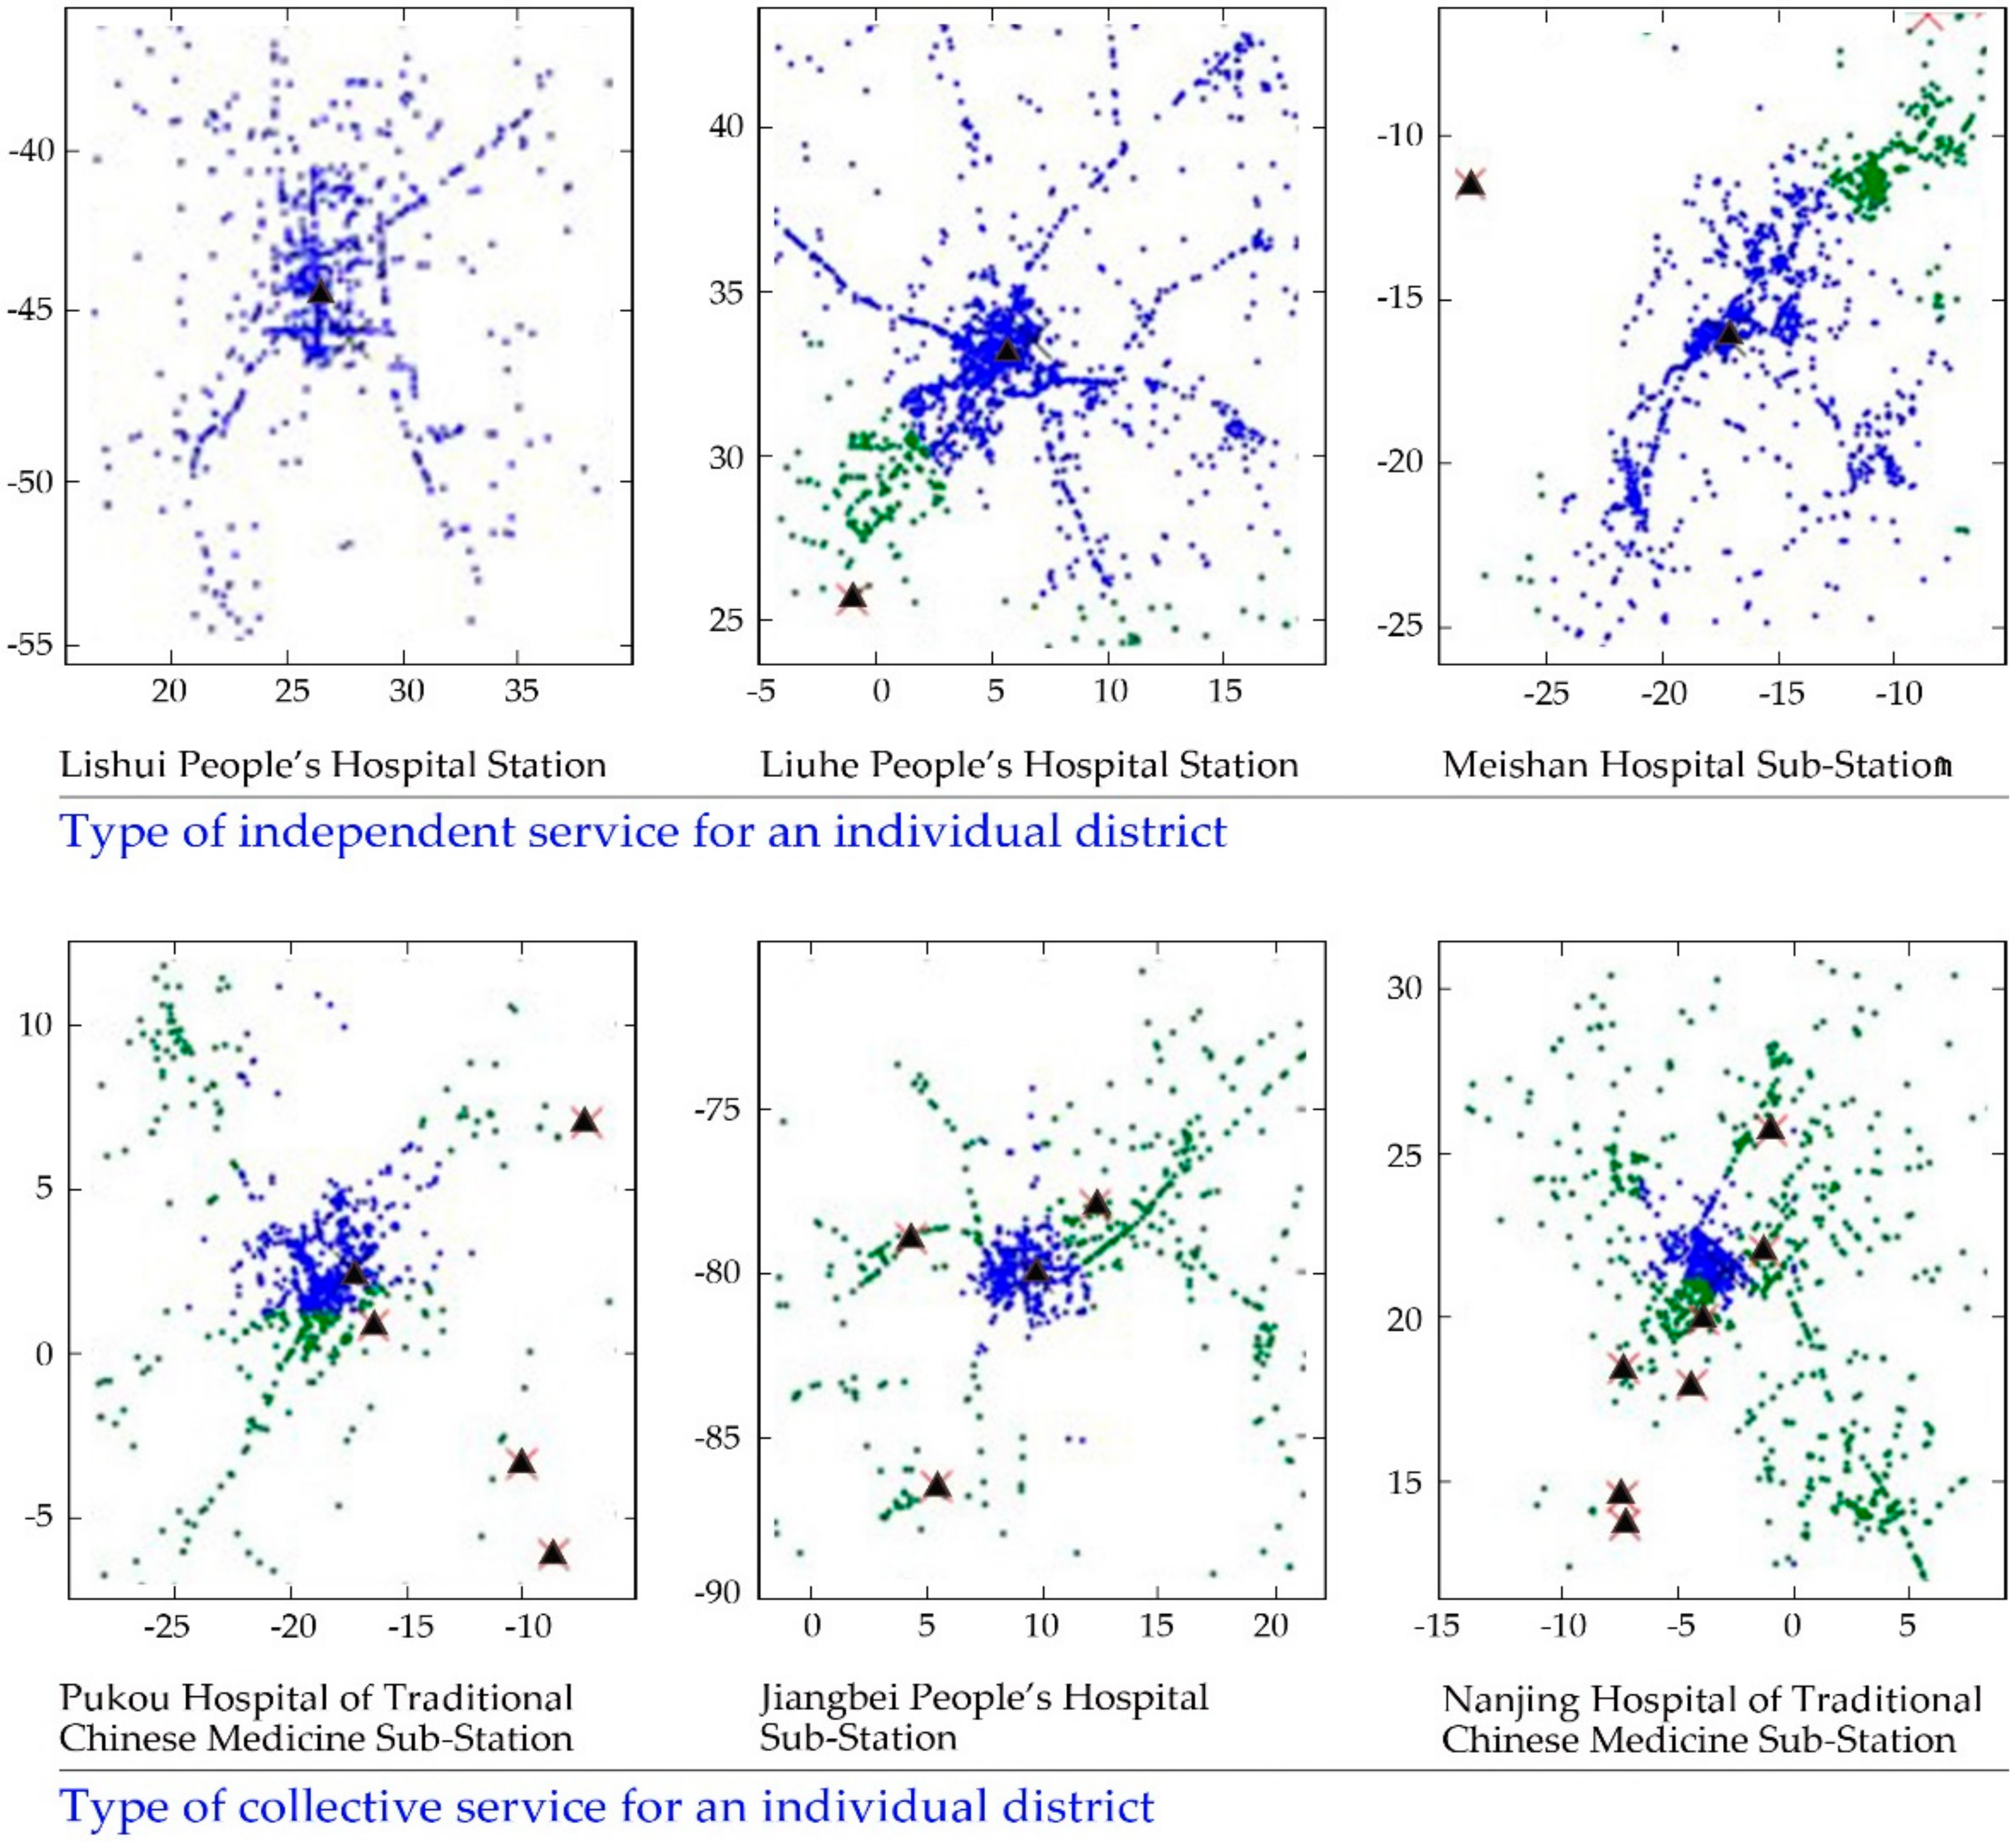
5.2.2. Clustering Analysis for First aid Service Data and Simulation of First aid Demands
5.2.3. Building the Road Network Model and Calculating the Minimum Time Matrix
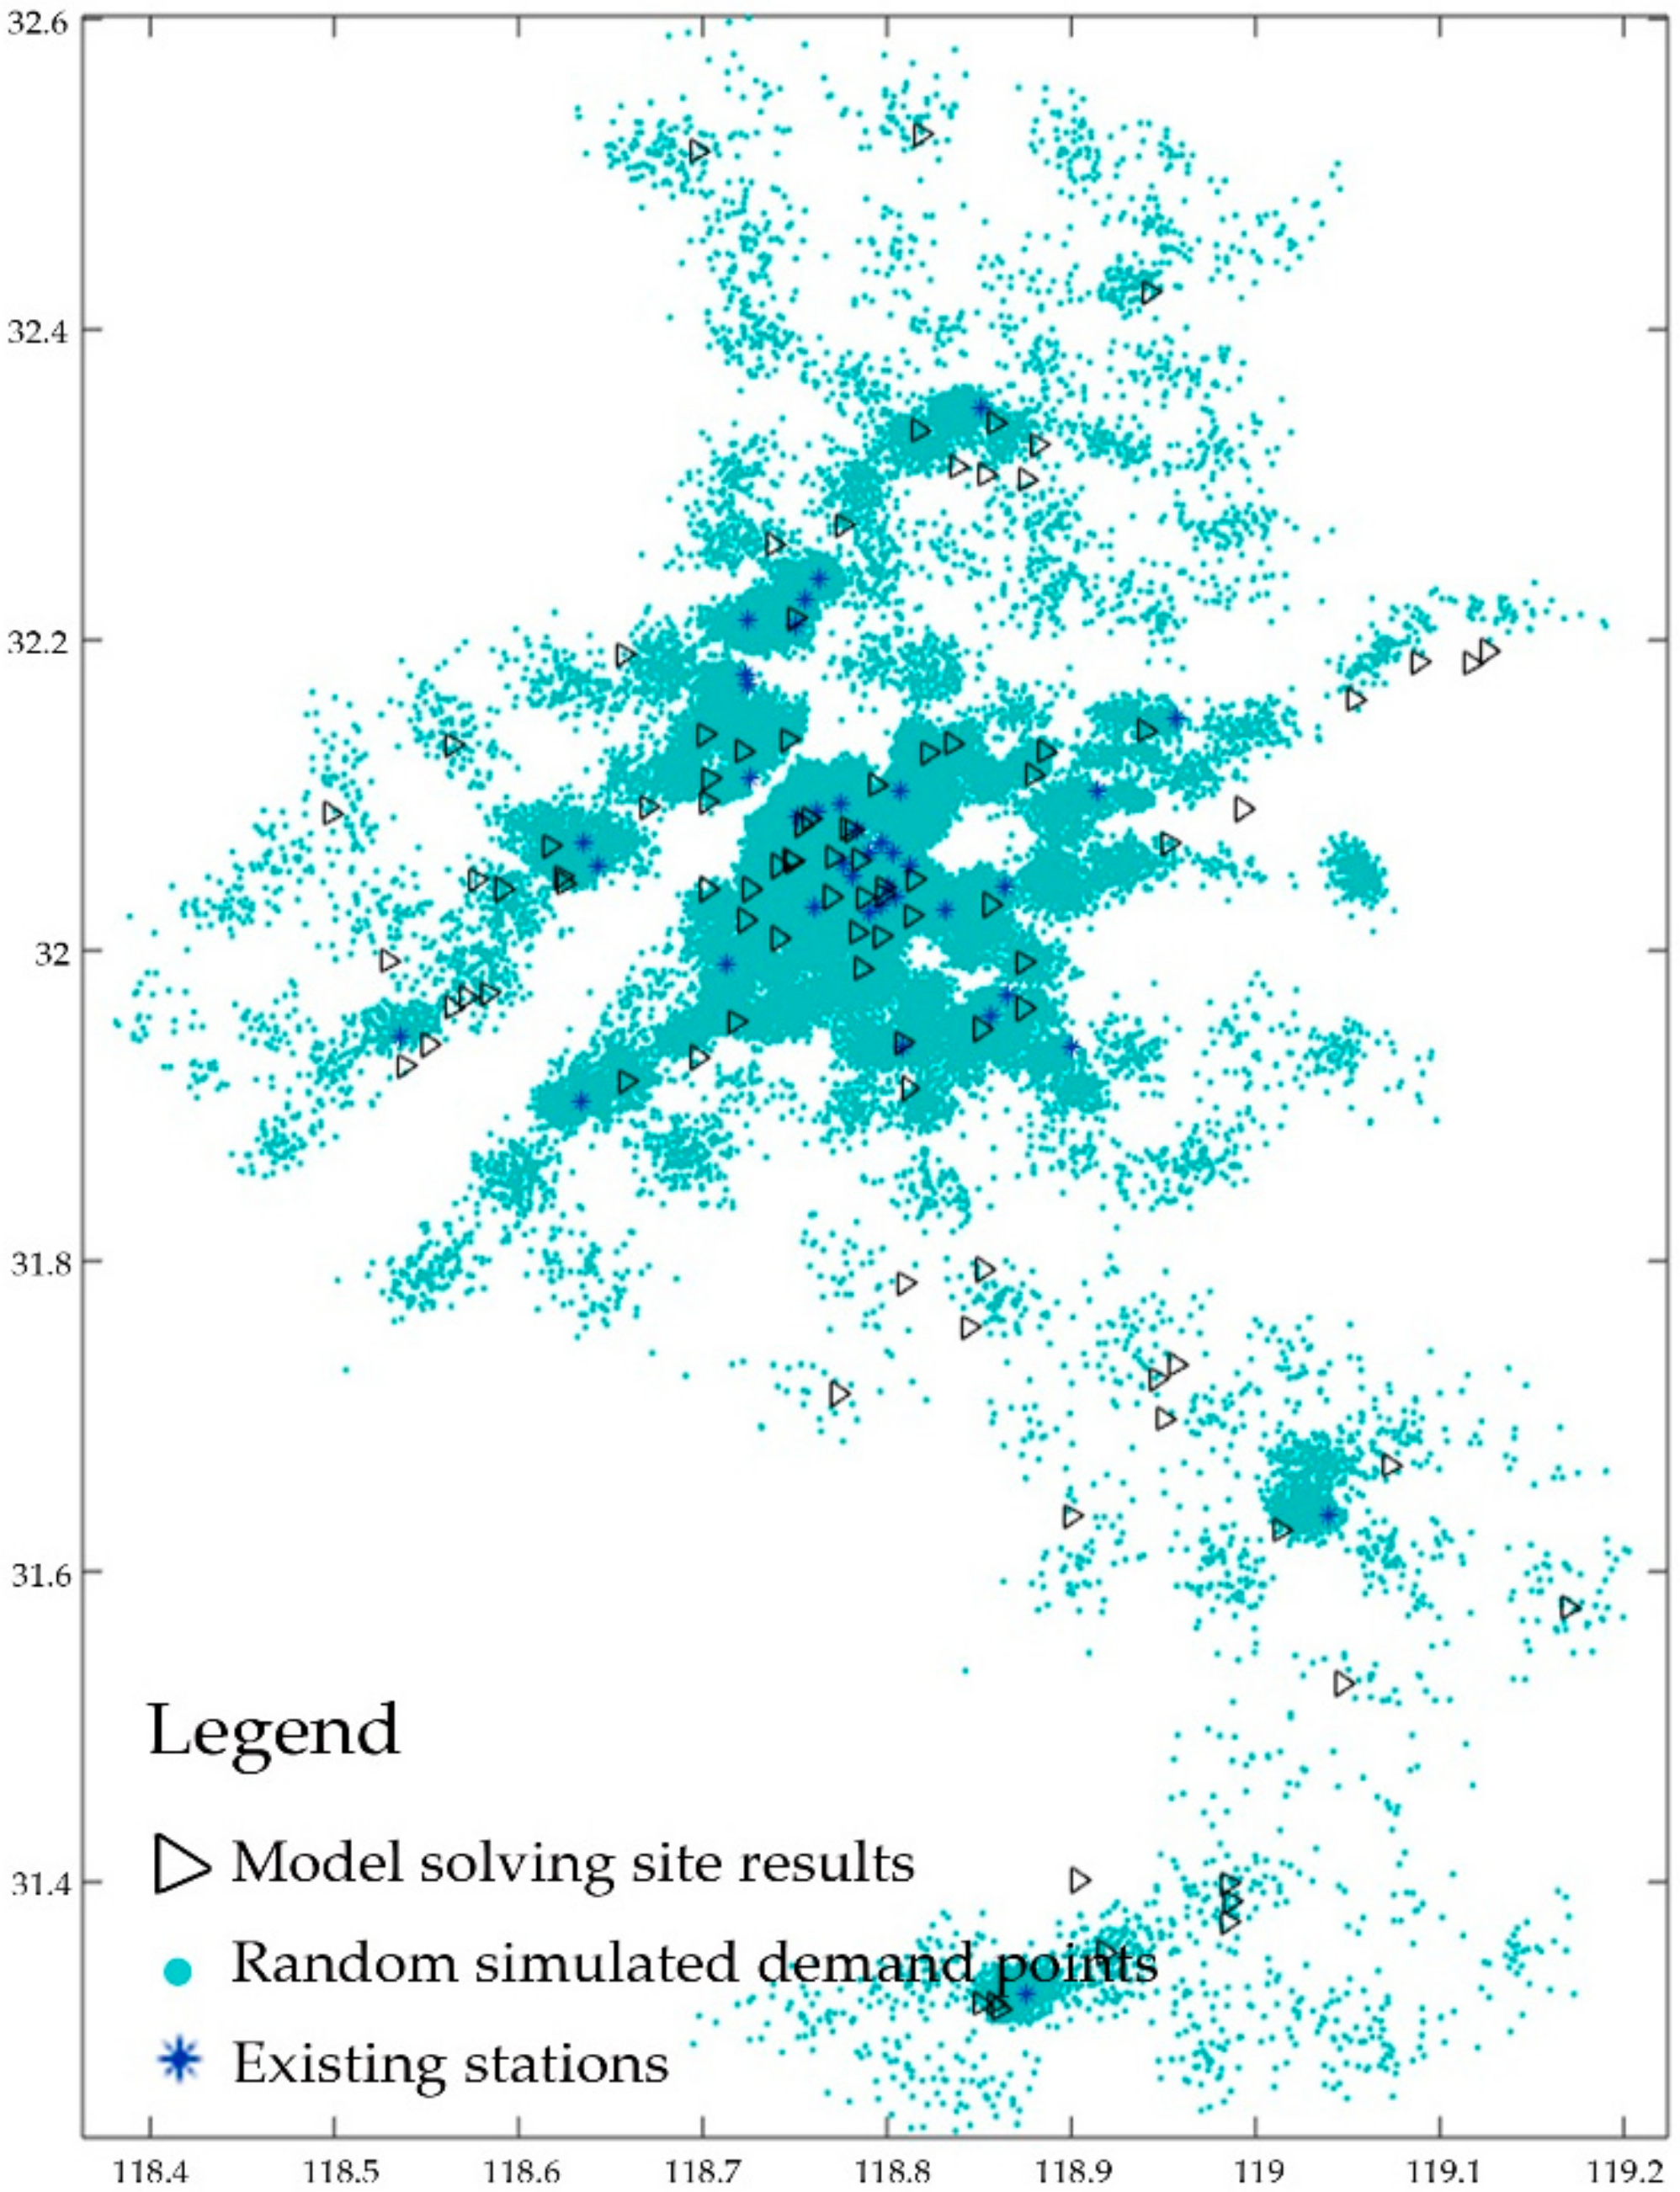
5.2.4. Collecting Final Planning Sites and Writing Them in the Set W
5.2.5. Iterative Computation in Matlab
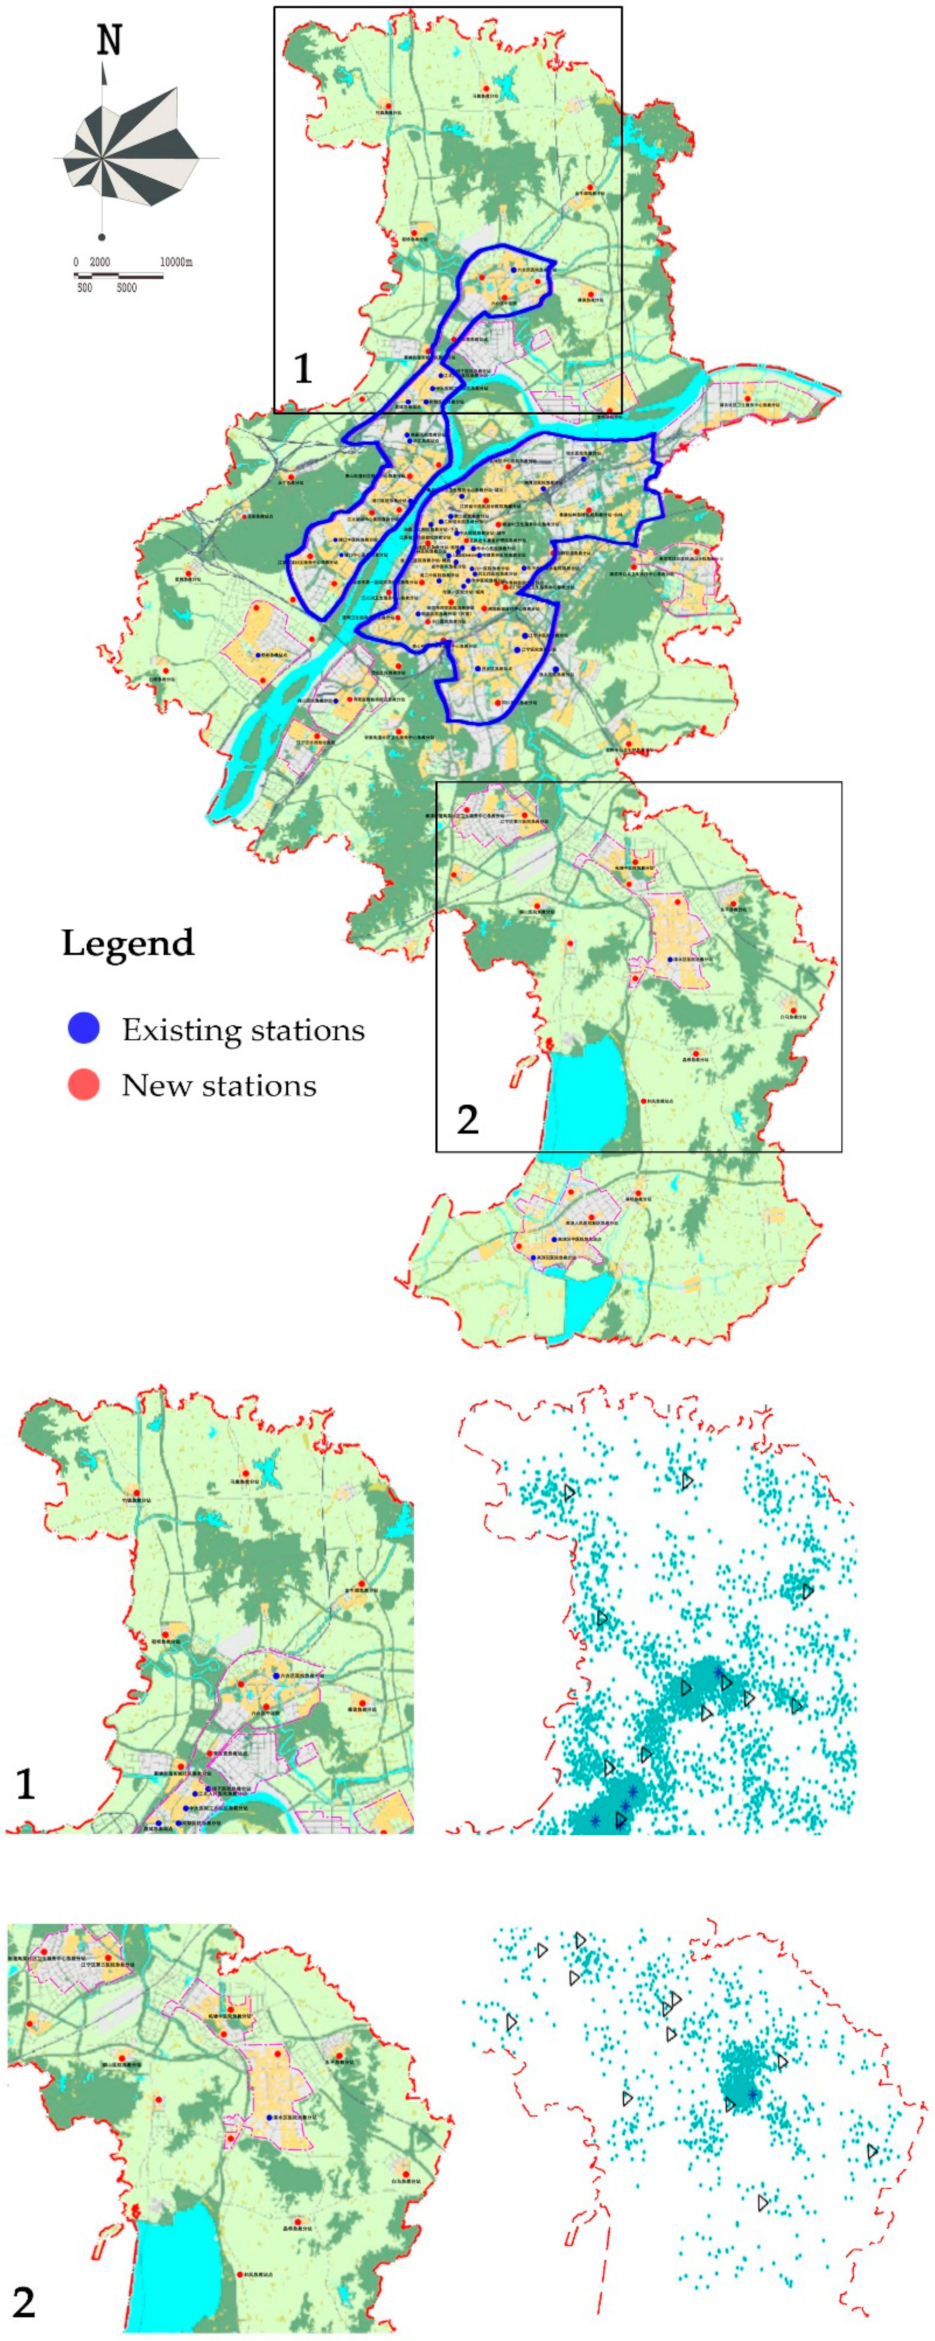
5.2.6. Examining and Adjusting Simulated Results
6. Discussion
- (1)
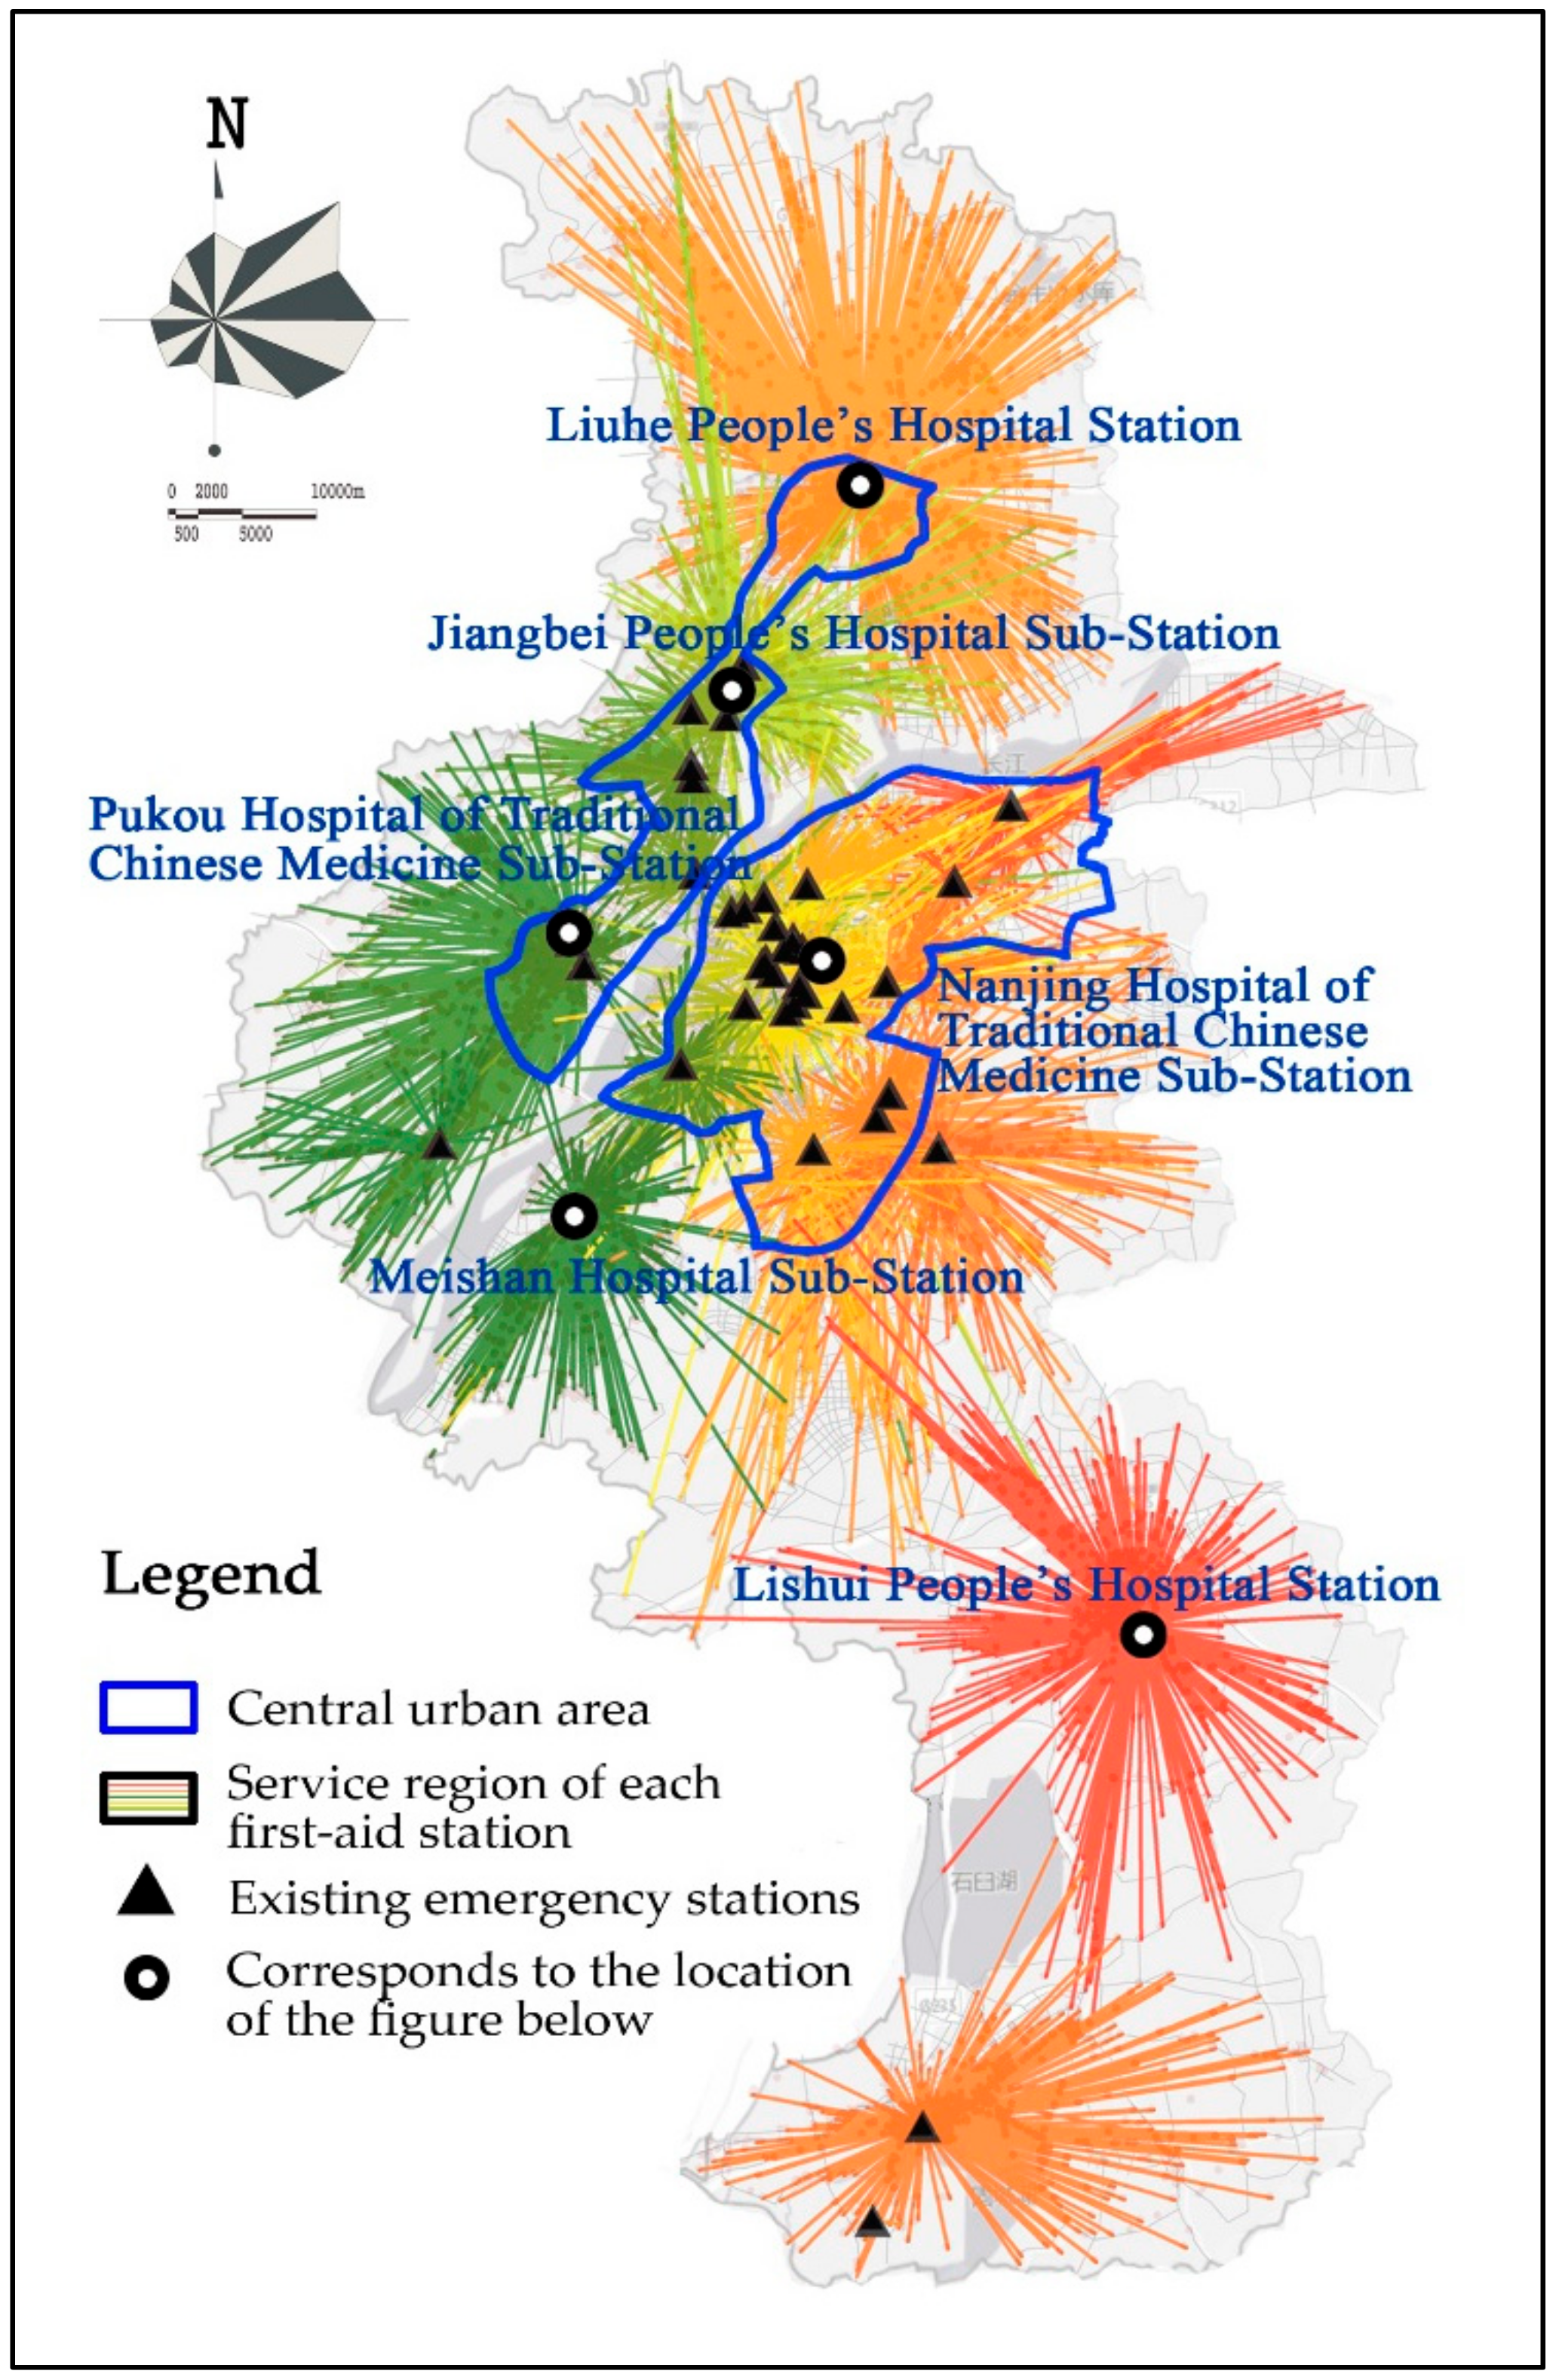
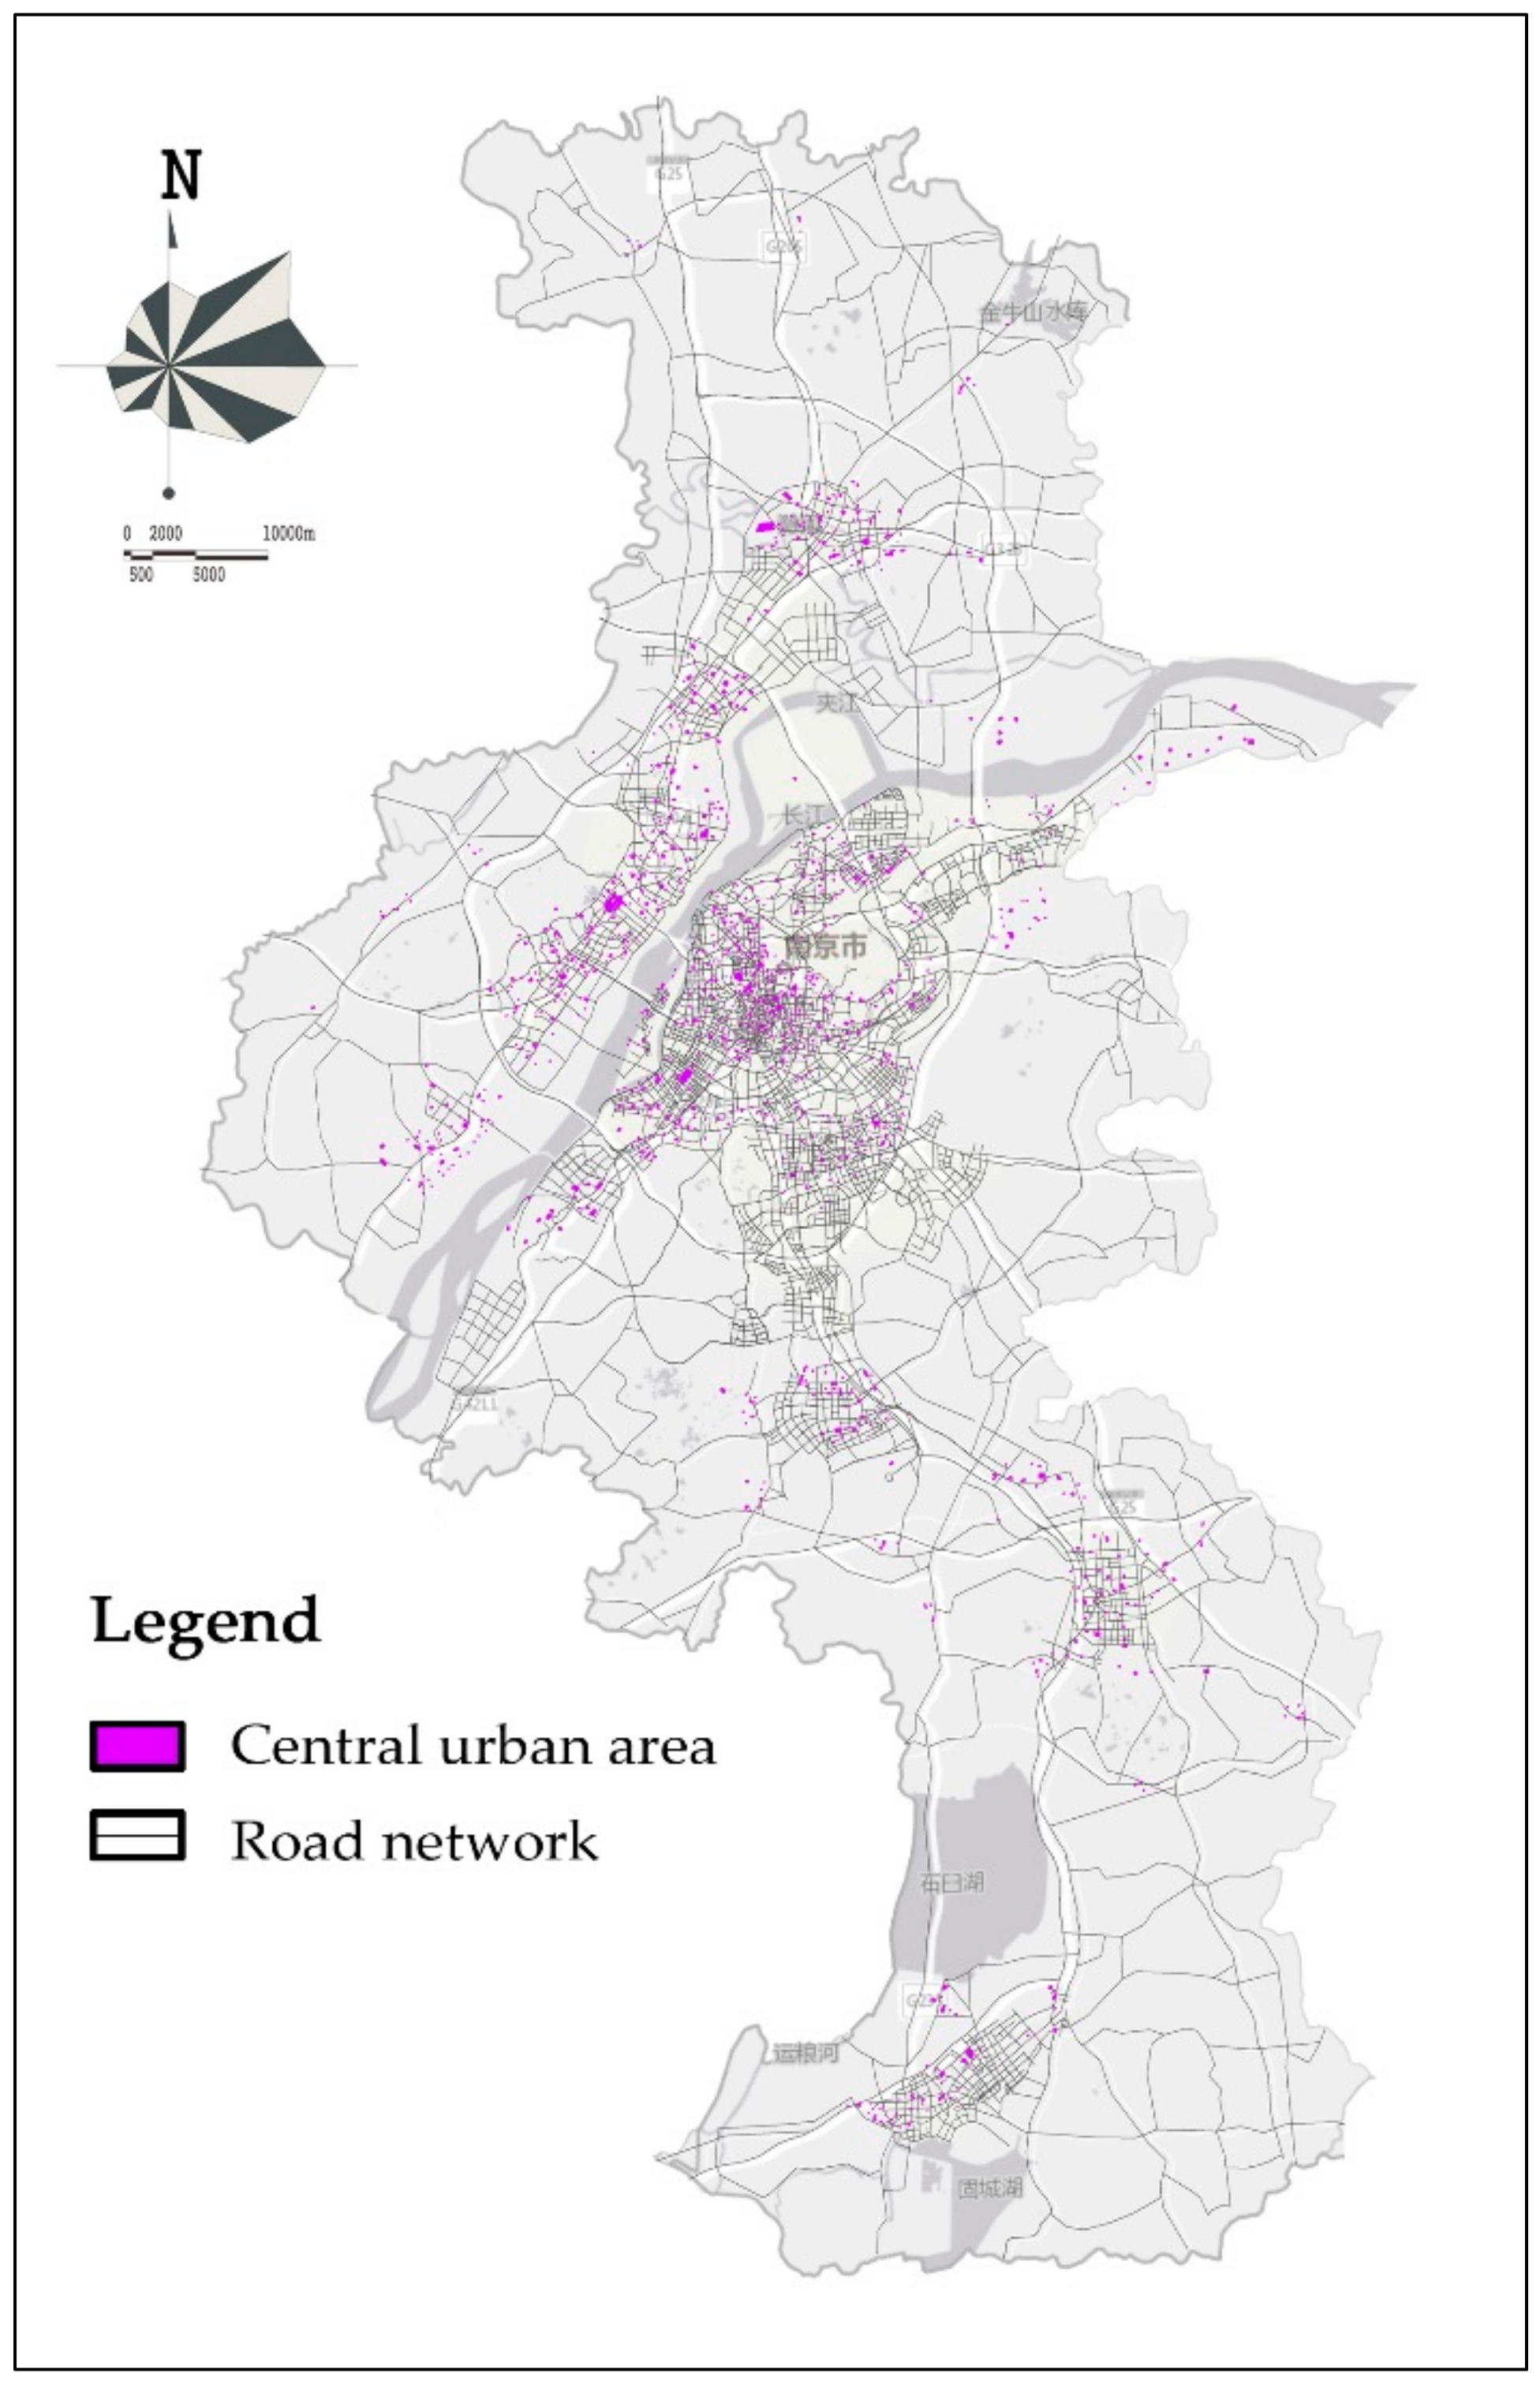
- The optimization of emergency facility sites has been a classic research topic in the field of geography. Compared with the traditional model, the optimized location set coverage model is demonstrated to greatly improve the coverage and effectively shorten the emergency response time. This confirms the presence of obvious shortcomings when it comes to the distribution of pre-hospital emergency stations in Nanjing City. Specifically, current emergency facilities are far from meeting emergency demands due to insufficient and unbalanced allocation of medical resources in various districts. The overwhelmingly concentrated medical resources in Gulou and Xuanwu Districts contradict the goal of Nanjing’s multi-center development plan of “one center and three sub-cities”. Moreover, the unbalanced allocation of emergency resources is also present within each district. For instance, emergency resources in the Xuanwu and Gulou Districts are mainly concentrated on the south and east of Xuanwu Lake, respectively.
- (2)
- The time target parameter in the proposed model is selected according to the existing data analysis and the actual situation of Nanjing City with references to the requirements of other cities in China and other countries. In the future, with the further improvement of the first aid legislation and various supporting facilities, the government may be able to further shorten the target emergency call response time. Moreover, the emergency response time and personnel response time may be incrementally reduced with promoted standardized management. In addition, the traffic cost based on the road network model may be changed as a result of road reconstruction and expansion. Therefore, it is crucial to adjust and update the dynamic factors in the model in a timely manner. Accordingly, traffic data over a longer period of time will be collected to observe the changes in vehicle speeds during different seasons and months, which will help obtain more accurate time cost factors that can be substituted into the model. Furthermore, the emergency data in 2020 can be acquired and substituted into the proposed model for further comparison and verification.
7. Conclusions
Author Contributions
Funding
Acknowledgments
Conflicts of Interest
References
- Yang, X.H.; Ren, Y.R. Research on the layout of urban emergency medical service network. Chin. J. Hosp. Manag. 1994, 10, 673–677. [Google Scholar]
- Lin, W.P.; Yan, Z. Medical and health system reform and urban medical and health facilities planning. Urban Plan. 2006, 30, 47–50. [Google Scholar]
- Adenso-Díaz, B.; Rodríguez, F. A simple search heuristic for the MCLP: Application to the location of ambulance bases in a rural region. Omega 1997, 25, 181–187. [Google Scholar] [CrossRef]
- Toregas, C.; Swain, R.; ReVelle, C.; Bergman, L. The Location of Emergency Service Facilities. Oper. Res. 1971, 19, 1363–1373. [Google Scholar] [CrossRef]
- Church, R.; ReVelle, C. The maximal covering location problem. Pap. Reg. Sci. Assoc. 1974, 32, 101–118. [Google Scholar] [CrossRef]
- Murray, A.T.; O’Kelly, M.E. Assessing representation error in point-based coverage modeling. J. Geogr. Syst. 2002, 4, 171–191. [Google Scholar] [CrossRef]
- Pitt, E.; Pusponegoro, A. Prehospital care in Indonesia. Emerg. Med. J. 2005, 22, 144–147. [Google Scholar] [CrossRef]
- Degel, D.; Wiesche, L.; Rachuba, S.; Werners, B. Time-dependent ambulance allocation considering data-driven empirically required coverage. Health Care Manag. Sci. 2015, 18, 444–458. [Google Scholar] [CrossRef]
- Chen, A.Y.; Lu, T.Y.; Ma, M.H.M.; Sun, W.Z. Demand Forecast Using Data Analytics for the Preallocation of Ambulances. IEEE J. Biomed. Health Inform. 2016, 20, 1178–1187. [Google Scholar] [CrossRef]
- Fan, B. Spatial clustering mining method for site selection problem of emergency response center. J. Manag. Sci. 2008, 11, 20–28, 30–32. [Google Scholar]
- Zhou, Y.N.; Lu, X.; Dai, Z.; Shen, H.; Zhu, Q.Z.; Luo, L. Planning method and empirical study of emergency site. China Health Policy Res. 2016, 9, 69–73. [Google Scholar]
- Dou, Q.Z.; Zhang, W.W.; Zhu, H.D.; Xu, J.; Chen, M.F.; Li, C.; Duan, W.Q.; Miao, J.G. Nonuniform and relatively stable pre-hospital first-aid model based on spatial big data. Comput. Technol. Appl. 2018, 044, 130–133. [Google Scholar]
- Beraldi, P.; Bruni, M.E. A probabilistic model applied to emergency service vehicle location. Eur. J. Oper. Res. 2009, 196, 323–331. [Google Scholar] [CrossRef]
- Su, Q.; Yang, Q.; Wang, Q.G. Ambulance location planning considering the spatial randomness of demand. Chin. J. Manag. Sci. 2019, 27, 110–119. [Google Scholar]
- Ni, J.; Wang, J.; Rui, Y.; Qian, T.; Wang, J. An enhanced variable two-step floating catchment area method for measuring spatial accessibility to residential care facilities in Nanjing. Int. J. Environ. Res. Public Health 2015, 12, 14490–14504. [Google Scholar] [CrossRef] [Green Version]
- Tao, Z.; Cheng, Y.; Dai, T.; Rosenberg, M.W. Spatial optimization of residential care facility locations in Beijing, China: Maximum equity in accessibility. Int. J. Health Geogr. 2014, 13, 33. [Google Scholar] [CrossRef] [Green Version]
- Chen, J.; Zhou, S.; Liu, L.; Xiao, L.; Song, G. Impact of traffic congestion on time-space accessibility of emergency medical services—Take Guangzhou as an example. Prog. Geogr. Sci. 2016, 35, 431–439. [Google Scholar] [CrossRef]
- Xia, T.; Song, X.; Zhang, H.; Song, X.; Kanasugi, H.; Shibasaki, R. Measuring spatio-temporal accessibility to emergency medical services through big GPS data. Health Place 2019, 56, 53–62. [Google Scholar] [CrossRef]
- Cheng, G.; Zeng, X.; Duan, L.; Lu, X.; Sun, H.; Jiang, T.; Li, Y. Spatial difference analysis for accessibility to high level hospitals based on travel time in Shenzhen, China. Habitat Int. 2016, 53, 485–494. [Google Scholar] [CrossRef] [Green Version]
- Wang, F.; Xu, Y. Estimating O-D travel time matrix by Google Maps API: Implementation, advantages, and implications. Ann. GIS 2011, 17, 199–209. [Google Scholar] [CrossRef]
- Gu, W.; Wang, X.; McGregor, S.E. Optimization of preventive health care facility locations. Int. J. Health Geogr. 2010, 9, 17. [Google Scholar] [CrossRef] [PubMed] [Green Version]
- Tao, Z.; Yao, Z.; Kong, H.; Duan, F.; Li, G. Spatial accessibility to healthcare services in Shenzhen, China: Improving the multi-modal two-step floating catchment area method by estimating travel time via online map APIs. BMC Health Serv. Res. 2018, 18, 345. [Google Scholar] [CrossRef] [Green Version]
- Murray, A.T.; Tong, D.; Kim, K. Enhancing classic coverage location models. Int. Reg. Sci. Rev. 2010, 33, 115–133. [Google Scholar] [CrossRef]
- ReVelle, C. Review, extension and prediction in emergency service siting models. Eur. J. Oper. Res. 1989, 40, 58–69. [Google Scholar] [CrossRef]
- Liu, J.; Hao, Y.H.; Wu, Q.H.; Dong, X.; Xu, J.; Wu, Z.Y.; Chen, H.P.; Sun, Y.H. An international comparison of pre-hospital emergency mode and job training of emergency personnel. Chin. Health Resour. 2013, 16, 30–32. [Google Scholar]
- Zhang, A.H.; Tao, H.; Gui, L. Review and prospect of the development of national and international Emergency Medical Service System. J. Nurs. Adm. 2004, 4, 23–25. [Google Scholar]
- General Office of the State Council. Notice of The General Office of the State Council on Forwarding the Construction Plan of Medical Treatment System for Public Health Emergencies of the Ministry of Health (Development and Reform Commission No.82 [2003]); General Office of the State Council: Beijing, China, 2003.
- Chen, K.H. Investigation report of European emergency service system. Chin. Hosp. 2006, 10, 79–81. [Google Scholar]
- Sun, M. Progress of American emergency medical service. Chin. Hosp. Manag. 1987, 7, 53–55. [Google Scholar]
- Legislative Council of the Hong Kong. Legislative Council of the Hong Kong Special Administration Region of the People’s Republic of China; LC Paper No. CB(2)114/00-01; Legislative Council of the Hong Kong: Hong Kong, China, 2000.


| Ambulance Plate Number | Departure Time | Arrival Time at the Demand Site | Site Longitude and Latitude | Arrival Time at the Hospital | Destination Hospital |
|---|---|---|---|---|---|
| SUXXXXXX | 2 June 2016 08:25 | 08:37:48 | 118.7907; 32.0241 | 08:45:28 | Chengnan Sub-Station |
| SUXXXXXX | 2 June 2016 14:18 | 14:35:20 | 118.7787; 32.01897 | 14:52:30 | Brain Hospital Sub-station |
| SUXXXXXX | 2 June 2016 16:22 | 16:34:40 | 118.7687; 32.02224 | 16:38:10 | Chengnan Sub-Station |
| SUXXXXXX | 2 June 2016 17:35 | 17:53:18 | 118.7959; 32.0029 | 18:02:38 | Chengnan Sub-Station |
| SUXXXXXX | 2 June 2016 19:15 | 19:20:46 | 118.7722; 32.0146 | 19:27:24 | Chengnan Sub-Station |
© 2020 by the authors. Licensee MDPI, Basel, Switzerland. This article is an open access article distributed under the terms and conditions of the Creative Commons Attribution (CC BY) license (http://creativecommons.org/licenses/by/4.0/).
Share and Cite
Han, B.; Hu, M.; Wang, J. Site Selection for Pre-Hospital Emergency Stations Based on the Actual Spatiotemporal Demand: A Case Study of Nanjing City, China. ISPRS Int. J. Geo-Inf. 2020, 9, 559. https://doi.org/10.3390/ijgi9100559
Han B, Hu M, Wang J. Site Selection for Pre-Hospital Emergency Stations Based on the Actual Spatiotemporal Demand: A Case Study of Nanjing City, China. ISPRS International Journal of Geo-Information. 2020; 9(10):559. https://doi.org/10.3390/ijgi9100559
Chicago/Turabian StyleHan, Bing, Mingxing Hu, and Jialing Wang. 2020. "Site Selection for Pre-Hospital Emergency Stations Based on the Actual Spatiotemporal Demand: A Case Study of Nanjing City, China" ISPRS International Journal of Geo-Information 9, no. 10: 559. https://doi.org/10.3390/ijgi9100559