Article

Multi-Scale Analysis of Regional Inequality based on Spatial Field Model: A Case Study of China from 2000 to 2012

1
School of Economics and Management, Beijing Forestry University, No. 35, Tsinghua East Road, Beijing 100083, China
2
National Academy for Mayors of China, Huixin West Street, Beijing 100029, China
3
Department of Earth and Environmental Studies, Montclair State University, Montclair, NJ 07043, USA
4
Institute of Geographic Sciences and Natural Resources Research, Chinese Academy of Sciences, Datun Road, Beijing 100101, China
*
Authors to whom correspondence should be addressed.
ISPRS Int. J. Geo-Inf. 2015, 4(4), 1982-2003; https://doi.org/10.3390/ijgi4041982
Submission received: 12 July 2015 / Revised: 13 September 2015 / Accepted: 14 September 2015 / Published: 6 October 2015

Abstract

:
A large body of recent studies—from both inside and outside of China—are devoted to the understanding of China’s regional inequality. The current study introduces “the spatial field model” to achieve comprehensive evaluation and multi-scale analysis of regional inequality. The model is based on the growth pole theory, regional interaction theory, and energy space theory. The spatial field is an abstract concept that defines the potential energy difference that is formed in the process of a regional growth pole driving the economic development of peripheral areas through transportation and communication corridors. The model is able to provide potentially more precise regional inequality estimates and generates isarithmic maps that will provide highly intuitive and visualized presentations. The model is applied to evaluate the spatiotemporal pattern of economic inequality in China from 2000 to 2012 amongst internal eastern-central-western regions as well as north-south regions at three geographical scales—i.e., inter-province, inter-city, and inter-county. The results indicate that the spatial field model could comprehensively evaluate regional inequality, provide aesthetically pleasing and highly adaptable presentations based on a pixel-based raster, and realise the multi-scale analyses of the regional inequality. The paper also investigates the limitations and extensions of the spatial field model in future application.

Graphical Abstract

1. Introduction

China has achieved great progress in economic and social development since the “open-door policy” of 1978 and subsequent economic reforms. During the period following the transformations of the late 1970s, the country adopted industrial and urban priority development strategies which focused specifically on economic growth based on regional comparative advantage, foreign direct investment, international interaction and technological innovation. In so doing, regional inequality is deemed as an inevitable result of such transformation process. Under such strategies, cities and coastal areas in China have gained substantially development during the reform period due largely to their comparative advantages, either as a result of geographic location or historical development. Consequently, regional economic inequality in China has increased drastically during the past three decades [1,2]. Rising regional inequality—such as that seen in China at present—may cause social and economic instability within a country and compromise the prospect of achieving long-term sustainable growth through a variety of social, political, and economic mechanisms [3]. Regional inequality has thus become an important issue, attracting considerable attention from both the government and researchers.
Since the second half of the 1990s, the Chinese government has attached more emphasis to mapping out programmes and national development strategies to alleviate regional inequality. For instance, in 1999 the central government of China formulated the Western Development Strategy (xibu da kaifa) to boost the economic development in relatively underdeveloped western China. In 2003 and 2006, Reinvigorating Old Industrial Bases of Northeast China (zhenxing dongbei) program, and the Central Region Grow-Up Strategy (zhongbu jueqi) were launched in order to boost up economic growth in the north, as well as in central regions [4]. Recently, the central government has compiled the Twelfth Five-Year Plan (2011–2015), through which more attention has been paid to strengthening the coordination of regional development, promoting a more balanced development of basic public services, and gradually narrowing the gap between rural and urban residents’ living standards, as well as striving to solve the unbalanced, uncoordinated, and unsustainable problems associated with existing economic and social development patterns.
Regional inequality has also come to be seen as a serious issue amongst researchers, attracting considerable attention from the academic community. The problem has been extensively documented both inside and outside of China, generating a growing literature that can be characterised by five key features. Firstly, the term “regional inequality” tends to clearly denote a regional economic difference that can be divided into “absolute” and “relative” difference, the former reflecting the difference between regions’ total economic outputs, the latter representing the difference in their economic development levels [5]. Secondly, the spatiotemporal pattern of the evolution of regional economic difference—that is, the spatial pattern of economic gaps between regions, as well as the features of the evolution of those gaps over a sufficiently long time period—is still a core area of study within research addressing regional inequality [6]. Thirdly, we note that the scale addressed by recent research has been diverse: the analysis scale of regional inequality has in fact shifted between the “macroscopic” scale—e.g., addressing interior–coastal, north-south, rural–urban, inter-provincial or intra-provincial inequality [6,7,8,9]; the “mesoscale”—e.g., addressing inter-rural and inter-urban, and inter-regional inequality [7]; and the “microscale”—e.g., inequality at the county level as well as the township level [10]. Fourth, increasingly vigorous technological and methodological contributions have been made in measuring regional inequality. Inequality indices now include the Gini coefficient, the coefficient of variation, the Theil index, the generalized entropy index, and the Atkinson index [6,11,12]. More recently, spatial analysis models using geographic information systems (GIS) and geographically weighted regression, and economic growth models have gradually been introduced to this field [13,14]. Finally, explanations—as well as corresponding policy prescriptions—addressing the factors that are responsible for regional inequality have become both the focus and the main foothold of current research efforts. The effects of physical conditions [15], geographical location [16], labour migration [6], marketization, globalisation [17], foreign direct investment [15], social capital [18], total factor productivity (TFP) and factor inputs, national policies [19] and regional development strategies have been explored as important factors that (jointly) trigger regional inequality. Further, some scholars propose that human capital investment in less-developed areas, factor market reform, infrastructure investment, social protection investment, and governance can all contribute to promoting economic growth in lagging regions and reducing regional gaps [8,15].
Despite these contributions, at least three aspects of study on regional inequality deserve far greater attention. First of all, most of the previous studies use only a single indicator or a simple composite indicator system to evaluate regional inequality—for instance, by considering per capita GDP, per capita GNP, and/or per capita income. The development of the indicator plays an important role in the degree and even the direction of change seen in the inequality being investigated; as such, conclusions may be contingent upon the selection of specific measuring indicators [12,20]. Due to the limitation of a single indicator, comprehensive measurement with respect to regional inequality (e.g., using comprehensive, multiple, or composite indicators, introduced through the spatial field model developed in this study) should garner greater attention in future research [20,21]. Secondly, though more studies have taken a spatial data analytical approach, the majority of the existing work undertaken on the subject has applied traditional statistical models in their analysis of regional inequality. In this regard, we believe that the use of intuitive and visualised presentations of regional inequality, graphically presented through isarithmic maps, should be further enhanced [22]. The third issue evidenced in previous work on regional inequality lies in the different—and even opposite—conclusions yielded by the diversity of analysis scales, measuring indicators and methods, statistical data, as well as urban definitions [6,7]. Such variation is perceived as being serious problem, and can lead to a variety of diverse policy implications, rather than a targeted response [23].
The objective of this study was to develop a “spatial field model” in response to the aforementioned challenges. The model that we put forward has several advantages, including: (i) proposing a comprehensive evaluation of regional inequality in terms of the current features of a region, and its future potential for economic development; (ii) presenting evaluation results as intuitive and highly visualised isarithmic maps; and (iii) achieving a multi-scale analysis of regional inequality. The spatial field model was applied to evaluate intraregional inequality amongst the three often-referred-to economic regions (the eastern, central, and western regions) in China, as well as the broader division of “the north” and “the south” of China, in the period 2000–2012. Each evaluation is done at the provincial-, the prefecture- and county- levels. Results indicated that the spatial field model is a useful instrument in the evaluation of regional inequality. A discussion of the results also highlights the limitations of the spatial field model, and expands upon a series of matters requiring further attention in future applications of the model.
In detail, the eastern region includes 11 provinces: Beijing, Tianjin, Hebei, Liaoning, Shandong, Jiangsu, Shanghai, Zhejiang, Fujian, Guangdong and Hainan; the central region consists of 8 provinces: Heilongjiang, Jilin, Shanxi, Henan, Hunan, Hubei, Jiangxi and Anhui; the western region comprises 12 provinces: Inner Mongolia, Shaanxi, Gansu, Ningxia, Qinghai, Xinjiang, Sichuan, Chongqing, Guangxi, Yunnan, Guizhou and Tibet. Moreover, the country is divided into “the north” and “the south” based on the natural geographical boundaries, especially the climate boundary—i.e., Qinling-Huaihe Line. South China includes 16 provinces: Shanghai, Jiangsu, Zhejiang, Fujian, Anhui, Jiangxi, Hunan, Hubei, Guangdong, Guangxi, Hainan, Sichuan, Chongqing, Yunnan, Guizhou and Tibet; north China consists of the remainder provinces.
The remainder of this paper proceeds as follows. Section 2 describes the spatial field model employed and presents the data acquisition and processing. Section 3 presents the results of regional inequality in China from 2000 to 2012 at three geographical scales. Discussions and concluding remarks are presented in Section 4 and Section 5 respectively.

2. The Spatial Field Model

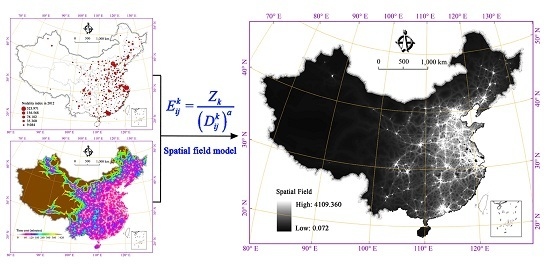
2.1. Defining the Spatial Field Model

The “central place theory”, originally proposed by the German geographer Walter Christaller in 1933, constitutes both a doctrine on urban scale and urban hierarchies and a theoretical model for urban planning and urban construction [24]. Subsequently, Perroux in the 1950s proposed the growth pole theory in which growth poles serve as “centres from which centrifugal forces emanate and to which centripetal forces are attracted” [25]. In general, a growth pole might exert two distinctly different types of influence on its neighbours through strong attractive forces (concentration) and radial forces (diffusion): these are termed as “backwash effects” and “spreading effects” [26,27,28]. A stable core-periphery pattern and an integration of regional development would be expected to achieve under the impact of backwash and spreading effects of a well-devised growth pole strategy [29]. In the early stages of a growth pole, polarisation effects lead the central city to absorb adjacent regions’ population, capital, information, technology, and various other production elements. As the pole develops, the “spreading effects” tend to dominate, leading to the spread of various factors and elements from central cities to adjacent regions through various contact “channels” [30,31,32], which in real world mainly involves the trunk lines of transportation and communication as well as channels for energy and water movement [16].
Since a growth pole is always more developed than its surrounding peripheral regions, from a pure energy perspective (i.e., everything is converted to some types of energy), we can imagine that there exists energy difference from the pole to the peripheral. We can designate such energy decays from the pole to the farthest peripheral with values between 1 and 0. The diffusion distance of the energy will likely be a function of the concentration of regional transportation and communication infrastructure facilities. The “spatial field” is an abstract concept that we coined in an attempt to measure the sphere of influence of any growth poles at any given level [33]. Using energy as a universal measuring unit, the growth pole shall have the largest spatial field (high energy level) than any other locations in its sphere of influence. Such energy declines from the pole to the peripherals following typical distance decaying mechanism.

2.2. Constructing the Spatial Field Model

In general, a growth pole could drive the economic development of peripheral areas through the spreading and backwash effects [26]. If a central city (as regional growth pole) has strong control ability to aggregate and diffuse resources and production factors, and has good regional accessibility, the central city would have a strong spatial field energy, and vice versa. Given that the value of the spatial field energy gradually decreases as distance from the growth pole increases, a peripheral point that is far away from the growth pole would have weak spatial field energy. Thus, the spatial field can be described with the gravity-based potential model which is the most widely used types of interaction model [34,35]. In physics, gravitation is a force that decreases with distance and increases with mass [35]. The gravity-based potential model aims at measuring the influence exerted by a set of masses on a unit of mass located at a given point in space [36,37,38]. The formula of the potential at point [i, j] is given as follows:
E i j k = Z k ( D i j k ) a
where [i, j] indicates the horizontal and vertical coordinates of the point; E i j k indicates the intensity of the potential at point [i, j] deriving from the mass k; Zk is usually represented by population size of the mass k; D i j k is the distance between the mass k and point [i, j] (e.g., Euclidean distance, economic cost, time); a is the distance friction parameter (normally the value of a is set as 1). In this paper, Zk is represented by the ability of central city k to aggregate and diffuse resources and the factors of production, and D i j k is represented by the time cost between the mass k and point [i, j].
In general, a spatial point has a composite spatial field for that it is simultaneously influenced by all of the surrounding central cities. The composite spatial field constitutes the superposition of the spatial field (potential energy value) from all of the surrounding central cities. The intensity of the composite spatial field can be described as follows:
E i j = k = 1 K E i j k
where Eij is the composite spatial field of the point [i, j] deriving from all of the central cities (k=1, …, K).
It should be noted that when D i j k equals zero, the value of spatial field in the point [i, j] would be not in conformity with the mathematical rules. In this situation, we set E i j k as the largest spatial field value of its surrounding points.
The intensity of a point’s composite spatial field is determined by the control ability of its regional central cities (growth poles) to aggregate and spread resources and factors of production (Zk, k=1, …, K), as well as the regional accessibility of those cities ( D i j k , k=1, …, K). In this paper, the ability of regional central cities (growth poles) to aggregate and spread resources and factors of production is reflected by the nodality index, which is a composite indicator system. The distance cost between a central city and its neighbouring area is reflected by regional accessibility based on the Cost-Weighted Distance Method.

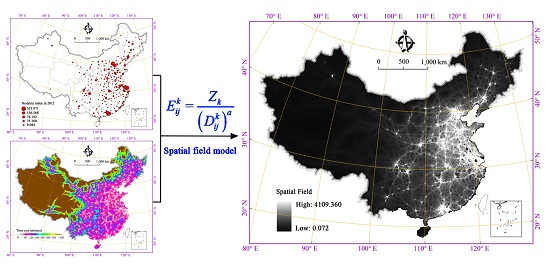
2.2.1. The Indicator System of the Nodality Index

Each city has an absolute importance for it provides residents with goods and services. Preston put forward nodality index and used it to describe the absolute importance of a city [39]. In the study, the nodality index is used to evaluate the capability of central cities (growth poles) in aggregating and spreading resources and factors of production from/to their neighbours. The nodality index therefore reflects the aggregation ability and spread ability of central cities in driving the economic development of peripheral areas. Based upon the considerations of manoeuvrability, dynamics, scientific validity, and comprehensiveness, a critical indicator system was established using the expert consultation method, in accordance with the scientific definition of a nodality index and with reference to related literature, feasibility reports, and official reports. The index consists of the target layer, the criterion layer, and the index layer, and includes 29 identified specific indicators to reflect economic development, social development, infrastructure development, investment environment, science and technology, and the condition of informatization (Table 1).
Table 1. The indicator system of nodality index.
Target LayerCriterion LayerSpecific Indicators
Nodality IndexEconomic development conditionGross domestic product(X1, 10, 000 RMB), per capita gross domestic product (X2, RMB), total population (X3, 10, 000 persons), gross industrial output value (X4, 10, 000 RMB), local government bugetary revenue(X5, 10, 000 RMB), total retail sales of social consumer goods (X6, 10, 000 RMB), savings deposit of urban and rural household (X7, 10, 000 RMB)
Social development conditionUrbanisation rate of population (X8, %), average wage of staff and workers(X9, RMB), mobile phone users (X10, 10, 000 number), number of theater and cinemas (X11, unit), total collections in public libraries (X12, 1000 copies), number of licensed/assistant doctors (X13, 10, 000 persons)
Infrastructure development conditionBuilt-up area (X14, km2), vegetation cover in respect to built-up area (X24, %), total passenger traffic (X20, 10, 000 persons), total freight traffic (X21, 10, 000 tons), area of paved roads at year-end (X22, 10, 000 m2), number of public vehicles under operation at year-end (X23, unit)
Investment environment conditionNumber of fully-employed staff and workers (X15, 10, 000 persons), total investment in fixed assets (X16, 10, 000 RMB), amount of foreign capital actually utilized (X17, 10, 000 dollar), water supply (X18, 10, 000 tons), electricity consumption (X19, 10, 000 kwh)
Science & technology and informatization conditionPostal and telecommunications services (X25, 10, 000 RMB), total research & development personnel (X26, persons), total educational funds (X27, 10, 000 RMB), national regular institutions of higher education (X28, unit), number of students enrollment in higher education (X29, persons)
Note: indicates the indicators in relation to statistical data of municipal district is missing and are replaced with the statistical data from the whole city.
Due to the difficulty in obtaining data, this study made use of data in two years, 2000 and 2012 for prefecture-level or higher level cities. It should be noted that the evaluation result would be not accurate due to the study ignored the county-centers for the difficulty in obtaining data. In fact, the county-centers are always more developed than its surrounding peripheral regions and they might exert influence on its neighbor through strong attractive forces (concentration) and radial forces (diffusion). Thus, it is necessary to comprehensively consider the city-centers as well as the county-centers in the concessional conditions.
The data in these two special years were more complete and representative than others. In terms of 2000, it was not only the first year of the tenth “Five-Year Plan Period”, but also the beginning for the central government began to accelerate the urbanisation process, strengthen the leading role and improve the socio-economic function of the regional central cities. In the same year, the country initially constructed a safe and effective regional transportation framework. In 2012, it was the beginning of the twelfth “Five-Year Plan Period”. In addition, the socio-economic development and transportation infrastructure construction in the year have not been affected by the country’s four trillion RMB economic stimulus plan. In hence, these two years were very significant and typical for us to research the spatio-temporal changes of regional inequality in China.
Since the economic reforms initiated in 1978, China has significantly restructured its urban administrative/spatial system in order to empower central cities to play a leading role in driving national and regional economic development. The country has constructed 260 prefecture- or higher level cities (including 4 municipalities—Beijing, Tianjin, Shanghai and Chongqing, and 256 prefecture level cities) in 2000 and 287 cities (including 4 municipalities and 283 prefecture level cities) in 2012, respectively. This study selected those cities as the growth poles across the country, and derived their nodality index.
In order to ensure the comparability of the nodality index, the raw data of the various periods was standardised using a Deviation Standardisation Method. Due to the difficulty in determining the weight of each indicator as well as the high correlation between the indicators, principal component analysis (PCA) was adopted to calculate the nodality index. Kaiser (1974) suggests adopting the Kaiser–Meyer–Olkin (KMO) measure of sampling adequacy to test the appropriateness of the data reduction techniques such as PCA. A KMO value over 0.9 represents strong suitability for PCA; a value of 0.8 indicates suitability; a value of 0.7 shows moderate suitability. According to our preliminary analysis, the KMO value of the 29 indicators was 0.938 in 2000 and 0.946 in 2012, respectively, indicating that the sample was suitable for PCA. The first four principal components of the PCA were found to have eigen values above 1. These four components explained 85.02% and 86.39% respectively of total variance in 2000 and 2012, which meant that they represent reasonably well the 29 original indicators with limited loss of information.
Figure 1 provides the calculation results of the central cities in 2000 (Panel A) and 2012 (Panel B). It could be noted that the cities evidenced a drop in their numbers and density when comparing eastern coastal China to central China, and then central China to western China. The results were correlated with the overall level of economic development in those three areas; the urban systems in the three agglomeration area (Yangtze River Delta, Pearl River Delta, and Bohai Rim) were most integrated and well-developed in the country [40,41].
Figure 1. Nodality index in relation to the central cities for different years in China for year (a) 2000 and (b) 2012.
Ijgi 04 01982 g001

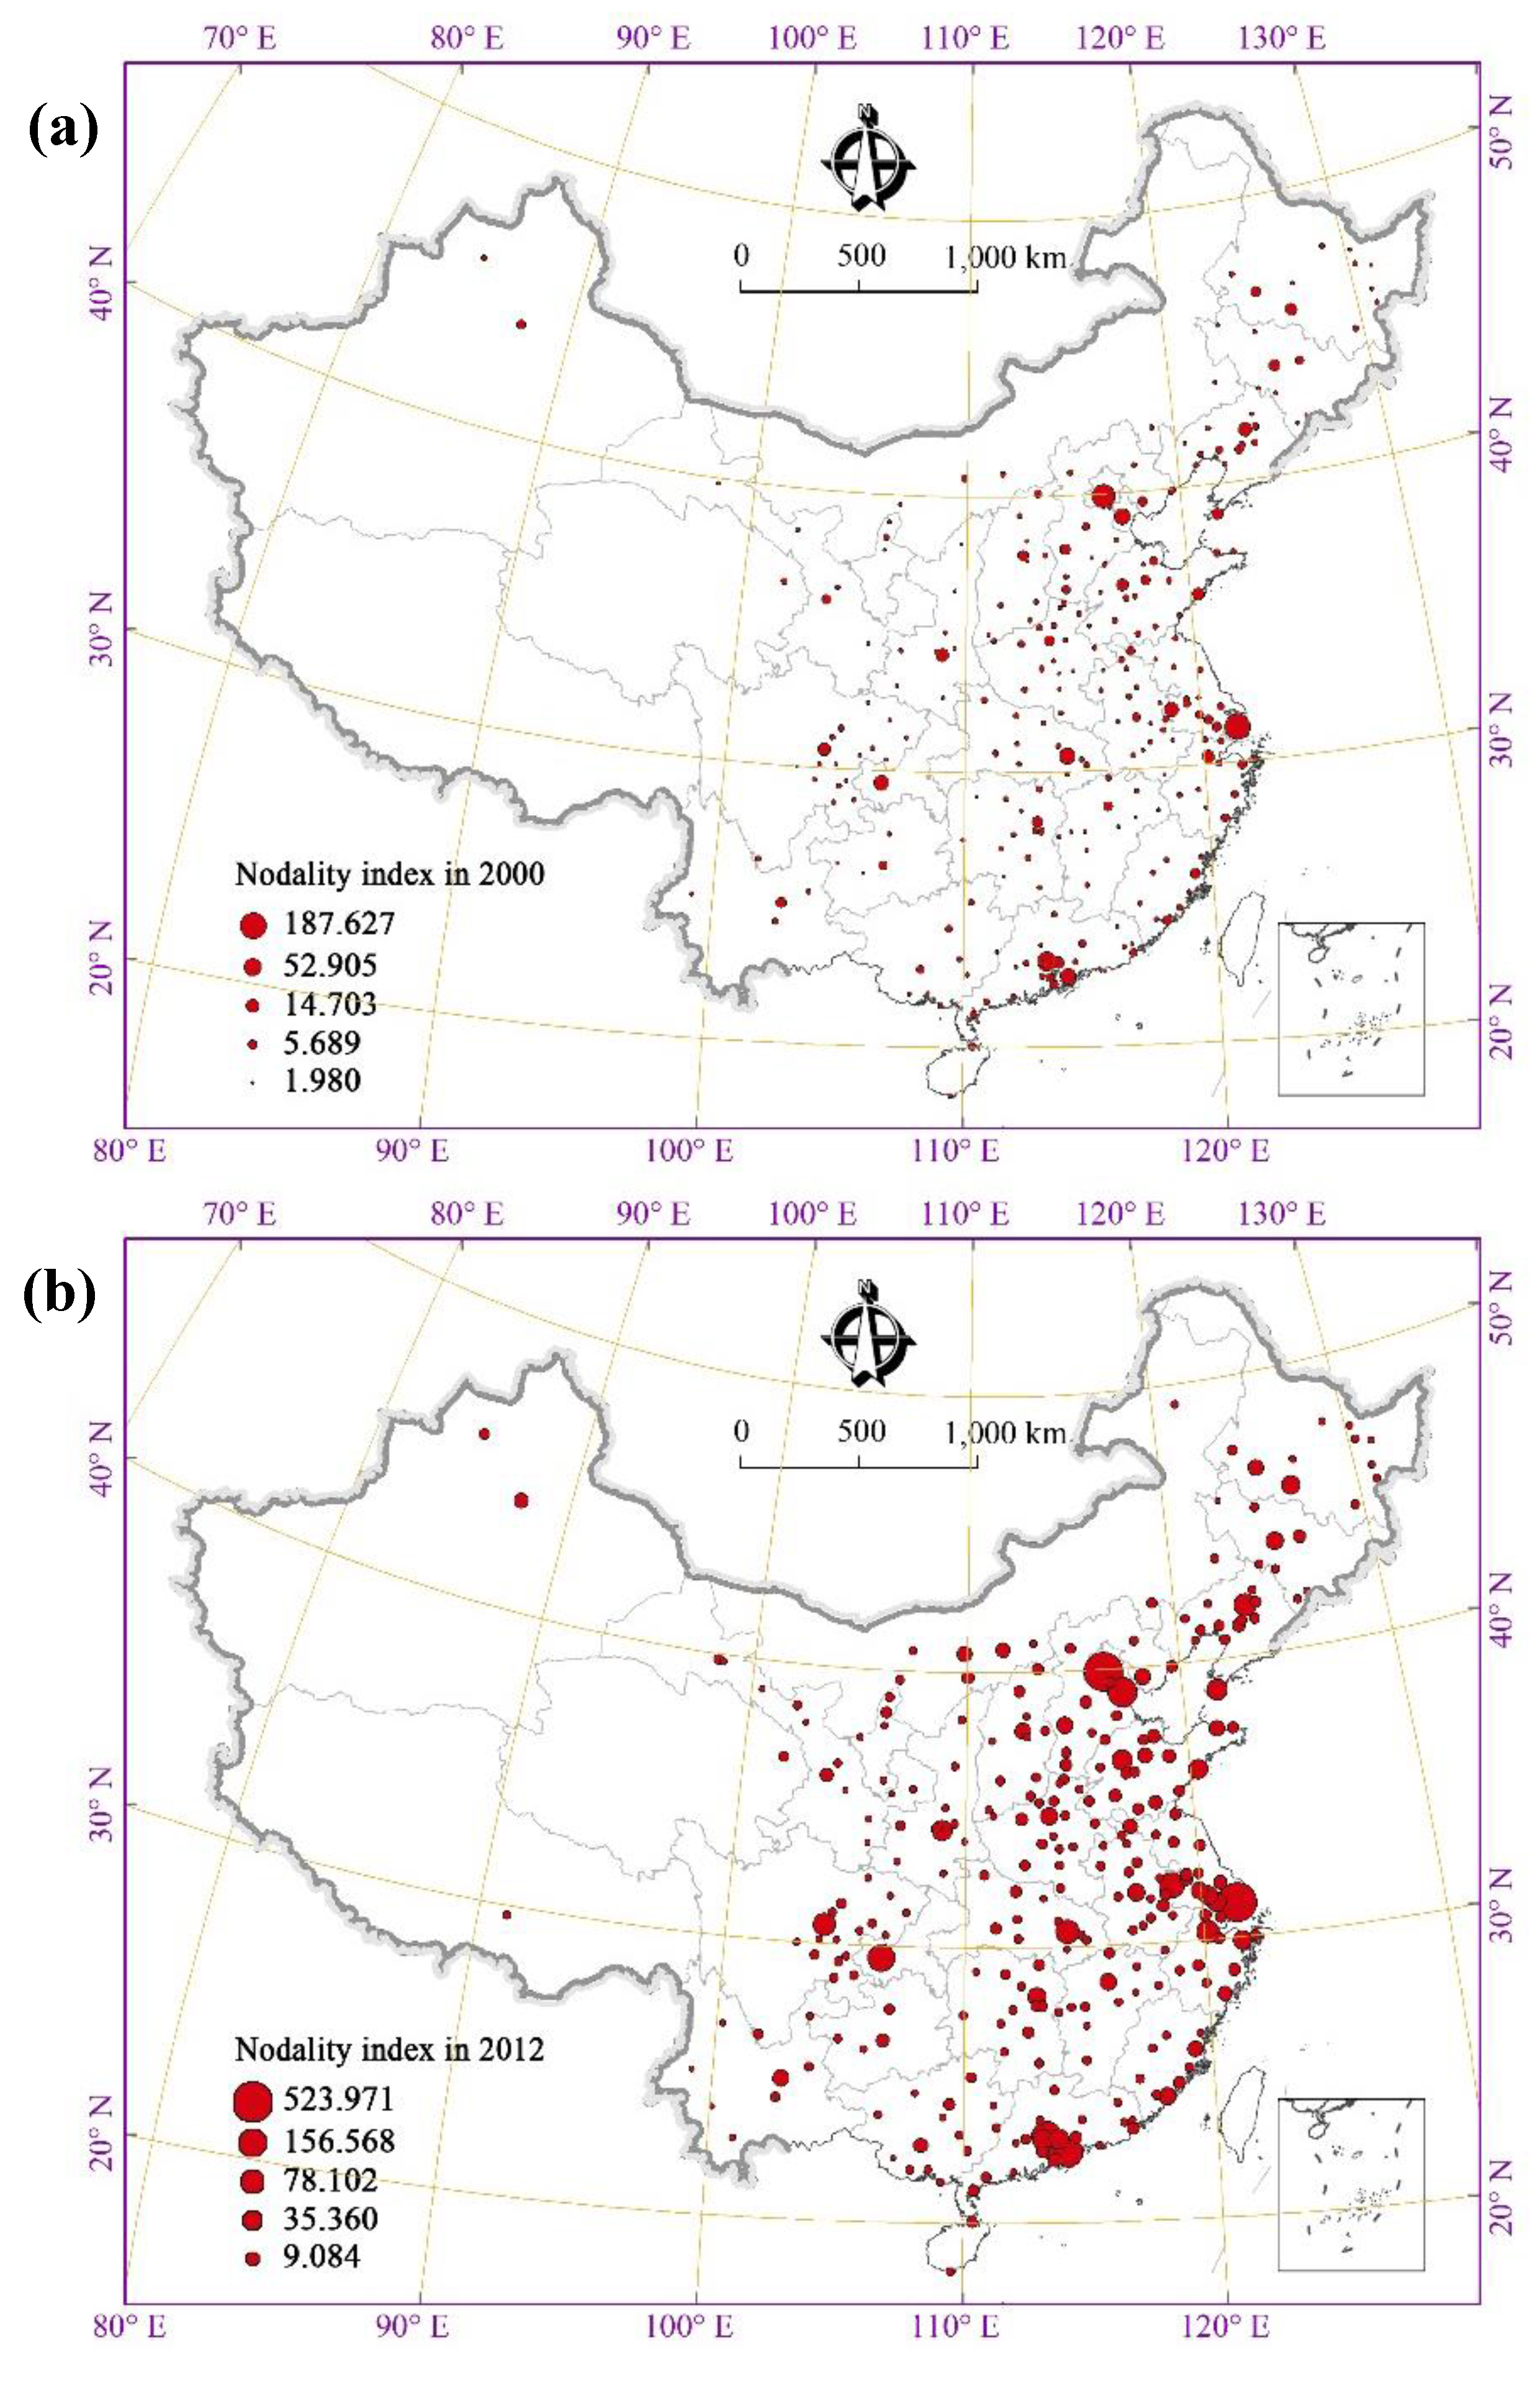
2.2.2. Regional Accessibility

Regional accessibility is defined areas as the time required for a specific location to travel to its central city [42,43]. This study uses the Cost-Weighted Distance Method (i.e., the shortest path method) to calculate the time cost between a central city and its neighbouring area [44].
The main calculation steps followed in this study in calculating regional accessibility were as follows (following [45]): (a) 1000 m × 1000 m grid cells were generated using the Grid Module of ArcGIS software. The whole of China was divided into 5515 × 4833 grid cells. (b) The transportation speed was set according to different road types in different periods based on the designed road speed provided by Highway Engineering Technical Standard of the People’s Republic of China (JTGB01-2003). The average speeds of high-speed railways, normal railways, highways, national highways, provincial highways, and normal roads in 2000 were set at 250 km/h, 80 km/h, 100 km/h, 70 km/h, 50 km/h, and 40 km/h respectively; the corresponding average speeds in 2012 were set at 250 km/h, 100 km/h, 120 km/h, 80 km/h, 60 km/h, and 50 km/h respectively. In addition, the default value with respect to the speed of land was set at 10 km/h. Water areas incur higher time costs than land, and thus the average speed over water was set at 1 km/h. It is noted that the rapid development of the high-speed railway forms an important characteristic in China’s transportation profile, as such the study also took into account the 12 high-speed lines that were in operation by the end of 2012. (c) A spatial diffusion map of accessibility was generated using the Spatial Analysis Module of ArcGIS software. Figure 2 provides the time cost of each grid cell in terms of distance to the nearest central cities in 2000 (Panel A) and in 2012 (Panel B).
Figure 2. Spatial pattern of regional accessibility in relation to time cost in China for the year (a) 2000 and (b) 2012.
Ijgi 04 01982 g002

2.3. Data Sources and Processing

(i) Spatial data: Vector data, in the form of spatial administrative boundaries of 1:1,000,000 and China’s 1 km resolution digital elevation dataset, were acquired from the National Geomatics Centre of China (NGCC). Transportation datasets for 2000 and 2012 (which include data on high-speed railways, normal railways, highways, national highways, provincial highways, and normal roads) were acquired from the Resources and Environment Data Centre at the Chinese Academy of Sciences (CAS). The digital map 1: 400, 0000 Highway Transport Version, also used in this study, was published by the Ministry of Transport of the People’s Republic of China.
(ii) Attribute data: All socio-economic data was obtained from the annual reports of the National Bureau of Statistics of China, including the Chinese City Statistical Yearbook of 2001 and 2013, the Chinese City Construction Statistical Yearbook of 2001 and 2013, as well as the yearbooks of 32 Chinese provinces (autonomous regions and municipalities) relating to the relevant years. Because we aimed to describe and compare all of these data for the selected cities, we made sure that any data used were from unified statistical sources and that the economic data were based on comparable pricing (i.e., using the constant price in 2000).
It should also be noted that population data as well as any “average” per capita indicator does have a great influence on the evaluation of regional inequality. Due to the unique Chinese hukou systems, there were two different types of population statistics (i.e., de jure and de facto population) [46,47]. The de jure population (huji renkou) includes people who are registered but actually do not live in the unit and exclude those who live in the unit but lack local hukou registration, which might tend to significantly overstate the regional inequality [7]; the de facto population (changzhu renkou) includes local residents and migrants without local hukou, which can depict an actual picture of regional inequality. In this study, the population data as well as per capita indicators was based on de facto population statistics. The de facto population of the year 2000 came from the fifth national population census of China; the de facto population of the year 2012 was substituted with the sixth national population census of China in 2010, which could not be obtained from the relevant statistical yearbook. During the rapid urbanization process in China in recent years, the population and industry scales of different size cities present a polarization trend—i.e., large and mega cities swiftly expanding and medium and small-sized cities relatively shrinking. The substitution would narrow the gap of population size between large cities and small-sized cities, which would reduce the disparity on nodality index between the different size cities. Therefore, the corresponding consequence of the substitution would slightly reduce the regional development disparity in China.

3. Results Analysis

By feeding our data in ArcGIS, we obtained the value of the spatial field across the 5515 × 4833 grid cells. The dasymetric map of the pattern of the spatial field in China in 2000 (Panel A) and in 2012 (Panel B) is provided at Figure 3. Following this first step, we then computed the mean of the spatial field values based on the grid cells located in the specific administrative units—including provincial level, prefecture level, and county level. The coefficient of deviation (CV) was employed in measuring regional inequality across China, as well as intra-regional inequality in the eastern, central, and western regions, and in the north and the south.
Figure 3. Distribution pattern of spatial field in China for the year of (a) 2000 and (b) 2012.
Ijgi 04 01982 g003

3.1. Inequality in China at Three Geographical Scales

This paper details an investigation of China’s regional development pattern, and the economic inequality it revealed in the period 2000–2012. The results of the study suggest that China has attained remarkable achievements in the socio-economic development since the turn of the century, seen in rapid increases in the spatial fields (Table 2). Meanwhile, the study also showed that the unevenness of the process of economic development across the country had intensified, in line with the rapid economic growth. In fact, the coefficient of variation (CV) of the spatial field in relation to inter-province, inter-city, and inter-county inequality rose significantly, from 1.336 in 2000 to 1.421 in 2012, from 0.888 to 0.999, and from 1.131 to 1.496, respectively. The spatial field’s deviation coefficient showed, at all three geographical scales, that regional inequality in China increased significantly within the period studied (Table 2).
Table 2. Difference in the spatial field at three geographical scales in China.
YearIndicatorsThe Whole Country of China
Provincial-Level UnitPrefecture-Level UnitCounty-Level Unit
2000Mean0.2950.2470.254
Std. Dev0.3940.2190.287
Coefficient 1.3360.8881.131
2012Mean1.6531.3161.355
Std. Dev2.3491.3142.028
Coefficient 1.4210.9991.496
Note: Coefficient is defined as the ratio of the standard deviation to the mean, which is a statistical index commonly employed in measuring regional inequality.
It is worthwhile to point out that the degree of regional development inequality seen at the inter-province and inter-county levels were more serious than that at the inter-city level. In addition, inter-county inequality across the country was shown to experience a more conspicuous increase than inter-province and inter-city inequality over the study period. Observed levels of regional inequality and change within those levels can therefore be described as being contingent upon the geographical scales [20]. As such, the effect of the geographical scale of a given inquiry needs to be accounted in the design and assessment of studies addressing regional equality, since the sensitivity of the degree and direction of change in the inequality measured shifted as the choice of geographic scale changes. Such shifts have the potential to generate quite different policy implications.

3.2. Intra-Regional Inequality in the Three Regions Studied

Table 3 reports the averages of the spatial field of the three regions at the three geographical scales. It is noted that the mean values of the spatial field evidenced a drop from eastern coastal China to central China, and then to western China in both 2000 and 2012. These results correlate with the overall level of economic development in those three areas, with respect to which the eastern region is still far ahead of the central and western regions [22].
Table 3. Difference in the spatial field of administrative units at various levels in the three regions of China.
YearIndicatorsProvincial-Level UnitPrefecture-Level UnitCounty-Level Unit
EasternCentralWesternEasternCentralWesternEasternCentralWestern
2000Mean0.5260.2130.0910.3800.2470.1060.3930.2650.112
Std. Dev0.5600.0980.0550.2960.1210.0790.3880.2200.119
Coefficient 1.0640.4570.6040.7800.4900.7410.9890.8311.062
2012Mean3.0641.0850.4722.1001.2770.5342.2041.3440.564
Std. Dev3.3230.5650.3011.8330.7110.3903.1141.1650.553
Coefficient 1.0840.5200.6380.8730.5570.7301.4130.8670.981
Note: Coefficient is defined as the ratio of the standard deviation to the mean, which is a statistical index commonly employed in measuring regional inequality.
Table 3 also presents the development disparity in the three regions at the three geographical scales. Overall, the estimated values of inequality evidenced at the provincial, the prefecture and county levels indicates that intraregional inequality of the three regions presents impressive characteristics of “reverse-to-natural gradient”, that is the interior parts of the eastern region has experienced more uneven development than the western region, and the western region has experienced a more uneven development process than the central region.
The level of development inequality recorded in the internal eastern coastal region was particularly high, and had increased significantly over the study period, an upward change that may stem from the fact that a number of the wealthiest provinces as well a number of the poorest provinces in China are both located in this region. Hainan and Guangxi, for example, which are located in the coastal region, are significantly more impoverished than Beijing, Tianjin, and Shanghai. In addition, the largest three urban agglomerations in China—the Yangtze River Delta, the Pearl River Delta, and Beijing-Tianjin-Hebei—are also located in the eastern region, which is constructive in stimulating high-speed socioeconomic growth in the region, but which also poses significant threats in terms of increasing disparity. A number of scholars argue that the distribution of municipalities, urban agglomerations, provincial capital cities, and special resource cities have a fundamental influence on the overall regional inequality of China [22,48].
In contrast, the interior parts of the central region experienced the lowest degree of inequality and an unimpressive degree of upward change. In fact, the provinces of the central region were found to enjoy similar resource endowment and development levels in relation to natural conditions, geographical location, and industrial structure, making the inequality in the central region significantly lower than that of the eastern region and the western region. Currently, in order to stimulate the development of the central region and balance the development of interior and coastal parts of the country, the Chinese government has decided to engage in efforts to foster several urban agglomerations–Shijiazhuang-Taiyuan, Wuhan, Zhongyuan, Changsha-Zhuzhou-Xiangtan, and Nanchang-Jiujiang—and develop them as regional growth poles. These urban agglomerations will gradually become aggregation sites, absorbing a wide range of resources and factors of production, which may ultimately result in increases in the region’s internal regional inequality in the future.
Due to a series of factors—in particular, less favourable natural conditions, lagging infrastructure, a lack of hometown connections amongst overseas Chinese, a poor transportation network, and poor accessibility to international markets—economic development in Western China at present lags far behind the eastern and central regions. The intraregional inequality in this region is still higher than that of the central region. One possible explanation could be that since 1999, the central government has pursued a Western Development Strategy, through which it has fostered several regional central cities—Chongqing, Chengdu, and Xi’an—in order to boost the economy of the western region. After a decade of efforts, these large metropolitan areas can be seen to have basically reached the development level of the central cities located in the coastal areas of the other regions. Widening regional inequality within the western region thus also represents a direction sequence of national strategies.

3.3. Inequality in Relation to the Interior of North and South China

Table 4 illustrates the mean as well as the coefficient of variation (CV) in relation to the spatial field of the interior, expressed through the division between the north and the south of China. The mean value accorded to the spatial field of the south approximately equalled that of the north in 2000. However, the value of the spatial field of the south was found to be significantly larger than that of the north in 2012. This shift implies that the south experienced more significant growth than its northern counterpart in the period 2000–2012. This remarkable development may stem from a number of factors. Firstly, it is noted that the “open-door policies” benefited the south much earlier and much more strongly than they contributed to the north. The Special Economic Zones were first established in the south (in Shenzhen, Zhuhai, Shantou in Guangdong province, and Xiamen in Fujian province). Subsequently, the Yangtze Delta, the Pearl River Delta, and coastal Fujian, as well as Hainan Island, joined the troops entitled with special privilege policies and other economic incentives. Secondly, for historical and geographical reasons, most overseas Chinese have origins in southern areas, especially in Fujian, Guangdong, and Zhejiang. The strong hometown connections of overseas Chinese have led to the south to become the main recipient of foreign investment. Thirdly, the south has enjoyed the advantages of a geographical location adjacent to Hong Kong, Macao, and Taiwan, and as a result is more competitive than the north in terms of international trade, foreign investment, and technology spillovers.
Table 4 demonstrates the widening nature of intraregional inequalities in both the south and the north. Despite this, it is noted that the extent of the change in regional equality varies at different analysis scales. Table 4 also shows that the inequality evidenced in interior parts of the south region is more significantly severe than in interior parts of the north.
Table 4. Difference in spatial field of administrative units at various levels in “the north” and “the south” of China.
YearIndicatorsProvincial-Level UnitPrefecture-Level UnitCounty-Level Unit
SouthNorthSouthNorthSouthNorth
2000Mean0.3170.2710.2670.2260.2450.224
Std. Dev0.4920.2690.2580.1660.2980.234
Coefficient 1.5520.9910.9660.7341.2121.046
2012Mean1.8041.4931.4921.1271.3991.307
Std. Dev2.8631.7301.5670.9352.4841.346
Coefficient 1.5871.1581.0500.8291.7761.030
Note: Coefficient is defined as the ratio of the standard deviation to the mean, which is a statistical index commonly employed in measuring regional inequality.

3.4. Summary of an Evaluation of Inequality in China

Since the turn of the new millennium, China has made great advancements in socioeconomic development, evidenced in rapid increases in the values of the spatial field of its cities (Table 2). Moreover, it is noted that the mean value of the spatial field and its change are significantly higher in the eastern region and in the south than in the central or western regions and in the north (Table 2 and Table 3); this demonstrates that the eastern region are still far ahead of the central and western regions, and that the south is more developed than the north.
Meanwhile, in line with China’s rapid economic growth, the uneven process of economic development across the country intensified in the period studied (Table 5). In considering the direction of changes in intraregional inequality in China between 2000 and 2012, we noted that the development of the eastern region was characterised by greater unevenness than the development of the central and western regions; at the same time, the interior parts of the south has experienced a greater inequality than the interior parts of the north. It is, however, also worthwhile noting that the extent of changes in inter-regional inequality, as well as in intra-regional inequality, varied at different scales of analysis. Observed levels of regional inequality and its change have been previously seen to be sensitive to the geographical scales [20], a characteristic which also became apparent in this study. Since the late 1990s, the central government has attempted to readjust its regional development strategies in order to improve the economy of inland areas and promote coordinated economic development across the country. Whilst the “open-door policies”, the Western Development Strategy, and the Central Region Grow-Up Strategy have improved the socioeconomic performance of inland areas, they also pose significant threats to inter- and intra-region inequality. Development theory and practice within the development field prove that balanced development constitutes a long-term process and, further, that “absolute balance” is simply not feasible between and within regions which have different natural conditions, geographic positions, and historical and economic development bases [16].
Table 5. The development level and inequality of internal eastern-central-western region and north-south region from 2000 to 2012.
IndicatorsPeriodThree Economic RegionsNorth-South Region
EasternCentralWesternSouthNorth
Development level 2000 and 2012HighMediumLowHighLow
Development speed From 2000 to 2012HighMediumLowHighLow
Degree of inequality 2000 and 2012HighLowMediumHighLow
Increase of inequality From 2000 to 2012LowMediumHighLowHigh
Note: indicates the overall conclusion was drawn from the results at the three geographical scales; indicates the conclusion was drawn from the results on the inter-provincial inequality. In fact, the pattern in relation to the increase of inequality drawn from the results at the three analysis scales is different even opposite.

4. Discussions

4.1. Advantages of the Spatial Field Model

4.1.1. Comprehensive Evaluation of Regional Inequality

The spatial field model developed through this paper has the advantage of being able to realise “comprehensive” evaluations of regional inequality, offering an alternative to the “single indicator” evaluations that have been employed in previous studies. Regional inequality, we argue, requires a comprehensive index that is able to reflect a number of different aspects, including economic output, industrial structure, residents’ income, social services, livelihood standards, and living environment suitability.
The construction of the proposed model was based on a “nodality index”—a measure of the ability of central cities (growth poles) to aggregate and to spread (and thus to drive the economic development of periphery areas), and “regional accessibility”—a measure indicating the convenience of regional transportation and communication infrastructure. The prosperity and development of the economy of a specific region is closely related to the spillovers, dispersion, and spread effects of its regional growth pole; the model reflects this relation. The results of the evaluation undertaken in this study comprehensively demonstrate not only the current features of economic development but also future economic development potential.
With regard to territorial exploitation and regional development, a higher value in terms of a regional central city’s spatial field means that that city not only possesses strong abilities in terms of aggregation and spreading(and therefore in driving the economic development of periphery areas), and convenient and efficient contact channels, but also enjoys remarkable development potential. By contrast, a lower value in terms of a city’s spatial field signals a city with weaker economic strength and spread effects, inconvenient and inefficient contact channels, and ultimately unpromising development potential.

4.1.2. Provision of Aesthetically Pleasing and Highly Adaptable Presentations based on a Pixel-Based Raster

It is commonly known that socioeconomic datasets (e.g., data on gross domestic product, or demographic datasets) are routinely collected through censuses and surveys, and are compiled for political or administrative units [49]. These datasets are aggregated to areal units, such as counties and census tracts [50]. All previous research on regional inequality has been based on aggregated datasets, and has thus been subject to the typically arbitrary nature of the administrative units. Choropleth maps are usually used to present the results of evaluations of regional inequality, giving the impression that socioeconomic elements are distributed homogeneously within each political or administrative unit [50]. In reality, however, the actual location of boundaries is arbitrary, and in most cases bears no logical relationship to the location of genuine discontinuities in the property being mapped. As such, the spatially discontinuous choropleth map has been considered a poor representation of the underlying continuous but not uniform distribution of various socioeconomic elements, especially where these elements are concentrated in relatively small numbers of villages, towns, and cities [51].
The spatial field energy concept proposed through this study is calculated based on an exhaustive tessellation of square grid cells, in which socioeconomic elements are modelled as a continuous density surface instead of an irregular partitioning into arbitrary administrative units. The results of evaluations of regional economy using the model are graphically represented as dasymetric and isarithmic maps, which retain a high degree of spatial accuracy and simultaneously provide aesthetically pleasing and highly adaptable presentations [51]. The results are actual density measures, which are recorded at a consistent level of generalisation by grid cells that are easily modifiable. Moreover, the model can yield precise spatial inequality estimates, providing the reader with a graphic representation and, in comparison to the conventional choroplethic method, a more accurate impression of various socioeconomic elements [51].

4.1.3. Realisation of Multi-Scale Analyses of Regional Inequality

The spatial field model can realise multi-scale analyses of regional inequality. Regional inequality has been proved to be sensitive to geographical scale; as such, a single-scale investigation might hide important characteristics of regional inequality [20,52]. In fact, there are several different geographic scales in relation to the patterns of regional inequality in China—i.e., inter-region, between the three regions; inter-province, between all provinces; inter-municipal-level city, between all cities; inter-county/district, between all counties/districts; inter-township, between all townships; as well as intra-region/province/city/county/township.
In previous studies, scholars have had to obtain evaluation indicators within various administrative units if they have wanted to realise multi-scale analysis. Undoubtedly, obtaining the socioeconomic datasets is both complicated and time-consuming, especially when the administrative units change frequently. The results of the evaluation of inequality presented in this paper are represented as isarithmic maps that are calculated from a pixel-based raster. Analysis can therefore appraise regional inequality at various geographical scales, by calculating the sum or the mean of pixel values within the corresponding administrative units. As shown in Figure 4, in order to evaluate the inequality present at inter-province, inter-city, and inter-county levels, we calculated the sum of pixel values within the corresponding administrative units. As a pixel-based evaluation mode, the spatial field model provides a very convenient method to realise multi-scale analysis. This study evaluated regional inequality in the eastern-central-western economic regions and the northern-southern region of China at three geographical scales. The results indicate that the observed levels of regional inequality are contingent upon the geographic scales.
Figure 4. Inequality evaluation based on calculating the sum of pixel values within the administrative units at different geographical scales.
Ijgi 04 01982 g004

4.2. Limitations and Extensions of the Spatial Field Model

4.2.1. Limitations in the Construction of the Spatial Field

To begin with, greater importance should be attached to the construction of the indicator system related to the spatial field. In this paper, the spatial field was defined based on nodality index and regional accessibility. However, the choice of elements to measure within the nodality index (i.e., indicator system) was largely subjective. As such, it is necessary to construct more scientific and accurate indicator systems.
Another deficiency in the indicator system used in calculating spatial field lay in the uncertainty surrounding the act of setting the distance frictional coefficient (i.e., a), a value which had a significant influence on the results. It is therefore necessary to conduct sensitivity analyses in the future so as to determine a reasonable coefficient.
Thirdly, the regional accessibility intended to capture the transportation infrastructure and reflect the degree of convenience of contact and interaction between growth poles (central cities) and the periphery areas. However, the transportation modes considered were limited to surface road networks without accounting for air and waterway transportation. It was not consistent with the reality through integrating these surface networks by their speed without taking into account the traffic capacity and location of nodes/stations. Consequently, more scientific evaluation on regional accessibility remains to be explored in depth in future.

4.2.2. Limitations and Extensions with Respect to the Solution Algorithm and Computational Requirements

The spatial field model can easily be implemented in an integrated raster-based GIS. It is, however, noted that the model required large amounts of running time due to the complexity of regional accessibility as well as the vast territory of China. In fact, in order to calculate the distance from the 5515 × 4833 grid cells to the 260 central cities in 2000, and to the 287 central cities in 2012, with the aid of an ArcGIS secondary development tool (i.e., ArcEngine) under the c# 2005 development environment, the model consumed approximately 1245 min and 1438 min respectively. It is in reality necessary to calculate the shortest distance between any spatial location and all of the central cities. In this study, the grid cells were set as large as 1000 m × 1000 m (the area of a grid is about 1 square kilometres) in order to shorten the computation time. It would, however, be much better to set the size of the grid cells as small as 100 m × 100 m in order to obtain a higher precision result (a shift requiring strengthened computational facilities). While the spatial field model was used in this study in order to evaluate the development inequality with respect to a small region (e.g., city/county), we suggest setting the grid cells at 50 m × 50 m (i.e., about the width of a road) in order to generate a more accurate and scientific evaluation result.

4.2.3. Extensions Related to the Inequality Evaluation in Other Dimensions of Human Development

Another potential extension lies in using the spatial field model to evaluate development inequality in relation to other dimensions of human development—e.g., production, consumption, wage, education, and healthcare, as well as living environments. In fact, substantial inequality exists between the eastern-central-western regions, the rural-urban, and the provinces in China in these dimensions [12,53]. Further research should attach more attention to the crucial discrepancies evidenced in the diverse regions of the country.

4.2.4. Extensions Related to the Identification of Urban Agglomerations

In the past decade, central and provincial governments have sought to foster urban agglomerations (metropolitan areas) as regional growth poles and as strategic core areas with the potential to drive continuous economic growth. An incipient structural system of urban agglomerations has indeed formed in China [41], however the concept and standard definition of urban agglomerations remains a subject of great dispute in the country. The value of a region’s spatial field reflects the level and the future potential of economic development of that region, and can be adapted to determine the spatial location and boundary of an urban agglomeration based on the dasymetric spatial field map. Figure 3 provides evidence of at least four mature urban agglomerations (the Yangtze River Delta, the Pearl River Delta, Beijing-Tianjin-Hebei, and the Shandong Peninsula) located in coastal regions, and several incipient metropolitan areas (Chongqing-Chengdu, Wuhan, Xi’an, Changsha-Zhuzhou-XiangTan, Nanchang-Jiujiang and Shijiazhuang-Taiyuan) located in central and western regions.

5. Conclusions

Based on the growth pole theory, regional interaction theory, and energy space theory, this paper puts forward the spatial field model and defines and elaborates this evaluation method. “Spatial field” is an abstract concept that can be used to define the spatial potential difference resulting from the process of the growth pole of a regional economy driving the economic development of periphery areas through transportation and communication corridors. The proposed model is characterised by the application of a nodality index which indicates both the control ability of central cities (as growth poles) in aggregating and spreading resources and factors of production, and regional accessibility—the convenience of transportation and communication infrastructure. The spatial field model makes possible the realisation of comprehensive evaluations of regional inequality with respect to current features and potential regional socioeconomic development. In addition, through the model multi-scale analysis of regional inequality can be realised, as the results are calculated based on a pixel-based raster. Moreover, the dasymetric method can yield more reasonable and precise regional inequality estimates and graphically represent the geographic distribution of various production factors, through intuitive and highly visual presentations.
The spatial field model was applied in this study in order to evaluate the spatiotemporal pattern of regional development inequality across the country and the scope of intraregional inequality between the inland eastern, central, and western regions as well as the north and the south. The evaluation addressed the period between 2000 and 2012, and analysis was undertaken at three geographical scales. The results indicated that China has made great achievements in socioeconomic development since the turn of the new millennium. Meanwhile, along with rapid economic growth, the process of economic development across the country has also become increasingly uneven; the eastern region is still far ahead of the central and western regions and the south is more developed than the north. Coastal areas have experienced more uneven development than the interior; at the same time, the interior parts of the south was characterised by greater unevenness than the interior parts of the north. In the past decades, a number of regional development strategies have been formulated and implemented that have improved the socioeconomic performance of China’s regions. However, those same strategies and policies also pose the risk of significantly increasing and widening inter- and intra-region inequality. In essence, pursuing balanced and coordinated development is a long-term process that requires further research and solutions.
This study attempts to evaluate regional inequality in China based on a new method—“the spatial field model”. Whilst a number of valuable implications have been drawn from the study, a number of gaps in the research remain. One potential extension to be addressed through future research would be to attach greater importance to the construction of the spatial field as a measure. Both the nodality index and the measure of regional accessibility used in this study to define the spatial field should be improved in future applications of the model. Another potential extension lies in setting the size of the grid cells to approximately 50 m × 50 m (i.e., about the width of a road) so as to obtain a more precise inequality evaluation result for a smaller region (e.g., city/county). Undoubtedly, it is necessary to strengthen computational facilities, as the evaluation process would be rather computationally complex and time-consuming at such a fine scale. Moreover, the extended model could be applied to the identification of urban agglomerations (metropolitan areas) and to the evaluation of inequality in other dimensions of regional development—e.g., production, consumption, education, and healthcare, as well as living environments.

Acknowledgments

The authors are indebted to the National Natural Science Foundation of China (Grant No. 41401192 and No. 41271174), the Humanities and Social Sciences Foundation of the Ministry of Education (No. 14YJCZH106), and the Key Program of the National Natural Science Foundation of China (Grant No. 71433008). The insightful and constructive comments of editors and three anonymous reviewers are greatly appreciated.

Author Contributions

Shasha Lu and Xingliang Guan contributed to the development of the idea and participated in all phases. Danlin Yu, Yu Deng and Linjie Zhou helped perform the analysis with constructive discussions and improve the figures and manuscript. All authors have read and approved the final manuscript.

Conflicts of Interest

The authors declare no conflict of interest.

References

  1. Sutherland, D.; Yao, S.J. Income inequality in China over 30 years of reforms. Camb. J. Reg. Econ. Soc. 2011, 4, 91–105. [Google Scholar] [CrossRef]
  2. Li, G.; Fang, C. Analyzing the multi-mechanism of regional inequality in China. Ann. Reg. Sci. 2014, 52, 155–182. [Google Scholar] [CrossRef]
  3. Yang, D.T. What has caused regional inequality in China? China Econ. Rev. 2002 2002, 13, 331–334. [Google Scholar] [CrossRef]
  4. Deng, X.Z.; Huang, J.K.; Rozelle, S.; Uchida, E. Economic growth and the expansion of urban land in China. Urban Stud. 2010, 47, 813–843. [Google Scholar] [CrossRef]
  5. Zhang, W. Rethinking Regional Disparity in China. Econ. Plan. 2001, 34, 113–138. [Google Scholar]
  6. Kanbur, R.; Zhang, X. Which regional inequality? The evolution of rural-urban and inland-coastal inequality in China from 1983 to 1995. J. Comp. Econ. 1999, 27, 686–701. [Google Scholar] [CrossRef]
  7. Fan, C.C.; Sun, M. Regional inequality in China, 1978–2006. Eurasian Geogr. Econ. 2008, 49, 1–18. [Google Scholar] [CrossRef]
  8. Fan, S.; Kanburb, R.; Zhang, X. China’s regional disparities: experience and policy. Rev. Dev. Financ. 2011, 1, 47–56. [Google Scholar] [CrossRef]
  9. Li, Y.H. Resource flows and the decomposition of regional inequality in the Beijing-Tianjin-Hebei Metropolitan Region, 1990–2004. Growth Chang. 2012, 43, 335–357. [Google Scholar] [CrossRef]
  10. Li, X.J.; Qiao, J.J. County level economic disparities of China in the 1990s. Acta Geogr. Sin. 2001, 56, 136–145. (in Chinese). [Google Scholar]
  11. Chen, J.; Fleisher, B.M. Regional income inequality and economic growth in China. J. Comp. Econ. 1996, 22, 141–164. [Google Scholar] [CrossRef]
  12. Liu, H. Changing regional rural inequality in China 1980–2002. Area. 2006, 38, 377–389. [Google Scholar] [CrossRef]
  13. Yu, D.L.; Wei, Y.H.D. Analyzing regional inequality in post-Mao China in a GIS environment. Eurasian Geogr. Econ. 2003, 44, 514–534. [Google Scholar] [CrossRef]
  14. Ye, X.; Wei, Y.H.D. Geospatial analysis of regional development in China: The case of Zhejiang Province and the Wenzhou model. Eurasian Geogr. Econ. 2005, 46, 445–464. [Google Scholar] [CrossRef]
  15. Fleisher, B.; Li, H.; Zhao, M.Q. Human capital, economic growth, and regional inequality in China. J. Dev. Econ. 2010, 92, 215–231. [Google Scholar] [CrossRef]
  16. Lu, D.D. Objective and framework for territorial development in China. Chin. Geogr. Sci. 2009, 19, 195–202. [Google Scholar] [CrossRef]
  17. Fujita, M.; Hu, D. Regional disparity in China 1985–1994: The effects of globalization and economic liberalization. Ann. Reg. Sci. 2001, 35, 3–37. [Google Scholar] [CrossRef]
  18. Pan, F.H.; He, C.F. Regional difference in social capital and its impact on regional economic growth in China. Chin. Geogr. Sci. 2010, 20, 442–449. [Google Scholar] [CrossRef]
  19. Ho, C.; Li, D. Rising regional inequality in China: Policy regimes and structural changes. Pap. Reg. Sci. 2008, 87, 245–259. [Google Scholar] [CrossRef]
  20. Lu, M.; Wang, E. Forging ahead and falling behind: Changing regional inequalities in post-reform China. Growth Chang. 2002, 33, 42–71. [Google Scholar] [CrossRef]
  21. Lyons, T.P. Intraprovincial disparities in post-Mao China: A multidimensional analysis of Fujian Province. J. Dev. Areas 1997, 32, 1–28. [Google Scholar]
  22. Li, Y.; Wei, Y.H.D. The spatial-temporal hierarchy of regional inequality of China. Appl. Geogr. 2010, 30, 303–316. [Google Scholar] [CrossRef]
  23. Bradfield, M. Regional Economics: Analysis and Policies in Canada; McGraw-Hill Ryerson Ltd.: Toronto, ON, Canada, 1988. [Google Scholar]
  24. Christaller, W. How I Discovered the Theory of Central Places: A Report about the Origin of Central Places; Oxford University Press: Oxford, UK, 1972. [Google Scholar]
  25. Perroux, F. Note on the concept of growth poles. In Regional Economics: Theory and Practice; Mckee, D.L., Dean, R.D., Leahy, W.H., Eds.; Free Press: New York, NY, USA, 1970; pp. 93–104. [Google Scholar]
  26. Barkley, D.L.; Henry, M.S.; Bao, S. Identifying “spread” versus “backwash” effects in regional economic areas: A density functions approach. Land Econ. 1996, 72, 336–357. [Google Scholar] [CrossRef]
  27. Grafton, D.J. Small-Scale growth centres in remote rural regions: The case of Alpine Switzerland. Appl. Geogr. 1984, 4, 29–46. [Google Scholar] [CrossRef]
  28. Richardson, H.W. Growth pole spillovers: The dynamics of backwash and spread. Reg. Stud. 2007, 41, S27–S35. [Google Scholar] [CrossRef]
  29. Krugman, P. Increasing returns and economic geography. J. Polit. Econ. 1991, 99, 483–499. [Google Scholar] [CrossRef]
  30. Castell, M. The Rise of Network Society; Social Science Academic Press: Beijing, China, 2000. [Google Scholar]
  31. Scott, A.J. Global City-Regions: Trends, Theory, Policy; Oxford University Press: Oxford, UK, 2002. [Google Scholar]
  32. Short, J.R. Global Metropolitan: Globalizing Cities in a Capitalist World; Routledge: London, UK, 2004. [Google Scholar]
  33. Guan, X.L.; Fang, C.L.; Luo, K. Regional economic development disparity of China: An application of spatial field. Scientia Geographica Sinica. 2012, 32, 1055–1065. [Google Scholar]
  34. Haynes, K.E.; Fotheringham, A.S. Gravity and Spatial Interaction Models; Sage Publications: Beverly Hills, CA, USA, 1984. [Google Scholar]
  35. Wang, F.H.; Guldmann, J.M. Simulating urban population density with a gravity-based model. Socio-Econ. Plan. Sci. 1996, 30, 245–256. [Google Scholar] [CrossRef]
  36. Batten, D.F.; Boyce, D.E. Spatial interaction, transportation, and interregional commodity flow models. Handb. Reg.Urban Econ. 1987, 1, 357–406. [Google Scholar]
  37. Chen, Y.G. The distance-decay function of geographical gravity model: Power law or exponential law? Chaos Solitons Fractals. 2015, 77, 174–189. [Google Scholar] [CrossRef]
  38. Carrothers, G.A.P. An historical bedew of the gravity and potential concepts of human interaction. J. Am. Inst. Plan. 1956, 22, 94–102. [Google Scholar] [CrossRef]
  39. Preston, R E. Two centrality models. Yearb. Assoc. Pac. Coast Geogr. 1970, 32, 59–78. [Google Scholar]
  40. Song, S.F.; Kevin, H.L. Urbanization and city size distribution in China. Urban Stud. 2002, 39, 2317–2327. [Google Scholar] [CrossRef]
  41. Fang, C.L.; Guan, X.L.; Lu, S.S.; Zhou, M.; Deng, Y. Input-Output efficiency of urban agglomerations in China: An application of Data Envelopment Analysis (DEA). Urban Stud. 2013, 50, 2766–2790. [Google Scholar] [CrossRef]
  42. Goodall, B. Dictionary of Human Geography; Penguin: London, UK, 1987. [Google Scholar]
  43. Wan, N.; Zhan, F.B.; Zou, B. A relative spatial access assessment approach for analyzing potential spatial access to colorectal cancer services in Texas. Appl. Geogr. 2012, 32, 291–299. [Google Scholar] [CrossRef]
  44. Wang, Z.B.; Xu, J.G.; Fang, C.L.; Xu, L.; Qi, Y. The study on county accessibility in China: Characteristics and effects on population agglomeration. J. Geogr. Sci. 2011, 21, 18–34. [Google Scholar] [CrossRef]
  45. Wang, L.; Deng, Y.; Liu, S.H.; Wang, J.H. Research on urban spheres of influence based on improved field model in central China. J. Geogr. Sci. 2011, 21, 489–502. [Google Scholar] [CrossRef]
  46. Chan, K W. The Chinese hukou system at 50. In Eurasian Geogr. Econ.; 2009; Volume 50, pp. 197–221. [Google Scholar]
  47. Zhou, Y.X.; Ma, L.J.C. China’s urban population statistics: A critical evaluation. Eurasian Geogr. Econ. 2005, 46, 272–289. [Google Scholar] [CrossRef]
  48. Wang, Y.; Fang, C.L.; Xiu, C.L.; Liu, D.Q. A new approach to measurement of regional inequality in particular directions. Chin. Geogr. Sci. 2012, 22, 705–717. [Google Scholar] [CrossRef]
  49. Deichmann, U.; Balk, D.; Yetman, G. Transforming Population Data for Interdisciplinary Usages: From Census to Grid. 2001. Available online: http://sedac.ciesin.org/gpw-v2/GPWdocumentation.pdf (accessed on 12 July 2015).
  50. Mennis, J. Generating surface models of population using dasymetric mapping. Prof. Geogr. 2003, 55, 31–42. [Google Scholar]
  51. Langford, M.; Unwin, D.J. Generating and mapping population density surfaces within a geographical information system. Cartogr. J. 1994, 31, 21–26. [Google Scholar] [CrossRef] [PubMed]
  52. Wei, Y.H.D. Regional inequality in China. Prog. Hum. Geogr. 1999, 23, 49–59. [Google Scholar] [CrossRef]
  53. Poon, J.P.H.; Shang, Q.Y. Regional wage inequality in China, 1996–2010. Eurasian Geogr. Econ. 2012, 53, 338–355. [Google Scholar] [CrossRef]

