1. Introduction
Short rotation woody crops (SRWC) have been considered as a potential feedstock supply source for sustainable biofuel production [
1]. Among the SRWCs, hybrid poplars have been extensively studied for bioenergy production because of many factors, including their fast growth, high photosynthetic efficiency, easy adaptation to new climates and ease of cultivation [
2,
3,
4]. Earlier studies have shown that growing poplar in short rotation can not only consistently supply the feedstock for biofuel production, but also support environmental stewardship [
5,
6].
Efficient feedstock supply chains that can provide biomass reliably and cost effectively are needed for the development of sustainable bioenergy industries. To build such supply chains, many factors influencing biomass supply need to be carefully analyzed with the participation of many stakeholders, including land owners, farmers, industrial players and policy makers [
7,
8,
9]. Some of the important factors in the biomass supply chains are land productivity, biomass production and transportation costs, biomass market development, policies, environmental impacts and social acceptance. In order to facilitate a comprehensive analysis and to configure landscape design for adequate biomass supply, stakeholders must have access to necessary and reliable information. For landowners and farmers to participate, they need to understand the potential for poplar biomass production on their lands.
The Advanced Hardwood Biofuels Northwest (AHB) project, a research and development initiative supported by the U.S. Department of Agriculture National Institute of Food and Agriculture (USDA-NIFA), focuses on researching sustainable ways of producing biofuel from poplar production in the U.S. Pacific Northwest region. Under this initiative, a physiological model, referred to as 3PG-AHB, was developed for modeling poplar growth under short rotation using the existing 3PG model (use of
Physiological
Principles in
Predicting
Growth) [
10,
11]. The new model adds several key features for simulating poplar growth as a biomass feedstock, including the option for coppicing, that is, harvesting standing biomass by cutting near the ground level and allowing the trees to resprout for the subsequent growth interval. Another modification includes allometric relations more suitable for SRWCs. Details of the 3PG-AHB model are discussed separately [
11].
Biomass potential varies with the change in location, management and climate, and therefore, site-level logistics are important in configuring landscape design for reliable biomass supply chains [
8]. For instance, while land owners demand the best management strategies to maximize profit under a variety of climate conditions, industrial partners need to identify cost-effective feedstock resources. Similarly, policy makers look for net lifecycle energy and carbon benefits of the biomass to promote environmental sustainability. To facilitate the assessment of site-level logistics by different stakeholders, a dynamic interactive tool is required that can provide spatially-explicit estimates of biomass production under different management options and climate conditions.
Previous work has been done in building applications to support geographical and agricultural decision-making. These tools use various technologies and address issues that include location selection and evaluation, continuous plantation monitoring and real-time decision-making [
12,
13,
14,
15]. The goal of the 3PG-AHB application was to provide a simple, intuitive interface that is easy and convenient to use. The application should also allow model sensitivity analysis and location-specific calibration to be useful for individual landowners. The tool includes direct access to existing geospatial data for the U.S. Pacific Northwest, as this is currently the region of interest in the scope of the AHB study. However, it is also more generally applicable, as long as the relevant weather and soil data can be obtained. The development for the application has been greatly simplified with the inclusion of readily-available third-party technologies. This shortened the development cycle and automated the process of code building, testing and release. The description of the technological markup of the application is provided in this paper, so that any part of the process may be readily reproduced. The approach can also be adopted by those interested in similar development for other resource management and decision support applications.
2. Methods
2.1. Application Requirements and Design
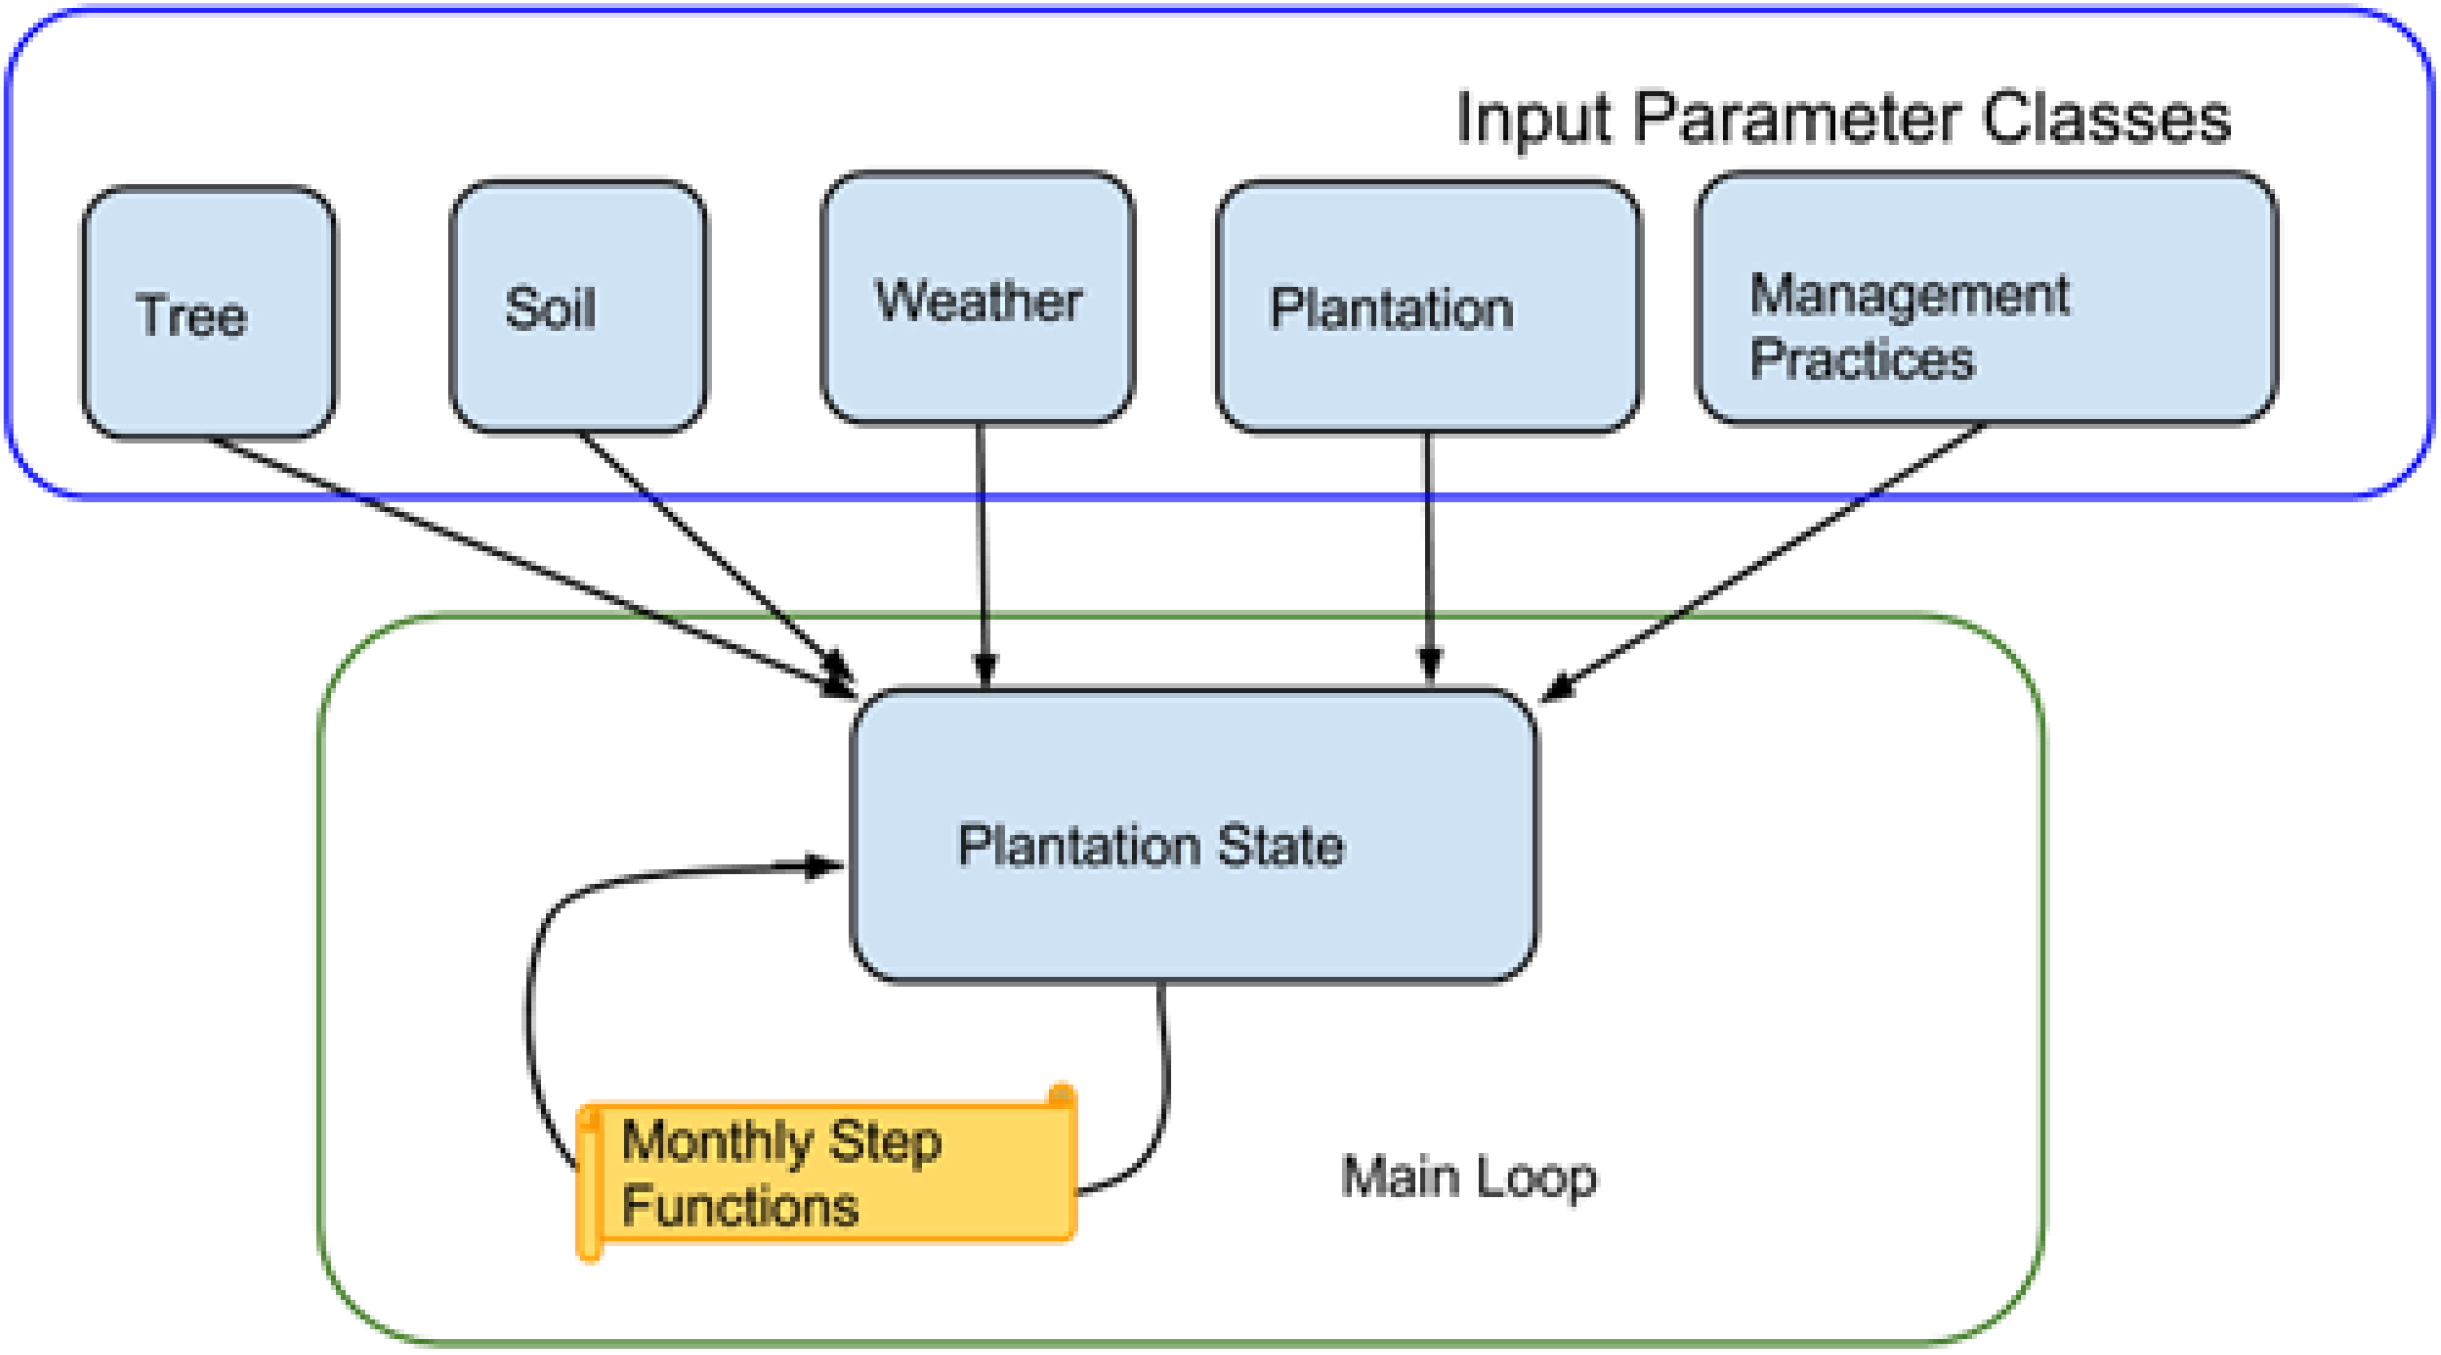
For the purposes of the project, the actual model calculations are required to run in two environments: (1) inside the Postgres database for the regional studies; and (2) online, where the sensitivity analysis and/or calibration can be performed on a single location. In the database scenario, inputs and outputs are supplied by database tables, while on the web, the data are handled in JavaScript Object Notation (JSON) format. Since populating these parameters depends on the environment in which the program is run, the better code design solution was an object-oriented approach with a separate environment-based input-output data handling module (
Figure 1). At each time step, there are a fixed number of functions that run, corresponding to the theoretical model equations, and on the website these function code snippets can be exposed upon user request for observing equation implementation. The model runs iteratively on a monthly time step for the time specified by the user between planting date and end-of-simulation date.
Figure 1.
Model interaction chart.
Figure 1.
Model interaction chart.
2.2. User Interface Specifications
The main goal for the user interface is to provide a simple and clean design that is responsive and able to adapt to various device screen sizes and resolutions.
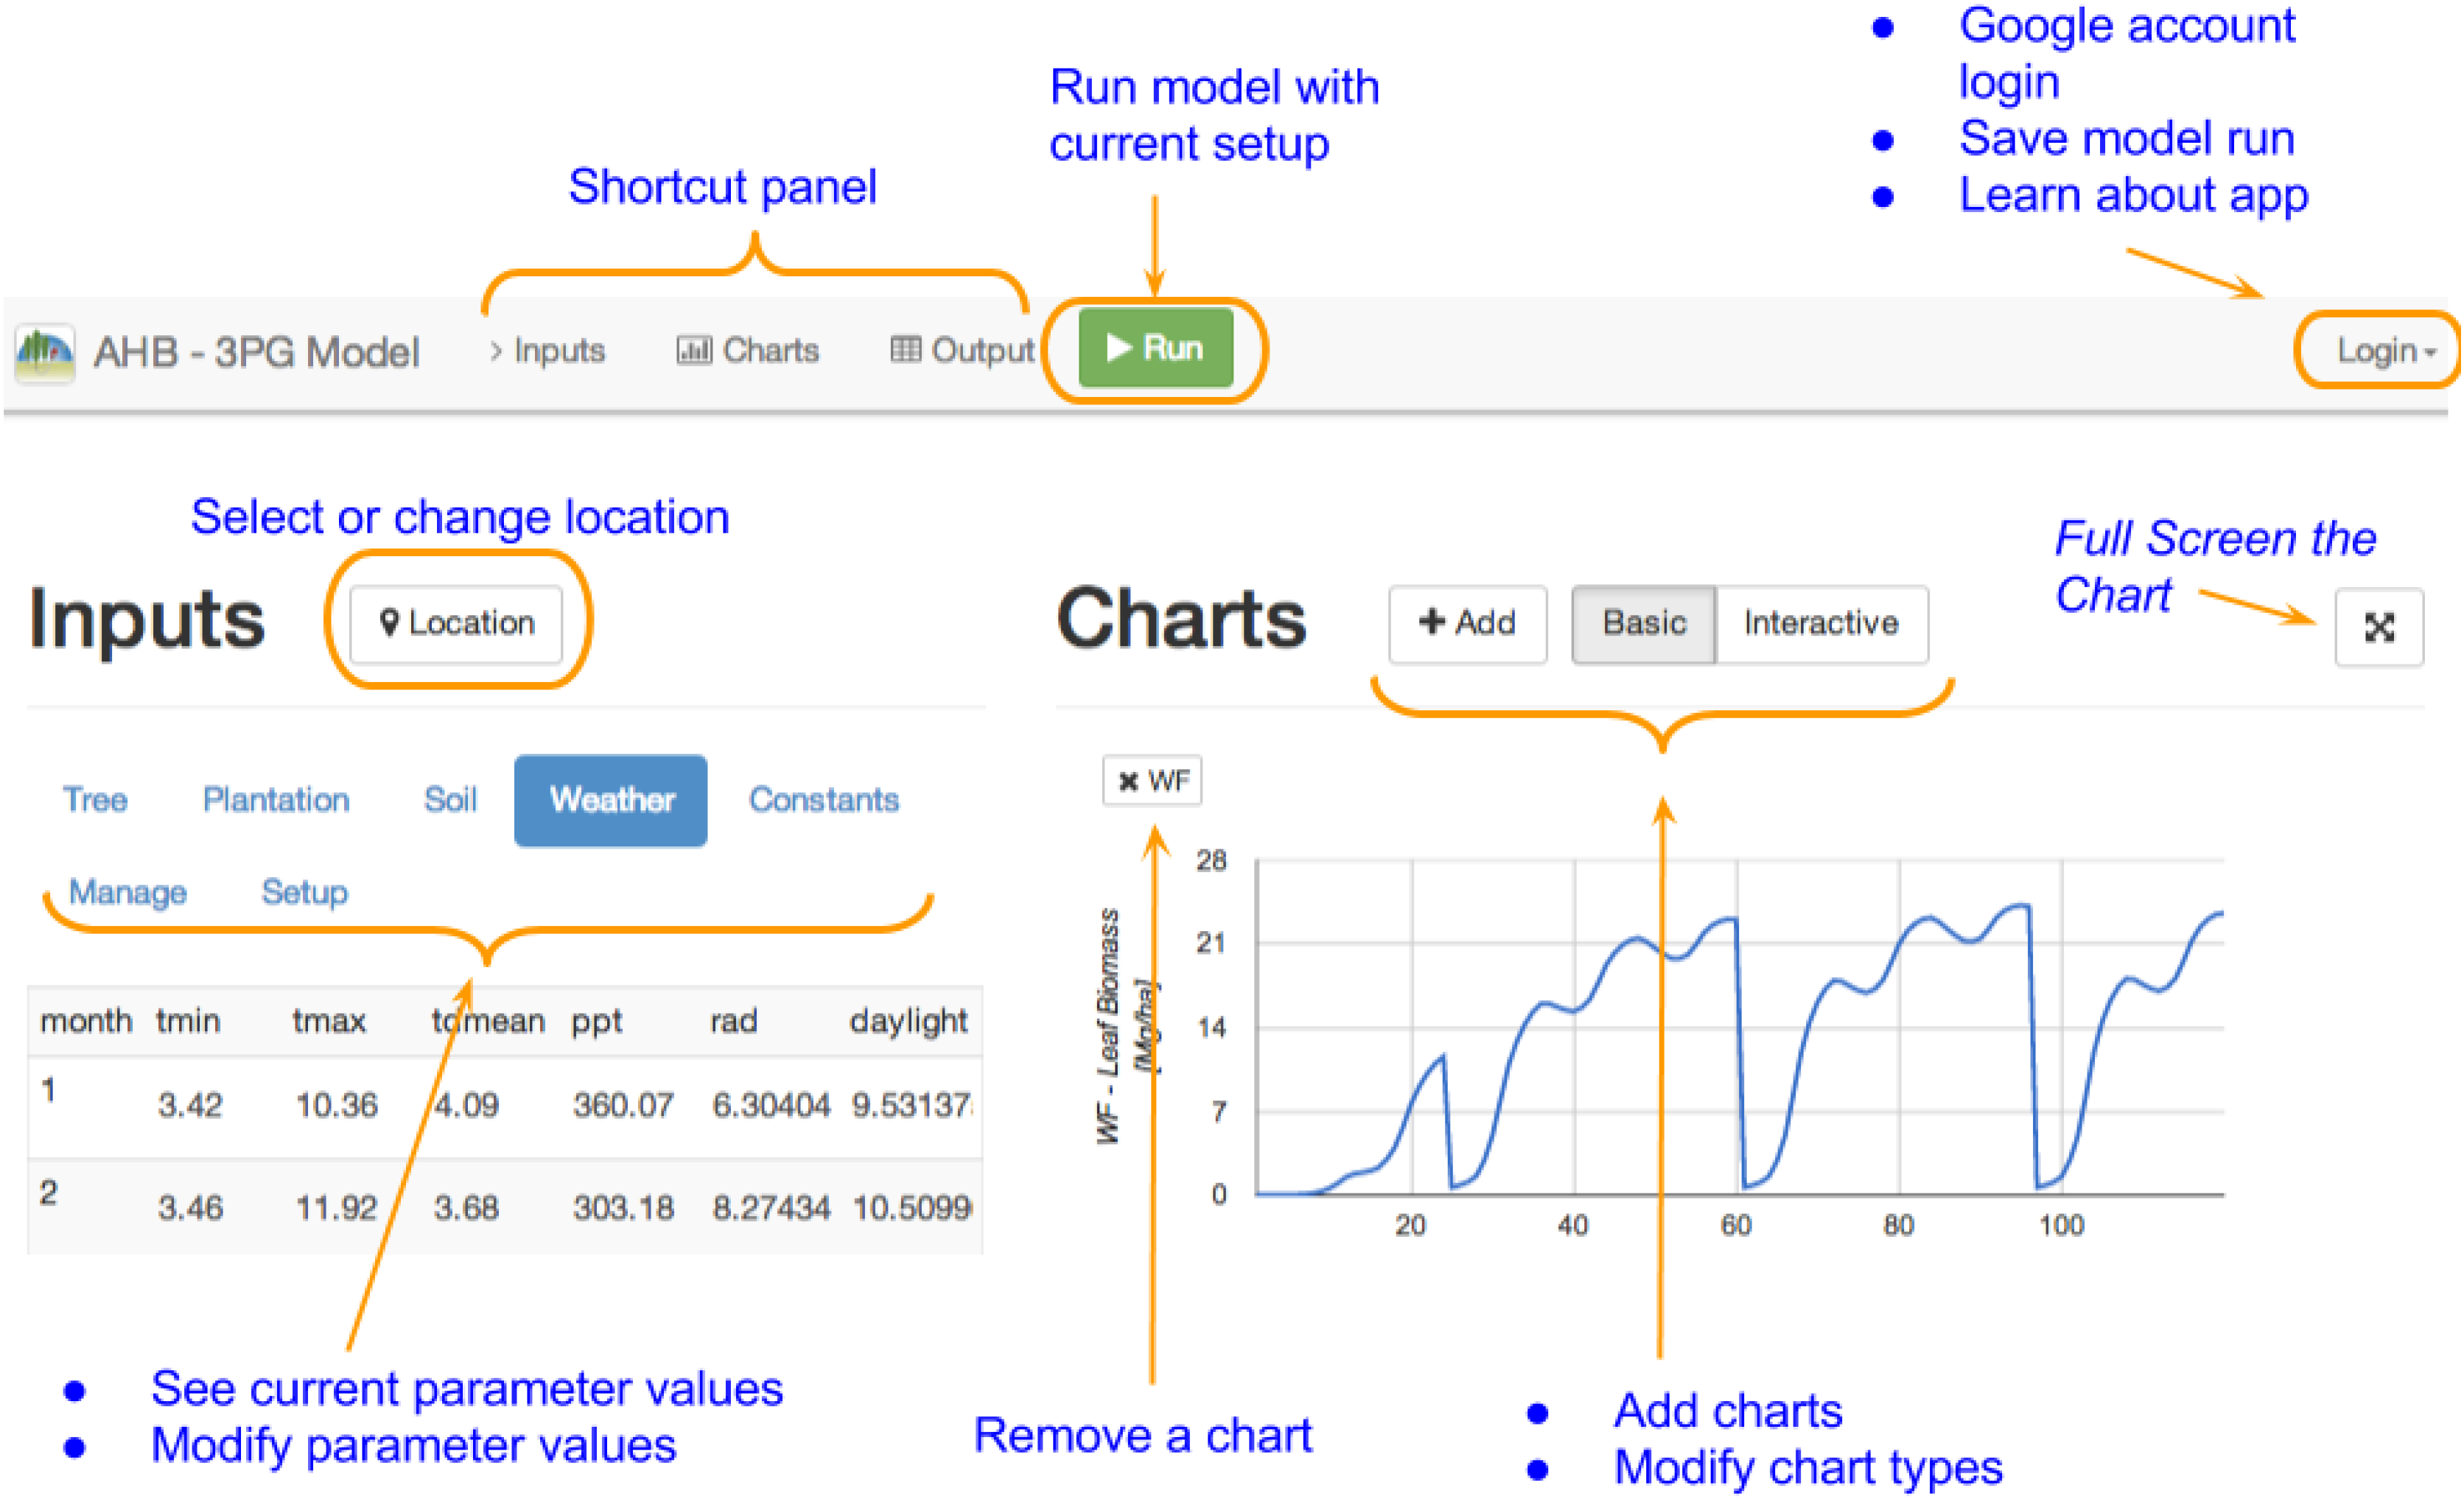
The website is separated into 3 sections: (1) Inputs, Charts and Raw Output with a toolbar on the top that contains shortcuts to these 3 sections; (2) Run button and (3) Login menu (
Figure 2).
Figure 2.
User interface features.
Figure 2.
User interface features.
Users can visually select a location on the map by clicking the location button in the Inputs section. This location is interpreted on an 8 by 8-kilometer grid, which is the resolution for the weather and soil data that have been collected from the PRISM and State Soil Geographic databases [
16,
17]. This resolution is sufficient for the analysis conducted within the AHB project. However, a finer resolution may be implemented in future versions of the application. The default weather and soil data for any chosen location can be easily overwritten by higher resolution input data whenever such data are available to the user.
Users select the input class by clicking on one of the tabs, which displays the variables in that class, as well as their descriptions. Clicking on a variable name displays its default value, which can then be changed. This approach of zooming to the input value of interest has improved the application interface and helped to group related parameters in a meaningful and intuitive way. The users interested in crop species parameters will find them under the “Tree” tab, while those interested in plantation management practices will find them under the “Manage” tab.
Charts come in Basic and Interactive modes for simple display and fine-grained time resolution, respectively (
Figure 3 and
Figure 4). There is also a button for adding, removing and learning more about the functions available for display.
Figure 3.
Biomass yields with irrigation set to half and full irrigation based on crop water needs.
Figure 3.
Biomass yields with irrigation set to half and full irrigation based on crop water needs.
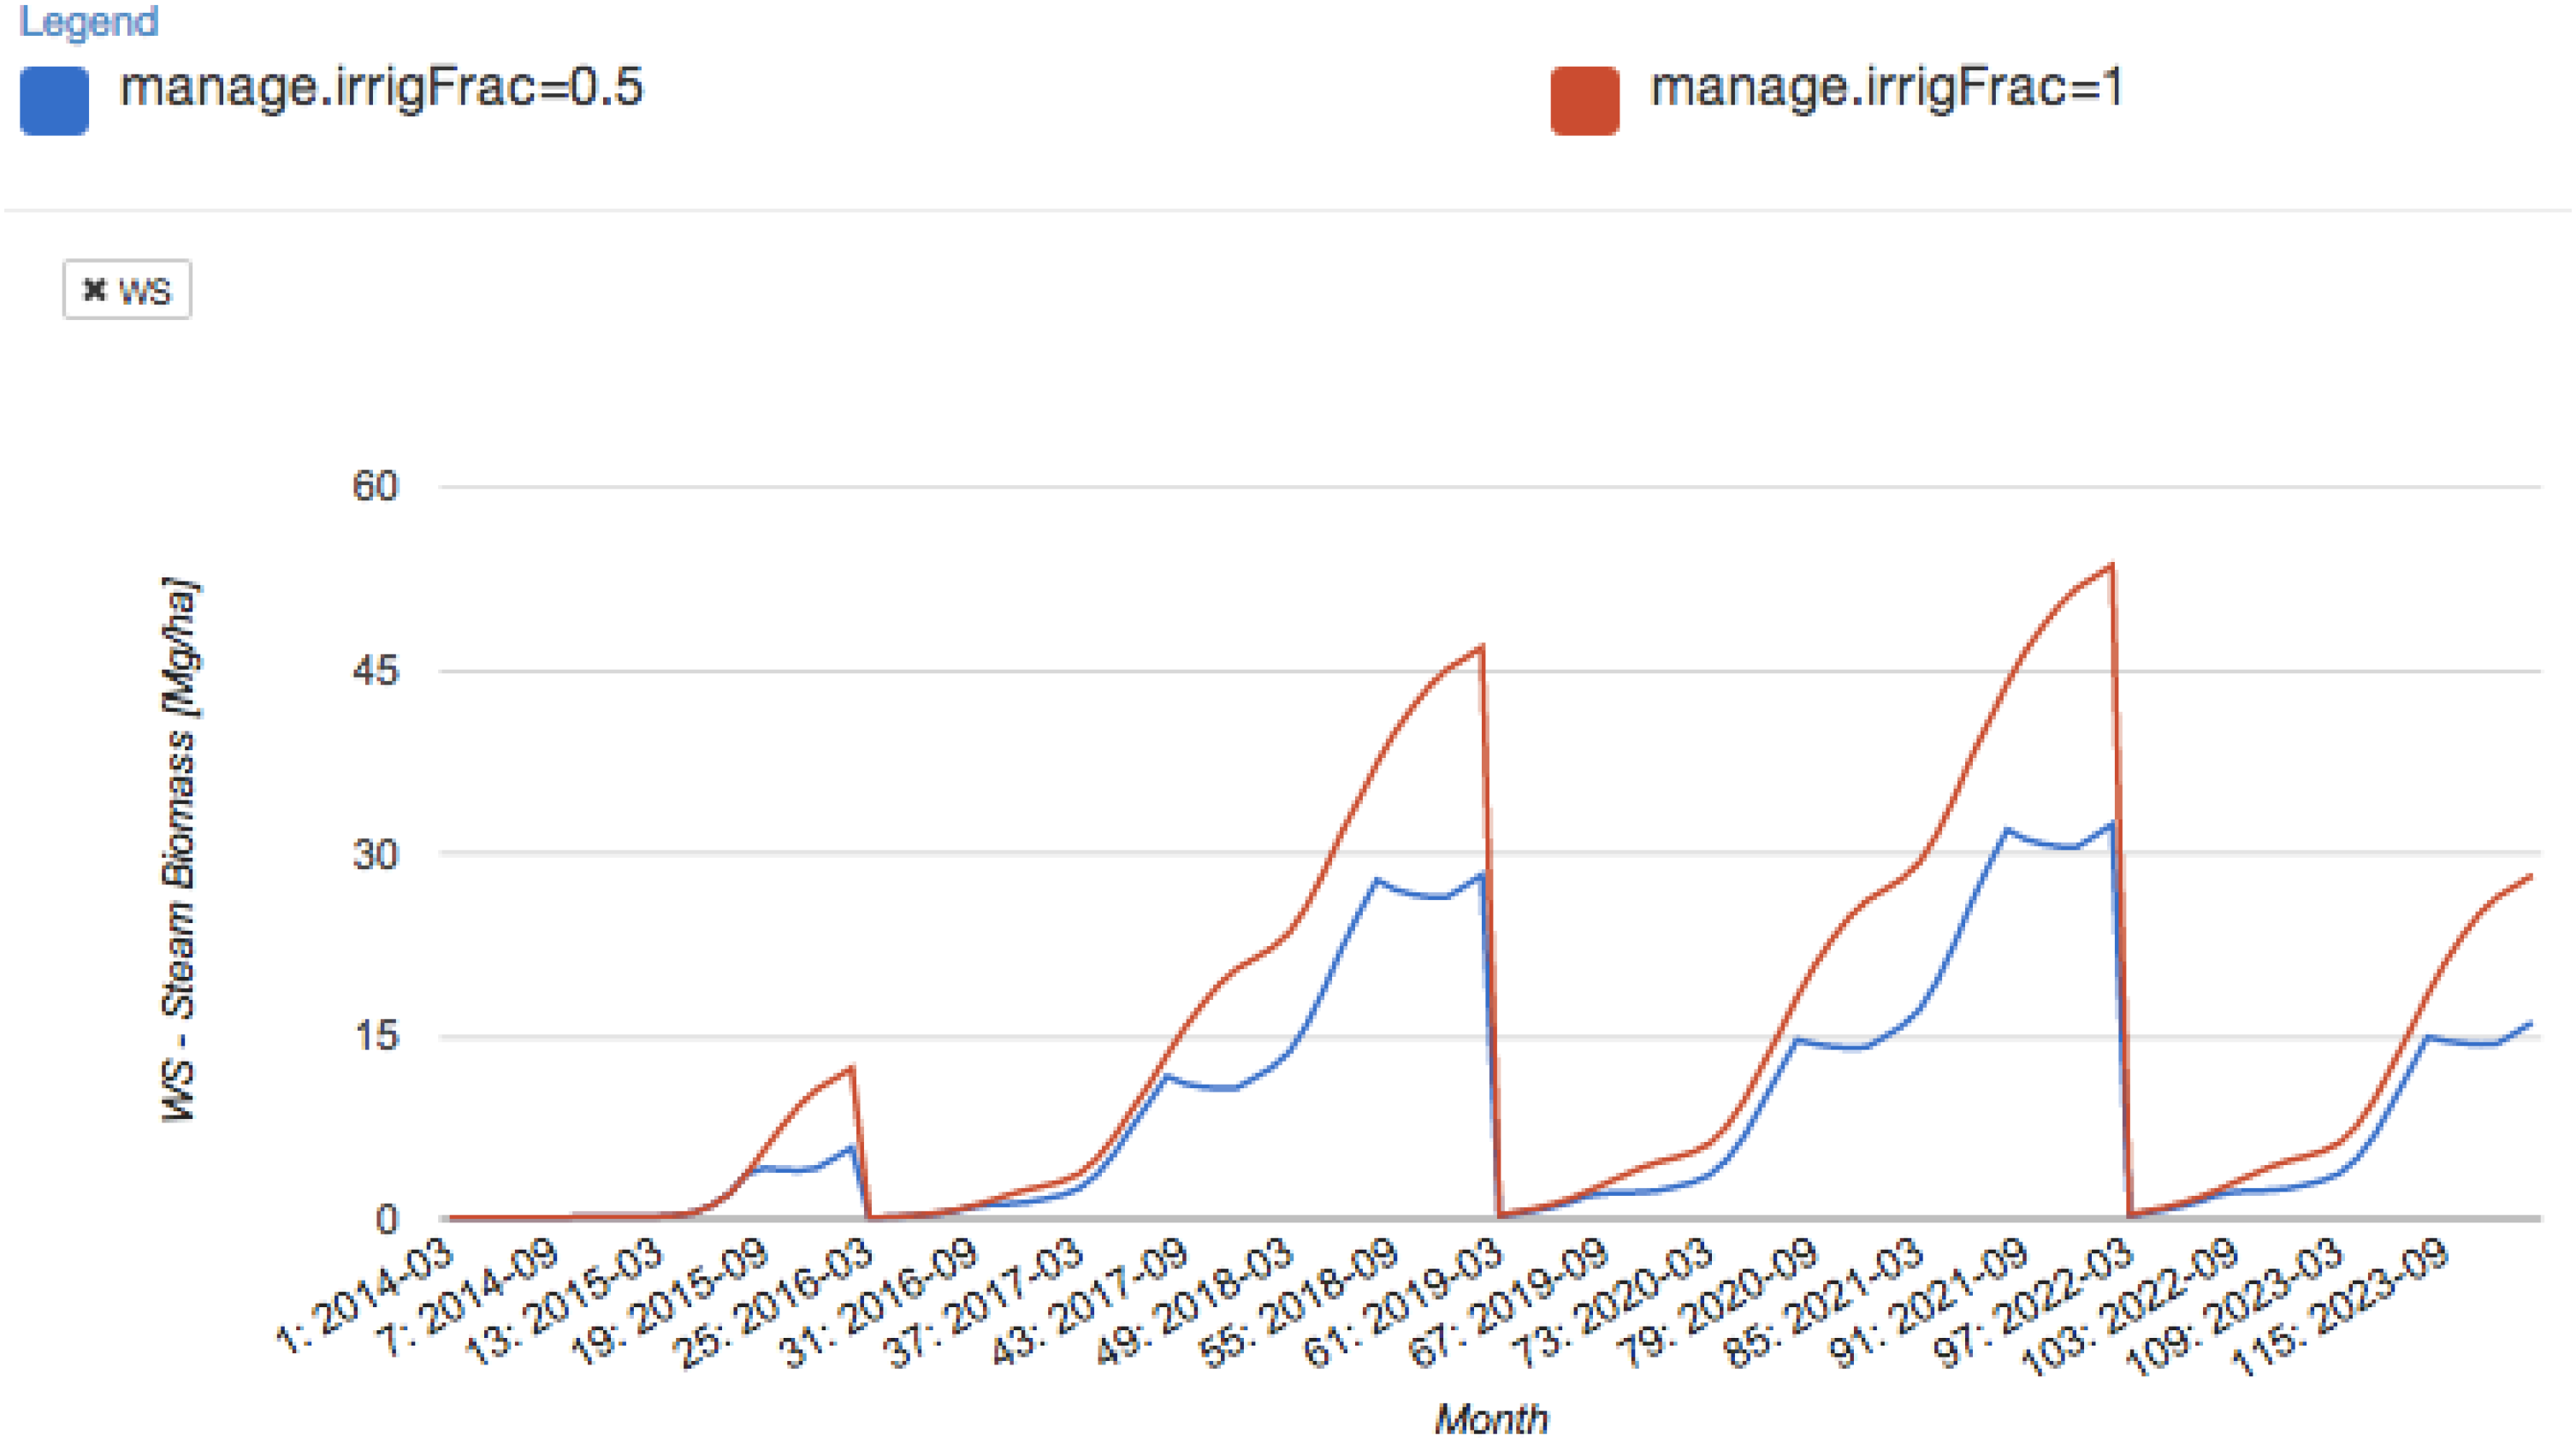
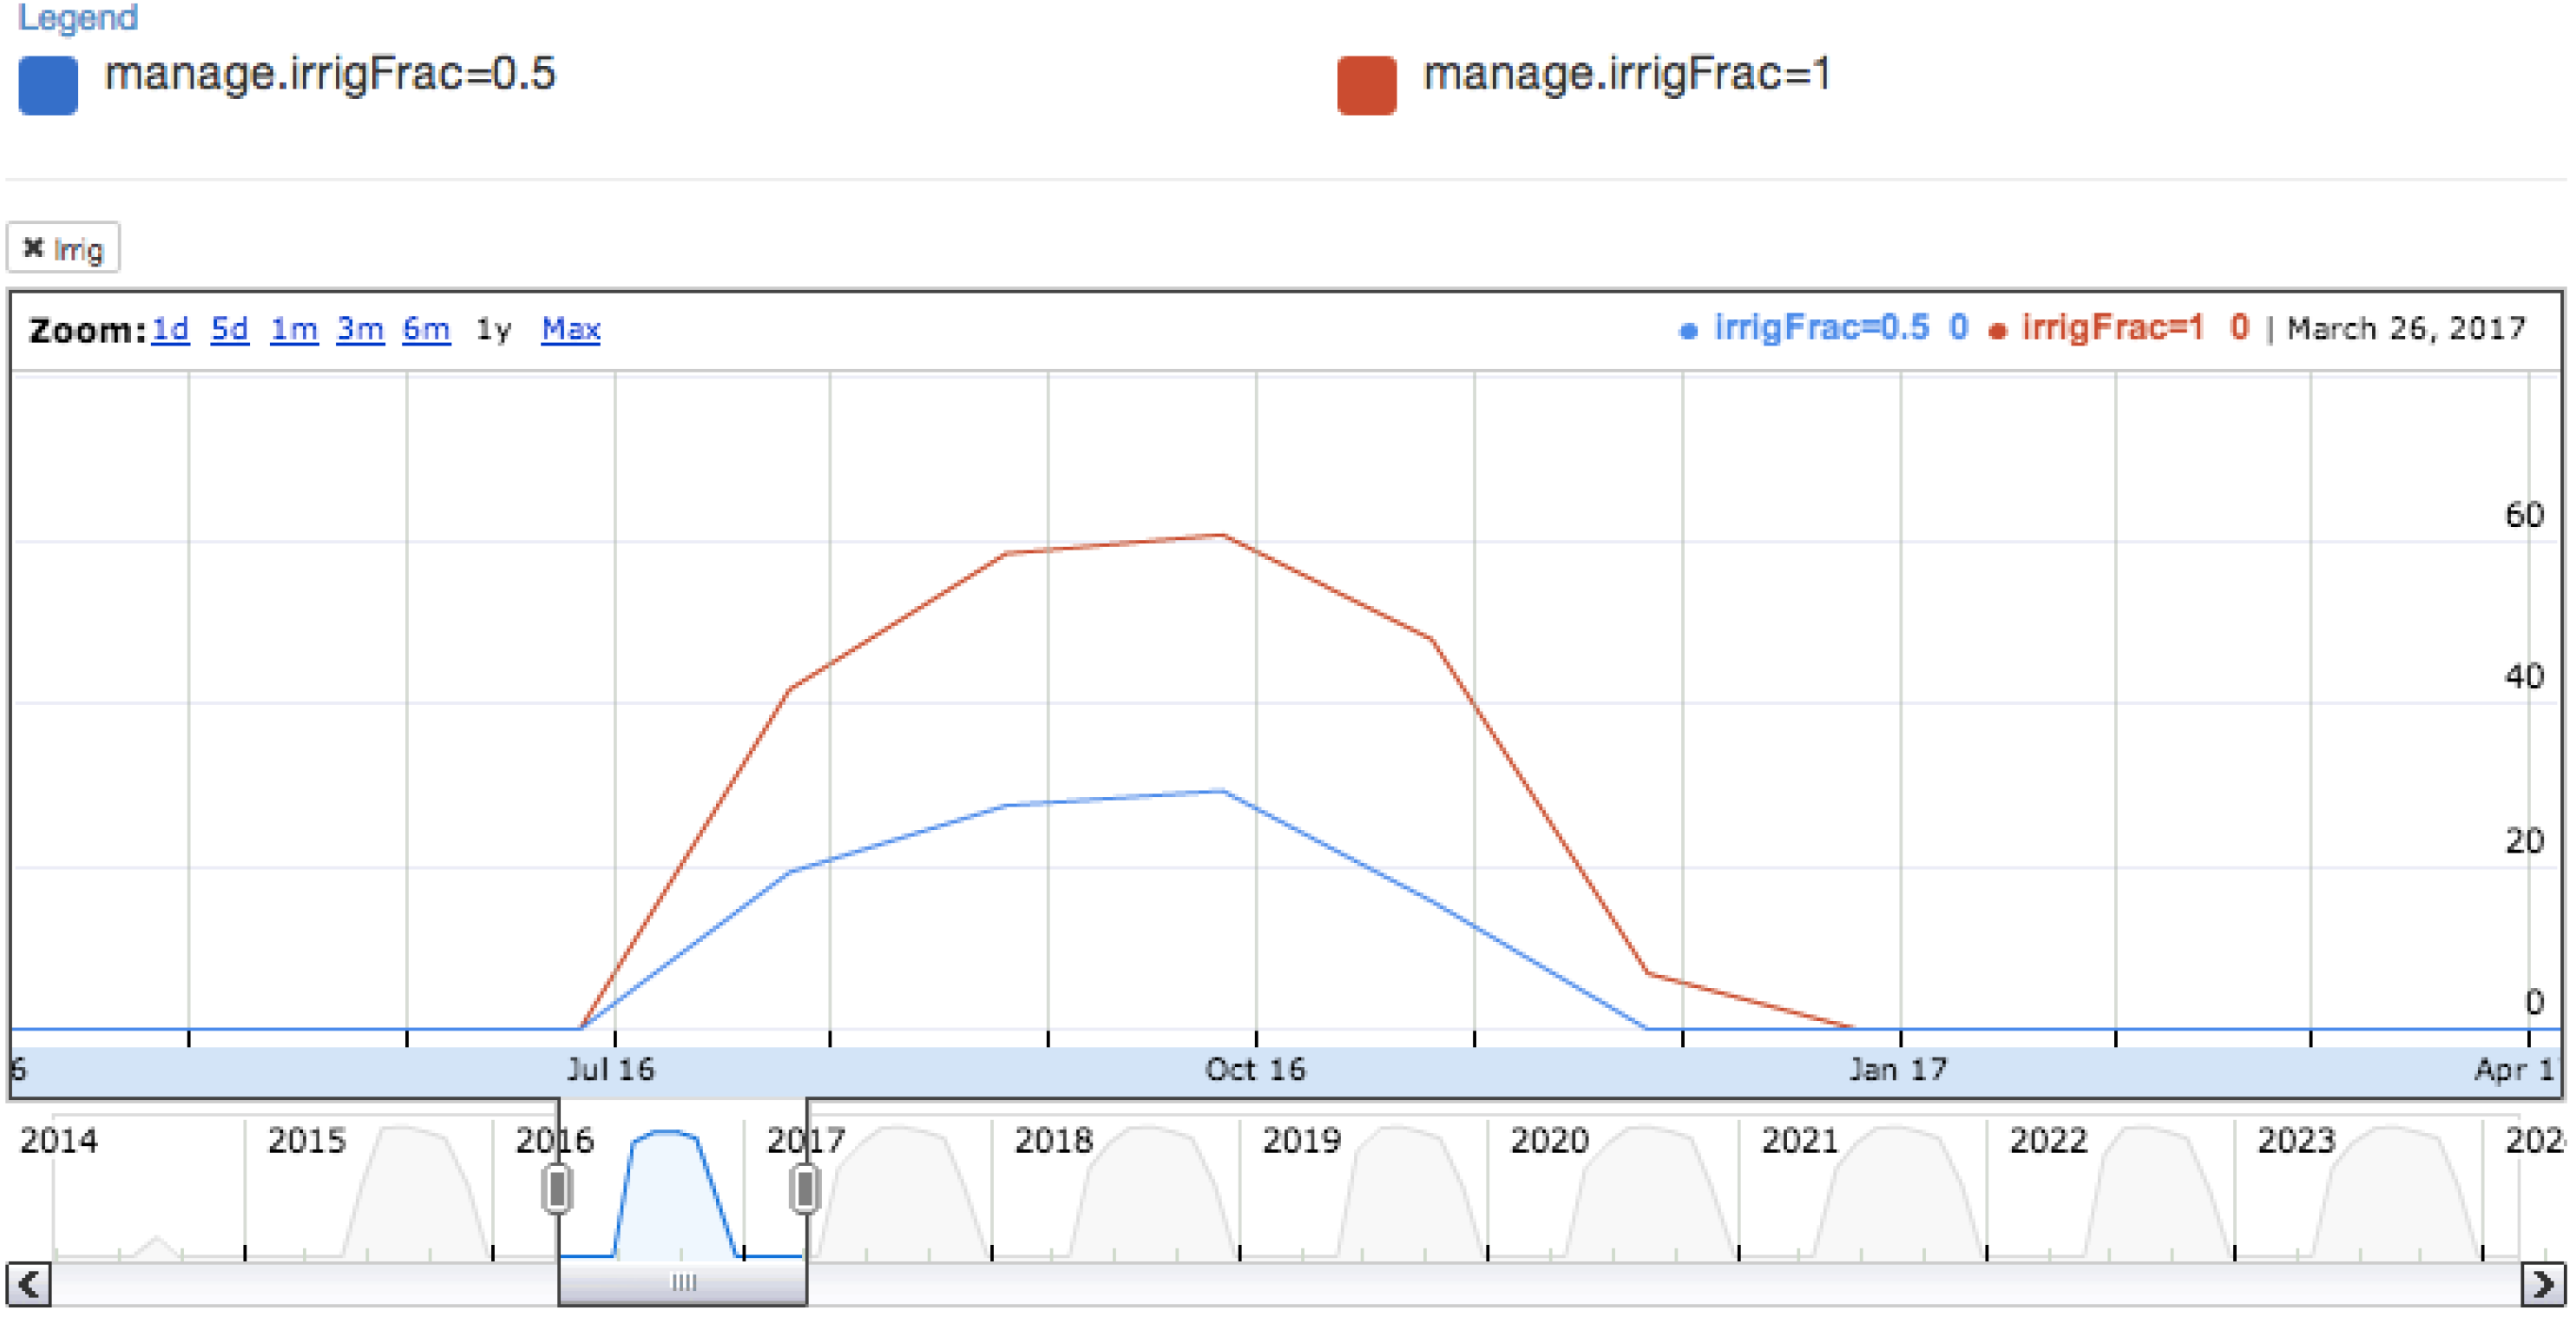
Figure 4.
The effects of the irrigation fraction on stem biomass yield.
Figure 4.
The effects of the irrigation fraction on stem biomass yield.
The shortcut panel is useful when the application is viewed on the smaller screen of a handheld device. It aids in quickly switching between the locations on the site instead of scrolling up and down between them.
2.3. Sensitivity Analysis and Calibration Support
For model variation analysis and parameter testing that are crucial during the model development stages, the application supports the option to input an array of comma-separated values for up to 2 arrays at a time. This, in turn, provides the option to compare results for various inputs. During the model validation phase, this feature can be used to analyze various effects of the parameters, a crucial step in species parameterization when tuning the model to other hardwood species.
The same functionality of the application can be applied to the plantation management parameters that enable farmers to choose the time of the year that works best for planting and coppicing and to decide on irrigation strategies for optimal growth.
Thus, setting the irrigation fraction parameter to 0 simulates plantation yields under rain-fed only cultivation, with no supplemental irrigation, while setting it to 1 simulates yields under full irrigation to meet all of the water needs of the trees (
Figure 3).
2.4. Implementation
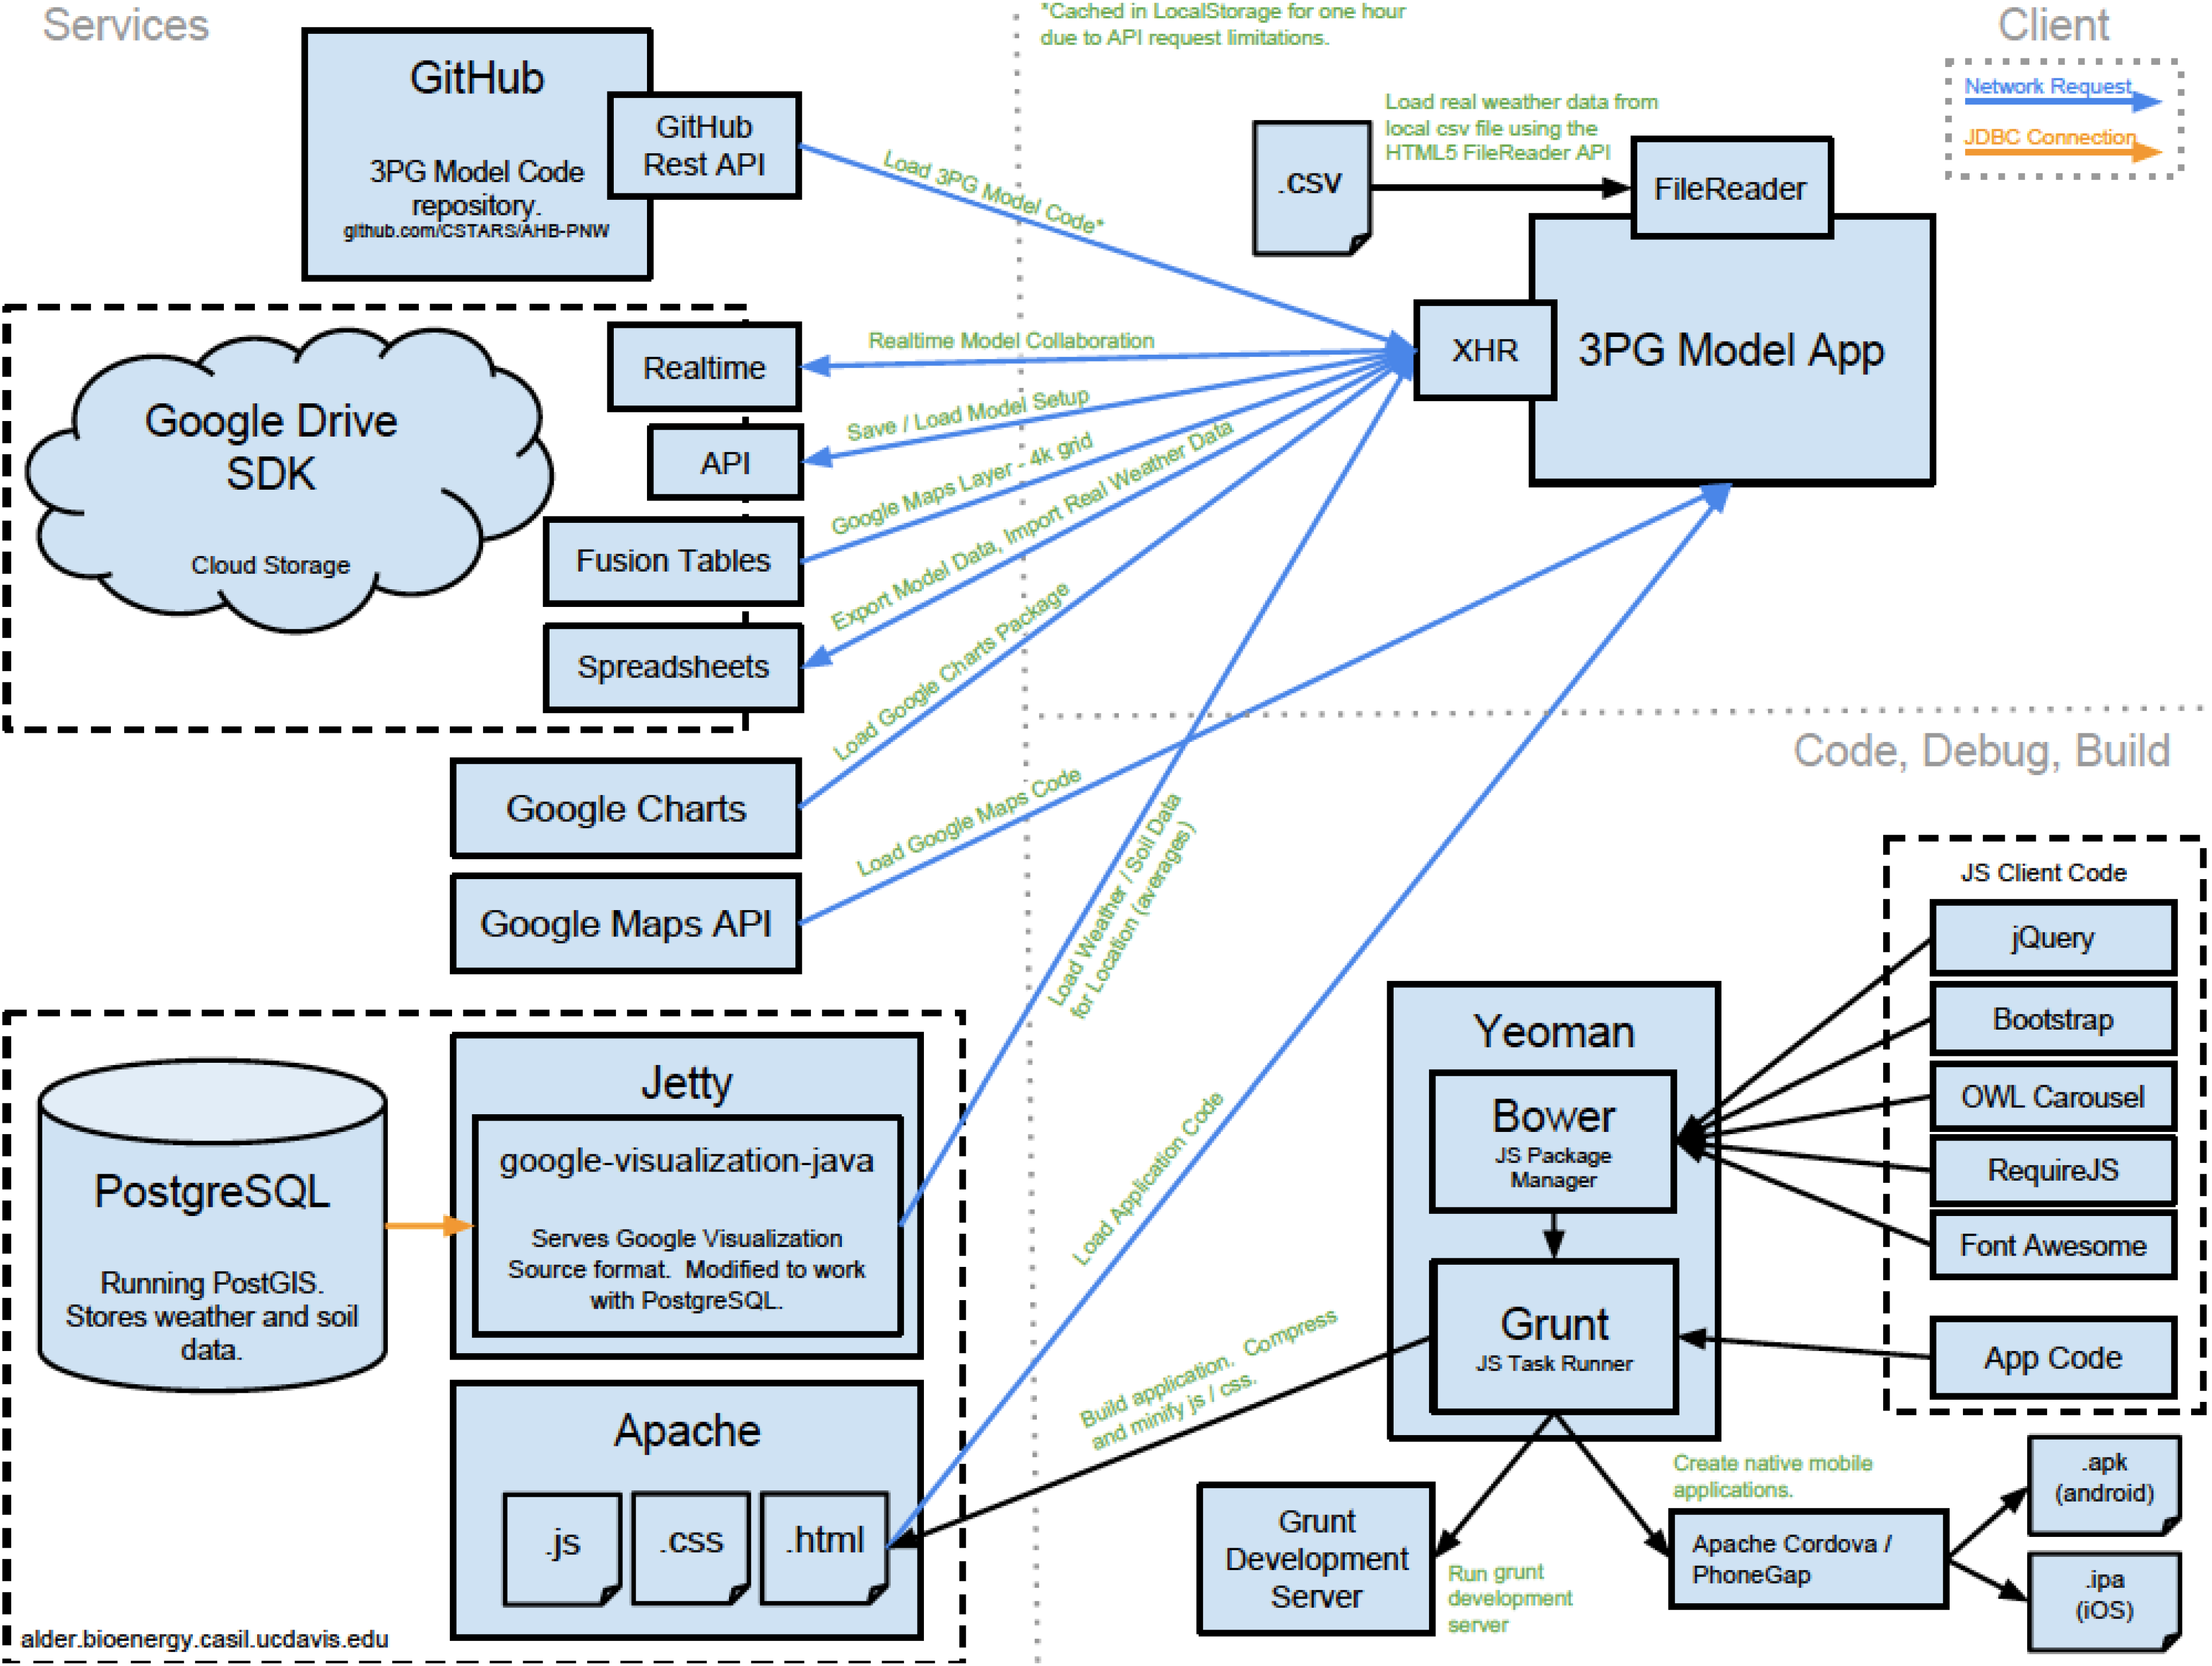
Various third-party technologies (mention of any specific trade name does not constitute an endorsement by the University of California) were used for implementing the application in order to shorten the development cycle and simplify maintenance (
Figure 5). RESTful (REST) web services [
18] are used for network communication between application components. These services use HTTP GET and POST requests to process queries and return data in the JavaScript Object Notation (JSON) format to the browser. REST services allow the application to load data asynchronously as needed, providing more flexibility when multiple users are simultaneously using the application. The backend model code is written in JavaScript (JS), because of its widespread adoption and standardization as the main programming language for all browsers, and is executed with Grunt JS Task Runner [
19]. The user interface (UI) is designed with Bootstrap, jQuery, OWL Carousel, RequireJS and Font Awesome [
20,
21,
22,
23,
24].
Bootstrap uses custom Cascading Style Sheet (CSS) rules to implement responsive layouts that conform to a screen size, while also providing a set of easy to use CSS components and jQuery plugins. The Bower package manager downloads any required packages and manages their dependencies, and Grunt builds the application, compressing the JS and CSS files [
19,
25]. The active build is committed to the repository.
For developing the UI in the local environment, Grunt Development Server can be started. The same build produced by Grunt is run through Apache Cordova/PhoneGap to produce native Android and iPhone applications of the same content as the web application generated [
26]. An Apache server [
27] runs on the University server side. It gets the latest application build from the repository and serves it to the client whenever users access the website of the application.
The server also hosts the PostgreSQL database that is running PostGIS and stores weather and soil data collected from PRISM and StatsGo databases [
16,
17,
28,
29]. The same PostgreSQL database is used for landscape-scale biomass production estimates, running the same 3PG-AHB JS code as the website in the PostgreSQL environment with the help of the plv8js plugin [
30]. A Jetty server, using a modified version of google-visualization-java, customized so that it can query the tables in the public schema of the PostgreSQL database, serves the weather/soil data in Google Visualization Source format when requested from the web application, which happens whenever the user selects a target location [
31,
32]. Google Maps API loads the map code for displaying the location selection map [
33]. Google Charts provide the package of charts to visualize the results that the users see on the site [
34]. Google Drive Standard Development Kit (SDK) provides several important services for the application [
35]. The most important is the cloud storage that every Google account has associated with it, allowing users to store their model parameters and results in the cloud.
Figure 5.
Technology level overview.
Figure 5.
Technology level overview.
Users login with Google credentials. This is made possible by Google OAuth service, where the OAuth protocol is a standard protocol commonly used across many cloud service applications that allows for third-party authentication of users [
36,
37]. Once authenticated, the application is granted access to the user’s 3PG-AHB Model app data stored on Google Drive. There, the application setup files are stored in JSON format, while custom tree, weather or output files are stored in Comma Separated Variable (CSV) format. This allows users to reload their files at a later time or use the Google Drive sharing functionality to allow others to modify and use their data.
In addition to cloud storage, Google Drive SDK provides Realtime API, which allows for multiple users to collaborate on the same model at the same time and to see each other’s changes. It also provides the API to store and load previously saved models, Fusion Tables to overlay the map of possible locations with the 8 by 8-km grid and Google Spreadsheets to export raw output data in CSV format if the user desires and upload the user’s custom weather data in CSV format, which is made possible by the FileReader API [
38,
39,
40,
41,
42]. Data storing and loading, as well as user collaboration are made possible via XMLHttpRequest JavaScript Objects [
43]. GitHub hosts all of the code files in the repository, while GitHub’s REST API allows the web application to load the freshest code and cache it for one hour, or when a version tag is provided to the request, an older version of the model can be loaded instead [
44]. This is one of the unique features of this application, giving the developers an opportunity to compare the performance of older and newer versions of the application whenever the code is modified and ensuring that the application is running the latest version of the model when accessed by users.
2.5. User Interface Analysis
The target audience for this application is somewhat domain specific, concentrating on users with knowledge in the field of biofuel feedstocks. However, the hope is that it can include growers and potential growers, besides researchers, and educate people about the potential in the field. In order to assess the user interface design of the application, we have developed a preliminary test of site usability and performance using a small sample set of 24 use cases. The volunteers were predominantly graduate students and postdoctoral fellows and not necessarily representative of the target audience. Volunteers were assigned a list of common tasks to perform within the application. The tasks were fairly open-ended in scope, and the responses about site functionality and accessibility were collected and analyzed.
Most (85%) reported high to very high satisfaction with the application design and responsiveness. Only one identified the application as unfriendly. Most volunteers had no major issues with the common tasks of the application.
Regarding data assimilation, most were able to identify the procedures to discover and assimilate climatic data and change parameters, and to manage the model runs. The variation of parameters was typically well understood.
Individual comments from the reviews were most notably about adding more information regarding the parameters of the model. This would help both the farmers and potential research collaborators alike to feel more comfortable making changes to input parameters and understanding the effects in the resulting predictions of biomass. Allowing the application to support more immediate feedback on parameters was noted as an important feature. Modifications to include automatic range checking, visualizations of the expected values and information on the part of the model that a change in a parameter might affect were all identified as potential improvements.
More complex uses of the model, for example uploading specific weather data as opposed to using the automatically-assigned averages, were identified as more difficult to perform without additional tutorials.
The use of the cloud environment requires ownership of a Google account for authentication, thereby limiting the application users. This is only a requirement when users wish to store and share their model runs, however, and was not seen as a major issue of concern within the study group.
3. Results and Discussion
The 3PG-AHB web application is currently accessible via a server of the University of California, Davis [
45]. The overall layout of the application consists of the Inputs, Raw Outputs and Charts sections, as noted above, along with the toolbar at the top (
Figure 2). The layout adjusts when accessed via devices with narrow and long screens, such as tablets and smart phones. In such cases, the Charts section is displayed below Inputs. The toolbar can be used as a shortcut to jump between sections. Selecting the Location button in the Inputs section is the first user action when accessing the application. A location selection window appears with the map of the Pacific Northwest region overlapped with the 8 by 8-km grid. The user can zoom into the region or use the Locate Me button to select her or his location. Other map regions can be developed to support decision-making elsewhere.
As mentioned previously, input parameters for the application are separated into classes, such as Tree, Plantation, Soil, Weather, Constants, Manage and Setup. Under each class, there are the input variables and their descriptions. After selecting a specific variable, the user can view and alter the default value. After each run of the model, the Raw Output and Charts are displayed. The default variables produced are the root (WR), stem (WS) and foliage (WF) biomass yields in dry metric tons per hectare. A unit conversion module can be implemented to shift the output to conventional units or those specifically understood by the user. The displaying of additional graphs occurs with the Add button, which opens a new window where the user can see all of the variables produced as the model runs, the full names, descriptions and units of those variables, as well as the implementation of each function used to compute them—the fn() link. This functionality enables observing variables for correct behavior and for error checking the code during the model validation stage.
If sensitivity analysis or application calibration is of interest, arrays of comma-separated values can be provided as input. The output charts have the resulting variables for each of the input values coded by color and displayed on the same chart for easy visualization and comparison of that variable’s contribution to the biomass growth prediction. Besides the Basic charts that show the whole simulation intervals, Interactive charts are available that provide for zooming the visualization to some shorter period of time (e.g., from years to months).
The user is also given the option to log in with his or her Google Account and save, share and load previously saved model results from within the website. The file can also be shared from within the Google Drive application after saving. Authentication and storage happen through Google services, allowing a local cloud space in which user data are stored. Google Realtime API, which allows for simultaneous file editing in Google Docs, has also been enabled for this application. Active users are displayed in the top right corner, and the cells being editing are identified with the user name. This allows for a more immediate collaboration. For model development, testing and validation, previous versions of the application are identified by appending the URL with the version number flag that accesses that version in the GitHub repository. This has proven to be a tremendous asset in validating the functionality of the model and ensuring the correct behavior between versions. Without this version flag, the application always loads the latest code from the repository, so that the user accesses the most up-to-date code version.
Other functionality includes storing of raw outputs in the form of a CSV (comma-separated) file, which allows for further data analysis to be performed outside of the application when desired by the user. Storing a specific hybrid of the tree species is also an important addition. If the parameters of a hybrid are known, the values can be easily loaded for hybrid-specific studies. Weather is another important input class that supports the upload of custom data, for example for using actual weather data instead of averages that are supplied by default. This functionality has allowed model validation for studies outside of the Pacific Northwest region.
The user survey performed on a non-target audience of volunteers has tested the potential of the 3PG-AHB application in terms of user interface design. Even though the task description was purposely vague, volunteers had no difficulty locating key components of the application, running test scenarios and storing and sharing results. The responsiveness and speed of the website were noticeable, which were all made possible by the design and technology decisions.
4. Conclusions
Developing and maintaining an online application requires a balance in the use of third-party components. The 3PG-AHB model leans heavily on libraries and tools developed by other groups. This speeds the development time significantly, but also makes the application potentially fragile with respect to changes in those technologies. The use of code building frameworks, as well as the choice to deploy multiple version instances of the application should moderate that concern. At the same time, maintenance of the geospatial data still requires a hosted service.
The technology bundles used for building the application can be readily reused for other geospatial and time series models. Components of the model, such as the model sharing methods, data management and visualization choices can be incorporated into other applications, as well.
In addition to the parameter input enhancements discussed above, the model can be expanded further into agricultural decision support, helping users select the best poplar hybrids for growth as appropriate parameterization of hybrid poplars and other hardwoods becomes available. With little modification, the application can become a library for these sets of input data.
The 3PG-AHB application includes specialized programming hooks connecting it to Google Analytics, so that it can be further monitored after being released to the public. These results enable dedicating the appropriate resources to support the influx of users, test the application on commonly used browsers and ensure that the infrastructure meets the needs of the users.
The 3PG-AHB application can serve multiple purposes outside the original scope without changes to the code. Growing poplar for purposes other than biofuel production, such as for the pulp and lumber industries, does not require short rotation coppicing. If users prefer to run the simulation for non-coppiced scenarios, the coppice date needs only to be set to the same as the end-of-simulation date under the “Manage” class of input parameters. While the model is anticipated to perform well under these conditions, validation and sensitivity analysis have only been completed so far for shorter-term coppiced SRWC. In order to support non-hardwood crop growth, modeling more extensive changes would be necessary, potentially including a complete replacement of the underlying physiological model in favor of other, more appropriate models designed for the selected feedstocks.
The 3PG-AHB application is intended as a facilitating tool for the investigation of biofuel feedstocks and designed for overall ease of use, automatic integration of spatial data, information-rich visualizations and simple access to sensitivity analysis along with input data calibration to support production decisions. The model analyses and predictions should allow for more effective long-term decisions regarding the sustainable design of the biofuel feedstock supply chain, as well as real-time decisions in the field. In addition to assisting landowners in making informed decisions, the application should help to educate the public about new possibilities, facilitate collaboration among researchers and enhance other renewable bioenergy modeling efforts.

