


Urban Human-Land Spatial Mismatch Analysis from a Source-Sink Perspective with ICT Support

1
School of Humanities and Law, Northeastern University, Shenyang 110169, China
2
Jangho Architecture College, Northeastern University, Shenyang 110169, China
*
Author to whom correspondence should be addressed.
ISPRS Int. J. Geo-Inf. 2022, 11(11), 575; https://doi.org/10.3390/ijgi11110575
Submission received: 21 September 2022
/
Revised: 9 November 2022
/
Accepted: 14 November 2022
/
Published: 17 November 2022
(This article belongs to the Topic Advances in Sustainable Communities, Neighborhoods and 15-Minute Cities-Theory, Methods and Techniques)
Abstract
:The development management of the city constantly pursues sustainable development of human-land matching. Under the new research framework, this study discusses the urban human-land relationship from the perspective of the source-sink of daily population mobility, making up for the lack of a static research perspective in the past. The spatial relationship between population source-sink and land use intensity was studied by bivariate Moran’s I and multivariate correspondence analysis. The results show that there is a significant spatial correlation between urban population source-sink and land use intensity, which is obviously affected by urban circles and land use types, and these laws are cyclical day after day. The urban fringe becomes the main place where spatial mismatch occurs. Currently, the spatial mismatch of cities in northeast China, represented by Shenyang, is dominated by the high intensity of land use and low flow of the population. The key to solving the problem is to curb the high-density urban sprawl. The research results improve the integrity and accuracy of urban human-land spatial mismatch analysis and provide support for formulating more specific urban land use policies.
1. Introduction
In a global context, urbanization is an ongoing issue of concern. Urbanization promotes economic and social development, but also adversely affects ecological and social systems [1]. A large influx of people and rapid expansion of land use force a city to face the pressure of providing transportation, housing, and resources, and the ecological environment is affected by problems such as pollution, soil erosion, and a sharp decline in biodiversity [2,3,4]. Dense populations, industrial agglomeration, and frequent interaction make the human-land relationship between cities complicated. Thus, cities are gradually becoming an essential vessel for human-land relationship research [5]. Efforts in this area have included developing higher-density compact cities [6,7], controlling urban sprawl, rationally developing urban growth boundaries and achieving smart urban growth [8,9], and developing urban resilience [10], to achieve smart sustainable cities [11]. These efforts result from planners and managers who have carefully examined the relationship between urban development and the environment and are committed to the efficient and rational use of urban land to create a better living environment to achieve the coordinated development of urban human-land matching. After experiencing rapid urban expansion, China’s urban land use has gradually changed from incremental to stock [12]. The high-density urban sprawl has become a concern in Chinese cities [13,14]. When these high-intensity areas lack connection to urban society and the economy, a serious waste of resources will result [15]. Empty cities and ghost towns are extreme cases of human-land spatial mismatch [16]. We urgently need to focus on urban human-land spatial mismatch and promote the realization of a balanced, coordinated, and sustainable urban development vision.
Spatial mismatch has been widely discussed and applied by various disciplines since it was proposed [17,18]. Many achievements have been made in applying spatial mismatch to the analysis of aspects of urban internal structure and social equity, such as the relationship between housing and employment, residential isolation, and equality and accessibility of public services [19,20,21,22,23], as well as aspects of environmental sustainability, such as land use, spatial growth, and resource protection [24]. Urban human-land spatial mismatch focuses on the mismatch between urban populations and their social production spaces, and “land” extends more to the human built environment in the human-land relation [25]. There are two research paradigms, macroscopic and microscopic, in existing research on urban human-land spatial mismatch. Macroscopic research focuses on measuring land use efficiency from the perspective of a whole city [26,27] or optimizing the allocation of urban land [28,29]. Stochastic frontier analysis (SFA) and data envelopment analysis (DEA) are the most representative land use efficiency evaluation methods [30,31]. There are linear programming, multi-objective programming, and system dynamics methods for urban land optimization, and methods for spatial layout optimization, such as the CLUE model, cellular automata (CA), multi-agent systems (MAS), bionic intelligent algorithms, and so on [32,33,34,35,36,37]. These studies have the characteristics of a long time-span and large spatial scale. Through model construction and algorithm optimization, it evaluates and simulates urban land use combined with population distribution. However, it pays too much attention to the influence of natural and socioeconomic factors on land use and pays too little attention to human subjects in the study of human-land mismatch. Micro studies mostly start from the perspective of urban residents and focus on the spatial mismatch between humans and land caused by specific urban problems based on accessibility studies, such as the spatial mismatch between residence and employment, schooling, and leisure [17,38,39]. Gravimetry-based and opportunity-based measurement methods are the two most commonly used methods in accessibility studies. These studies focus on whether various functional configurations of cities meet the needs of the population but pay insufficient attention to land use. In both macro and micro human-land mismatch research, there is little research focused on the problem of "human" and "land" itself. The advantage of detecting the urban human-land mismatch by bivariate LISA is to return the research perspective to the human-land relationship itself.
Most data sources for urban human-land spatial mismatch research were based on questionnaire surveys or government census data and were characterized by low accuracy, low coverage, low collection efficiency, and limited spatiotemporal accuracy. This approach is limited in understanding the daily laws of a city and has little guiding significance for the interior of the city. With the development of information and communications technology (ICT), the use of remote sensing, point-of-interest (POI) data, and other data to identify urban land use [40,41,42] and discover urban functions through traffic data [43,44] has promoted the study of urban populations and land use [45,46]. The recent wide application of big data has promoted the development of urban population research in a dynamic and refined direction. Scholars have constructed a dynamic population analysis framework, quantified the distribution of urban vitality, and examined the relationship between urban population and time changes [47,48]. We found that although ICT has promoted urban research from a dynamic perspective and enriched urban land use research, with the trend of urban population research gradually turning to dynamic changes, the urban human-land relationship is still more concerned with static spatial balance. Little research has been completed on urban dynamic human-land spatial mismatch, although some scholars have attempted to address this problem. However, whether it is to distinguish the urban spatial mismatch between daytime and nighttime through POI data and nighttime lights [49,50,51] or to focus on the relationship between urban population density and land use over time [24,52], it is still impossible to objectively reflect the state of urban population flow due to data limitations. There are urban areas with low population densities but dense population flow. These places with strong population mobility and large source-sink magnitudes are also places with a high demand for urban facilities. Therefore, using mobile phone signaling data to study the relationship between urban source-sink and the intensity of land use can compensate for some deficiencies compared to the analysis of the human-land relationship from the perspective of static population distribution. The characteristics of a high sampling rate and high update rate of mobile phone signaling data have natural advantages for understanding the urban spatial structure and the distribution of daily population activities [53]. Using mobile phone signaling data and merging multi-source data can help us to better understand the problem of urban dynamic human-land spatial mismatch [54,55].
In this study, urban human-land spatial mismatch from a source-sink perspective was analyzed, avoiding the contradiction that urban land is a static object, whereas population is dynamic. The source-sink theory has been widely used in landscape ecology since it was first proposed [56,57,58,59]. It has also been applied to urban transportation sources and sinks [60], as well as large-scale population migration studies [61], such as the annual spatial mismatch of the population in China’s “Spring Festival”. Most importantly, the source-sink theory can organically integrate the pattern and the process. In this study, population source-sink is used to represent the dynamic changes in the urban population. The population inflow area is the sink area, and the population outflow area is the source area. The sink population is the population inflow of the study unit, and the source population is the population outflow of the study unit. Population sources and sinks show the increase and decrease in population in cities, reflecting the agglomeration or dissipation of the population in specific areas over time. For this study, we chose land use intensity to represent “land” in the urban human-land relationship. Land use intensity is the quantity or degree of land development in a region [44] or the sum of investment in land [62,63,64]. Urban land use intensity is the degree of urban land development, a widely used measure in urban planning, design, and management [65]. Previous research on urban land use intensity is divided into two aspects: first, measurement of urban land use intensity, which is calculated by remote sensing spatiotemporal spectral changes [44], POI [63], and building data [50,66], and second, factors that influence urban land use intensity and its relationship to various other urban elements [67], such as urban vitality [50], cultivated land protection [68], and ecological networks [40]. The national, regional, and urban scales of the study of urban land use intensity are common [69]. A focus on dynamic urban changes and smaller internal scales, when studying the spatial relationship between urban population and land use intensity, extends existing urban land use intensity research.
In this study, three questions were addressed: (1) What is the spatiotemporal distribution pattern of urban population source-sink? (2) What is the relationship between urban population source-sink and urban land use intensity, and is there a spatial mismatch between them? (3) How does the relationship between source-sink and land use intensity change for different urban ring roads and different land use types, and is this change affected by factors such as different periods, different dates, and different weather conditions? With a new analytical framework, the dynamic urban population is closely related to static land use. The dynamic population source and sink were obtained through mobile signaling data, and the urban land use intensity was characterized by the floor area ratio (FAR) and the building coverage rate (BCR). The correlation between population source and sink and land use intensity was discussed to reveal the urban human-land spatial mismatch. Meanwhile, the effects of different circles and different land use types on spatial mismatch are discussed. Through the construction of this analysis framework, supported by ICT, the urban human-land relationship can be recognized dynamically, realistically, and with high accuracy, which provides favorable support for urban development and efficient use of land.
2. Materials and Methods
2.1. Study Area and Data Source
Shenyang, the main city in northeast China and the capital of Liaoning province, was chosen as the subject area for this study. In recent years, the built-up land in Shenyang has expanded rapidly and the phenomenon of urban sprawl has become prevalent. Consequently, the conflict between cultivated land and built-up land has intensified, and the problem of land use mismatch has become increasingly prominent [70,71,72]. Shenyang is a typical microcosm of rapid urbanization in China. In this era of urbanization, developing ways to harness the internal potential of urban land and improve the existing urban human-land model has become an important direction in the field of land management. Previous research on urban land use has been limited by its reliance primarily on long time series and large-scale plots, and application of these tools and methods cannot fulfill the dynamic and refined management needs of cities. With the rapid development of ICT, dynamic and microscopic research on the urban population and land use has become possible.
This study was conducted by using ICT data. The main data used were mobile phone signaling data, building data, urban road data, and land use data (Table 1). Mobile phone signaling data provide information on user spatial positions through interactions between users and base stations and can record the time and space trajectory of the population flow. All signaling data used in this study were obtained with the cooperation of one of the largest local mobile phone operators, and 500 × 500 m was the basic space unit for signaling data. The mobile phone signaling data generated in Shenyang during the four days of 15 May, 19 May, 14 August, and 18 August 2018 were used, as summarized in Table 2. Building data often exhibit a certain lag, so 2019 AutoNavi map data were used, including data on the basic outlines of buildings, the number of building floors, floor areas, and spatial coordinates. Land use datasets were completed using ELUC-China in 2018, combined with FROM-GLC10 and ground verification. ELUC-China is compiled by combining remote sensing, mobile phone positioning, POI, and other multi-source data, and the accuracy of verified results is higher than that of pure POI data [73].
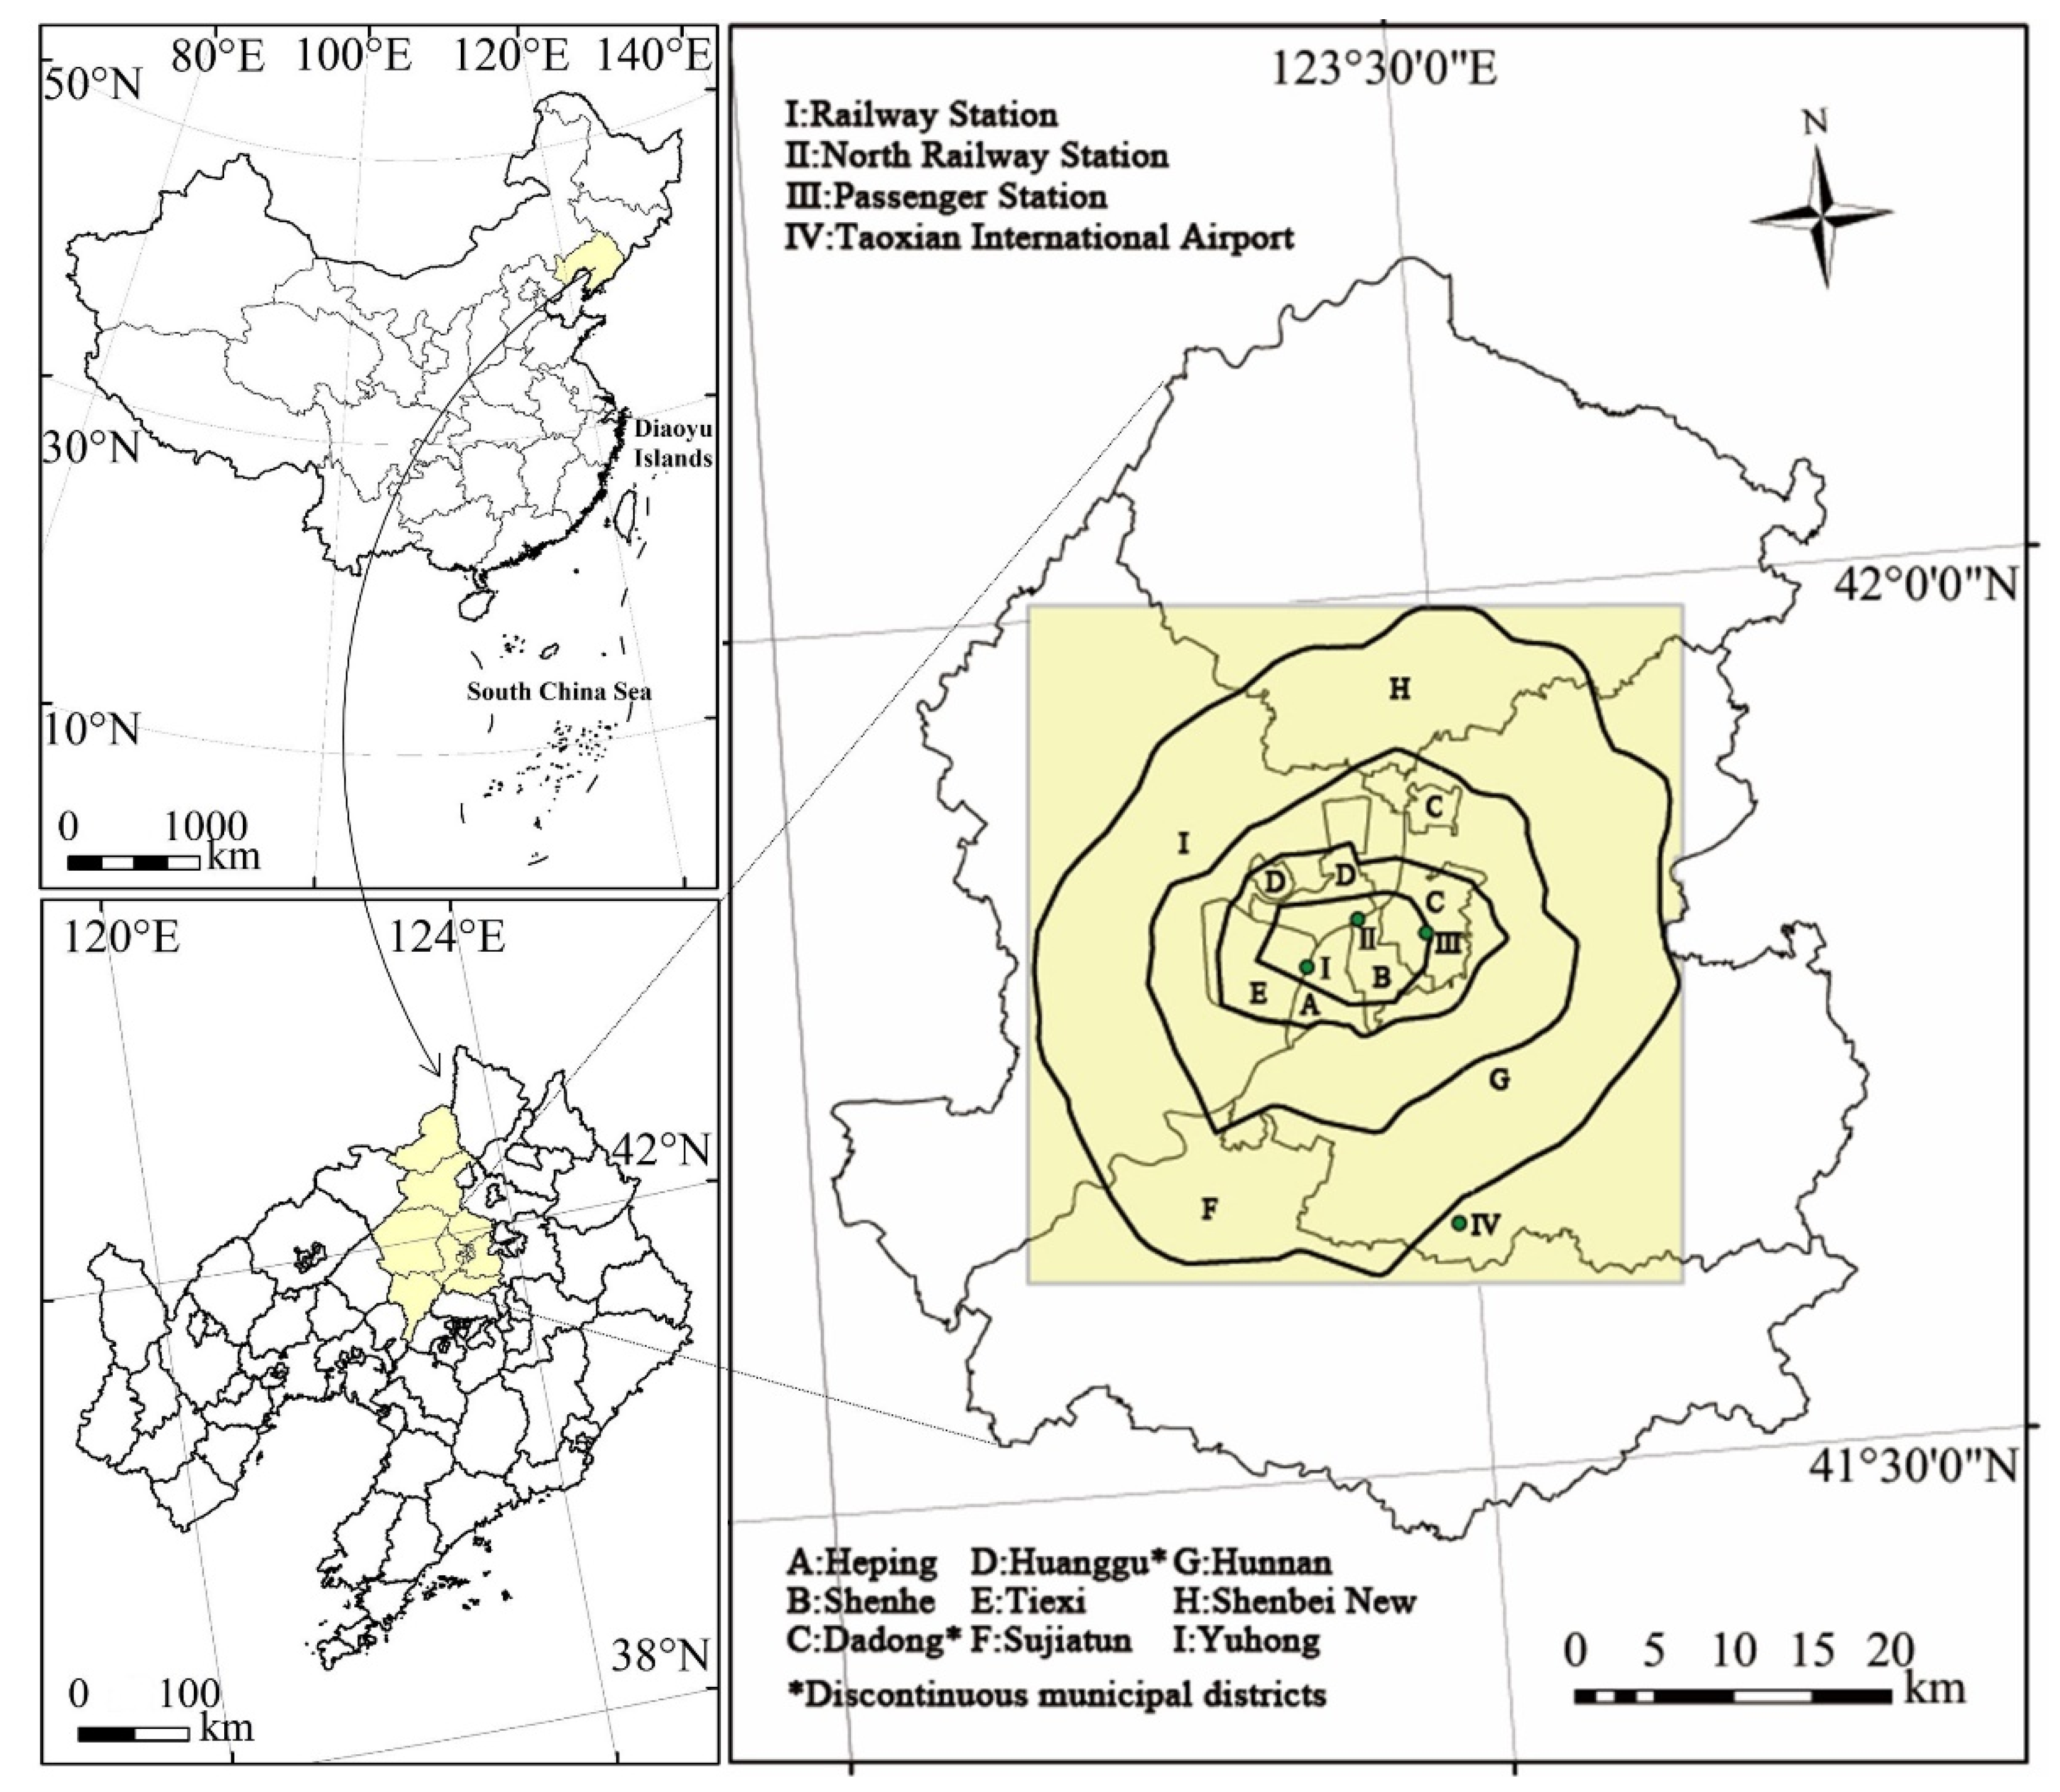
From the data for the Shenyang City area, the population source-sink was determined to be concentrated in the city center, and the land use data and building data for this area were relatively complete. The study area was selected to cover the main urban area of Shenyang, with a rectangular area of 41.5 × 43 km, including the entire area of the Fourth Ring Road in Shenyang and the airport (an important source-sink area), comprising 7126 basic units of 500 × 500 m (Figure 1).
2.2. Research Method
2.2.1. Source-Sink of Urban Population
The “source-sink” theory was originally developed to study population changes in different habitats. The birth rate is greater than the death rate for the source patch, and the opposite is true for the sink patch. In this study, the study area grid was divided into three categories: source, sink, and balance. For the source, , for the sink, , and the balance between the two is indicated by . Grids without population flow were excluded from the analysis, which focused on source grids and sink grids. The population source-sink formula (Formula (1)) is given below [60]:
In Formula (1), is the source-sink flow of the ith grid during the study period, and and represent the inflow and outflow population of the grid, respectively.
2.2.2. Urban Land Use Intensity
This study measures urban land use intensity based on two indicators—the FAR and the BCR [50]. FAR is an important measure of the use intensity of built-up land and is defined as the ratio of the total building area in the grid to the land area of the grid. The BCR is the ratio of the base area of buildings in a grid to the land area of the grid and reflects the vacant land ratio and building density in the grid. Both are important indicators of urban density and morphology. Building data include information such as spatial coordinates, basic outlines, and floors.
The FAR Formula (2) is given below:
The BCR Formula (3) is given below:
In these formulas, represents the base area of the building in the grid, represents the land area of the grid, and represents the floor of the building.
2.2.3. Bivariate Global Moran’s I and Bivariate LISA
In this study, bivariate Moran’s I and bivariate LISA were calculated using GeoDa. Bivariate Moran’s I, which was used to measure the spatial agglomeration trend of the population source-sink and land use intensity [74,75], was calculated according to Formula (4):
is the variance of all samples, and is the spatial weight. The values of fall within the range [–1, 1]. denotes a positive spatial correlation and denotes negative spatial correlation.
Bivariate LISA was used to measure the local interaction between urban population source-sink and land use intensity [49] and thus detect the spatial mismatch between them. The bivariate LISA is calculated using Formulas (5) and (6):
where are the values of variables and , respectively, in unit are their respective average values, and are their respective standard deviations. Based on LISA statistics, source and sink results are each divided into five categories. For the sink population (positive values), the categories are high population flow and high land use intensity (SI-HH), high flow and low intensity (SI-HL), low flow and high intensity (SI-LH), low flow and low intensity (SI-LL), and not significant (NS). Similarly, for the source population (negative values), the categories are low flow and high intensity (SO-HH), low flow and low intensity (SO-HL), high flow and high intensity (SO-LH), high flow and low intensity (SO-LL), and NS.
2.2.4. Correspondence Analysis and Multiple Correspondence Analysis
SPSS version 23 was used for conducting correspondence analysis and multiple correspondence analysis to explore the relationship and degree of correlation between LISA results and various variables (the variables considered in the analysis and their assignments are shown in Table 3). Correspondence analysis can express the contingency table as points and reflect the relationship between two categorical variables in relative positions in the dimensionally reduced space. The closer the scatter distance in the analysis graph is, the more obvious the association tendency is. Multiple correspondence analysis is suitable for use when there are many categorical variables [76]. Since the correspondence between the categories of the contingency table is difficult to read, graphical contingency tables can make the results more intuitive.
3. Results and Analysis
3.1. Temporal and Spatial Patterns of Population Source-Sink
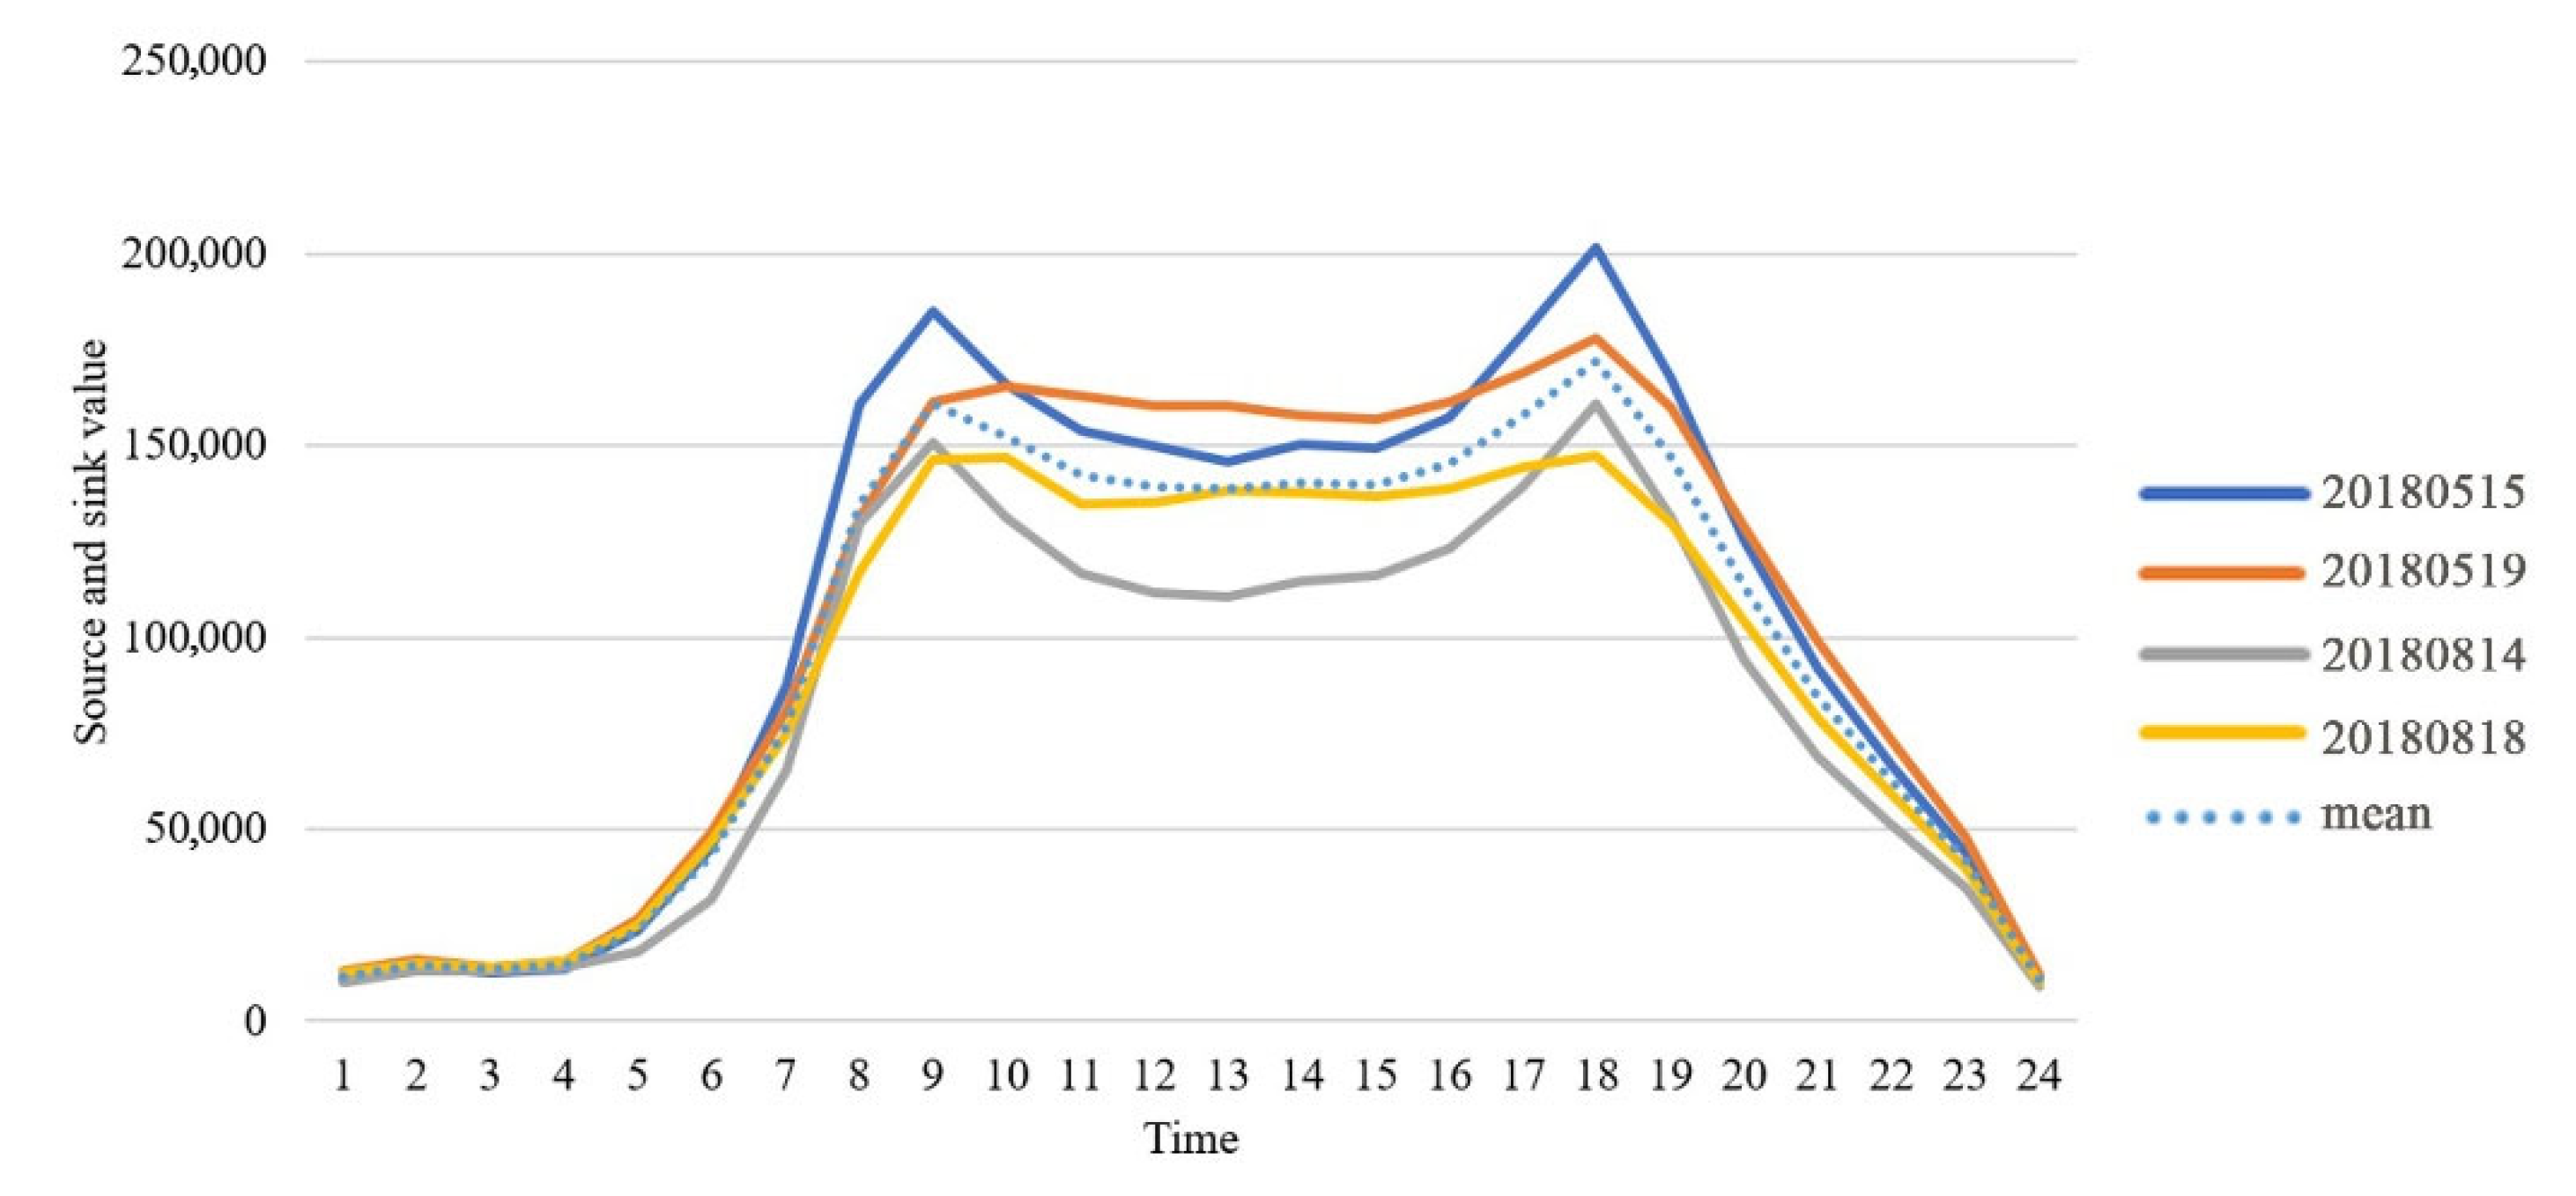
The 24 h population source-sink changes in the city (Figure 2) exhibit obvious regularity, and there are two obvious peaks and relative valleys every day. The peaks and valleys correspond to midnight (23:00–02:00), the morning peak (07:00–10:00), noon (11:00–14:00), and the late peak (16:00–19:00), for four periods, representing typical life scenarios of urban residents’ rest, work, lunch, and getting off work. The four days selected in the study were an ordinary weekday, an ordinary weekend day, a rainy weekday, and a rainy weekend day (Table 2). The trend for weekends was relatively flat compared to that of weekdays, and the source-sink volume for rainy days was notably lower than that for non-rainy days. Pearson’s correlation coefficients for the four-day population source-sink values and their mean values in the study area were greater than 0.9, indicating that the urban population shows regular daily fluctuations.
The graphs for the different periods of the day in the city (Figure 3) indicate that the magnitudes of the midnight source-sink values are obviously lower than those of the other three periods. At midnight, the population in most areas of the city is in a static state, and the only notable population flows are from the city center to the periphery. The Taoxian Airport and Shenyang Railway Station, both important transportation hubs, were population source areas at midnight. During the morning peak, numerous people gathered in the urban center, and most grids were in a state of population outflow. Airports, railway stations, and passenger terminals became important sink areas at this time, and industrial parks and municipal governments on the outskirts of the city also exhibited small-scale population sinks. At noon, there is a population agglomeration in the business district, and the central office area is the main source area. The late peak and the morning peak are almost symmetrical, and the urban population flows from the city center to the periphery, reflecting the tidal nature of the urban population source-sink. From the perspective of different dates, compared to weekdays, the flow of the population at midnight on weekends is larger, but the peaks in the morning and evening are relatively flat, and the concentration of the population in the business district is higher at noon. Compared with non-rainy days, rainy days are relatively unsuitable for travel, and urban residents travel less, but the overall distribution of population source-sink still follows non-rainy days. The proportion of regular urban trips is high and decisively affects changes in the urban source-sink.
The population source-sink activity within the Third Ring Road in Shenyang is higher than that outside the Third Ring Road, which also reflects the source-sink difference between urban centers and suburbs. During the morning peak, the central urban area is the sink area and the rest of the time it is primarily the source area. During a day in the city, the population gathers in the central urban area in the morning and then gradually disperses outward. The population continues to fluctuate in the city, like tides. Urban centers and suburbs exhibit opposite regularities, with the tidal nature of the regularity always present, whether it is a weekday or a weekend or whether it is raining.
3.2. Spatial Correlation Analysis of Urban Population Source-Sink and Land Use Intensity
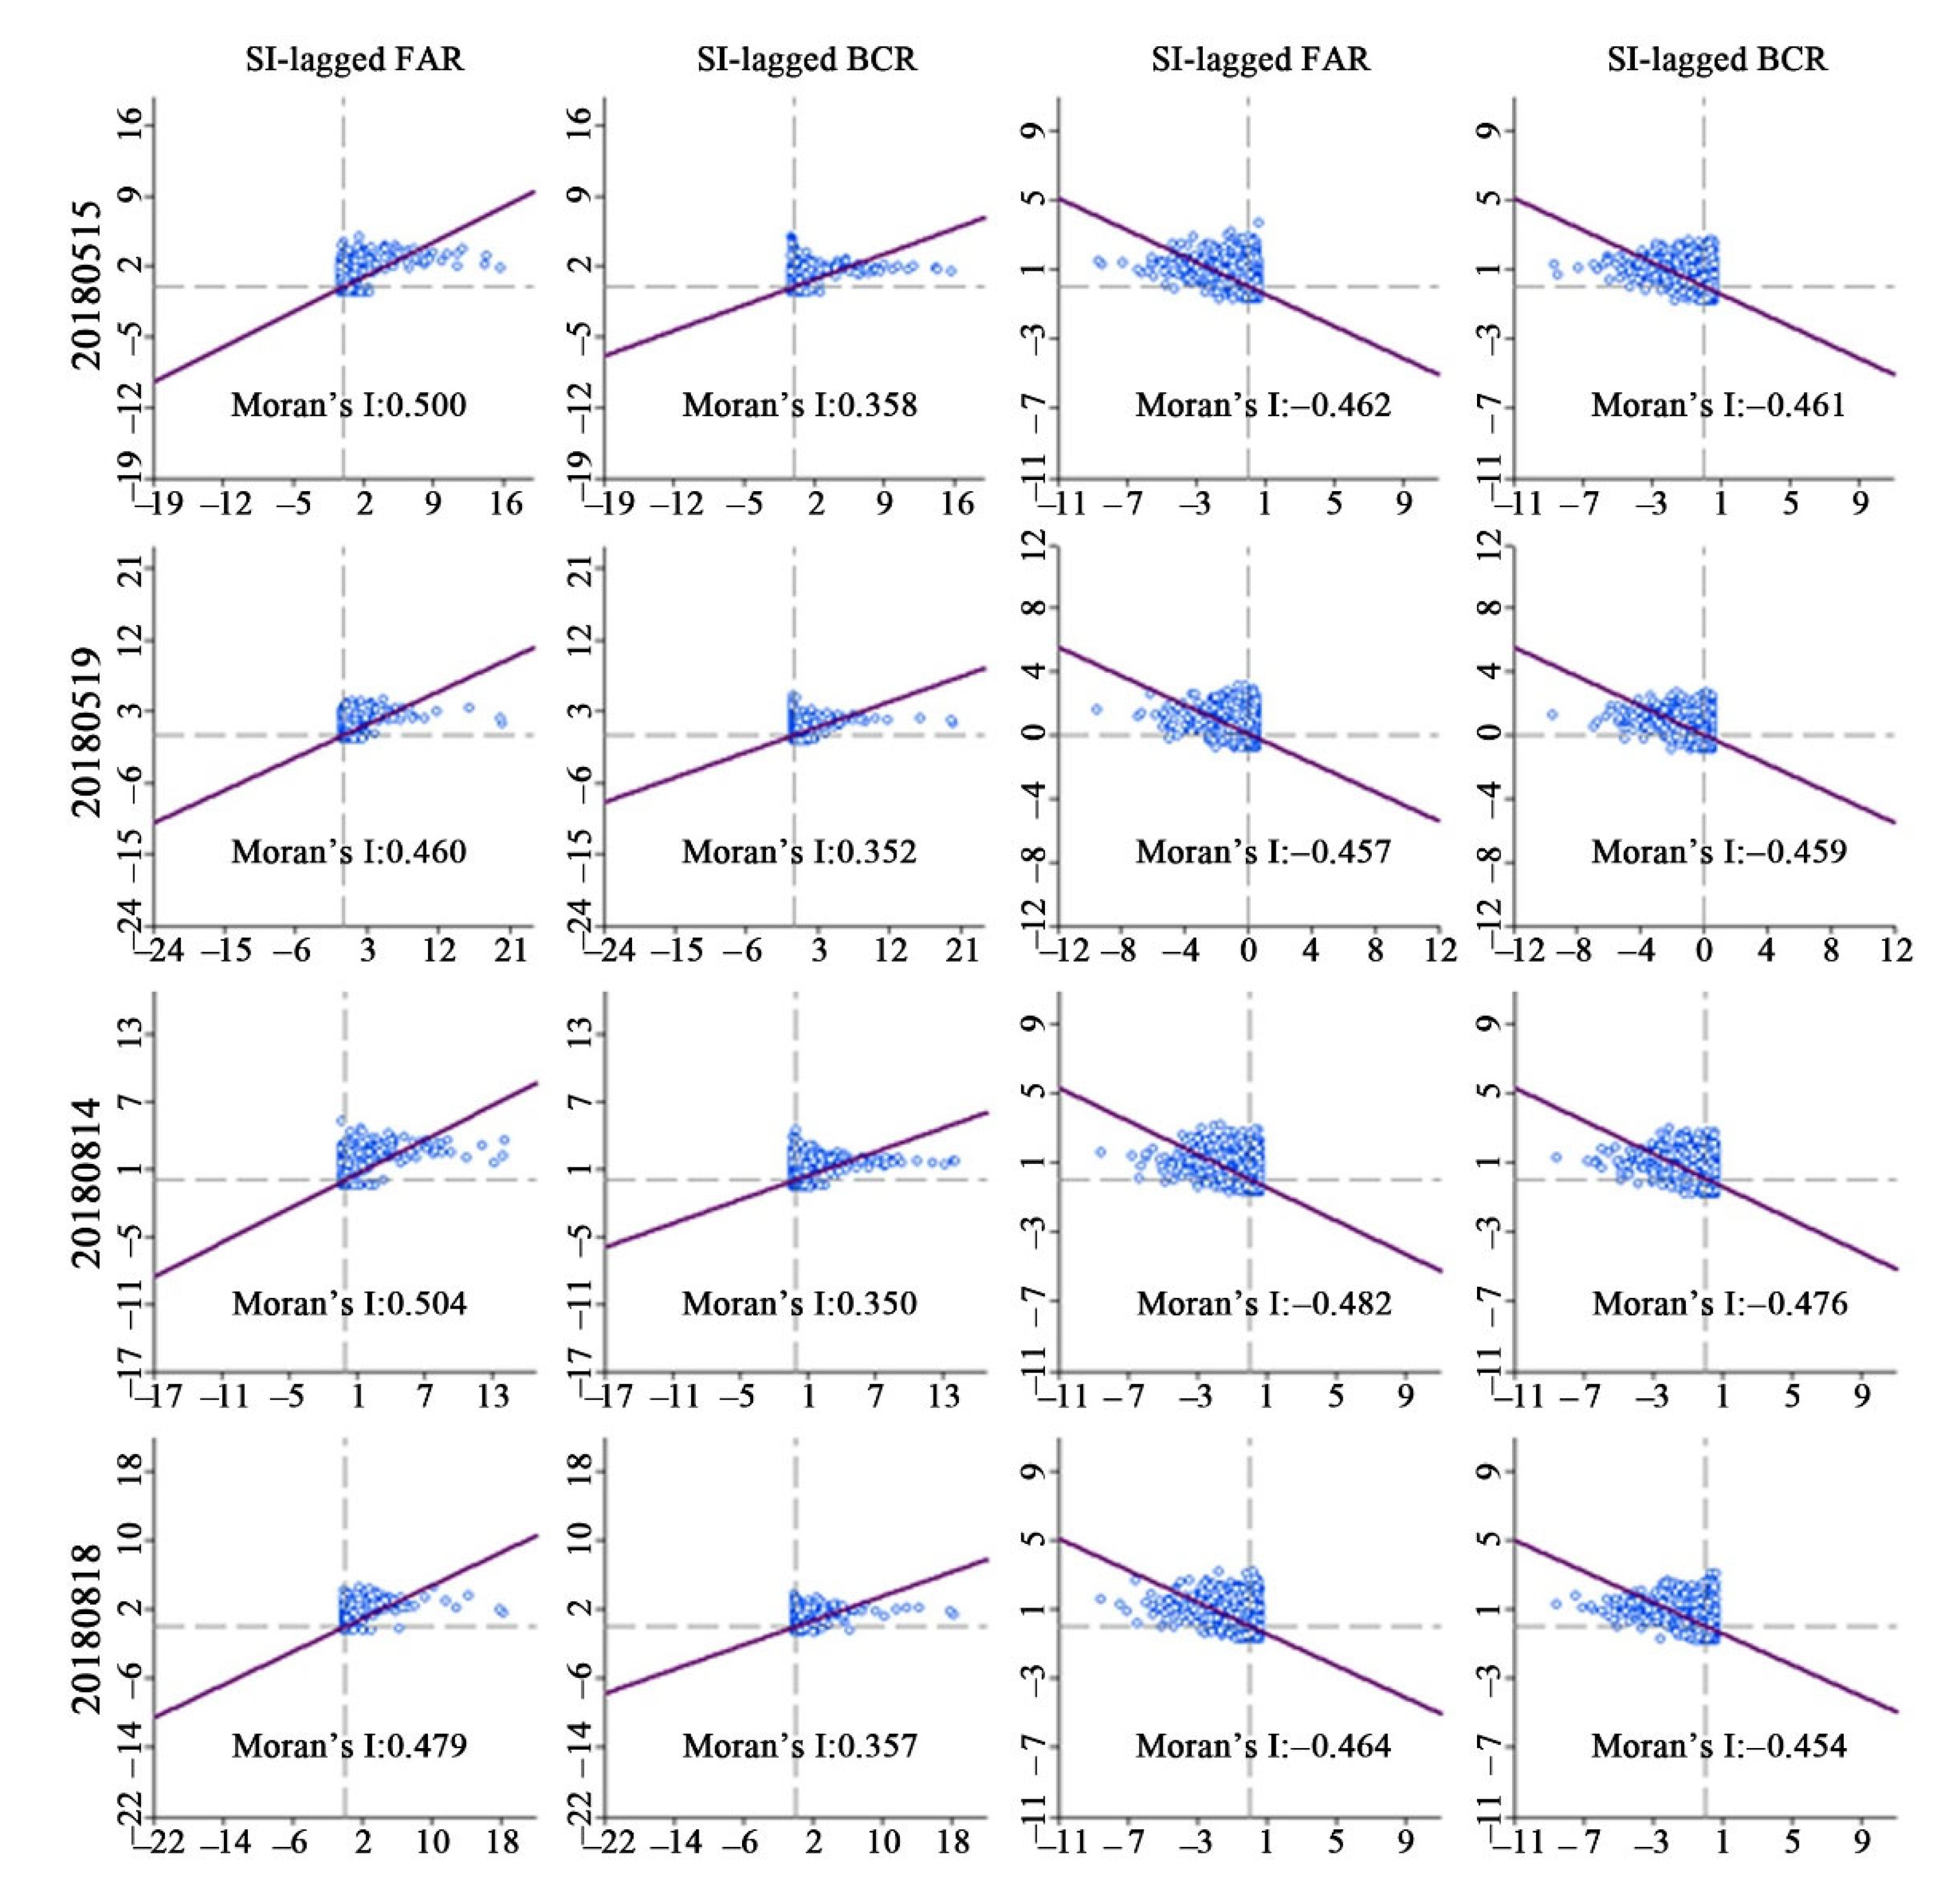
The results for global Moran’s I are shown in Figure 4 and Table 4. All results satisfy 999 permutations with p = 0.001. There is a significant spatial correlation between population source-sink and land use intensity, and the two have similar local patterns. Specifically, there is a significant positive spatial autocorrelation between population sources and land use intensity and a significant negative spatial autocorrelation between population sinks and land use intensity. The FAR and BCR results show similar trends. The results also show that large population inflows and outflows are often accompanied by high-intensity land use. Urban population source-sinks are significantly correlated with land use intensity, and this correlation is dynamic. Specifically, for this correlation, the morning and late peaks are higher than other periods, weekdays are higher than weekend days, and non-rainy days are higher than rainy days. In addition, the correlation between the population source-sink and FAR is higher than that between the population source-sink and BCR.
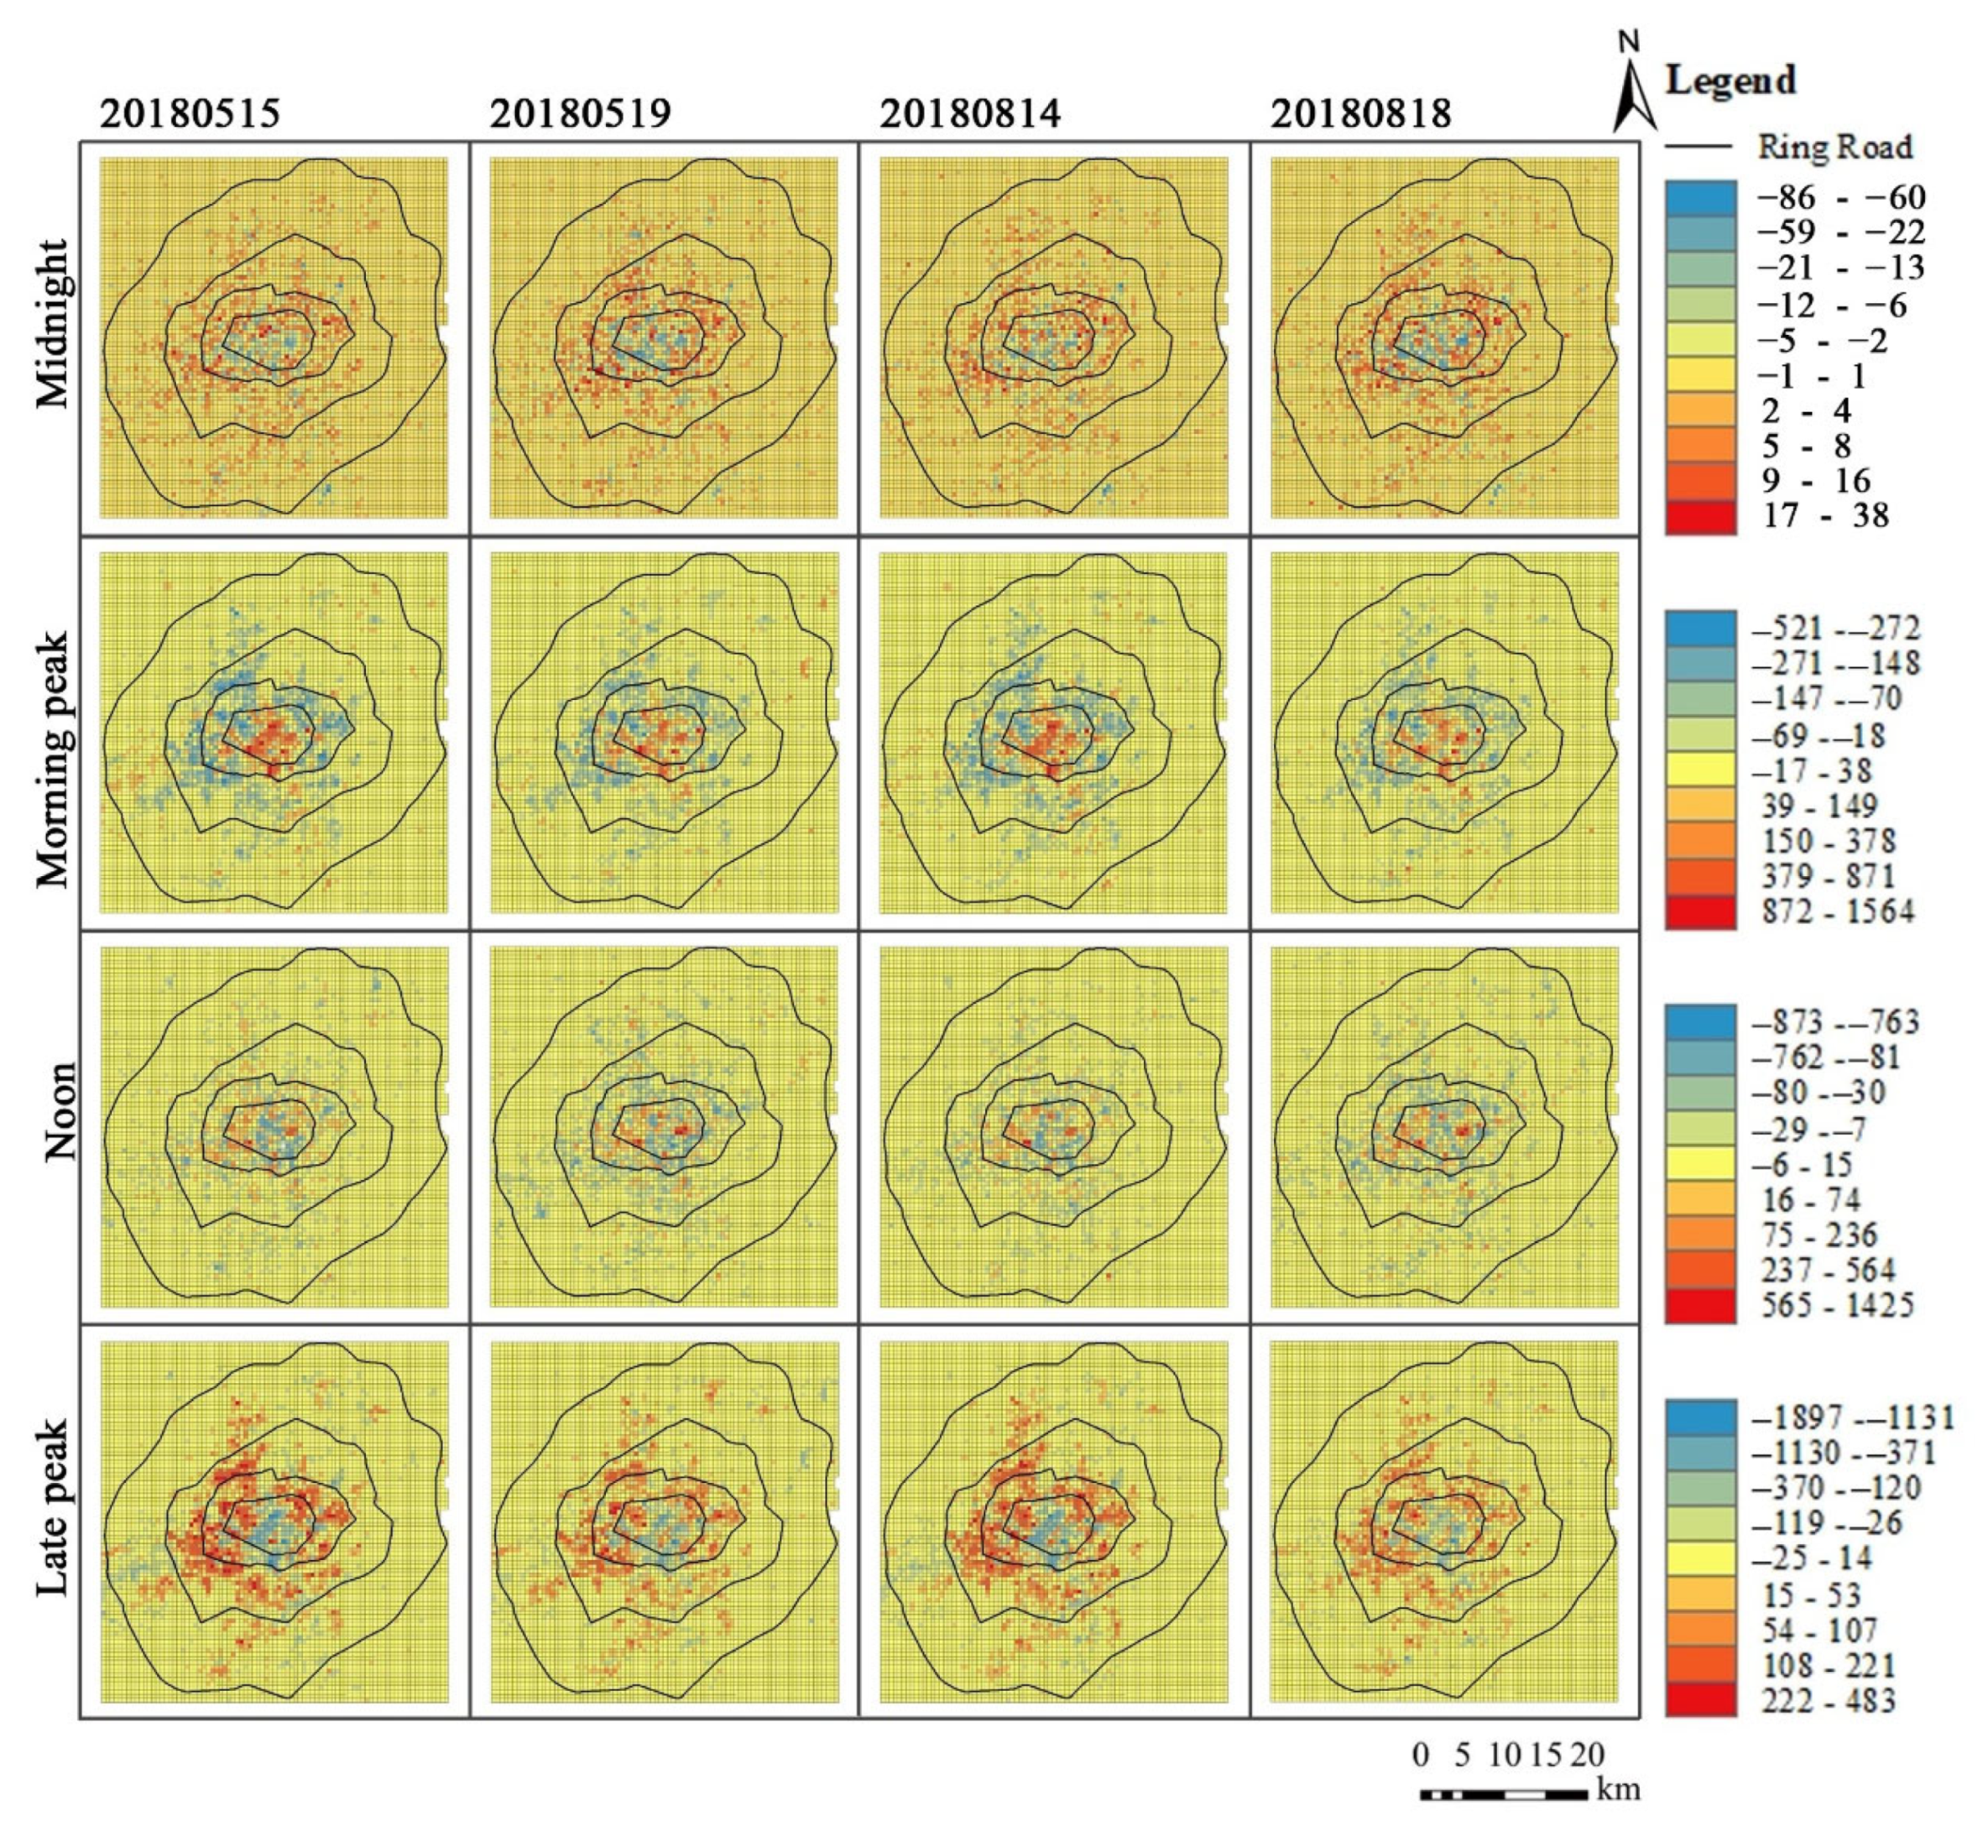
Using LISA to evaluate the local spatial relationship between population source-sink and land use intensity helps us discover the urban human-land spatial mismatch and accurately improve the efficiency of urban land use. According to the LISA statistics, all grids are classified as HH, HL, LL, LH, or NS, according to the source and sink classes, respectively. The bivariate LISA mapping between urban population source-sink and land use intensity (FAR, BCR) is shown in Figure 5, and all results obtained are significant (p ≤ 0.05). In the sink areas, HH is concentrated in the city center, LH is scattered around HH, LL is mainly distributed outside the Fourth Ring Road, and HL is minuscule. The source area LH is mainly concentrated in the city center, and HL is mainly distributed in the periphery of the study area. Thus, the areas with high flow and high intensity are concentrated in the city center, whereas the areas with low flow and low intensity are mainly distributed in the periphery of the city. We found a local spatial mismatch between urban population flow and land use intensity in all LISA results. The local mismatch is dominated by low-flow and high-intensity cases, and other mismatches are rare, with high-flow and low-intensity cases. This shows that the human-land spatial mismatch is widespread in cities and there may be problems of overdevelopment or lag in the development of urban land, with overdevelopment being predominant.
3.3. Spatial Mismatch in Urban Circle Structure and Land Use Function
3.3.1. Differential Influence of Spatial Mismatch in Different Urban Ring Road Areas
During urban development, gradual outward expansion is normal, and Shenyang City exhibits typical circular outward expansion. The city has gradually expanded from the first and second rings to the current fourth ring, and each ring is in a different state of urban development. For example, the first ring was formed early, and various functional facilities within it are complete, whereas the fourth ring has only been under development for a short time and is dominated by local development.
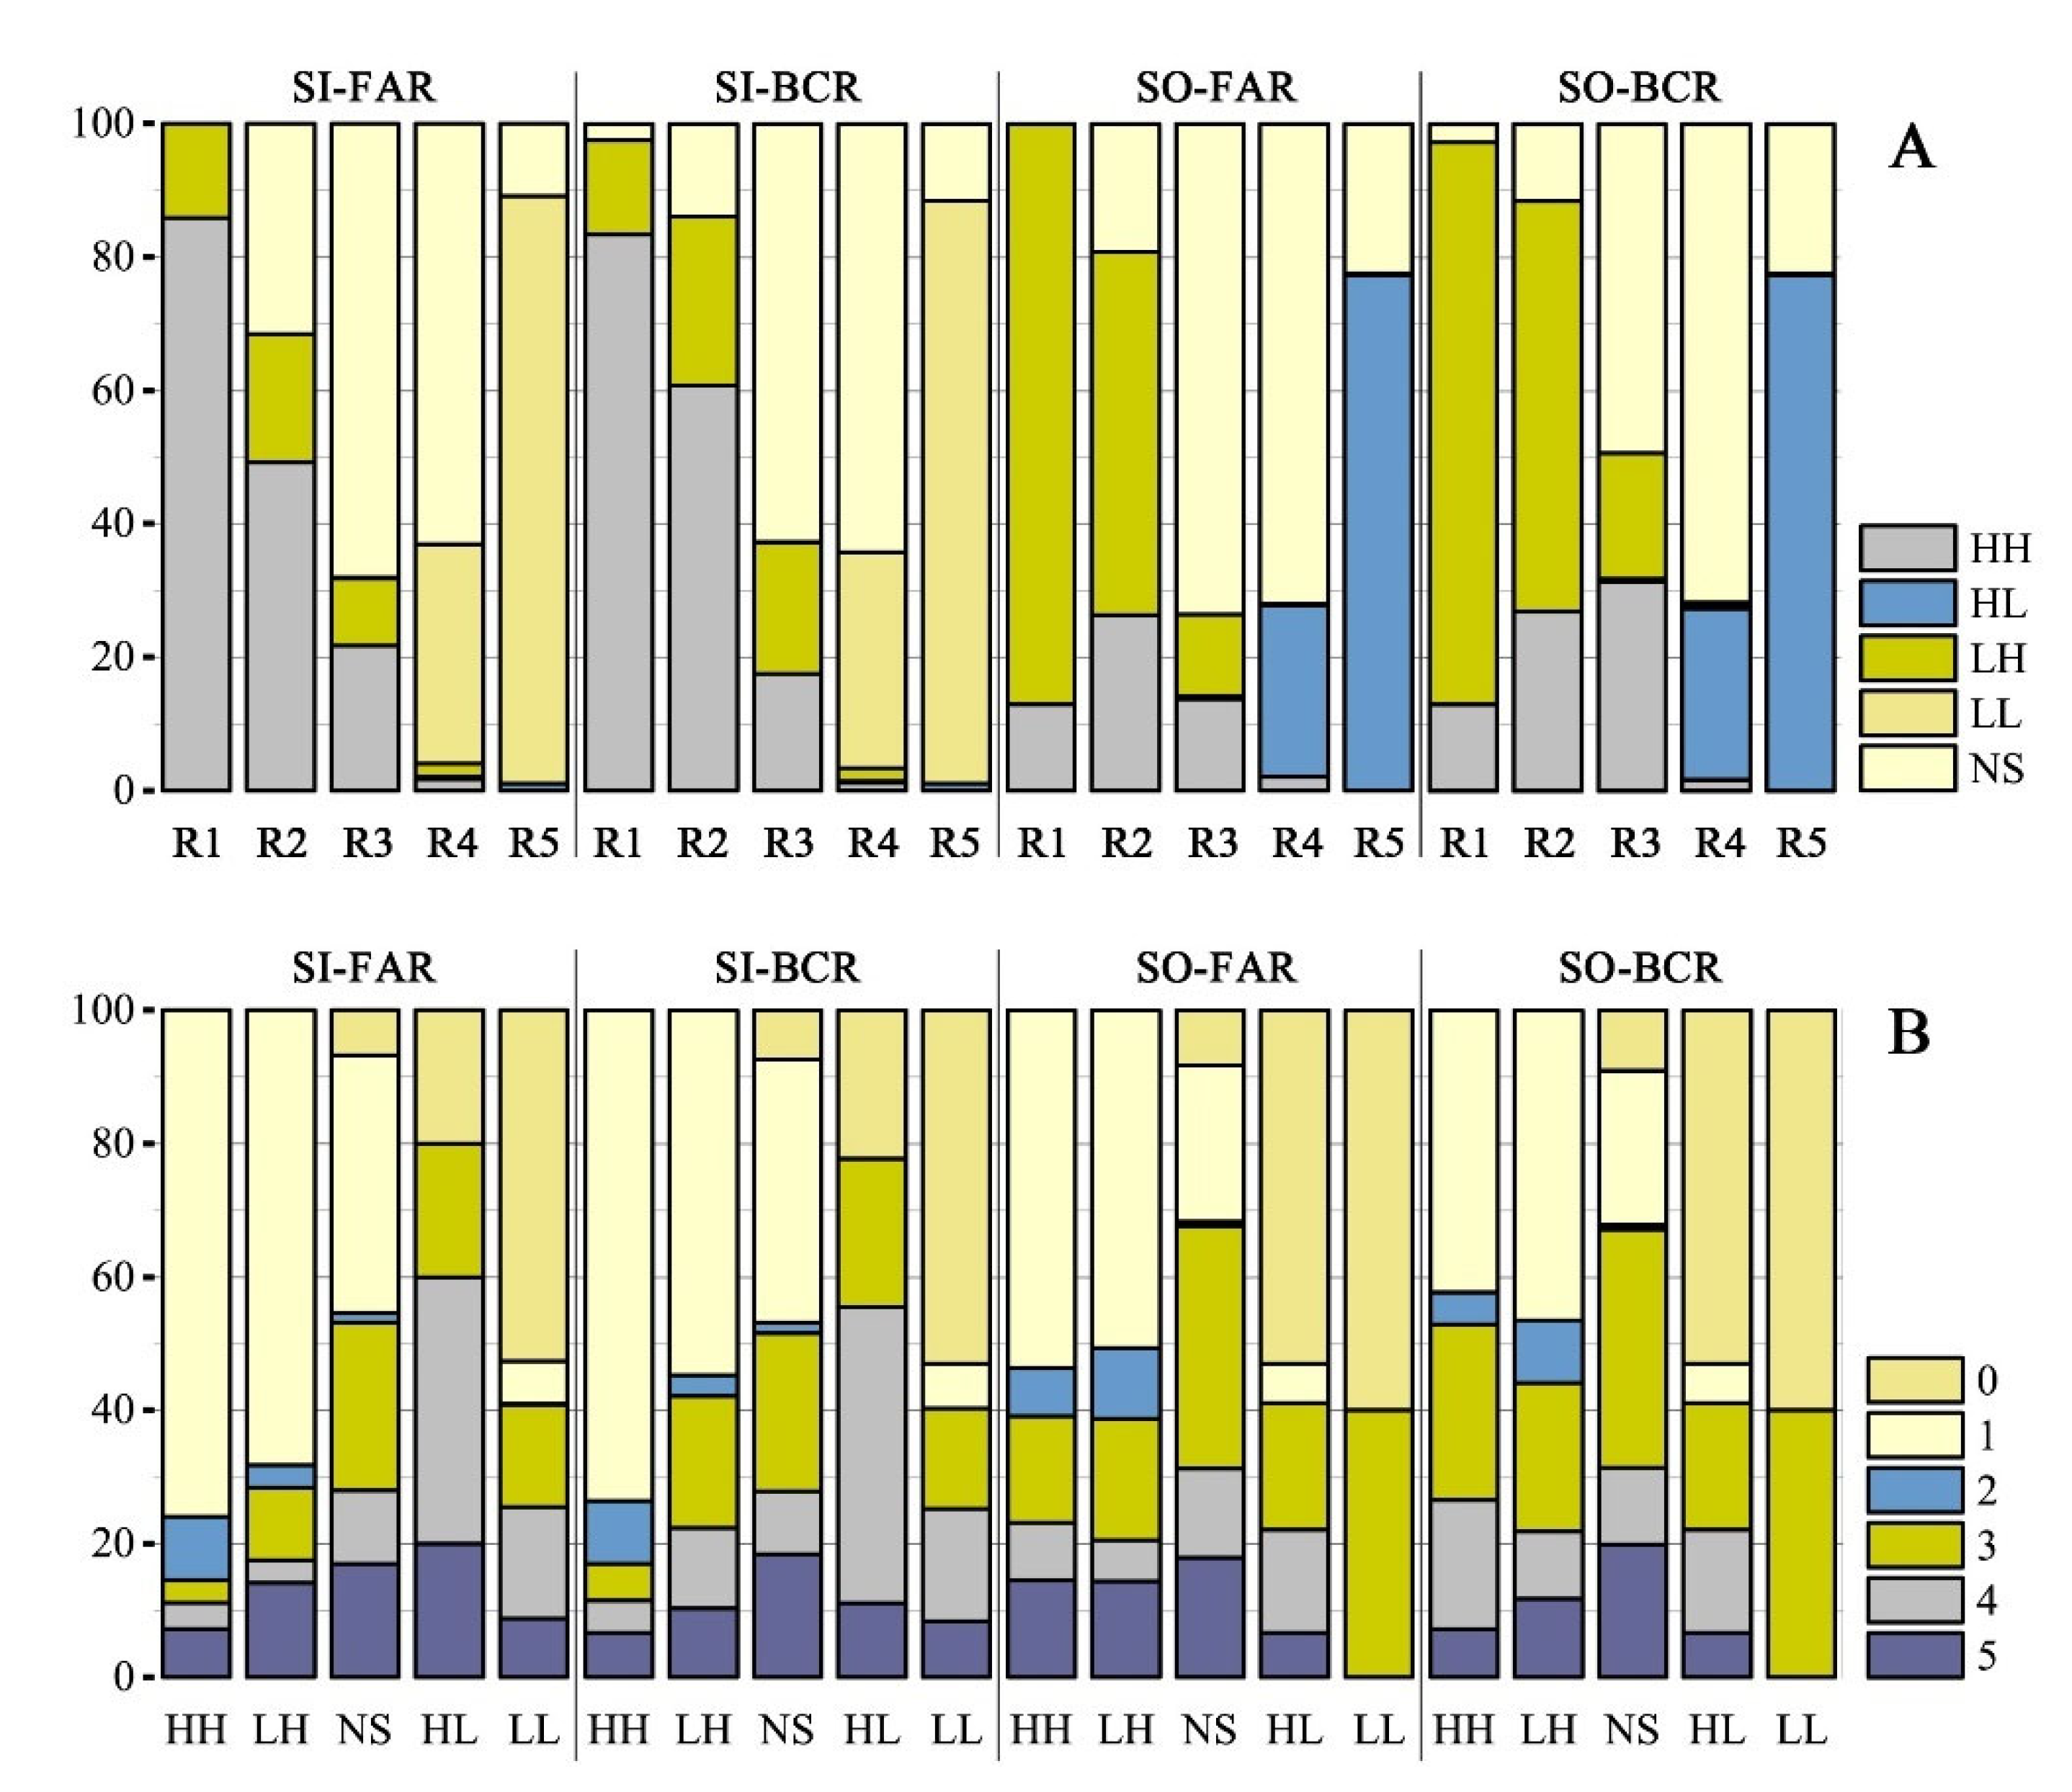
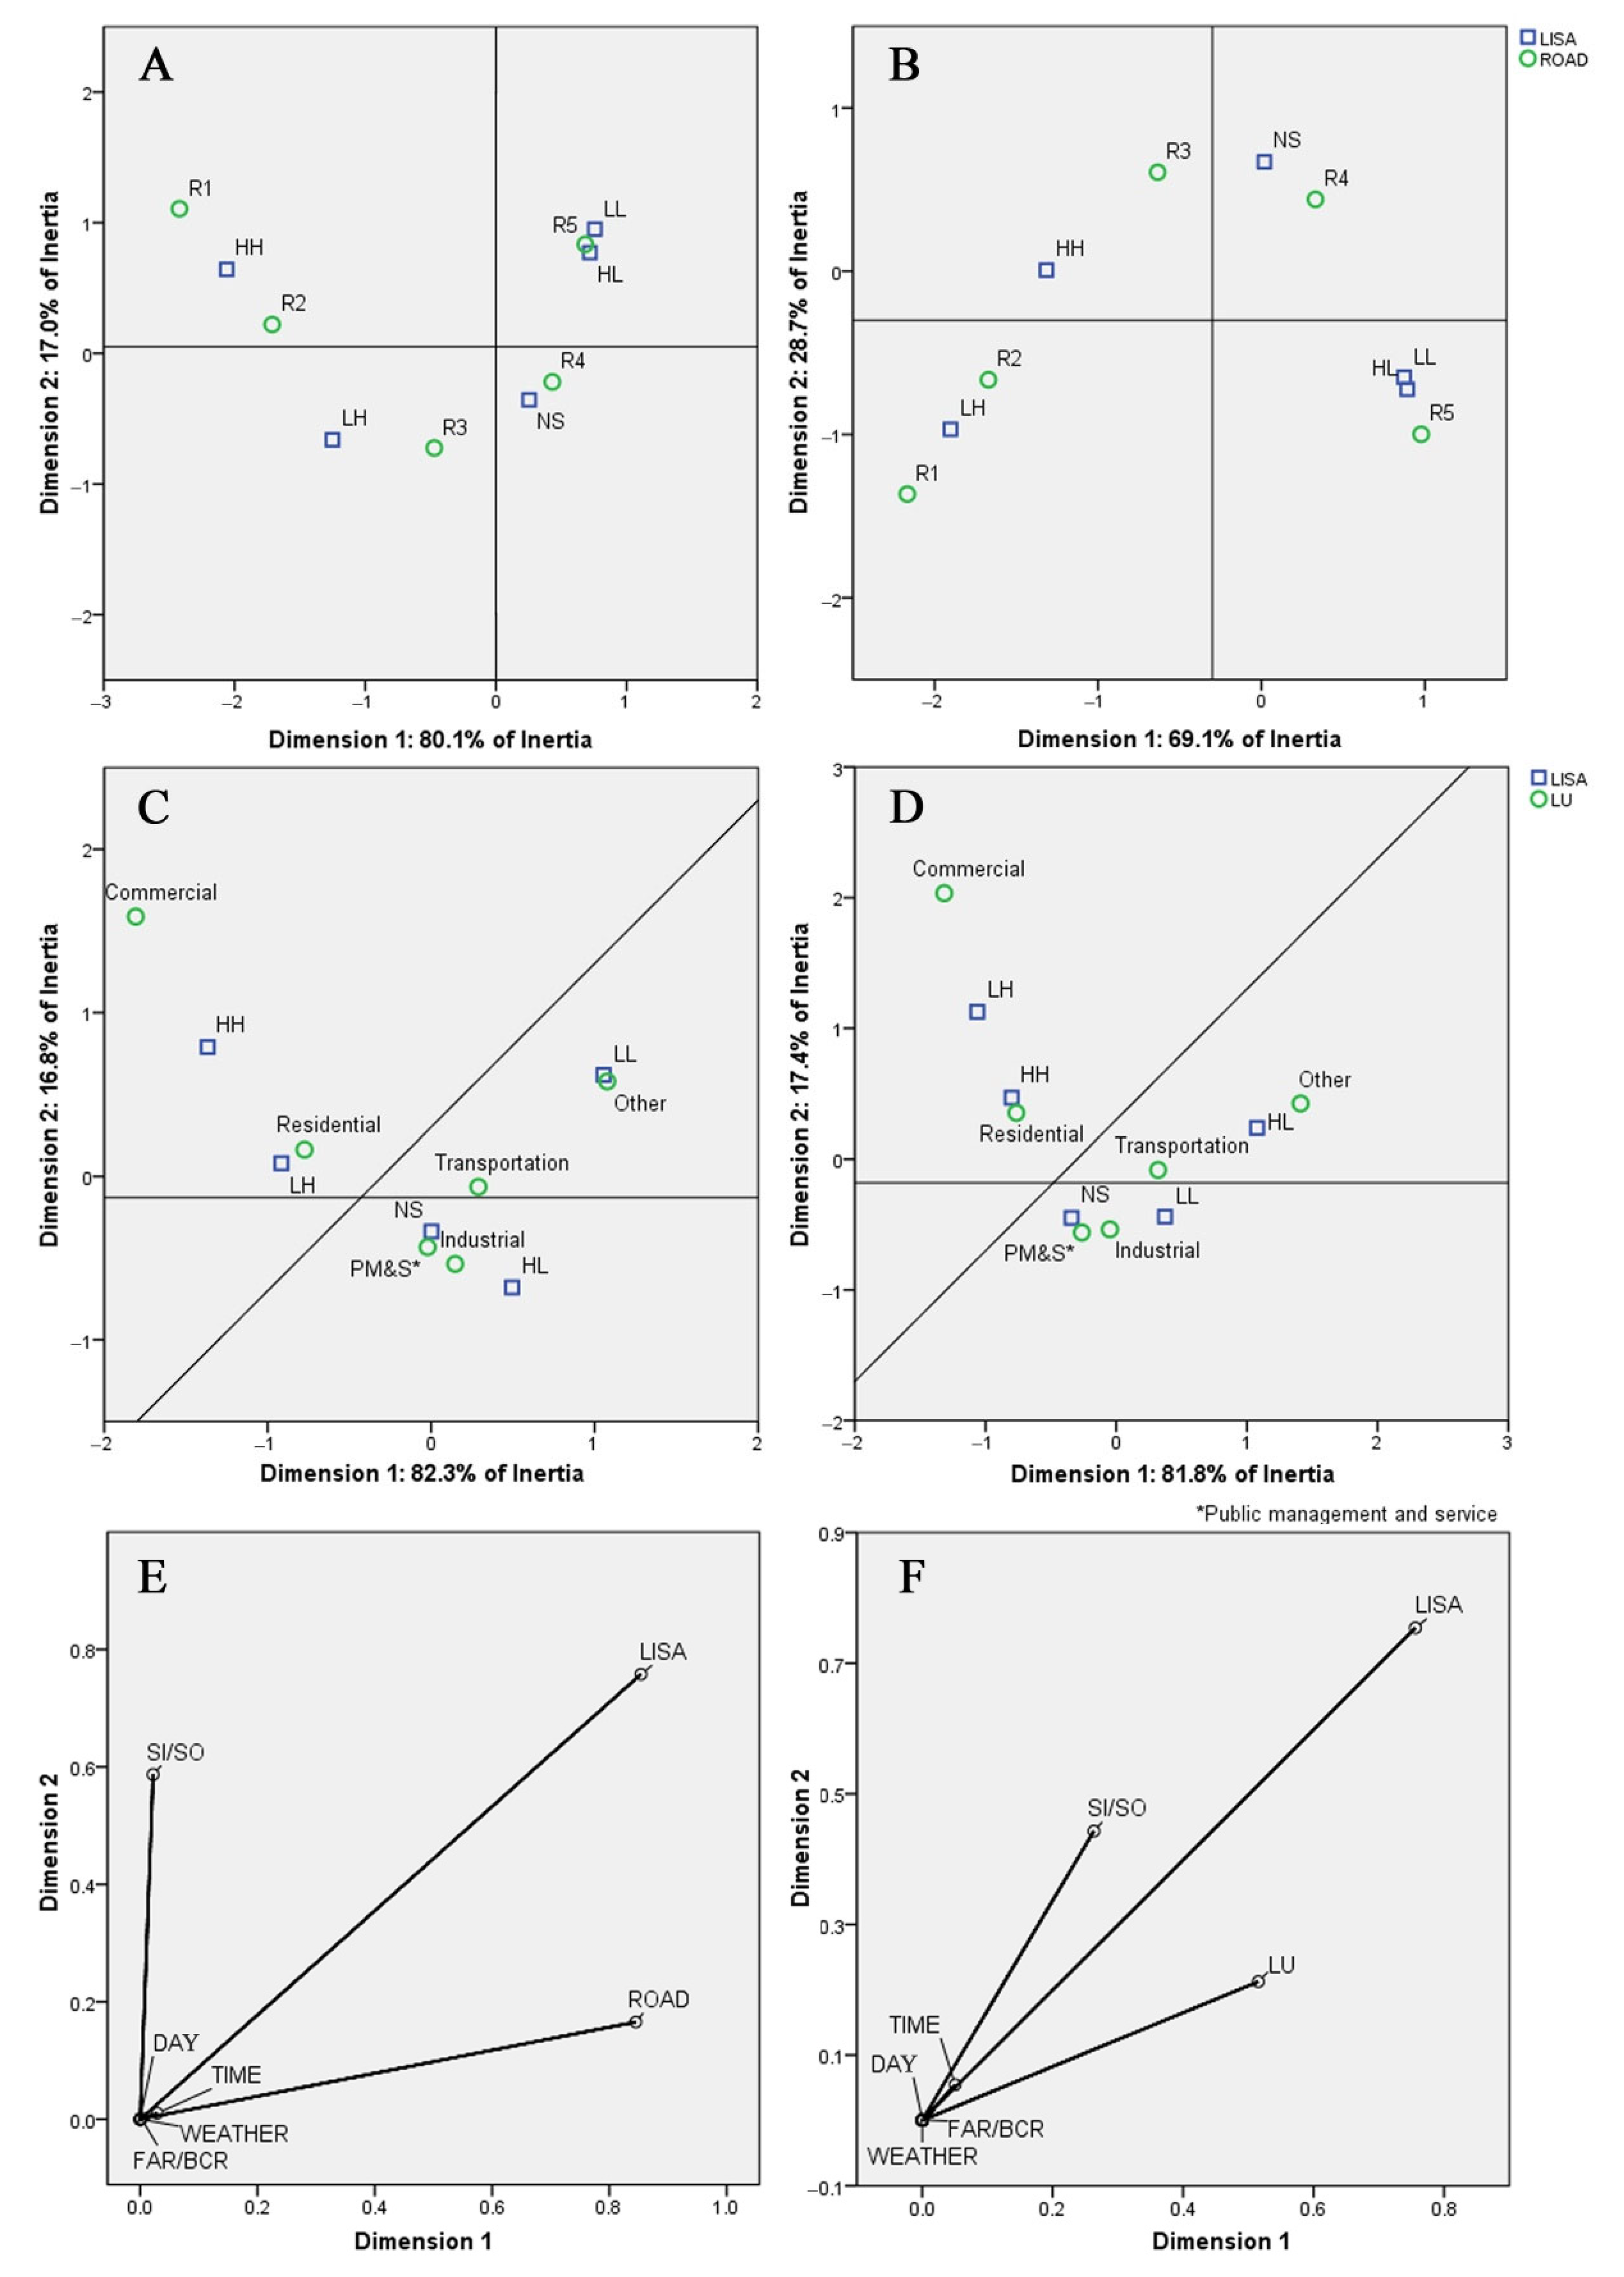
The correspondence analysis between the LISA results and the urban ring road was developed. In the correspondence analysis, the source and sink were still calculated separately, and both passed the chi-square test, indicating that the LISA results were closely related to the urban ring road. The proportion of LISA results in each ring (Figure 6A) and the correspondence analysis results (Figure 7A,B) reflect the quantitative structure and degree of connection, respectively. There are obvious differences in the distribution of the LISA results in the different urban ring road areas, and there are obviously different characteristics within the Third Ring Road and outside the Third Ring Road. In the population sink area (Figure 6A(SI) and Figure 7A), R1 and R2 are mainly HH, R3 is more closely related to LH and NS, R4 is mainly NS, R5 is mainly LL, and HL is closely related to R5. From the city center to the Third Ring Road, HH gradually decreases, and NS gradually increases. Outward from the Third Ring Road, LL increases, and NS decreases. HH are all distributed inside the Third Ring Road, and LL are all distributed outside the Third Ring Road. LH and HL represent two states of mismatch between population and land use intensity. LH is mainly distributed on the Third Ring Road, but the proportion is less than 20%, whereas HL accounts for a small proportion, mainly in R5. This shows that the intensity of urban land development in Shenyang is ahead for the demand for population mobility. Most of the human-land mismatch is based on a small population flow but a high intensity of land development. The source area of the population is expressed as a negative value, so it differs from the positive value of the sink area. However, the relationship between population flow and land use intensity reflects the same law as the sink area.
Multiple correspondence analysis was used to explore the effects of period, source and sink, FAR/BCR, and day, and LISA results used in the correspondence analysis are in units of one day, whereas the LISA results used in the multiple correspondence analysis considering multiple categorical variables are in units of periods. Figure 7E,F are discriminative metric diagrams of multiple correspondence analysis, showing the information in the variables in each dimension, which is usually used to eliminate variables to simplify the model. The results show that day, weather, FAR/BCR, and period have little discrimination (Figure 7E), which shows that these variables have little influence and that the urban ring road area has a decisive influence on the relationship between urban population source-sink and land use intensity.
From these results, we can see that the development state of Shenyang exhibits obvious differences from the center to the suburbs and that the Third Ring Road has become a dividing line in the urban development state, with obviously different development laws inside and outside and the main development being mainly within the Third Ring Road. From the urban center to the suburbs, there is a development process of high-value human-land matching, human-land mismatching, and low-value human-land matching. Transitional areas from the center to the suburbs are areas that need to be focused on addressing urban sprawl. In these areas, the land has been highly developed, but the population flow is relatively low. Attention should be paid to attract people to these areas to avoid an unnecessary waste of resources caused by the continuous outward expansion of the city and to promote efficient and reasonable use of urban land.
3.3.2. Differential Impact of Spatial Mismatch between Different Urban Land Use Types
Urban land use intensity can vary greatly due to different urban functions. When discussing land use intensity, it is necessary to consider the impact of different land use types. The correspondence analysis is developed between the LISA results and land use types, and all passed the chi-square test, indicating that the LISA results were closely related to land use types. The correspondence analysis results (Figure 7C) indicate that HH and LH are closely related to residential and commercial land, other land use is mainly in the LL state, and industrial land and public management and service land are closely related to the NS state. Judging by the proportion of LISA results for each land use type (Figure 6B), HH is dominated by residential land, with other land use types accounting for less than 10%. LH is dominated by residential land, with the total proportion of other land use types slightly higher than the HH state. LL is mainly other land, followed by industrial and transportation land. NS is mainly residential, industrial, and public management and service land, and the number of HL types is small, and the proportion is not stable. Combining the correspondence analysis results (Figure 7C,D) and the proportion of each land type in the LISA results (Figure 6B), regardless of the level of population flow, we concluded that the intensity of high land use primarily corresponds to residential land and commercial land, whereas the low flow and low intensity mainly correspond to other land uses, and public management, service land, and industrial land are insignificant.
To explore the influence of different periods of the day and other factors on the results, five additional variables—period, source and sink, FAR/BCR, day, and weather—were considered in the multiple correspondence analysis. The model alpha coefficient was 80.2%, and the result was credible. It can be seen from Figure 7F that FAR/BCR, day, and weather are extremely close to the origin, the discrimination is tiny, the period is close to the origin and coincides with LISA, and the impact is also smaller. Among these variables, land use type has the greatest impact on the relationship between urban population source-sink and land use intensity, which shows the regularity of urban operation.
The research results indicate that the land use intensity of residential and commercial land is higher, which follows our understanding of the actual situation of the city. The results of the correspondence analysis show that residential land is most closely related to low flow and high intensity. Figure 6A shows that the proportion of HL is small, so most of the human-land spatial mismatch appears on residential land. As a land use type with a high incidence of mismatch, most of the spatial mismatch of residential land is caused by the high-intensity land use and low-occupancy rate caused by large-scale commercial housing construction, which urban managers must focus on.
3.4. Urban Human-Land Spatial Mismatch from a Dynamic Perspective
There is a specific regularity in the urban human-land relationship, and the 24 h “tidal” changes of population source-sink had no significant impact on this regularity. We compared the dynamic changes in the relationship between the population source-sink and FAR of the ordinary weekday 20180515 to explore the specific reasons for the phenomenon.
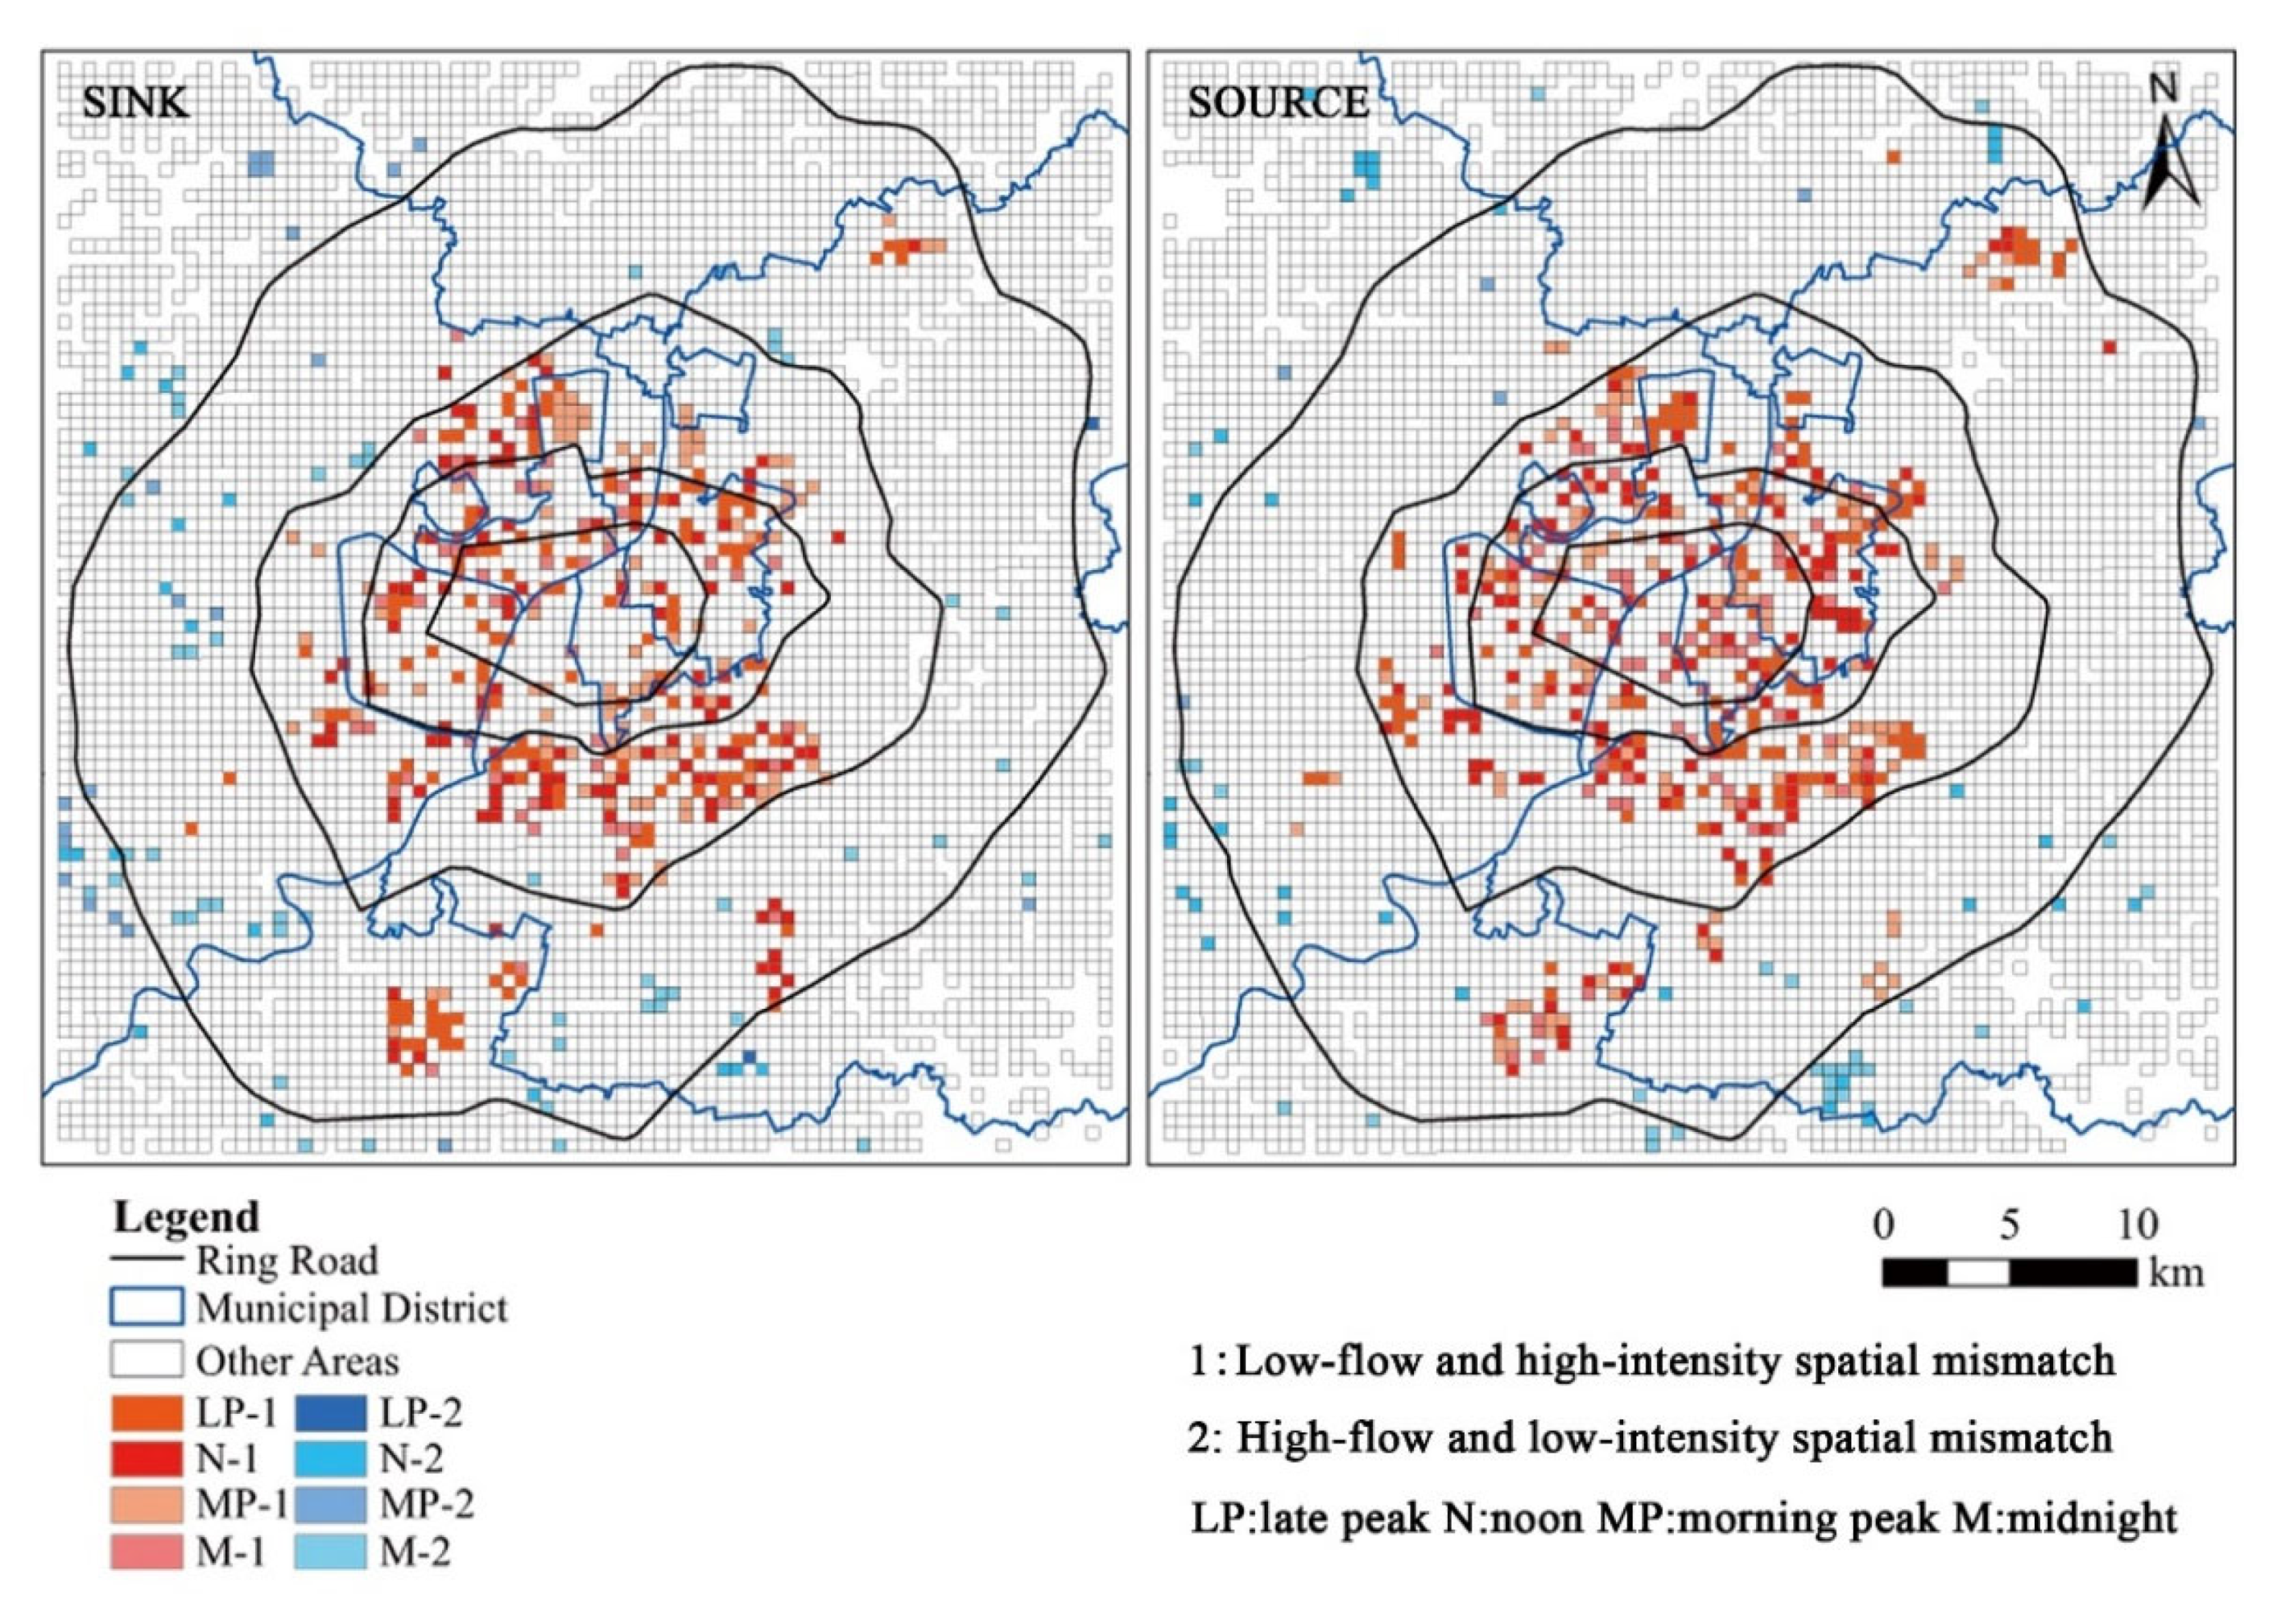
From the perspective of spatial mismatch distribution with low flow and high intensity, the comparison of spatial mismatch grids in different periods shows that there are almost no grids in the mismatch state continuously for four periods, but that mismatch grids in different periods appear in adjacent areas one after another. There will always be spatial mismatches around a mismatched grid in other periods, and these areas that appear in patches are the areas we need to focus on in urban management. It can be seen from Figure 8 that most areas with spatial mismatches are distributed in Hunnan, Yuhong, and Dadong within the Third Ring Road, which are more peripheral municipal districts than the central municipal districts of Heping, Shenhe, and Tiexi. In addition, there is a large-scale enclave-style spatial mismatch in the Sujiatun District. The spatial mismatch between high flow and low intensity is scattered in the outer periphery of the city. Taoxian Airport, in the southeast of the city’s Fourth Ring Road, is a typical such area.
The spatial mismatch state of this distribution suggests that the problem of urban spatial mismatch is not a single grid problem from a static perspective, but a problem within the urban area from a dynamic perspective. Therefore, when solving and improving the problem of spatial mismatch, we cannot focus only on the place where the problem occurs. The mismatched area is not isolated but is linked to the surrounding area, which requires unified coordination and overall improvement. It is precisely because of this concomitant distribution and constant change that the distribution and quantity of urban spatial mismatch are roughly similar at any time, so they have less impact on the overall urban mismatch. Furthermore, the distribution of the spatial mismatch of source-sink throughout the day is the closest to that of the late peak, indicating that the overall spatial mismatch is still dominated by the distribution of the residential population.
4. Discussion
4.1. Regularity of Population Source-Sink and Spatial Mismatch Characteristics
The 24 h urban population source-sink changes are cyclical, and studies have verified that daily human activities follow a repeatable pattern from the perspective of the city [77,78,79]. Population flow causes the urban “tide”, with the morning peak population gathering in the urban center and then gradually dispersing outward, which follows the opposite distribution in the source and sink areas of the city in the morning and evening in a previous study [60], and the law of population being centripetal during the day and centrifugal at night is consistent [52]. Rigid travel in this regular population flow determines the daily regularity of the city, so whether there is precipitation in the city on weekdays or weekends, there are similar overall laws. However, the morning and late peaks on weekends are flatter [80], and rainfall reduces people’s travel volumes. Although travel is affected by weather, daily travel is still representative [81,82].
There is a strong correlation between population source-sink and land use intensity, and therefore, high flow and high intensity have similar distribution rules. Therefore, urban human-land mismatch can be detected from a dynamic perspective using mobile phone signaling data, which differs from conventional methods for obtaining population data that are static, low in precision, and require long acquisition times. This study differed in some respects from previous studies. Different periods, weekday versus weekend days, and rainy weather on local spatial relationships were not found to affect the overall law, in contrast to the finding in previous research that the local spatial relationship between population activity and land use intensity differs from day to night [50]. The biggest influences on spatial mismatch were the circle structure and land use type. Furthermore, the spatial mismatch appearing adjacent to different periods is not reflected in the findings of studies conducted from a static perspective.
There are large quantitative differences between the two states of human-land spatial mismatch, i.e., low flow, high intensity and high flow, low intensity, in cities. The number of high-flow and low-intensity states is minuscule, and when this state occurs in areas such as airports and railway stations in transportation land, or in popular parks and green spaces in public management and service land, high flow and low intensity are relatively reasonable states. The main problem of human-land spatial mismatch in Shenyang City is low population flow and high intensity. Some studies have pointed out that the high housing vacancy rate and serious aging of Shenyang City are warning problems that need to be addressed in urban development [83].
The authors should discuss the results and how they can be interpreted from the perspective of previous studies and of the working hypotheses. The findings and their implications should be discussed in the broadest possible context. Future research directions may also be highlighted.
4.2. Policy Implications of Possible Spatial Mismatch Caused by Urban Sprawl
Urban human-land spatial mismatch is mostly directly reflected in overdevelopment or lagging development of land relative to the urban population. Overdevelopment is a type of idle land after high-intensity development, whereas lagging development is a low-intensity land development that cannot meet population needs [84]. The human-land spatial mismatch in Shenyang is basically caused by land overdevelopment, with residential land being the most overdeveloped. The Second Ring Road in Shenyang was completed in 1997, and the Third Ring Road was completed in 2013. This period corresponds roughly to the period of the fastest urban expansion in China [85,86]. As a typical representative of the urban “pie” development form, it is important to coordinate the human-land mismatch caused by excessive urban expansion and high-density urban sprawl and maximize the improvement of the existing urban state. The following are the two main policy implications.
Multiple measures should be considered to improve the population flow in mismatched areas. The role of mixed use of land in enhancing the vitality of areas, promoting the balance and coordination of regional land functions, and meeting the different needs of residents with multifunctionality are important. Urban public service resources should be allocated rationally and the functions of urban centers should be eased [87], and more investment is required in suburban culture, sports, education, and medical care, to attract people with high-quality supporting resources. It is important to promote the coordinated development of industry and urban construction, increased employment opportunities in areas with serious mismatch, and to attach the spontaneous vitality of the communities in these areas. Furthermore, restrictions on the household registration system should be reduced, and external factors that affect the fairness of access to public goods [88] must be addressed to help cities attract external populations and increase the overall population flow in the city.
High-density urban sprawl should be curbed. The dependence on land finance should be reduced and the unsustainable development method of using land finance to maintain urban construction funds must be avoided [89]. The demand for high-density buildings in Shenyang is much lower than the current construction volume provides, but real estate companies, driven by the search for high profits, always choose a high FAR development model, which makes the city continue to develop vertically. The crowding and environmental deterioration caused by high FAR contradict the demands of urban residents for a comfortable living environment [90]. It is urgent to strengthen the management and control of real estate development. Planners and implementers should simultaneously focus on the spatial layout guidelines of overall planning and urban design, appropriately construct control planning indicators, and determine a reasonable FAR and BCR from the city center to the suburbs as needed. They should strive to delineate and strictly follow urban growth boundaries to avoid the continuous extension of sprawl, seek an efficient and compact urban development model [91], improve urban resilience [10], and achieve intelligent growth [92].
4.3. Limitations and Prospects
There are certain limitations to this study. Due to data availability limitations, only four days of mobile phone signaling data were used to represent ordinary weekdays, ordinary weekend days, rainy weekdays, and rainy weekend days, and there was no larger-scale dataset available. However, numerous studies based on mobile phone signaling data or other types of big data have found and verified the periodicity of urban population mobility [48,78,93,94], which was also verified in this study. Mobile phone signaling data also comprise a large amount of data. It was believed to be feasible and representative to explore the relationship between urban population source-sink and land use intensity using four days of data. If more abundant datasets were available, this study could be further verified and improved.
In terms of the choice of methods, on the one hand, this study avoided the focus on the natural, economic, and other factors in the macro urban human-land spatial relationship research represented by land use efficiency and optimization, while ignoring the important impact of human activities on land use. On the other hand, it avoids focusing on function and ignoring land use in micro-accessibility research. Through the new analysis framework, this research returns to the essence of human-land spatial relationship research, and discusses the local human-land spatial mismatch in cities based on the 500 m grid data of population source-sink and land use, which can show the urban human-land spatial relationship more intuitively. However, although the existing bivariate model is suitable for exploring the human-land relationship, it is difficult to reveal the inner complexity of urban activities. Future research will accurately identify various urban activities and then integrate and analyze them, not only to find the matching of human-land quantity but also to explore the possibility of human-land balance with comprehensive functions.
5. Conclusions
In this study, using ICT data, such as mobile phone signaling data and multiple open data sources and an analysis approach based on the source-sink theory, the urban human-land matching relationship was examined from a dynamic perspective. This study demonstrated the spatial correlation and spatial mismatch between urban population source-sink and land use intensity. This spatial mismatch has nothing to do with different days, weather, or periods but is strongly correlated with different urban circles and different land use types. The results show there was a 24 h periodic law in the urban population source-sink. There was a significant spatial correlation between population source-sink and land use intensity, and the local spatial mismatch between the two was mainly in the state of low population flow and high intensity. The phenomenon of spatial mismatch is different in different urban circles and is most closely related to residential land. The adjacent occurrence of spatial mismatch in different periods reminds us to consider the linkage with surrounding areas when improving the mismatch problem. For sustainable development, it is necessary to strengthen the management and control of urban land use intensity, manage existing mismatched areas, curb high-intensity urban sprawl, and prevent cities from continuously generating new spatial mismatches. Furthermore, this study was based on the overall urban population activity, but the massive urban population activity data were contributed by the daily activities of residents such as work and leisure. The following research will identify various daily activities of residents with the support of ICT, explore the possibility of balancing various functions of urban land use, and provide more support for solving the problem of urban human-land mismatch.
Author Contributions
Conceptualization, methodology, formal analysis, data curation, writing—original draft and visualization, Tong Li; writing—review and editing, funding acquisition, Chunliang Xiu; resources, writing—review and editing, Huisheng Yu. All authors have read and agreed to the published version of the manuscript.
Funding
This research was funded by the National Natural Science Foundation of China, grant number 41871162.
Data Availability Statement
Not applicable.
Acknowledgments
The authors are grateful to the editor and reviewers for their valuable comments and suggestions.
Conflicts of Interest
The authors declare no conflict of interest.
References
- Yu, A.T.W.; Wu, Y.; Zheng, B.; Zhang, X.; Shen, L. Identifying Risk Factors of Urban-Rural Conflict in Urbanization: A Case of China. Habitat Int. 2014, 44, 177–185. [Google Scholar] [CrossRef]
- Jiang, S.; Meng, J.; Zhu, L.; Cheng, H. Spatial-Temporal Pattern of Land Use Conflict in China and Its Multilevel Driving Mechanisms. Sci. Total Environ. 2021, 801, 149697. [Google Scholar] [CrossRef] [PubMed]
- Chen, D.; Lu, X.; Hu, W.; Zhang, C.; Lin, Y. How Urban Sprawl Influences Eco-Environmental Quality: Empirical Research in China by Using the Spatial Durbin Model. Ecol. Indic. 2021, 131, 108113. [Google Scholar] [CrossRef]
- Zhao, Z.-Q.; He, B.-J.; Li, L.-G.; Wang, H.-B.; Darko, A. Profile and Concentric Zonal Analysis of Relationships between Land Use/Land Cover and Land Surface Temperature: Case Study of Shenyang, China. Energy Build. 2017, 155, 282–295. [Google Scholar] [CrossRef]
- Fan, Y.; Fang, C. Eco-City and Man-Land Relationship. Acta Ecol. Sin. 2022, 42, 4313–4323. [Google Scholar] [CrossRef]
- Neuman, M. The Compact City Fallacy. J. Plan. Educ. Res. 2005, 25, 11–26. [Google Scholar] [CrossRef]
- Bibri, S.E. Compact Urbanism and the Synergic Potential of Its Integration with Data-Driven Smart Urbanism: An Extensive Interdisciplinary Literature Review. Land Use Policy 2020, 97, 104703. [Google Scholar] [CrossRef]
- Downs, A. What Does Smart Growth Really Mean? Planning 2001, 67, 20–25. [Google Scholar]
- Gabriel, S.A.; Faria, J.A.; Moglen, G.E. A Multiobjective Optimization Approach to Smart Growth in Land Development. Socio-Econ. Plan. Sci. 2006, 40, 212–248. [Google Scholar] [CrossRef] [Green Version]
- Feng, X.; Xiu, C.; Bai, L.; Zhong, Y.; Wei, Y. Comprehensive Evaluation of Urban Resilience Based on the Perspective of Landscape Pattern: A Case Study of Shenyang City. Cities 2020, 104, 102722. [Google Scholar] [CrossRef]
- Blasi, S.; Ganzaroli, A.; De Noni, I. Smartening Sustainable Development in Cities: Strengthening the Theoretical Linkage between Smart Cities and SDGs. Sustain. Cities Soc. 2022, 80, 103793. [Google Scholar] [CrossRef]
- Liu, Y.; Li, J.; Yang, Y. Strategic Adjustment of Land Use Policy under the Economic Transformation. Land Use Policy 2018, 74, 5–14. [Google Scholar] [CrossRef]
- Kuang, W.; Chi, W.; Lu, D.; Dou, Y. A Comparative Analysis of Megacity Expansions in China and the U.S.: Patterns, Rates and Driving Forces. Landsc. Urban Plan. 2014, 132, 121–135. [Google Scholar] [CrossRef]
- Wang, X.; Jiao, L.; Dong, T. A Comparative Analysis of Urban Sprawl Characteristics of High-Density and Low-Density Cities Comparative Analysis of Large Cities in China and America. Econ. Geogr. 2020, 40, 70–78. [Google Scholar] [CrossRef]
- Chen, Z.; Yu, B.; Hu, Y.; Huang, C.; Shi, K.; Wu, J. Estimating House Vacancy Rate in Metropolitan Areas Using NPP-VIIRS Nighttime Light Composite Data. IEEE J. Sel. Top. Appl. Earth Obs. Remote Sens. 2015, 8, 2188–2197. [Google Scholar] [CrossRef]
- Zheng, Q.; Deng, J.; Jiang, R.; Wang, K.; Xue, X.; Lin, Y.; Huang, Z.; Shen, Z.; Li, J.; Shahtahmassebi, A.R. Monitoring and Assessing “Ghost Cities” in Northeast China from the View of Nighttime Light Remote Sensing Data. Habitat Int. 2017, 70, 34–42. [Google Scholar] [CrossRef]
- Kain, J.F. Housing Segregation, Negro Employment, and Metropolitan Decentralization. Q. J. Econ. 1968, 82, 175–197. [Google Scholar] [CrossRef]
- Kain, J.F. A Pioneer’s Perspective on the Spatial Mismatch Literature. Urban Stud. 2004, 41, 7–32. [Google Scholar] [CrossRef]
- Ta, N.; Chai, Y.; Zhang, Y.; Sun, D. Understanding Job-Housing Relationship and Commuting Pattern in Chinese Cities: Past, Present and Future. Transp. Res. Part D Transp. Environ. 2017, 52, 562–573. [Google Scholar] [CrossRef]
- Zhao, P.; Lü, B.; de Roo, G. Impact of the Jobs-Housing Balance on Urban Commuting in Beijing in the Transformation Era. J. Transp. Geogr. 2011, 19, 59–69. [Google Scholar] [CrossRef]
- Liu, C.; Cao, M.; Yang, T.; Ma, L.; Wu, M.; Cheng, L.; Ye, R. Inequalities in the Commuting Burden: Institutional Constraints and Job-Housing Relationships in Tianjin, China. Res. Transp. Bus. Manag. 2022, 42, 100545. [Google Scholar] [CrossRef]
- Wang, F.; Luo, W. Assessing Spatial and Nonspatial Factors for Healthcare Access: Towards an Integrated Approach to Defining Health Professional Shortage Areas. Health Place 2005, 11, 131–146. [Google Scholar] [CrossRef] [PubMed]
- Wang, S.; Wang, M.; Liu, Y. Access to Urban Parks: Comparing Spatial Accessibility Measures Using Three GIS-Based Approaches. Comput. Environ. Urban Syst. 2021, 90, 101713. [Google Scholar] [CrossRef]
- Peng, Y.; Liu, J.; Zhang, T.; Li, X. The Relationship between Urban Population Density Distribution and Land Use in Guangzhou, China: A Spatial Spillover Perspective. Int. J. Environ. Res. Public Health 2021, 18, 12160. [Google Scholar] [CrossRef] [PubMed]
- Cote, M.; Nightingale, A.J. Resilience Thinking Meets Social Theory: Situating Social Change in Socio-Ecological Systems (SES) Research. Prog. Hum. Geogr. 2012, 36, 475–489. [Google Scholar] [CrossRef]
- Zhao, Z.; Bai, Y.; Wang, G.; Chen, J.; Yu, J.; Liu, W. Land Eco-Efficiency for New-Type Urbanization in the Beijing-Tianjin-Hebei Region. Technol. Forecast. Soc. Chang. 2018, 137, 19–26. [Google Scholar] [CrossRef]
- Botticini, F.; Auzins, A.; Lacoere, P.; Lewis, O.; Tiboni, M. Land Take and Value Capture: Towards More Efficient Land Use. Sustainability 2022, 14, 778. [Google Scholar] [CrossRef]
- Stewart, T.J.; Janssen, R.; van Herwijnen, M. A Genetic Algorithm Approach to Multiobjective Land Use Planning. Comput. Oper. Res. 2004, 31, 2293–2313. [Google Scholar] [CrossRef]
- Li, X.; Liu, X. Embedding Sustainable Development Strategies in Agent-based Models for Use as a Planning Tool. Int. J. Geogr. Inf. Sci. 2008, 22, 21–45. [Google Scholar] [CrossRef]
- Liu, S.; Xiao, W.; Li, L.; Ye, Y.; Song, X. Urban Land Use Efficiency and Improvement Potential in China: A Stochastic Frontier Analysis. Land Use Policy 2020, 99, 105046. [Google Scholar] [CrossRef]
- Peng, C.; Li, B.; Nan, B. An Analysis Framework for the Ecological Security of Urban Agglomeration: A Case Study of the Beijing-Tianjin-Hebei Urban Agglomeration. J. Clean. Prod. 2021, 315, 128111. [Google Scholar] [CrossRef]
- Das, B.; Singh, A.; Panda, S.N.; Yasuda, H. Optimal Land and Water Resources Allocation Policies for Sustainable Irrigated Agriculture. Land Use Policy 2015, 42, 527–537. [Google Scholar] [CrossRef]
- Chang, Y.-C.; Ko, T.-T. An Interactive Dynamic Multi-Objective Programming Model to Support Better Land Use Planning. Land Use Policy 2014, 36, 13–22. [Google Scholar] [CrossRef] [Green Version]
- Wu, W.; Luo, X.; Knopp, J.; Jones, L.; Banzhaf, E. A European-Chinese Exploration: Part 2—Urban Ecosystem Service Patterns, Processes, and Contributions to Environmental Equity under Different Scenarios. Remote Sens. 2022, 14, 3488. [Google Scholar] [CrossRef]
- Xu, L.; Liu, X.; Tong, D.; Liu, Z.; Yin, L.; Zheng, W. Forecasting Urban Land Use Change Based on Cellular Automata and the PLUS Model. Land 2022, 11, 652. [Google Scholar] [CrossRef]
- Yuan, M.; Liu, Y.; He, J.; Liu, D. Regional Land-Use Allocation Using a Coupled MAS and GA Model: From Local Simulation to Global Optimization, a Case Study in Caidian District, Wuhan, China. Cartogr. Geogr. Inf. Sci. 2014, 41, 363–378. [Google Scholar] [CrossRef]
- Cao, K.; Liu, M.; Wang, S.; Liu, M.; Zhang, W.; Meng, Q.; Huang, B. Spatial Multi-Objective Land Use Optimization toward Livability Based on Boundary-Based Genetic Algorithm: A Case Study in Singapore. ISPRS Int. J. Geo-Inf. 2020, 9, 40. [Google Scholar] [CrossRef] [Green Version]
- Seto, K.C.; Sánchez-Rodríguez, R.; Fragkias, M. The New Geography of Contemporary Urbanization and the Environment. Annu. Rev. Environ. Resour. 2010, 35, 167–194. [Google Scholar] [CrossRef] [Green Version]
- Easley, J. Spatial Mismatch beyond Black and White: Levels and Determinants of Job Access among Asian and Hispanic Subpopulations. Urban Stud. 2018, 55, 1800–1820. [Google Scholar] [CrossRef]
- Gao, S.; Janowicz, K.; Couclelis, H. Extracting Urban Functional Regions from Points of Interest and Human Activities on Location-Based Social Networks. Trans. GIS 2017, 21, 446–467. [Google Scholar] [CrossRef]
- Wang, S.; Xu, G.; Guo, Q. Street Centralities and Land Use Intensities Based on Points of Interest (POI) in Shenzhen, China. ISPRS Int. J. Geo-Inf. 2018, 7, 425. [Google Scholar] [CrossRef]
- Zhang, X.; Du, S.; Wang, Q. Hierarchical Semantic Cognition for Urban Functional Zones with VHR Satellite Images and POI Data. ISPRS J. Photogramm. Remote Sens. 2017, 132, 170–184. [Google Scholar] [CrossRef]
- Pan, G.; Qi, G.; Wu, Z.; Zhang, D.; Li, S. Land-Use Classification Using Taxi GPS Traces. IEEE Trans. Intell. Transp. Syst. 2013, 14, 113–123. [Google Scholar] [CrossRef]
- Wellmann, T.; Haase, D.; Knapp, S.; Salbach, C.; Selsam, P.; Lausch, A. Urban Land Use Intensity Assessment: The Potential of Spatio-Temporal Spectral Traits with Remote Sensing. Ecol. Indic. 2018, 85, 190–203. [Google Scholar] [CrossRef]
- Cheng, L.; Chen, C.; Xiu, C. Excess Kindergarten Travel in Changchun, Northeast China: A Measure of Residence-Kindergarten Spatial Mismatch. J. Transp. Geogr. 2017, 60, 208–216. [Google Scholar] [CrossRef]
- Shen, Y.; Sun, F.; Che, Y. Public Green Spaces and Human Wellbeing: Mapping the Spatial Inequity and Mismatching Status of Public Green Space in the Central City of Shanghai. Urban For. Urban Green. 2017, 27, 59–68. [Google Scholar] [CrossRef]
- Liu, Z.; Ma, T.; Du, Y.; Pei, T.; Yi, J.; Peng, H. Mapping Hourly Dynamics of Urban Population Using Trajectories Reconstructed from Mobile Phone Records. Trans. GIS 2018, 22, 494–513. [Google Scholar] [CrossRef]
- Liu, W.; Wu, W.; Thakuriah, P.; Wang, J. The Geography of Human Activity and Land Use: A Big Data Approach. Cities 2020, 97, 102523. [Google Scholar] [CrossRef]
- Chen, Y.; Liu, X.; Li, X. Analyzing Parcel-Level Relationships between Urban Land Expansion and Activity Changes by Integrating Landsat and Nighttime Light Data. Remote Sens. 2017, 9, 164. [Google Scholar] [CrossRef] [Green Version]
- Xia, C.; Yeh, A.G.-O.; Zhang, A. Analyzing Spatial Relationships between Urban Land Use Intensity and Urban Vitality at Street Block Level: A Case Study of Five Chinese Megacities. Landsc. Urban Plan. 2020, 193, 103669. [Google Scholar] [CrossRef]
- Xu, G.; Su, J.; Xia, C.; Li, X.; Xiao, R. Spatial Mismatches between Nighttime Light Intensity and Building Morphology in Shanghai, China. Sustain. Cities Soc. 2022, 81, 103851. [Google Scholar] [CrossRef]
- Li, J.; Li, J.; Yuan, Y.; Li, G. Spatiotemporal Distribution Characteristics and Mechanism Analysis of Urban Population Density: A Case of Xi’an, Shaanxi, China. Cities 2019, 86, 62–70. [Google Scholar] [CrossRef]
- Calabrese, F.; Diao, M.; Di Lorenzo, G.; Ferreira, J.; Ratti, C. Understanding Individual Mobility Patterns from Urban Sensing Data: A Mobile Phone Trace Example. Transp. Res. Part C Emerg. Technol. 2013, 26, 301–313. [Google Scholar] [CrossRef]
- Dong, X.; Xu, Y.; Huang, L.; Liu, Z.; Xu, Y.; Zhang, K.; Hu, Z.; Wu, G. Exploring Impact of Spatial Unit on Urban Land Use Mapping with Multisource Data. Remote Sens. 2020, 12, 3597. [Google Scholar] [CrossRef]
- Liu, B.; Deng, Y.; Li, M.; Yang, J.; Liu, T. Classification Schemes and Identification Methods for Urban Functional Zone: A Review of Recent Papers. Appl. Sci. 2021, 11, 9968. [Google Scholar] [CrossRef]
- Pulliam, H.R. Sources, Sinks, and Population Regulation. Am. Nat. 1988, 132, 652–661. [Google Scholar] [CrossRef]
- Li, W.; Cao, Q.; Lang, K.; Wu, J. Linking Potential Heat Source and Sink to Urban Heat Island: Heterogeneous Effects of Landscape Pattern on Land Surface Temperature. Sci. Total Environ. 2017, 586, 457–465. [Google Scholar] [CrossRef] [PubMed]
- Sun, R.; Xie, W.; Chen, L. A Landscape Connectivity Model to Quantify Contributions of Heat Sources and Sinks in Urban Regions. Landsc. Urban Plan. 2018, 178, 43–50. [Google Scholar] [CrossRef]
- Chen, L.; Sun, R.; Lu, Y. A Conceptual Model for a Process-Oriented Landscape Pattern Analysis. Sci. China Earth Sci. 2019, 62, 2050–2057. [Google Scholar] [CrossRef]
- Liu, Y.; Wang, F.; Xiao, Y.; Gao, S. Urban Land Uses and Traffic ‘Source-Sink Areas’: Evidence from GPS-Enabled Taxi Data in Shanghai. Landsc. Urban Plan. 2012, 106, 73–87. [Google Scholar] [CrossRef]
- Wang, Y.; Wang, F.; Zhang, Y.; Liu, Y. Delineating Urbanization “Source-Sink” Regions in China: Evidence from Mobile App Data. Cities 2019, 86, 167–177. [Google Scholar] [CrossRef]
- Erb, K.-H. How a Socio-Ecological Metabolism Approach Can Help to Advance Our Understanding of Changes in Land-Use Intensity. Ecol. Econ. 2012, 76, 8–14. [Google Scholar] [CrossRef] [PubMed] [Green Version]
- Zeng, C.; Yang, L.; Dong, J. Management of Urban Land Expansion in China through Intensity Assessment: A Big Data Perspective. J. Clean. Prod. 2017, 153, 637–647. [Google Scholar] [CrossRef]
- Erb, K.-H.; Haberl, H.; Jepsen, M.R.; Kuemmerle, T.; Lindner, M.; Müller, D.; Verburg, P.H.; Reenberg, A. A Conceptual Framework for Analysing and Measuring Land-Use Intensity. Curr. Opin. Environ. Sustain. 2013, 5, 464–470. [Google Scholar] [CrossRef] [Green Version]
- Chen, Y.; Chen, Z.; Xu, G.; Tian, Z. Built-up Land Efficiency in Urban China: Insights from the General Land Use Plan (2006–2020). Habitat Int. 2016, 51, 31–38. [Google Scholar] [CrossRef]
- Ye, Y.; Li, D.; Liu, X. How Block Density and Typology Affect Urban Vitality: An Exploratory Analysis in Shenzhen, China. Urban Geogr. 2018, 39, 631–652. [Google Scholar] [CrossRef]
- Zhang, P.; Yang, D.; Qin, M.; Jing, W. Spatial Heterogeneity Analysis and Driving Forces Exploring of Built-up Land Development Intensity in Chinese Prefecture-Level Cities and Implications for Future Urban Land Intensive Use. Land Use Policy 2020, 99, 104958. [Google Scholar] [CrossRef]
- Zhong, T.; Qian, Z.; Huang, X.; Zhao, Y.; Zhou, Y.; Zhao, Z. Impact of the Top-down Quota-Oriented Farmland Preservation Planning on the Change of Urban Land-Use Intensity in China. Habitat Int. 2018, 77, 71–79. [Google Scholar] [CrossRef]
- Wang, L.; Zhang, S.; Tang, L.; Lu, Y.; Liu, Y.; Liu, Y. Optimizing Distribution of Urban Land on the Basis of Urban Land Use Intensity at Prefectural City Scale in Mainland China. Land Use Policy 2022, 115, 106037. [Google Scholar] [CrossRef]
- Sun, Y.; Zhao, S.; Qu, W. Quantifying Spatiotemporal Patterns of Urban Expansion in Three Capital Cities in Northeast China over the Past Three Decades Using Satellite Data Sets. Environ. Earth Sci. 2015, 73, 7221–7235. [Google Scholar] [CrossRef]
- Li, Z.; Luan, W.; Zhang, Z.; Su, M. Relationship between Urban Construction Land Expansion and Population/Economic Growth in Liaoning Province, China. Land Use Policy 2020, 99, 105022. [Google Scholar] [CrossRef]
- Zhao, Z.; Sharifi, A.; Dong, X.; Shen, L.; He, B.-J. Spatial Variability and Temporal Heterogeneity of Surface Urban Heat Island Patterns and the Suitability of Local Climate Zones for Land Surface Temperature Characterization. Remote Sens. 2021, 13, 4338. [Google Scholar] [CrossRef]
- Gong, P.; Chen, B.; Li, X.; Liu, H.; Wang, J.; Bai, Y.; Chen, J.; Chen, X.; Fang, L.; Feng, S.; et al. Mapping Essential Urban Land Use Categories in China (EULUC-China): Preliminary Results for 2018. Sci. Bull. 2020, 65, 182–187. [Google Scholar] [CrossRef] [Green Version]
- Anselin, L. Local Indicators of Spatial Association—LISA. Geogr. Anal. 1995, 27, 93–115. [Google Scholar] [CrossRef]
- Wu, J.; He, H.; Hu, T. Analysis of Factors Influencing the “Source-Sink” Landscape Contribution of Land Surface Temperature. Dili Xuebao/Acta Geogr. Sin. 2022, 77, 51–65. [Google Scholar] [CrossRef]
- Di Franco, G. Multiple Correspondence Analysis: One Only or Several Techniques? Qual. Quant. 2016, 50, 1299–1315. [Google Scholar] [CrossRef]
- González, M.C.; Hidalgo, C.A.; Barabási, A.-L. Understanding Individual Human Mobility Patterns. Nature 2008, 453, 779–782. [Google Scholar] [CrossRef]
- Song, C.; Qu, Z.; Blumm, N.; Barabási, A.-L. Limits of Predictability in Human Mobility. Science 2010, 327, 1018–1021. [Google Scholar] [CrossRef] [Green Version]
- Lu, X.; Wetter, E.; Bharti, N.; Tatem, A.J.; Bengtsson, L. Approaching the Limit of Predictability in Human Mobility. Sci. Rep. 2013, 3, 2923. [Google Scholar] [CrossRef] [Green Version]
- Zhao, P.; Hu, H. Geographical Patterns of Traffic Congestion in Growing Megacities: Big Data Analytics from Beijing. Cities 2019, 92, 164–174. [Google Scholar] [CrossRef]
- Brum-Bastos, V.S.; Long, J.A.; Demšar, U. Weather Effects on Human Mobility: A Study Using Multi-Channel Sequence Analysis. Comput. Environ. Urban Syst. 2018, 71, 131–152. [Google Scholar] [CrossRef]
- Zhang, X.; Li, N. Characterizing Individual Mobility Perturbations in Cities during Extreme Weather Events. Int. J. Disaster Risk Reduct. 2022, 72, 102849. [Google Scholar] [CrossRef]
- Williams, S.; Xu, W.; Tan, S.B.; Foster, M.J.; Chen, C. Ghost Cities of China: Identifying Urban Vacancy through Social Media Data. Cities 2019, 94, 275–285. [Google Scholar] [CrossRef]
- Chen, M.; Liu, W.; Lu, D. Challenges and the Way Forward in China’s New-Type Urbanization. Land Use Policy 2016, 55, 334–339. [Google Scholar] [CrossRef]
- Li, G.; Li, F. Urban Sprawl in China: Differences and Socioeconomic Drivers. Sci. Total Environ. 2019, 673, 367–377. [Google Scholar] [CrossRef]
- Liu, Z.; Liu, S.; Qi, W.; Jin, H. Urban Sprawl among Chinese Cities of Different Population Sizes. Habitat Int. 2018, 79, 89–98. [Google Scholar] [CrossRef]
- Yu, H.; Yang, J.; Li, T.; Jin, Y.; Sun, D. Morphological and Functional Polycentric Structure Assessment of Megacity: An Integrated Approach with Spatial Distribution and Interaction. Sustain. Cities Soc. 2022, 80, 103800. [Google Scholar] [CrossRef]
- Lan, F.; Gong, X.; Da, H.; Wen, H. How Do Population Inflow and Social Infrastructure Affect Urban Vitality? Evidence from 35 Large- and Medium-Sized Cities in China. Cities 2020, 100, 102454. [Google Scholar] [CrossRef]
- Cai, Z.; Liu, Q.; Cao, S. Real Estate Supports Rapid Development of China’s Urbanization. Land Use Policy 2020, 95, 104582. [Google Scholar] [CrossRef]
- Zhou, D.; Li, Z.; Wang, S.; Tian, Y.; Zhang, Y.; Jiang, G. How Does the Newly Urban Residential Built-up Density Differ across Chinese Cities under Rapid Urban Expansion? Evidence from Residential FAR and Statistical Data from 2007 to 2016. Land Use Policy 2021, 104, 105365. [Google Scholar] [CrossRef]
- Brueckner, J.K. Urban Sprawl: Diagnosis and Remedies. Int. Reg. Sci. Rev. 2000, 23, 160–171. [Google Scholar] [CrossRef]
- Yue, W.; Zhang, L.; Liu, Y. Measuring Sprawl in Large Chinese Cities along the Yangtze River via Combined Single and Multidimensional Metrics. Habitat Int. 2016, 57, 43–52. [Google Scholar] [CrossRef]
- Sevtsuk, A.; Ratti, C. Does Urban Mobility Have a Daily Routine? Learning from the Aggregate Data of Mobile Networks. J. Urban Technol. 2010, 17, 41–60. [Google Scholar] [CrossRef]
- Monsivais, D.; Ghosh, A.; Bhattacharya, K.; Dunbar, R.I.M.; Kaski, K. Tracking Urban Human Activity from Mobile Phone Calling Patterns. PLOS Comput. Biol. 2017, 13, e1005824. [Google Scholar] [CrossRef] [PubMed]
Figure 1.
Research area.

Figure 2.
24 h population source-sink changes.

Figure 3.
Distribution of population source-sink at different dates and time periods.

Figure 4.
The global Moran’s I between the population source-sink and urban land use intensity in the morning peak.
Figure 4.
The global Moran’s I between the population source-sink and urban land use intensity in the morning peak.

Figure 5.
LISA between population source-sink and urban land use intensity in four days.
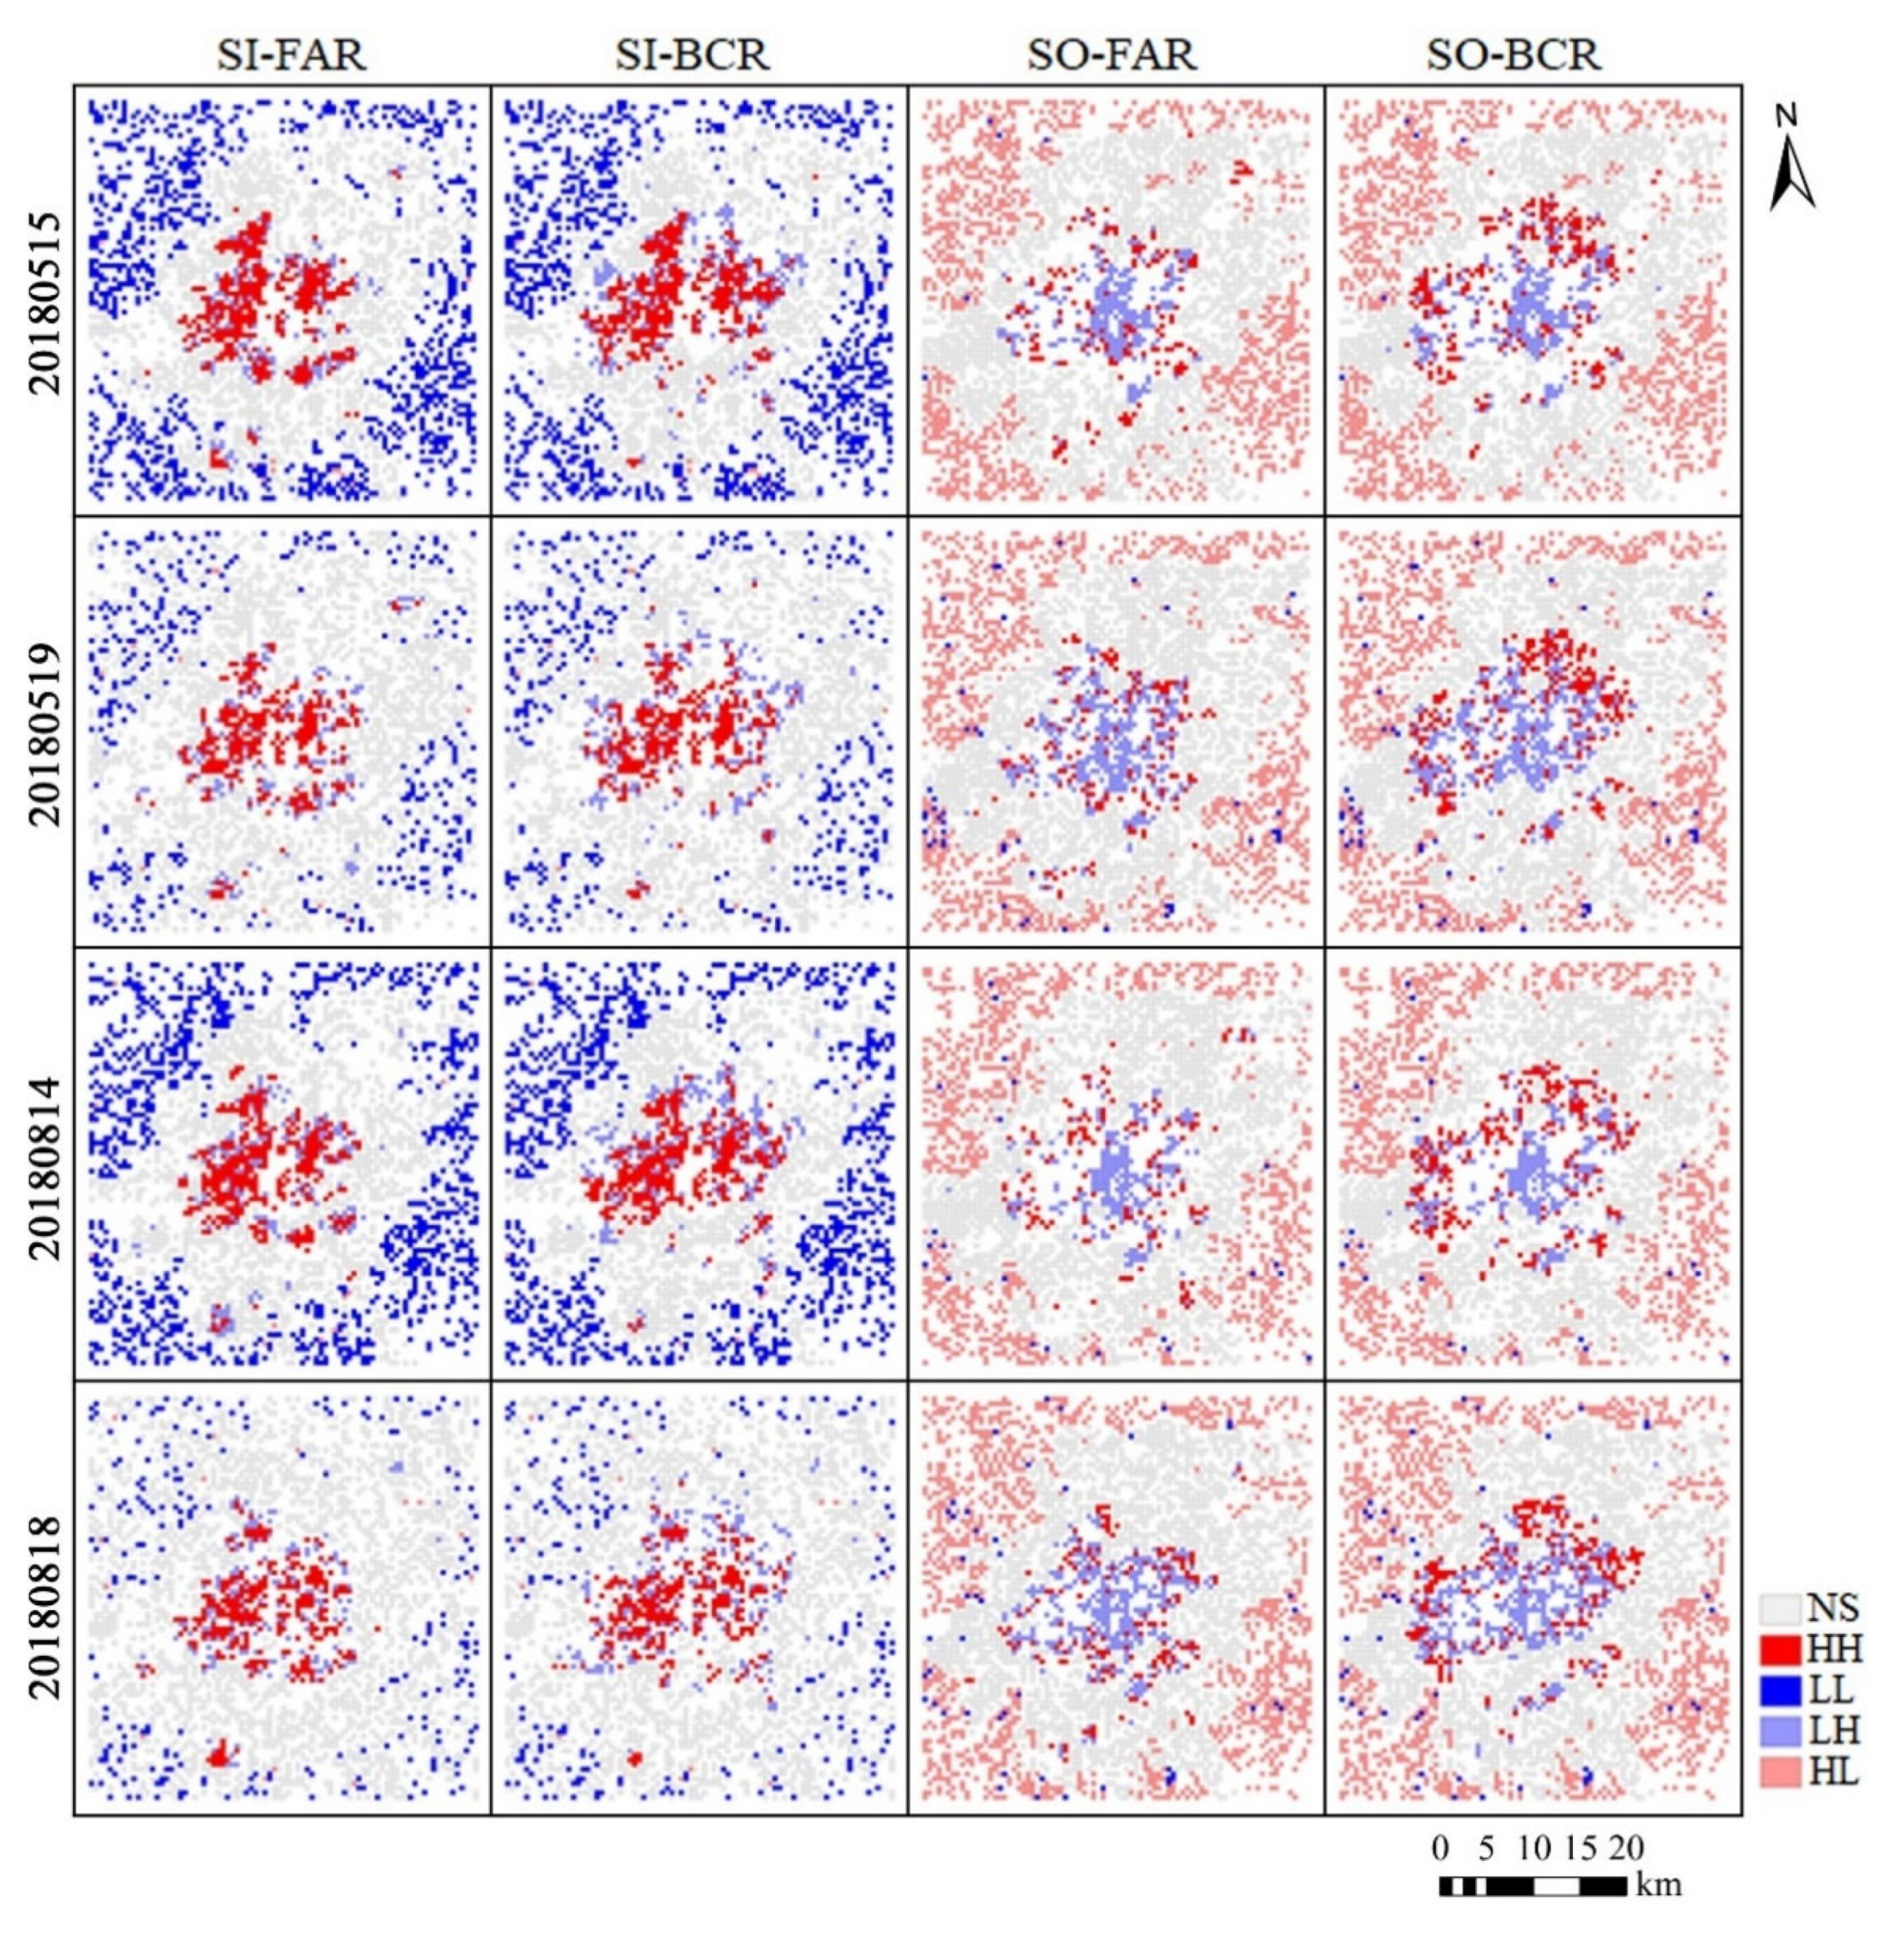
Figure 6.
(A) The proportion of LISA results in each ring road, R1–R5 are different urban ring road enclosures. (B) The proportion of each land type in LISA results, 0–6 are land use types, see Table 3 for specific explanations.
Figure 6.
(A) The proportion of LISA results in each ring road, R1–R5 are different urban ring road enclosures. (B) The proportion of each land type in LISA results, 0–6 are land use types, see Table 3 for specific explanations.

Figure 7.
(A) Correspondence analysis between sink LISA results and different ring road regions, (B) correspondence analysis between source LISA results and different ring road regions, (C) correspondence analysis between sink LISA results and land use types, (D) correspondence analysis between source LISA results and land use types, (E) multiple correspondence analysis of different ring road regions, and (F) multiple correspondence analysis of land use types.

Figure 8.
20180515 Spatial mismatch area between population source-sink and FAR.

Table 1.
Data sources and information.
| Data Source and Description | Time | Spatial Resolution | Usage | |
|---|---|---|---|---|
| Mobile phone signaling data | China Unicom Smart Steps (http://www.smartsteps.com/) accessed on 13 December 2018 | 2018 | 500 m | Calculate population source-sink value |
| Building data/urban road data | AutoNavi map (https://www.amap.com/) accessed on 15 December 2020 | 2019 | vector data | Calculate FAR and BCR |
| Land use data | ELUC-China/FROM-GLC10 (http://data.ess.tsinghua.edu.cn/) accessed on 1 March 2020 | 2018 | 10 m | Land use types |
| Historical Weather Data | Envicloud (http://www.envicloud.cn/) accessed on 3 March 2021 | 2018 | hourly/daily | Weather |
Table 2.
Four-day basic information.
| Date | Day | Weather | Rainfall (mm) | Temperature Average (°C) | Influence of Special Events |
|---|---|---|---|---|---|
| 20180515 | Tuesday | No rain | 0 | 20.55 | No |
| 20180519 | Saturday | No rain | 0 | 21.45 | No |
| 20180814 | Tuesday | Moderate rain | 17.80 | 24.01 | No |
| 20180818 | Saturday | Moderate rain | 10.20 | 21.85 | No |
Table 3.
Categorical variables and assignment in correspondence analysis/multiple correspondence analysis.
Table 3.
Categorical variables and assignment in correspondence analysis/multiple correspondence analysis.
| Variables | Assignment |
|---|---|
| LISA | 1 = HH, 2 = LL, 3 = LH, 4 = HL, 5 = NS |
| SI/SO | 1 = Sink, 2 = Source |
| FAR/BCR | 1 = FAR, 2 = BCR |
| Road 1 | 1 = R1, 2 = R2, 3 = R3, 4 = R4, 5 = R5 |
| LU (Land use type) | 1 = Residential, 2 = Commercial, 3 = Industrial, 4 = Transportation, 5 = Public management and service, 6 = Other |
| Weather | 1 = No rain, 2 = Rain |
| Day | 1 = Weekday, 2 = Weekend |
| Time | 1 = Midnight, 2 = Morning Peak, 3 = Noon, 4 = Late Peak |
1 R1 represents the first urban circle area, R2 represents the area between the first ring and the second ring, R3 represents the area between the second ring and the third ring, R4 represents the area between the third ring and the fourth ring, R5 refers to the area outside the fourth ring.
Table 4.
Bivariate global Moran’s I between population source-sink and urban land use intensity, p-value = 0.001.
Table 4.
Bivariate global Moran’s I between population source-sink and urban land use intensity, p-value = 0.001.
| Types | Midnight | Morning Peak | Noon | Late Peak | 24 h | ||||||
|---|---|---|---|---|---|---|---|---|---|---|---|
| FAR | BCR | FAR | BCR | FAR | BCR | FAR | BCR | FAR | BCR | ||
| 2018 0515 | Sink | 0.375 | 0.364 | 0.500 | 0.358 | 0.390 | 0.308 | 0.486 | 0.469 | 0.414 | 0.358 |
| Source | −0.344 | −0.274 | −0.462 | −0.461 | −0.345 | −0.276 | −0.463 | −0.322 | −0.352 | −0.254 | |
| 2018 0519 | Sink | 0.391 | 0.377 | 0.460 | 0.352 | 0.292 | 0.229 | 0.456 | 0.446 | 0.323 | 0.277 |
| Source | −0.425 | −0.335 | −0.457 | −0.459 | −0.351 | −0.316 | −0.395 | −0.296 | −0.268 | −0.220 | |
| 2018 0814 | Sink | 0.338 | 0.346 | 0.504 | 0.350 | 0.328 | 0.256 | 0.503 | 0.469 | 0.327 | 0.271 |
| Source | −0.320 | −0.265 | −0.482 | −0.476 | −0.336 | −0.286 | −0.467 | −0.334 | −0.372 | −0.267 | |
| 2018 0818 | Sink | 0.378 | 0.387 | 0.479 | 0.357 | 0.315 | 0.237 | 0.468 | 0.461 | 0.316 | 0.259 |
| Source | −0.402 | −0.310 | −0.464 | −0.454 | −0.381 | −0.330 | −0.400 | −0.293 | −0.251 | −0.221 | |
Publisher’s Note: MDPI stays neutral with regard to jurisdictional claims in published maps and institutional affiliations. |
© 2022 by the authors. Licensee MDPI, Basel, Switzerland. This article is an open access article distributed under the terms and conditions of the Creative Commons Attribution (CC BY) license (https://creativecommons.org/licenses/by/4.0/).
Share and Cite
MDPI and ACS Style
Li, T.; Xiu, C.; Yu, H. Urban Human-Land Spatial Mismatch Analysis from a Source-Sink Perspective with ICT Support. ISPRS Int. J. Geo-Inf. 2022, 11, 575. https://doi.org/10.3390/ijgi11110575
AMA Style
Li T, Xiu C, Yu H. Urban Human-Land Spatial Mismatch Analysis from a Source-Sink Perspective with ICT Support. ISPRS International Journal of Geo-Information. 2022; 11(11):575. https://doi.org/10.3390/ijgi11110575
Chicago/Turabian StyleLi, Tong, Chunliang Xiu, and Huisheng Yu. 2022. "Urban Human-Land Spatial Mismatch Analysis from a Source-Sink Perspective with ICT Support" ISPRS International Journal of Geo-Information 11, no. 11: 575. https://doi.org/10.3390/ijgi11110575
Note that from the first issue of 2016, this journal uses article numbers instead of page numbers. See further details here.