Article

GIS-Based Spatial and Multi-Criteria Assessment of Riverine Flood Potential: A Case Study of the Nitra River Basin, Slovakia

1
Department of Geography and Regional Development, Faculty of Natural Sciences, Constantine the Philosopher University in Nitra, Trieda A. Hlinku 1, 94901 Nitra, Slovakia
2
Institute of Applied Technology, Thu Dau Mot University, Thu Dau Mot City 75000, Vietnam
*
Author to whom correspondence should be addressed.
ISPRS Int. J. Geo-Inf. 2021, 10(9), 578; https://doi.org/10.3390/ijgi10090578
Submission received: 30 June 2021 / Revised: 19 August 2021 / Accepted: 26 August 2021 / Published: 27 August 2021
(This article belongs to the Special Issue GIScience for Risk Management in Big Data Era)

Abstract

:
The aim of this study was to identify the areas with different levels of riverine flood potential (RFP) in the Nitra river basin, Slovakia, using multi-criteria evaluation (MCE)-analytical hierarchical process (AHP), geographic information systems (GIS), and seven flood conditioning factors. The RFP in the Nitra river basin had not yet been assessed through MCE-AHP. Therefore, the methodology used can be useful, especially in terms of the preliminary flood risk assessment required by the EU Floods Directive. The results showed that classification techniques of natural breaks (Jenks), equal interval, quantile, and geometric interval classified 32.03%, 29.90%, 41.84%, and 53.52% of the basin, respectively, into high and very high RFP while 87.38%, 87.38%, 96.21%, and 98.73% of flood validation events, respectively, corresponded to high and very high RFP. A single-parameter sensitivity analysis of factor weights was performed in order to derive the effective weights, which were used to calculate the revised riverine flood potential (RRFP). In general, the differences between the RFP and RRFP can be interpreted as an underestimation of the share of high and very high RFP as well as the share of flood events in these classes within the RFP assessment. Therefore, the RRFP is recommended for the assessment of riverine flood potential in the Nitra river basin.

1. Introduction

In recent decades, the frequency and magnitude of floods as well as flood damage have been increasing, which is mainly caused by the impacts of various human activities [1,2]. On the other hand, the vulnerability of society to floods is being influenced mainly by population growth and related economic activities. Thus, flood protection, integrated flood risk management, mitigation, and coping with floods or adaption to floods are highly topical issues which have also been addressed by governments all over the world. In the EU, the importance of flood potential mapping is indirectly incorporated into the preliminary flood risk assessment (EU Floods Directive 2007/60/EC [3]), which is legally binding for all member countries and should be updated and revised in six-year cycles starting from 2011. The objective of the preliminary flood risk assessment is to identify areas with potentially significant flood risk or where floods are likely to occur. In Slovakia, this task was implemented by the Ministry of Environment of the Slovak Republic in 2011 and 2018 [4,5]. While in the first cycle (2011) no flood potential mapping procedure was taken into account, in the next cycle (2018), the work by Minár et al. [6] was incorporated into assessments.
The term flood potential, also referred to as flood susceptibility [7], is understood as an expression of the potential of flooding resulting from the physical-geographical configuration of the landscape and associated land use/cover characteristics without considering flow or precipitation quantitative information [6,7,8]. The notion of the term flood potential thus differs from the term flood hazard. Flood hazard also incorporates the probability of flood occurrence expressed by the design discharges with different return periods as well as defining flood prone areas in terms of flood extent, flow depth, or flow velocity [9].
Flood potential assessment is based on the selection of flood conditioning (influencing) factors, which define the propensity of a given area to be flooded, as well as preparation of a flood inventory database [10]. In particular, the flood conditioning factors may include various physical-geographical factors, such as morphometric (terrain) characteristics defined by elevation, slope, aspect, or other terrain-derived attributes (e.g., topographic wetness index or topographic roughness index). The mentioned morphometric factors influence the surface runoff processes in the basin. In general, with increasing slope degree, surface runoff from the basin accelerates, which subsequently leads to an increase in peak flows [11]. Moreover, as the elevation increases, the amount of precipitation and thus the potential for flood water accumulation generally increases. The hydrography factors are defined, for example, by river network density or distance to rivers. It is generally valid that the higher the river network density or the closer the distance to a river, the higher the flood potential. As for the permeability factors, such as soil texture, lithology, or land use/land cover, they influence the absorption and retention capabilities of the basin, which subsequently influence the runoff [12,13]. For example, clay soils decrease the absorption of water into deeper horizons while sandy soils are highly permeable. Similarly, for example, flysch rocks have low permeability in comparison to various quaternary sediments (gravel or sandstones) or limestones and dolomites [14]. In case of land use/land cover classes, built-up areas, asphalt roads, and other impervious areas usually cause high surface runoff while forests or grasslands are capable of absorbing much more rainwater than impervious areas, thus decreasing the surface runoff [15,16].
The role of geographic information systems (GIS) is inevitable, especially, in processing and synthesizing the selected flood conditioning factors, preparing flood inventory data, and computing and visualizing the flood potential map [17,18,19,20]. Different methods have been applied to identify the areas with different level of flood potential. Moreover, they have been applied in diverse regions as well as at various spatial scales from local [21] to global [22].
Multi-criteria evaluation (MCE) or multi-criteria decision analysis (MCDA) represents a widely used knowledge-based method for susceptibility mapping of different natural hazards [23]. When evaluating the multiple criteria, different approaches can be used to create weights of the criteria (factors). One of the preferred techniques is the acquisition of expert views who may, subsequently, use different weighing methods, such as the ranking method, the point distribution method, or the paired comparison method, to express the relative importance of selected criteria (i.e., floods conditioning factors) [18,24]. Based on a literature analysis, the most widely used methods of multi-criteria flood potential assessment are the analytical hierarchical process (AHP) [25,26,27], weighted linear combination (WLC) [28,29], analytical network process (ANP) [30,31], VIseKriterijumska Optimizacija I Kompromisno Resenje (VIKOR), or Technique for Order of Preference by Similarity to Ideal Solution (TOPSIS) [32]. A comprehensive review of MCDA applications in water-related natural hazards and assessments, including the flood susceptibility, is provided in a very recent study by Abdullah et al. [33], who also analyzed strengths and weaknesses of various MCDA techniques.
Several studies have dealt with the comparison or combination of MCDA with other methods for identifying flood potential in order to find the most appropriate one. In particular, Tabarestani and Afzalimehr [34] compared and combined AHP, TOPSIS, and Attributive Border Approximation Area Comparison (MABAC) with weights of evidence (WOE) in Babolroud Watershed, Iran. Khosravi et al. [32] compared VIKOR, TOPSIS, and simple additive weighting (SAW) along with Naive Bayes (NB) and Naive Bayes Tree (NBT) models in Ningdu catchment, China, and in another study, Khosravi et al. (2016) compared FR, WOE, AHP, and a combination of FR–AHP in Haraz watershed, Iran. Arabameri et al. [35] compared evidential belief function (EBF), frequency ratio (FR), TOPSIS, and VIKOR in Kiasar watershed, Iran. Furthermore, Ali et al. [36] compared decision-making trial and evaluation laboratory (DEMATEL)–ANP with FR, statistical index (SI), NBT, and logistic regression (LR) in the Topľa river basin, Slovakia.
In addition, it should be noted that the above MCDA techniques for mapping flood potential (flood susceptibility) have been used in different areas and spatial scales. The flood potential assessment at the local spatial scale is represented, for example, by the work of Santagnelo et al. [37] or Rahmati et al. [38]. Most of the works deal with flood potential at a regional spatial scale, such as Termeh et al. [39], Chapi et al. [40], Haghizadeh et al. [41], Bui et al. [42], and Das and Gupta [43]. In case of the national spatial scale, the flood potential was studied, for example, by Minár et al. [6], Jacinto et al. [8], Kourgialis and Karatzas [44], Zhao et al. [45], and Santos et al. [19]. Flood potential at the global spatial scale was studied, for example, by Li et al. [22].
This study aims to identify areas with different riverine flood potential using GIS-based spatial and multi-criteria evaluation, namely the AHP technique, at regional spatial scale represented by the Nitra river basin, Slovakia. The riverine flood potential in the Nitra river basin has not yet been assessed through MCE-AHP. Therefore, the methodology used can be considered innovative, especially in terms of the preliminary flood risk assessment (EU Floods Directive 2007/60/EC [3]) in this basin. The approach used in this study is different in respect to the work of Minár et al. [6], which was partly used in the last update of the preliminary flood risk assessment in Slovakia in 2018. In particular, the authors analyzed flood potential at a national scale using more generalized input data than in this study and without any validation of the results. The presented approach is thus proposed to be incorporated in the next preliminary flood risk assessment in principal basins of Slovakia in 2024.
The structure of the article is as follows. A brief explanation of the term flood potential/susceptibility, short description of flood conditioning factors, and a review of applications of MCE/MCDA in flood susceptibility studies is presented in the Introduction section. The next section, Material and Methods, deals first with the description of the selected study area—Nitra river basin. Then, it presents the methodological workflow applied in this study as well as input data and methods of their processing. It follows with a description of the multi-criteria evaluation—AHP, determination of riverine flood potential (RFP), sensitivity analysis of factor weights, and determination of the revised riverine flood potential (RRFP). In the Results and Discussion section, the article focuses on the RFP obtained by four classification techniques, the validation of RFP maps, the sensitivity analysis, and the analysis of RRFP. The last section Limitations and Conclusion deals with the limitations in the presented methodology and data while the concluding part summarizes the main findings and highlights future research directions in the studied topic.

2. Materials and Methods
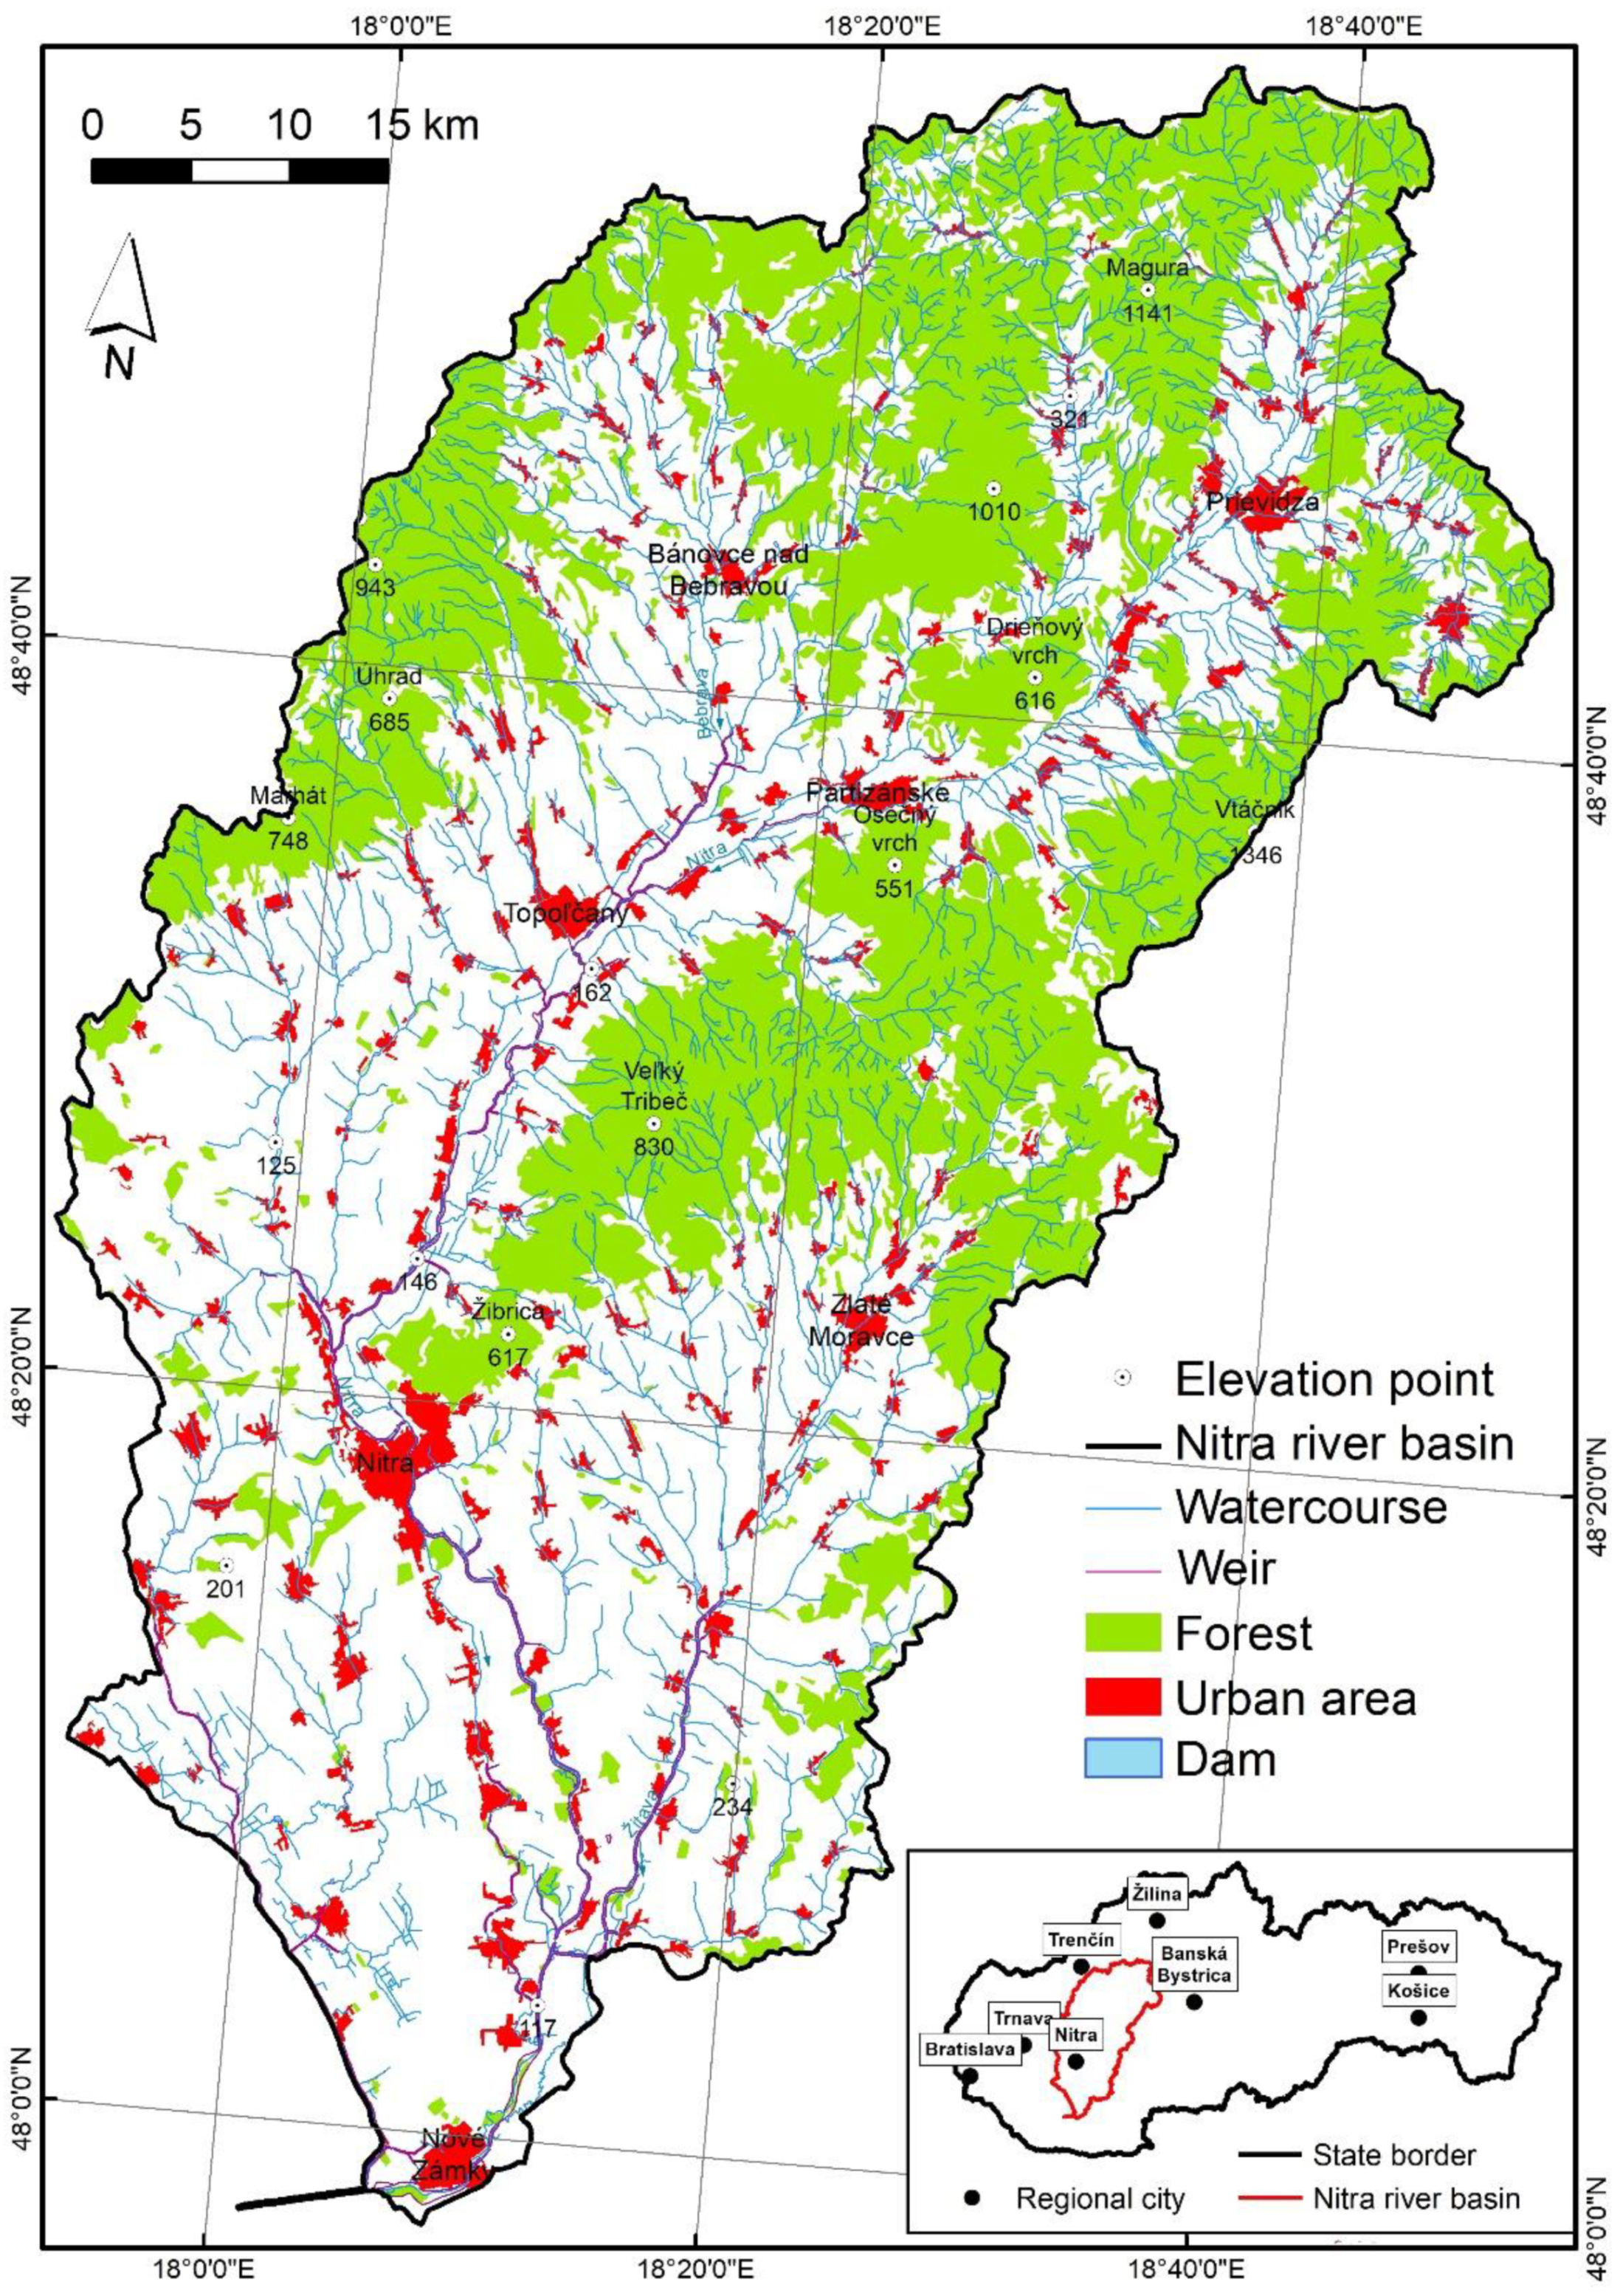
2.1. Stury Area

The study area is represented by the Nitra river basin (Figure 1), which covers an area of 4488 km2. The Nitra river springs in the Malá Fatra mountain under the Reváň peak (1205 m) at an elevation of approximately 770 m and creates a left-sided tributary of the Váh river. The total length of the Nitra river is 167 km. The left-sided tributaries include, for example, Handlovka river and Vyčoma river while the right-sided tributaries are, for example, Bebrava river, Radošinka river, Nitrica river, and Dlhý kanál river.
There are more than 100 dams in the basin, of which the major ones include, for example, Nitrianske Rudno, Slepčany, Golianovo, Prusy, Vráble, Rastislavice, Čifáre, Trávnica, Veľké Uherce, and so on. Major weirs higher than 10 m were built mostly along the lower reaches of the Nitra river, Žitava river, and Bebrava river.
The geographic coordinates of the study area are as follows: northernmost point 48°58′ N and 18°34′ E; southernmost point 47°57′ N and 18°08′ E; westernmost point 48°09′ N and 17°52′ E; easternmost point 48°44′ N and 18°49′ E.
The study area belongs to the following geomorphological units [46]: Podunajská rovina (plain), Podunajská pahorkatina (upland), Tribeč (mountain), Strážovské vrchy (mountain), Hornonitrianska kotlina (basin), Žiar (mountain), Považský Inovec (mountain), Vtáčnik (mountain), and a Pohronský Inovec (mountain). The highest point has an elevation of 1346 m and it is located on the eastern boundary of the study area in the Vtáčnik mountain. The lowest point is located in the river mouth (108 m).
Based on the administrative division of Slovakia, the study area is included in the Západné Slovensko (NUTS II), Trenčiansky kraj (NUTS III), Nitriansky kraj (NUTS III), and Trnavský kraj (NUTS III).
Regarding the occurrence of historical floods, the Nitra basin belongs to a highly vulnerable region. It is documented by many historical floods, which occurred in the study area. Riverine, flash, and pluvial floods are the most recurrent types of floods in the basin. For example, the floods in June 2010 represented a regional type of flood, which was triggered by long-lasting rainfall and there was subsequent typical occurrence of riverine floods on the Nitra river as well as its main and minor tributaries, such as Žitava, Bebrava, Handlovka, Vyčoma, Malá Nitra, Liska, Širočina, Drevenica, and so on. Another riverine flood occurred, for example, on the Bebrava river in April 2006 and on the Žitava river in April 2013, which affected the municipalities of Dolný Ohaj, Hul, and Uľany na Žitavou, and so on. A typical flash flood triggered by heavy and short rainfall occurred, for example, in June 2013 and July 2014 in the Uhrovec municipality (Radiša river), in June 2013 in the Valaská Belá municipality (Nitrica river), and in June 1999 in the Klátova Nová Ves municipality (Vyčoma river) and Oslany municipality (Osliansky potok stream) [5].

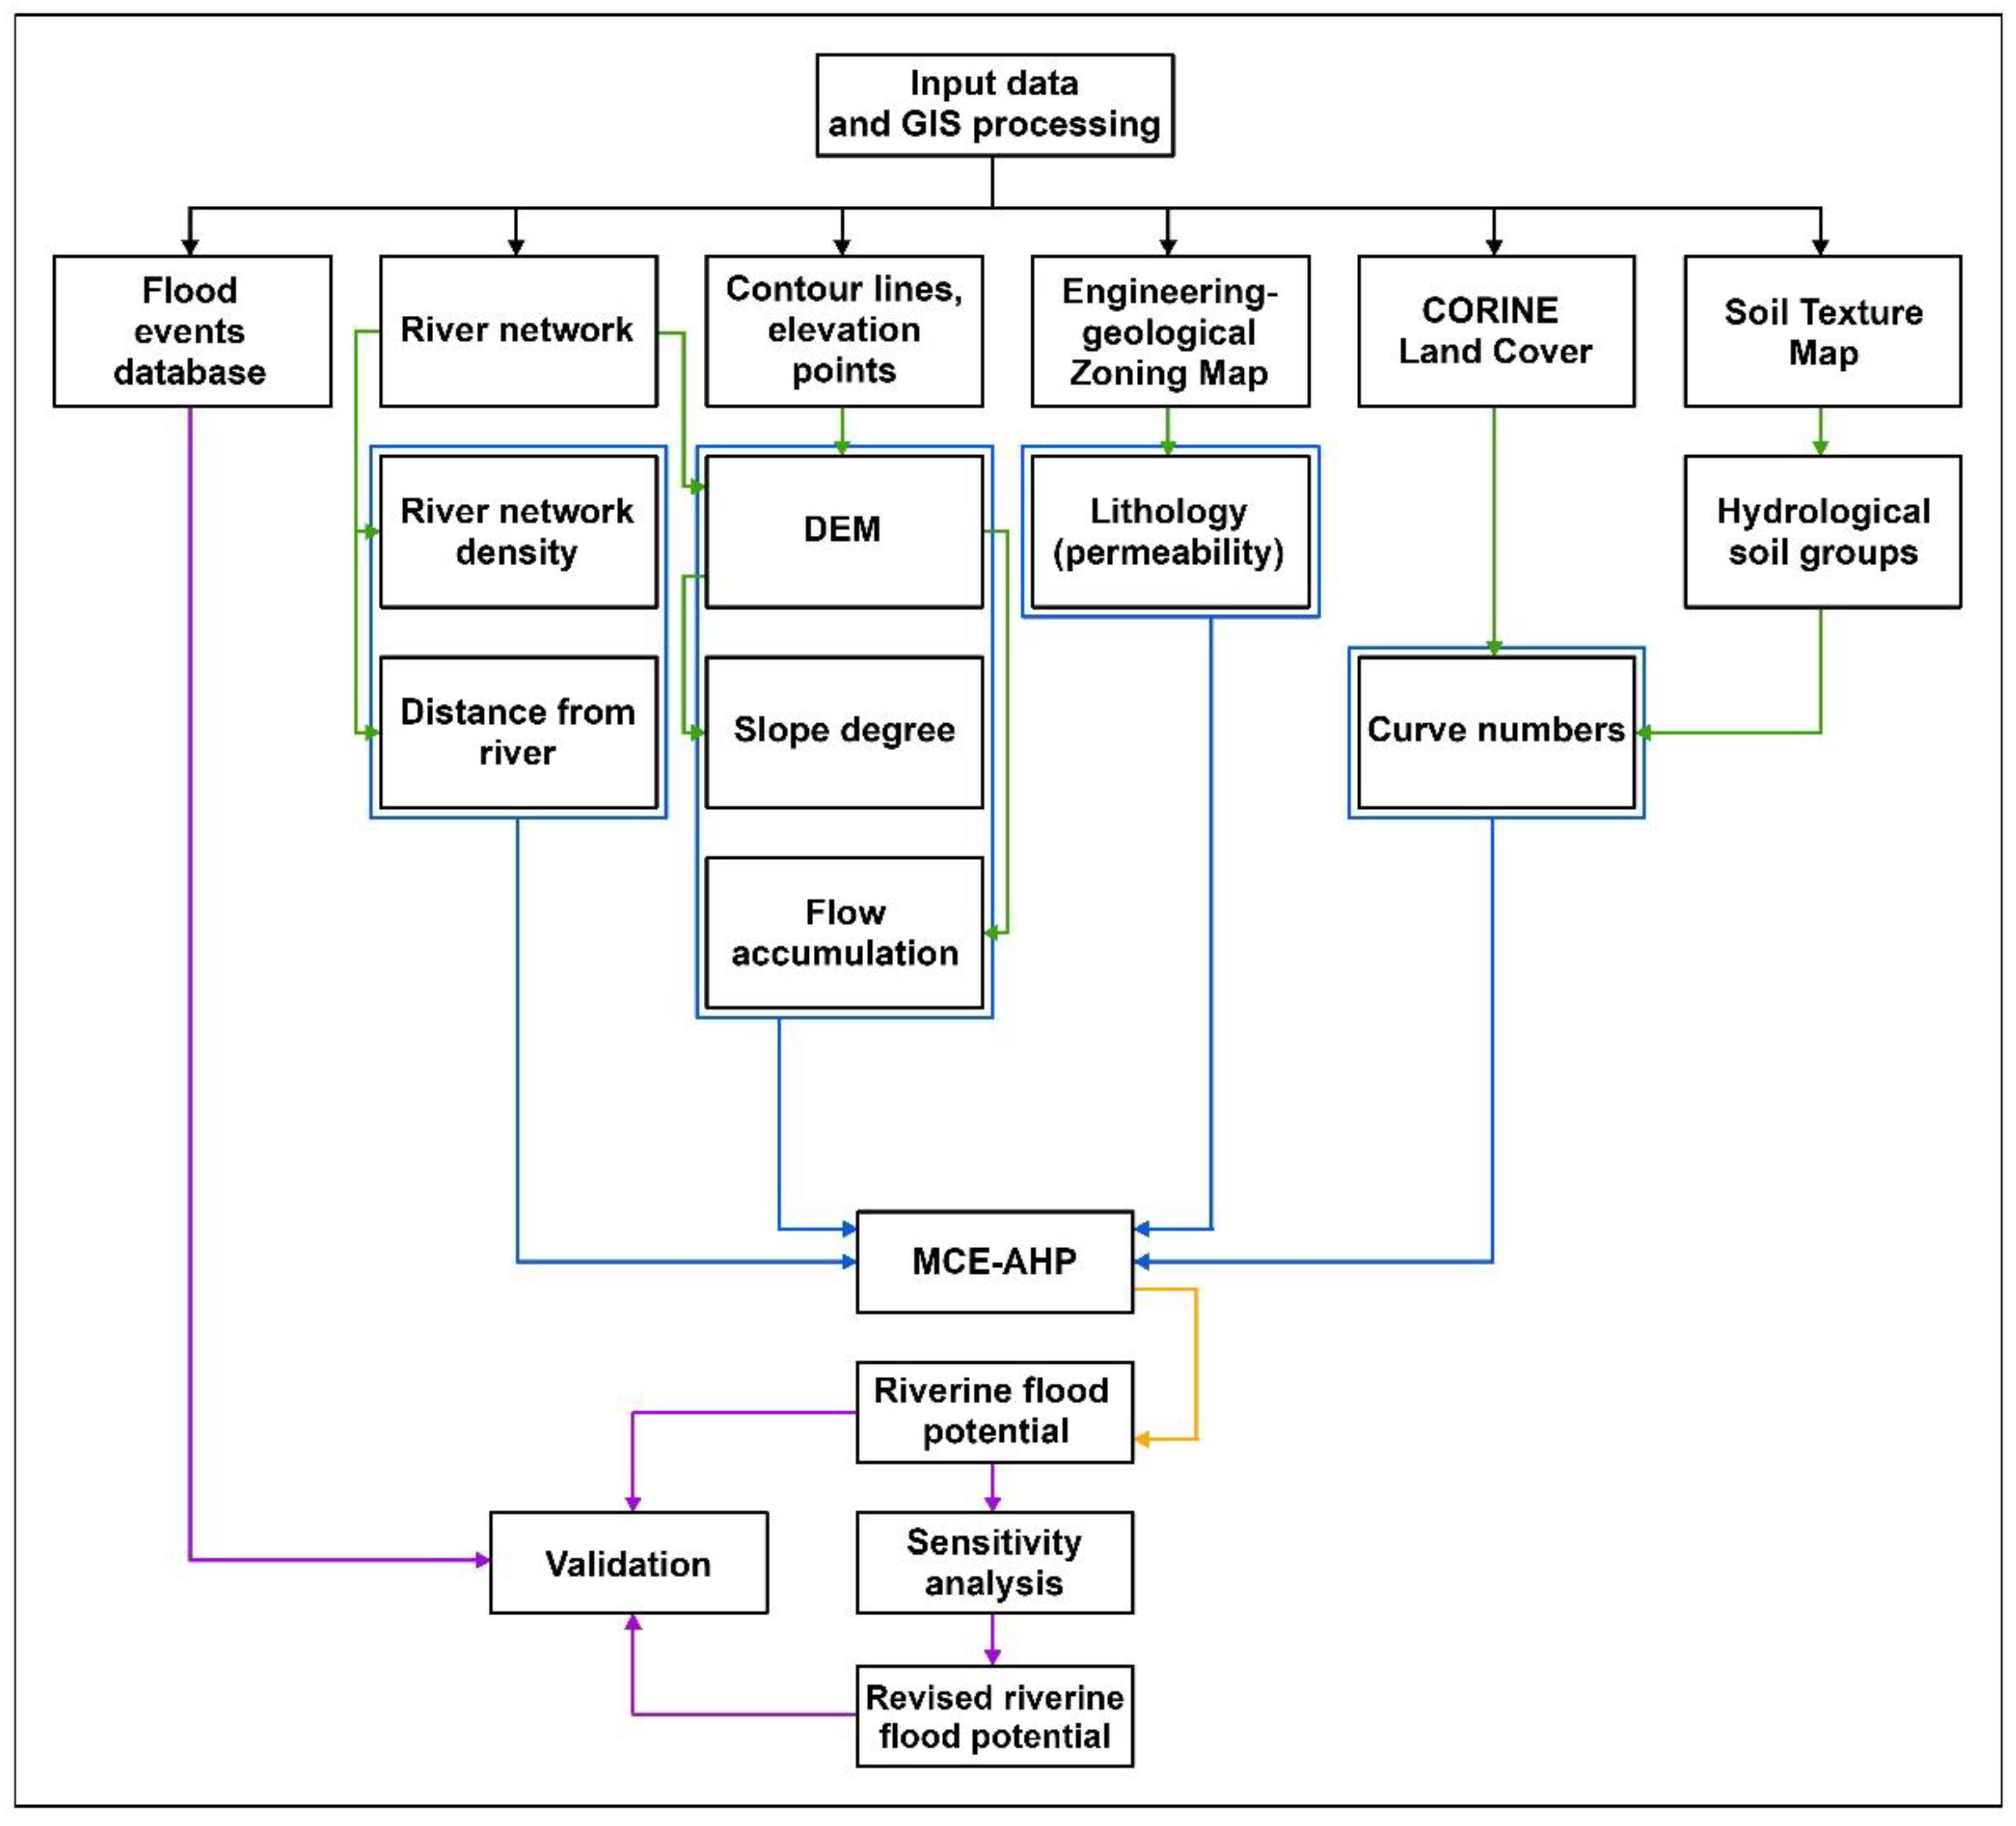
2.2. Methodological Workflow

The methodological procedure required the application of different data, methods, and specialized software. The methodological workflow used for determining the flood potential is presented in Figure 2. The main steps of the methodology applied were (i) creating a database of flood events, (ii) processing and reclassifying flood conditioning factors, (iii) using multi-criteria evaluation (AHP technique) to define the weights of individual factors, (iv) GIS-based modeling of the riverine flood potential using the weighted sum of factors, (v) validation of the resulting model using the GIS database of flood events, (vi) sensitivity analysis of factor weights, and (vii) determination of the revised riverine flood potential using the effective weights from the sensitivity analysis.
Altogether, seven relevant flood conditioning factors and flood inventory database were processed in GIS to derive the riverine flood potential map using a weighted sum of the selected flood conditioning factors. The resulting RFP map was classified with the use of four classification techniques (natural breaks, equal interval, quantile, and geometric interval) and validated by calculating the relative distribution of flood (validation) points in derived flood potential classes. Subsequently, the sensitivity analysis of factor weights was performed and the revised riverine flood potential, using the effective weights derived from the sensitivity analysis, was calculated. The RRFP map was classified with the use of the same four classification techniques and validated with the same flood validation locations.

2.3. Input Data and GIS Processing of Flood Conditioning Factors

In order to validate the results of flood potential modeling, a vector database of flood events was created in GIS. Information on the occurrence of floods was obtained from the documents of preliminary flood risk assessment (Ministry of the Environment of the Slovak Republic 2011, 2018 [4,5]), databases, and flood reports of the Slovak Water Management Enterprise and the Slovak Hydrometeorological Institute, available literature (particularly Solín [47]), and own records. A total of 317 flood events, corresponding to the period 1996–2017, were digitized and stored in a point vector layer using ArcGIS software.
Flood potential mapping is based on different flood conditioning factors which are processed in GIS based on different source data. The source data used for deriving the selected conditioning factors in this study are provided in Table 1.
In this case, seven flood conditioning factors were selected for deriving the flood potential map, particularly, morphometry: elevation and slope; hydrography: river network density and distance from river; permeability: curve number and lithology (degree of rock permeability); and hydrology: flow accumulation. The ArcGIS software was used for processing the selected flood conditioning factors. All seven conditioning factors were processed or, where necessary, converted from vector format into a raster format with spatial resolution of 25 × 25 m.
As for the elevation and slope maps, they were derived from the digital elevation model (DEM). The input data for creating the DEM were contour lines and elevation points from the vector topographic map at a scale of 1:50,000. The interpolation method for deriving hydrologically correct DEM was used (Figure S1a). The slope angle map was derived based on the DEM using the Slope tool available in ArcGIS software (Figure S1b).
The source data for creating the conditioning factors of river network density (Figure S2a) and distance from river (Figure S2b) was the river network from the vector topographic map at a scale of 1:50,000. Both maps were derived using the ArcGIS software, particularly the Line Density tool and Euclidean Distance tool for the map of river network density and map of distance from river, respectively. The factor of flow accumulation was derived based on the DEM and flow direction raster using Hydrology toolset in ArcGIS software (Figure S2c).
As for the creation of curve number map, the SCS-CN method was applied. In terms of this method, the map of hydrological soil groups (Figure S3a), map of land cover (Figure S3b), and official SCS-CN tables [48] were combined (Table S1) using the HEC-GeoHMS extension for ArcGIS software to derive the curve numbers (Figure S4a). Hydrological soil groups were derived from the vector Soil Texture Map at a scale of 1:500,000 [49] while the CORINE Land Cover vector layer from 2018 was used to derive the land cover in the study area. The lithology map (Figure S4b), defined by the degree of rock permeability according to the work of Hrnčiarová [50], was derived from the vector Engineering-geological Zoning Map at a scale of 1:500,000 [51]. The reclassification of this map into five classes was performed using Table S2.

2.4. Multi-Criteria Evaluation and Determination of Riverine Flood Potential

The multi-criteria evaluation was performed using the analytical hierarchy process (AHP) method, which was originally developed by Saaty [25]. The application of this method can be divided into the following steps:
(a)
Decomposing a complex unstructured problem into simpler hierarchical components.
(b)
Creating and rating the criteria (in this case factors) and alternatives. In this context, the selected flood conditioning factors were reclassified (rated) into five classes expressing their susceptibility to flooding using the following scale (Table 2): 5—very high, 4—high, 3—moderate, 2—low, and 1—very low. The reclassification of flood-conditioning rasters was based on different techniques. In case of the slope angles, the reclassification was based on the work of Demek [52]. The elevations were reclassified to three intervals based on the work of Lukniš [53]. Factors of distance from river and river network density were reclassified based on the natural breaks (Jenks) classification method. The flow accumulation raster was manually reclassified such that it best corresponded to the river network from the topographic map 1:50,000. The curve numbers were classified to intervals based on their runoff potential (Table 2).
(c)
Expert pair-wise comparison of the selected conditioning factors, where numerical values were assigned to each factor expressing its relative importance in relation to another factor (Table S3). In this sense, the nine-point continuous scale was used, as suggested by Saaty [25].
(d)
Synthesis of pair-wise evaluations to determine the most influencing factor. The synthesis was performed by normalizing the derived weights and their averaging using the eigenvalue technique [25,54], as shown in Table 3.
(e)
Calculation of consistency of the pair-wise evaluations using the consistency ratio (CR), which is defined by the following Equations (1) and (2) [25]:
C I = λ n n 1
where CI is the consistency index, n is the number of criteria (conditioning factors), and λ is the average value of the consistency vector.
C R = C I R I
where RI is the random index, which depends on the number of criteria (factors) being compared [25].
The value of the consistency ratio obtained in this study was 0.02, which fulfilled the consistency condition and the created matrix evaluations were thus consistent.
The computation of resulting riverine flood potential was performed in ArcGIS software using the weighted sum of the reclassified flood conditioning factors, which were multiplied with their weights (Equation (3)):
R F P = w i x i
where RFP is the riverine flood potential, wi is the weight of factor i, and xi is the reclassified class of each factor i.

2.5. Sensitivity Analysis of Factor Weights

The performed sensitivity analysis aims at assessing the influence of each factor on the AHP method used. As a result, the role of each factor in resulting riverine flood potential was investigated because of the subjective significance of the factors used, providing useful information on the influence of rating—weighting values assigned to each factor. We decided to perform a single-parameter analysis, which was firstly used by Napolitano and Fabbri [55] and later also in flood susceptibility studies, such as Kazakis et al. [56] and Hammani et al. [57]. In the performed sensitivity analysis, the initial arbitrary values of the factors were replaced with the so-called effective weights based on Equation (4).
E W = F r F w R F P · 100
where EW is the effective weight of each factor, Fr is the ratings of factor’s classes, Fw is the factor’s weight, and RFP is the riverine flood potential.
The effective weights were subsequently used to calculate the revised riverine flood potential (RRFP), which uses the same factors and class ratings as in RFP calculation, based on Equation (5).
R R F P = E W i x i
where RRFP is the revised riverine flood potential, EWi is the effective weight of factor i, and xi is the reclassified class of each factor i.

3. Results and Discussion

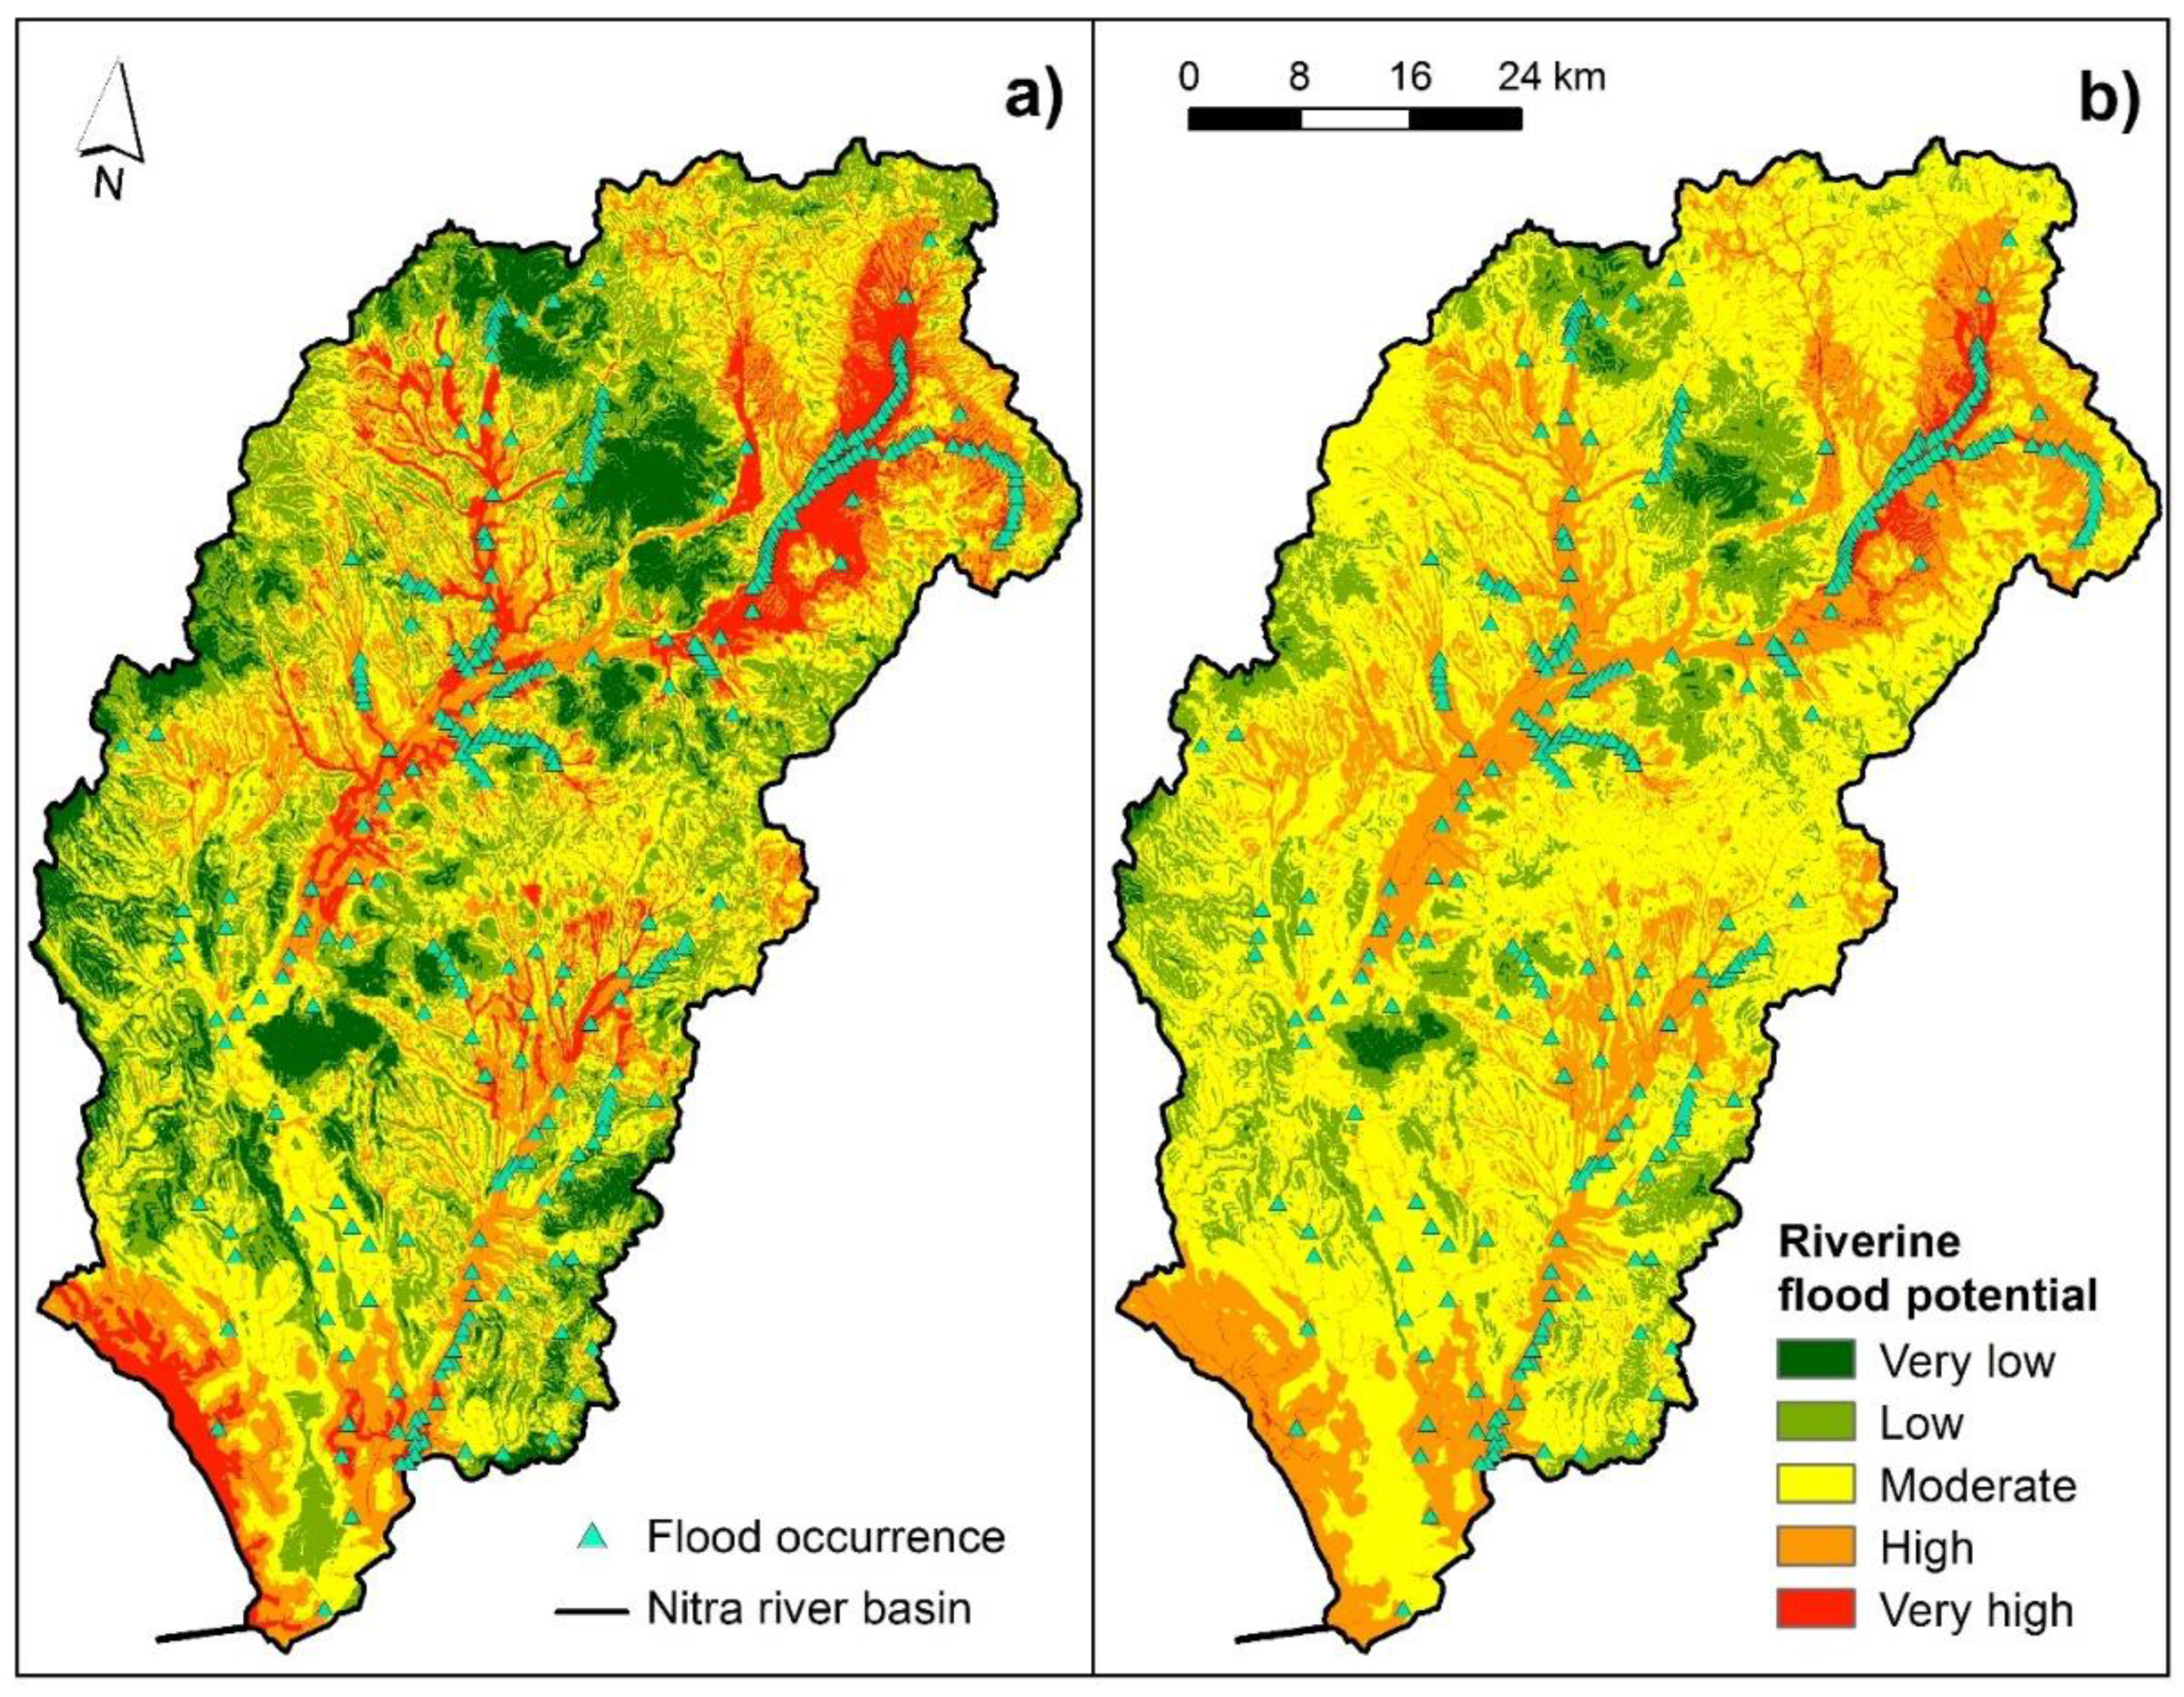
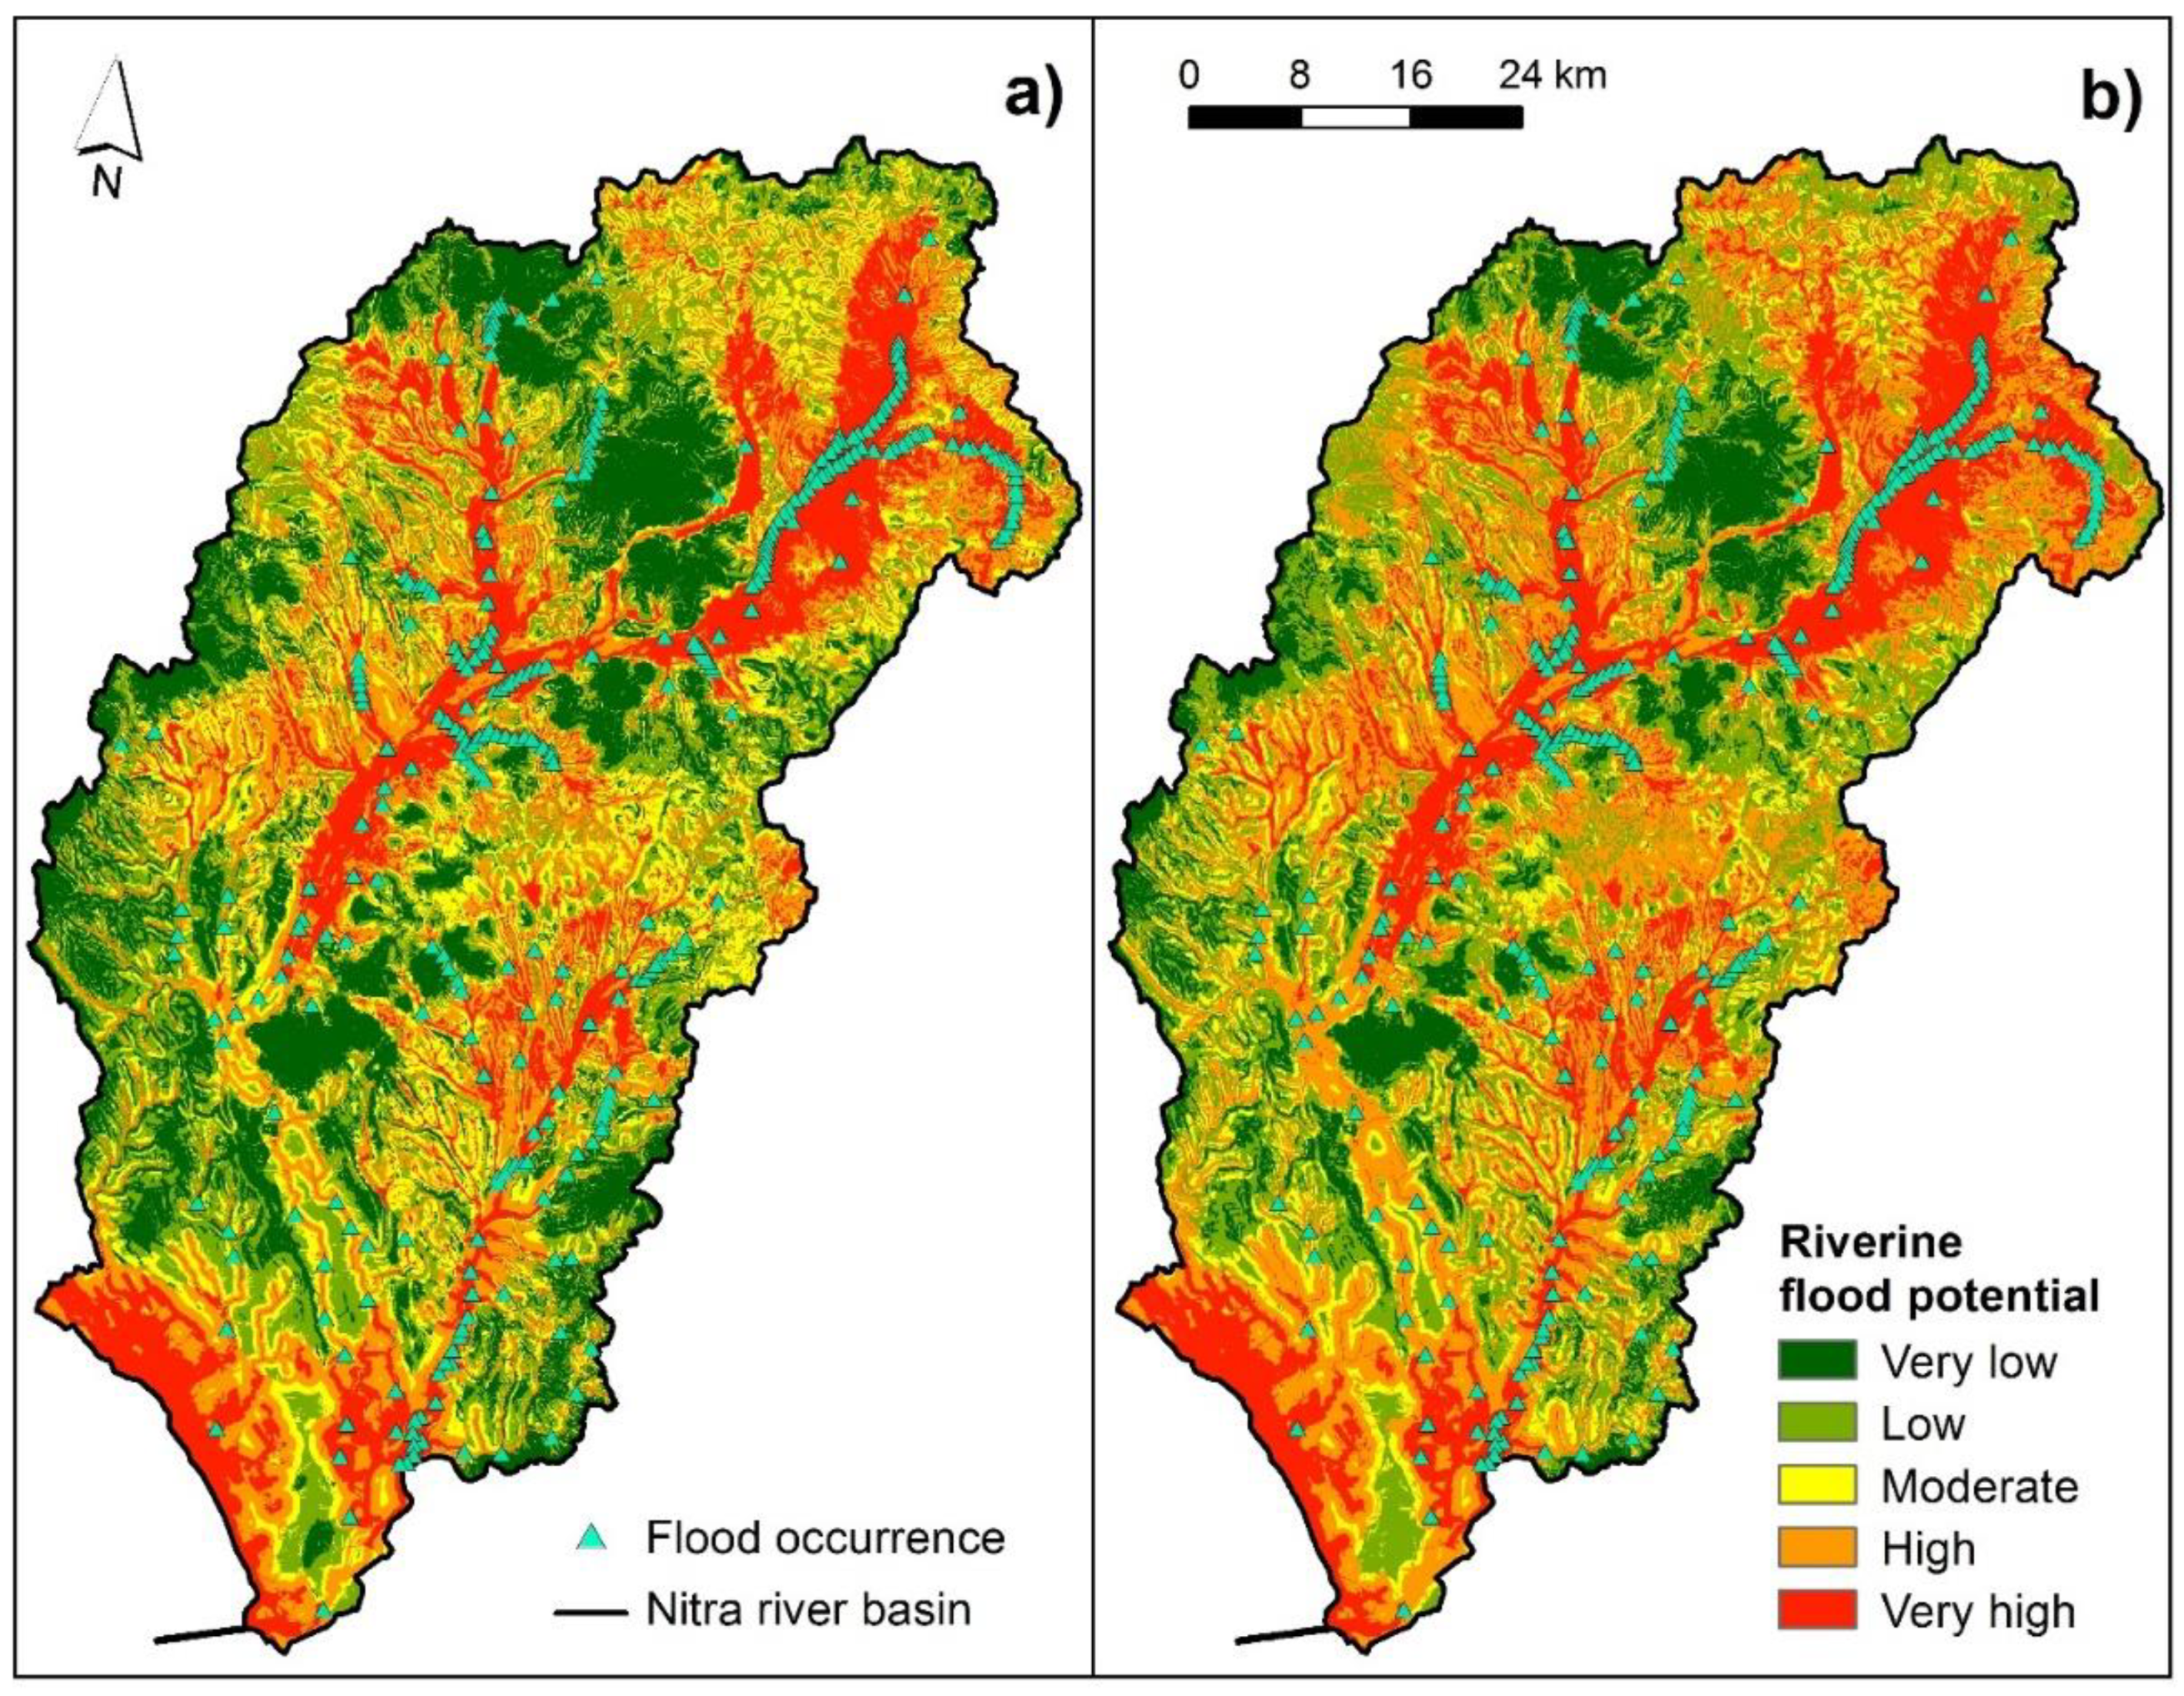
3.1. Riverine Flood Potential

After applying the methodology presented in Section 2.2., the resulting riverine flood potential maps were obtained (Figure 3 and Figure 4). In order to classify the riverine flood potential maps into classes, four classification techniques—natural breaks (Jenks), equal interval, quantile, and geometric interval technique—were applied. Subsequently, the area coverage and share of flood potential classes (very high, high, moderate, low, and very low) on the basin area were calculated (Table 4).
Based on Table 4 and Figure 3, it can be seen that in case of the natural breaks (Jenks) technique, the largest share (33.93%) on the basin area belonged to the moderate flood potential class. Low flood potential class represented the share of 24.29% on the basin area while high flood potential class accounted for 21.74% of the basin area. Very high flood potential was represented in the study area by 10.29%. The lowest percentage regarded the very low flood potential (9.75%). The most susceptible areas (high and very high flood potential) to riverine floods, based on Figure 3a, are the upper and middle part of the Nitra river, including its tributaries in these parts (Nitrica river and Handlovka river), most of the Dlhý kanál river and Bebrava river, as well as the Žitava river and its tributaries in its upper reach. As for the equal interval technique, the highest share (53.74%) corresponded to moderate flood potential class, followed by high flood potential class (27.85%), and low flood potential class (15.17%). Very high and very low flood potential classes had 2.05% and 1.19% share on the basin area, respectively. According to Figure 3b, the most susceptible areas include similar areas as in Figure 3a, but here, the areas are characterized mostly by high flood potential. The very high flood potential can be seen mostly in the upper part of the Nitra river and several of its tributaries.
As can be seen in Figure 4 and Table 4, the share of flood potential classes on the basin area was very similar in case of the quantile technique. In particular, 19.77%, 22.07%, 18.15%, 20.08%, and 19.93% corresponded to very high, high, moderate, low, and very low flood potential class, respectively. In case of the geometric interval technique, the highest share can be seen in high flood potential class (32.14%), followed by low flood potential class (23.66%), and very high flood potential class (21.38%). The lowest share was recorded by moderate (11.51%) and very low flood potential class (11.31%). As shown in Figure 4a,b, the spatial patterns of the areas with very high flood potential are very similar. These areas include mainly the upper, middle, and part of the lower section of the Nitra river, most of the Bebrava river and its tributaries in the upper part, Nitrica river, Handlovka river, Dlhý kanál river, and Žitava river and its tributaries in the upper part. In case of high flood potential, it has the highest share in Figure 4b.
Based on the classification techniques used: natural breaks (Jenks), equal interval, quantile, and geometric interval, 32.03%, 29.90%, 41.84%, and 53.52% of the Nitra river basin, respectively, is characterized by high to very high flood potential. The results can be compared, for example, with the work of Tang et al. [58], who calculated the following share of the high and very high flood potential classes using the random forest (RF) model and the same classification techniques in the Wanan County in Jiangxi Province, China: natural breaks (Jenks) (22%), equal interval (20%), quantile (40%), and geometric interval (47%). As it can be seen, the differences range from around 2% in case of the equal interval technique to 10% in case of the natural breaks (Jenks) technique. In the work of Ajibade et al. [59], the authors computed the percentage coverage of flood potential classes for the AHP and FAHP methods and the classification techniques of natural breaks (Jenks) and geometric interval for the Ibadan City, Nigeria. As for the AHP method, the share of the high and very high flood potential classes was 25% and 15% for the natural breaks (Jenks) and geometric interval, respectively. The difference is quite high, especially in case of the geometric interval (more than 38%) while in case of the natural breaks (Jenks) technique, the difference is 7%. Furthermore, Khosravi et al. [60] calculated the share of high and very high flood potential classes in the Haraz watershed, based on the AHP method and natural breaks (Jenks) technique, to be 34%, which is similar to the presented study.

3.2. Validation of Flood Potential Map

The resulting flood potential model was validated based on its comparison with the occurrence of 317 flood events in the study area, which were also shown in Figure 3 and Figure 4. Moreover, Table 5 shows the number and share of flood events in individual flood potential classes.
In case of the natural breaks (Jenks) technique, most of the flood events corresponded to very high flood potential class, in particular 66.56% of the total number of flood events (Table 5). The second highest frequency of flood events was recorded in the high flood potential class, particularly, 20.82% of the total number of floods. A total of 39 (12.30%) flood events related to the moderate flood potential class. Only one flood event occurred in low potential class. None of the mapped flood events belonged to the very low flood potential class. As for the equal interval technique, very high, high, and moderate flood potential classes contained 40.38%, 47.00%, and 12.62% of all flood events, respectively.
Similar distribution of flood events in flood potential classes can be seen when applying the quantile and geometric interval techniques. Very high flood potential class contained most of the flood events, i.e., 81.70% (quantile) and 82.01% (geometric interval) while high flood potential class recorded a considerably lower share of flood events, i.e., 14.51% (quantile) and 16.72% (geometric interval). As for the moderate flood potential class, 2.84% and 0.95% of flood events corresponded to quantile and geometric interval techniques, respectively. In case of the quantile technique, three flood events were recorded in low flood potential class while in case of the geometric interval technique, it was only one flood event.
Based on the classification techniques of natural breaks (Jenks), equal interval, quantile, and geometric interval, 87.38%, 87.38%, 96.21%, and 98.73% of flood events, respectively, corresponded to high and very high flood potential classes. These findings can be compared with the work of Costache and Zaharia [11], who compared the same classification techniques for the flash-flood potential in the Basca Chiojdului catchment, Romania. The percentage of the high and very high classes using the WOE and FR models is the following: natural breaks (Jenks) (86%), equal interval (91%), quantile (86%), and geometric interval (95%) for the WOE model and natural breaks (Jenks) (85%), equal interval (83%), quantile (87%), and geometric interval (89%) for the FR model. Compared to the results of this study, the differences range from around 1 to 10%. Furthermore, it can be stated that the presented study achieved slightly better results in all classification techniques applied for the AHP model, except for the equal interval in the WOE model. On the other hand, higher shares of flood validation locations were achieved by Tang et al. [58], where the shares were equal to or higher than 95% in all of the studied classification techniques used for the RF model. In another study by Khosravi et al. [60], the share of flood events in high and very high classes using the AHP-based flood susceptibility in Haraz watershed was highest in the case of the quantile technique (97%) in comparison to the natural breaks (Jenks), equal interval, and geometric interval. All in all, these comparisons point to the fact that the share of flood validation locations in flood potential/susceptibility classes varies due to different number and spatial distribution of flood events as well as flood conditioning factors used, which makes this validation parameter area-specific.

3.3. Results of Sensitivity Analysis

The results of the sensitivity analysis are presented in Table 6. The calculated effective values proved that slope is the dominant factor in the computed RFP with even higher weight (40.11%) than its subjective weight (35%). Similarly, river network density retained its position of the second most influential factor, however, with lower effective weight (20.17%) than the subjective weight (24%). Distance from river retained its position as the third most important factor with higher effective weight (19.32%) than its subjective weight (16%). In case of flow accumulation, this factor changed its effective weight (3.84%) significantly, compared to its subjective weight (11%) and became the second least important factor based on the sensitivity analysis, i.e., this factor was overestimated in the RFP assessment. The elevation factor, similarly to distance from river or slope, increased its effective weight (9.98%) compared to its subjective weight (7%), and became the fourth most important factor. Moreover, curve number changed its position and became the fifth most important factor with the effective weight (4.86%), which is similar to the subjective weight (5). Lithology retained its position as the least influential factor with the effective weight of (1.72%), which is even less than its subjective weight (3%).

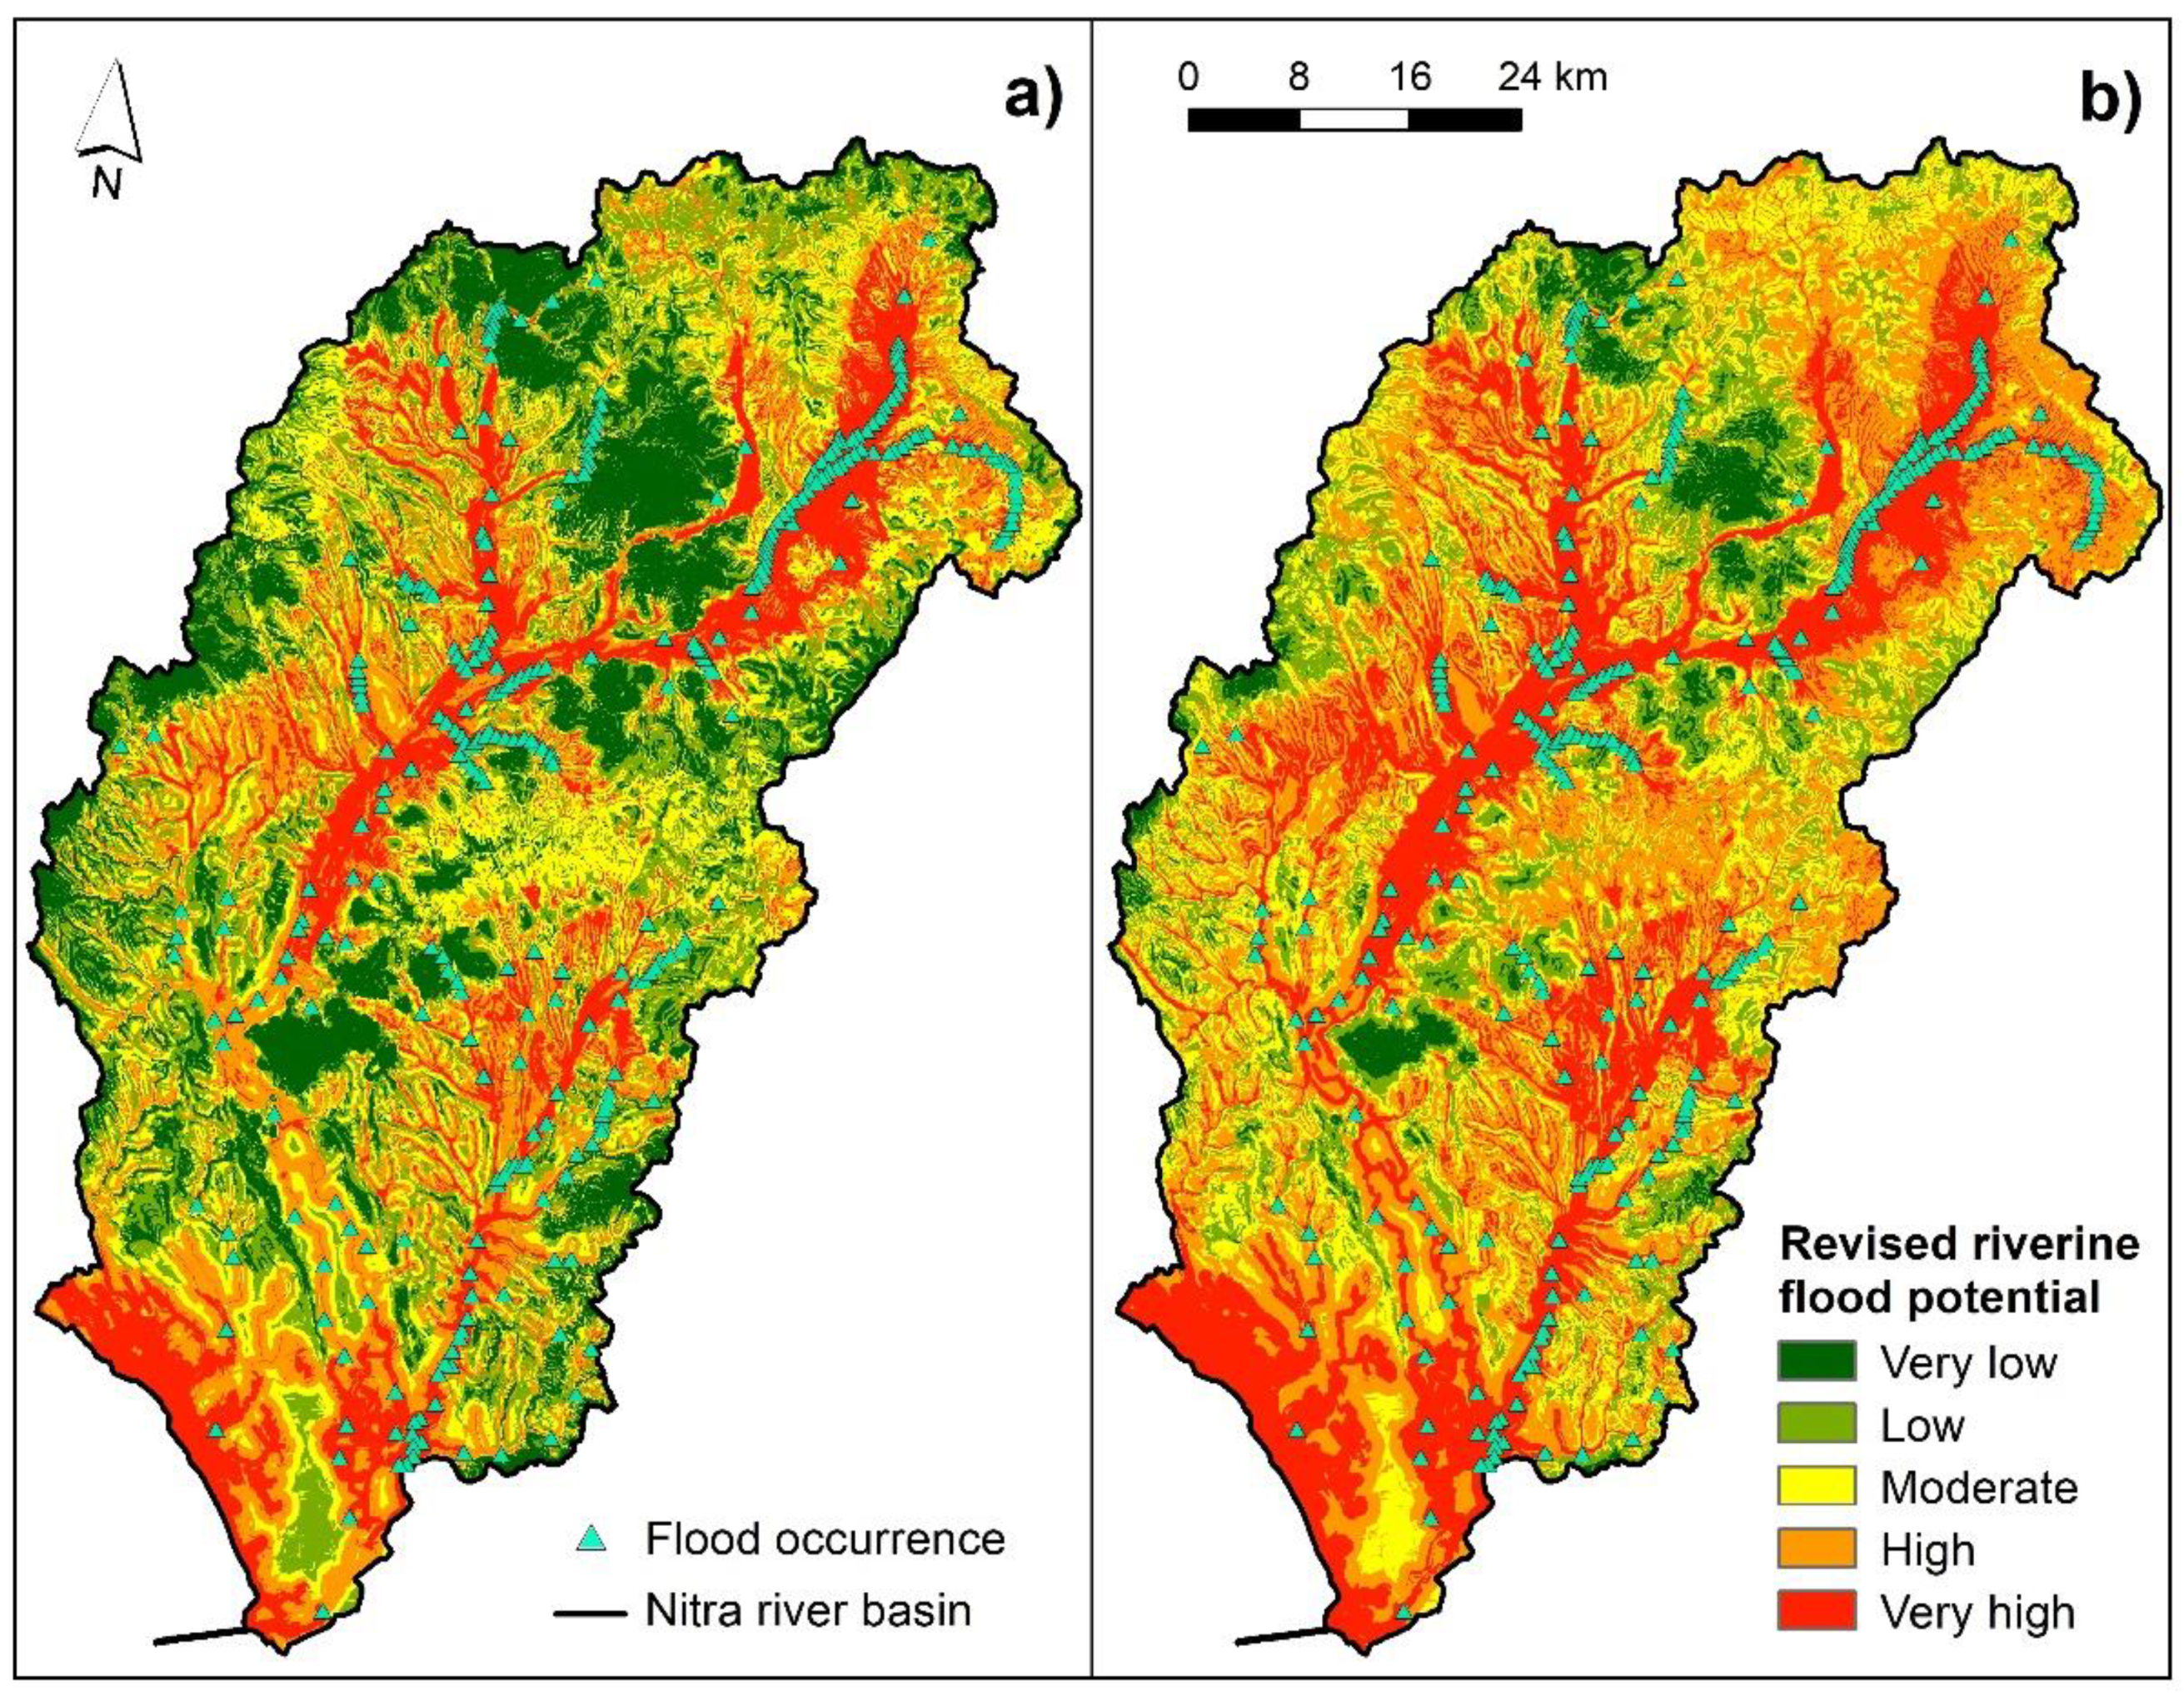
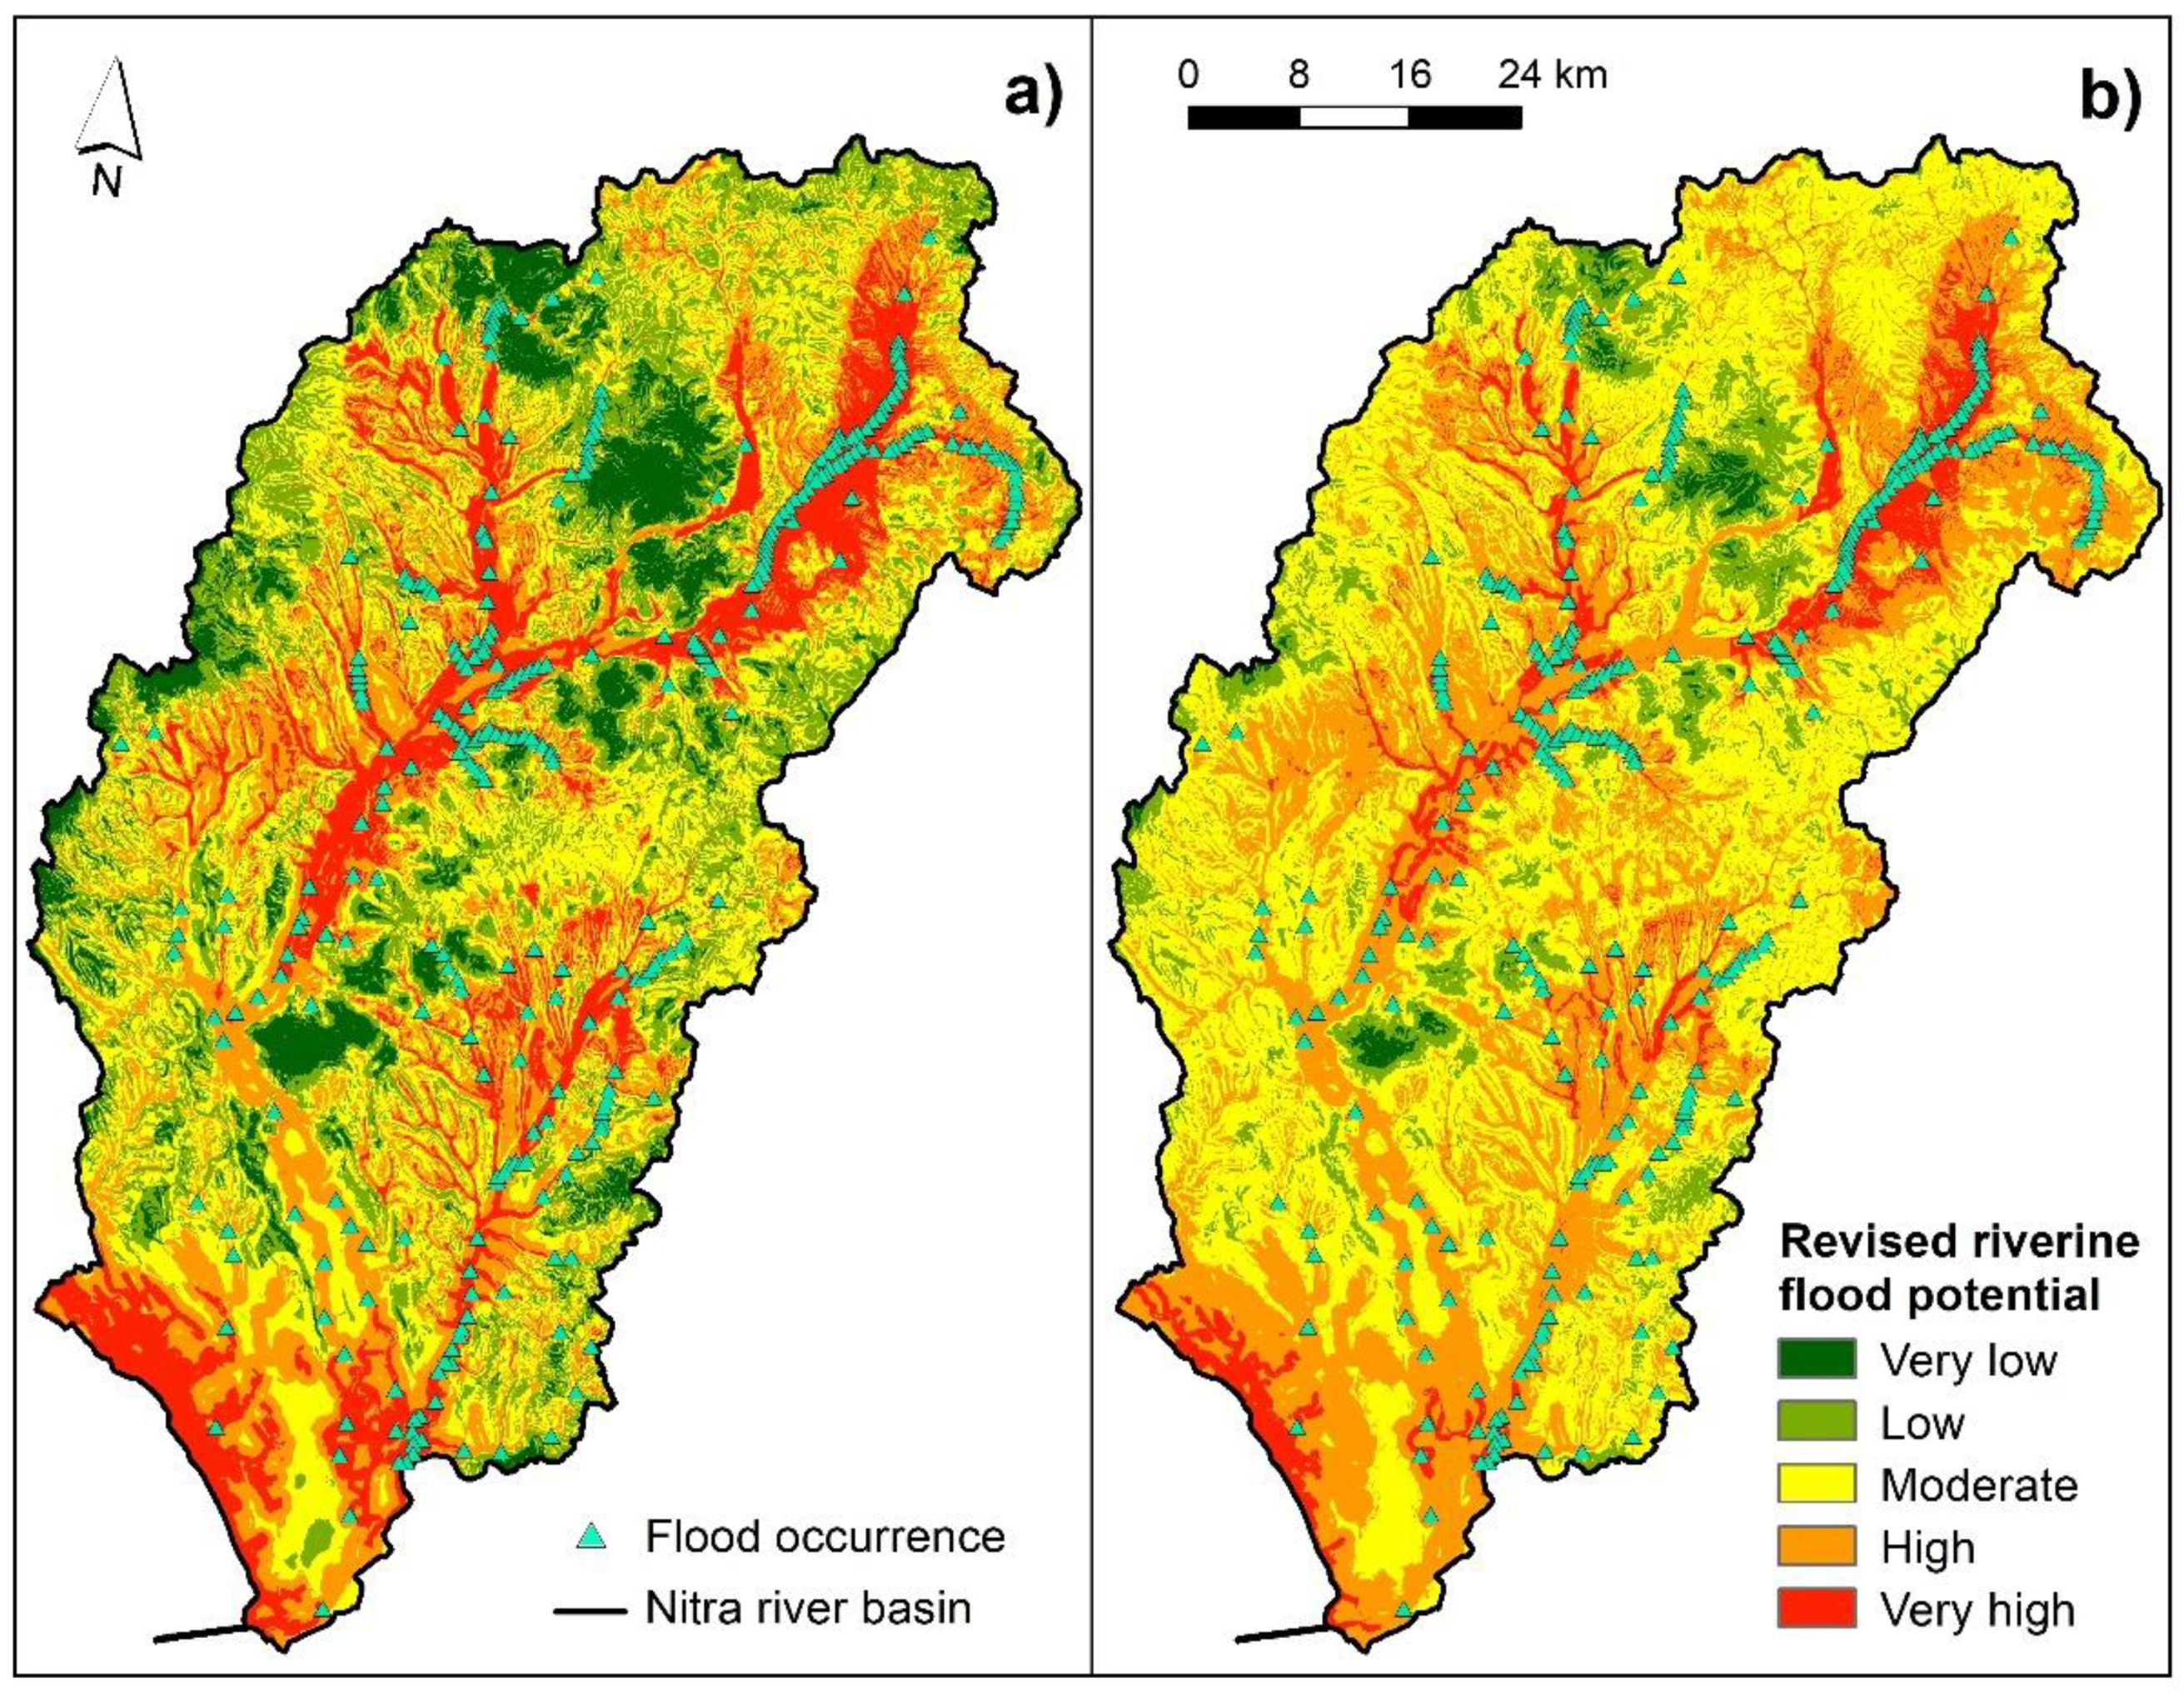
3.4. Revised Riverine Flood Potential

The effective weights calculated in the sensitivity analysis were used to calculate the RRFP. The spatial distribution of the RRFP can be seen in Figure 5 in case of natural breaks (Jenks) and equal interval techniques and, in Figure 6, in case of the other classification techniques used. Furthermore, the share of RRFP classes on the basin area is presented in Table 7 and the share of flood events in RRFP classes can be seen in Table 8.
Based on Table 4 and Table 7, a general underestimation of high and very high flood potential areas by the RFP can be seen. In contrast, the areas with very low and low potential were overestimated by the RFP assessment. In particular, the share of high and very high flood potential classes in the RRFP maps was the following for the classification techniques used: natural breaks (Jenks) (42.33%), equal interval (46.08%), quantile (40.28%), and geometric interval (62.01%). In case of natural breaks (Jenks), equal interval, and geometric interval classification techniques, there was an increase by 10.30%, 16.18%, and 8.49%, respectively, compared to the RFP classes. Only in case of the quantile interval, a decrease by 1.56% was recorded.
Table 8 shows the share of flood events in the revised riverine flood potential classes. Based on the classification techniques of natural breaks (Jenks), equal interval, quantile, and geometric interval, 97.16%, 98.11%, 94.32%, and 99.37% of flood events, respectively, corresponded to high and very high flood potential classes. In case of the natural breaks (Jenks), equal interval, and geometric interval classification techniques, there was an increase by 9.78%, 10.73%, and 0.64%, respectively, compared to the RFP classes. Only in the case of quantile interval, an overestimation by 1.89% was recorded in the RFP.
Overall, the validation of the weights used in the RFP assessment has improved the reliability of the proposed methodology. Based on the aforementioned differences between the RFP and RRFP, the RRFP is eventually recommended for the assessment of riverine flood potential areas in the Nitra river basin. This finding is in accordance with the results achieved in the study by Kazakis et al. [56] or Hammani et al. [57].

4. Limitations and Conclusions

The presented GIS-based spatial and multi-criteria evaluation of flood potential may have certain limitations regarding the methods, i.e., the multi-criteria approach, as well as input data applied.
As for the input data, a limitation can be seen in using source data which were originally produced in different original map scales. In particular, the content of the original Engineering-geological Zoning Map (1:500,000) or Soil Texture Map (1:500,000) is more generalized than the content of medium-scale maps, such as the topographic map at a scale of 1:50,000. For this reason, certain consolidation of input data, in terms of original map scale, spatial resolution, or generalization, should be considered when modeling the flood potential [8]. Furthermore, it should be mentioned that some uncertainties may also arise in case of selecting appropriate flood conditioning factors, which is usually done in a subjective manner [61].
According to Tehrany et al. [62], the emphasis should be placed on the selection of modeling methods and their limitations, which can significantly influence the results. In this study, the AHP method [25] was used to calculate the weights of flood conditioning factors based on the pair-wise comparison matrix and the nine-point continuous scale. The slope angle was defined as the most influencing factor with the highest weight, followed by the river network density, distance from river, flow accumulation, elevation, curve numbers, and lithology. Although the AHP is considered one of the most objective and exact methods of multi-criteria decision analysis, it may have some limitations which arise from the fact that it is a knowledge-driven method [56]. One of the sources of uncertainty is the use of a certain degree of subjectivity, especially when weighting individual flood conditioning factors, which is carried out by expert judgments [60]. On the other hand, the advantage of the AHP method is that it performs the whole evaluation by comparing at least two alternatives, where the resulting scores of the individual alternatives are normalized and the sum of ratings is always equal to 1 or 100%.
The resulting riverine flood potential was determined as the weighted sum of reclassified factors and the resulting map was divided into five classes: very low, low, medium, high, and very high flood potential. The results showed that from one third up to more than half of the Nitra river basin is characterized by high to very high riverine flood potential when taking into account different classification techniques. Validation of the resulting model, using the total number of 317 flood events, showed that from 87% to almost 99% of flood events corresponded to high and very high flood potential classes considering different classification techniques used. In this context, the validation of the created model is an important step in the presented methodology as well as other flood potential studies since it verifies its accuracy [60]. However, extending the database of flood events in the study area with other relevant historical floods would allow better comparison of the resulting model with the occurrence of past floods.
The sensitivity analysis revealed an underestimation of the weights of slope, distance from river, and elevation factors while factors of river network density, curve number, lithology, and, especially, flow accumulation were overestimated in the RFP assessments. In general, the differences between the RFP and RRFP can be interpreted as an underestimation of the share of high and very high flood potential as well as the share of flood events in these classes within the RFP assessment. Based on these findings, the RRFP is recommended for the assessment of riverine flood potential in the Nitra river basin.
To conclude, the impacts of climate change and anthropic pressure on the landscape have caused an increased number of flood situations as well as increased flood damage worldwide. In terms of minimizing flood risk and flood damage, it is inevitable to apply different structural as well as non-structural flood protection measures [63]. In this sense, assessment of flood potential should play an important role, especially, in flood prevention and management since it is able to identify areas with high and very high flood potential. This fact is also stressed in the preliminary flood risk assessment, which is updated every six years in the EU member countries according to the EU Floods Directive 2007/60/EC [3].
On one hand, future research directions will be focused on input data consolidation in terms of the original map scale, spatial resolution, generalization, or integration as well on the creation of more robust validation data. On the other hand, the MCE-AHP technique will be compared to other approaches for flood potential mapping in the Nitra river basin, such as other MCE techniques, statistical, or machine learning models, in order to find the most appropriate one.

Supplementary Materials

The following are available online at https://www.mdpi.com/article/10.3390/ijgi10090578/s1, Table S1: Derived curve numbers, Table S2: Zones of rock types and their corresponding degree of permeability, Figure S1: Flood conditioning factors: (a) eleva-tion, (b) slope angle, Figure S2: Flood conditioning factors: (a) river network density, (b) distance from river, (c) flow accumulation, Figure S3: Input maps: (a) hydrological soil groups, (b) CORINE Land Cover from 2018, Figure S4. Flood conditioning factors: (a) curve numbers, (b) lithology (degree of permeability), Table S3: Reciprocal pair-wise comparison matrix.

Author Contributions

Conceptualization, Matej Vojtek, Jana Vojteková, and Quoc Bao Pham; methodology, Matej Vojtek and Jana Vojteková; software, Jana Vojteková and Quoc Bao Pham; validation, Quoc Bao Pham; formal analysis, Matej Vojtek and Jana Vojteková; data curation, Matej Vojtek and Quoc Bao Pham; writing—original draft preparation, Matej Vojtek, Jana Vojteková, and Quoc Bao Pham; writing—review and editing, Matej Vojtek; visualization, Jana Vojteková All authors have read and agreed to the published version of the manuscript.

Funding

This work was supported by the Slovak Research and Development Agency under the Contract no. APVV-18-0185 and by the VEGA agency under the grant no. 1/0880/21.

Data Availability Statement

The data presented in this study are available on request from the corresponding author. The data are not publicly available due to privacy reasons.

Conflicts of Interest

The authors declare no conflict of interest.

References

  1. Smith, K.; Ward, R. Floods: Physical Processes and Human Impacts; John Wiley & Sons: Chicester, UK, 1998. [Google Scholar]
  2. Hirabayashi, Y.; Mahendran, R.; Koirala, S.; Konoshima, L.; Yamazaki, D.; Watanabe, S.; Kim, H.; Kanae, S. Global flood risk under climate change. Nat. Clim. Chang. 2013, 3, 816–821. [Google Scholar] [CrossRef]
  3. Directive 2007/60/EC of the European Parliament and of the Council of 23 October 2007 on the Assessment and Management of Flood Risks. Available online: http://eurlex.europa.eu/LexUriServ/LexUriServ.do?uri=OJ:L:2007:288:0027:0034:SK:PDF (accessed on 23 April 2021).
  4. Ministry of Environment of the Slovak Republic, Predbežné Hodnotenie Povodňového Rizika v Slovenskej Republike [Preliminary Flood Risk Assessment in the Slovak Republic]. 2011. Available online: http://www.minzp.sk/files/sekcia-vod/phpr_sr-textova-cast-oprava.pdf (accessed on 12 August 2021).
  5. Ministry of Environment of the Slovak Republic, Predbežné Hodnotenie Povodňového Rizika v Slovenskej Republike—Aktualizácia 2018 [Preliminary Flood Risk Assessment in the Slovak Republic—Update 2018]. 2018. Available online: http://www.minzp.sk/files/sekcia-vod/hodnotenierizika-2018/phpr_sr2018.pdf (accessed on 12 August 2021).
  6. Minár, J.; Trizna, M.; Barka, I.; Bonk, R. Povodňový Potenciál na ÚZEMÍ SLOVENSKA [Flood Potential in Slovakia]; Geo-grafika: Bratislava, Slovakia, 2005. [Google Scholar]
  7. Zaharia, L.; Costache, R.; Prăvălie, R.; Ioana-Toroimac, G. Mapping flood and flooding potential indices: A methodological approach to identifying areas susceptible to flood and flooding risk. Case study: The Prahova catchment (Romania). Front. Earth Sci. 2017, 11, 229–247. [Google Scholar] [CrossRef]
  8. Jacinto, R.; Grosso, N.; Reis, E.; Dias, L.; Santos, F.D.; Garrett, P. Continental Portuguese Territory Flood Susceptibility Index—Contribution to a vulnerability index. Nat. Hazards Earth Sys. Sci. 2015, 15, 1907–1919. [Google Scholar] [CrossRef] [Green Version]
  9. Vojtek, M.; Vojteková, J. Flood maps and their potential role in local spatial planning: A case study from Slovakia. Water Policy 2018, 20, 1042–1058. [Google Scholar] [CrossRef] [Green Version]
  10. Vojtek, M.; Vojteková, J.; Pham, Q.B.; Lee, S.; Arshad, A.; Costache, R.; Sahoo, S.; Linh, N.T.T.; Anh, D.T. Comparison of multi-criteria-analytical hierarchy process and machine learning-boosted tree models for regional flood susceptibility mapping: A case study from Slovakia. Geomat. Nat. Hazards Risk 2021, 12, 1153–1180. [Google Scholar] [CrossRef]
  11. Costache, R.; Zaharia, L. Flash-flood potential assessment and mapping by integrating the weights-of-evidence and frequency ratio statistical methods in GIS environment—Case study: âsca Chiojdului River catchment (Romania). J. Earth Syst. Sci. 2017, 126, 59. [Google Scholar] [CrossRef]
  12. Vojtek, M.; Vojteková, J. GIS-based Approach to Estimate Surface Runoff in Small Catchments: A Case Study. Quaest. Geogr. 2016, 35, 97–116. [Google Scholar] [CrossRef] [Green Version]
  13. Petrikovičová, L.; Rampašeková, Z.; Sobocká, J. A Detailed Identification of Erosionally Endangered Agricultural Land in Slovakia (Case Study of Nitra Upland). Sustainability 2020, 12, 4863. [Google Scholar] [CrossRef]
  14. Trpkošová, D.; Krásny, J.; Pavlíková, D. Rozdíly v odtokových poměrech z krystalinických a flyšových území na Moravě a ve Slezsku. J. Hydrol. Hydromech. 2008, 56, 201–210. [Google Scholar]
  15. Vojtek, M.; Vojteková, J. Land Use Change and Its Impact on Surface Runoff from Small Basins: A Case of Radiša Basin. Folia Geogr. 2019, 61, 104–125. [Google Scholar]
  16. Shrestha, S.; Cui, S.; Xu, L.; Wang, L.; Manandhar, B.; Ding, S. Impact of Land Use Change Due to Urbanisation on Surface Runoff Using GIS-Based SCS–CN Method: A Case Study of Xiamen City, China. Land 2021, 10, 839. [Google Scholar] [CrossRef]
  17. Eastman, J.R.; Weigen, J.; Kyem, P.A.; Toledano, J. Raster procedures for multi-criteria/multi-objective decisions. Photogramm. Eng. Remote Sens. 1995, 61, 539–547. [Google Scholar]
  18. Malczewski, J. GIS and Multicriteria Decision Analysis; John Wiley & Sons: Toronto, ON, Canada, 1999. [Google Scholar]
  19. Santos, P.P.; Reis, E.; Pereira, S.; Santos, M. A flood susceptibility model at the national scale based on multicriteria analysis. Sci. Total Environ. 2019, 667, 325–337. [Google Scholar] [CrossRef] [PubMed]
  20. Konečný, M.; Bandrova, T. Proposal for a Standard in Cartographic Visualization of Natural Risks and Disasters. Int. J. Urban Sci. 2006, 10, 130–139. [Google Scholar] [CrossRef]
  21. Malekinezhad, H.; Sepehri, M.; Pham, Q.B.; Hosseini, S.Z.; Meshram, S.G.; Vojtek, M.; Vojteková, J. Application of entropy weighting method for urban flood hazard mapping. Acta Geophys. 2021, 69, 841–854. [Google Scholar] [CrossRef]
  22. Li, X.; Yan, D.H.; Wang, K.; Weng, B.; Qin, T.; Liu, S. Flood risk assessment of global watersheds based on multiple machine learning models. Water 2019, 11, 1654. [Google Scholar] [CrossRef] [Green Version]
  23. Skilodimou, H.D.; Bathrellos, G.D.; Chousianitis, K.; Youssef, A.M.; Pradhan, B. Multi-hazard assessment modeling via multi-criteria analysis and GIS: A case study. Environ. Earth Sci. 2019, 77, 47. [Google Scholar] [CrossRef]
  24. Zardari, H.; Ahmed, K.; Shirazi, S.M.; Yusop, Z.B. Weighting Methods and their Effects on Multi-Criteria Decision Making Model Outcomes in Water Resources Management; Springer: London, UK, 2015. [Google Scholar]
  25. Saaty, T.L. The Analytic Hierarchy Process; McGraw Hill Company: New York, NY, USA, 1980. [Google Scholar]
  26. Das, S. Geographic information system and AHP-based flood hazard zonation of Vaitarna basin, Maharashtra, India. Arab. J. Geosci. 2018, 11, 576. [Google Scholar] [CrossRef]
  27. Mahmoud, S.H.; Gan, T.Y. Multi-criteria approach to develop flood susceptibility maps in arid regions of Middle East. J. Clean. Prod. 2018, 196, 216–229. [Google Scholar] [CrossRef]
  28. Kourgialas, N.N.; Karatzas, G.P. Flood management and a GIS modelling method to assess flood-hazard areas—A case study. Hydrol. Sci. J. 2011, 56, 212–225. [Google Scholar] [CrossRef]
  29. Wang, Y.; Hong, H.; Chen, W.; Li, S.; Pamučar, D.; Gigović, L.; Drobnjak, S.; Bui, D.T.; Duan, H. A Hybrid GIS Multi-Criteria Decision-Making Method for Flood Susceptibility Mapping at Shangyou, China. Remote Sens. 2019, 11, 62. [Google Scholar] [CrossRef] [Green Version]
  30. Dano, U.L.; Balogunm, A.L.; Matori, A.N.; Yusouf, K.W.; Abubakar, I.R.; Mohamed, M.A.S.; Aina, Y.A.; Pradhan, B. Flood Susceptibility Mapping Using GIS-Based Analytic Network Process: A Case Study of Perlis, Malaysia. Water 2019, 11, 615. [Google Scholar] [CrossRef] [Green Version]
  31. Kanani-Sadat, Y.; Arabsheibani, R.; Karimipour, F.; Nasseri, M. A new approach to flood susceptibility assessment in data-scarce and ungauged regions based on GIS-based hybrid multi criteria decision-making method. J. Hydrol. 2019, 572, 17–31. [Google Scholar] [CrossRef]
  32. Khosravi, K.; Shahabi, H.; Pham, B.T.; Adamowski, J.; Shirzadi, A.; Pradhan, B.; Dou, J.; Ly, H.B.; Gróf, G.; Ho, H.L.; et al. A comparative assessment of flood susceptibility modeling using Multi-Criteria Decision-Making Analysis and Machine Learning Methods. J. Hydrol. 2019, 573, 311–323. [Google Scholar] [CrossRef]
  33. Abdullah, M.F.; Siraj, S.; Hodgett, R.E. An Overview of Multi-Criteria Decision Analysis (MCDA) Application in Managing Water-Related Disaster Events: Analyzing 20 Years of Literature for Flood and Drought Events. Water 2021, 13, 1358. [Google Scholar] [CrossRef]
  34. Tabarestani, E.S.; Afzalimehr, H. A comparative assessment of multi-criteria decision analysis for flood susceptibility modelling. Geocarto Int. 2021, 1–24. [Google Scholar] [CrossRef]
  35. Arabameri, A.; Redzaei, K.; Cerdá, A.; Conoscenti, C.; Kalantari, Z. A comparison of statistical methods and multi-criteria decision making to map flood hazard susceptibility in Northern Iran. Sci. Total Environ. 2019, 660, 443–458. [Google Scholar] [CrossRef]
  36. Ali, S.A.; Parvin, F.; Pham, Q.B.; Vojtek, M.; Vojteková, J.; Costache, R.; Linh, N.T.T.; Nguyen, H.Q.; Ateeque, A.; Ghorbani, M.A. GIS-based comparative assessment of flood susceptibility mapping using hybrid multi-criteria decision-making approach, naive Bayes tree, bivariate statistics and logistic regression: A case of Topľa basin, Slovakia. Ecol. Indic. 2020, 117, 106620. [Google Scholar] [CrossRef]
  37. Santangelo, N.; Santo, A.; Di Crescenzo, G.; Foscari, G.; Liuzza, V.; Sciarrotta, S.; Scorpio, V. Flood susceptibility assessment in a highly urbanized alluvial fan: The case study of Sala Consilina (southern Italy). Nat. Hazards Earth Syst. Sci. 2011, 11, 2765–2780. [Google Scholar] [CrossRef] [Green Version]
  38. Rahmati, O.; Zeinivand, H.; Besharat, M. Flood hazard zoning in Yasooj region, Iran, using GIS and multi-criteria decision analysis. Geomat. Nat. Hazards Risk. 2016, 7, 1000–1017. [Google Scholar] [CrossRef] [Green Version]
  39. Termeh, S.V.R.; Kornejady, A.; Pourghasemi, H.R.; Keesstra, S. Flood susceptibility mapping using novel ensembles of adaptive neuro fuzzy inference system and metaheuristic algorithms. Sci. Total Environ. 2018, 615, 438–451. [Google Scholar] [CrossRef] [PubMed]
  40. Chapi, K.; Singh, V.P.; Shirzadi, A.; Shahabi, H.; Bui, D.T.; Pham, B.T.; Khosravi, K. A novel hybrid artificial intelligence approach for flood susceptibility assessment. Environ. Model. Softw. 2017, 95, 229–245. [Google Scholar] [CrossRef]
  41. Haghizadeh, A.; Siahkamari, S.; Hamzeh Haghiabi, A.; Rahmati, O. Forecasting flood-prone areas using Shannon’s entropy model. J. Earth Sys. Sci. 2017, 126, 39. [Google Scholar] [CrossRef]
  42. Tien Bui, D.; Khosravi, K.; Shahabi, H.; Daggupati, P.; Adamowski, J.F.; Melesse, A.M.; Pham, B.T.; Pourghasemi, H.R.; Mahmoudi, M.; Bahrami, S.; et al. Flood Spatial Modeling in Northern Iran Using Remote Sensing and GIS: A Comparison between Evidential Belief Functions and Its Ensemble with a Multivariate Logistic Regression Model. Remote Sens. 2019, 11, 1589. [Google Scholar]
  43. Das, S.; Gupta, A. Multi-criteria decision based geospatial mapping of flood susceptibility and temporal hydro-geomorphic changes in the Subarnarekha basin, India. Geosci. Front. 2021, 12, 101206. [Google Scholar] [CrossRef]
  44. Kourgialis, N.N.; Karatzas, G.P. A national scale flood hazard mapping methodology: The case of Greece—Protection and adaptation policy approaches. Sci. Total Environ. 2017, 601–602, 441–452. [Google Scholar] [CrossRef] [PubMed]
  45. Zhao, G.; Pang, B.; Xu, Z.; Yue, J.; Tu, T. Mapping flood susceptibility in mountainous areas on a national scale in China. Sci. Total Environ. 2018, 615, 1133–1142. [Google Scholar] [CrossRef] [PubMed]
  46. Mazúr, E.; Lukniš, M. Geomorfologické Členenie SSR a ČSSR. Časť Slovensko; Slovenská Kartografia: Bratislava, Slovakia, 1986. [Google Scholar]
  47. Solín, Ľ. Analýza výskytu povodňových situácií na Slovensku v období rokov 1996–2006. J. Hydrol. Hydromech. 2008, 56, 95–115. [Google Scholar]
  48. Cronshey, R.; McCuen, R.H.; Miller, N.; Rawls, W.; Robbins, S.; Woodward, D. Urban Hydrology for Small Watersheds (TR-55); Natural Resources Conservation Service: Washington, DC, USA, 1986.
  49. Čurlík, J.; Šály, R. Zrnitosť pôdy. In Atlas Krajiny Slovenskej Republiky; Hrnčiarová, T., Ed.; MŽP SR; SAŽP: Banská Bystrica, Slovakia, 2002. [Google Scholar]
  50. Hrnčiarová, T. Hodnotenie Potenciálnej Zraniteľnosti Zásob Podzemných vôd pre ekologické plánovanie krajiny. Životn. Prostr. 1993, 27, 311–314. [Google Scholar]
  51. Hrašna, M.; Klukanová, A. Inžinierskogeologická rajonizácia. In Atlas Krajiny Slovenskej Republiky; Hrnčiarová, T., Ed.; MŽP SR; SAŽP: Banská Bystrica, Slovakia, 2002. [Google Scholar]
  52. Demek, J. Manual of Detailed Geomorphological Mapping; Academia: Prague, Czech Republic, 1972. [Google Scholar]
  53. Lukniš, M. Reliéf. In Slovensko 2—Príroda; Lukniš, M., Ed.; Obzor: Bratislava, Slovakia, 1972; pp. 124–202. [Google Scholar]
  54. Drobne, S.; Lisec, A. Multi-attribute decision analysis in GIS: Weighted linear combination and ordered weighted averaging. Informatica 2009, 33, 459–474. [Google Scholar]
  55. Napolitano, P.; Fabbri, A.G. Single-parameter sensitivity analysis for aquifer vulnerability assessment using drastic and sintacs. In IAHS Publications-Series of Proceedings and Reports; IAHS Press: Wallingford, UK, 1996; Volume 235, pp. 559–566. [Google Scholar]
  56. Kazakis, N.; Kougias, I.; Patsialis, T. Assessment of flood hazard areas at a regional scale using an index-based approach and Analytical Hierarchy Process: Application in Rhodope–Evros region, Greece. Sci. Total Environ. 2015, 538, 555–563. [Google Scholar] [CrossRef] [PubMed]
  57. Hammami, S.; Zouhri, L.; Soussi, D.; Souei, A.; Zghibi, A.; Marzougui, A.; Dlala, U. Application of the GIS based multi-criteria decision analysis and analytical hierarchy process (AHP) in the flood susceptibility mapping (Tunisia). Arab. J. Geosci. 2019, 12, 653. [Google Scholar] [CrossRef]
  58. Tang, X.; Machimura, T.; Liu, W.; Li, J.; Hong, H. A novel index to evaluate discretization methods: A case study of flood susceptibility assessment based on random forest. Geosci. Front. 2021, 12, 101253. [Google Scholar] [CrossRef]
  59. Ajibade, F.O.; Ajibade, T.F.; Idowu, T.E.; Nwogwu, N.A.; Adelodun, B.; Lasisi, K.H.; Opafola, O.T.; Ajala, O.A.; Fadugba, O.G.; Adewumi, J.R. Flood-prone area mapping using GIS-based analytical hierarchy frameworks for Ibadan city, Nigeria. J. Multi-Criteria Decis. Anal. 2021. [Google Scholar] [CrossRef]
  60. Khosravi, K.; Nohani, E.; Maroufinia, E.; Pourghasemi, H.R. A GIS-based flood susceptibility assessment and its mapping in Iran: A comparison between frequency ratio and weights-of-evidence bivariate statistical models with multi-criteria decision-making technique. Nat. Hazards 2016, 83, 947–987. [Google Scholar] [CrossRef]
  61. Das, S. Geospatial mapping of flood susceptibility and hydro-geomorphic response to the floods in Ulhas basin, India. Remote Sens. App. Soc. Environ. 2019, 14, 60–74. [Google Scholar] [CrossRef]
  62. Tehrany, M.S.; Jones, S.; Shabani, F. Identifying the essential flood conditioning factors for flood prone area mapping using machine learning techniques. Catena 2019, 175, 174–192. [Google Scholar] [CrossRef]
  63. Charvat, K.; Kubicek, P.; Talhofer, V.; Konecny, M.; Jezek, J. Spatial Data Infrastructure and Geovisualization in Emergency Management. In Resilience of Cities to Terrorist and other Threats. NATO Science for Peace and Security Series Series C: Environmental Security; Pasman, H.J., Kirillov, I.A., Eds.; Springer: Dordrecht, The Netherlands, 2008; pp. 443–473. [Google Scholar]
Figure 1. Location of the Nitra river basin in Slovakia.
Ijgi 10 00578 g001
Figure 2. Methodological workflow for GIS-based riverine flood potential mapping in the Nitra river basin.
Ijgi 10 00578 g002
Figure 3. Riverine flood potential in the Nitra river basin based on classification techniques: (a) natural breaks (Jenks), (b) equal interval.
Ijgi 10 00578 g003
Figure 4. Riverine flood potential in the Nitra river basin based on classification techniques: (a) quantile, (b) geometric interval.
Ijgi 10 00578 g004
Figure 5. Revised riverine flood potential in the Nitra river basin based on classification techniques: (a) natural breaks (Jenks), (b) equal interval.
Ijgi 10 00578 g005
Figure 6. Revised riverine flood potential in the Nitra river basin based on classification techniques: (a) quantile, (b) geometric interval.
Ijgi 10 00578 g006
Table 1. Source data for processing the selected flood conditioning factors.
Source dataFormatSourceDerived Map
River network
(Topographic map
1:50,000)
Vector (shapefile)Geodetic and Cartographic Institute BratislavaElevation
River network density
Distance from river
Contour lines and elevation points
(Topographic map
1:50,000)
Vector (shapefile)Geodetic and Cartographic Institute BratislavaElevation
Slope
Flow accumulation
Engineering-geological Zoning Map (1:500,000)Vector (shapefile)Landscape Atlas of the Slovak Republic (2002)Lithology
Land coverVector (shapefile)CORINE Land Cover (2018)Curve number
Soil Texture Map
(1:500,000)
Vector (shapefile)Landscape Atlas of the Slovak Republic (2002)Curve number
Table 2. Flood conditioning factors and their rating.
Conditioning FactorIntervalRating
Slope
(°)
0.0–2.05
2.1–5.04
5.1–15.03
15.1–35.02
35.1–44.21
River network density (km/km2)0.00–0.681
0.69–0.862
0.87–1.063
1.07–1.314
1.32–1.655
Distance from river
(m)
0–2135
214–5214
522–9123
913–14692
1470–30211
Flow accumulation (pixels)0–2501
251–5002
501–25003
2501–50,0004
50,001–397,8595
Elevation
(m)
108–3005
301–8003
801–13461
Curve number56–591
60–642
65–743
75–844
85–1005
Lithology
(degree of permeability)
Very high1
High2
Moderate3
Low4
Very low5
Table 3. Normalized weights and resulting weights of factors (wi).
Normalized Weights
FactorsSlopeRiver Network DensityDistance from RiverFlow AccumulationElevationCurve NumberLithologywi
Slope0.390.450.410.360.320.280.250.35
River network density0.190.220.270.270.250.230.210.24
Distance from river0.130.110.140.180.190.190.180.16
Flow accumulation0.100.070.070.090.130.140.140.11
Elevation0.080.060.050.050.060.090.110.07
Curve number 0.060.040.030.030.030.050.070.05
Lithology0.060.040.030.020.020.020.040.03
Table 4. Share of riverine flood potential classes on the basin area.
Natural Breaks (Jenks)Equal IntervalQuantileGeometric Interval
Riverine Flood
Potential Class
Area (km2)Share on
Basin Area
(%)
Area (km2)Share on
Basin Area
(%)
Area (km2)Share on
Basin Area
(%)
Area (km2)Share on
Basin Area
(%)
Very low437.79.7553.31.19894.519.93507.611.31
Low1090.324.29681.015.17901.220.081062.023.66
Moderate1523.133.932411.853.74814.518.15516.611.51
High975.621.741250.327.85990.522.071442.532.14
Very high461.610.2991.82.05887.519.77959.621.38
Table 5. Distribution of flood events in flood potential classes.
Natural Breaks (Jenks)Equal IntervalQuantileGeometric Interval
Riverine Flood
Potential Class
Flood EventsFlood Events (%)Flood EventsFlood Events (%)Flood EventsFlood Events (%)Flood EventsFlood Events (%)
Very low00.0000.0000.0000.00
Low10.3200.0030.9510.32
Moderate3912.304012.6292.8430.95
High6620.8214947.004614.515316.72
Very high21166.5612840.3825981.7026082.01
Table 6. Calculated effective weights based on sensitivity analysis.
FactorSubjective Weight (%)Effective Weight (%)
MinMaxMeanStandard Deviation
Slope3511.4065.5440.119.39
River network density246.0047.8120.178.97
Distance from river164.2336.2019.324.69
Flow accumulation112.4219.863.841.39
Elevation74.9020.719.981.76
Curve number51.0711.634.861.47
Lithology30.617.891.721.09
Table 7. Share of RRFP classes on the basin area.
Natural Breaks (Jenks)Equal IntervalQuantileGeometric Interval
Riverine Flood
Potential Class
Area (km2)Share on
Basin Area
(%)
Area (km2)Share on
Basin Area
(%)
Area (km2)Share on
Basin Area
(%)
Area (km2)Share on
Basin Area
(%)
Very low351.27.8239.40.88823.118.34171.33.82
Low912.820.33383.38.54916.220.41619.813.81
Moderate1324.629.511997.844.51941.120.97914.020.36
High1164.225.941708.538.07992.222.111601.835.69
Very high735.516.39359.328.01815.718.171181.326.32
Table 8. Distribution of flood events in RRFP classes.
Natural Breaks (Jenks)Equal IntervalQuantileGeometric Interval
Riverine Flood
Potential Class
Flood EventsFlood Events (%)Flood EventsFlood Events (%)Flood EventsFlood Events (%)Flood EventsFlood Events (%)
Very low00.0000.0000.0000.00
Low00.0000.0020.6300.00
Moderate92.8461.89165.0520.63
High7523.6614144.484915.463811.99
Very high23373.5017053.6325078.8627787.38
Publisher’s Note: MDPI stays neutral with regard to jurisdictional claims in published maps and institutional affiliations.

