Article

Integration and Analysis of Multi-Modal Geospatial Secondary Data to Inform Management of at-Risk Archaeological Sites

1
School of Engineering, Newcastle University, Newcastle upon Tyne NE1 7RU, UK
2
School of History, Classics and Archaeology, Newcastle University, Newcastle upon Tyne NE1 7RU, UK
3
Nottingham Geospatial Institute, University of Nottingham, Nottingham NG7 2TU, UK
4
Vindolanda, Bardon Mill, Hexham NE47 7JN, UK
*
Author to whom correspondence should be addressed.
ISPRS Int. J. Geo-Inf. 2021, 10(9), 575; https://doi.org/10.3390/ijgi10090575
Submission received: 30 June 2021 / Revised: 1 August 2021 / Accepted: 5 August 2021 / Published: 24 August 2021
(This article belongs to the Special Issue 3D Modeling and GIS for Historical Sites Reconstruction)

Abstract

:
Climate change poses an imminent physical risk to cultural heritage sites and their surrounding landscape through intensifying environmental processes such as damaging wetting and drying cycles that disrupt archaeological preservation conditions, and soil erosion which threatens to expose deposits and alter the archaeological context of sites. In the face of such threats, geospatial techniques such as GIS, remote sensing, and spatial modelling have proved invaluable tools for archaeological research and cultural heritage monitoring. This paper presents the application of secondary multi-source and multi-temporal geospatial data within a processing framework to provide a comprehensive assessment of geophysical risk to the Roman fort of Magna, Carvoran, UK. An investigation into the ancient hydraulic system at Magna was carried out with analysis of vegetation change over time, and spatio-temporal analysis of soil erosion risk at the site. Due to COVID-19 restrictions in place at the time of this study, these analyses were conducted using only secondary data with the aim to guide further archaeological research, and management and monitoring strategies for the stakeholders involved. Results guided inferences about the ancient hydraulic system, providing insights regarding how to better manage the site at Magna in the future. Analysis of soil erosion allowed the identification of hot spot areas, indicating a future increase in rates of erosion at Magna and suggesting a seasonal period of higher risk of degradation to the site. Results have proven that freely available multi-purpose national-scale datasets are sufficient to create meaningful insights into archaeological sites where physical access to the site is inhibited. This infers the potential to carry out preliminary risk assessment to inform future site management practices.

1. Introduction

Hadrian’s Wall, built between c. AD122 and c. AD130, marked the north-west frontier of the Roman Empire for almost three centuries, stretching 73 miles across Northern Britain. In 1987, the former military zone, which is now home to the archaeological remains of numerous Roman forts, milecastles and turrets, was designated a UNESCO World Heritage Site [1]. Previous excavations of Roman sites in the frontier zone have offered unprecedented insights into everyday life on the Roman frontier, transforming understanding of Roman Britain. Magna, meaning ‘fort at the rock’, is a unique Roman fort along Hadrian’s Wall that has not yet been the subject of a comprehensive research excavation. Magna is owned and managed by the Vindolanda Trust [2], and the distinctive anaerobic preservation conditions at the site make it an important archaeological resource with the potential to provide a rich body of evidence [3].
Climate change poses an imminent physical environment risk to cultural heritage sites and their surrounding landscape [4]. Wetland environments, such as those present at Magna, are particularly vulnerable to this threat [5]. Pressures from increasing temperatures and damaging wetting and drying cycles are threatening to unbalance the anaerobic soil conditions present at the site, putting the preservation levels and archaeological features at risk [4]. Furthermore, erosion and weathering may impact the volume of topsoil cover, exposing archaeological remains and increasing their vulnerability to damage. Long-term monitoring and analysis of the historic environment are thus essential to better appreciate changing conditions and understand how archaeological deposits can be sustainably preserved in the future.
Geospatial techniques, such as GIS, remote sensing and spatial modelling, have been well established as fundamental toolboxes for archaeological research and cultural heritage monitoring due to their ability to provide insights into sites where access or finance is not readily available [6,7]. Previous examples of geospatial analysis on Hadrian’s Wall include the Cultural Heritage Through Time (CHT2) project, where Fieber et al. [8] integrated numerous sources of multi-date and multi-sensor geospatial data, for the modelling and analysis of three Roman fortification sites on Hadrian’s Wall. Remote sensing can be used to detect and identify not only cultural heritage features but also the surrounding landscape and vegetation areas [7,9,10]. This is especially useful when COVID-19 has restricted physical access to sites but long-term weathering continues, necessitating the need to prioritise areas that are most at risk.
The aim of the study reported in this paper was to integrate various data sources and methodologies to help inform an understanding of the hydraulic and physical characteristics of the site at Magna, how they are changing over time, and identify future risks to archaeological preservation. This study was conducted under national COVID-19 lockdown restrictions, and was thereby limited to secondary data sources, with the intention that insights from each analysis would be integrated to inform intervention and monitoring strategies for the future management of the site. To approach this aim, three main stages were identified. These objectives and the methodology employed to address them are summarised in Figure 1.
The main threats identified to the site at Magna include physiological stress from drying soils during drought periods, and topsoil erosion in wet periods. Both these processes are driven by dynamics of the water environment at the site. Thus, it is important to better understand how water interacts with the landscape. Flow accumulation is standard procedure in watershed analysis [11] and has been used in fields as diverse as agriculture [12] and plate fault lines [13]. In our study, flow accumulation provided the ability to understand archaeological patterns by matching positions of current flow channels and low points against what is known to have existed in the past, and opens the opportunity to question if current features are the legacy of previously unknown anthropogenic landscape alterations. Flow accumulation has been shown to be important for soil erosion and sediment movement [14]. As a simple derivative of elevation at a single point in time, it lacks the ability to conclude on causes of desiccation, but it can support or discredit theories that seek to suggest why this might be the case.
To further analyse water dynamics at the site, a focus was made on the ancient hydraulic system. This was an essential component of Roman settlements [15], providing clean water throughout the year with wells, cisterns or aqueducts and wastewater disposal through drains and sewers. Another critical function was the drainage system, which was carefully planned to let rainwater flow away from the settlement as quickly as possible to avoid any damage due to runoff, especially in areas where heavy rainstorms occur. This underground network is likely to be well preserved below later sedimentation, and even if it is partially or wholly silted up, it is a favoured place for water to build up [16]. Thus, its identification and reactivation could play an important role for future water management at the site, firstly to be used for the introduction of water into the bog for increasing soil moisture, and secondly to remove water penetrating during the excavations and to estrange excess rainwater.
Alongside soil shrinkage during drought periods, water-driven soil erosion also poses a potential risk of exposure, escalating the threat to archaeological preservation. Thus, these environmental processes are important to factor into management of archaeological sites [17]. To quantify soil erosion and the associated risks for the landscape, several models have been proposed, of which the Universal Soil Loss Equation (USLE) [18] and its revised version, RUSLE [19], are the most widely used. The RUSLE has been extensively tested and implemented in the practice of soil conservation throughout the world, across all climatic zones and at varying scales [20,21,22,23]. However, erosion risk and modelling have rarely been the focus of archaeological study in the past. Howland et al. [17] demonstrated its effectiveness in this domain by implementing the RUSLE to assess erosion risk at Khirbat Nuqayb al-Asaymir, a Middle Islamic site in southern Jordan. While this study successfully provided an understanding of the spatial distribution of critical sites prone to erosion, variation across the temporal domain was not investigated. Assessing inter-annual variation and future risk of soil erosion offers the potential to provide more targeted and effective management solutions, critical to sustainable preservation of artefacts in the long-term [24]. Several studies have implemented statistical and machine learning approaches to estimate future erosion risk based on temporal trends in land cover change and rainfall intensity, the most dynamic features in soil erosion modelling [25,26,27,28]. However, these studies have mainly focused on mapping trends at a national or continental scale rather than individual sites.
In this study, our approach to the investigation is twofold. We attempt to both quantify the spatial pattern of erosion risk at Magna and analyse the temporal trends in this risk. Spatially, we implemented the RUSLE model to create a map of erosion risk at the site and highlight hotspots particularly vulnerable to erosion that may require further attention from management. Our temporal approach focuses on analysing inter-annual variability in erosion risk and estimating future changes in response to climate change, focusing primarily on changing patterns in the rainfall erosivity aspect of the soil loss model. This synergistic approach enables a comprehensive assessment of the current and future risks soil erosion poses to archaeological preservation at the site. Integration with results from further analyses provides the basis of management and monitoring recommendations to the stakeholders involved.

2. Materials and Methods
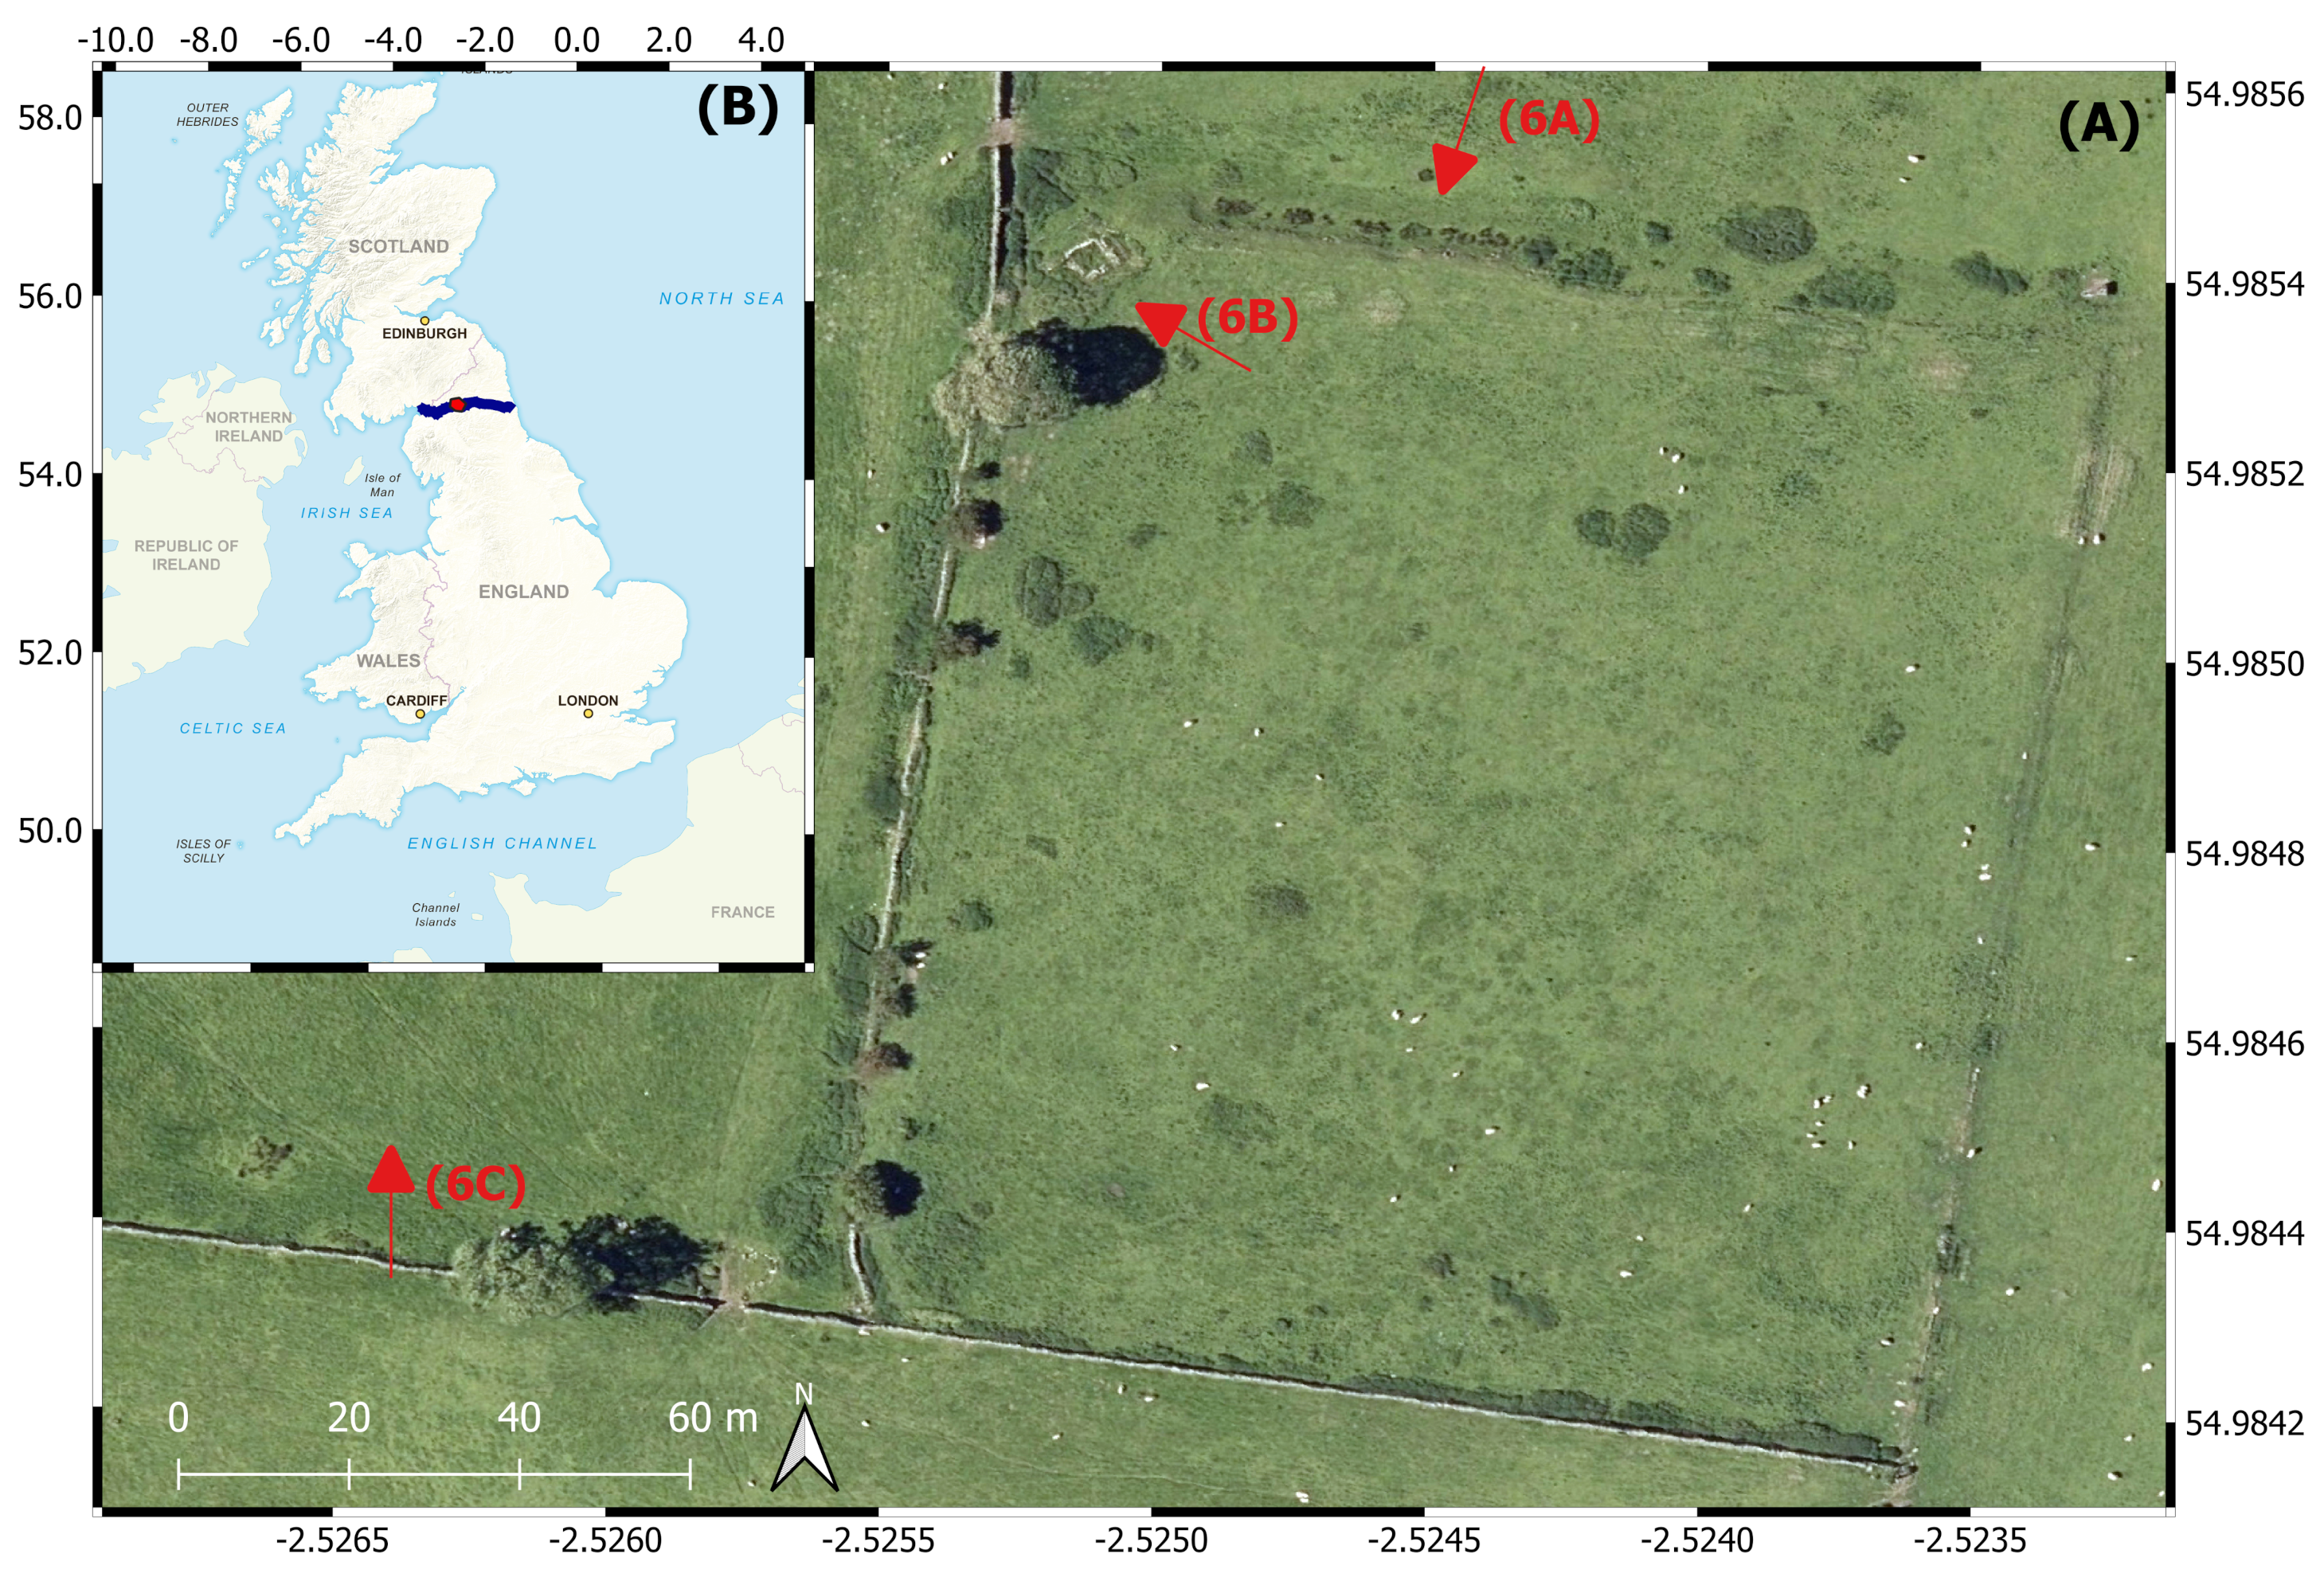
2.1. Research Area

The focus of this research was the Roman site of Magna (Carvoran) [29]. Vegetation and rainfall were analysed at a wider scale to provide context and allow the Vindolanda Trust to compare Magna against other sites in similar climates (Figure 2).

2.2. Ancient Hydraulic System

To understand the hydraulic characteristics at Magna, an important issue is the analysis of the ancient water system of the fort and settlement. The hydraulic system was a fundamental part of Roman settlements and it was designed at the first stage of the planning of each site, taking into account the specific geological and morphological characteristics, as well as all the local exploitable water sources. It was aimed at water supply, using techniques that best suited the specific cases, using collection features such as cisterns, withdrawal elements such as wells and transport systems such as aqueducts and pipes. Frequently these systems were used simultaneously creating a complex and perfectly functioning hydraulic network. Another crucial purpose was the drainage function—to let rainwater flow away from the settlement as quickly as possible and avoid any damage to the structures due to runoff, as well as the sewage function, that guaranteed the discharge of disposal water through drains and sewers. All these systems were built using channels. Due to its underground placement, the hydraulic network is probably well preserved, and even if it is silted up, it is still a favoured place for water to flow. Therefore, the identification of the ancient hydraulic system could play an important role in the water management and conservation of an archaeological site.
At Magna, secondary data sources were collated and plotted to provide an understanding of archaeological evidence and make predictions about archaeological structures and hydraulic systems, aimed at advising future water management of the site. These included a literature and historical maps review, and existing surveys analysis (Table 1 and Table 2). Much of what is known about the site from earlier investigations, as well as documents and maps, is elegantly reviewed in Robin Birley’s study The Fort at the Rock (1998) [16]. The most recent surveys provided more accurate maps for the positioning of the archaeological features.
A comparison to similar sites, such as Vindolanda [30], provided an excellent reference to understand likely building methods and techniques. Due to its spatial proximity and contemporaneity, we expect to find a similar scenario at Magna. Key features of the hydraulic system at Vindolanda include a spring-fed tank that supplied clean water through an aqueduct. A collecting water tank was placed in the centre of the fort and fed the wooden pipes supply network [31]. A main sewage/drainage system, built on one side of the streets and covered with flat stone slabs, collected the wastewater and rainwater, and was used to flush the latrine drains before flowing away from the fort. Open-access photogrammetric models were used to spot those elements [32].
An archaeological map was developed to visualise the possible configuration of the hydraulic system’s network at Magna based on these analyses. The output is a graphic vector map, created in AutoCAD (version 2020), where all elements were categorised in different layers and collated into groups of layers, thus allowing independent management of each group. The graphic sources used were also overlaid as raster images on separate layers, to correctly locate the elements on the map. This can provide a trace for the identification of the structures and their specific hydraulic functions, which may be significant for future excavation strategies. Once completed, raster (.tiff) maps were produced and georeferenced in QGIS (version 3.16.5). Some areas have been identified and highlighted to provide an indication on short-term and long-term interventions, as well as high- and medium-risk areas, which might require future management.

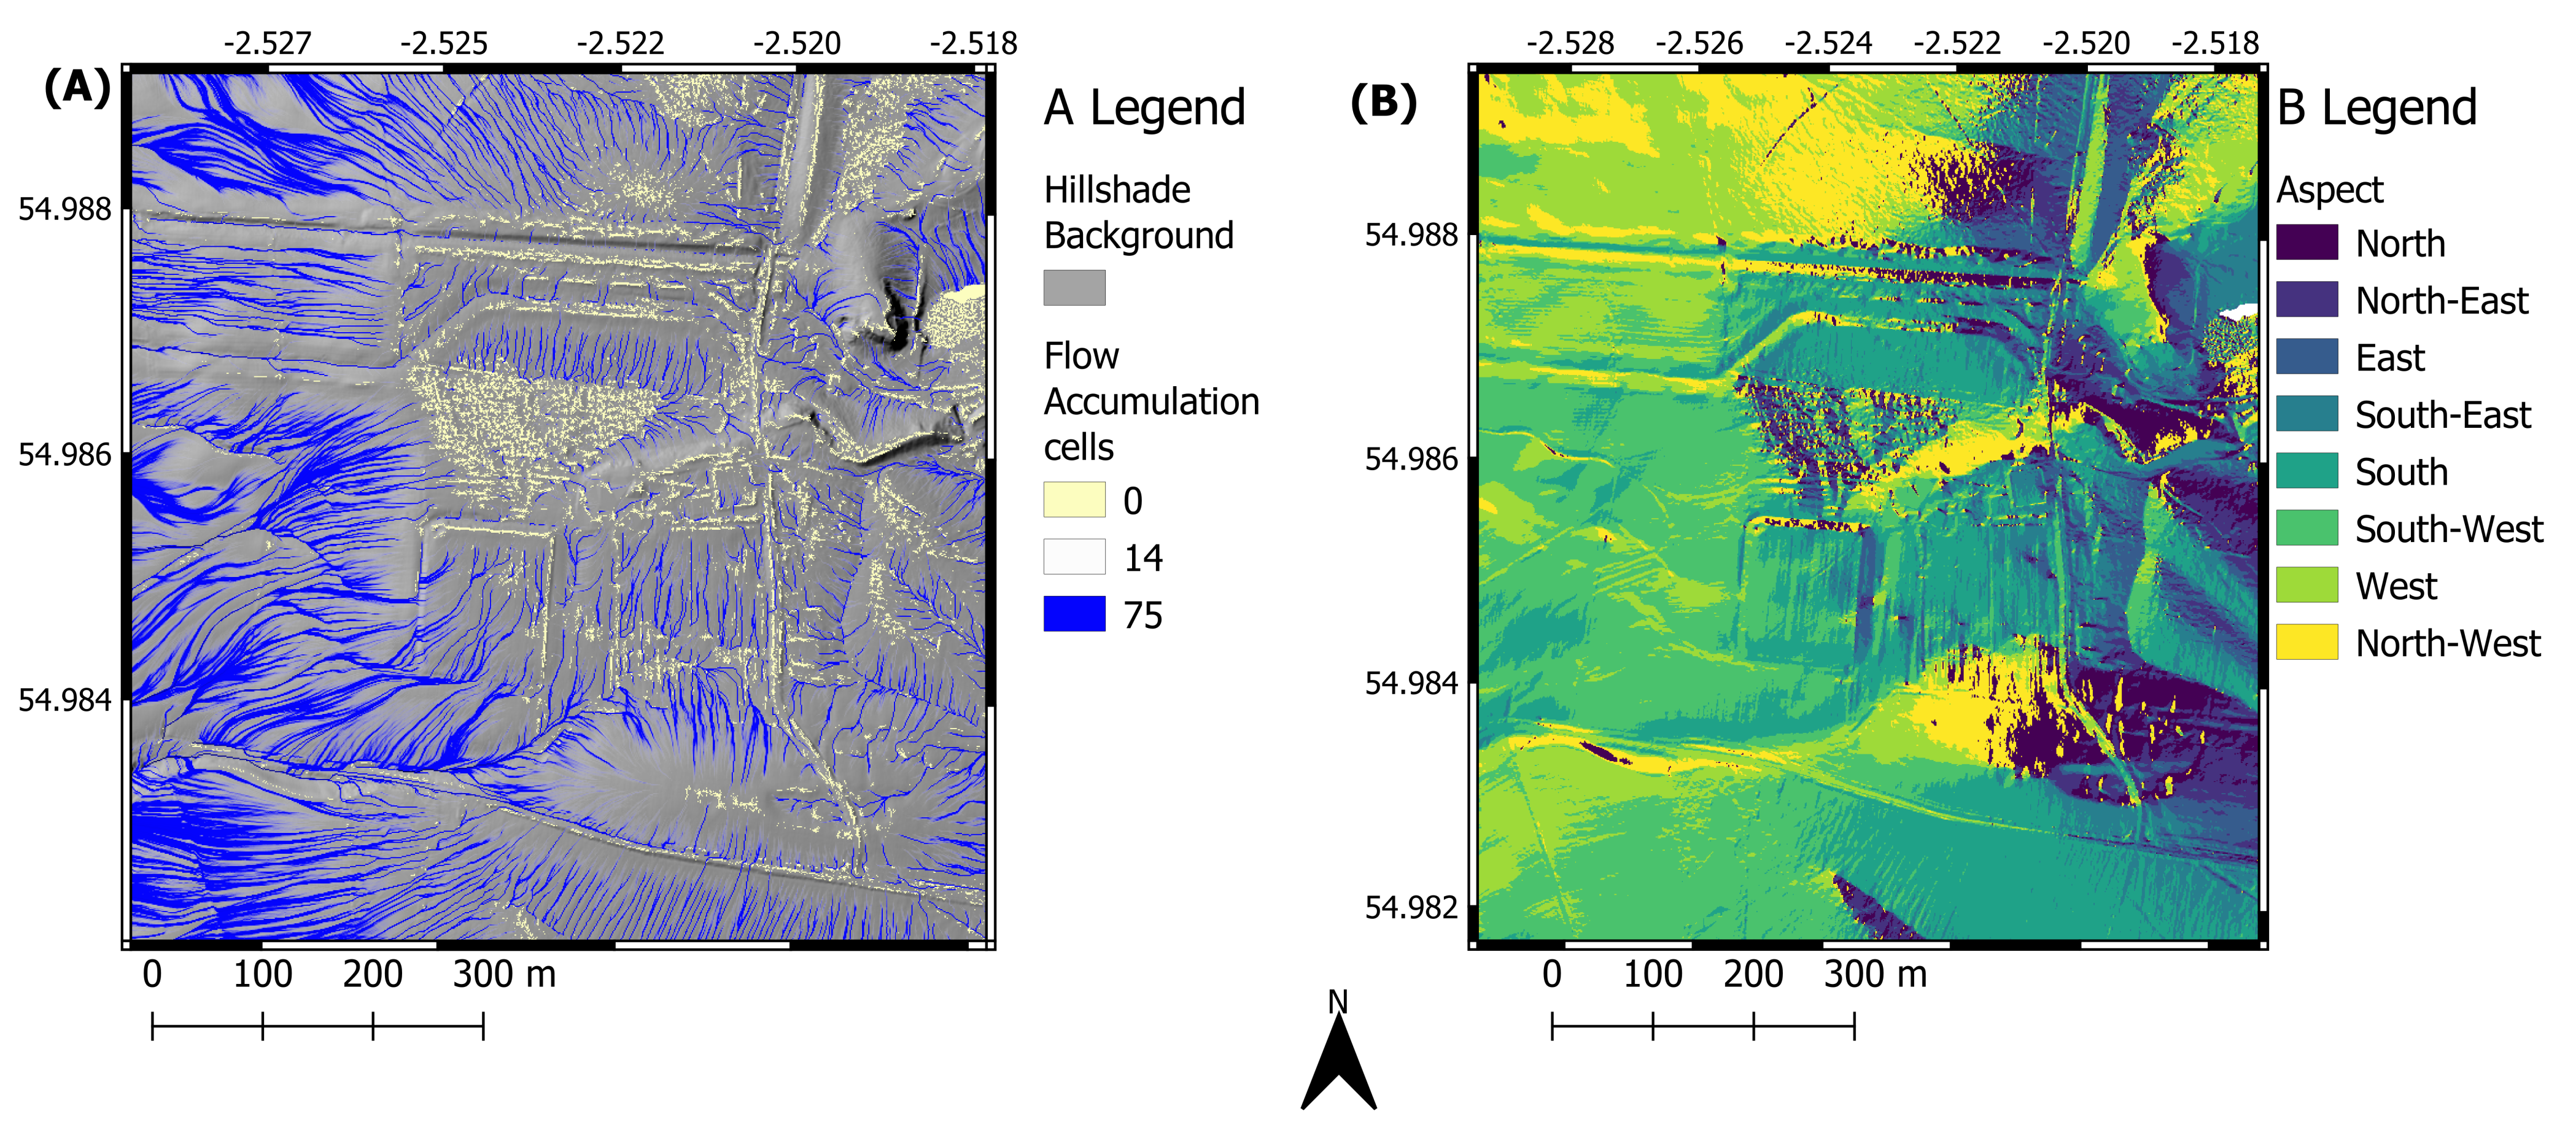
2.3. Digital Elevation Extracted Site Parameters

Ordnance Survey National Grid map tile “NY66NE” of the UK Environment Agency 1 m resolution LiDAR Digital Terrain Model (DTM) provided the bare earth elevation map of the region around Magna [33]. Derivative measures, calculated from the DTM, formed the basis of analysis on the current state of Magna to compare against the ancient hydraulic system and form the basis for subsequent risk analysis.
The QGIS GRASS extension (version 7.85) r.flow tool [34] was used to create a flow accumulation map using the D8 single-flow method which has become standard [35]. Unlike the layer later incorporated into the soil map, and against some recommendations [36], pits were not filled in prior to analysis to give a better visualisation of the soil saturation points [34]. Only cells with accumulations values >74 or with a 0 value were displayed to characterise the two key dynamics of the site.
Whilst flow pathways are known to tend from dendritic to concentrated channels [37], aspect and slope layers were created to confirm the direction of runoff. These were undertaken using internal QGIS tools, which were also used to create a hillshade map in order to highlight elevation anomalies [38]. Hillshade also provided a base map for source surveys to be plotted upon for comparison to actual ground characteristics.

2.4. Spatio-Temporal Analysis of NDVI

Time series were developed to provide records of environmental change at the site that might identify potential future risks. The Normalised Difference Vegetation Index (NDVI) [39] was calculated at the site and along the wall using Google Earth Engine and its associated Landsat archives.
The NDVI for the Wall was calculated across a 300 m buffer created in QGIS from the Newcastle Repository Hadrian’s Wall shapefile [40]. Median pixel values from June to August Landsat 5 image stacks were fed into the NDVI equation where cloud cover was less than 10% of the scene [41]. The resulting .tiff files were extracted and visualised in QGIS. For the site of Magna, as dictated by the sumo survey, a time series was extracted using images from Landsat 5, 7 and 8 to provide the most extensive record possible. This provided a time series of vegetation change at Magna and a comparison to values along the rest of the wall. The yearly means were analysed.

2.5. Modelling Soil Erosion

The Revised Universal Soil Loss Equation (RUSLE) is an empirical erosion model that predicts annual rates of soil loss over long periods of time [19]. This model was selected for the study at Magna due to the equation’s relative simplicity, compatibility with GIS-based analysis [42], and its ability to be appropriately applied to smaller-scale areas, compared to the larger agricultural standards on which many soil studies are based [17]. According to Renard et al. [19], the equation states that:
A = C × K × L S × P × R ,
where A is the annual soil loss rate ( t   h 1   y 1 ); C and P are dimensionless factors, ranging between 0 and 1, representing the cover management factor and support practice factor, respectively; K is the soil erodibility factor ( t   hMJ 1   mm 1 ); L S is the dimensionless slope length and steepness factor; and R is the rainfall erosivity factor ( MJ   mm   ha 1   h 1   y 1 ).
The K factor expresses the susceptibility of soil to erode and is estimated using equations based on soil properties such as organic matter content, soil texture, soil structure and permeability [43]. The P factor represents the effects of surface management practices that are applied to reduce soil loss, considering the impacts of features including contour farming, stone walls and grass margins [44]. The C factor’s key function is to capture the differences in soil loss in vegetated areas depending on crop composition and crop management systems [20,45]. There have been various methods and equations pro-posed to calculate the C, K and P parameters, varying with landscape and climatic zones [23]. Several studies undertaken by the European Soil Data Centre (ESDAC) have produced freely available, high-resolution (100 m) datasets for each input factor across the European Union. The EU layers corresponding to C, K and P factors were adopted in this study. Further details of the computations can be found on the ESDAC website [46].
The LS factor summarises the effects of topography on soil erosion, combining the influence of both slope length (L) and slope steepness (S). The ArcGIS Pro (version 2.8) hydrology toolset was employed for data processing and computation of the LS factor from the previously mentioned DTM according to the equations proposed by Desmet and Govers [47]. Further details of the computation can be found in the Supplementary Document provided. Among the six input parameters, the LS factor has the greatest influence on spatial variation in soil loss at the site, as other parameters will not vary much over such a small area.
The rainfall erosivity (R) factor quantifies the relationship between rainfall and sediment yield [48]. The rainfall erosivity of a storm event is calculated directly from high-temporal-resolution precipitation data by multiplying the total kinetic energy of the storm event by the maximum 30-min intensity. The R factor then accumulates these values over all rainfall events and averages it over multiple years [18,49]. The ESDAC developed a Rainfall Erosivity Database at European Scale (REDES) based on calculations using high-temporal-resolution data for rainfall stations across Europe [50]. However, under closer inspection only 39 stations were included for the UK, over half of which had less than 15 years of data. More importantly, available precipitation records were found for UK stations nearby Magna that were not included in this study. Therefore, to obtain a more representative estimation of the rainfall erosivity at Magna, its seasonal variation, and future projections, we created updated maps of the annual and monthly R factors over the UK using long-term precipitation records from stations with at least 15 years of data between 1995 and 2019, and a spatial regression model. Further details of the methodology employed can be found in the Supplementary Document.

2.6. Estimation of Future Erosion Risk

Future rainfall erosivity was estimated using the fitted regression models and future climate projections from the CNRM-CM6-1 climate model [51], obtained from the WorldClim database [52]. Further details are provided in the Supplementary Document. Climate projections are model-driven descriptions of potential future climates under a given set of possible climate change scenarios, and thus, GCMs represent powerful tools to produce spatially explicit predictions on future climate scenarios [25]. However, given that rainfall intensity and duration have large uncertainty in future predictions, results should be interpreted with caution. Monthly rainfall erosivity values were estimated from Magna for the periods 2021–2040, 2041–2060, 2061–2080 and 2081–2100, under three different future climate scenarios, or Shared Socio-economic Pathways (SSPs). SSPs represent different future socio-economic scenarios that are used to derive emission scenarios and thus climate change projections. In this study, the chosen scenarios to investigate were SSP1-2.6, an increasing shift towards sustainable practices and thus a more conservative pathway, SSP2-4.5, the intermediate scenario and the most widely used, and SSP5-8.5 representing a business-as-usual scenario in which there is little to no change to climate policy and therefore the most extreme changes to climate.

2.7. Web Dashboard

A QGIS project was created making all the layers and analysis available to the Vindolanda Trust to facilitate future analysis and management. All layers were projected into OSGB36 British National Grid for consistency and to improve ease of georeferencing maps. Furthermore, an online dashboard was developed to provide open and easy access to the analysis [53]. Geolocation functionality is provided which allows those currently at Magna to access this data via smartphone/tablet and use their position to update what is seen on the dashboard as the user moves around the site. This was achieved by using the open-source JavaScript libraries Leaflet and the ESRI Leaflet plugin.

3. Results

3.1. Water System Dynamics

Results of the flow accumulation analysis (Figure 3a) demonstrate a lack of substantial flow running into the fort area. Furthermore, the site is shown to be a source of water flowing downhill. These observations are reinforced by the slope aspect maps (Figure 3b). The flow accumulation also infers the expected position of a bog through a cluster of cells with 0 values for flow accumulation, pits, to the north of the fort. The results only suggest a small drainage catchment. Thus, it is unlikely that the area covered by these pits is large enough for rainfall alone to have created the recent size of the bog.

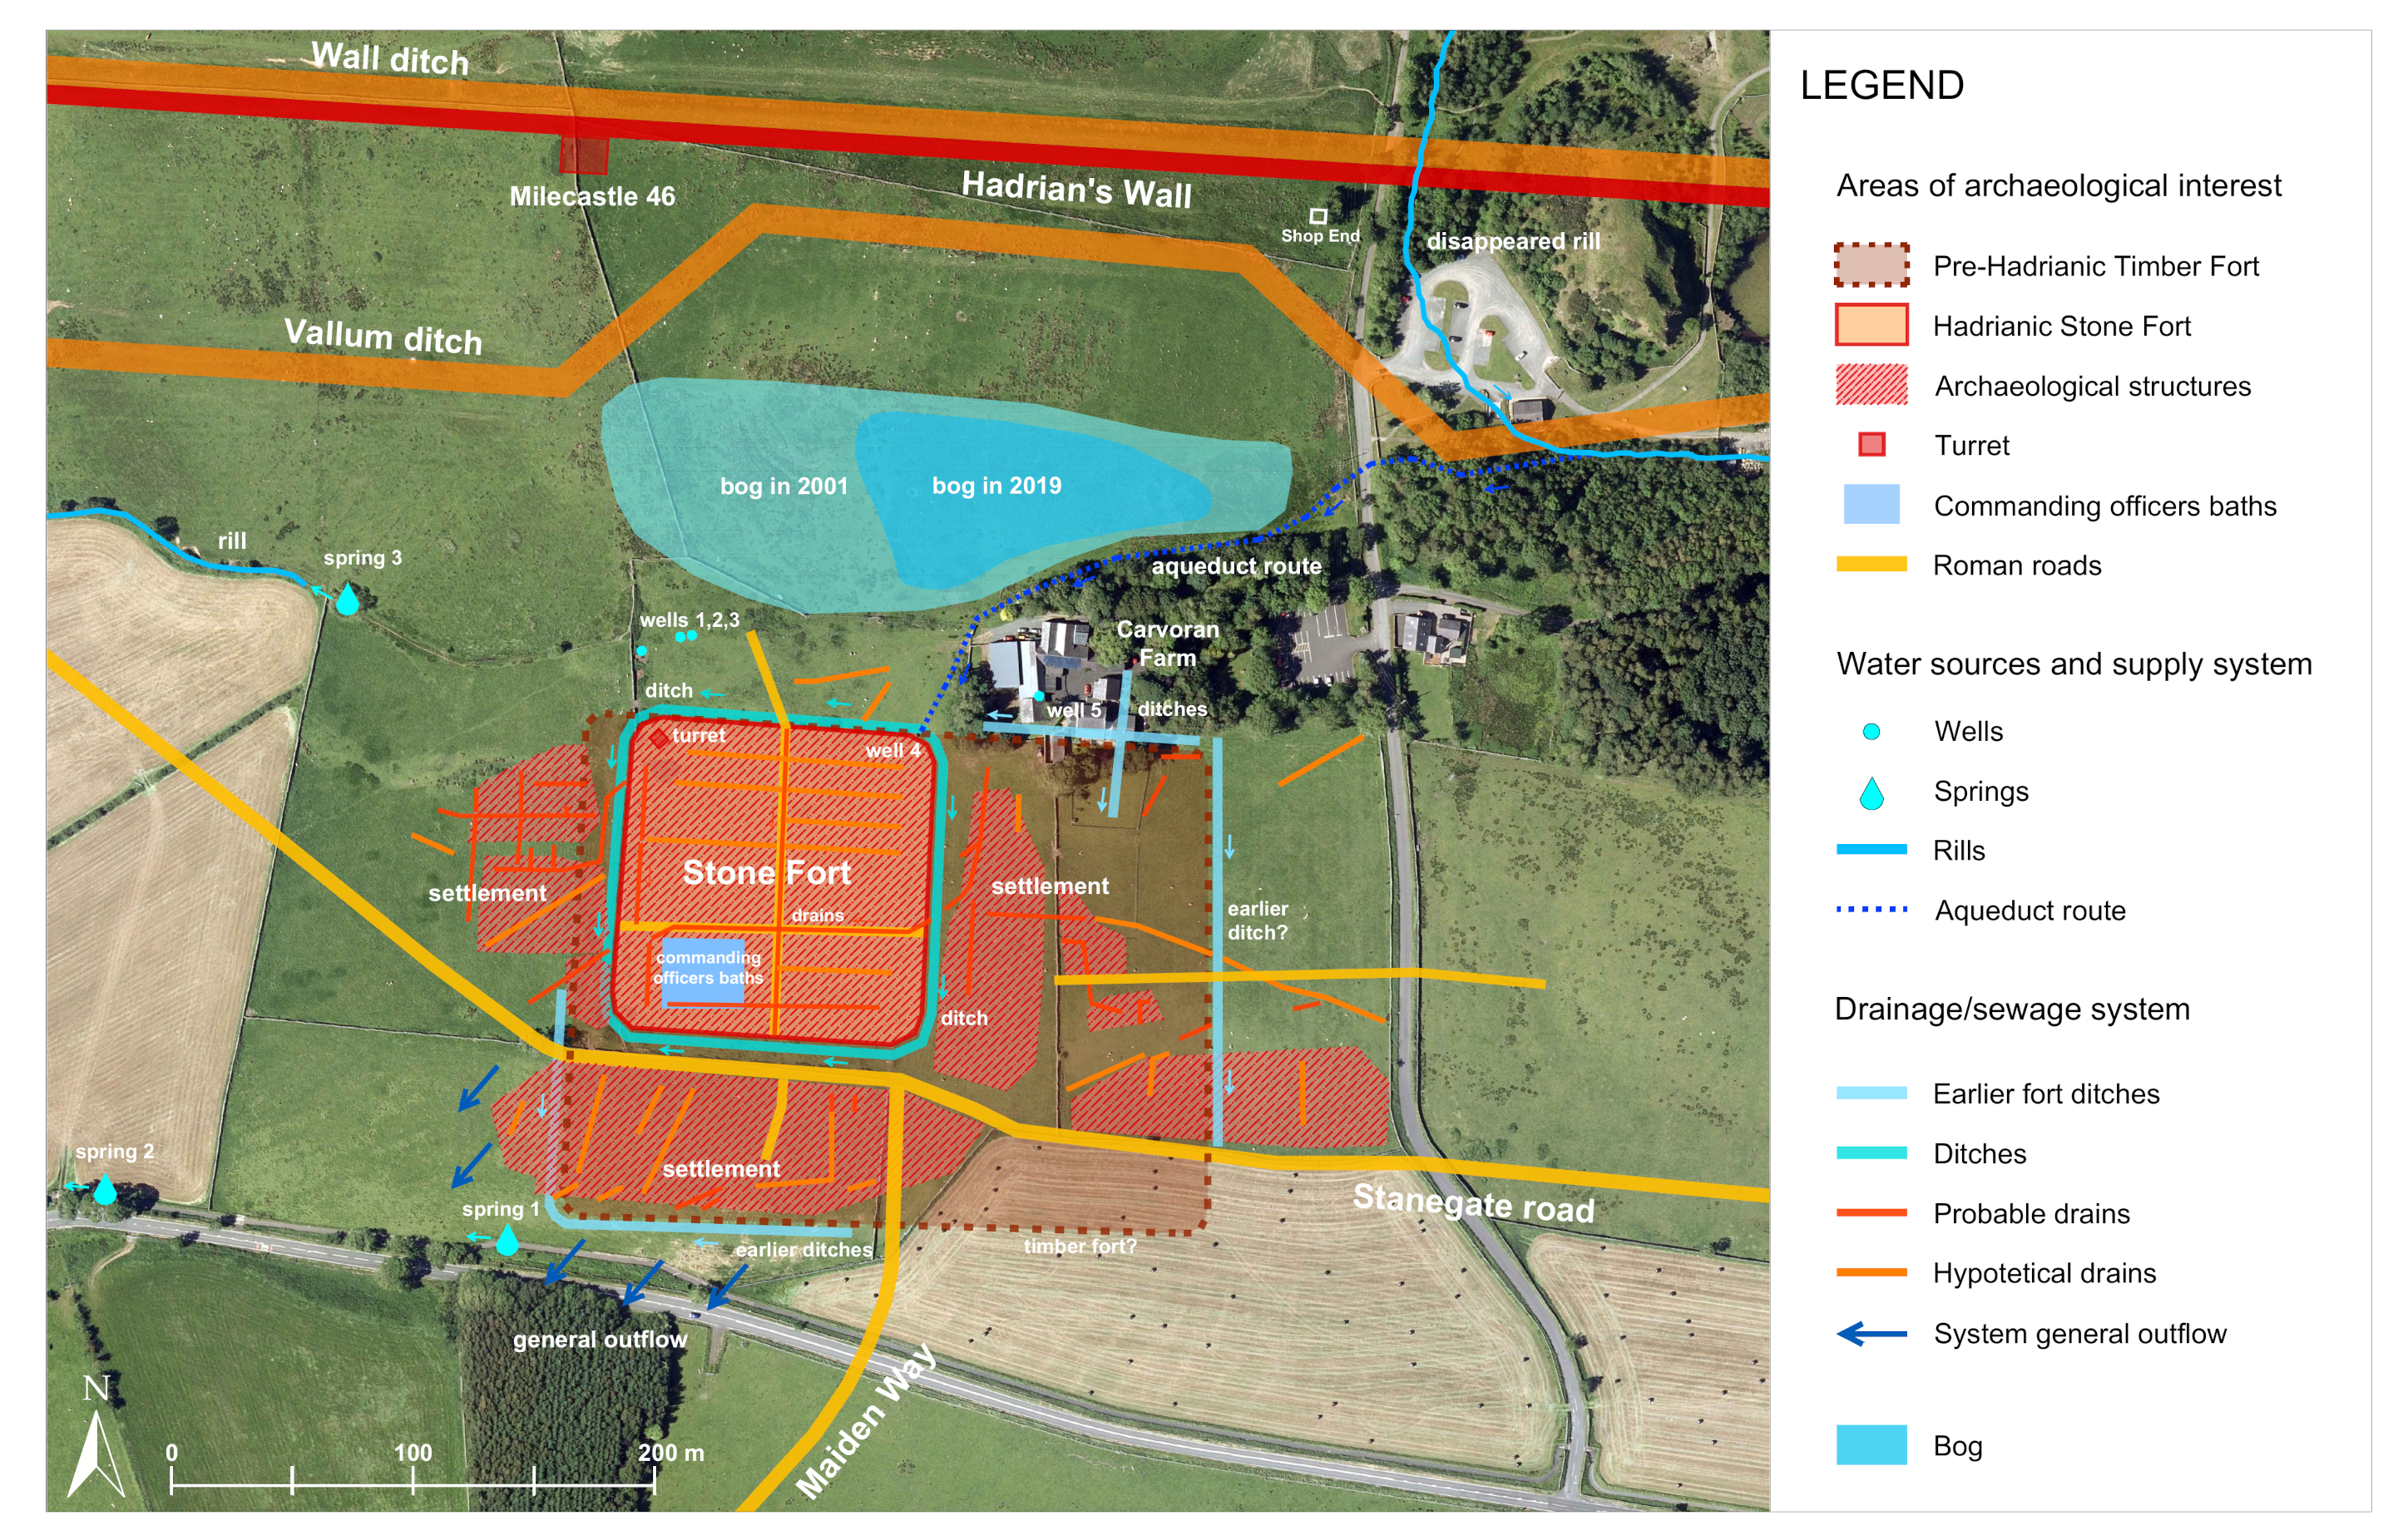
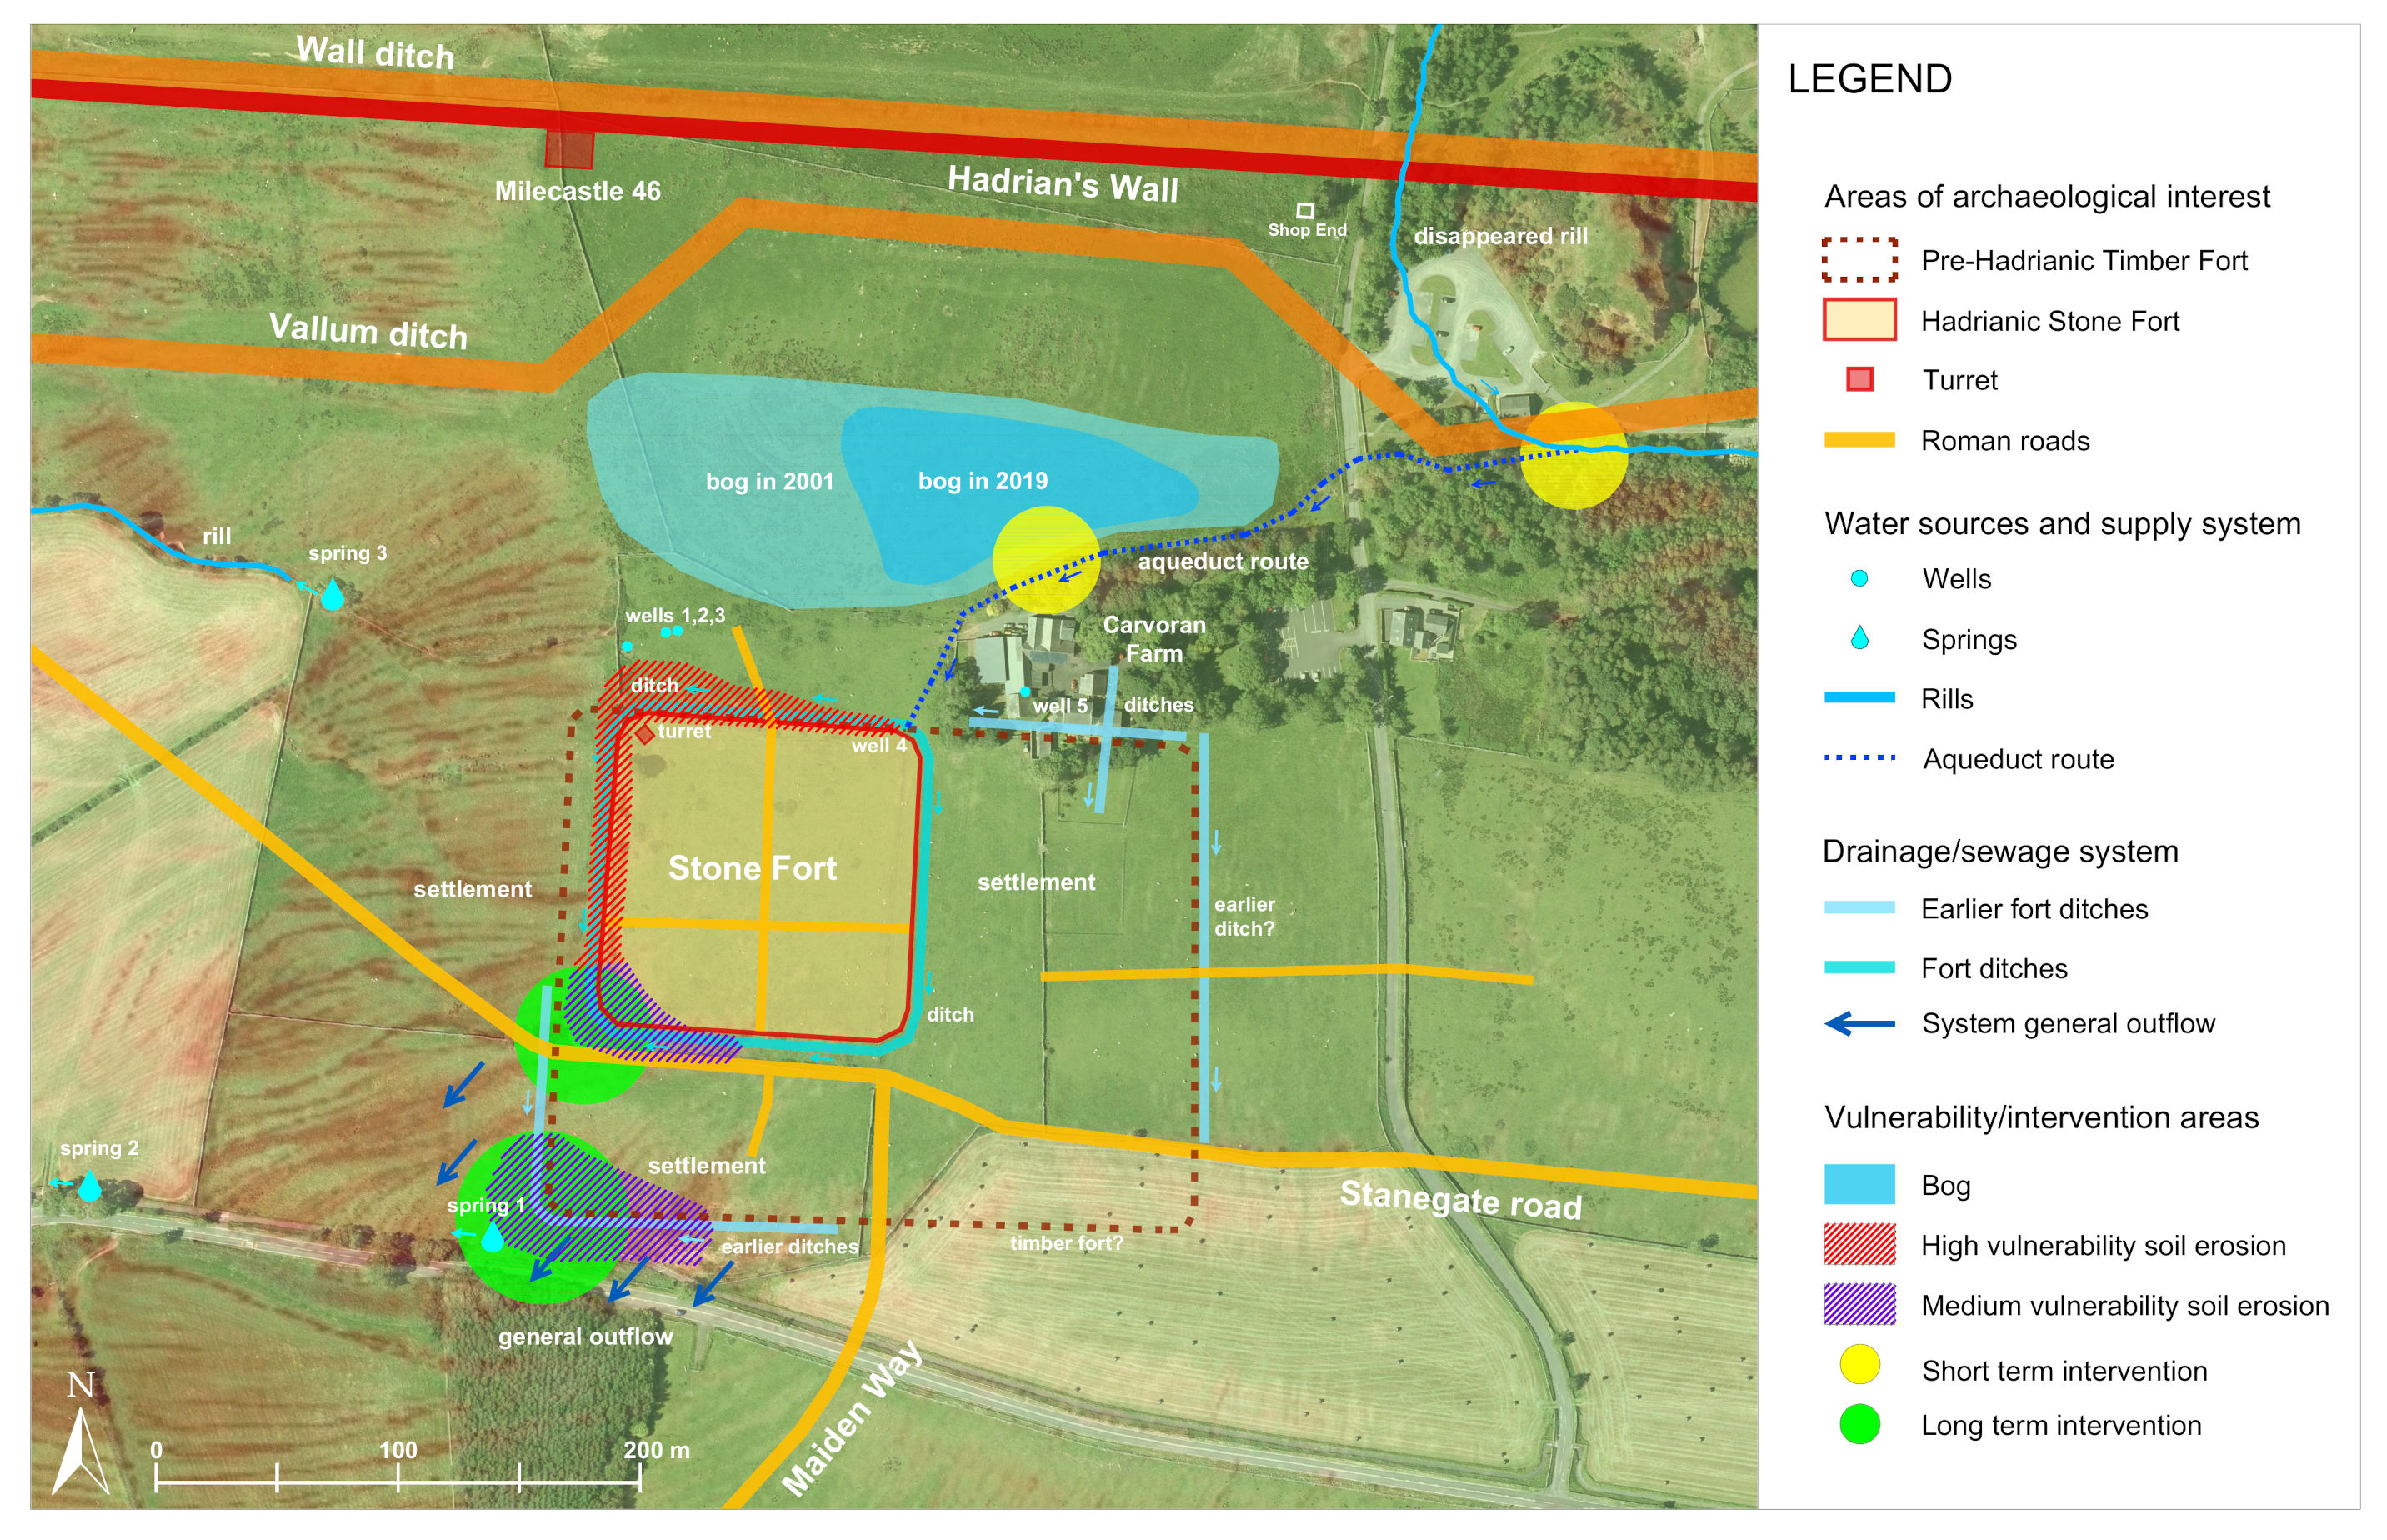
3.2. Ancient Hydraulic System

The analysis of critical data collated from indirect sources allowed the creation of a vector prediction map (Figure 4). This shows archaeological evidence (Stanegate road, Maiden Way, Hadrian’s Wall and Vallum, Milecastle 46, Stone Fort), archaeological area predictions (settlement areas, earlier timber fort area), and the scheme of the ancient hydraulic system, which includes the supply system (springs, well, rills and the aqueduct’s route) and the drainage/sewage system (ditches, drains, general outflow). The related sources are reported in Table 1 and Table 2.

3.3. Trends in Vegetation Cover

The analysis over the entirety of Hadrian’s Wall indicated that there has been little change in sub-decadal NDVI values (range: 0.56–0.7, SD: 0.19), and thus vegetation cover, along the length of the wall throughout the decades in question. Similarly, yearly average NDVI values at the site of Magna show no significant trend over time at the alpha value of 0.05 (n = 370 images, R 2 = 0.43, p = 0.66). A Pearson’s r test was applied to test for correlation between these yearly averages over time.

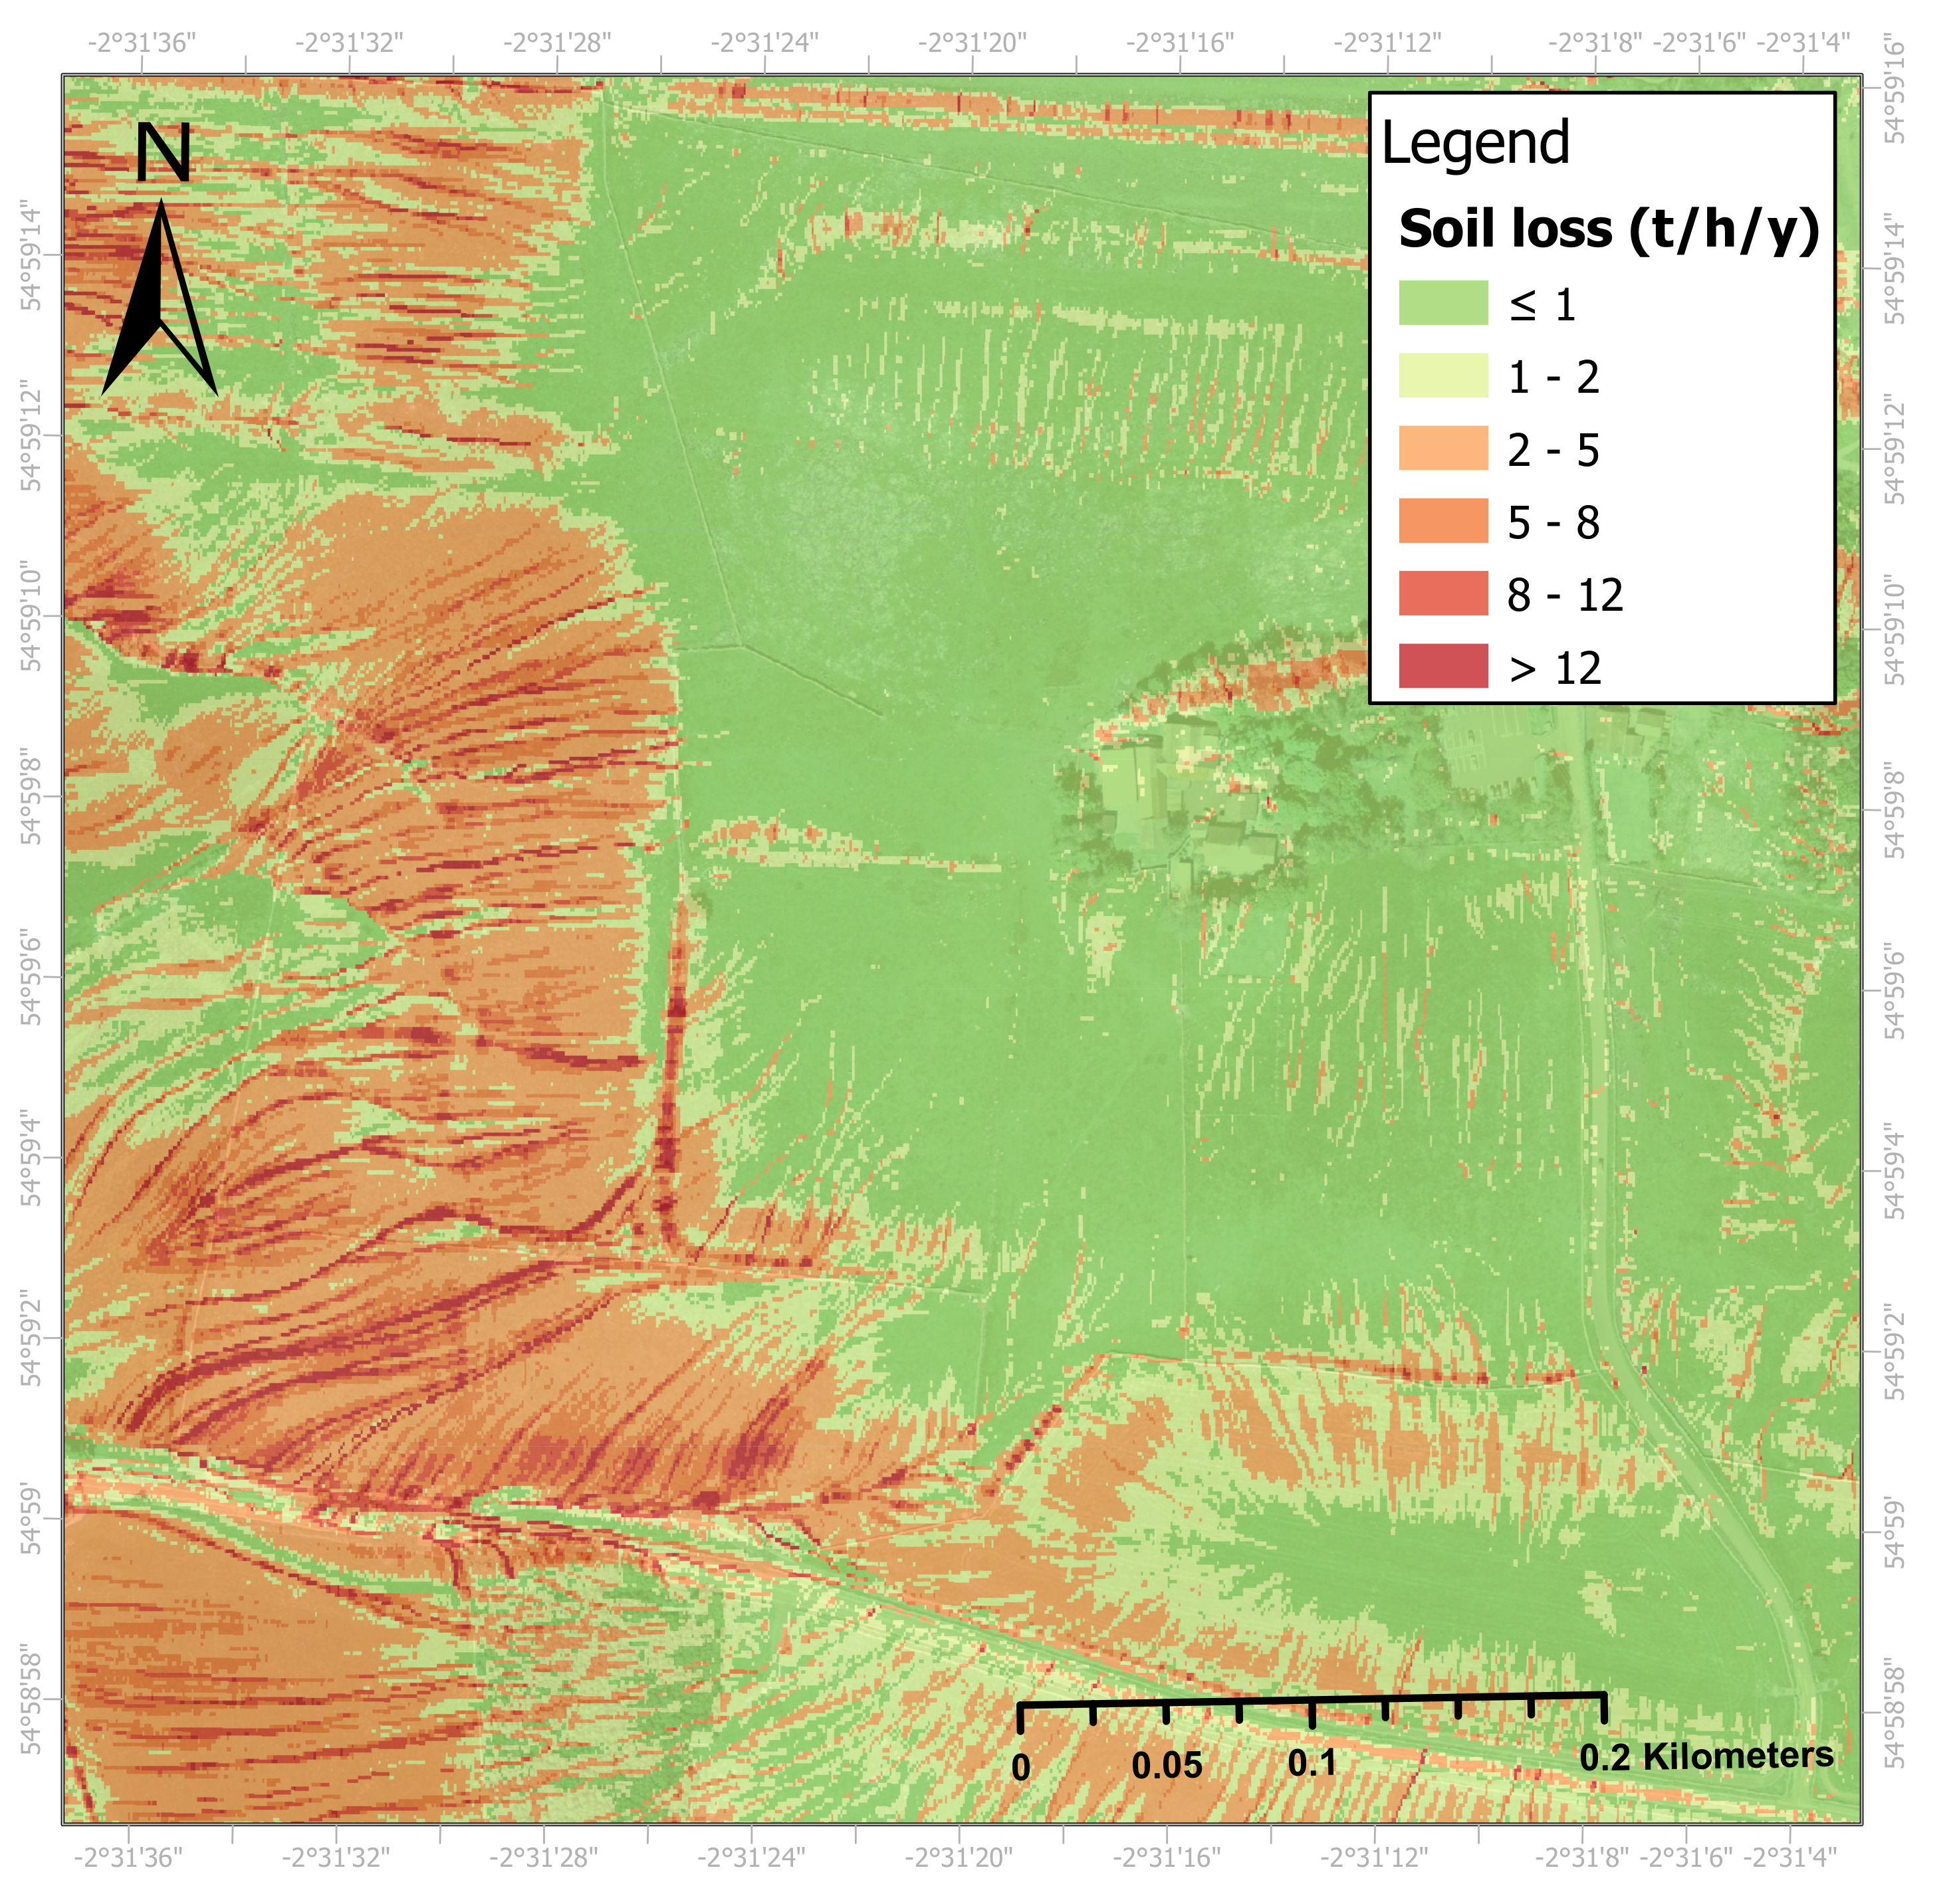
3.4. Spatial Variation in Soil Erosion Risk

The resulting soil erosion model calculated using the RUSLE is shown in Figure 5. The soil loss values in the area encompassed by Magna Fort ranged from 0 to 57.32 tha 1 y 1 , with an average of 1.36 tha 1 y 1 . 72.33% of the fort has presents little or no soil loss (0–1 tha 1 y 1 ). These losses occur in much of the north-east area within the fort. 3.47% of the fort is at moderate risk of soil loss (5–10 tha 1 y 1 ) while losses greater than 10 tha 1 y 1 are classified as high, and occur in only 1.42% of the site within the fort. High erosion risk is concentrated at the western and southern edges, corresponding to the fort ditches, and in the south-west corner where the commanding officers bath house is known to be located. A further zone of moderate erosion risk can be seen along the northern ditch and in a smaller zone of in the area surrounding the exposed turret in the north-east corner of the fort. Examination of the broader landscape that surrounds the fort reveals that fields to the west and south are characterised by high erosion rates with a large proportion of the land having an estimated soil loss of over 5 tha 1 y 1 .
Whilst COVID-19 restrictions limit our ability to evaluate the accuracy of these estimates by comparing with in situ data, archival aerial photography can provide valuable validation. Figure 6 shows aerial photography taken of the site during 2020. Figure 6c shows the field west of the fort, predicted by our model to have very high rates of erosion. In a large proportion of the field there are visible signs of sediment disruption compared to the surrounding land, suggesting that the land is particularly susceptible to soil erosion. The most visible signs of soil erosion, that can be detected from the aerial photography, can be seen on the northern edge of the fort as shown by Figure 6a. A large section of the slope has very little vegetation present and soil is exposed, probably the result of erosion over time. While this section was predicted lower risk than other areas of the fort, its increased soil loss compared to surrounding land validates the predicted soil loss risk at these areas. This can also be demonstrated at the turret on the north-west corner of the fort, as shown in Figure 6b, where a section soil has been exposed, further supporting the estimates from our model.

3.5. Inter-Annual Variability in Erosion Risk

Monthly rainfall erosivity values are summarised in Figure 7. There is a clear trend of increasing erosivity in the summer months, peaking in August at 111.52 MJ mm ha 1 h 1 y 1 , over 4 times the magnitude of erosivities for months February to May. July and June are the next most erosive months, with rainfall erosivity remaining high until October, before declining into the winter and spring months. Thus, the highest risk of soil loss at Magna will take place between the months of June and October. These results support similar findings from previous studies carried out by the ESDAC into seasonal rainfall erosivity across the European Union [54].

Projected Future Changes in Erosion Risk

The projected monthly rainfall erosivity values, based on observed values and WorldClim datasets, are shown in Figure 8a–d in terms of relative change since the observed baseline values. Rainfall erosivity is proportional to erosion rates estimated by the RUSLE, thus these values also reflect relative change in erosion risk at Magna, assuming other parameters remain constant. Short-term (2030–2050) SSPs display similar trends in changing monthly values. Erosion risk is projected to increase from December to March. March in particular shows a sharp increase under all climate scenarios, with erosion rates increasing by approximately 40% by 2030 and 30% by 2050. The months from April to November show little change or a slight decline in erosion rates in the short term, with the exception of September when erosion rates are expected to increase. Towards the end of the century (2070–2090), and in particularly by 2090, more dramatic changes can be seen. SSP1-2.6 shows a similar pattern and magnitude of changes as in the preceding decades. However, under both the other scenarios, by 2070, increasing erosion rates will be observed in summer months that had previously shown a slight decrease. September is predicted to see the biggest increase by 2090, estimated as a 38% increase under SSP2-4.5 and 114% under SSP5-8.5. Overall, under both these scenarios, erosion risk in all months is expected to increase by 2090. In general, results indicate that land at Magna will be increasingly susceptible to erosion in the future.

4. Discussion

The results provide a geospatial basis with which to compose information about the characteristics of a historic site such as Magna. The system is designed to be repeatable to manage sites in the context of future climate and land management changes. Moreover, the dashboard has provided the ability to disseminate the knowledge collated about the site. The geolocation feature allows on-site visualisation which can be used to influence careful practices around high-risk areas of the site.

4.1. The Aquifer and Hydraulic System

Water is not lacking at Magna [16] and it is confirmed by the presence of the peat bog to the north of the fort. However, Birley [16] argues that the site at Magna may have struggled with water supply due to the steepness of the west side of the fort and distance to the nearest stream. Therefore, a short aquifer may have existed from the north east which would have silted up and overflowed when the Romans ceased maintenance, resulting in the formation of the bog. Further degradation of the aquifer system is potentially the cause of the bog shrinking over time: from 2001 to 2019, it decreased in size by 50% (Figure 4). To have influenced the size of the bog so dramatically in a short period, a significant reduction in rainfall would have been expected, whereas the removal of inflow may have made the bog more susceptible to change. The flow accumulation strongly supports this argument, exhibiting the bog through a collection of DTM pits, but with only a small drainage catchment—the few meters south of the Vallum—and a considerable amount of water flowing away from it.
Moisture in the ground provides the anaerobic physiochemical conditions to preserve organic finds, such as leather and wood. In fact, the presence of wooden writings tablets at Magna is highly probable, as attested to in the waterlogged environments of Vindolanda and other forts along Hadrian’s Wall, that demonstrate the everyday use and circulation of these tablets [55,56]. Therefore, the stability of soil moisture conditions is a key factor for the preservation of artefacts, and when it is disrupted the archaeological record suffers, compromising future studies with the loss of archaeological and historical heritage.
Water management becomes a crucial focus for the current and future conservation of the site. In the winter months severe rainstorms occur, but during the summer the wells in the fields dry up, and the site suffers from a lack of water. At the present time, a 75 m deep well, sunk in 1980 at Carvoran Farm, is used for water supply, but in Roman times the fort was probably supplied by an aqueduct, connected to a perennial source to ensure a constant supply. The catching point could be identified in a source supplying a rill east of the farm, not more than 300 m away. [16]. The aqueduct collected its waters and crossed the moss field up to the north-east corner of the fort. After its abandonment, the silting up of the channel could have let the water supply the bog, which is considered post-Roman. However, this does not detract from its importance in maintaining artefacts and therefore it has been highlighted as an area of risk that needs to be actioned upon by the Vindolanda Trust. Activities at the Whinstone quarry which opened in the 1870s may have disrupted the archaeological evidence, but it is recommended that geological surveys are used to find the source used by the Roman aqueduct. If located, it may be possible to re-instigate the Roman aqueduct’s channel in order to let water flow again, supplying the bog and increasing soil moisture.
Related to the site’s drainage system, there are different type of channels that con-tribute to this function:
  • The Roman sewage system, usually located underneath the mains roads, collecting wastewater from the buildings of the fort and settlement (from the anomaly plan of the Timescape geophysical survey of 1999 we can observe the position of possible roads and related drains).
  • The Roman drainage system, consisting of open-air channels with a drainage function, located along the perimeter of the fort and in the site’s ground lowest levels to remove waters from the area.
  • The numerous modern farming drains built from the 1820s for agricultural purposes, that constitute the actual drainage system of the site.
Once located and cleared, Roman channels and more recent agricultural ones, could be harnessed across the site to support water management. Channels may be purposefully blocked or opened up depending on the requirements to either re-saturate or remove water from different parts of the site to aid in its long-term management and preservation of sensitive archaeological deposits.

4.2. Lack of Visible Long-Term Degradation

High NDVI values across the wall suggest that it is well vegetated, complementing schemes from governing bodies to maintain vegetation and reduce erosion [57]. The inaccessibility of much of the wall, especially for development, may play a large role in reducing degradation. Regardless, similarities suggest that management methods in place across the wall may also be applicable at Magna. Management methods from sites with similar rainfall erosivity may also be applicable here, hence the national-scale map for this variable.
Issues of soil drying, highlighted by the Vindolanda Trust [3], are not represented in the NDVI results as shown by the lack of NDVI change through time at the site which may suggest that the causes of drying at the site are shorter term and have not yet impacted surface vegetation. The lack of a clear trend may in part be an artifact of missing seasons impacting the mean. Therefore, alternative remote sensing methods could be considered to monitor these archaeological problems. Only having NDVI data from the last 40 years of an ancient site requires a realistic understanding that longer trends and earlier causes will not come out in a time series analysis. However, NDVI at a higher resolution could be used for feature analysis [58] which may be an effective way to build on and test our predictions on ancient hydraulic systems.

4.3. Potential Future Degradation

It is possible to hypothesise that the general outflow of the drainage/sewage system was located in the south-west corner of the site based on the flow accumulation towards the south west (Figure 4). The systems to manage the concentration of water have been removed or buried, leading to the designation of this as an area at risk of erosion. This correlates with the soil erosion map. However, this may be accounted for by the inclusion of flow accumulation as an input.
Results of the soil erosion model indicate that risk of soil loss at Magna will increase throughout the century under all climate scenarios. Combining the archaeological prediction layers with the soil map allowed for high-risk areas to be highlighted, as shown in Figure 9. It would be strongly advised that this research is taken further to manage areas where archaeological remains may be exposed with the longer-term degradation. Knowledge about the time of the year when the highest erosivity occurs can guide the implementation of targeted mitigation strategies. For example, in summer months when erosivity is high, sections of the fort with the highest erosion rates (north ditch) could be fenced off to prevent grazing and visitor tramping, which could further increase the risk of sediment loss [59].
Aerial photographs of the site show the presence of stone walls along the western and southern edge of the fort, a support factor that was not incorporated into our model, and which potentially explains the lack of in situ evidence of erosion predicted here despite being identified as high-risk areas in the model. Similarly, the presence of landscape features, e.g., roads, stone walls or fences that may interrupt runoff and reduce the slope length, but are not identified in the DTM. Further processing could identify and map these features, but these have not been carried out to provide simpler repeatability should the Vindolanda Trust want to update the system in time. A further important factor to consider is that the principal function of the RUSLE model is to predict the potential risk of erosion, rather than quantifying actual erosion [17]. Thus, it should not be anticipated that large quantities of sediment will be lost from Magna every year, but rather sediment in the higher-risk sections of the fort will be likely to erode.
Overall, this analysis provides a framework to investigate spatio-temporal variation in soil erosion risk at any site across the UK, facilitated with the production of a high-resolution map of rainfall erosivity. In particular, this methodology could be transferable to other archaeological sites across the country. While particular detail was taken in the production of rainfall erosivity and topographic factors of the RUSLE model, future work could look to improving other layers through the integration of higher-resolution national datasets, aerial photography, and in situ observations with regard to soil properties. Further work could also look to incorporate future changes in other aspects of the model besides rainfall erosivity. For example, changes in land use and in support practices over time could have significant impact on future rates and spatial patterning of erosion at the site, which were not accounted for within this analysis.

5. Conclusions

The aim of this study was to develop an understanding of the hydraulic and physical characteristics of the Magna site and how these are changing over time in order to provide an assessment of current and future risks to archaeological preservation. Through the integration of flow analysis, historical maps and geophysical surveys, a broad actionable understanding of how water interacts with the landscape was achieved. From this, inferences about the ancient hydraulic system were structured, providing further insights regarding how to better manage the site at Magna in the future. An initial analysis of vegetation change over time was conducted, suggesting no significant trends, and opening up potential future directions for research into changing environmental conditions at archaeological sites. Finally, the RUSLE model was applied to analyse both spatial and temporal variability in soil erosion risk, allowing the identification of hot spot areas, indicating a future increase in rates of erosion at Magna and suggesting a seasonal period of higher risk of degradation to the site. By integrating results from all the research strategies, areas of the site needing attention or that are vulnerable were identified. The results are illustrated in the intervention/risk map (Figure 9), where areas that require short-term and long-term interventions are highlighted, as well as areas where the risk of soil erosion is to be considered in a high and medium range.
In addition to the highlighted areas, the following short and long-term actions are proposed for the management of the site. These suggestions are intended to help direct management decision making and each should be considered in light of current site knowledge and resources prior to implementation.

5.1. Short-Term Recommendations:

  • Carry out geological surveys to the north east of Carvoran Farm (distance 240 m) to investigate the presence of the water source suggested in the literature.
  • Plan priority excavations of the ancient drainage/sewage system channels and ditches aimed for water management along with the modern agricultural field drains to be purposefully blocked or opened up depending on the requirements to either re-saturate or remove water from different parts of the site.
  • Facilitate additional risk analysis layers for actions of tourists at the site, particularly in the summer months when erosion risk is highest, and around erosion hot spots identified in Figure 9.

5.2. Long-Term Recommendations:

  • Investigate the ancient hydraulic system general outflow at the south-west corner of the Stone Fort and at the south-west corner of the potential earlier Timber Fort. Monitoring of continued water drainage in this area should occur, to guard against future erosion.
  • Locate, excavate and, if possible, restore the Roman aqueduct’s channel along the route proposed by the hydraulic system map. A new water inlet will help enlarge the area of the bog and maintain soil moisture levels for the entire site, sustaining the conditions in which organic materials and wooden artefacts can be preserved.
  • Investigate the presence and consistency of the local aquifer.
  • Plan geognostic surveys to analyse the soil stratigraphy and to evaluate its geological and geotechnical characteristics and chemical analysis of the soil.
  • Plan new and detailed geophysics surveys.
  • Undertake a detailed geoarchaeological assessment of the sites various preservation conditions through a selected sampling system with limited bore holes to establish the state of the remains across the site.
  • Provide a monitoring system of the oscillation of groundwater levels in the well of Carvoran Farm to understand the impact of the water table oscillation on the humidity of the surface soil.
  • Plan photogrammetric monitoring surveys, regularly scheduled if research excavations progress.
In this study, we have demonstrated the benefits of using geospatial analysis in order to facilitate deeper understanding and improved management focus where access to archaeological sites is not feasible. Using freely available datasets and resources has led to the formation of a comprehensive management plan, the development of a GIS and the publication of a dashboard to share these results. The methodology employed presents a broad framework that could be applied to other similar archaeological sites across the UK and further afield, demonstrating the wider impact of this work.

Supplementary Materials

The following are available online at https://www.mdpi.com/article/10.3390/ijgi10090575/s1, For supplementary documents see: ’RUSLE parameter calculations for Magna Roman Fort’. References [60,61,62,63,64,65,66,67,68] are cited in the supplementary materials.

Author Contributions

Conceptualization, Rebecca Guiney, Elettra Santucci, Samuel Valman and Adam Booth; methodology, Rebecca Guiney, Elettra Santucci, Samuel Valman and Adam Booth; formal analysis, Rebecca Guiney, Elettra Santucci, Samuel Valman and Adam Booth; investigation, Rebecca Guiney, Elettra Santucci, Samuel Valman and Adam Booth; resources, Andrew Birley and Ian Haynes; data curation, Andrew Birley and Ian Haynes; writing—original draft preparation, Rebecca Guiney, Elettra Santucci, Samuel Valman and Adam Booth; writing—review and editing, Andrew Birley, Ian Haynes, Stuart Marsh and Jon Mills; visualization, Rebecca Guiney, Elettra Santucci, Samuel Valman and Adam Booth; supervision, Andrew Birley, Ian Haynes, Stuart Marsh and Jon Mills; project administration, Jon Mills and Stuart Marsh; funding acquisition, Jon Mills and Stuart Marsh. All authors have read and agreed to the published version of the manuscript.

Funding

This research was funded by EPSRC grant number EP/S023577/1.

Institutional Review Board Statement

Not applicable.

Informed Consent Statement

Not applicable.

Data Availability Statement

All data supporting reported results, including links to publicly archived datasets analysed or generated during the study, can be found at: https://github.com/Adam-Booth/Group3_Project (accessed on 23 August 2021).

Acknowledgments

This research was undertaken as a group project module in the Geospatial Data Science MRes within the EPSRC Centre for Doctoral Training in Geospatial Systems (EP/S023577/1). The authors would like to thank all participating staff at Newcastle University and the University of Nottingham, UK, who provided the training and expertise which enabled this study to be conducted. Further thanks are due to the Vindolanda Trust for providing access to datasets and background knowledge about the site.

Conflicts of Interest

The authors declare no conflict of interest.

References

  1. UNESCO. UNESCO World Heritage List, Frontiers of the Roman Empire. Available online: https://whc.unesco.org/en/list/430/ (accessed on 25 March 2021).
  2. Vindolanda Charitable Trust. Available online: https://www.vindolanda.com/ (accessed on 28 June 2021).
  3. Henderson, T. The Secret Hadrian’s Wall Fort That Could Be Lost Forever. Available online: https://www.chroniclelive.co.uk/news/north-east-news/magna-fort-hadrians-wall-vindolanda-17570462 (accessed on 25 March 2021).
  4. Historic England. Facing the Future: Foresight and the Historic Environment. Available online: https://historicengland.org.uk/images-books/publications/facing-the-future/ (accessed on 26 March 2021).
  5. South West Heritage Trust. Archaeological Sites at Risk from Climate Change. Available online: https://swheritage.org.uk/news/archaeological-sites-at-risk-from-climate-change/ (accessed on 25 March 2021).
  6. Campana, S.; Remondino, F.; Ioannides, M. GIS in Cultural Heritage; The International Journal of Heritage in the Digital Era; Sage: Los Angeles, CA, USA, 2013. [Google Scholar]
  7. Themistocleous, K.; Agapiou, A.; Cuca, B.; Hadjimitsis, D. Unmanned Aerial Systems and Spectroscopy for Remote Sensing Applications in Archaeology. ISPRS Int. Arch. Photogramm. Remote Sens. Spat. Inf. Sci. 2015, XL-7/W3, 1419–1423. [Google Scholar] [CrossRef] [Green Version]
  8. Fieber, K.; Mills, J.; Peppa, M.V.; Haynes, I.; Turner, S.; Turner, A.; Douglas, M.; Bryan, P. Cultural Heritage through Time: A Case Study at Hadrian’S Wall, United Kingdom. ISPRS Int. Arch. Photogramm. Remote Sens. Spat. Inf. Sci. 2017, XL-2/W3, 297–302. [Google Scholar] [CrossRef] [Green Version]
  9. Rayne, L.; Bradbury, J.; Mattingly, D.; Philip, G.; Bewley, R.; Wilson, A. From Above and on the Ground: Geospatial Methods for Recording Endangered Archaeology in the Middle East and North Africa. Geosciences 2017, 7, 100. [Google Scholar] [CrossRef] [Green Version]
  10. Traviglia, A.; Cottica, D. Remote sensing applications and archaeological research in the Northern Lagoon of Venice: The case of the lost settlement of Constanciacus. J. Archaeol. Sci. 2011, 38, 2040–2050. [Google Scholar] [CrossRef]
  11. Basnet, K.; Paudel, R.C.; Sherchan, B. Analysis of watersheds in Gandaki Province, Nepal using QGIS. Tech. J. 2019, 1, 16–28. [Google Scholar] [CrossRef]
  12. Marques da Silva, J.R.; Silva, L.L. Relationship between distance to flow accumulation lines and spatial variability of irrigated maize grain yield and moisture content at harvest. Biosyst. Eng. 2006, 94, 525–533. [Google Scholar] [CrossRef] [Green Version]
  13. Florinsky, I.V. Relationships between topographically expressed zones of flow accumulation and sites of fault intersection: Analysis by means of digital terrain modelling. Environ. Model. Softw. 2000, 15, 87–100. [Google Scholar] [CrossRef]
  14. Qin, C.Z.; Zhan, L. Parallelizing flow-accumulation calculations on graphics processing units—From iterative DEM preprocessing algorithm to recursive multiple-flow-direction algorithm. Comput. Geosci. 2012, 43, 7–16. [Google Scholar] [CrossRef]
  15. Hodge, A.T. Roman Aqueducts & Water Supply; Duckworth: London, UK, 1992. [Google Scholar]
  16. Birley, R. The Fort at the Rock: On Hadrian’s Wall: Magna and Carvoran; Roman Army Museum Publications for the Vindolanda Trust; Roman Army Museum, Greenhead: Brampton, ON, Canada, 1998; pp. 21–23. [Google Scholar]
  17. Howland, M.; Jones, I.; Najjar, M.; Levy, T. Quantifying the effects of erosion on archaeological sites with low-altitude aerial photography, structure from motion, and GIS: A case study from southern Jordan. J. Archaeol. Sci. 2018, 90, 62–70. [Google Scholar] [CrossRef] [Green Version]
  18. Wischmeier, W.; Smith, D. Predicting Rainfall Erosion Losses—A Guide To Conservation Planning. Agric. Handb. 1978, 537, 62. [Google Scholar]
  19. Renard, K.; Foster, G.; Weesies, G.; Mccool, D.; Yoder, D. Predicting soil erosion by water: A guide to conservation planning with the revised universal soil loss equation (RUSLE). Agric. Handb. 1997, 703, 1–251. [Google Scholar]
  20. Marondedze, A.; Schütt, B. Assessment of Soil Erosion Using the RUSLE Model for the Epworth District of the Harare Metropolitan Province, Zimbabwe. Sustainability 2020, 12, 8531. [Google Scholar] [CrossRef]
  21. Panagos, P.; Borrelli, P.; Poesen, J.; Ballabio, C.; Meusburger, K.; Montanarella, L.; Lugato, E.; Alewell, C. The new assessment of soil loss by water erosion in Europe. Environ. Sci. Policy 2015, 54, 438–447. [Google Scholar] [CrossRef]
  22. Thapa, P. Spatial Estimation of Soil Erosion Using RUSLE Modeling: A case study of Dolakha District, Nepal. Environ. Syst. Res. 2020, 9, 1–10. [Google Scholar] [CrossRef]
  23. Ghosal, K.; Das, S. A Review of RUSLE Model. J. Indian Soc. Remote Sens. 2020, 48, 689–707. [Google Scholar] [CrossRef]
  24. Wang, G.; Gertner, G.; Singh, V.; Shinkareva, S.; Parysow, P.; Anderson, A. Spatial and temporal prediction and uncertainty of soil loss using the revised universal soil loss equation: A case study of the rainfall-runoff erosivity R factor. Ecol. Model. 2002, 153, 143–155. [Google Scholar] [CrossRef]
  25. Panagos, P.; Ballabio, C.; Meusburger, K.; Spinoni, J.; Alewell, C.; Borrelli, P. Towards estimates of future rainfall erosivity in Europe based on REDES and WorldClim datasets. J. Hydrol. 2017, 548, 251–262. [Google Scholar] [CrossRef]
  26. Vantas, K.; Sidiropoulos, E.; Loukas, A. Estimating Current and Future Rainfall Erosivity in Greece Using Regional Climate Models and Spatial Quantile Regression Forests. Water 2020, 12, 687. [Google Scholar] [CrossRef] [Green Version]
  27. Sardari, M.; Bazrafshan, O.; Panagopoulos, T.; Rafiei Sardooi, E. Modeling the Impact of Climate Change and Land Use Change Scenarios on Soil Erosion at the Minab Dam Watershed. Sustainability 2019, 11, 3353. [Google Scholar] [CrossRef] [Green Version]
  28. Almagro, A.; Oliveira, P.T.; Nearing, M.; Hagemann, S. Projected climate change impacts in rainfall erosivity over Brazil. Sci. Rep. 2017, 7, 1–12. [Google Scholar] [CrossRef] [Green Version]
  29. Historic England Research Records. Available online: https://www.heritagegateway.org.uk/Gateway/Results_Single.aspx?uid=13857&resourceID=19191# (accessed on 5 April 2021).
  30. Roman Vindolanda. Available online: https://hadrianswallcountry.co.uk/visit/roman-vindolanda (accessed on 28 June 2021).
  31. Vindolanda Charitable Trust. Wonderful Water Pipes. Available online: https://www.vindolanda.com/blogs/blog/wonderful-water-pipes (accessed on 5 April 2021).
  32. Vindolanda Fort and Vicus Excavation Areas 2015. Available online: https://sketchfab.com/3d-models/vindolanda-fort-and-vicus-excavation-areas-2015-4ef8168053794fc8817a0a90933830c6 (accessed on 5 April 2021).
  33. Environment Agency. Lidar Data. 2019. Available online: https://environment.data.gov.uk/DefraDataDownload/?Mode=survey (accessed on 3 March 2021).
  34. Caplan, J.; Ruesink, M.; Mitasova, H. GRASS GIS Manual: R.Flow. 2015. Available online: http://wgbis.ces.iisc.ernet.in/grass/grass73/manuals/r.flow.html (accessed on 5 April 2021).
  35. López-Vicente, M.; Pérez-Bielsa, C.; López-Montero, T.; Lambán, L.; Navas, A. Runoff simulation with eight different flow accumulation algorithms: Recommendations using a spatially distributed and open-source model. Environ. Model. Softw. 2014, 62, 11–21. [Google Scholar] [CrossRef] [Green Version]
  36. Arnold, N. A new approach for dealing with depressions in digital elevation models when calculating flow accumulation values. Prog. Phys. Geogr. Earth Environ. 2010, 34, 781–809. [Google Scholar] [CrossRef]
  37. Gleyzer, A.; Denisyuk, M.; Rimmer, A.; Salingar, Y. A Fast Recursive Gis Algorithm for Computing Strahler Stream Order in Braided and Nonbraided Networks. J. Am. Water Resour. Assoc. 2004, 40, 937–946. [Google Scholar] [CrossRef]
  38. Collins, B.D.; Corbett, S.C.; Fairley, H.C.; Minasian, D.; Kayen, R.; Dealy, T.P.; Bedford, D.R. Topographic change detection at select archeological sites in Grand Canyon National Park, Arizona, 2007–2010. US Geol. Surv. Sci. Investig. Rep. 2012, 5133, 77. [Google Scholar]
  39. Carlson, T.N.; Perry, E.M.; Schmugge, T.J. Remote estimation of soil moisture availability and fractional vegetation cover for agricultural fields. Agric. Forest Meteorol. 1990, 52, 45–69. [Google Scholar] [CrossRef]
  40. Garland, N. Hadrians Wall—Frontier System. Available online: https://data.ncl.ac.uk/articles/dataset/Hadrian_s_Wall_-_Frontier_system/11855592 (accessed on 3 March 2021).
  41. Tan, K.C.; Lim, H.S.; Matjafri, M.Z.; Abdullah, K. Landsat data to evaluate urban expansion and determine land use/land cover changes in Penang Island, Malaysia. Environ. Earth Sci. 2009, 60, 1509–1521. [Google Scholar] [CrossRef]
  42. Ganasri, B.; Gowda, R. Assessment of soil erosion by RUSLE model using remote sensing and GIS—A case study of Nethravathi Basin. Geosci. Front. 2015, 7. [Google Scholar] [CrossRef] [Green Version]
  43. Panagos, P.; Meusburger, K.; Ballabio, C.; Borrelli, P.; Alewell, C. Soil erodibility in Europe: A high-resolution dataset based on LUCAS. Sci. Total Environ. 2014, 479–480, 189–200. [Google Scholar] [CrossRef]
  44. Panagos, P.; Borrelli, P.; Meusburger, K.; Zanden, E.; Poesen, J.; Alewell, C. Modelling the effect of support practices (P-factor) on the reduction of soil erosion by water at European Scale. Environ. Sci. Policy 2015, 51, 23–34. [Google Scholar] [CrossRef]
  45. Panagos, P.; Borrelli, P.; Meusburger, K.; Alewell, C.; Lugato, E.; Montanarella, L. Estimating the soil erosion cover-management factor at the European scale. Land Use Policy 2015, 48, 38–50. [Google Scholar] [CrossRef]
  46. ESDAC. European Soil Data Centre. Available online: esdac.jrc.ec.europa.eu (accessed on 10 March 2021).
  47. Desmet, P.; Govers, G. A GIS procedure for automatically calculating the USLE LS factor on topographically complex landscape units. J. Soil Water Conserv. 1996, 51, 427–433. [Google Scholar]
  48. Yang, X.; Yu, B. Modelling and mapping rainfall erosivity in New South Wales, Australia. Soil Res. 2015, 53, 178–189. [Google Scholar] [CrossRef]
  49. Brown, L.; Foster, G. Storm Erosivity Using Idealized Intensity Distributions. Trans. ASAE 1987, 30, 379–386. [Google Scholar] [CrossRef]
  50. Panagos, P.; Ballabio, C.; Borrelli, P.; Meusburger, K.; Klik, A.; Rousseva, S.; Percec Tadic, M.; Michaelides, S.; Hrabalikova, M.; Olsen, P.; et al. Rainfall erosivity in Europe. Sci. Total Environ. 2015, 511, 801–814. [Google Scholar] [CrossRef] [Green Version]
  51. Voldoire, A. CNRM-CERFACS CNRM-CM6-1 Model Output Prepared for CMIP6 HighResMIP. Earth Syst. Grid Fed. 2019. [Google Scholar] [CrossRef]
  52. Fick, S.; Hijmans, R. WorldClim 2: New 1-km spatial resolution climate surfaces for global land areas. Int. J. Climatol. 2017, 37, 4302–4315. [Google Scholar] [CrossRef]
  53. The Fort at the Rock. Available online: https://thefortattherock.com/ (accessed on 28 June 2021).
  54. Ballabio, C.; Borrelli, P.; Spinoni, J.; Meusburger, K.; Michaelides, S.; Beguería, S.; Klik, A.; Petan, S.; Janecek, M.; Olsen, P.; et al. Mapping monthly rainfall erosivity in Europe. Sci. Total Environ. 2016, 579, 1298–1315. [Google Scholar] [CrossRef] [PubMed] [Green Version]
  55. Bowman, A.K.; Thomas, J.D.; Tomlin, R.S. The Vindolanda Writing-Tablets (Tabulae Vindolandenses IV, Part 2). Britannia 2011, 42, 113–144. [Google Scholar] [CrossRef]
  56. Birley, R. Vindolanda: A Roman Frontier Post on Hadrian’s Wall; Thames and Hudson: London, UK, 1977. [Google Scholar]
  57. Code of Respect. Available online: https://hadrianswallcountry.co.uk/walking/code-respect (accessed on 5 April 2021).
  58. Lasaponara, R.; Masini, N. Identification of archaeological buried remains based on the normalized difference vegetation index (NDVI) from Quickbird satellite data. IEEE Geosci. Remote Sens. Lett. 2006, 3, 325–328. [Google Scholar] [CrossRef]
  59. Bilotta, G.; Brazier, R.; Haygarth, P. The Impacts of Grazing Animals on the Quality of Soils, Vegetation, and Surface Waters in Intensively Managed Grasslands. Adv. Agron. 2007, 94, 237–280. [Google Scholar] [CrossRef]
  60. Winchell, M.; Jackson, S.; Wadley, A.; Srinivasan, R. Extension and Validation of a Geographic Information System-Based Method for Calculating the Revised Universal Soil Loss Equation Length-Slope Factor for Erosion Risk Assessments in Large Watersheds. J. Soil Water Conserv. 2008, 63, 105–111. [Google Scholar] [CrossRef]
  61. Scheper, S.; Simon, T.; Meusburger, K. Modification of the Rusle Slope Length and Steepness Factor (Ls-Factor) Based on Rainfall Experiments at Steep Alpine Grasslands. MethodsX 2019, 6, 219–229. [Google Scholar]
  62. ArcGIS. ArcGIS Pro: An Overview of the Hydrology Toolset. 2021. Available online: https://pro.arcgiscom/en/pro-app/latest/tool-reference/spatial-analyst/an-overview-of-the-hydrology-tools.htm (accessed on 3 March 2021).
  63. Panagos, P.; Borrelli, P.; Meusburger, K. A New European Slope Length and Steepness Factor (LS-Factor) for Modeling Soil Erosion by Water. Geosciences 2015, 2015, 117–126. [Google Scholar] [CrossRef] [Green Version]
  64. Wischmeier, W.H.; Smith, D.D. Predicting rainfall erosion losses in the Eastern US—A guide to conservation planning. Agric. Handb. 1965, 282. [Google Scholar]
  65. Mccool, D.; Foster, G.; Yoder, D.; Weesies, G.A.; McGregor, K.C. The Revised Universal Soil Loss Equation, Version 2. In International Soil Conservation Organization Conference Proceedings; ISCO: Brisbane, Australia, 2004. [Google Scholar]
  66. Oliveira, P.T.; Wendland, E.; Nearing, M. Rainfall Erosivity in Brazil: A Review. CATENA 2013, 100, 139–147. [Google Scholar] [CrossRef]
  67. Met Office. MIDAS Open: UK Hourly Rainfall Data, v202007; Centre for Environmental Data Analysis: London, UK, 21 October 2020. [Google Scholar]
  68. Vantas, K. hyetor: R Package to Analyze Fixed Interval Precipitation Time Series [Online]. 2018. Available online: https://kvantas.github.io/hyetor/ (accessed on 14 March 2021).
Figure 1. Flow diagram summarising the aims and objectives of this project and the adopted methodology.
Ijgi 10 00575 g001
Figure 2. Annotated map of the Magna site displaying the condition of the site (A) in regard to soil and vegetation cover. The north-west section is the only part of the Fort clearly above ground. This is a 2018 drone image courtesy of the Vindolanda Trust. Inset Ordnance Survey “GB overview” map (B) shows the location of the fort in the UK (red) with the position of Hadrian’s Wall overlaid (blue). All coordinates are in WGS 84. The position and direction of photos from Figure 6 are displayed with the red arrows to further enhance visualization of the site.
Ijgi 10 00575 g002
Figure 3. Flow accumulation diagram (A) for the site calculated from UK Environment Agency LiDAR DTM and the QGIS GRASS r.flow algorithm. Visualisation has been limited to cells which contain the accumulation of 75 other 1 m 2 cells, to highlight the main flow paths. Pit cells are also displayed, representing a high likelihood of ground saturation during rainfall. This is displayed on top of a hillshade map to enable visualization of the topography these flow paths are crossing. The Hill Aspect map (B) confirms flow direction by showing the direction of slope change.
Ijgi 10 00575 g003
Figure 4. Map of Magna showing the archaeological features and hydraulic systems layouts. The background is a 2018 drone image, courtesy of the Vindolanda Trust. The proposed vector graphic layout plan is the result of the analysis and comparison of all the actual available data (historical data and recent surveys), showing the archaeological structure predictions (roads, buildings, bath) as well as the features of the hydraulic systems, with the available water sources (wells, springs, rills), the aqueduct likely course and origin, the drainage and sewage systems (ditches and sewers) and the general water outflow of the site.
Ijgi 10 00575 g004
Figure 5. Annual soil loss (t/h/y) according to the RUSLE in the land surrounding Magna. (Map produced using ArcGIS Pro (version 2.8)).
Ijgi 10 00575 g005
Figure 6. Aerial photography of Magna Fort showing visible evidence of soil erosion (courtesy of the Vindolanda Trust). The location and direction of each photograph is shown in Figure 2.
Ijgi 10 00575 g006
Figure 7. Monthly rainfall erosivity at Magna ( MJ mm ha 1 h 1 y 1 ).
Ijgi 10 00575 g007
Figure 8. Predicted monthly change (%) in rainfall erosivity at Magna for the periods 2021–2040, 2041–2060, 2061–2081 and 2081–2100, compared to the baseline period of 2001–2020.
Ijgi 10 00575 g008
Figure 9. Map of Magna showing the main archaeological and hydraulic systems features. The background is a 2018 drone image, courtesy of the Vindolanda Trust, combined in transparency with the predicted soil erosion map. The site’s vulnerable areas are highlighted, showing high- and medium-soil-erosion-risk areas (in red and purple), and the identified areas that need short or long-term interventions (in yellow and green).
Ijgi 10 00575 g009
Table 1. List of sources used to define the archaeological data shown on the map in Figure 4.
Archaeological DataData Source
Hadrian’s WallLidar/Birley 1998, 8, 10
VallumLidar/Birley 1998, 8, 10–11
Milecastle 46Barri Jones’ survey 1981—83/Birley 1998, 8, 10, 83
Timber Earlier FortBarri Jones’ survey 1981—83/Birley 1998, 10
Stone FortLidar/Birley 1998, 12, 20
Stanegate RoadLidar/Birley 1998, 7
Maiden WayLidar/Birely 1998, 7–8
Stone Fort RoadsBirley 1998, 20/Timescape geophysical survey 1999 (magnetometry)
Settlement AreaTimescape geophysical survey 1999 (magnetometry)
Table 2. List of sources used to define the hydraulic systems elements shown on the map in Figure 4.
Hydraulic DataFunctionElement NameData Source
SpringsSourceSpring 1
Spring 2
Spring 3
Timescape geophysical survey 1999
RillSourceN-E rillMcLauchlan’s map 1857/Birley 1998, 22–23
WellsSupplyWell 1
Well 2
Well 3
Well 4 (Fort N-E corner)
Well 5 (Carvoran Farm)
Moss wells
Aerial survey 27.4.2020
Birley 1998, 42, 72 (square deep well)
BGS Waterwells (1980, 75 m)
Birley 1998, 89 (no location)
AqueductSupplyAqueductBirley 1998, 23
DitchesDrainageDitches (Carvoran Farm)
Ditches (Timber Fort)
Ditches (Stone Fort)
Barri Jones’ survey 1981—83/Birley 1998, 23
Barri Jones’ survey 1981—83/Birley 1998, 8
Aerial photogrammetry Sumo survey 2019
DrainsDrainage/sewageDrainsTimescape geophysical survey 1999 (magnetometry)
BathsBuilding related to supply/sewageCommanding officer bathhouse
Main bathhouse
Bell’s map/Birley 1998, 73–75
Birley 1998, 24 (ruins of substantial building)
Publisher’s Note: MDPI stays neutral with regard to jurisdictional claims in published maps and institutional affiliations.

