
Annual Actual Evapotranspiration Estimation via GIS Models of Three Empirical Methods Employing Remotely Sensed Data for the Peloponnese, Greece, and Comparison with Annual MODIS ET and Pan Evaporation Measurements


Abstract
:1. Introduction
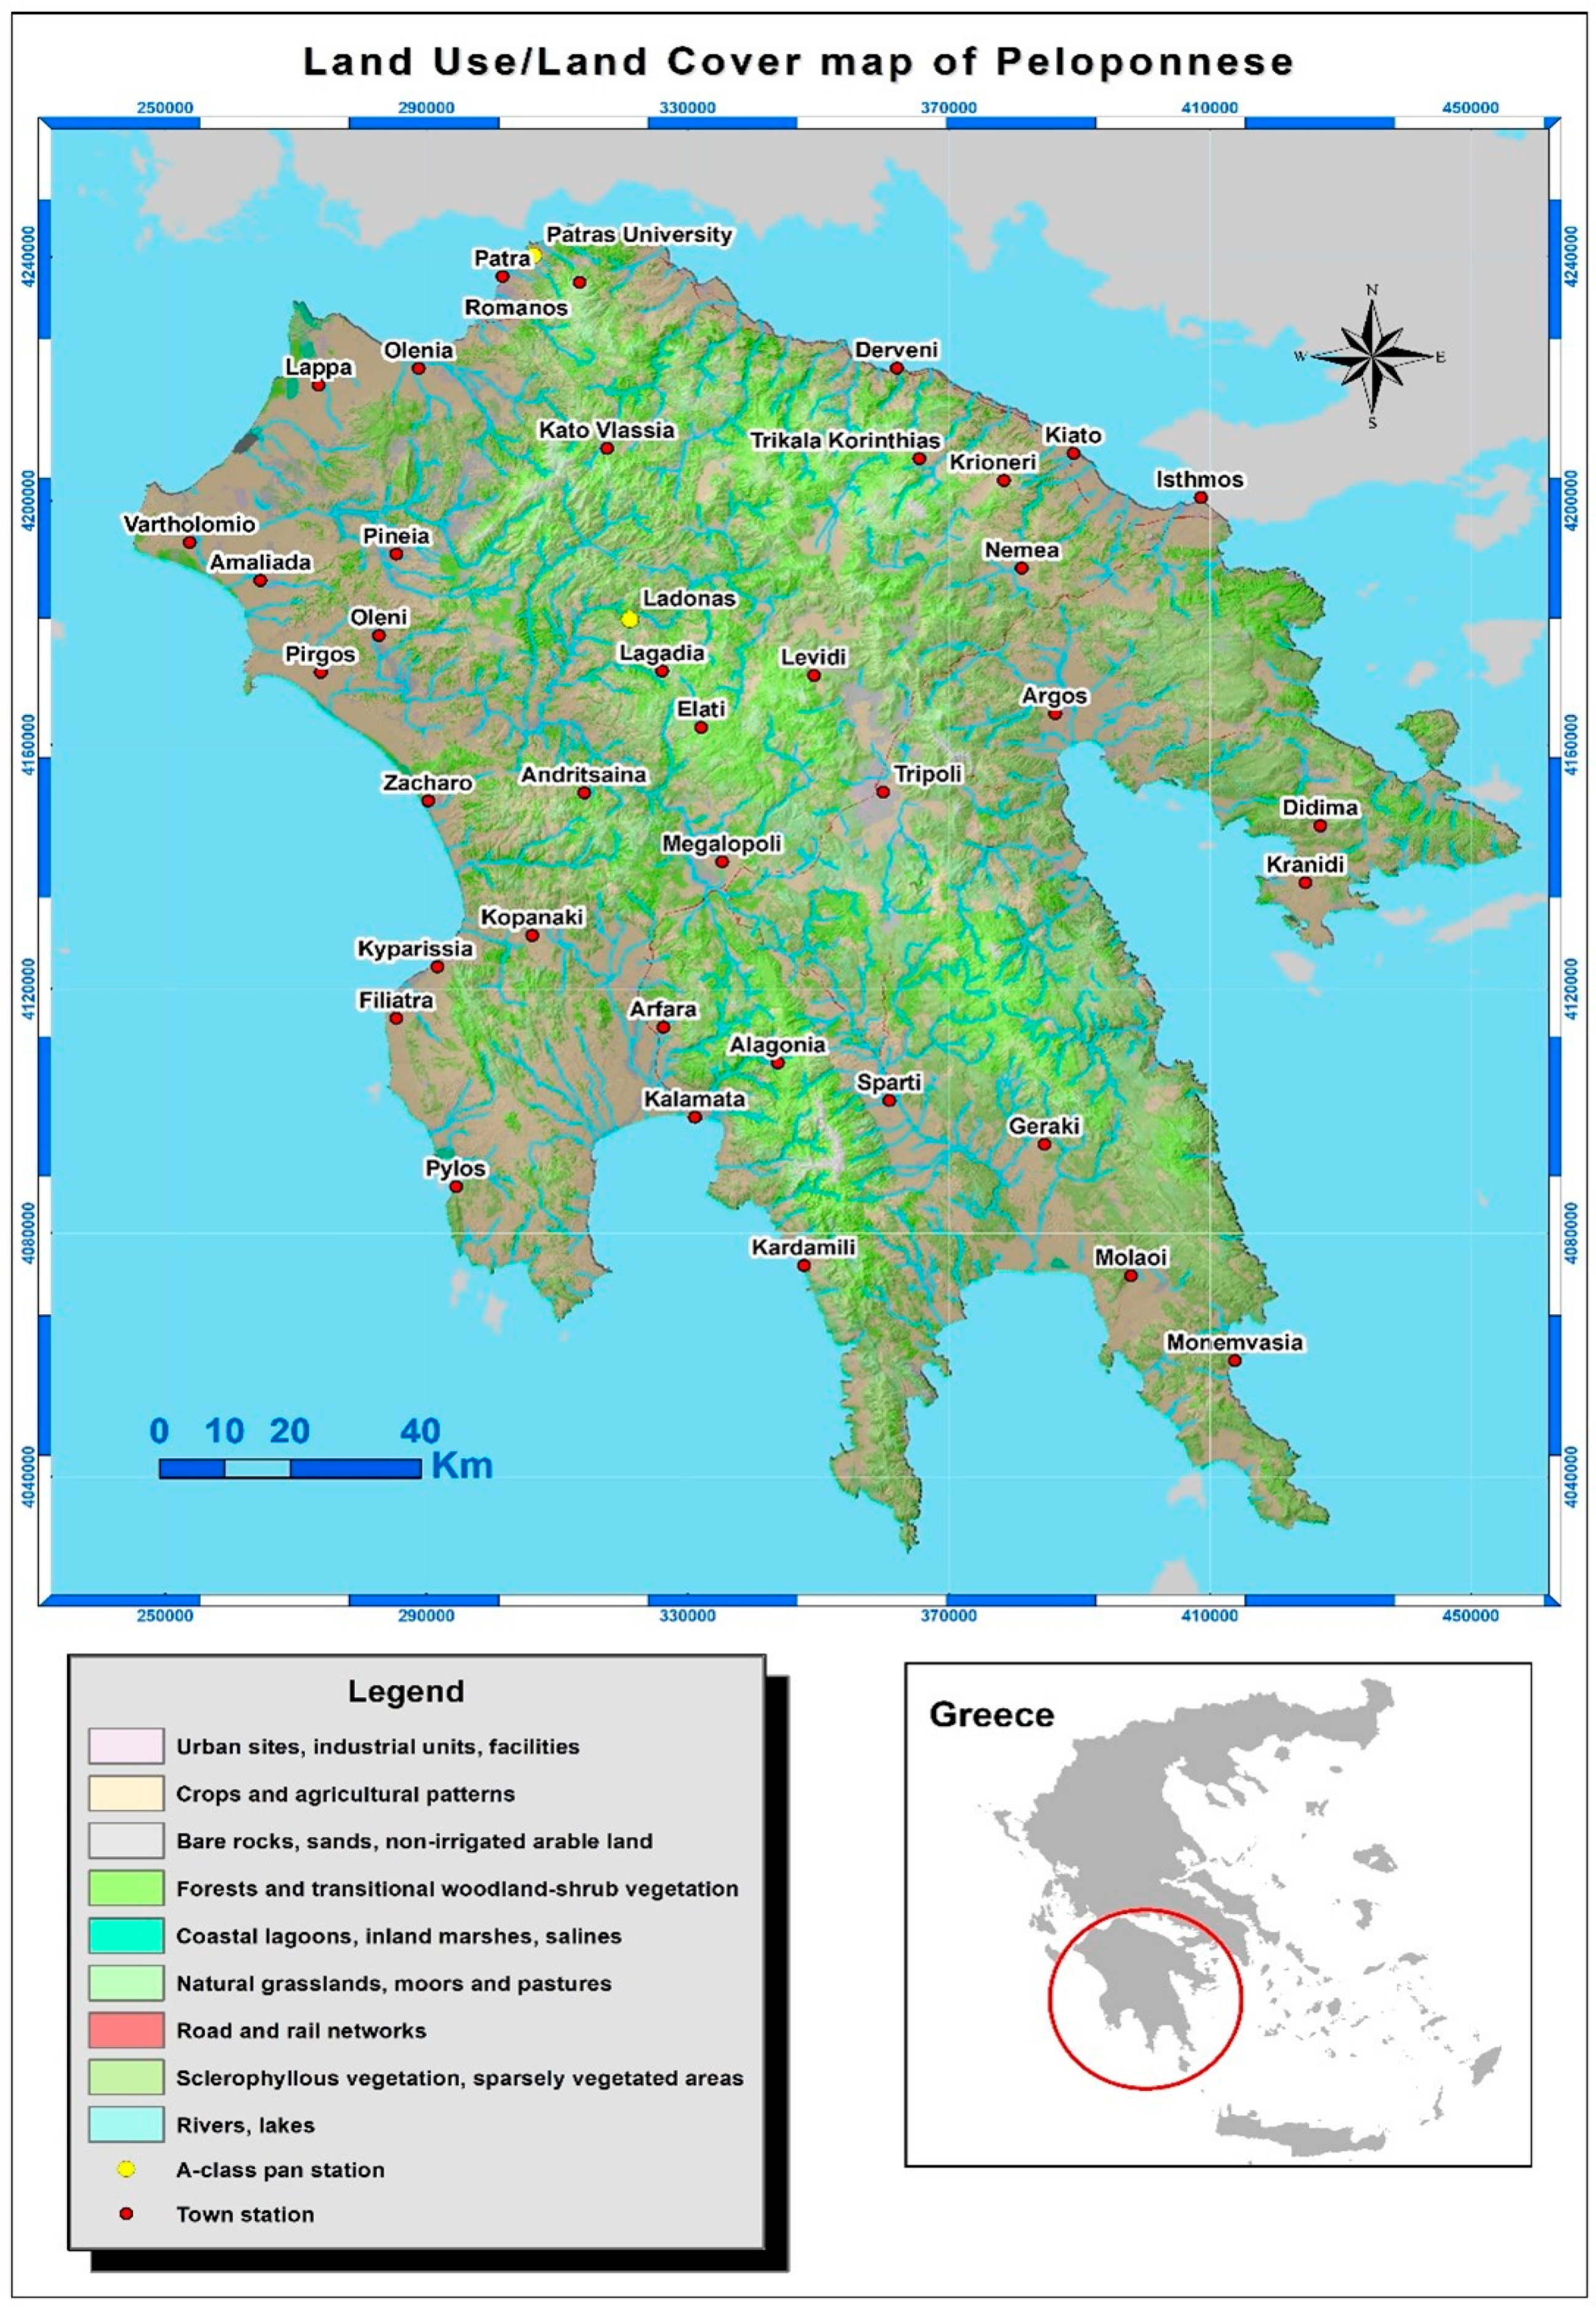
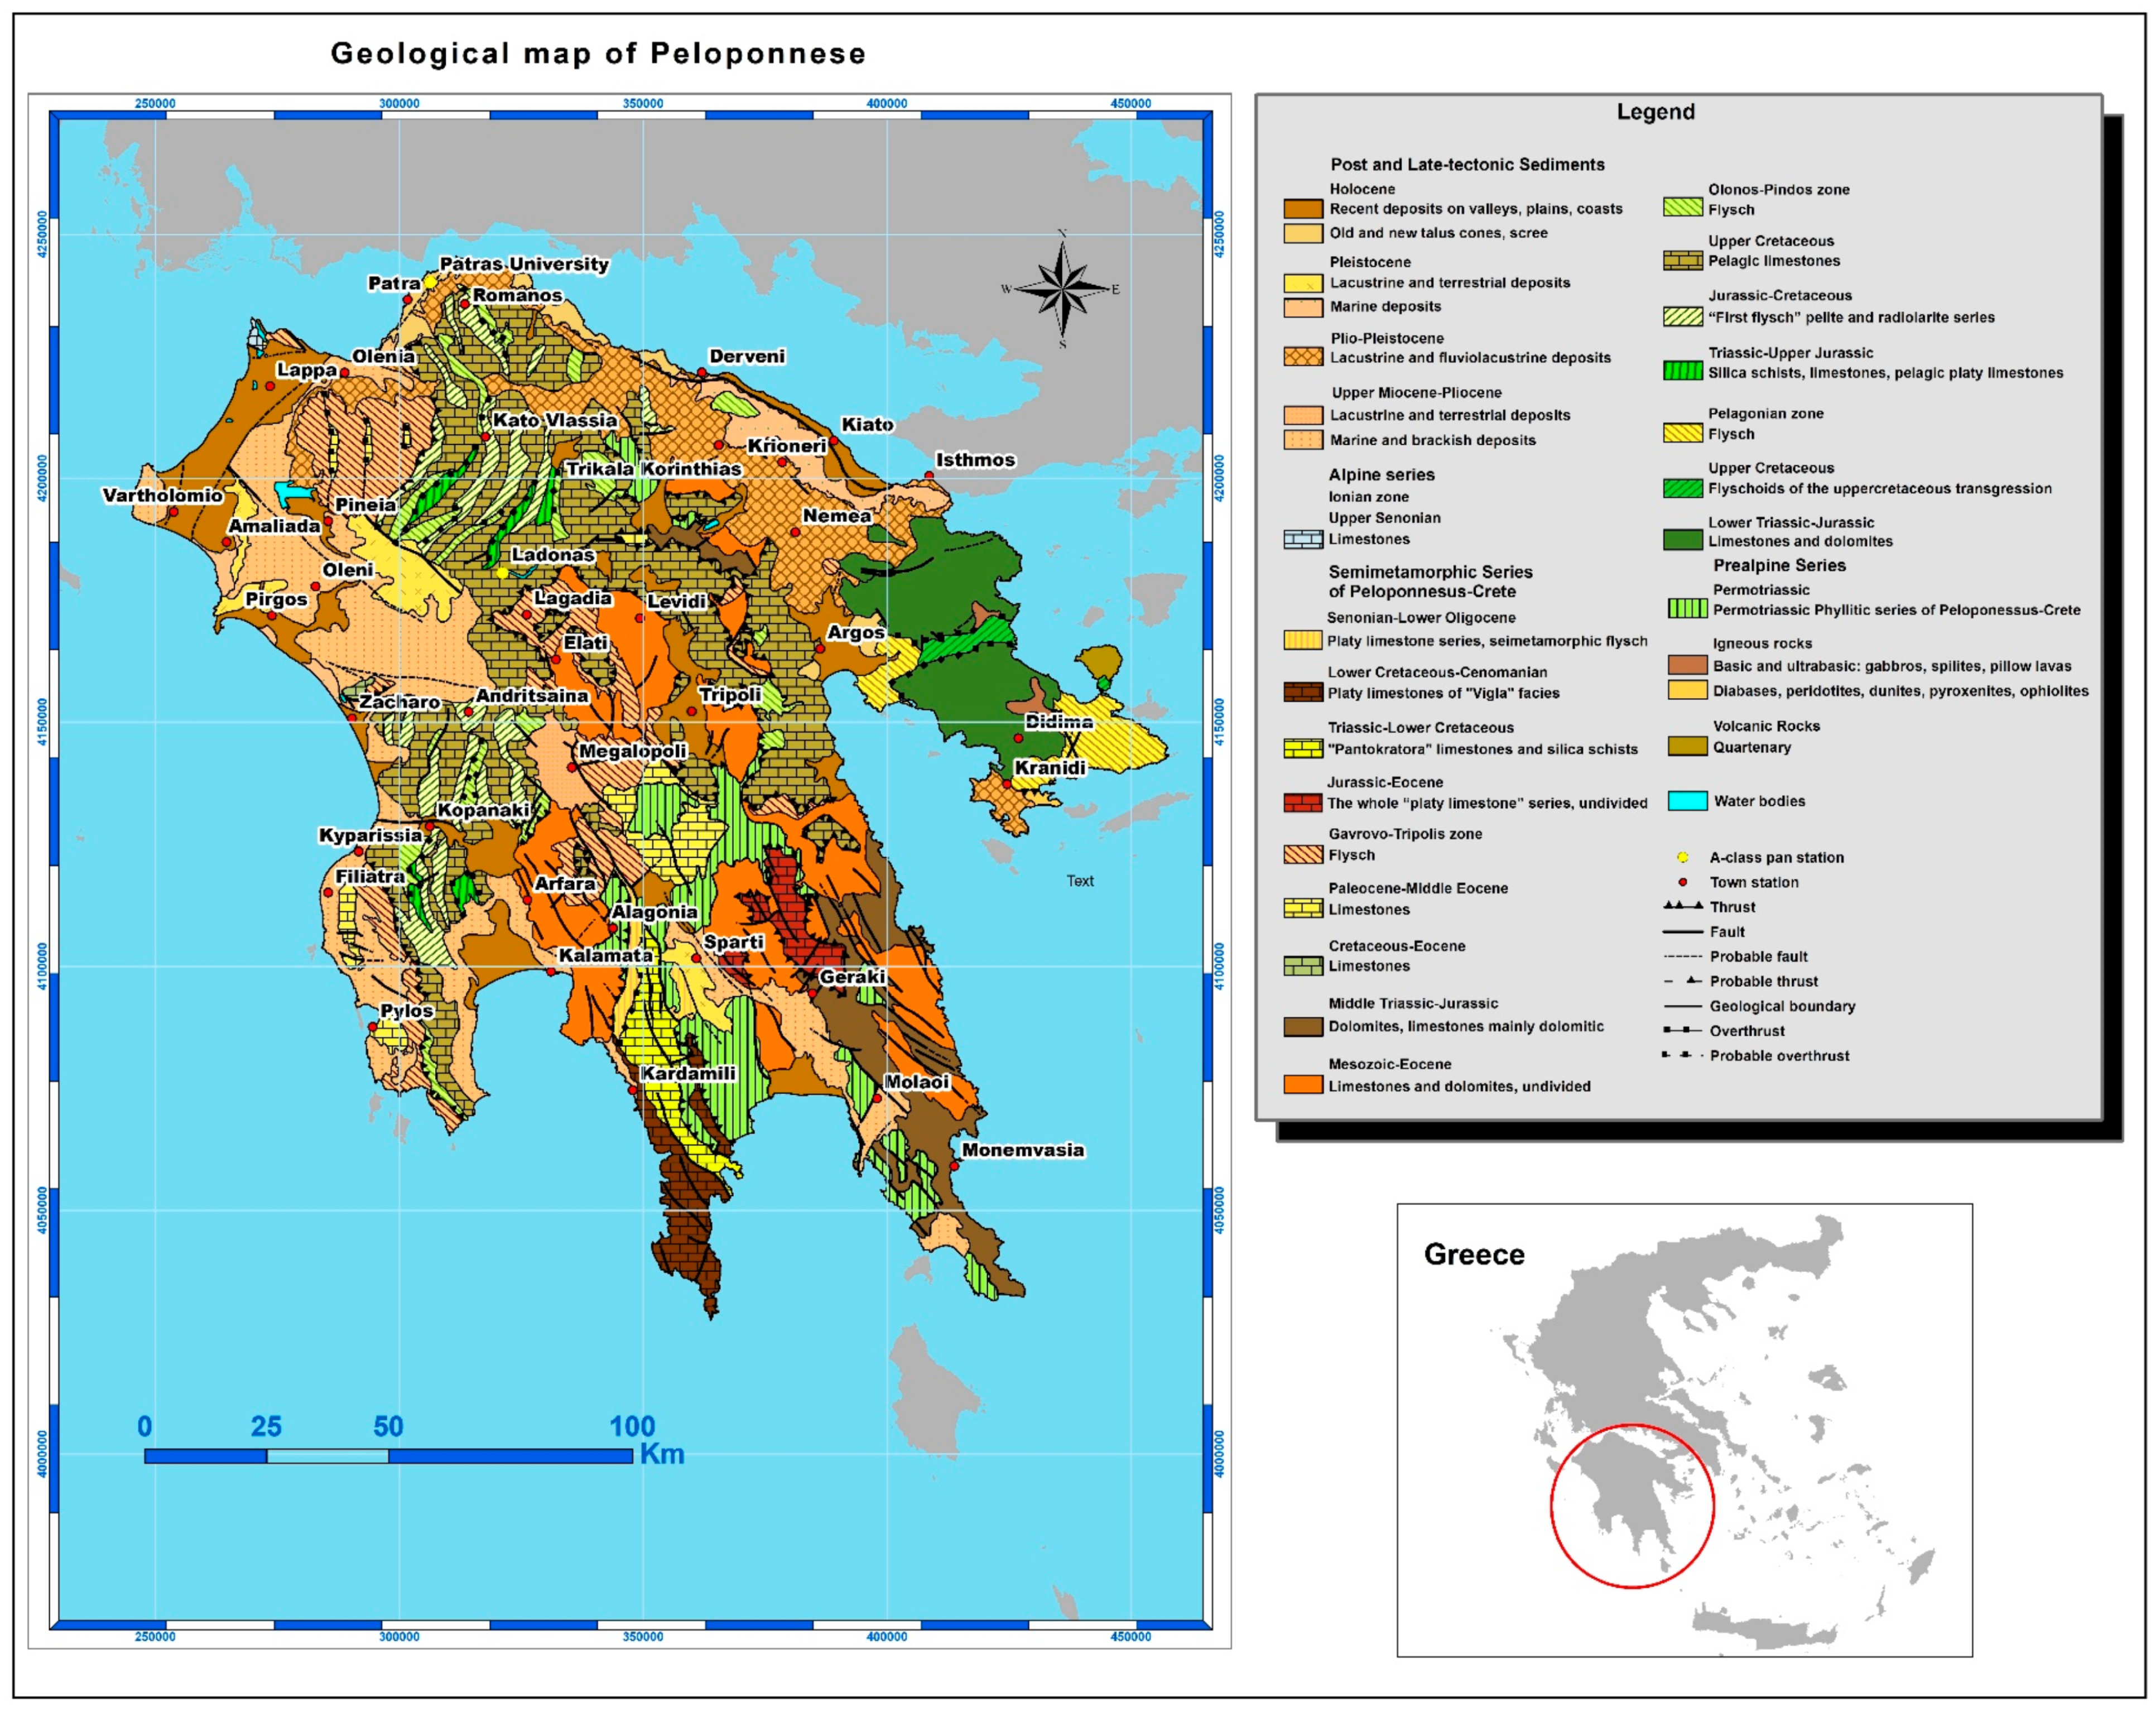
2. Study Area
3. Materials and Methods
3.1. Empirical Equations Employing Meteorological and MODIS Data Implemented via GIS Models
3.2. MODIS ET Products
3.3. Pan Evaporation Measurements
3.4. Statistical Indices Computed via GIS Models
4. Empirical Methods
4.1. Turc Method
4.2. Coutagne’s Method
4.3. Turc Modified Method
5. Results
5.1. Statistics for Annual Estimates
5.1.1. Descriptive Statistics of Empirical Method Estimates and MODIS ET
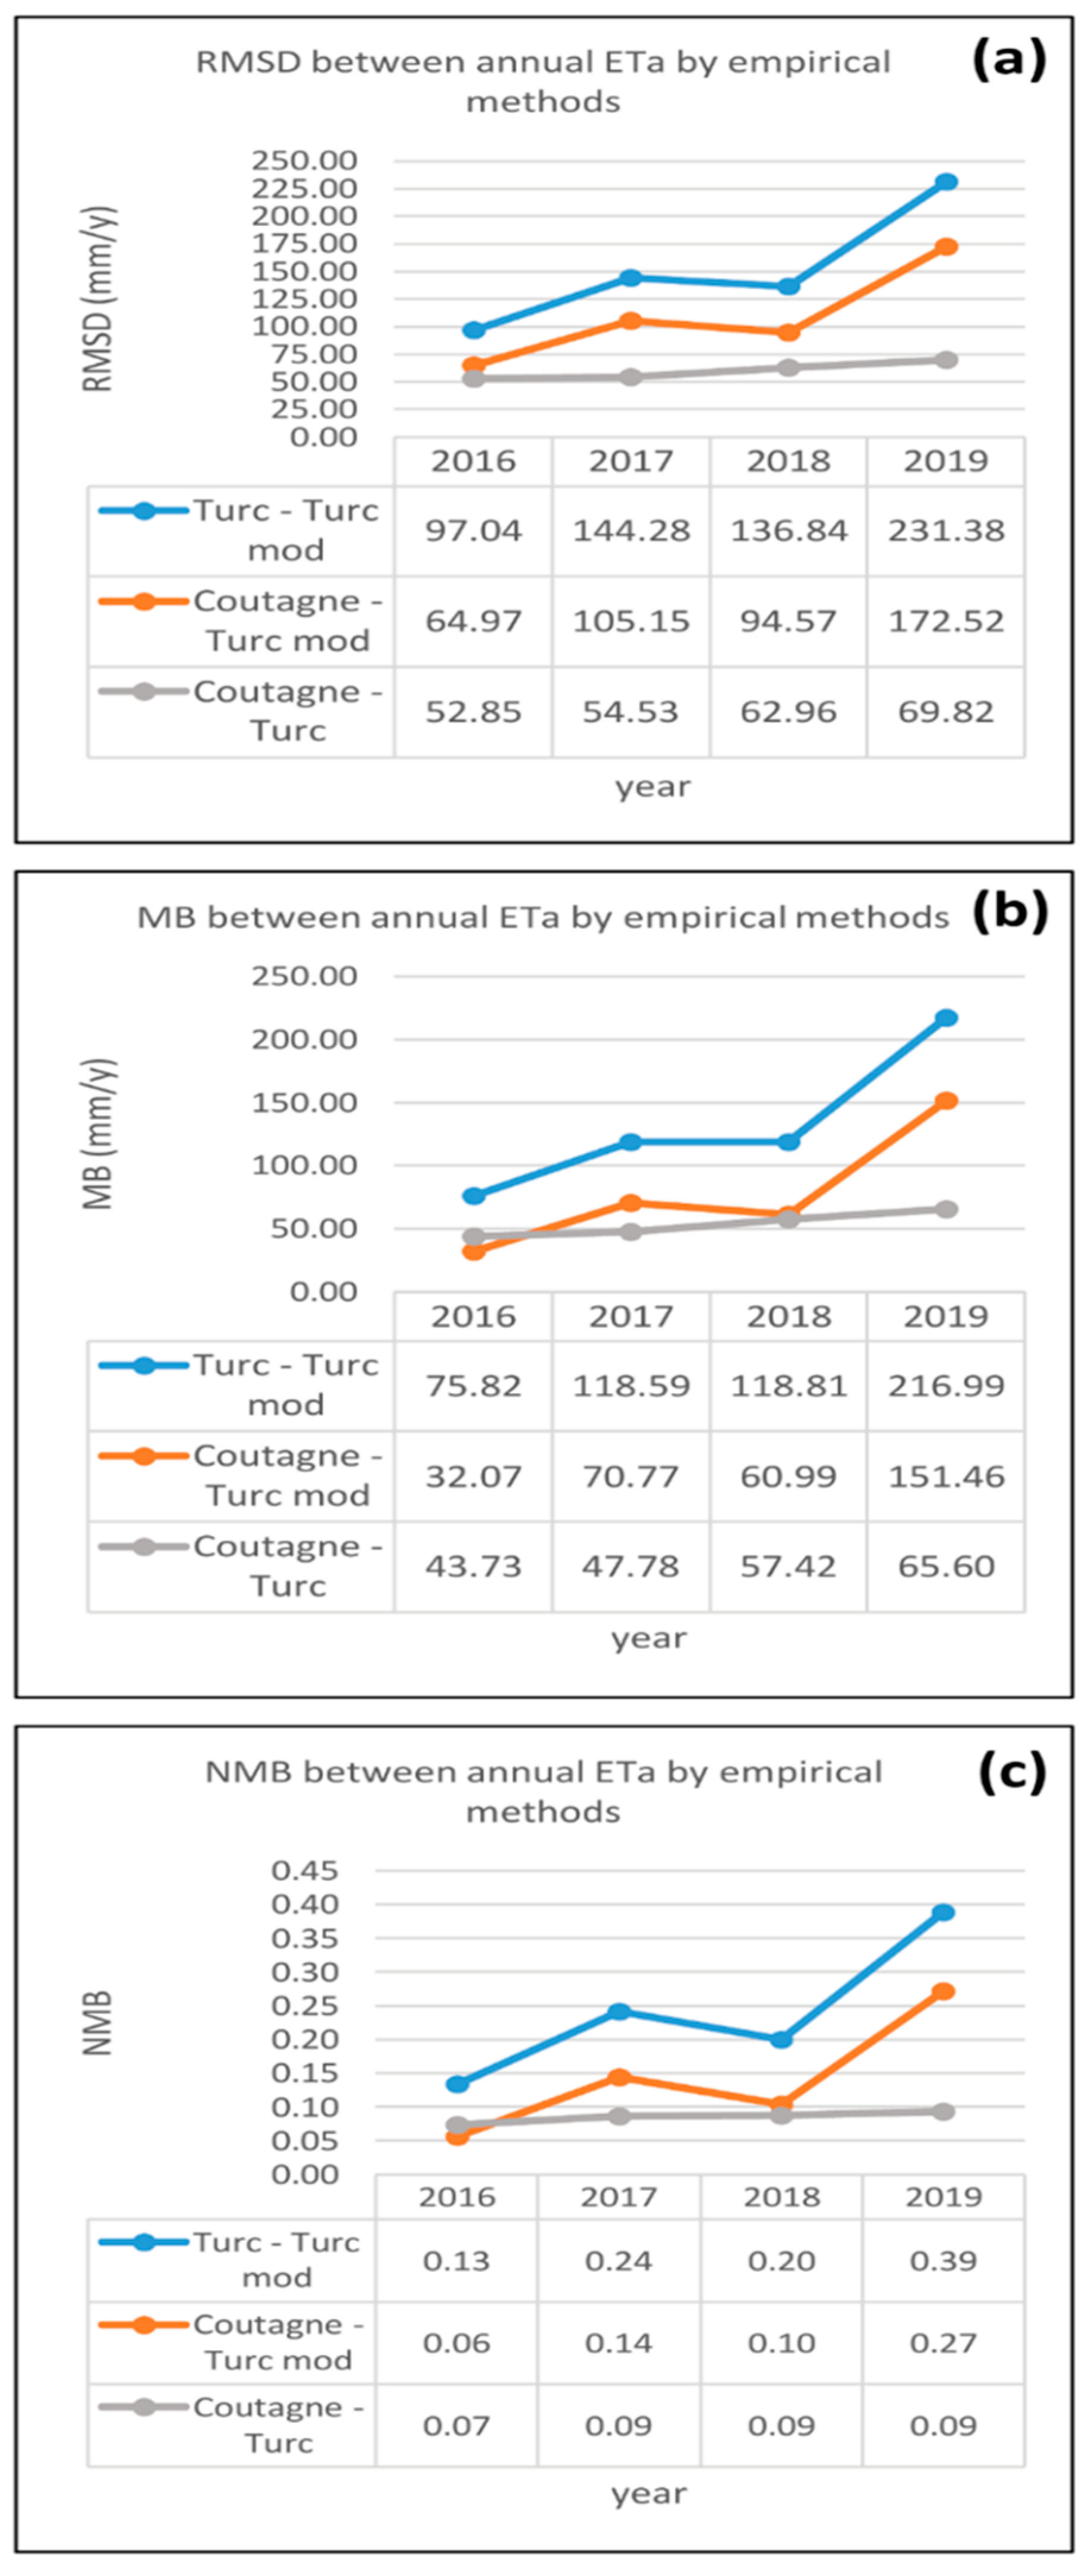
5.1.2. Statistical Measures between Annual Estimates by Empirical Methods
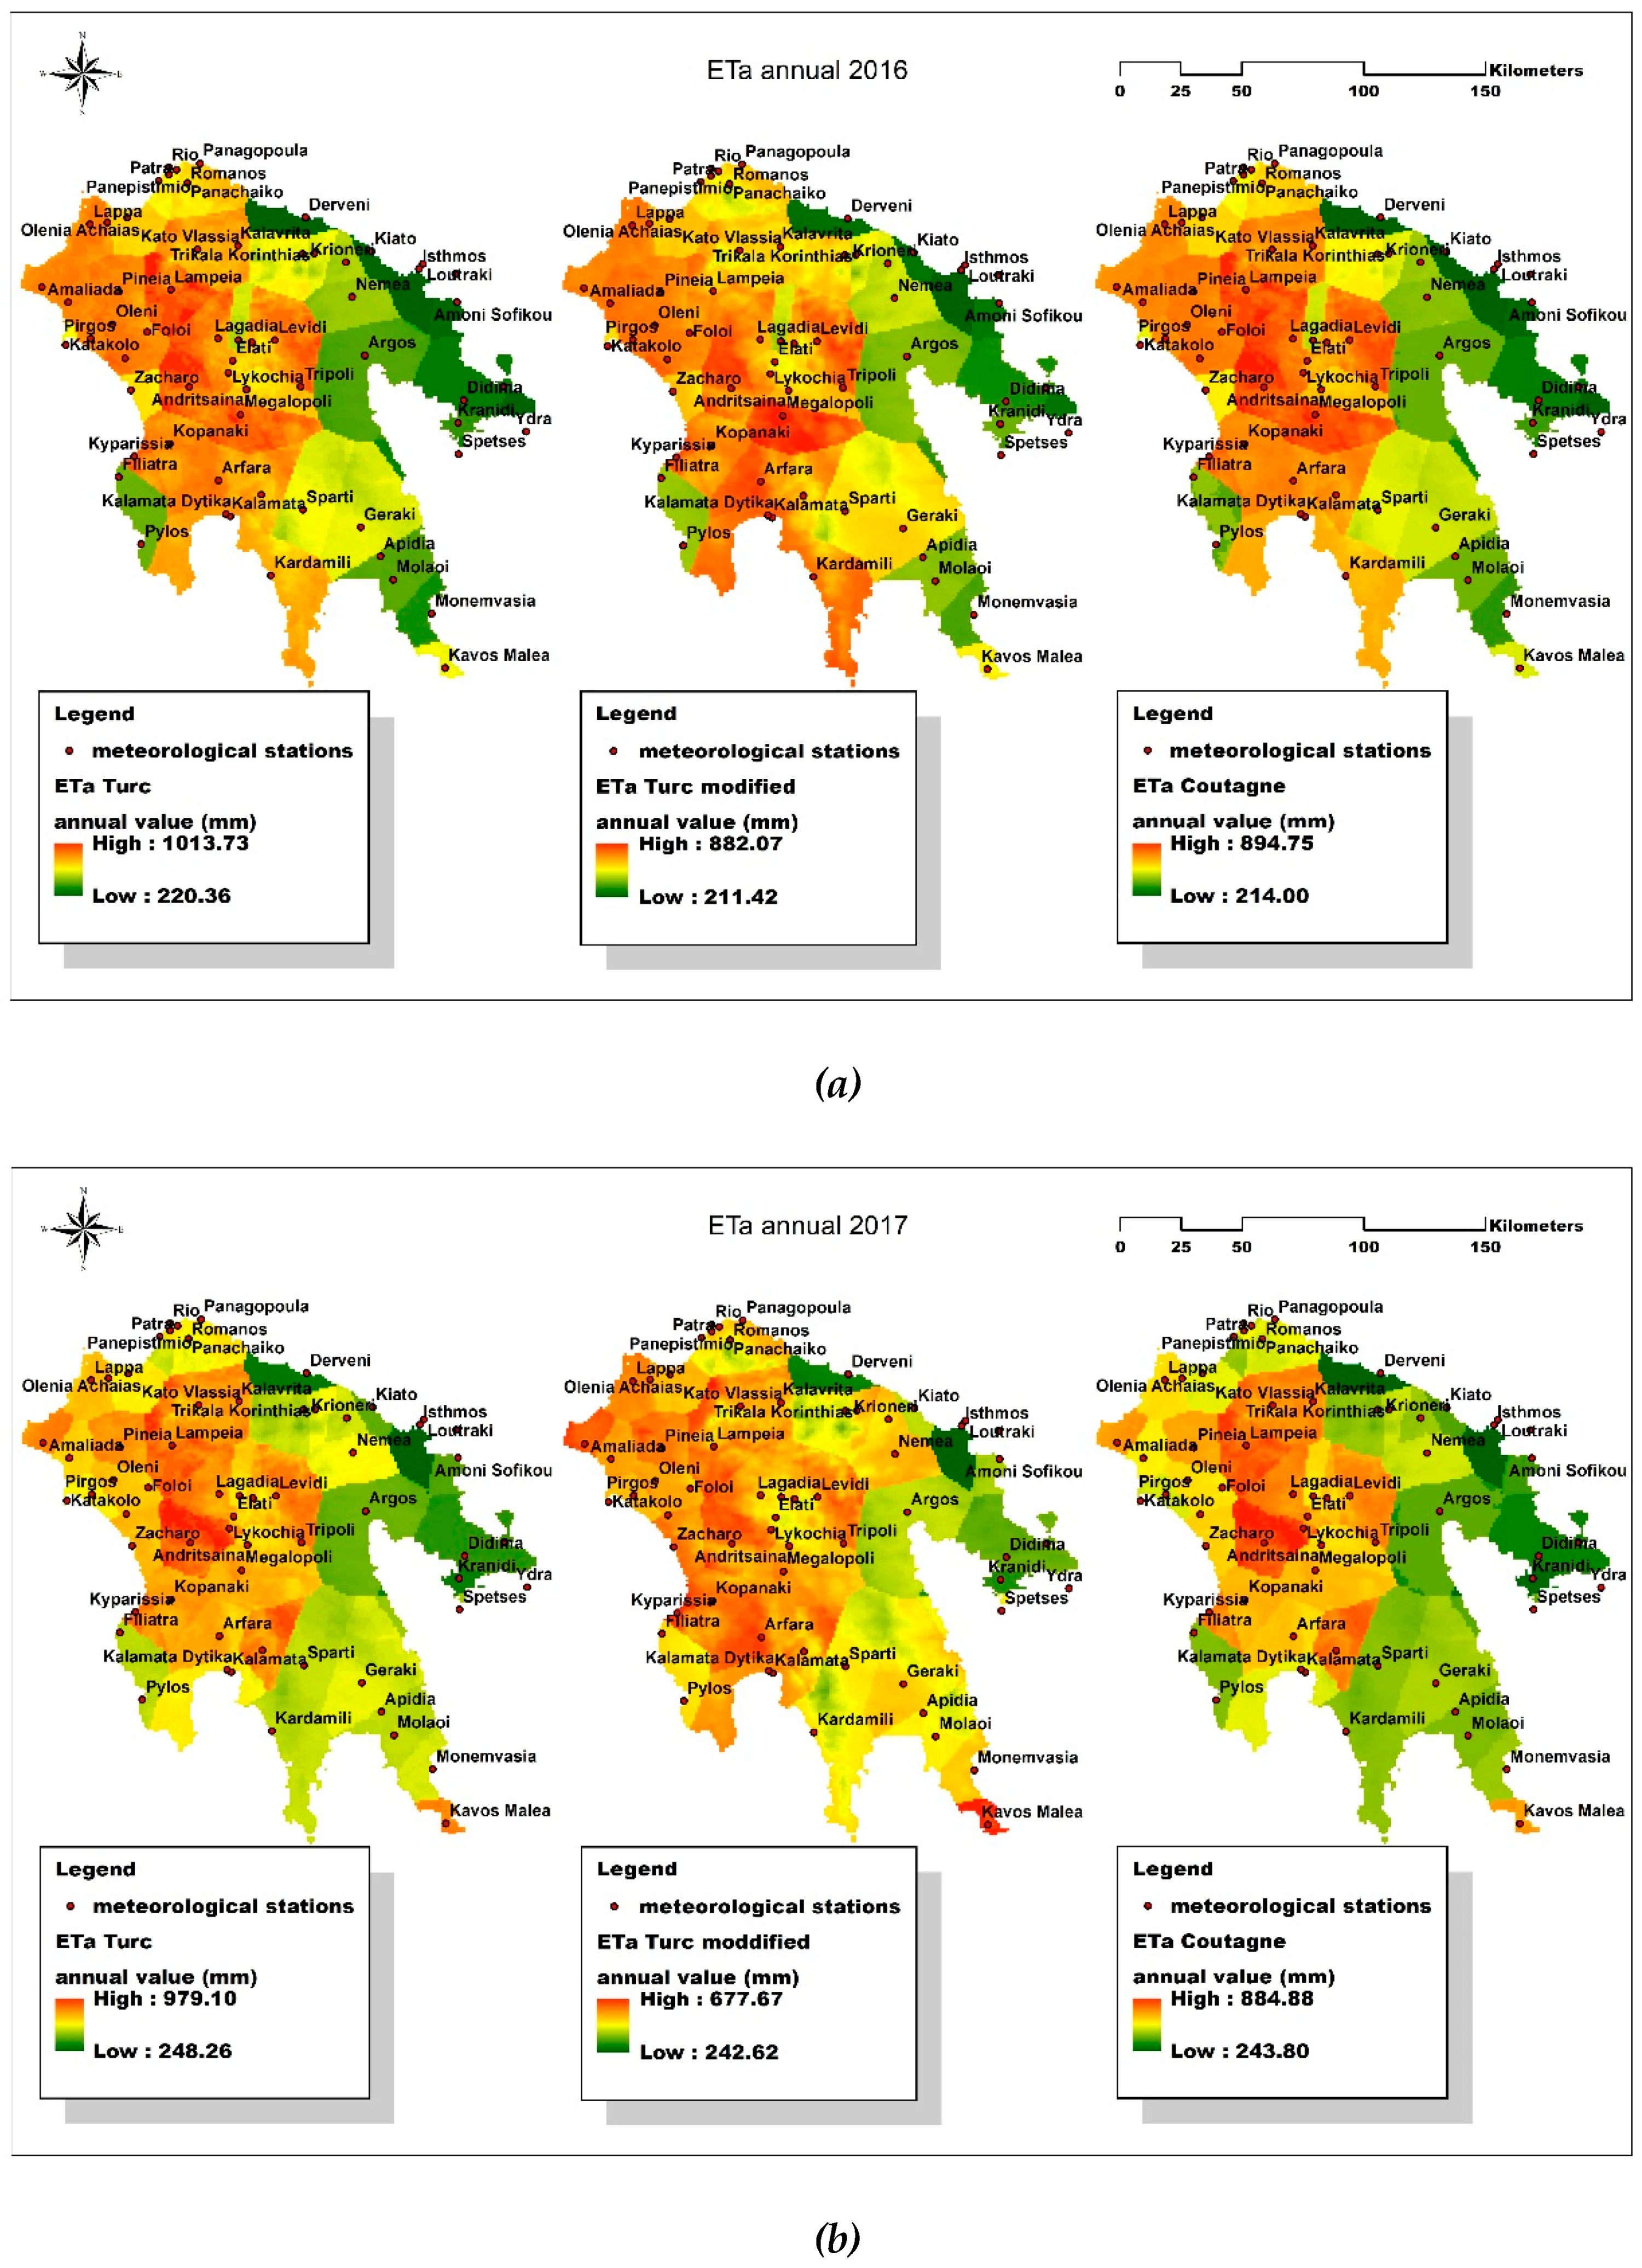
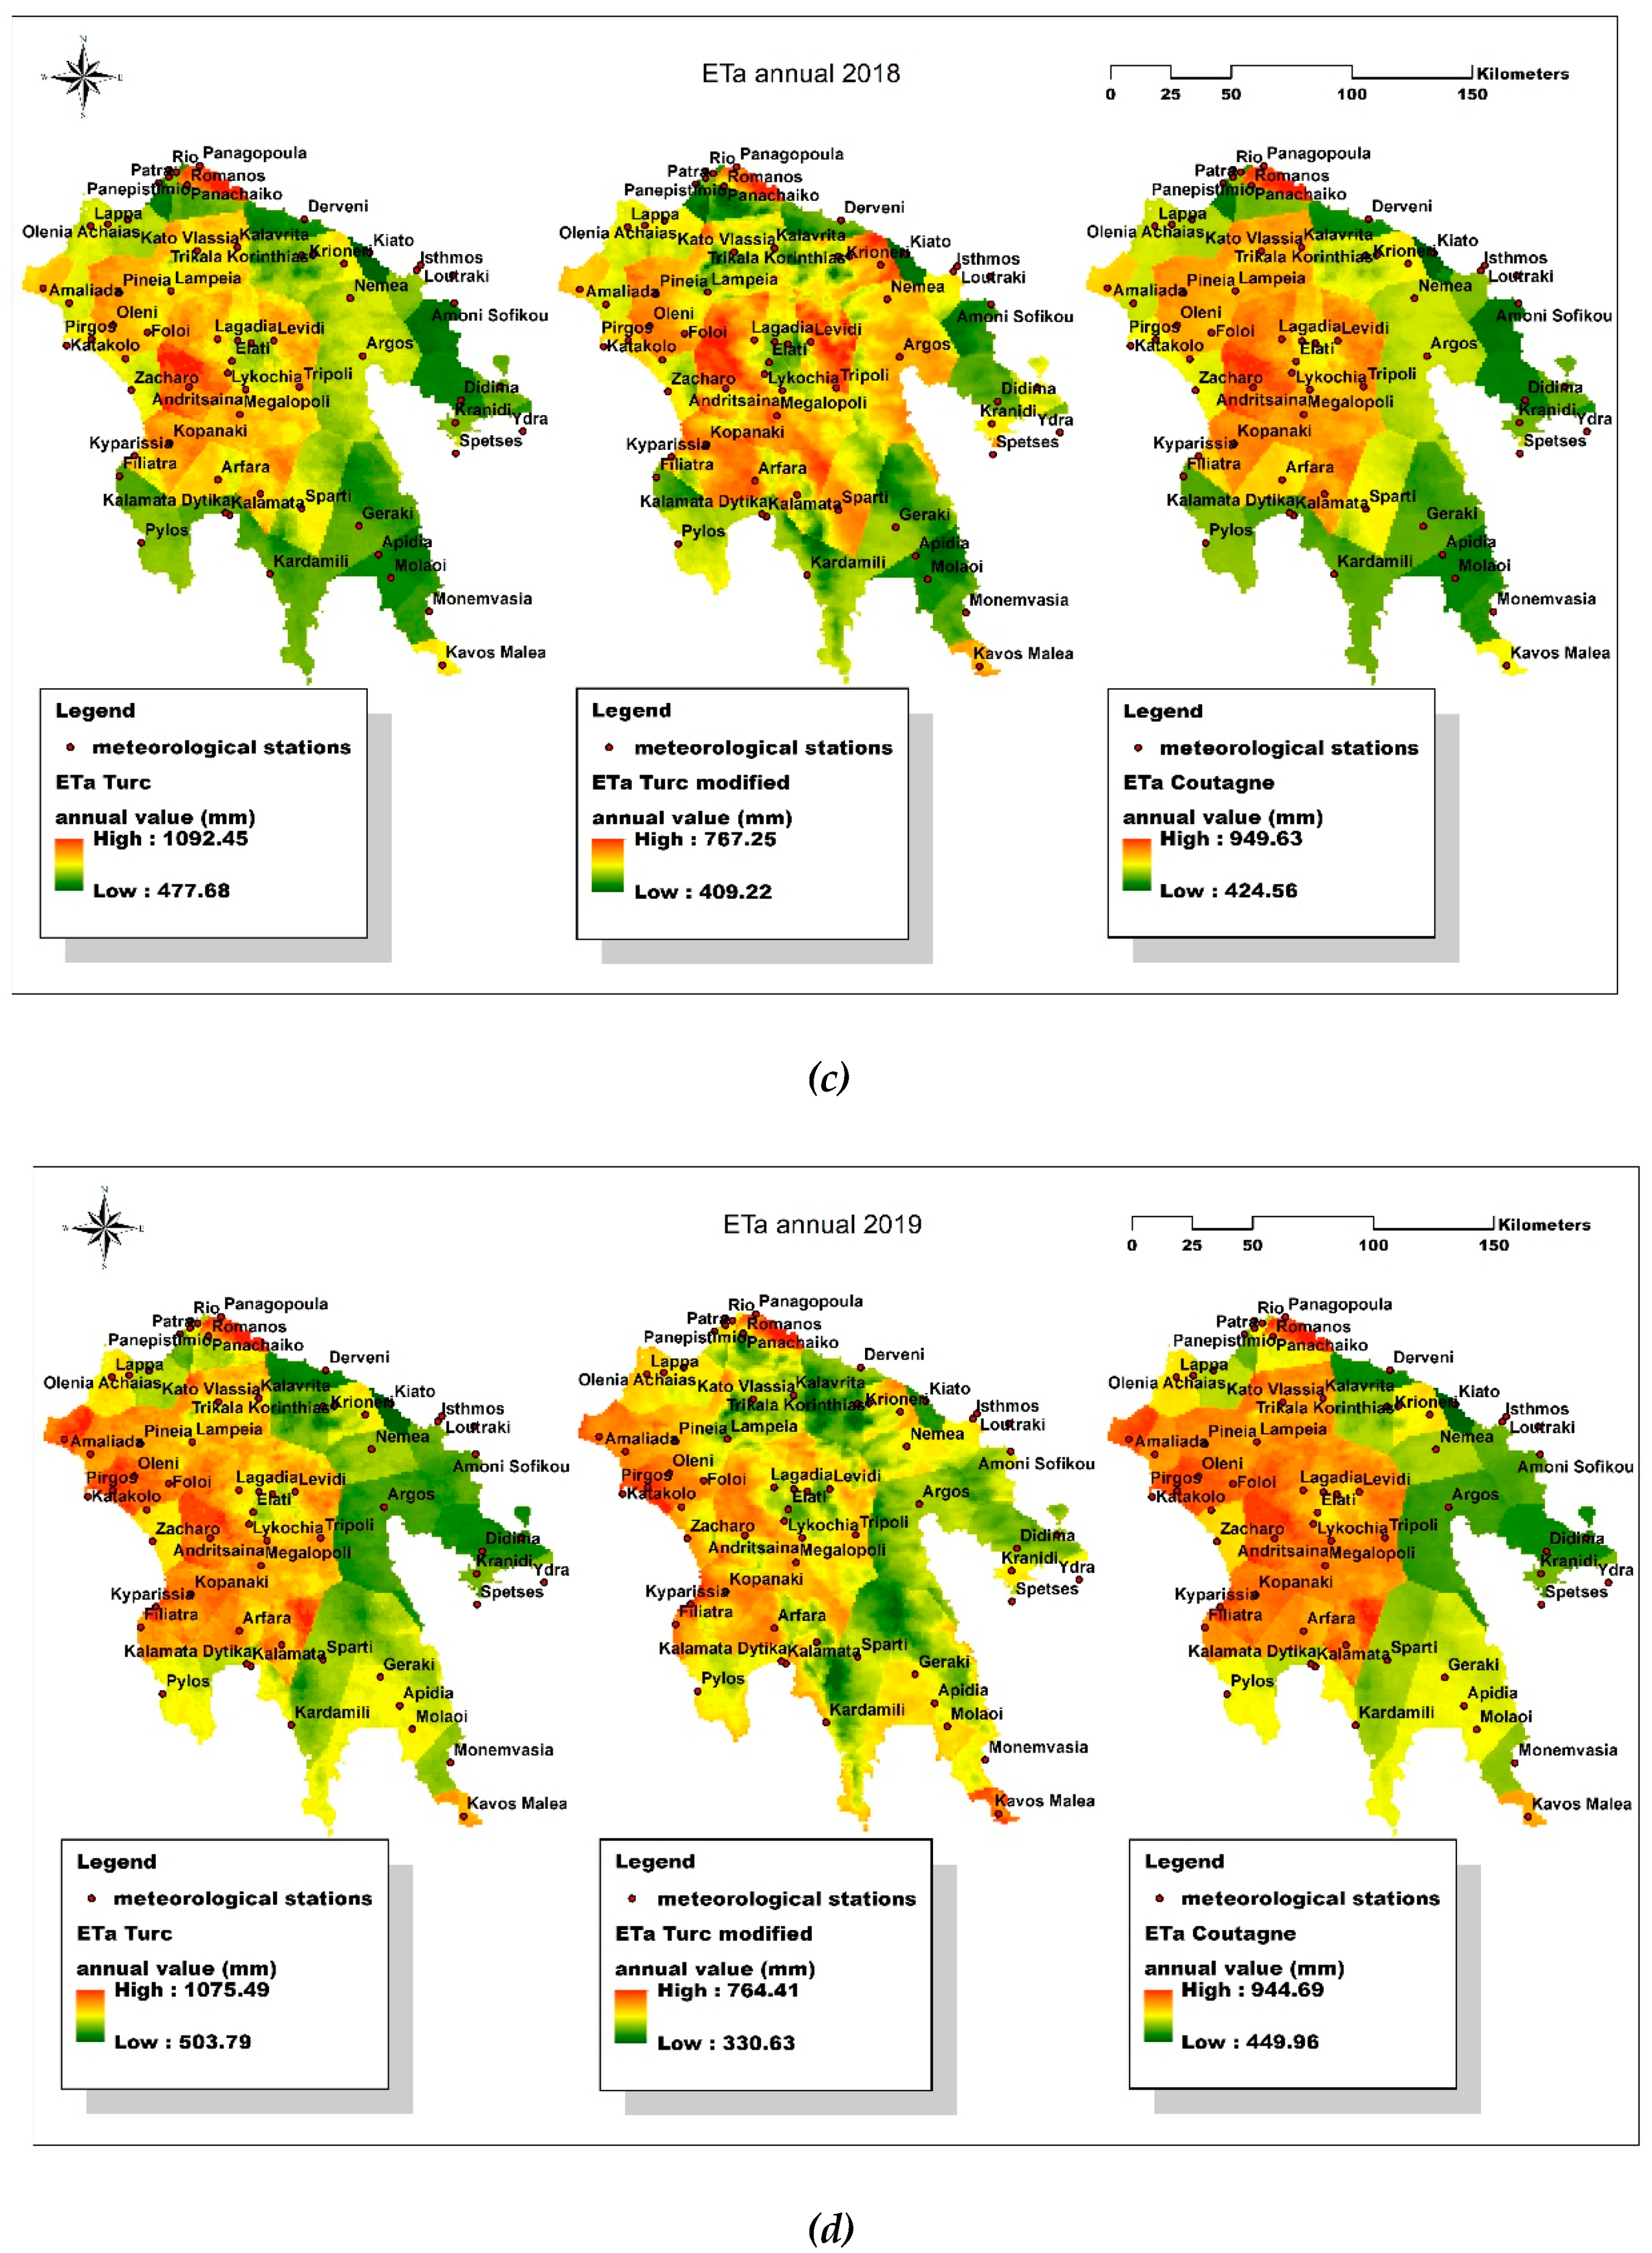
5.2. Spatial Distributions of Annual ETa by Empirical Methods
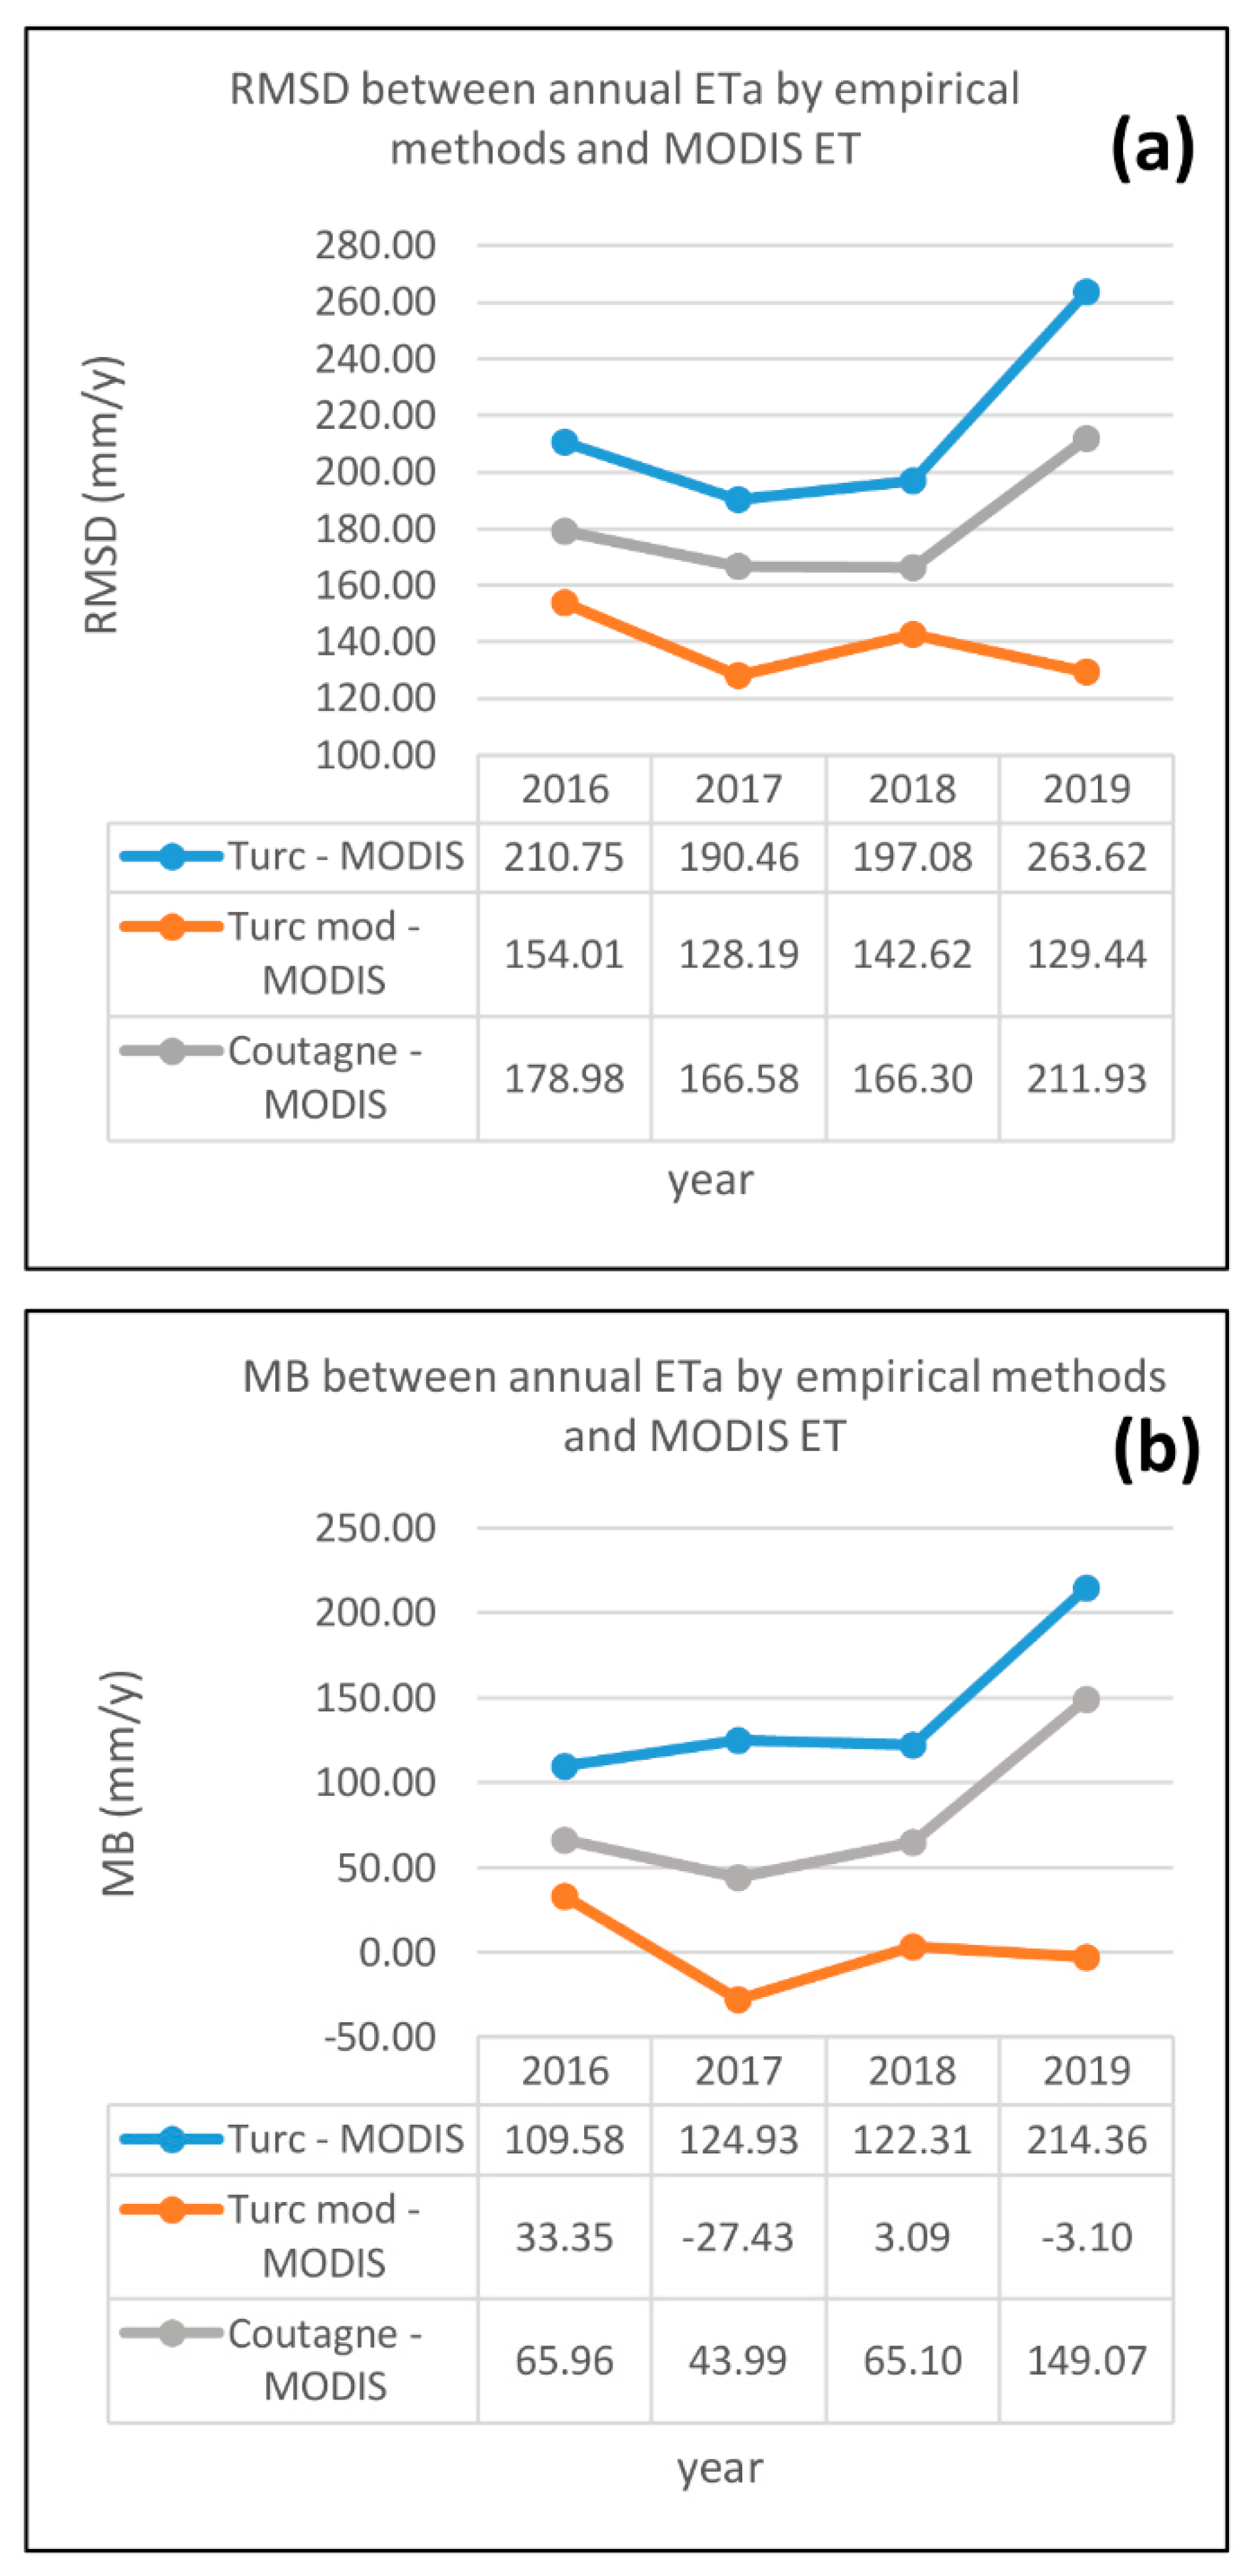
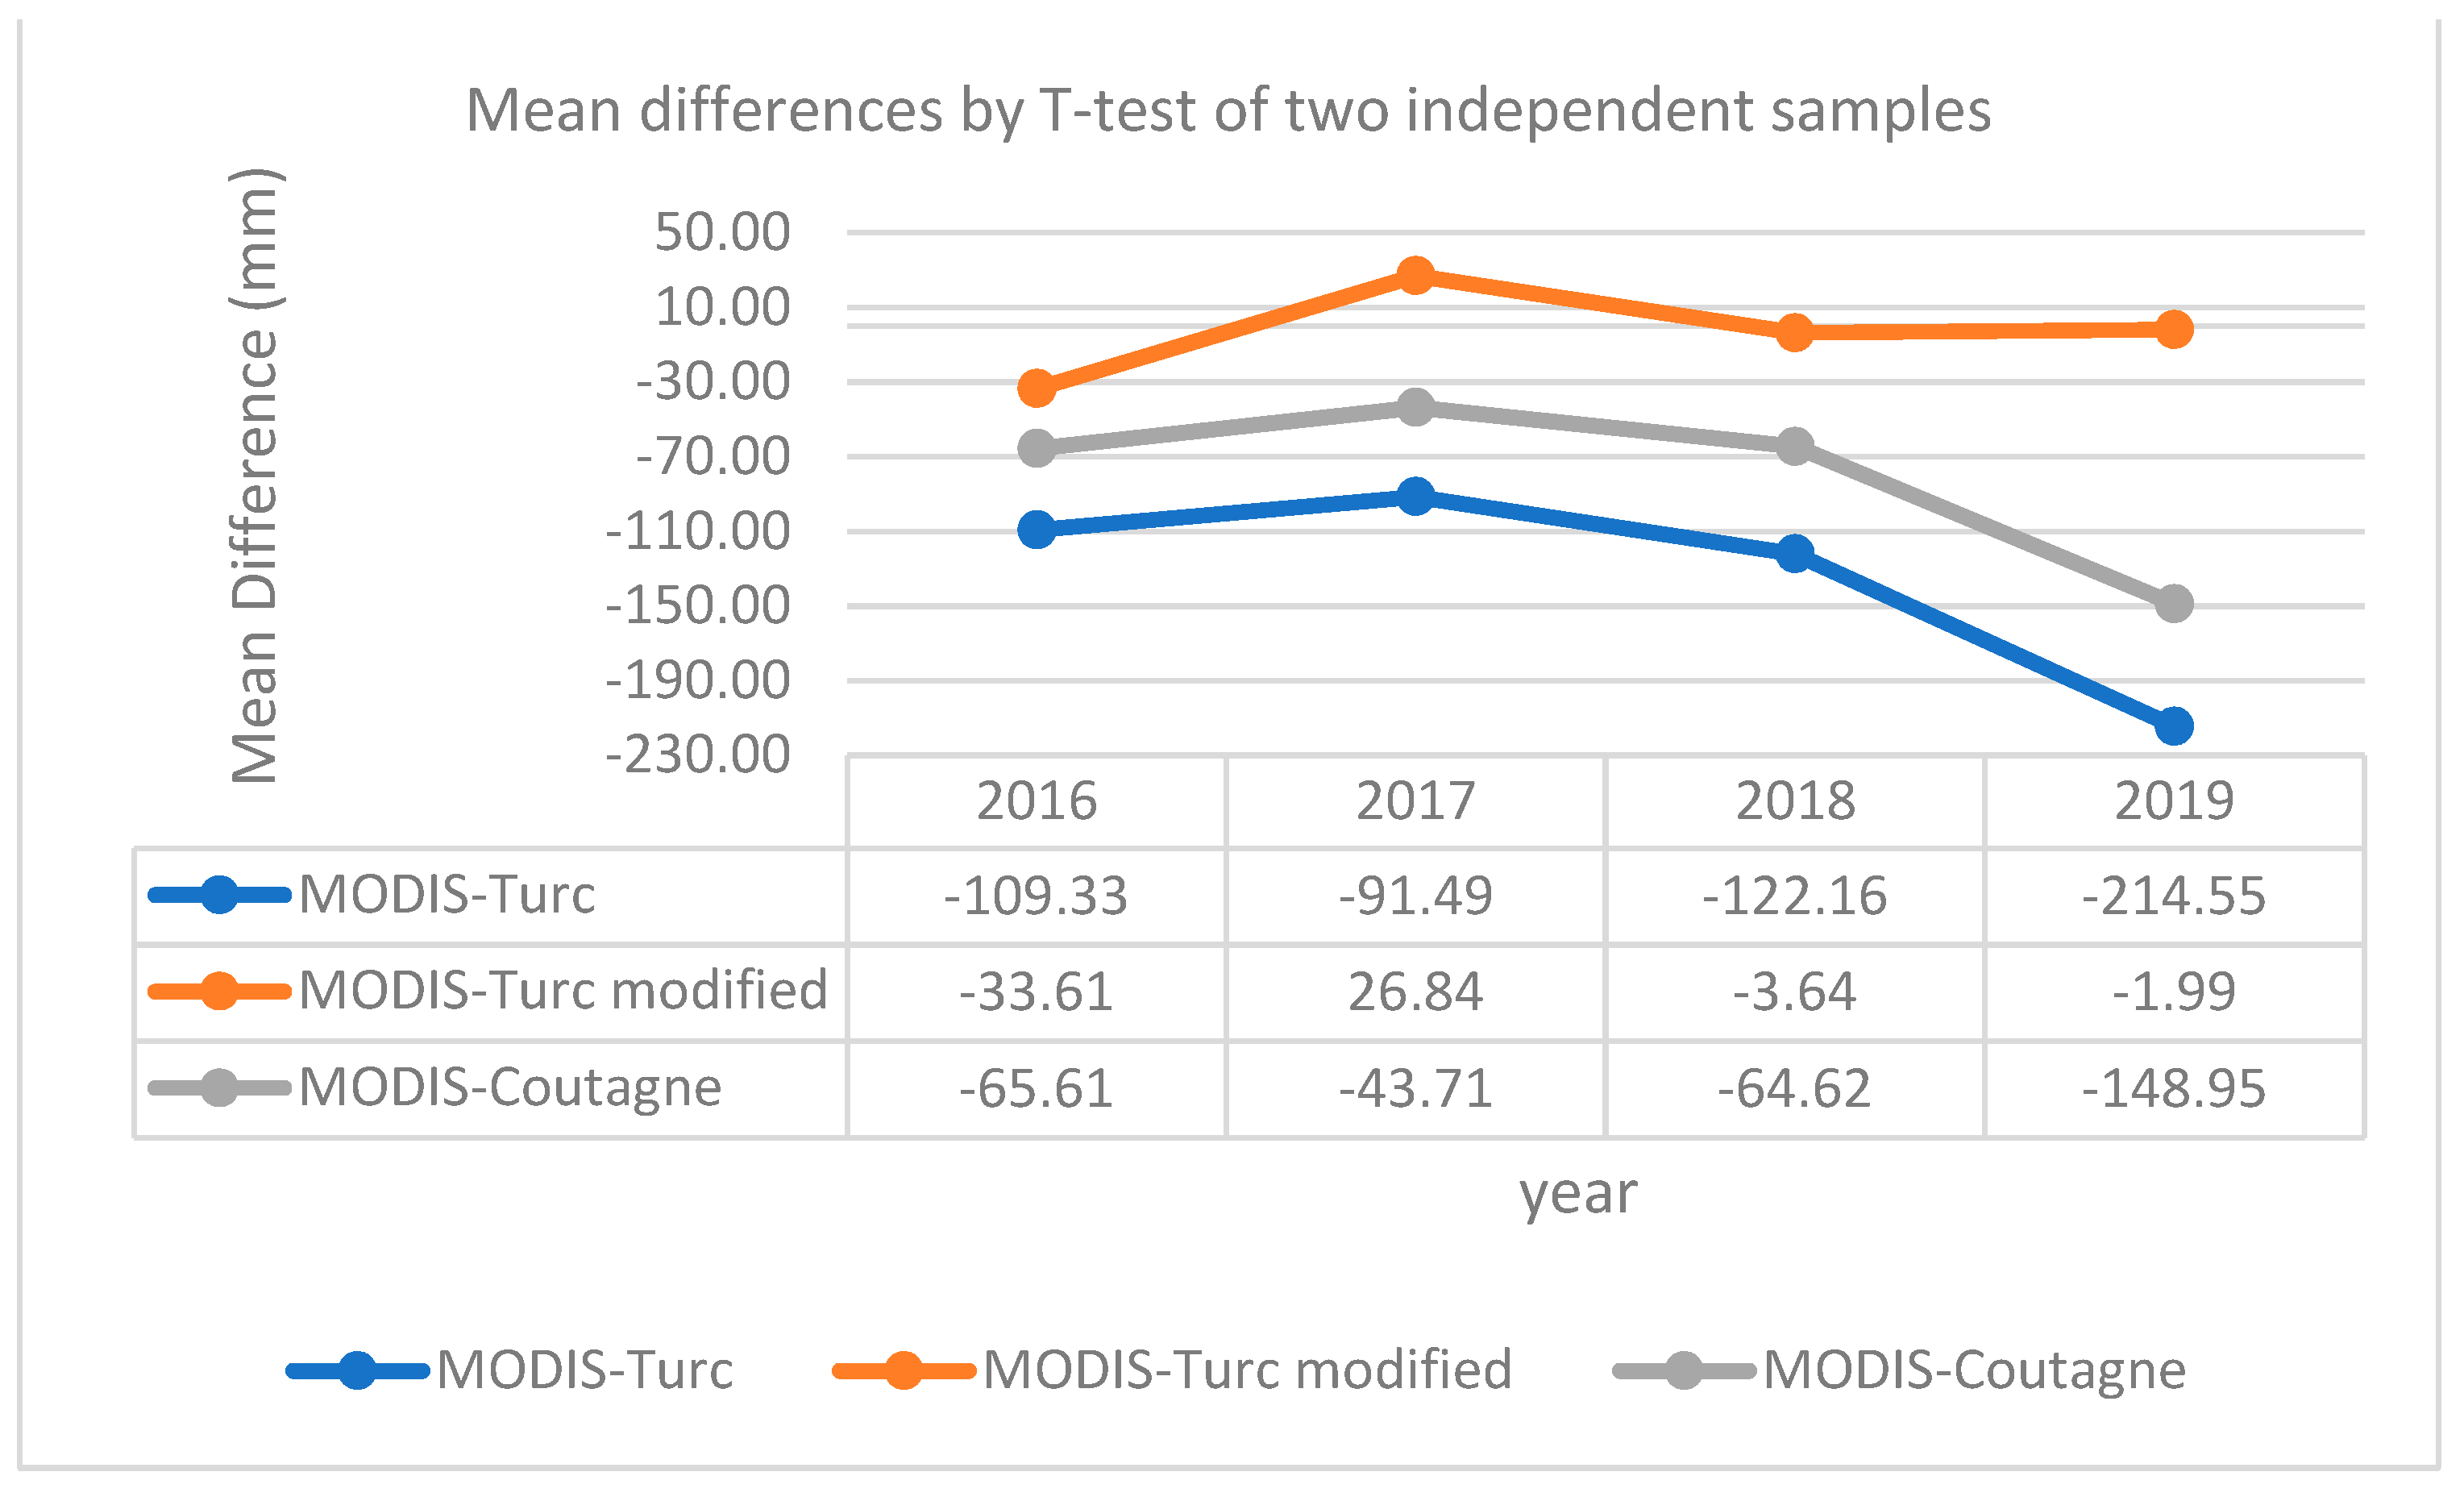
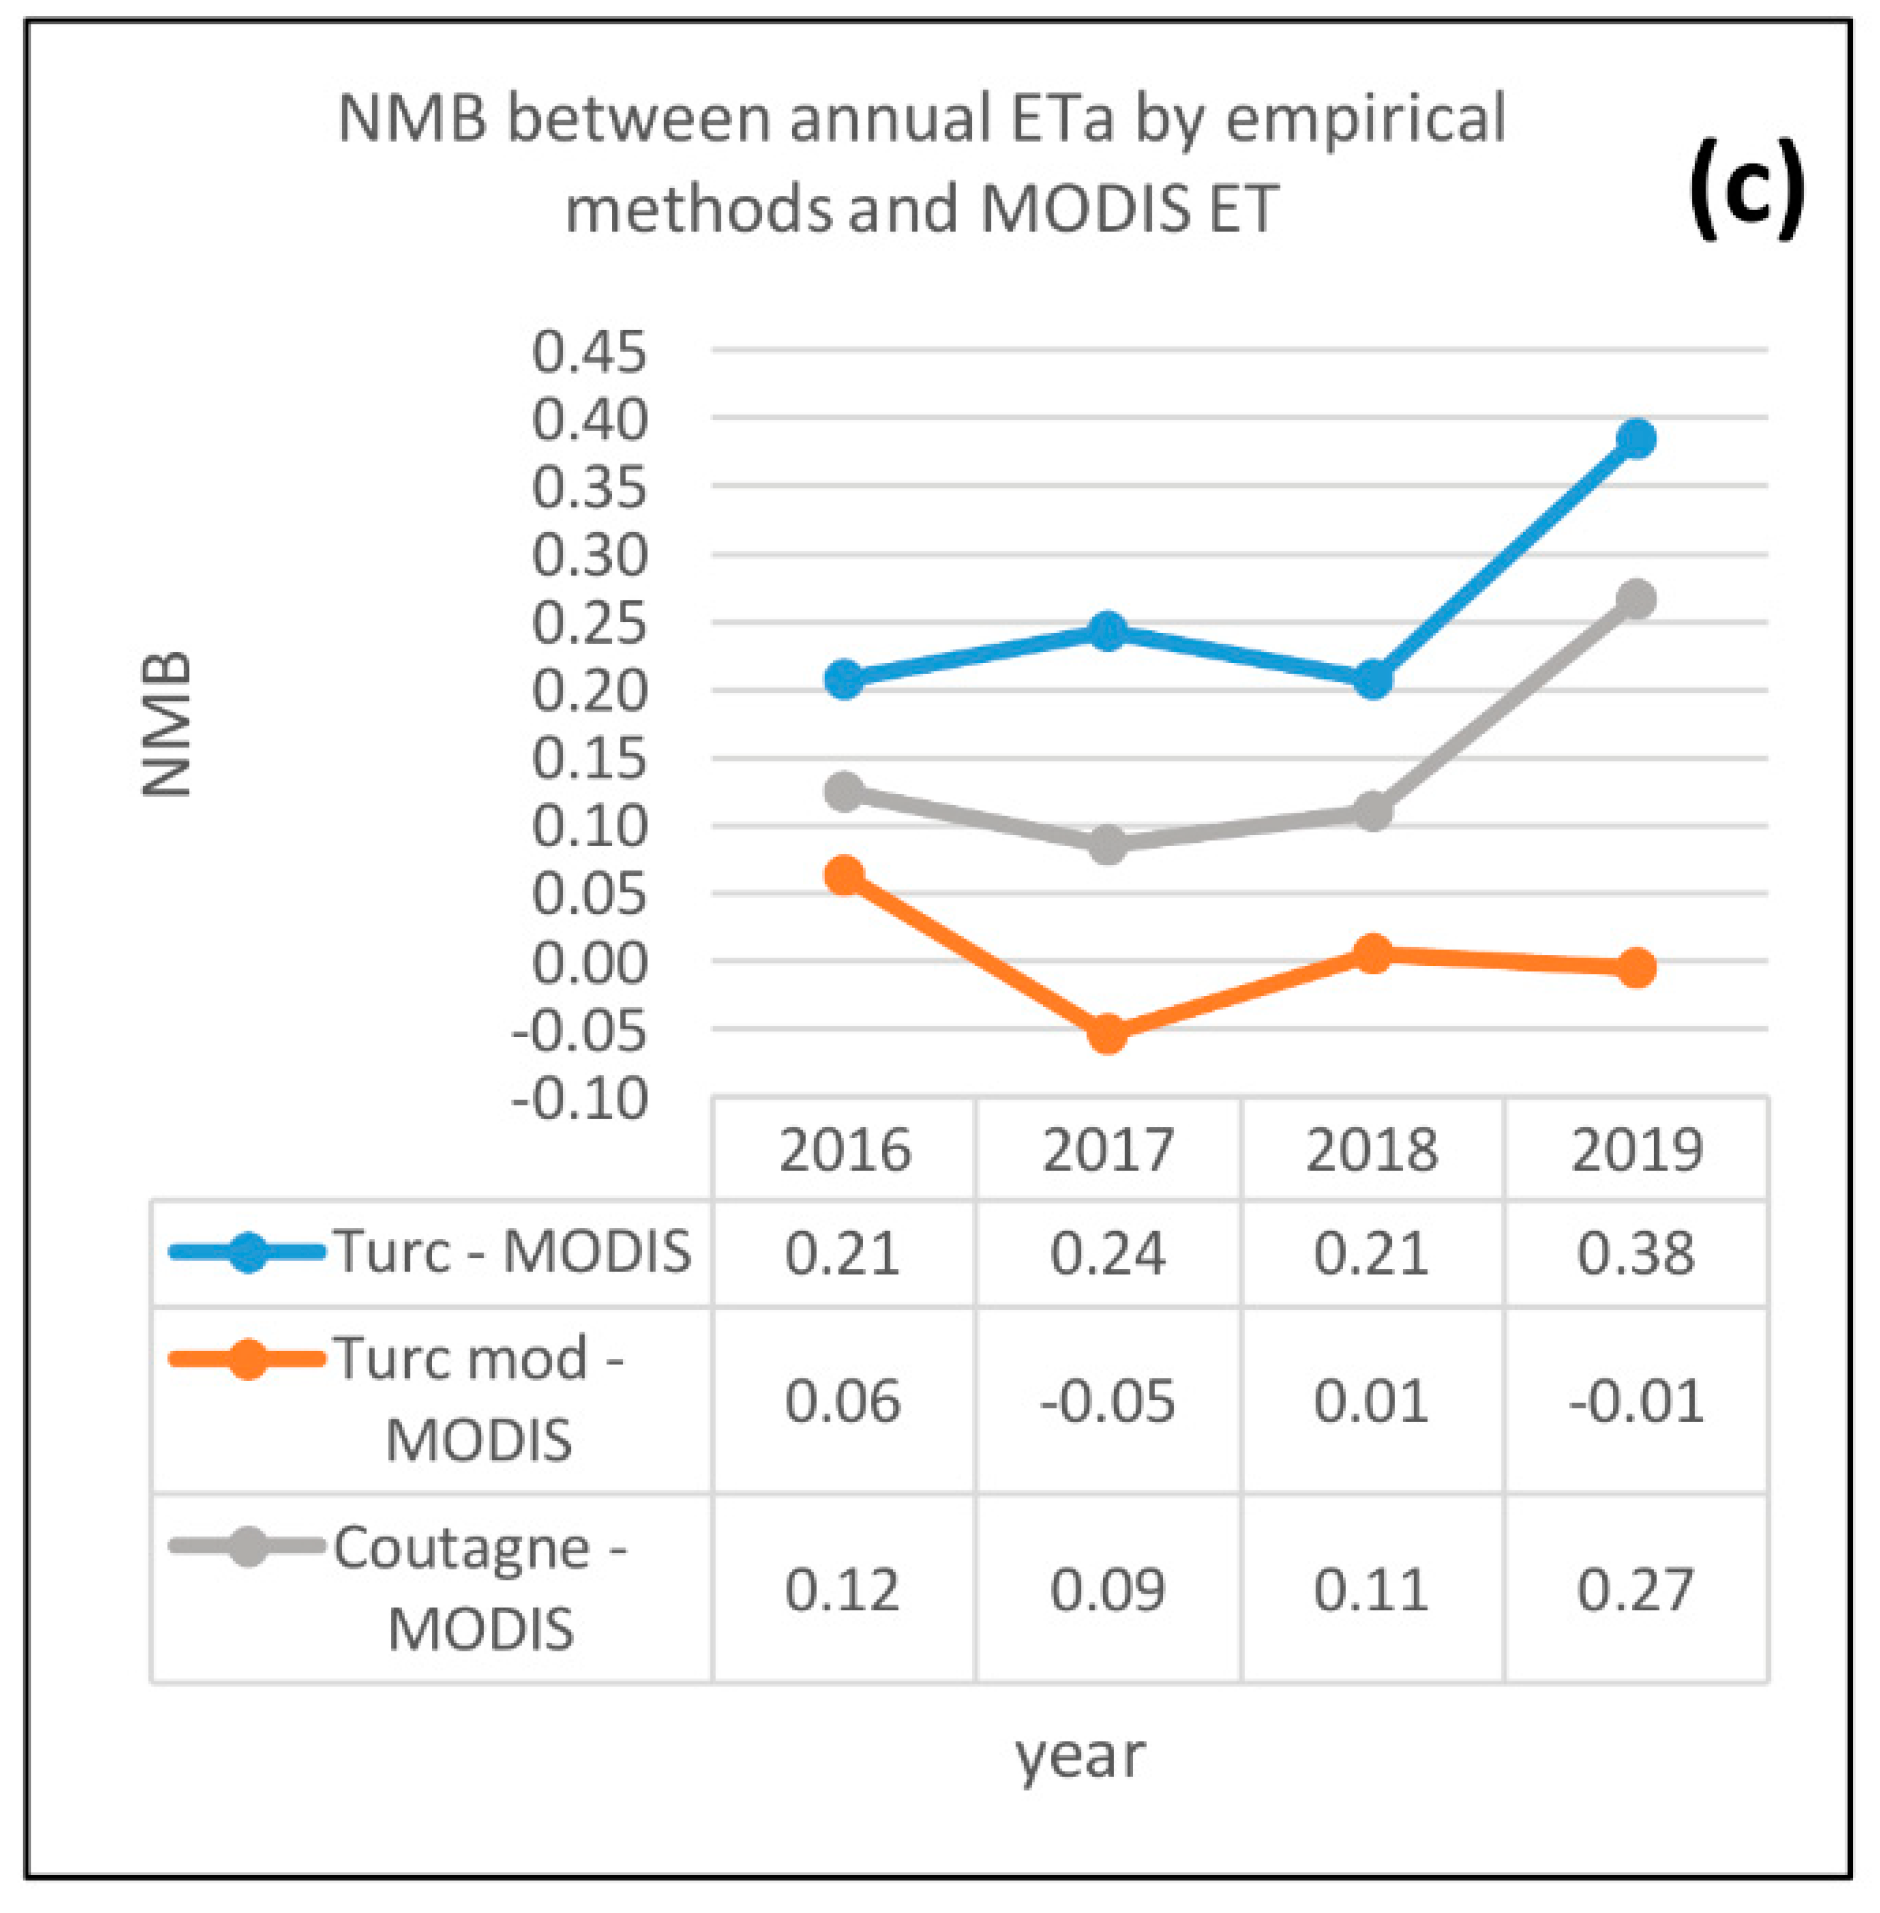
5.3. Statistical Measures between Annual Estimates by Empirical Methods and MODIS ET Products
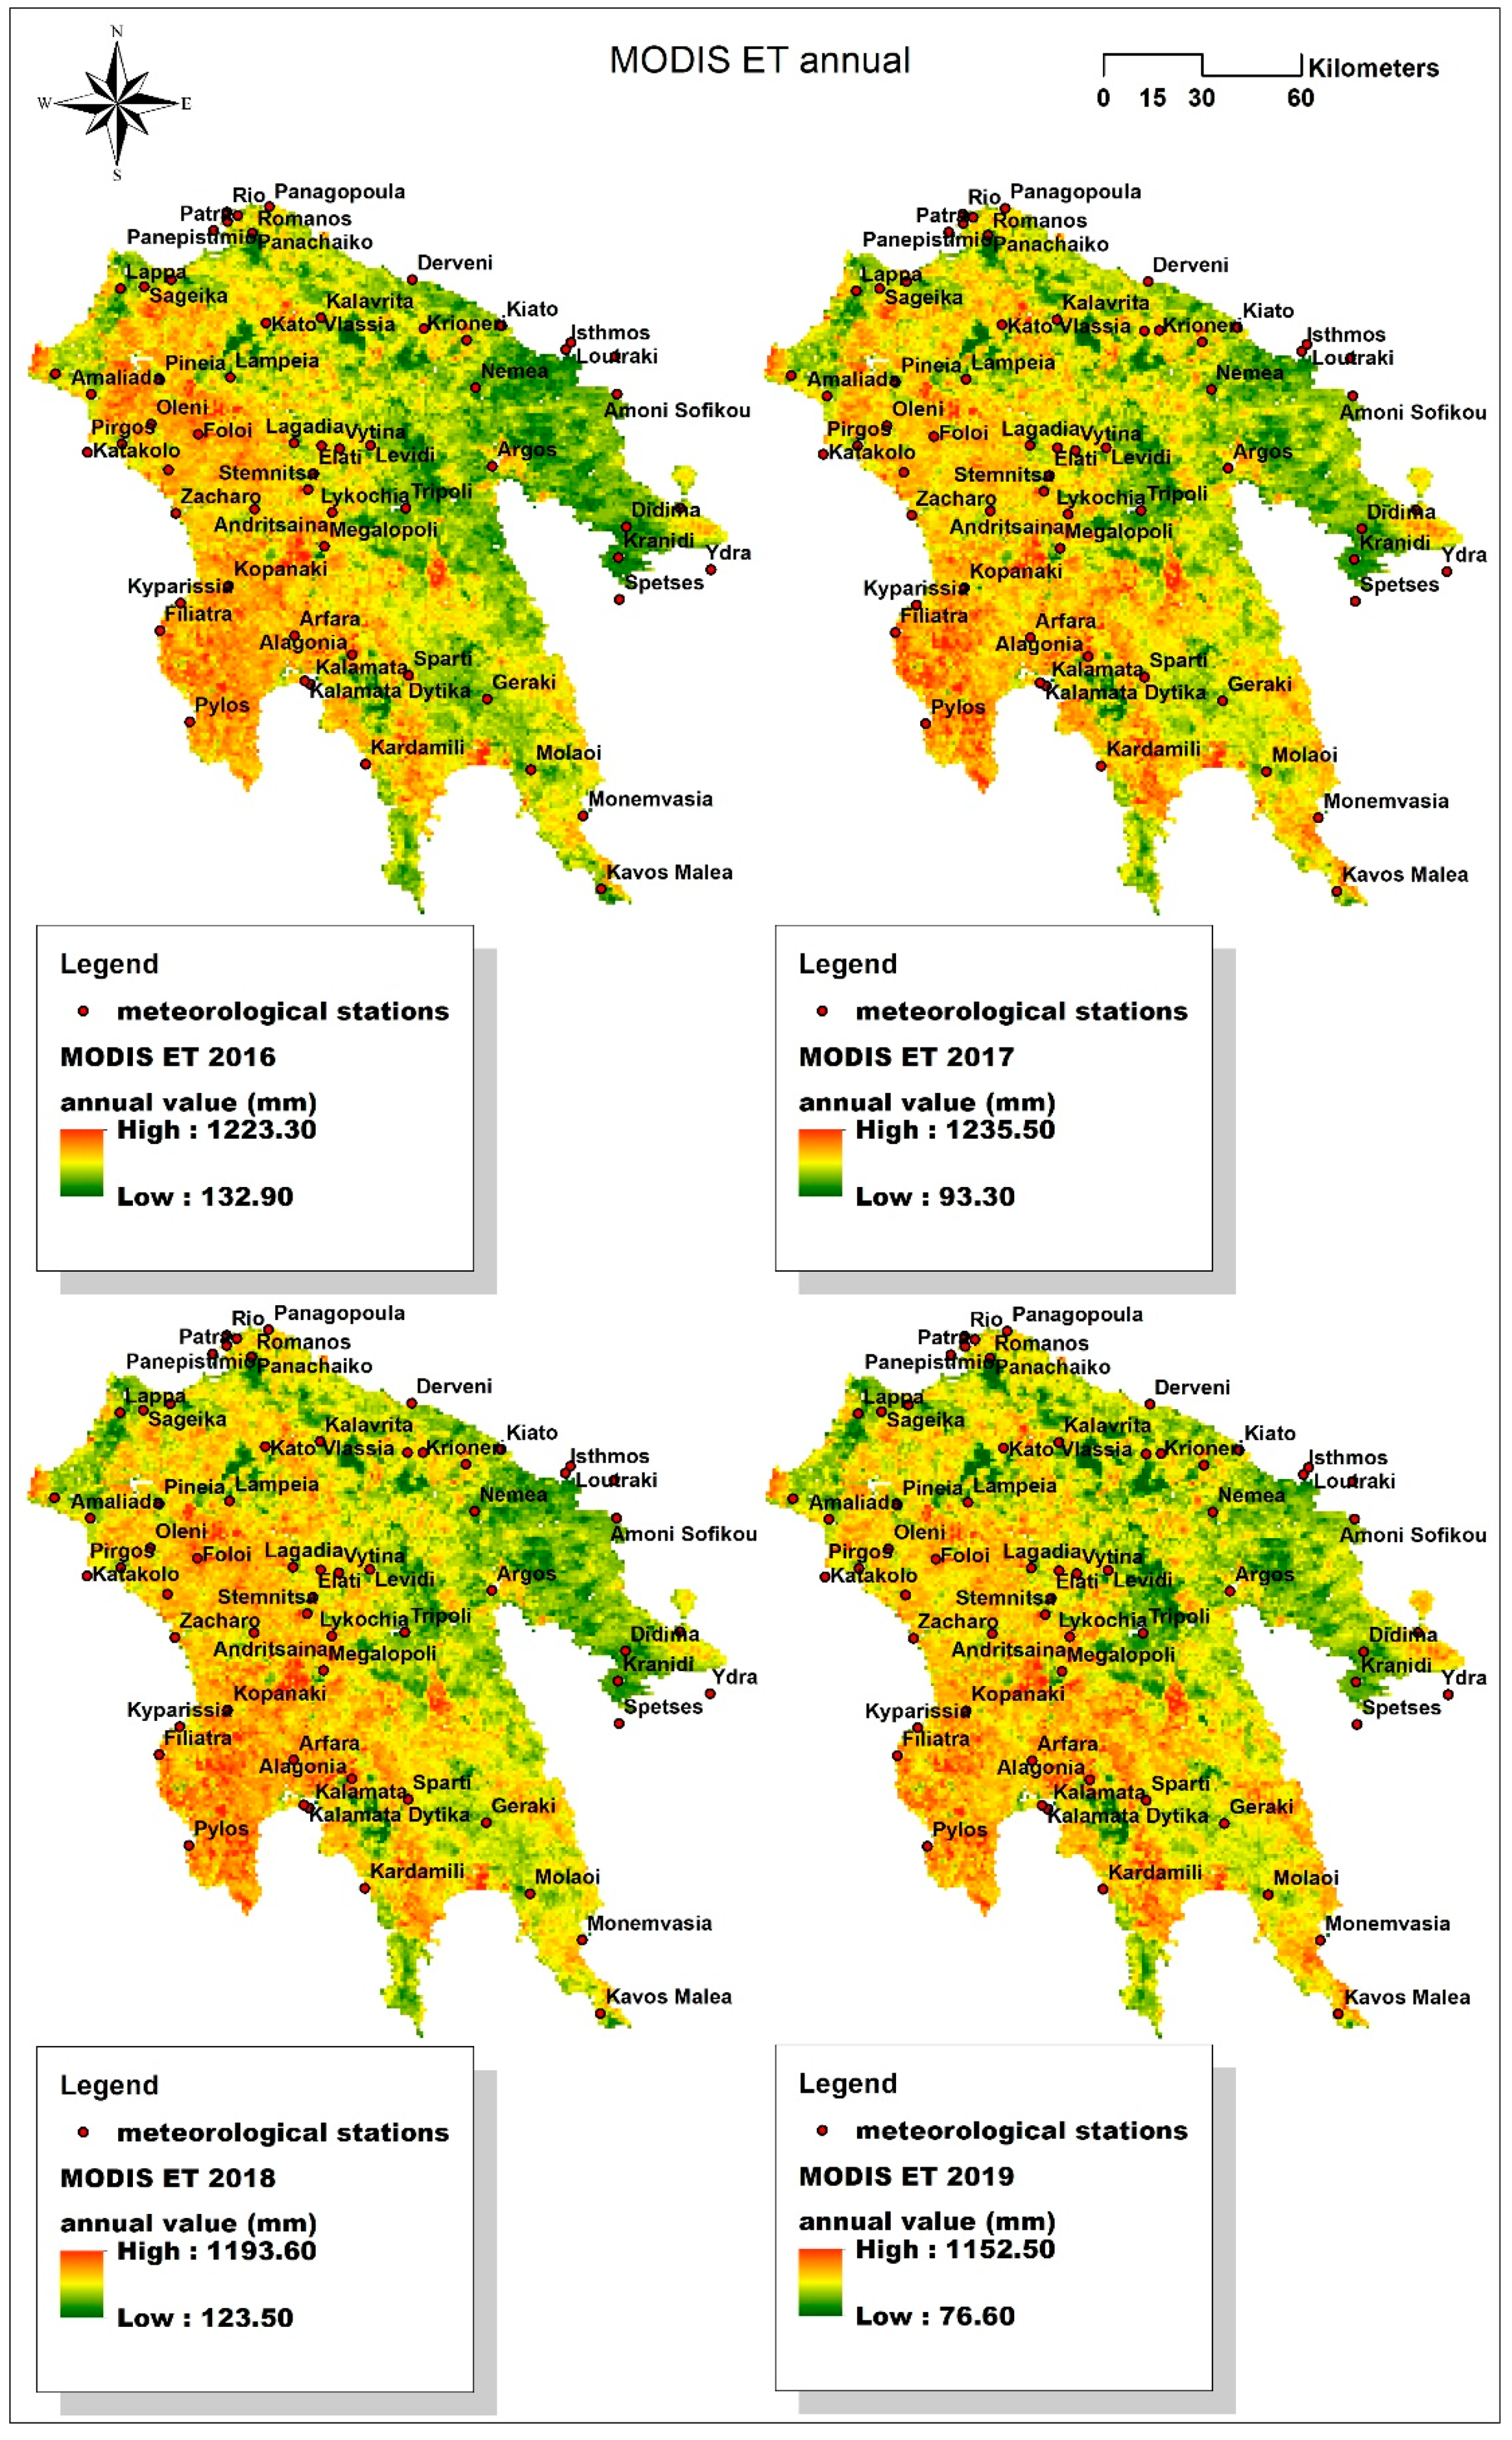
5.4. Spatial Distributions of Annual MODIS ET
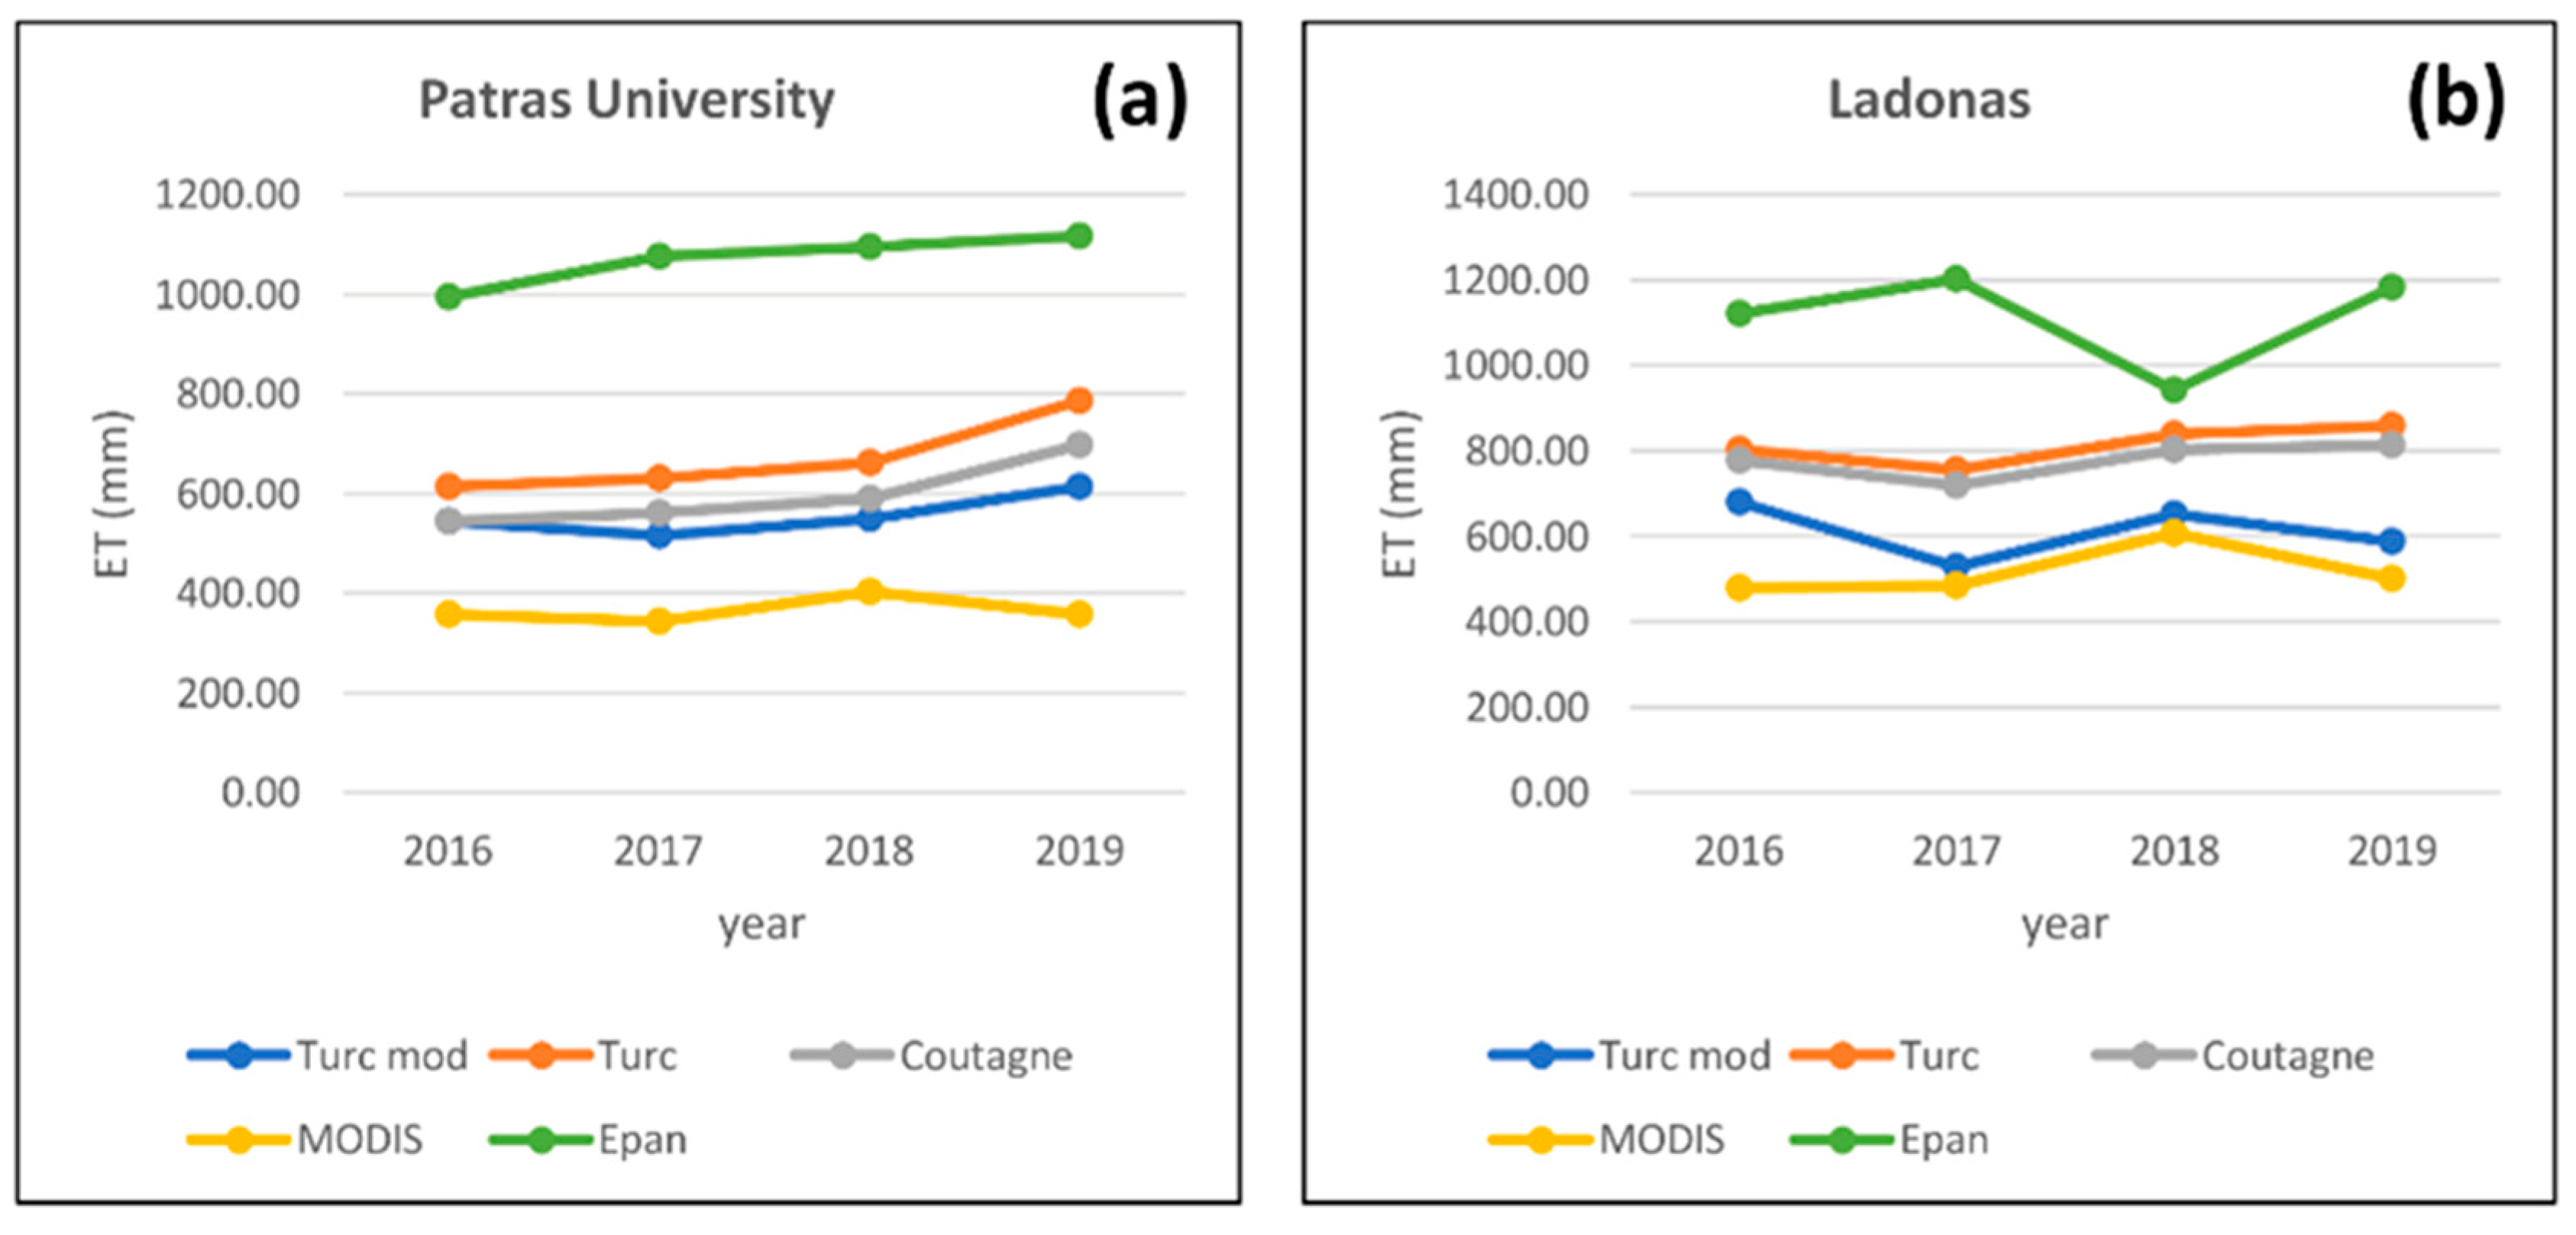
5.5. Pan Evaporation: Patras University and Ladonas Stations
5.5.1. Annual Values
5.5.2. Graphs of Annual Values of Epan, Empirical ETa and MODIS ET
6. Discussion
6.1. Annual ETa by Empirical Methods
6.2. Estimates of Empirical Methods Compared to MODIS ET
6.3. Pan Evaporation
7. Conclusions
Supplementary Materials
Author Contributions
Funding
Data Availability Statement
Acknowledgments
Conflicts of Interest
Appendix A

| ID | Station | X | Y | Elevation (m) | Municipality | ID | Station | X | Y | Elevation (m) | Municipality |
|---|---|---|---|---|---|---|---|---|---|---|---|
| Meteorological stations for 3 empirical methods (ETo) | Meteorological stations for 3 empirical methods (ETo) | ||||||||||
| 1 | Kalavrita | 334,349.9 | 4,210,128 | 781 | Achaia | 34 | Pirgos | 273,886.9 | 4,171,891 | 22 | Ilia |
| 2 | Kato Vlassia | 317,683.4 | 4,208,558 | 773 | Achaia | 35 | Vartholomio | 253,773.8 | 4,193,127 | 15 | Ilia |
| 3 | Lappa | 273,550 | 4,218,928 | 15 | Achaia | 36 | Zacharo | 290,302.6 | 4,150,806 | 5 | Ilia |
| 4 | Olenia | 288,845.1 | 4,221,654 | 34 | Achaia | 37 | Amoni Sofikou | 424,227.5 | 4,186,898 | 55 | Korinthia |
| 5 | Panachaiko | 313,491.4 | 4,235,800 | 1588 | Achaia | 38 | Derveni | 362,057.1 | 4,221,737 | 5 | Korinthia |
| 6 | Panagopoula | 318,709.5 | 4,243,842 | 15 | Achaia | 39 | Isthmos | 408,645.4 | 4,200,499 | 6 | Korinthia |
| 7 | Panepistimio | 305,972.3 | 4,239,289 | 66 | Achaia | 40 | Kiato | 389,163.5 | 4,207,722 | 15 | Korinthia |
| 8 | Patra | 301,697.8 | 4,236,694 | 6 | Achaia | 41 | Krioneri | 378,491.9 | 4,203,310 | 887 | Korinthia |
| 9 | Rio | 305,898.1 | 4,242,177 | 2 | Achaia | 42 | Loutraki | 410,248.7 | 4,202,636 | 30 | Korinthia |
| 10 | Romanos | 313,476.1 | 4,235,744 | 228 | Achaia | 43 | Nemea | 381,197.9 | 4,188,976 | 290 | Korinthia |
| 11 | Sageika | 280,638.4 | 4,219,575 | 26 | Achaia | 44 | Perigiali | 397,303.1 | 4,199,344 | 38 | Korinthia |
| 12 | Argos | 386,329.1 | 4,165,059 | 38 | Argolida | 45 | Trikala Korinthias | 365,493.7 | 4,206,835 | 1077 | Korinthia |
| 13 | Didima | 426,936.9 | 4,146,702 | 175 | Argolida | 46 | Agioi Theodoroi | 423,533.6 | 4,198,395 | 37 | Korinthia |
| 14 | Kranidi | 424,615.7 | 4,137,411 | 110 | Argolida | 47 | Apidia | 392,819.7 | 4,082,655 | 230 | Lakonia |
| 15 | Lagadia | 326,139.9 | 4,172,057 | 970 | Arkadia | 48 | Asteri | 386,527.1 | 4,076,757 | 8 | Lakonia |
| 16 | Levidi | 349,386.5 | 4,171,330 | 853 | Arkadia | 49 | Geraki | 384,706.6 | 4,094,508 | 330 | Lakonia |
| 17 | Lykochia | 337,772.6 | 4,151,113 | 870 | Arkadia | 50 | Krokees | 371,576.2 | 4,082,640 | 241 | Lakonia |
| 18 | Magouliana | 334,497.7 | 4,171,275 | 1256 | Arkadia | 51 | Molaoi | 397,984.6 | 4,072,957 | 128 | Lakonia |
| 19 | Megalopoli | 335,363 | 4,140,782 | 432 | Arkadia | 52 | Monemvasia | 413,811.4 | 4,059,051 | 17 | Lakonia |
| 20 | Stemnitsa | 330,377.8 | 4,157,967 | 1094 | Arkadia | 53 | Sparti | 360,929.9 | 4,101,670 | 204 | Lakonia |
| 21 | Tripoli | 359,989.3 | 4,152,250 | 650 | Arkadia | 54 | Alagonia | 343,840.9 | 4,107,863 | 765 | Messinia |
| 22 | Vytina | 339,989.8 | 4,170,409 | 1013 | Arkadia | 55 | Arfara | 326,299.4 | 4,113,666 | 96 | Messinia |
| 23 | Spetses | 424,919.5 | 4,124,662 | 3 | Attiki | 56 | Filiatra | 285,439.9 | 4,115,175 | 65 | Messinia |
| 24 | Taktikoupoli Troizinias | 443,373.2 | 4,152,374 | 15 | Attiki | 57 | Kalamata | 331,127 | 4,098,974 | 5 | Messinia |
| 25 | Ydra | 452,645.8 | 4,133,727 | 2 | Attiki | 58 | Kalamata Dytika | 329,347.3 | 4,100,001 | 10 | Messinia |
| 26 | Amaliada | 264,604.9 | 4,186,923 | 26 | Ilia | 59 | Kardamili | 347,857.7 | 4,074,651 | 13 | Messinia |
| 27 | Andritsaina | 314,220.3 | 4,152,125 | 731 | Ilia | 60 | Kopanaki | 306,288.6 | 4,128,741 | 184 | Messinia |
| 28 | Archaia Olympia | 287,981.3 | 4,163,856 | 45 | Ilia | 61 | Kyparissia | 291,691 | 4,123,584 | 36 | Messinia |
| 29 | Foloi | 297,082.7 | 4,174,732 | 600 | Ilia | 62 | Pylos | 294,556.8 | 4,087,590 | 5 | Messinia |
| 30 | Katakolo | 263,537.2 | 4,169,327 | 2 | Ilia | Class A stations for pan evaporation (Epan) measurements | |||||
| 31 | Lampeia | 306,840.3 | 4,192,041 | 840 | Ilia | ||||||
| 32 | Oleni | 282,783.4 | 4,177,872 | 61 | Ilia | 1 | Patras University | 306,411.3 | 4,240,231.8 | 24.8 | Achaia |
| 33 | Pineia | 285,425.3 | 4,191,240 | 184 | Ilia | 2 | Ladonas | 321,161.4 | 4,180,593.8 | 420 | Arkadia |
References
- Sidiropoulos, P.; Dalezios, N.R.; Loukas, A.; Mylopoulos, N.; Spiliotopoulos, M.; Faraslis, I.N.; Alpanakis, N.; Sakellariou, S. Quantitative Classification of Desertification Severity for Degraded Aquifer Based on Remotely Sensed Drought Assessment. Hydrology 2021, 8, 47. [Google Scholar] [CrossRef]
- Tigkas, D.; Vangelis, H.; Tsakiris, G. Implementing Crop Evapotranspiration in RDI for Farm-Level Drought Evaluation and Adaptation under Climate Change Conditions. Water Resour. Manag. 2020, 34, 4329–4343. [Google Scholar] [CrossRef]
- Xu, S.; Yu, Z.; Yang, C.; Ji, X.; Zhang, K. Trends in evapotranspiration and their responses to climate change and vegetation greening over the upper reaches of the Yellow River Basin. Agric. For. Meteorol. 2018, 263, 118–129. [Google Scholar] [CrossRef]
- Long, D.; Longuevergne, L.; Scanlon, B.R. Uncertainty in evapotranspiration from land surface modeling, remote sensing, and GRACE satellites. Water Resour. Res. 2014, 50, 1131–1151. [Google Scholar] [CrossRef] [Green Version]
- Liu, Z.; Ballantyne, A.P.; Cooper, L.A. Biophysical feedback of global forest fires on surface temperature. Nat. Commun. 2019, 10. [Google Scholar] [CrossRef] [Green Version]
- Häusler, M.; Nunes, J.P.; Silva, J.M.N.; Keizer, J.J.; Warneke, T.; Pereira, J.M.C. A promising new approach to estimate drought indices for fire danger assessment using remotely sensed data. Agric. For. Meteorol. 2019, 274, 195–209. [Google Scholar] [CrossRef]
- Soulis, K.; Valiantzas, J.; Dercas, N. Modelling forest fires hydrological impact using spatio-temporal geographical data. In Proceedings of the International Congress on Environmental Modelling and Software Modelling for Environment’s Sake (iEMSs), Ottawa, ON, Canada, 2010; Available online: https://www.researchgate.net/publication/331812315_Modelling_forest_fires_hydrological_impact_using_spatio-temporal_geographical_data (accessed on 31 July 2021).
- Larbi, I.; Obuobie, E.; Verhoef, A.; Julich, S.; Feger, K.; Bossa, A.Y.; Macdonald, D. Water balance components estimation under scenarios of land cover change in the Vea catchment, West Africa. Hydrol. Sci. J. 2020, 65, 2196–2209. [Google Scholar] [CrossRef]
- Rodríguez-Huerta, E.; Rosas-Casals, M.; Hernández-Terrones, L.M. A water balance model to estimate climate change impact on groundwater recharge in Yucatan peninsula, Mexico. Hydrol. Sci. J. 2020, 65, 470–486. [Google Scholar] [CrossRef]
- Jung, C.; Lee, D.; Moon, J. Comparison of the Penman-Monteith method and regional calibration of the Hargreaves equation for actual evapotranspiration using SWAT-simulated results in the Seolma-cheon basin, South Korea. Hydrol. Sci. J. 2016, 61, 793–800. [Google Scholar] [CrossRef]
- Soulis, K.X.; Generali, K.A.; Papadaki, C.; Theodoropoulos, C.; Psomiadis, E. Hydrological Response of Natural Mediterranean Watersheds to Forest Fires. Hydrology 2021, 8, 15. [Google Scholar] [CrossRef]
- Jayathilake, D.I.; Smith, T. Understanding the role of hydrologic model structures on evapotranspiration-driven sensitivity. Hydrol. Sci. J. 2020, 65, 1474–1489. [Google Scholar] [CrossRef]
- Dimitriadou, S.; Nikolakopoulos, K.G. Remote sensing methods to estimate evapotranspiration incorporating MODIS derived data and applications over Greece: A review. In Proceedings of the SPIE 11524, Eighth International Conference on Remote Sensing and Geoinformation of the Environment (RSCy2020), Paphos, Cyprus, 26 August 2020. [Google Scholar] [CrossRef]
- Mutiibwa, D.; Strachan, S.; Albright, T. Land Surface Temperature and Surface Air Temperature in Complex Terrain. IEEE J. Sel. Top. Appl. Earth Obs. Remote Sens. 2015, 8, 4762–4774. [Google Scholar] [CrossRef]
- Kitsara, G.; Papaioannou, G.; Retalis, A.; Paronis, D.; Kerkides, P. Estimation of air temperature and reference evapotranspiration using MODIS land surface temperature over Greece evapotranspiration using MODIS land surface temperature. Int. J. Remote Sens. 2018, 39, 924–948. [Google Scholar] [CrossRef]
- Lin, S.; Moore, N.J.; Messina, J.P.; DeVisser, M.H.; Wu, J. Evaluation of estimating daily maximum and minimum air temperature with MODIS data in east Africa. Int. J. Appl. Earth Obs. Geoinf. 2012, 18, 128–140. [Google Scholar] [CrossRef]
- Raoufi, R.; Beighley, E. Estimating Daily Global Evapotranspiration Using Penman–Monteith Equation and Remotely Sensed Land Surface Temperature. Remote Sens. 2017, 9, 1138. [Google Scholar] [CrossRef] [Green Version]
- Wan, Z. New refinements and validation of the MODIS land-surface temperature/emissivity products. Remote Sens. Environ. 2008, 112, 59–74. [Google Scholar] [CrossRef]
- Jin, M.; Dickinson, R.E. Land Surface Skin Temperature Climatology: Benefitting from the Strengths of Satellite Observations. Environ. Res. Lett. 2010, 5, 044004. [Google Scholar] [CrossRef] [Green Version]
- Vancutsem, C.; Ceccato, P.; Dinku, T.; Connor, S.; Lin, J. Evaluation of MODIS land surface temperature data to estimate air temperature in different ecosystems over Africa. Remote Sens. Environ. 2010, 114, 449–465. [Google Scholar] [CrossRef]
- Varotsos, K.V.; Karali, A.; Lemesios, G.; Kitsara, G.; Moriondo, M.; Dibari, C.; Leolini, L.; Giannakopoulos, C. Near future climate change projections with implications for the agricultural sector of three major Mediterranean islands. Reg. Environ. Chang. 2021, 16, 1–15. [Google Scholar] [CrossRef]
- Mimikou, M.; Baltas, E. Assessment of Climate Change Impacts in Greece: A General Overview. Am. J. Clim. Chang. 2013, 2, 46–56. [Google Scholar] [CrossRef]
- Vicente-Serrano, S.M.; Saz-Sánchez, M.A.; Cuadrat, J.M. Comparative analysis of interpolation methods in the middle Ebro Valley (Spain): Application to annual precipitation and temperature. Clim. Res. 2003, 24, 161–180. [Google Scholar] [CrossRef] [Green Version]
- Silva, A.M.; da Silva, R.M.; Santos, C.A.G. Automated surface energy balance algorithm for land (ASEBAL) based on automating endmember pixel selection for evapotranspiration calculation in MODIS orbital images. Int. J. Appl. Earth Obs. Geoinf. 2019, 79, 1–11. [Google Scholar] [CrossRef]
- Proias, G.; Gravalos, I.; Papageorgiou, E.; Poczęta, K.; Sakellariou-Makrantonaki, M. Forecasting Reference Evapotranspiration Using Time Lagged Recurrent Neural Network. Wseas Trans. Environ. Dev. 2020, 16, 699–707. [Google Scholar] [CrossRef]
- Mosavi, A.; Edalatifar, M. A Hybrid Neuro-Fuzzy Algorithm for Prediction of Reference Evapotranspiration. In Recent Advances in Technology Research and Education; Laukaitis, G., Ed.; INTER-ACADEMIA 2018; Lecture Notes in Networks and Systems; Springer: Cham, Switzerland, 2019; Volume 53. [Google Scholar] [CrossRef]
- Sattari, M.T.; Apaydin, H.; Band, S.S.; Mosavi, A.; Prasad, R. Comparative analysis of kernel-based versus ANN and deep learning methods in monthly reference evapotranspiration estimation. Hydrol. Earth Syst. Sci. 2021, 25, 603–618. [Google Scholar] [CrossRef]
- Shamshirband, S.; Hashemi, S.; Salimi, H.; Samadianfard, S.; Asadi, E.; Shadkani, S.; Kargar, K.; Mosavi, A.; Nabipour, N.; Chau, K.W. Predicting Standardized Streamflow index for hydrological drought using machine learning models. Eng. Appl. Comput. Fluid Mech. 2020, 14, 339–350. [Google Scholar] [CrossRef]
- Diamantopoulou, M.J.; Georgiou, P.E.; Papamichail, D.M. Performance evaluation of artificial neural networks in estimating reference evapotranspiration with minimal meteorological data. Glob. Nest J. 2011, 13, 18–27. [Google Scholar]
- Andreu, A.; Kustas, W.P.; Polo, M.J.; Carrara, A.; González-Dugo, M.P. Modeling Surface Energy Fluxes over a Dehesa (Oak Savanna) Ecosystem Using a Thermal Based Two Source Energy Balance Model (TSEB) II—Integration of Remote Sensing Medium and Low Spatial Resolution Satellite Images. Remote Sens. 2018, 10, 558. [Google Scholar] [CrossRef] [Green Version]
- Gourgoulios, V.; Nalbantis, I. Ungauged drainage basins: Investigation on the basin of Peneios River, Thessaly, Greece. Eur. Water 2017, 57, 163–169. [Google Scholar]
- Valiantzas, J.D. Temperature-and humidity-based simplified Penman’s ET0 formulae. Comparisons with temperature-based Hargreaves-Samani and other methodologies. Agric. Water Manag. 2018, 208, 326–334. [Google Scholar] [CrossRef]
- Chatzithomas, C.D.; Alexandris, S.G. Solar radiation and relative humidity based, empirical method, toestimate hourly reference evapotranspiration. Agric. Water Manag. 2015, 152, 188–197. [Google Scholar] [CrossRef]
- Toulios, L.; Spiliotopoulos, M.; Papadavid, G.; Loukas, A. Observation Methods and Model Approaches for Estimating Regional Crop Evapotranspiration and Yield in Agro-Landscapes: A Literature Review. In Landscape Modelling and Decision Support. Innovations in Landscape Research; Mirschel, W., Terleev, V., Wenkel, K.O., Eds.; Springer: Cham, Switzerland, 2013; pp. 79–100. ISBN 978-3-030-37420-4. [Google Scholar] [CrossRef]
- Malamos, N.; Tsirogiannis, I.L.; Tegos, A.; Efstratiadis, A.; Koutsoyiannis, D. Spatial interpolation of potential evapotranspiration for precision irrigation purposes. Eur. Water 2017, 59, 303–309. [Google Scholar]
- Nastos, P.; Kapsomenakis, J.; Kotsopoulos, S.; Poulos, S. Present and future projected reference evapotranspiration over Thessaly plain, Greece, based on regional climate models’ simulations. Eur. Water 2015, 51, 63–72. [Google Scholar]
- Sakellariou-Makrantonaki, M.; Vagenas, I.N. Mapping crop evapotranspiration and total crop water requirements estimation in central Greece. Eur. Water 2006, 13–14, 3–13. [Google Scholar]
- Efthimiou, N.; Alexandris, S.; Karavitis, C.; Mamassis, N. Comparative analysis of reference evapotranspiration estimation between various methods and the FAO56 Penman-Monteith procedure. Eur. J. Water Qual. 2013, 42, 19–34. [Google Scholar]
- Xystrakis, F.; Matzarakis, A. Evaluation of 13 Empirical Reference Potential Evapotranspiration Equations on the Island of Crete in Southern Greece. J. Irrig. Drain. Eng. 2011, 137, 211–222. [Google Scholar] [CrossRef] [Green Version]
- Paparrizos, S.; Maris, F.; Matzarakis, A. Sensitivity analysis and comparison of various potential evapotranspiration formulae for selected Greek areas with different climate conditions. Theor. Appl. Climatol. 2017, 128, 745–759. [Google Scholar] [CrossRef]
- Aschonitis, V.; Miliaresis, G.; Demertzi, K.; Papamichail, D. Terrain Segmentation of Greece Using the Spatial and Seasonal Variation of Reference Crop Evapotranspiration. Adv. Meteorol. 2016, 2016, 3092671. [Google Scholar] [CrossRef] [Green Version]
- Mamassis, N.; Panagoulia, D.; Novkovic, A. Sensitivity analysis of Penman evaporation method. Glob. Nest J. 2014, 16, 628–639. [Google Scholar]
- Dalezios, N.R.; Loukas, A.; Bampzelis, D. Spatial variability of reference evapotranspiration in Greece. Phys. Chem. Earth 2002, 27, 1031–1038. [Google Scholar] [CrossRef]
- Mavromatis, T.; Stathis, D. Response of the water balance in Greece to temperature and precipitation trends. Ther. Appl. Clim. 2011, 104, 13–24. [Google Scholar] [CrossRef]
- Voudouris, K.S.; Georgiou, P.E.; Mavromatis, T.; Gianneli, C. Comparison of actual evapotranspiration estimation methods: Application to Korisos basin, NW Greece. In Evapotranspiration: Processes, Sources and Environmental Implications, 1st ed.; Er-Raki, S., Ed.; Nova Sciences Publishers: New York, NY, USA, 2013; pp. 105–118. ISBN 978-1-62417-138-3. [Google Scholar]
- Gudulas, K.; Voudouris, K.; Soulios, G.; Dimopoulos, G. Comparison of different methods to estimate actual evapotranspiration and hydrologic balance. Desalination Water Treat. 2013, 51, 2945–2954. [Google Scholar] [CrossRef]
- Demertzi, K.; Pisinaras, V.; Lekakis, E.; Tziritis, E.; Babakos, K.; Aschonitis, V. Assessing Annual Actual Evapotranspiration based on Climate, Topography and Soil in Natural and Agricultural Ecosystems. Climate 2021, 9, 20. [Google Scholar] [CrossRef]
- Spiliotopoulos, M.; Adaktylou, N.; Loukas, A.; Michalopoulou, H.; Mylopoulos, N.; Toulios, L. A spatial downscaling procedure of MODIS derived actual evapotranspiration using Landsat images at central Greece. In Proceedings of the First International Conference on Remote Sensing and Geoinformation of the Environment (RSCy2013), Paphos, Cyprus, 5 August 2013; Proc. SPIE 8795. p. 879508. [Google Scholar] [CrossRef]
- Vasiliades, L.; Spiliotopoulos, M.; Tzabiras, J.; Loukas, A.; Mylopoulos, N. Estimation of crop water requirements using remote sensing for operational water resources management. In Proceedings of the Third International Conference on Remote Sensing and Geoinformation of the Environment (RSCy2015), Paphos, Cyprus, 19 June 2015; Proc. SPIE 9535. p. 95351B. [Google Scholar] [CrossRef]
- Tsouni, A.; Kontoes, C.; Koutsoyiannis, D.; Elias, P. Estimation of Actual Evapotranspiration by Remote Sensing. Sensors 2008, 8, 3586–3600. [Google Scholar] [CrossRef]
- Trepekli, A.; Loupa, G.; Rapsomanikis, S. Agricultural and Forest Meteorology Seasonal evapotranspiration, energy fluxes and turbulence variance characteristics of a Mediterranean coastal grassland. Agric. For. Meteorol. 2016, 226–227, 13–27. [Google Scholar] [CrossRef]
- Allen, R.; Pereira, L.; Raes, D.; Smith, M. Crop evapotranspiration–Guidelines for computing crop water requirements. In Irrigation and Drainage; Paper No. 56; FAO: Rome, Italy, 1998; Volume 300. [Google Scholar]
- Tabari, H.; Grismer, M.E.; Trajkovic, S. Comparative analysis of 31 reference evapotranspiration methods under humid conditions. Irrig. Sci. 2013, 31, 107–117. [Google Scholar] [CrossRef]
- Sun, Z.; Ouyang, Z.; Zhao, J.; Li, S.; Zhang, X.; Ren, W. Recent rebound in observational large-pan evaporation driven by heat wave and droughts by the Lower Yellow River. J. Hydrol. 2018, 565, 237–247. [Google Scholar] [CrossRef]
- Kitsara, G.; Floros, J.; Papaioannou, G.; Kerkides, P. Spatial and Temporal Analysis of Pan Evaporation in Greece. In Proceedings of the 7th International Conference of European Water Resources Association (EWRA): Resources Conservation and Risk Reduction under Climatic Instability, Limassol, Cyprus, 25 June 2009. [Google Scholar]
- Kitsara, G.; Papaioannou, G.; Kerkides, P. Changes of pan evaporation measurements and reference evapotranspiration in Greece. In Proceedings of the 11th International Conference on Meteorology, Climatology and Atmospheric Physics (COMECAP 2012), Athens, Greece, 29 May 2012; Volume 1, pp. 527–533. [Google Scholar] [CrossRef]
- World Meteorological Organization (WMO). WMO Confirms 2019 as Second Hottest Year on Record. 15 January 2020. Available online: https://public.wmo.int/en/media/press-release/wmo-confirms-2019-second-hottest-year-record (accessed on 1 March 2021).
- Dimitriadou, S.; Katsanou, K.; Stratikopoulos, K.; Lambrakis, N. Investigation of the chemical processes controlling the groundwater quality of Ilia Prefecture. Environ. Earth Sci. 2019, 78, 401. [Google Scholar] [CrossRef]
- Dimitriadou, S.; Katsanou, K.; Charalabopoulos, S.; Lambrakis, N. Interpretation of the Factors Defining Groundwater Quality of the Site Subjected to the Wildfire of 2007 in Ilia Prefecture, South-Western Greece. Geosciences 2018, 8, 108. [Google Scholar] [CrossRef] [Green Version]
- Koukouvelas, I.; Mpresiakas, A.; Sokos, E.; Doutsos, T. The tectonic setting and earthquake ground hazards of the 1993 Pyrgos earthquake, Peloponnese, Greece. J. Geol. Soc. Lond. 1996, 152, 39–49. [Google Scholar] [CrossRef]
- Argiriou, A.A. The Climate of Greece; Hellenic National Meteorological Service: Athens, Greece, 2016; pp. 1–6. Available online: http://climatlas.hnms.gr/sdi/?lang=EN (accessed on 28 March 2021).
- Copernicus Land Monitoring Service. CLC 2018. © European Union, Copernicus Land Monitoring Service 2018, European Environment Agency (EEA). Available online: https://land.copernicus.eu/pan-european/corine-land-cover/clc2018 (accessed on 11 January 2021).
- Institute of Geological and Mineralogical Exploration (IGME). Geological Map of Greece in Scale 1:1000000; © IGME: Athens, Greece, 1999. [Google Scholar]
- Zhu, W.; Lu, A.; Jia, S. Estimation of daily maximum and minimum air temperature using MODIS land surface temperature products. Remote Sens. Environ. 2013, 130, 62–73. [Google Scholar] [CrossRef]
- Loukas, A.; Vasiliades, L.; Domenikiotis, C.; Dalezios, N.R. Basin-wide actual evapotranspiration estimation using 3 NOAA/AVHRR satellite data. Phys. Chem. Earth Parts A B C 2005, 30, 69–79. [Google Scholar] [CrossRef]
- Mu, Q.; Zhao, M.; Running, S.W. Improvements to a MODIS global terrestrial evapotranspiration algorithm. Remote Sens. Environ. 2011, 115, 1781–1800. [Google Scholar] [CrossRef]
- Kang, D.; Mathur, R.; Rao, S.T.; Yu, S. Bias adjustment techniques for improving ozone air quality forecasts. J. Geophys. Res. 2008, 113. [Google Scholar] [CrossRef] [Green Version]
- Tellen, V.A. A comparative analysis of reference evapotranspiration from the surface of rainfed grass in Yaounde, calculated by six empirical methods against the Penman Monteith formula. Earth Perspect. 2017, 4, 4. [Google Scholar] [CrossRef] [Green Version]
- Dimitriadou, S.; Nikolakopoulos, K.G. Reference evapotranspiration (ETo) methods implemented as ArcMap models with remote-sensed and ground-based inputs, examined along with MODIS ET, for Peloponnese, Greece. ISPRS Int. J. Geo-Inf. 2021, 10, 390. [Google Scholar] [CrossRef]
- Fox, D.G. Judging air quality model performance. A summary of the AMS workshop on Dispersion Model Performance. Bull. Am. Meteorol. 1981, 62, 599–609. [Google Scholar] [CrossRef] [Green Version]
- Student. The probable error of a mean. Biometrika 1908, 6, 1–25. [Google Scholar] [CrossRef]
- Cohen, J. Statistical Power Analysis for the Behavioral Sciences, 2nd ed.; Lawrence Earlbaum Associates: Hillsdale, NJ, USA, 1988. [Google Scholar]
- Papadavid, G.; Hadjimitsis, D. An integrated approach of Remote Sensing techniques and micro-sensor technology for estimating Evapotranspiration in Cyprus. Agric. Eng. Int. CIGR J. 2010, 12, 1–11. [Google Scholar]
- Turc, L. Nouvelle formule pour le calcul du bilan de l’eau en fonction des valeurs moyennes annuelles des précipitations et de la temperature. Comptes Rendus Hebd. Des Seances De L Acad. Des Sci. 1951, 233, 633–635. [Google Scholar]
- Coutagne, A. Etude generale des variations de debit en fonction des facteurs qui les conditionnent. La Houille Balance 1949, 2, 134–146. [Google Scholar] [CrossRef] [Green Version]
- Drexler, J.Z.; Snyder, R.L.; Spano, D.; Paw, K.T. A review of models and micrometeorological methods used to estimate wetland evapotranspiration. Hydrol. Proc. 2005, 18, 2071–2101. [Google Scholar] [CrossRef]
- Bhattarai, N.; Mallick, K.; Brunsell, N.A.; Sun, G.; Jain, M. Regional evapotranspiration from an image-based implementation of the Surface Temperature Initiated Closure (STIC1.2) model and its validation across an aridity gradient in the conterminous US. Hydrol. Earth Syst. Sci. 2018, 22, 2311–2341. [Google Scholar] [CrossRef] [Green Version]
- Velpuri, N.M.; Senay, G.B.; Singh, R.K.; Bohms, S.; Verdin, J.P. A comprehensive evaluation of two MODIS evapotranspiration products over the conterminous United States: Using point and gridded FLUXNET and water balance ET. Remote Sens. Environ. 2013, 139, 35–49. [Google Scholar] [CrossRef]
- Westerhoff, R.S. Using Uncertainty of Penman and Penman Monteith Methods in Combined Satellite and Ground-Based Evapotranspiration Estimates. Remote Sens. Environ. 2015, 169, 102–112. [Google Scholar] [CrossRef] [Green Version]
- Falalakis, G.; Gemitzi, A. A simple method for water balance estimation based on the empirical method and remotely sensed evapotranspiration estimates. J. Hydroinform. 2020, 22, 440–451. [Google Scholar] [CrossRef]
- Gemitzi, A.; Ajami, H.; Richnow, H.H. Developing empirical monthly groundwater recharge equations based on modeling and remote sensing data–modeling future groundwater recharge to predict potential climate change coefficient model. J. Hydroinform. 2017, 20, 1009–1024. [Google Scholar] [CrossRef]
- McMahon, T.A.; Peel, M.C.; Lowe, L.; Srikanthan, R.; McVicar, T.R. Estimating actual, potential, reference crop and pan evaporation using standard meteorological data: A pragmatic synthesis. Hydrol. Earth Syst. Sci. 2013, 17, 1331–1363. [Google Scholar] [CrossRef] [Green Version]


| Statistical Measures | RMSD | MB | NMB |
|---|---|---|---|
| formula |
| Annual Values (mm) | |||||
|---|---|---|---|---|---|
| Method | Descriptive Statistics | 2016 | 2017 | 2018 | 2019 |
| Modified Turc (ETa) | min | 211.42 | 242.62 | 409.22 | 330.63 |
| mean | 562.26 | 486.40 | 590.22 | 555.19 | |
| max | 882.07 | 677.67 | 767.25 | 764.41 | |
| SD | 148.53 | 79.32 | 67.63 | 60.62 | |
| Turc (ETa) | min | 220.36 | 248.25 | 477.68 | 503.79 |
| mean | 637.98 | 604.73 | 708.74 | 771.72 | |
| max | 1013.73 | 979.10 | 1092.45 | 1075.49 | |
| SD | 189.01 | 145.88 | 114.22 | 121.01 | |
| Coutagne (ETa) | min | 214.00 | 243.80 | 424.56 | 449.96 |
| mean | 594.25 | 556.95 | 651.20 | 706.12 | |
| max | 894.75 | 884.88 | 949.63 | 944.69 | |
| SD | 169.69 | 132.06 | 12.29 | 114.48 | |
| MODIS (ET) | min | 132.90 | 93.30 | 123.50 | 76.60 |
| mean | 528.65 | 513.25 | 586.58 | 557.17 | |
| max | 1223.30 | 1235.50 | 1193.60 | 1152.50 | |
| SD | 132.91 | 125.61 | 138.23 | 130.46 | |
| Annual Epan (mm)—Patras University | Annual Epan (mm)—Ladonas | |
|---|---|---|
| 2016 | 1532.16 | 1121 |
| 2017 | 1655.57 | 1204 |
| 2018 | 1459.69 | 943.5 |
| 2019 | 1595.59 | 1184 |
Publisher’s Note: MDPI stays neutral with regard to jurisdictional claims in published maps and institutional affiliations. |
© 2021 by the authors. Licensee MDPI, Basel, Switzerland. This article is an open access article distributed under the terms and conditions of the Creative Commons Attribution (CC BY) license (https://creativecommons.org/licenses/by/4.0/).
Share and Cite
Dimitriadou, S.; Nikolakopoulos, K.G. Annual Actual Evapotranspiration Estimation via GIS Models of Three Empirical Methods Employing Remotely Sensed Data for the Peloponnese, Greece, and Comparison with Annual MODIS ET and Pan Evaporation Measurements. ISPRS Int. J. Geo-Inf. 2021, 10, 522. https://doi.org/10.3390/ijgi10080522
Dimitriadou S, Nikolakopoulos KG. Annual Actual Evapotranspiration Estimation via GIS Models of Three Empirical Methods Employing Remotely Sensed Data for the Peloponnese, Greece, and Comparison with Annual MODIS ET and Pan Evaporation Measurements. ISPRS International Journal of Geo-Information. 2021; 10(8):522. https://doi.org/10.3390/ijgi10080522
Chicago/Turabian StyleDimitriadou, Stavroula, and Konstantinos G. Nikolakopoulos. 2021. "Annual Actual Evapotranspiration Estimation via GIS Models of Three Empirical Methods Employing Remotely Sensed Data for the Peloponnese, Greece, and Comparison with Annual MODIS ET and Pan Evaporation Measurements" ISPRS International Journal of Geo-Information 10, no. 8: 522. https://doi.org/10.3390/ijgi10080522