3. Results
The questionnaire contained a total of 30 questions, which were thematically divided into four groups. These groups corresponded to the subchapters of the results. Specifically, the questionnaire focused on teachers’ characteristics, questions about the atlases used, questions about the tasks with atlases, and finally, questions about teaching aids. Selected data are available in the form of an interactive chart (
Supplemental Material available at
http://eyetracking.upol.cz/school_atlas_survey/, accessed on 27 June 2021).
3.1. Characteristics of Respondents—Teachers
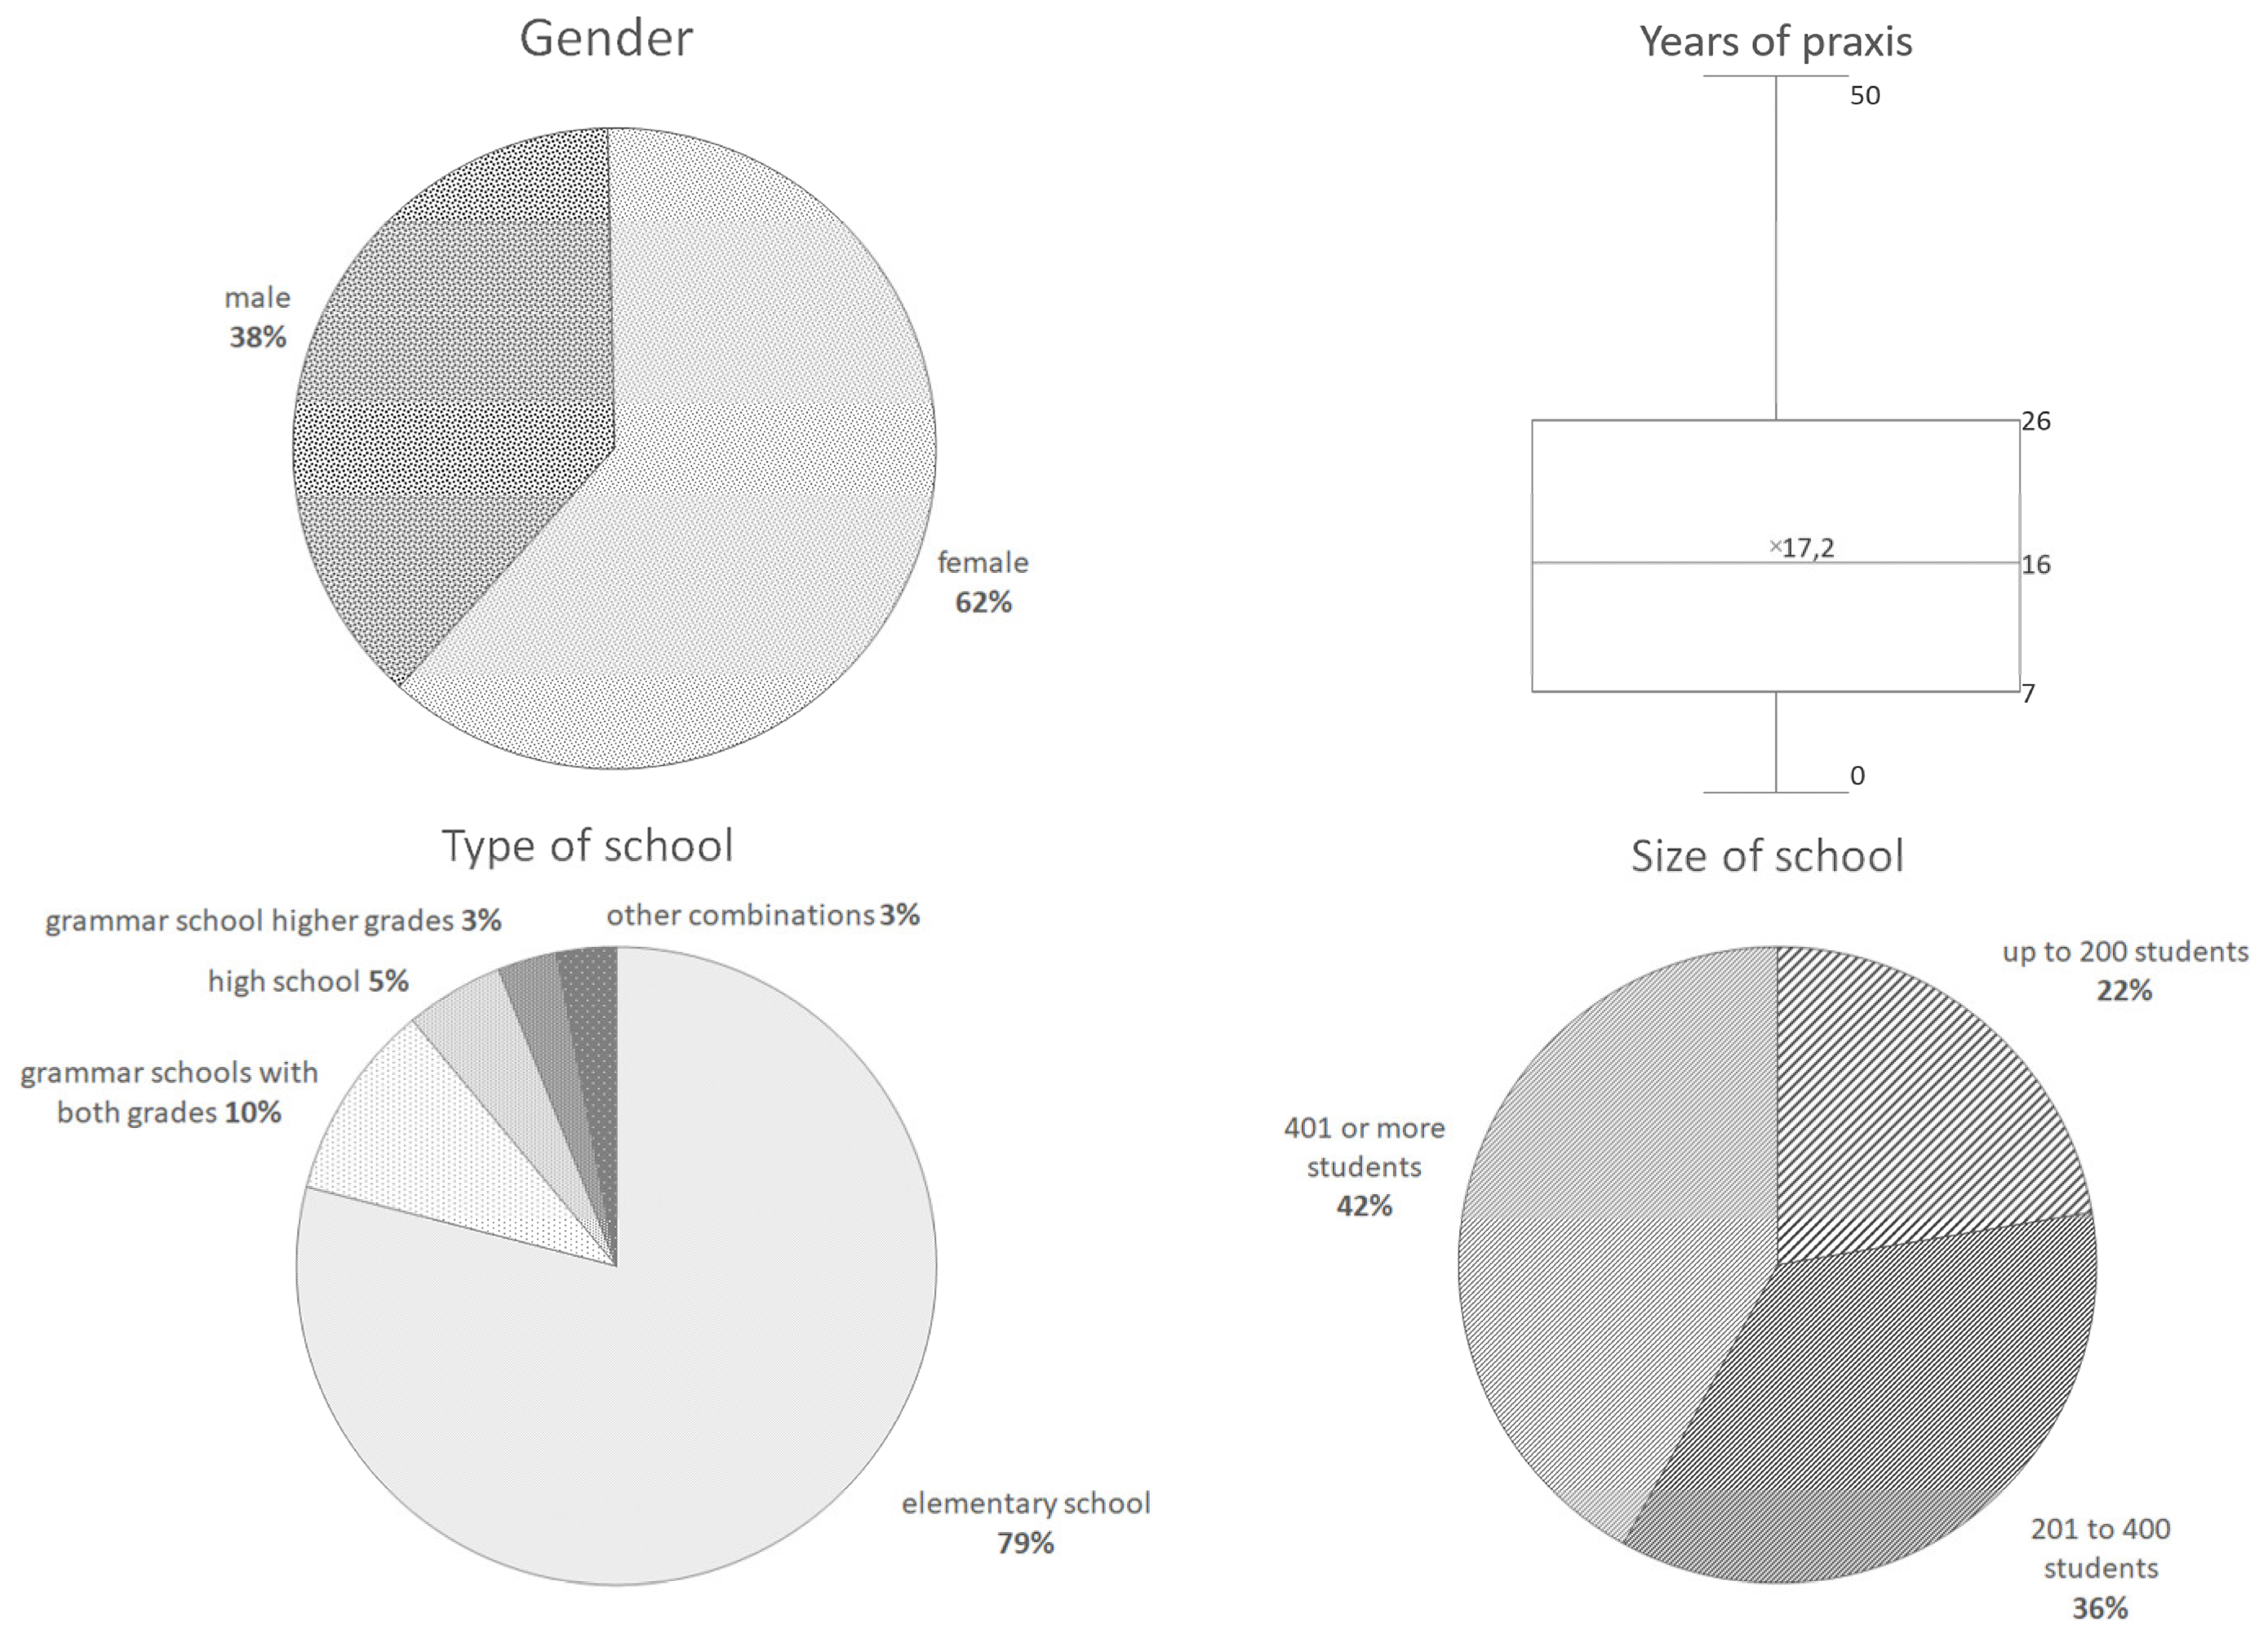
The survey was aimed at primary and secondary school geography teachers in the Czech Republic. The first questions asked about the gender (
Q28) and experience of the respondents (
Q27). The average number of years of praxis was 17.2 years (median 16 years). According to the annual report of the Czech School Inspectorate [
9], teachers’ average length of praxis in 2019 was 19.7 years. The next questions asked about the type (
Q25) and size (
Q26) of the school where the teachers worked (
Figure 1).
The average time that respondents spent completing the questionnaire was 15 min, 20 s. It is gratifying to note that over a third (35.3%) of the respondents wanted to participate in the future (Q29). Of respondents, 42.3% expressed interest in the results of the survey (Q30).
3.2. Atlases and Their Importance
The primary aim of the survey was to determine which school atlases are used in the Czech Republic and what their importance in geography teaching is.
The first question of the questionnaire evaluated the importance of the school world atlas in geography teaching (Q1). Respondents evaluated the importance of the atlas on a scale of 1 to 10 (0—none, 10—most significant). According to the teachers, the average importance of the school atlas was 8.2. (median 9; mode 10; SD 1.77). It is clear from these results that the school atlas plays an especially important role in teaching geography.
Another question related to Q1 was listed at the very end of the questionnaire survey (before the teachers’ characteristics). This question was Q24, “What would be the importance of the ideal atlas in your geography teaching?”, and its purpose was to ascertain whether the importance of the atlas is affected by the quality of the atlases used. The respondents used the same scale of answers, and the results were also similar. An ideal school atlas would have a significance with an average of 8.6 (median 9, mode 10, SD 1.47).
A comparison of the responses to
Q1 and
Q24 depicted in
Figure 2 shows that the hypothetical atlas “according to the teachers’ ideas” would have only slightly higher importance than the currently used atlas.
The importance of the atlas in teaching is also related to how often students work with it in the lessons (Q5). According to the teachers’ answers, most students (57%) work with an atlas every lesson. Approximately one-third (29%) work with a school atlas every second lesson. Less than a tenth (8%) work with the atlas at least every third lesson. Only 3% of students use the school atlas less frequently.
The remaining 3% of teachers responded differently. Teachers stated that it especially depended on the topic discussed (for regional topics almost always, for the Earth sphere not so often) (terms in italics represent direct translations of the teachers’ answers), some of them mentioned the differences between grades (6th–8th grade almost every hour, 9th grade occasionally) or alternative sources of map information (textbooks containing maps, programs on an interactive whiteboard).
A summary of the answers to
Q5 is shown in
Figure 3. In conclusion, a school atlas is an indispensable tool in geography teaching.
Another question focused on specific atlases that students use in geography classes (Q2). Teachers could choose one of the atlases currently offered on the Czech market. The list contained atlases from three main publishing houses (Kartografie PRAHA, TERRA-KLUB, SHOCart) and option “other”. Any combination of these options could be selected.
The School World Atlas from Kartografie PRAHA builds on the publishing house’s long tradition (since 1954). The atlas contains around three-quarters of thematic maps; however, the topics of these maps are repeated for each continent, and, therefore, the number of topics is limited. The maps have the largest graphic load, especially the physical maps. By contrast, Atlas from TERRA was first published in 2000, and it contains many more thematic maps on different topics. The atlas also contains many diagrams, tables, and text fields. The graphical load of this atlas is the lowest. A metric for measuring the graphic map load was introduced by Barvir and Vozenilek [
21]. The last atlas from SHOCart lies somewhere between these two. It is slightly similar to the one from Kartografie PRAHA and was published for the first time in 2004. Map symbols in school world atlases were analysed by Voženílek et al. [
22].
The majority of respondents stated that they used the school world atlas of Kartografie PRAHA [
23] (67.5%) and used it in combination with other atlases. Overall, this atlas is used by 93.9% of the teachers who completed the survey. The use of this atlas, therefore, completely prevails in Czech schools. Regarding the other two atlases, 2.5% of respondents use the atlas from SHOCart [
24] (10.1% in combination with another atlas), and the atlas from TERRA-KLUB [
25] is used independently by only 0.6% of respondents (19.9% in combination with another atlas).
The use of another school atlas was mentioned by 2.5% of respondents (Q3). For example, the paperback atlases from Kartografie PRAHA, geographical picture atlas from the publishing house Parta, or the British Collins Student Atlas were mentioned.
The results showed that the most used school atlas is the atlas from Kartografie PRAHA. The other two school atlases from SHOCart and TERRA-KLUB are mostly used in combination with Kartografie PRAHA. The results are summarised in the graph in
Figure 4.
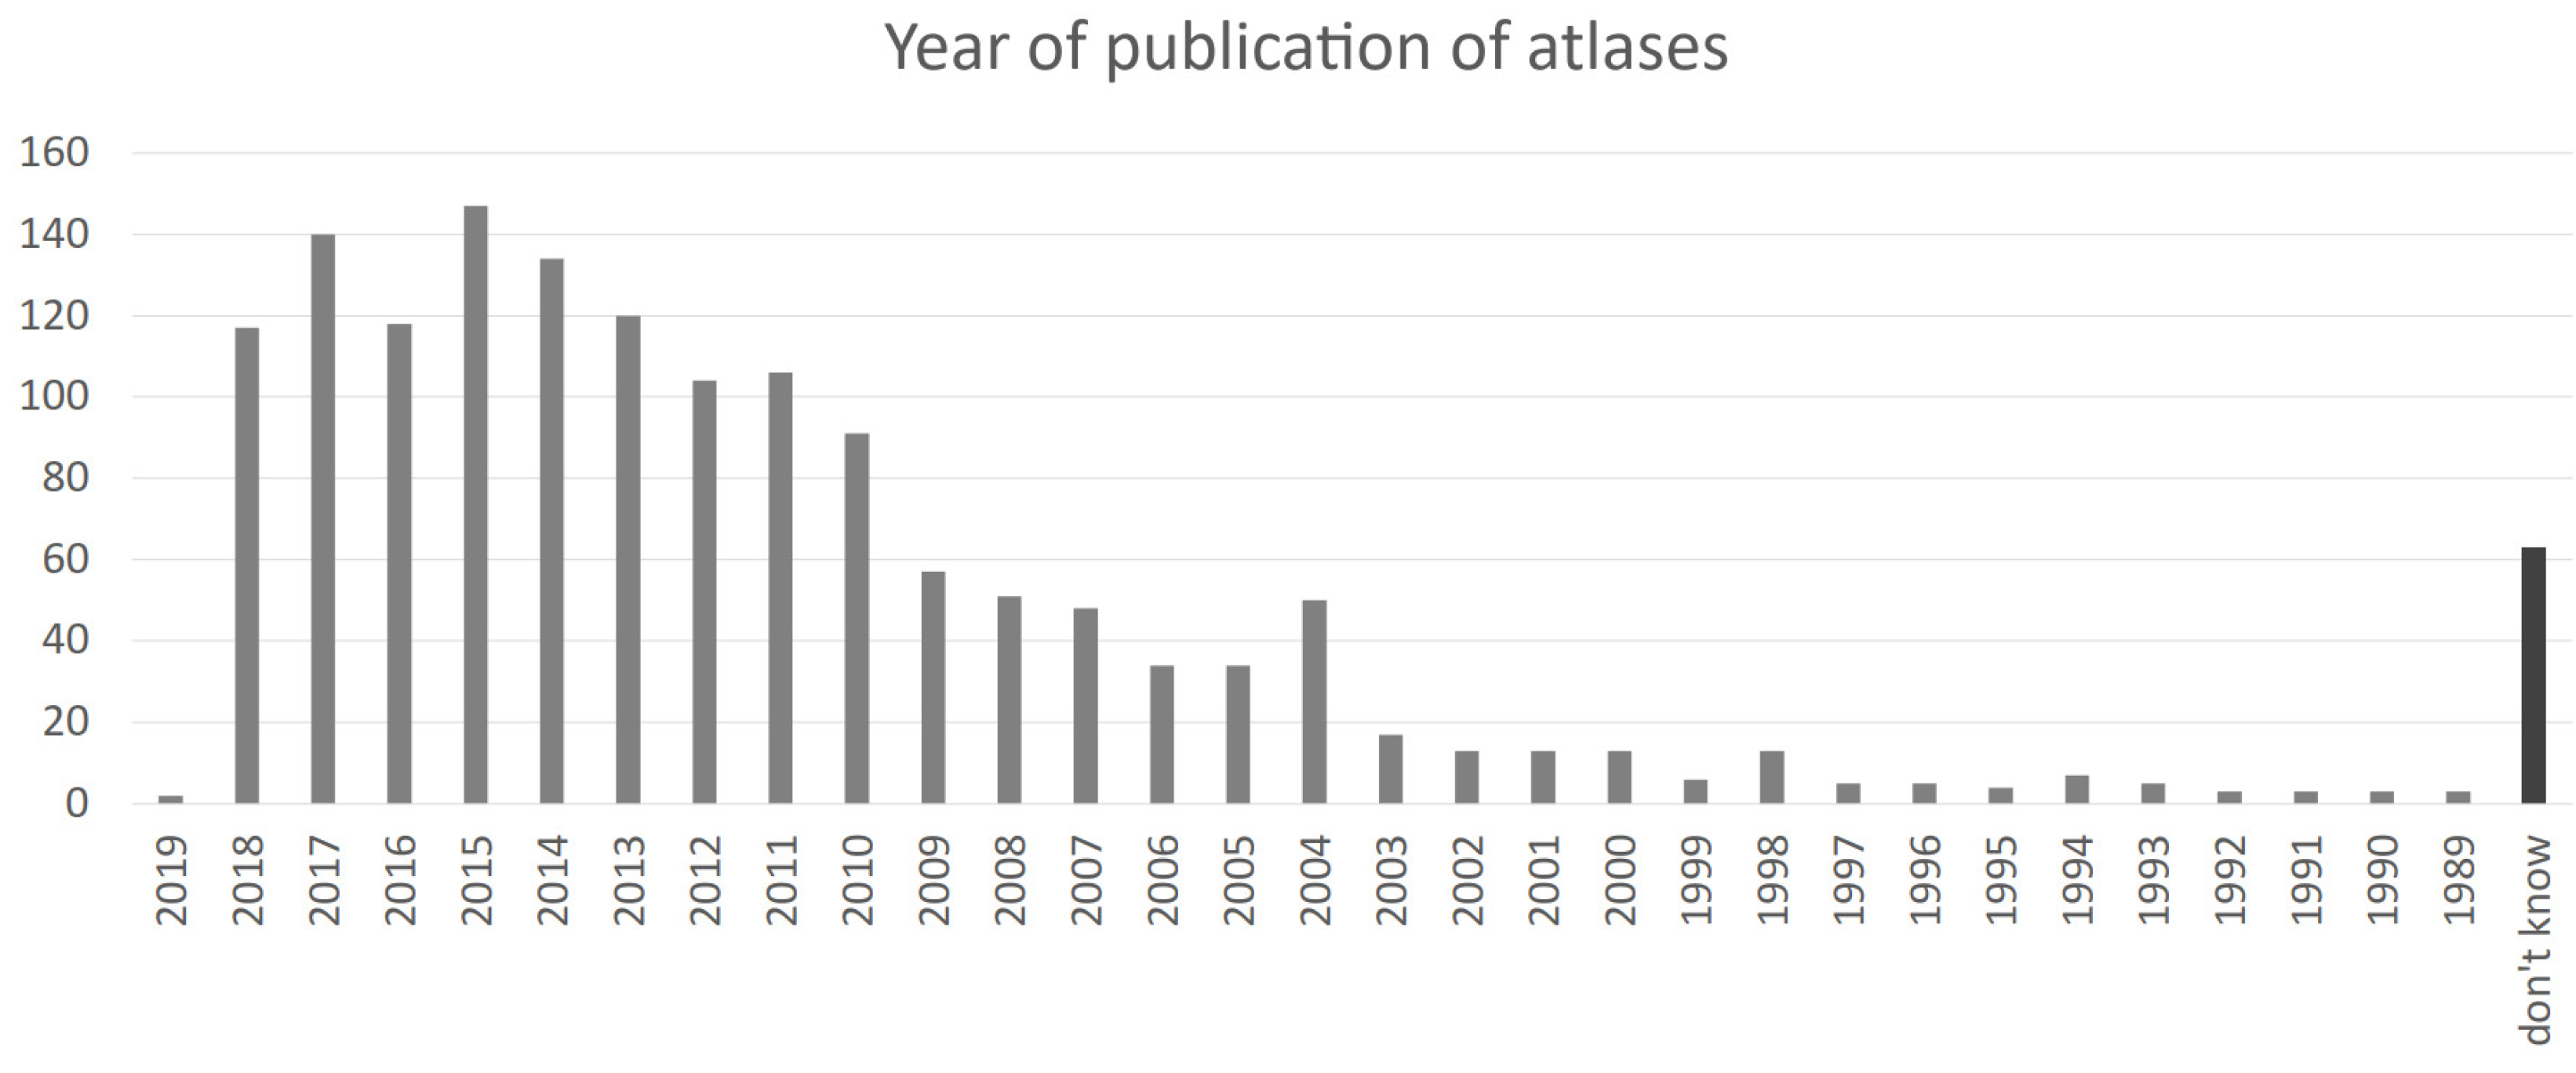
The age of used school atlases was addressed in Q4. Surprisingly, 10% of teachers responded that they did not know the answer. This question was conceived as open-ended, and teachers, therefore, often provided information in the form of text. Analysis of the answers to this question was therefore difficult, and some uncertainty in processing may have been present in many respects. Each teacher’s responses were checked, and the textual information was converted into numbers. Ideally, teachers indicated the specific year of publication of the atlas. A large number of responses contained several dates (i.e., most atlases 1989, several 2004). In this case, the data for both responses were included in the analysis (1989 and 2004). Many teachers also mentioned the range of years (i.e., 2012–2015). In this case, all the years in the specified range were included in the analysis (2012, 2013, 2014, and 2015).
The year 2015 most often appeared in the answers (147×). Since the survey was conducted in the first half of 2019, the least often response was 2019 (2×). Over 50% of the used atlases were issued between 2013 and 2019. Atlases published before 2000 appeared in only 5% of responses. However, in some extreme cases, 30 years old atlases are also used. The distribution of the age of atlases is displayed in
Figure 5. It is important to mention that in 1999, 2008, 2009, 2010, 2014, 2015, and 2016, no school world atlas was published in the Czech Republic.
The teachers provided several notes that illustrated the importance of school atlases in Czech schools and provided insight into practical work with them. Teachers stated that they usually did not have a sufficient number of atlases of a particular edition. They, therefore, have to combine atlases from different years, and they mentioned a lack of funds for the purchase of new school atlases as a reason. Usually, just a few atlases are purchased. Many teachers complained that older atlases were better and richer in content.
Questions
Q14 and
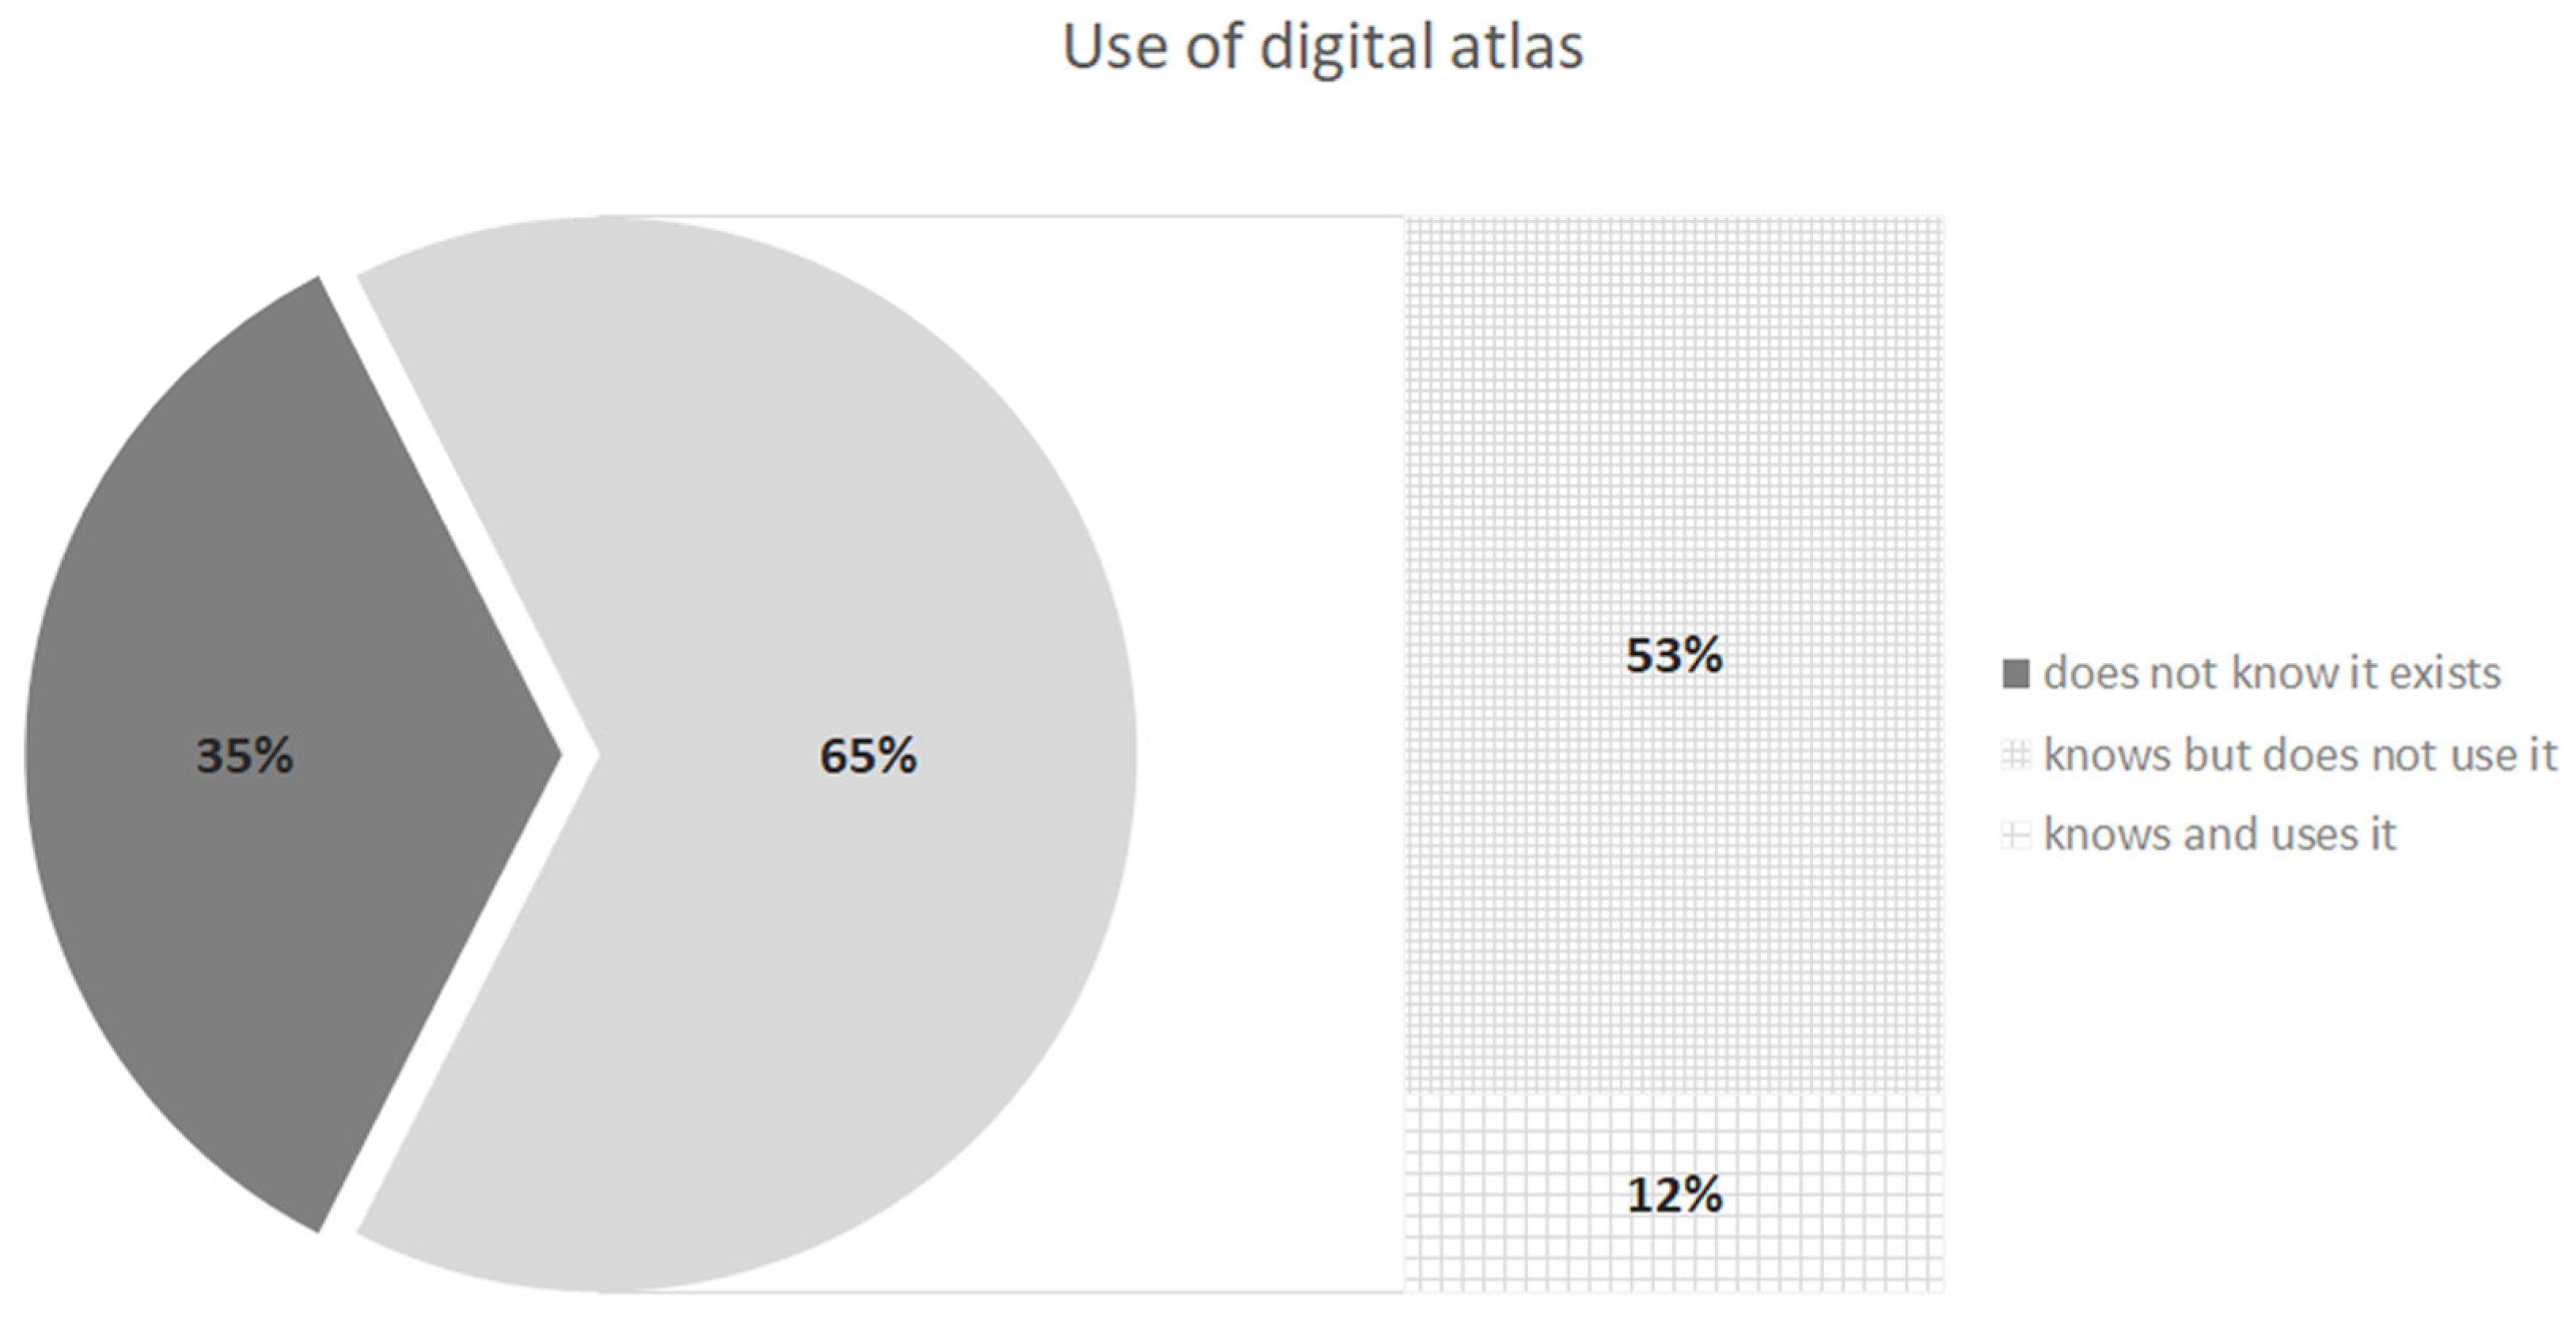
Q15 focused on the issue of digital versions because all three existing atlases were also available in this form. In the atlas from Kartografie PRAHA, the maps are available in the form of an electronic book in Flexibooks format. In addition to zoomable maps, this version also contains some multimedia elements such as images, graphs, and video links. The other two atlases offer a very similar solution. In all cases, the digital version is more a set of zoomable variants of analogue maps than a fully interactive publication. In
Q14, teachers were asked whether they knew that an electronic version existed. Almost two-thirds of teachers (65%) answered yes. However, contrary responses on whether teachers used this electronic version were given to
Q15 (
Figure 6). Only 12% of teachers who knew about the digital version actually use it. Specifically, this was 72 teachers.
Half of the geography teachers (50.9%) responded that they assigned their students homework with an atlas (Q21).
The final question related to this group concerned what teachers thought was missing from the atlases (Q10). This question was evaluated using linguistic methods. Mainly bigrams of lemmas were used. The most common phrase was “thematic map”, which appeared in the responses 47 times. The phrase “school atlas” was mentioned only 21 times.
A detailed analysis of the answers revealed that teachers are very dissatisfied with the thematic maps. It is probably the biggest weakness of the Czech school atlases. In particular, they criticised the publishers for the insufficient number of these maps (lack of thematic maps, mainly on human and economic geography). Many criticisms highlighted insufficient coverage of the topics (I miss more diverse thematic maps. Industry and agriculture are not sufficient). Teachers would also welcome the inclusion of larger-scale thematic maps in the atlas. In the latest edition of the most used school atlas from Kartografie PRAHA, the median scale of thematic maps is 1:80,000,000. Out of the total number of 103 thematic maps, only 30 maps have a larger scale. Some of the teachers have solved the lack of thematic maps in the atlas by creating their own maps.
Another problem that teachers highlighted was the change in the structure of the thematic maps in the different editions (There are changes to maps or the inclusion of other thematic maps, which leads to problems when students have different editions of the atlas–from the same publisher!!!). Another often recurring phrase was the “time zone map”, which appeared 20 times in the respondents’ answers. Here, teachers praised the location of this map on the title page of the atlas but complained that some editions of the atlases did not contain this map at all (Some editions lack a time zone map, or they are tiny). An often-mentioned phrase in the responses (31×) was “new edition” and “atlas edition”. Teachers complained about the frequent changes in the content of the atlas, paging, and the structure of maps. This makes it difficult for teachers to prepare their materials or work with maps that students may not find in the new edition.
Finally, teachers suggested the types of topics and maps that were missing in Czech school atlases:
More detailed maps of some parts of the continents;
Map of Russia, map of USA, map of Northern Asia;
Map of economic activities in Oceania (the atlas contains such a map for all other regions);
Races and nations of the world;
A map linking precipitation and sea currents;
Map of conflicts and their descriptions;
Freedom index;
More detailed maps of causes of deaths;
Issues of deforestation-development of tropical rainforest areas;
Distribution of important animals;
Environmental issues (main directions of plastic waste transport, marine pollution).
3.3. Tasks with Atlases
One of the most important questions of the questionnaire was Q6, which examined the types of tasks students solve with the atlas. Teachers answered this question in the form of text, which ranged from sentences to paragraphs (the average length of response was 36 words). The teachers answered this question thoroughly, and some of the answers provided great detail. The answers were therefore evaluated using linguistic methods. Specifically, this method was a bigram of lemmas and an analysis of the used verbs. The selected verbs were included in an analysis of the right and left contexts.
The most frequently mentioned phrase was “thematic map”, which appeared in the teachers’ responses in 172 cases. Many teachers mentioned that they considered thematic maps to be the most important part of the atlas (Working with thematic maps, which I consider to be the most important; working with thematic maps covers 80% of the work. Students derive the context). A detailed analysis of the responses revealed that teachers use thematic maps mostly for simpler tasks such as searching for information (searching for minerals, crops, farmed livestock, etc.; finding countries which are part of the EU). However, a large number of them perform more complex (sophisticated) work with thematic maps. Teachers mentioned, for example, activities such as comparison, evaluation, research, reasoning, explanation, etc. (e.g., search for data on total precipitation in a given area, compare with the values of the absolute minimum and maximum of a given continent, explain why local precipitation is lower/higher). In many cases, students compare thematic and physical maps (What effect does the distribution of plates have on the distribution of population, etc.). The response of one teacher who works at a primary school and uses thematic climate maps was interesting. In a task, students have to choose different travel needs (malaria pills, umbrella, sunscreen, etc.) and assign these needs to geographical locations (e.g., they have to find a place, find out what the climate is like there and choose what to pack).
Physical maps are an important part of atlases in general. References to these types of maps also appeared in the answers, but the teachers referred to them with different terms. In total, these phrases appeared in the responses 147 times. Teachers use physical maps to teach basic orientation on the map. Students solve tasks such as finding mountains, lowlands, islands, peninsulas, deserts, rivers, lakes, etc.
The phrase “blank map” (outline map) also appeared very often in the answers (117×). It is interesting since none of the atlases contain blank maps. A detailed analysis of the answers revealed that the students usually look for places in the atlas and then mark them onto blank maps. Some teachers mentioned that blank maps are also part of written exams. Students draw important parallels and meridians onto the blank map using an atlas, followed by the surface, water bodies, cities, etc.
Another important group of phrases was the group focused on determining geographical coordinates. Teachers again used different terms for this activity. In total, these terms appeared in the answers 185 times. In this case, students search for certain places using geographical coordinates, or, conversely, determine the coordinates of specific places (They must find a place on the map according to geographical coordinates, or, conversely, determine the geographical coordinates of a particular place).
In 51 cases, teachers mentioned the phrase “political map”. Students use these maps mainly for tasks such as finding a specific country, naming neighbouring countries, etc. (assigning cities to countries, determining the location, etc.). Furthermore, pairs of words representing specific types of maps were mentioned in the responses. These were, for example, time zone maps (47×), mineral resources maps (39×), population density maps (38×), maps of the world (33×), and others.
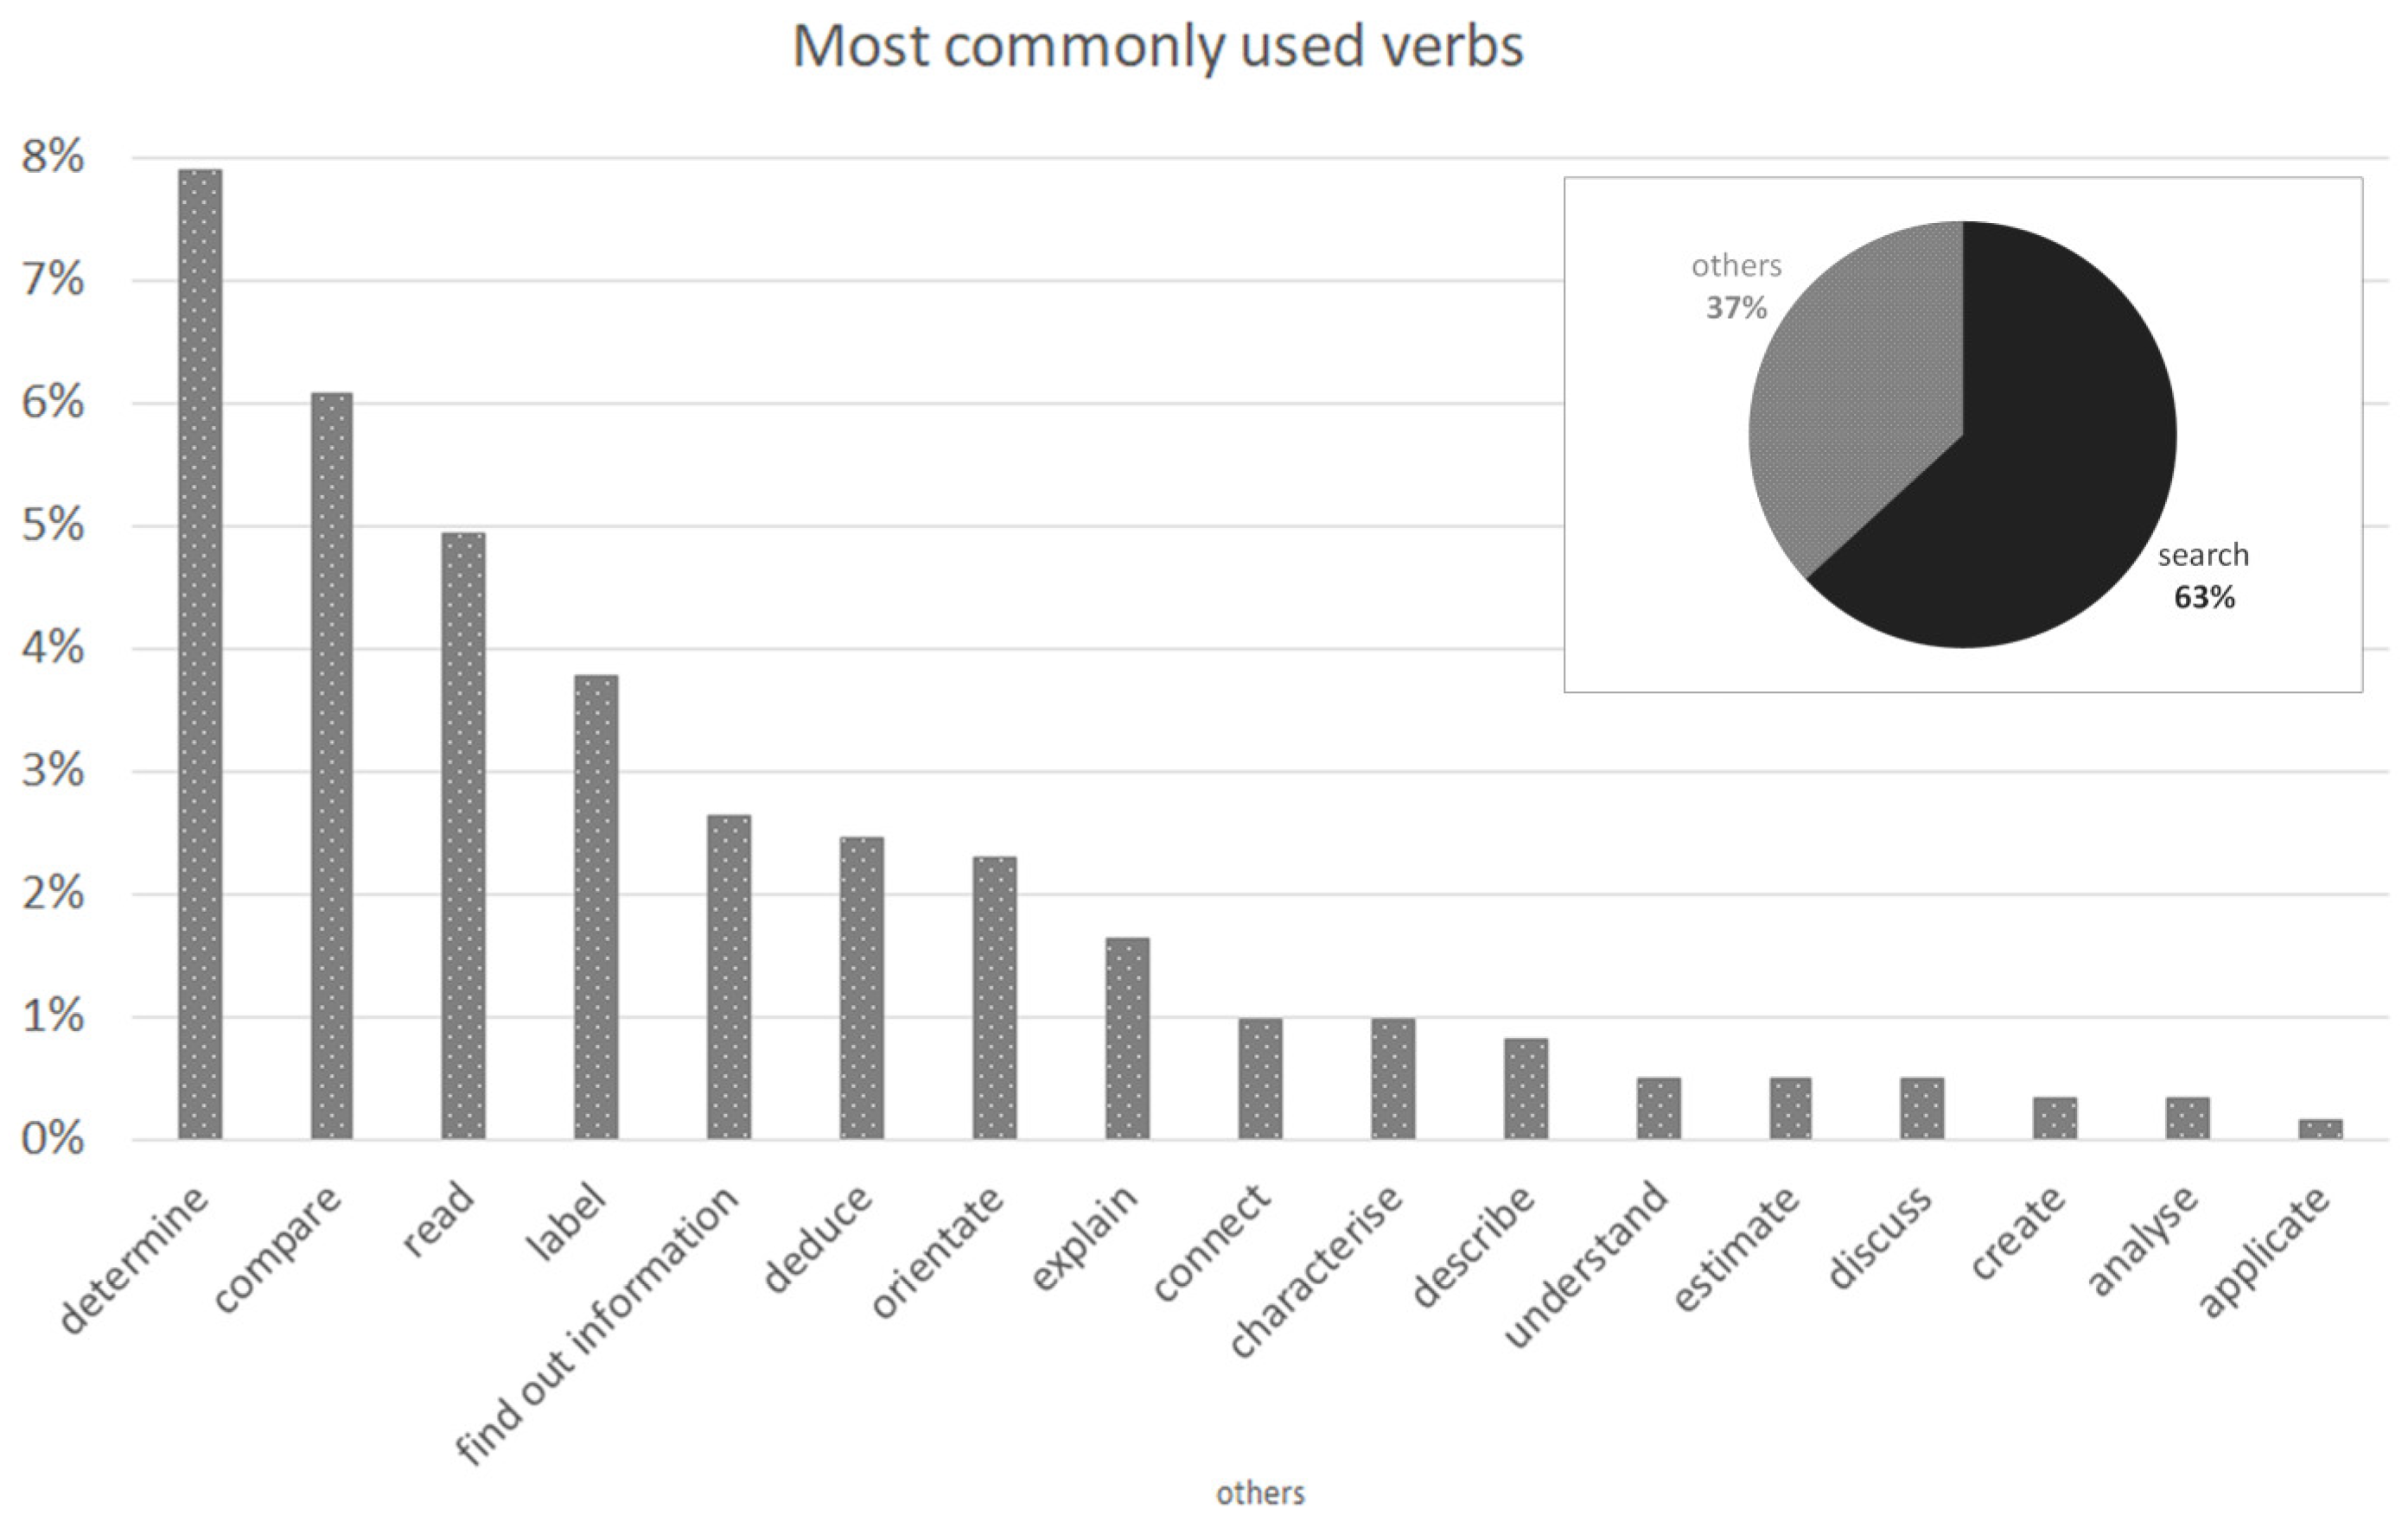
In the next step, the verbs that teachers used in response to this question were analysed. The most commonly used verb was “search”, which covered almost two-thirds of the verbs used in the answers. The remaining third consisted of activities such as determination, comparison, reading, etc. (
Figure 7).
The used verbs are related to Bloom’s taxonomy of educational objectives [
26]. The verbs that teachers used in their answers were used as action verbs and assigned to Bloom’s taxonomy categories. The assignment was completed according to the Pragmatic Master List of Action Verbs provided by Newton et al. [
27]. It is evident from the graph in
Figure 8 that most tasks (67%) were focused on finding elements in maps (knowledge). Other used categories were analysis (15%), comprehension (9%), and application (8%). The verbs associated with synthesis (create a map) were used only minimally (1%). The evaluation category was not used at all.
The other two questions were designed to determine which tasks with an atlas are the most popular with students, and conversely, which of them are the most problematic. The answers to these questions were also evaluated using linguistic analysis.
Regarding the most popular tasks (Q8), the most commonly used term was “search” with 252 occurrences. A detailed analysis of the answers revealed that students prefer a simple search for terms. In the answers, teachers most often-mentioned searching for countries, cities, minerals, unknown locations, and extremes (the rainiest, largest, highest, longest) or speed searches. Many teachers mentioned search games. Crossword puzzles were mentioned relatively often (21×) and competitions in general (34×). However, the vast majority of these competitions focused on the already mentioned search for terms. The exceptions were competitions in connecting thematic and political maps. The keyword analysis using corpus linguistics aided us in identifying one teacher who mentioned the term geographic detective. The other interesting answers included, for example, a geographical memory game, the creation of a trip itinerary, a game of wandering between time zones, and others. Interestingly, 20 teachers stated that they did not know what tasks their students liked. Ten teachers answer that they cannot judge it.
The answers to
Q9, concerning the problematic tasks, were dominated by responses concerning the determination of “geographical location” (84) or “geographical coordinates” (39). Work with “thematic maps” was also mentioned 39 times in the answers. Here, teachers most often mentioned that students had problems working with choropleth maps and proportional symbols, which was also found in other Czech studies [
28,
29]. Students do not like tasks where they are required to find the relationship between different phenomena (25×) and analytical tasks in general (25×). Teachers also mentioned working with the map scale (36×) and working with numbers and mathematical problems in general. A related task is calculating local times and working with time zones, which was mentioned in 12 cases.
Question Q16 summarised the tasks that students solve with the digital version of the atlases. A total of 72 of the teachers use the digital version in their teaching. The frequency of use divides this group into two parts: those who use it only a little and those who use it every hour. Teachers most often use a digital version as a replacement for the wall map. They highlighted interactive content as the biggest benefit to students. From a technical point of view, they positively evaluated the option to zoom on a map. The greatest criticism was directed mainly towards technical limitations. They often criticised the poor resolution of maps, scales, impractical controls, long loading times, lack of interactive elements, confusing arrangement of maps, etc. According to the teachers, the digital version’s use is problematic because it is not available to students.
3.4. Teaching Aids in Geography
This section describes the responses related to teaching aids and map sources used in geography lectures.
In addition to the school world atlases, many other atlases that focus on various topics are available on the market. The majority of geography teachers (88.7%) use them according to Q11 and Q12.
Most of them (36.3%) use the paperback Atlas of the Czech Republic from Kartografie PRAHA. The other frequently used atlases also come from the production of this publishing house. Almost 13.5% of teachers stated that they used a combination of various paperback atlases (Czech Republic; Europe; America; Asia; Africa; Australia, Oceania; and Antarctica). The remainder of the answers covered combinations of atlases from Kartografie PRAHA and TERRA-KLUB (5.6%) and SHOCart (4.5%).
According to the responses to Q13, almost all teachers (99%) use analogue (printed) teaching aids in addition to atlases. Most of the teachers (75%) use a combination of map sheets, wall maps, and globes. The combination of map sheets and wall maps was represented in the answers in 13%. Wall maps in combination with globes are used by 8% of teachers. The teachers also mentioned magazines (National Geographic), encyclopaedias, pictures, and diagrams.
In addition to printed teaching aids, digital devices are often used in geography lectures. In the answers to Q17 and Q18, 85% of teachers responded in the affirmative. Almost a third (26%) of geography teachers use a combination of a PC and interactive whiteboard. The second and third most often used devices are interactive whiteboards (13%) and PCs (10%) independently. The responses also contained the use of smartphones (156×) or GPS receivers (27×), but those were mainly mentioned in combination with other devices.
The next question asked teachers whether they use any sources of digital maps (Q19). An affirmative answer to this question was followed by Q20, where teachers specified them. The results showed that 81.8% of teachers use these sources. The teachers’ specifications in Q20 were evaluated using linguistic methods (bigrams). The most common source of maps is the Internet. The most frequently mentioned phrases were “Google Maps” (192×) and “Google Earth” (73×). The fourth most common phrase was “web page” (26×), and “Internet maps” appeared in sixth place (20×). The use of linguistic methods allows searching for all the domains in the responses. The websites mapy.cz and maps.google.com appeared most often here. The teachers use other map sources to find blank maps. This phrase occupied second place in the responses and appeared 83 times. The need for blank maps in teaching geography was also shown in the analysis of domains where the websites focused on the presence of blank maps (d-maps.com or slepemapy.cz).
The issue of map sources on the Internet was followed by Q22, which focused on the students’ use of GIS. Over two-thirds (69.2%) of teachers responded that their students did not use GIS at all. Of teachers, 25.6% use only basic GIS operations (finding routes). However, the question is whether the teachers talked about GIS or route search using Google Maps. Of teachers, 4% reported that their students worked with interactive geographic applications. Only 1.2% of teachers use GIS for map-making.
3.5. Relationships between Questions
After evaluating the answers for individual questions, the relationships between the questions were analysed using tests of independence or homogeneity at the significance level α = 0.05.
Using the chi-square test of independence, it was verified whether the distribution of answers to one question was independent of the answers to the other question when the answers to both questions were nominal and when the distribution of answers to both questions was affected by randomness. Examples are
Q2 (used atlas) and
Q14 (digital version awareness). The distribution of answers to these questions, including the values of standardised residuals, is shown in
Table 3.
The independence test showed that awareness of the digital version depends on the type of used atlas (p < 0.001). Based on the analysis of residuals, it can be said that users of the combination of atlases from Kartografie PRAHA and TERRA-KLUB are aware of the digital version significantly more than teachers using the atlas from Kartografie PRAHA only.
Another type of analysed relationship is the presence of homogeneity of answers to two nominal questions. In this case, the chi-square test solves whether the relative distribution of answers to one question differs depending on the answers to the other question. In this case, the factual nature of the latter question implies that the answers are fixed for each respondent, and they are therefore non-random. These were mainly
Q25–
Q28, which focused on the type of school and demographic characteristics of the respondent. This situation can be demonstrated in the example of
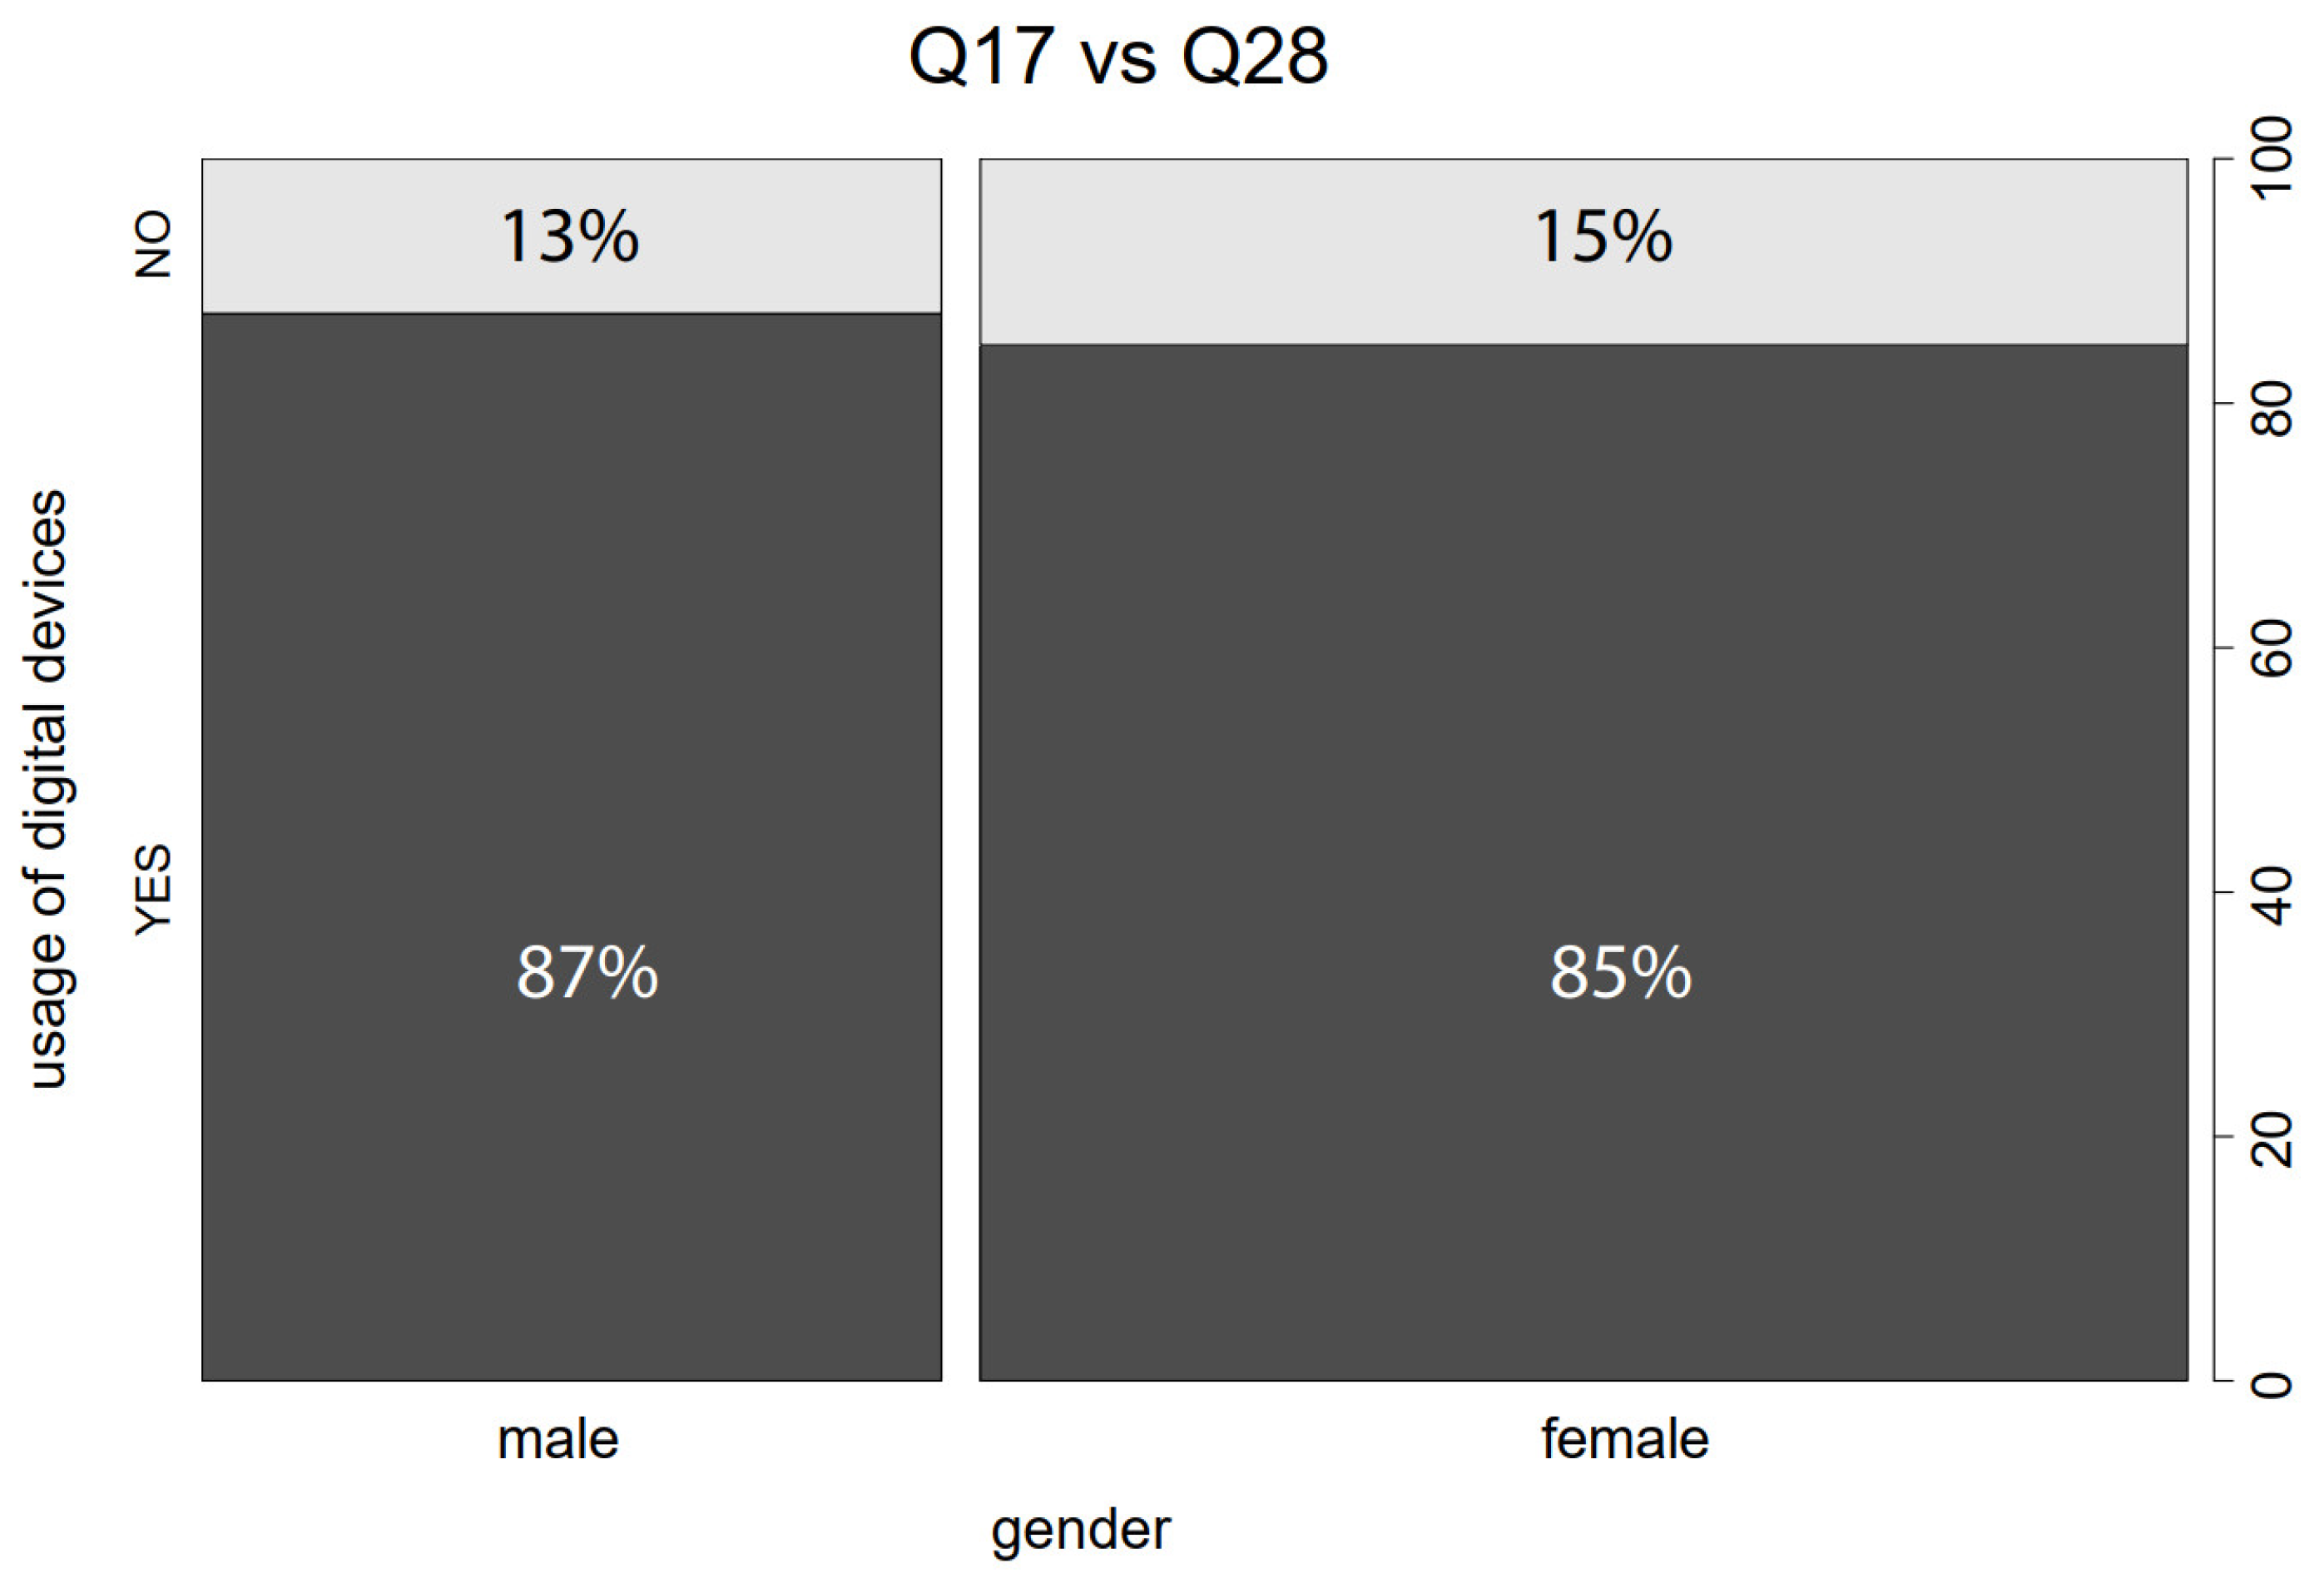
Q17 (usage of digital devices) and
Q28 (gender). The relative distribution of the responses to these questions is shown in
Figure 9. It is clear from the figure that working with digital devices is equally popular among males and females. This agreement was also verified with a homogeneity test (
p = 0.380).
A modified chi-square test [
12] was used to verify the homogeneity of answers when the combination of the nominal and ordinal questions was investigated. Ordinal answers were available for questions
Q5,
Q22,
Q26, and
Q27. An example is the analysis of the relationship between
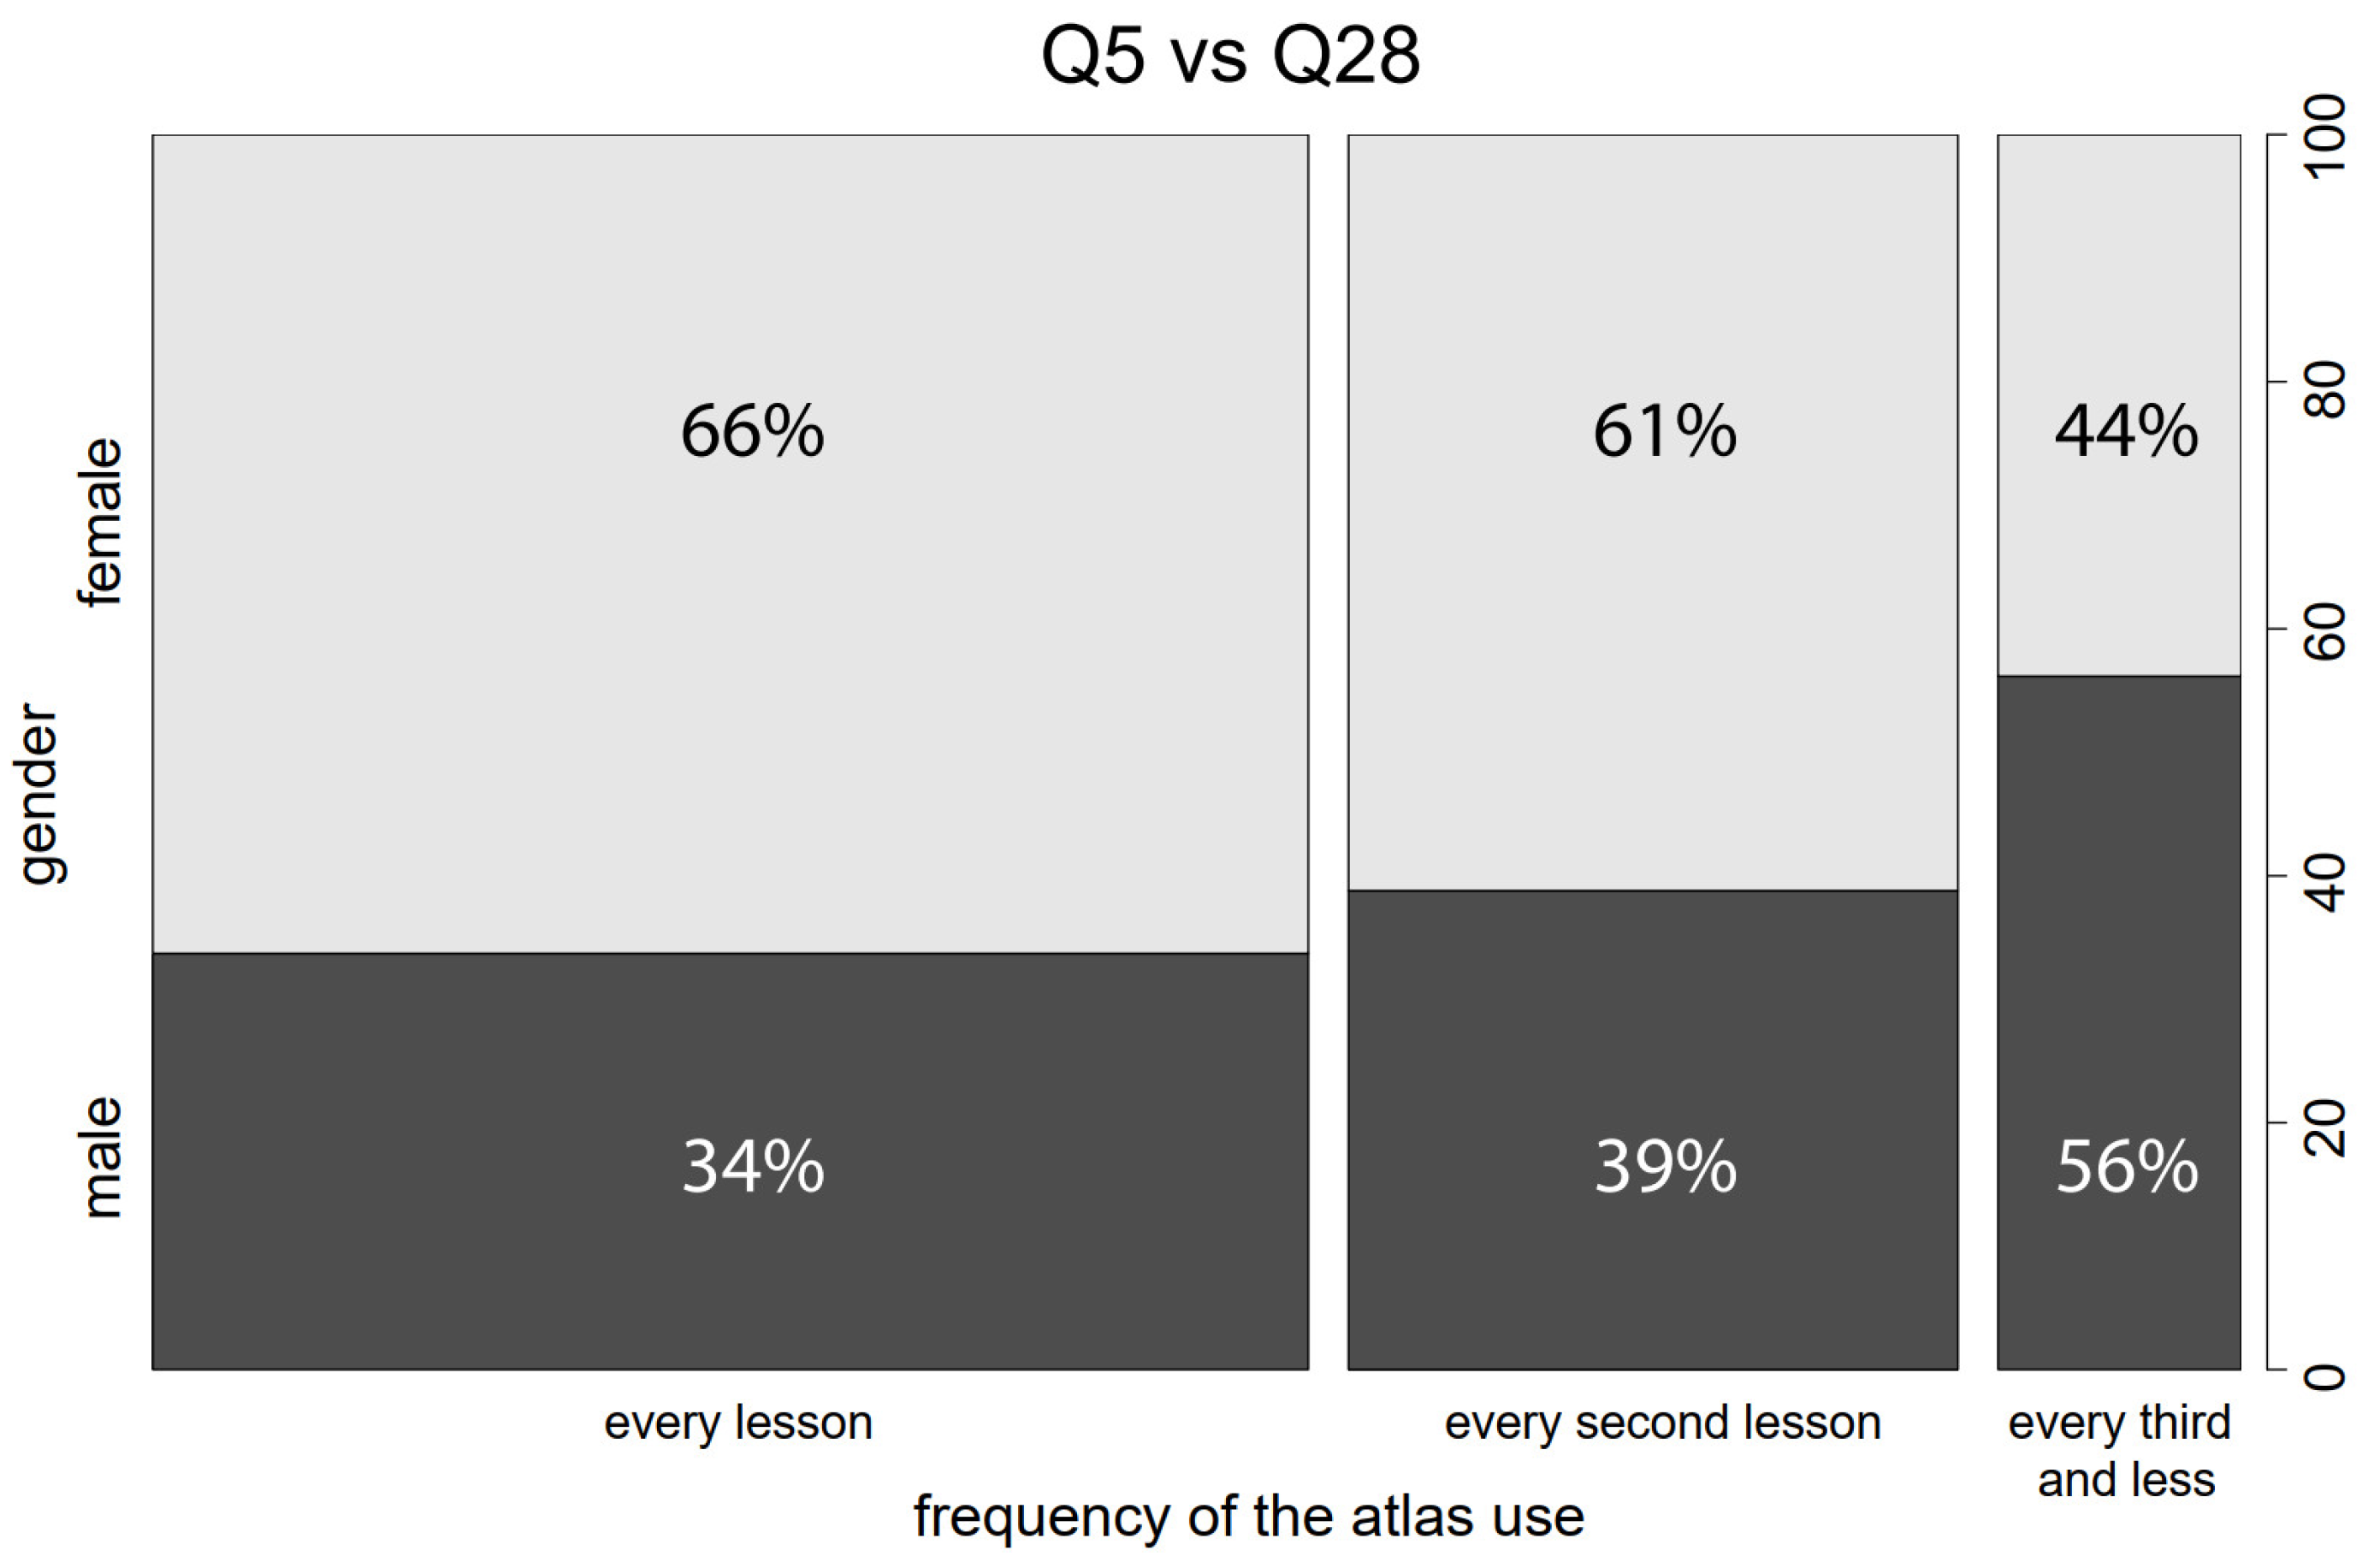
Q28 (gender) and
Q5 (frequency of atlas use). In this case, it was tested whether the relative distribution of answers to the question of atlas use frequency was the same for males and females. Based on the test results, it was found that the structure of responses differed between male and female teachers (
p < 0.001).
Figure 10 shows that this difference was caused mainly by the frequency of selection of extreme variants of
Q5. While 66% of female teachers are among those who work with the atlas every hour, the option “every third lesson or less often” was selected predominantly by male teachers (56%). It can be said that female teachers tend to work with the atlas more often than male teachers.
Another interesting relationship was the one between gender (Q28) and the type of school the teachers work at (Q25). Based on the chi-square test of homogeneity, it was found that the structure of teachers differed depending on the type of school (p < 0.001). After a deep inspection of the answers, it was found that female teachers work mainly at primary schools, while male teachers often teach at grammar schools. At secondary schools, the distribution of gender is balanced.
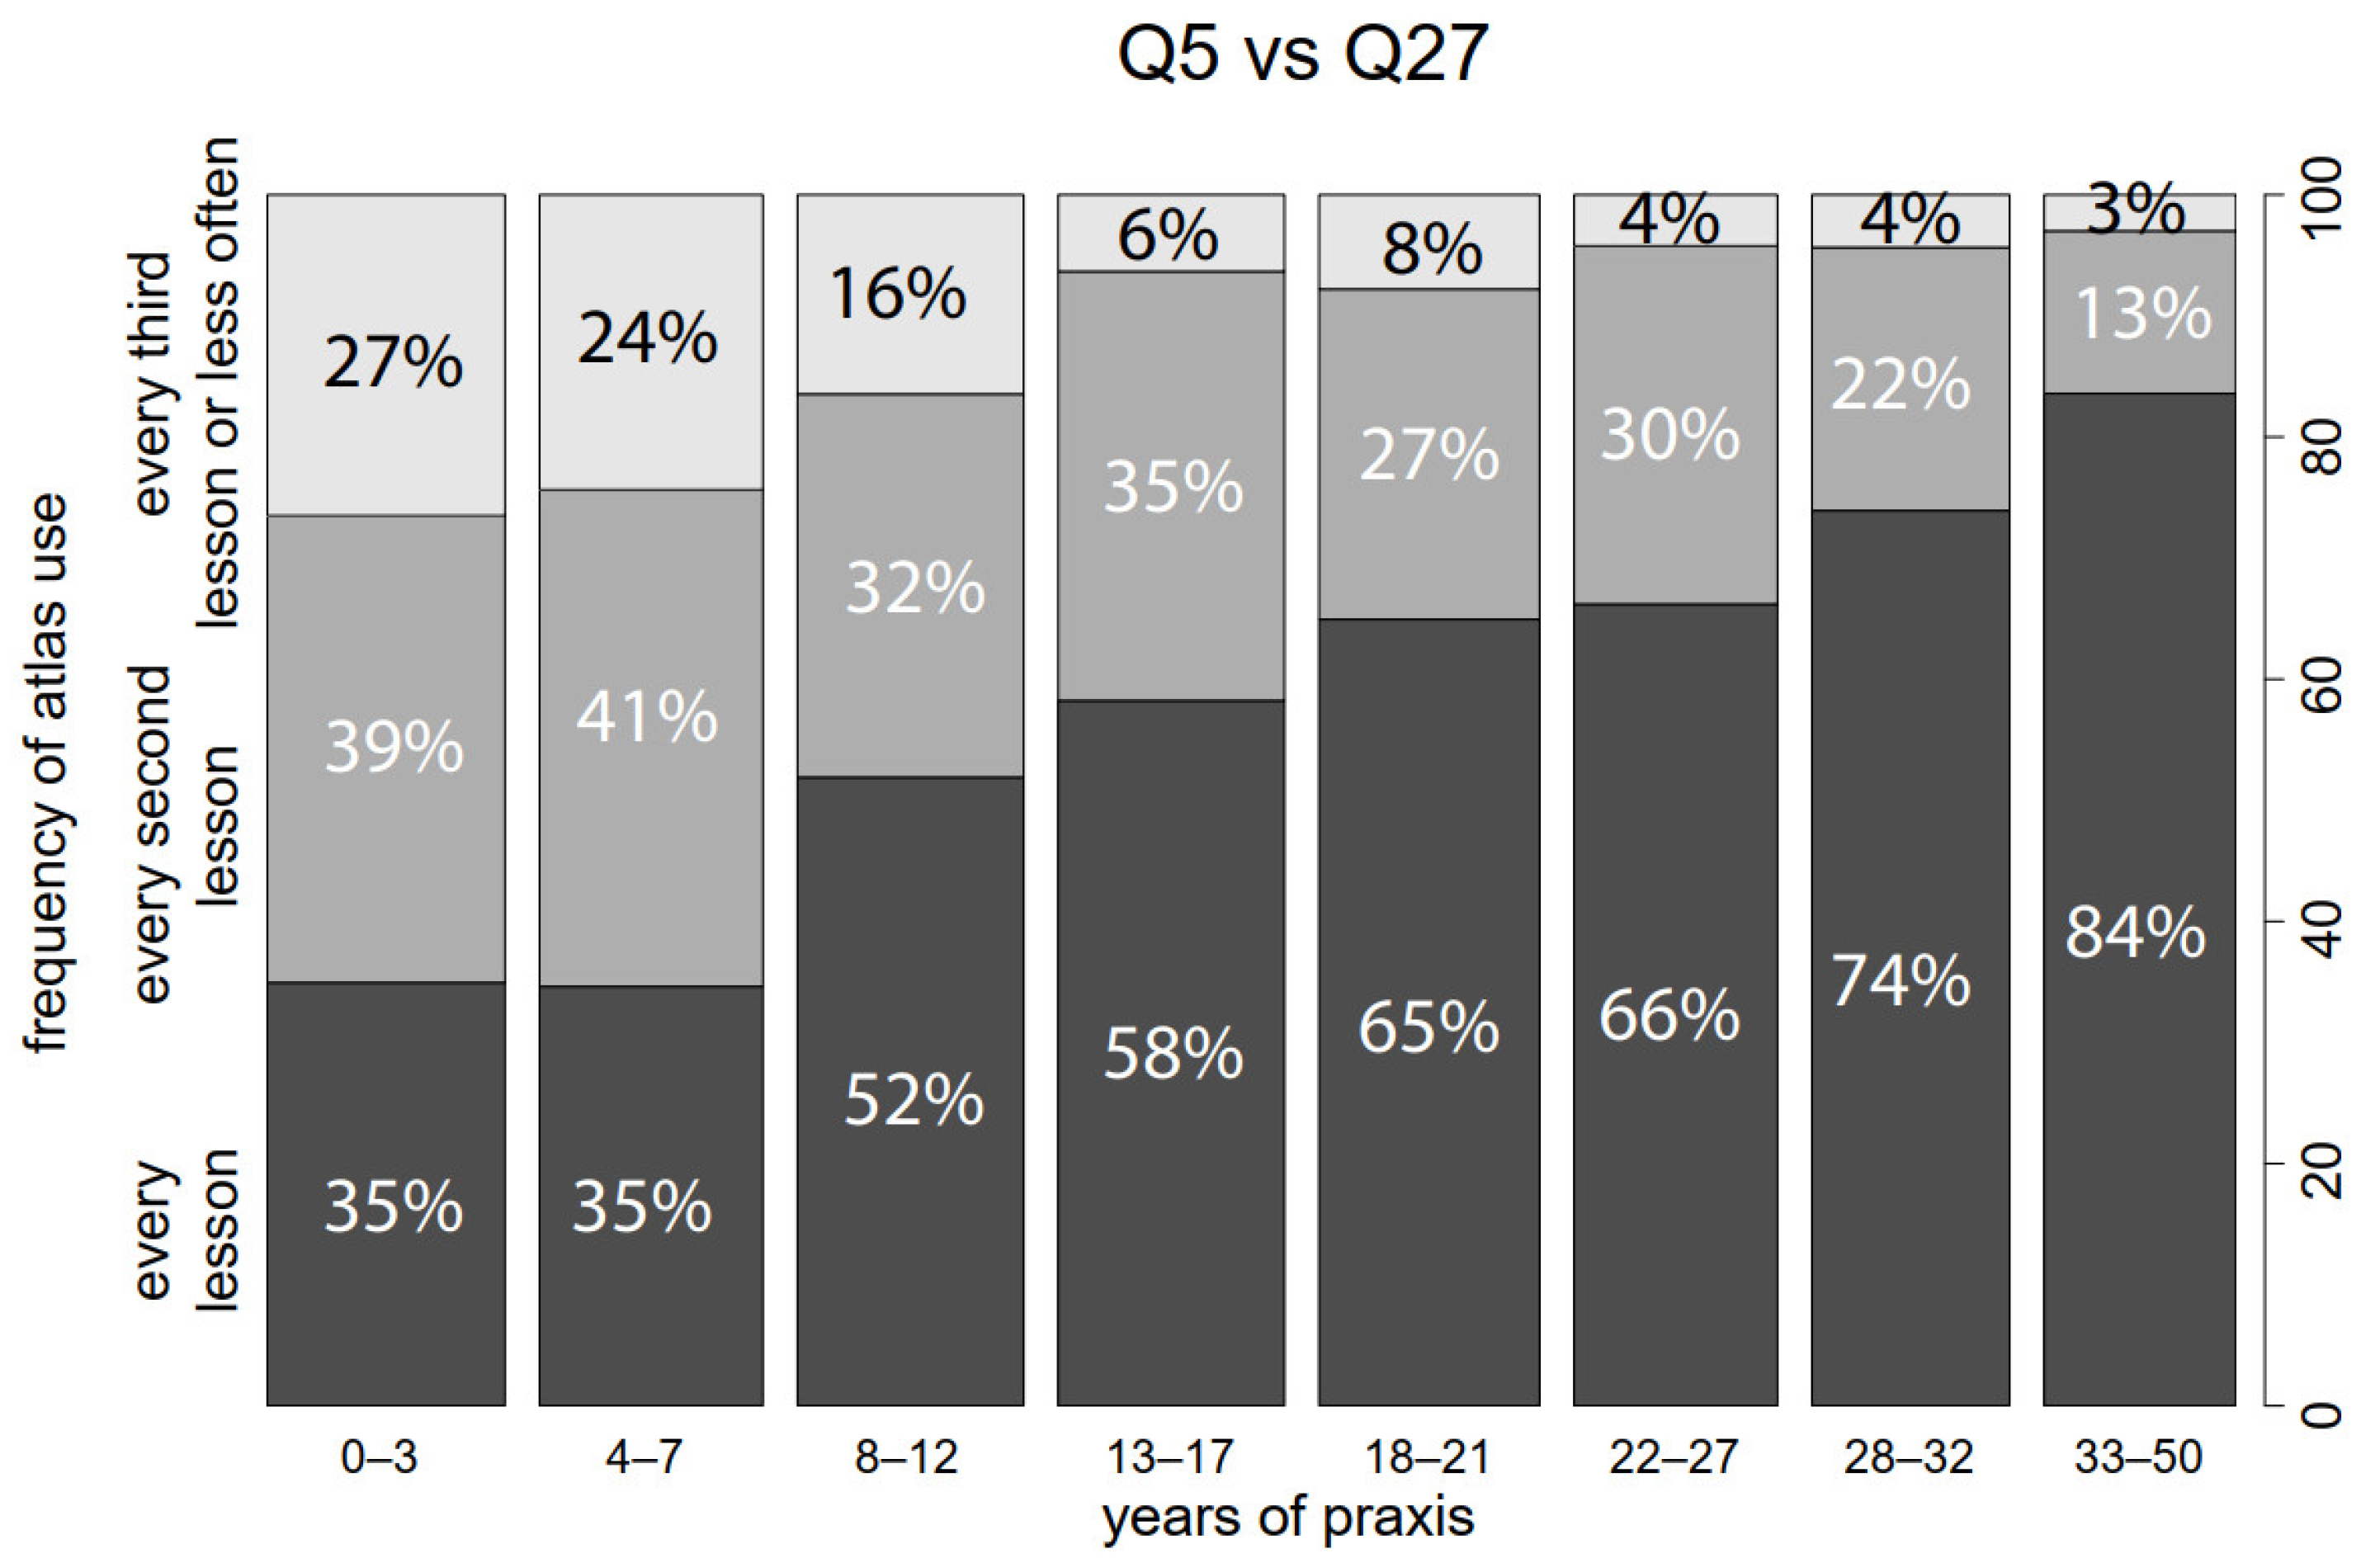
It was found that the number of years of praxis and (Q27) is the most important factor that affects the use of school atlases. Statistically significant trends were found for the combination of Q27 and ten other questions. All relationships were tested using a modified chi-square test for an ordinal variable.
One of the most important results was found in the relationship between
Q27 and
Q5 (the frequency of atlas use). Teachers with fewer years of praxis use the atlas less often than their more experienced colleagues (or less than expected in the case of the independence of both questions;
p < 0.001). This trend is visible in the graph in
Figure 11.
Less experienced teachers work more in primary schools, more experienced teachers in grammar schools (Q27 vs. Q5; p < 0.001). There is also a trend that inexperienced teachers work more in small schools. The more experienced the teachers are, the larger the school they work in (Q27 vs. Q26; p = 0.006).
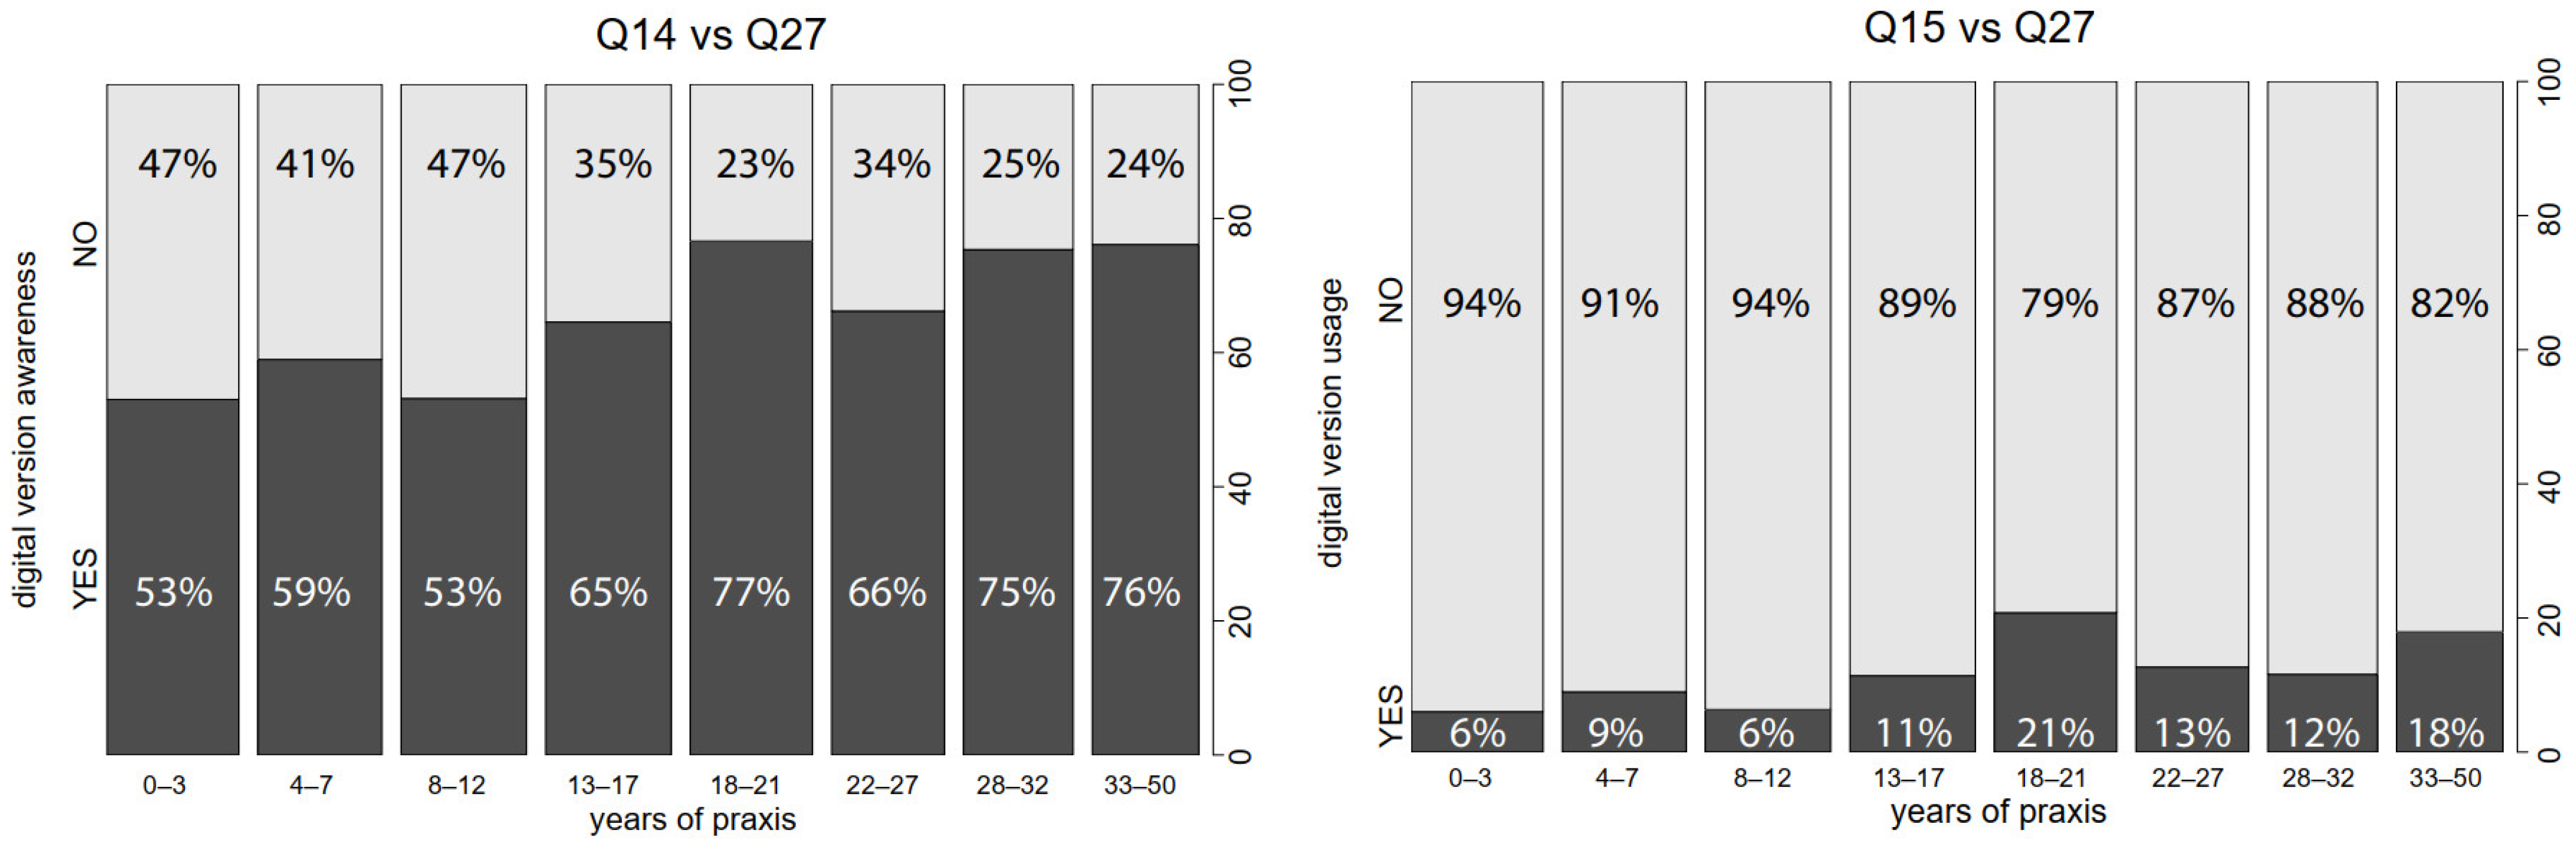
Surprisingly, more experienced (and therefore older) teachers are more aware of the digital version of the atlases than their younger (and less experienced) colleagues (
Q27 vs.
Q14;
p < 0.001). With the increasing number of years of practice, the proportion of teachers who work with the digital version also increases (
Q27 vs.
Q15;
p < 0.009). These trends are shown in the graphs in
Figure 12.
In contrast to these trends is the use of other map sources (Q19). Here, the results of the statistical analysis showed that these sources are used more by younger (less experienced) teachers (Q27 vs. Q19; p = 0.009). More experienced teachers, however, tend to give students more homework assignments with atlases (Q27 vs. Q21; p = 0.006).
A high number of statistically significant trends was found for Q25 (type of school). Teachers working at grammar schools are slightly more aware of the digital version of atlases; however, this difference is not dramatic (Q25 vs. Q14; p = 0.05). As shown by the independence test, a difference in the use of digital versions of atlases in different types of schools is also evident. Based on an estimated odds ratio of OR = 2.84, the odds that a teacher will use the digital version are almost three times higher at grammar schools than other types of schools (Q25 vs. Q15). The type of school also largely determines whether teachers will use GIS in their teaching. The odds of using GIS (all types of use, including the basic one) are about three times higher (OR = 3.26) at grammar schools than other types of schools (primary and secondary schools combined). However, the pair odds ratios are also interesting. Compared to secondary schools, the odds of using GIS at grammar schools are almost four times higher (OR = 3.84). Compared to primary schools, these odds are about three times higher (OR = 3.23). There is no significant difference between primary and secondary schools; the odds ratio is estimated at OR = 0.83, which does not significantly differ from 1.
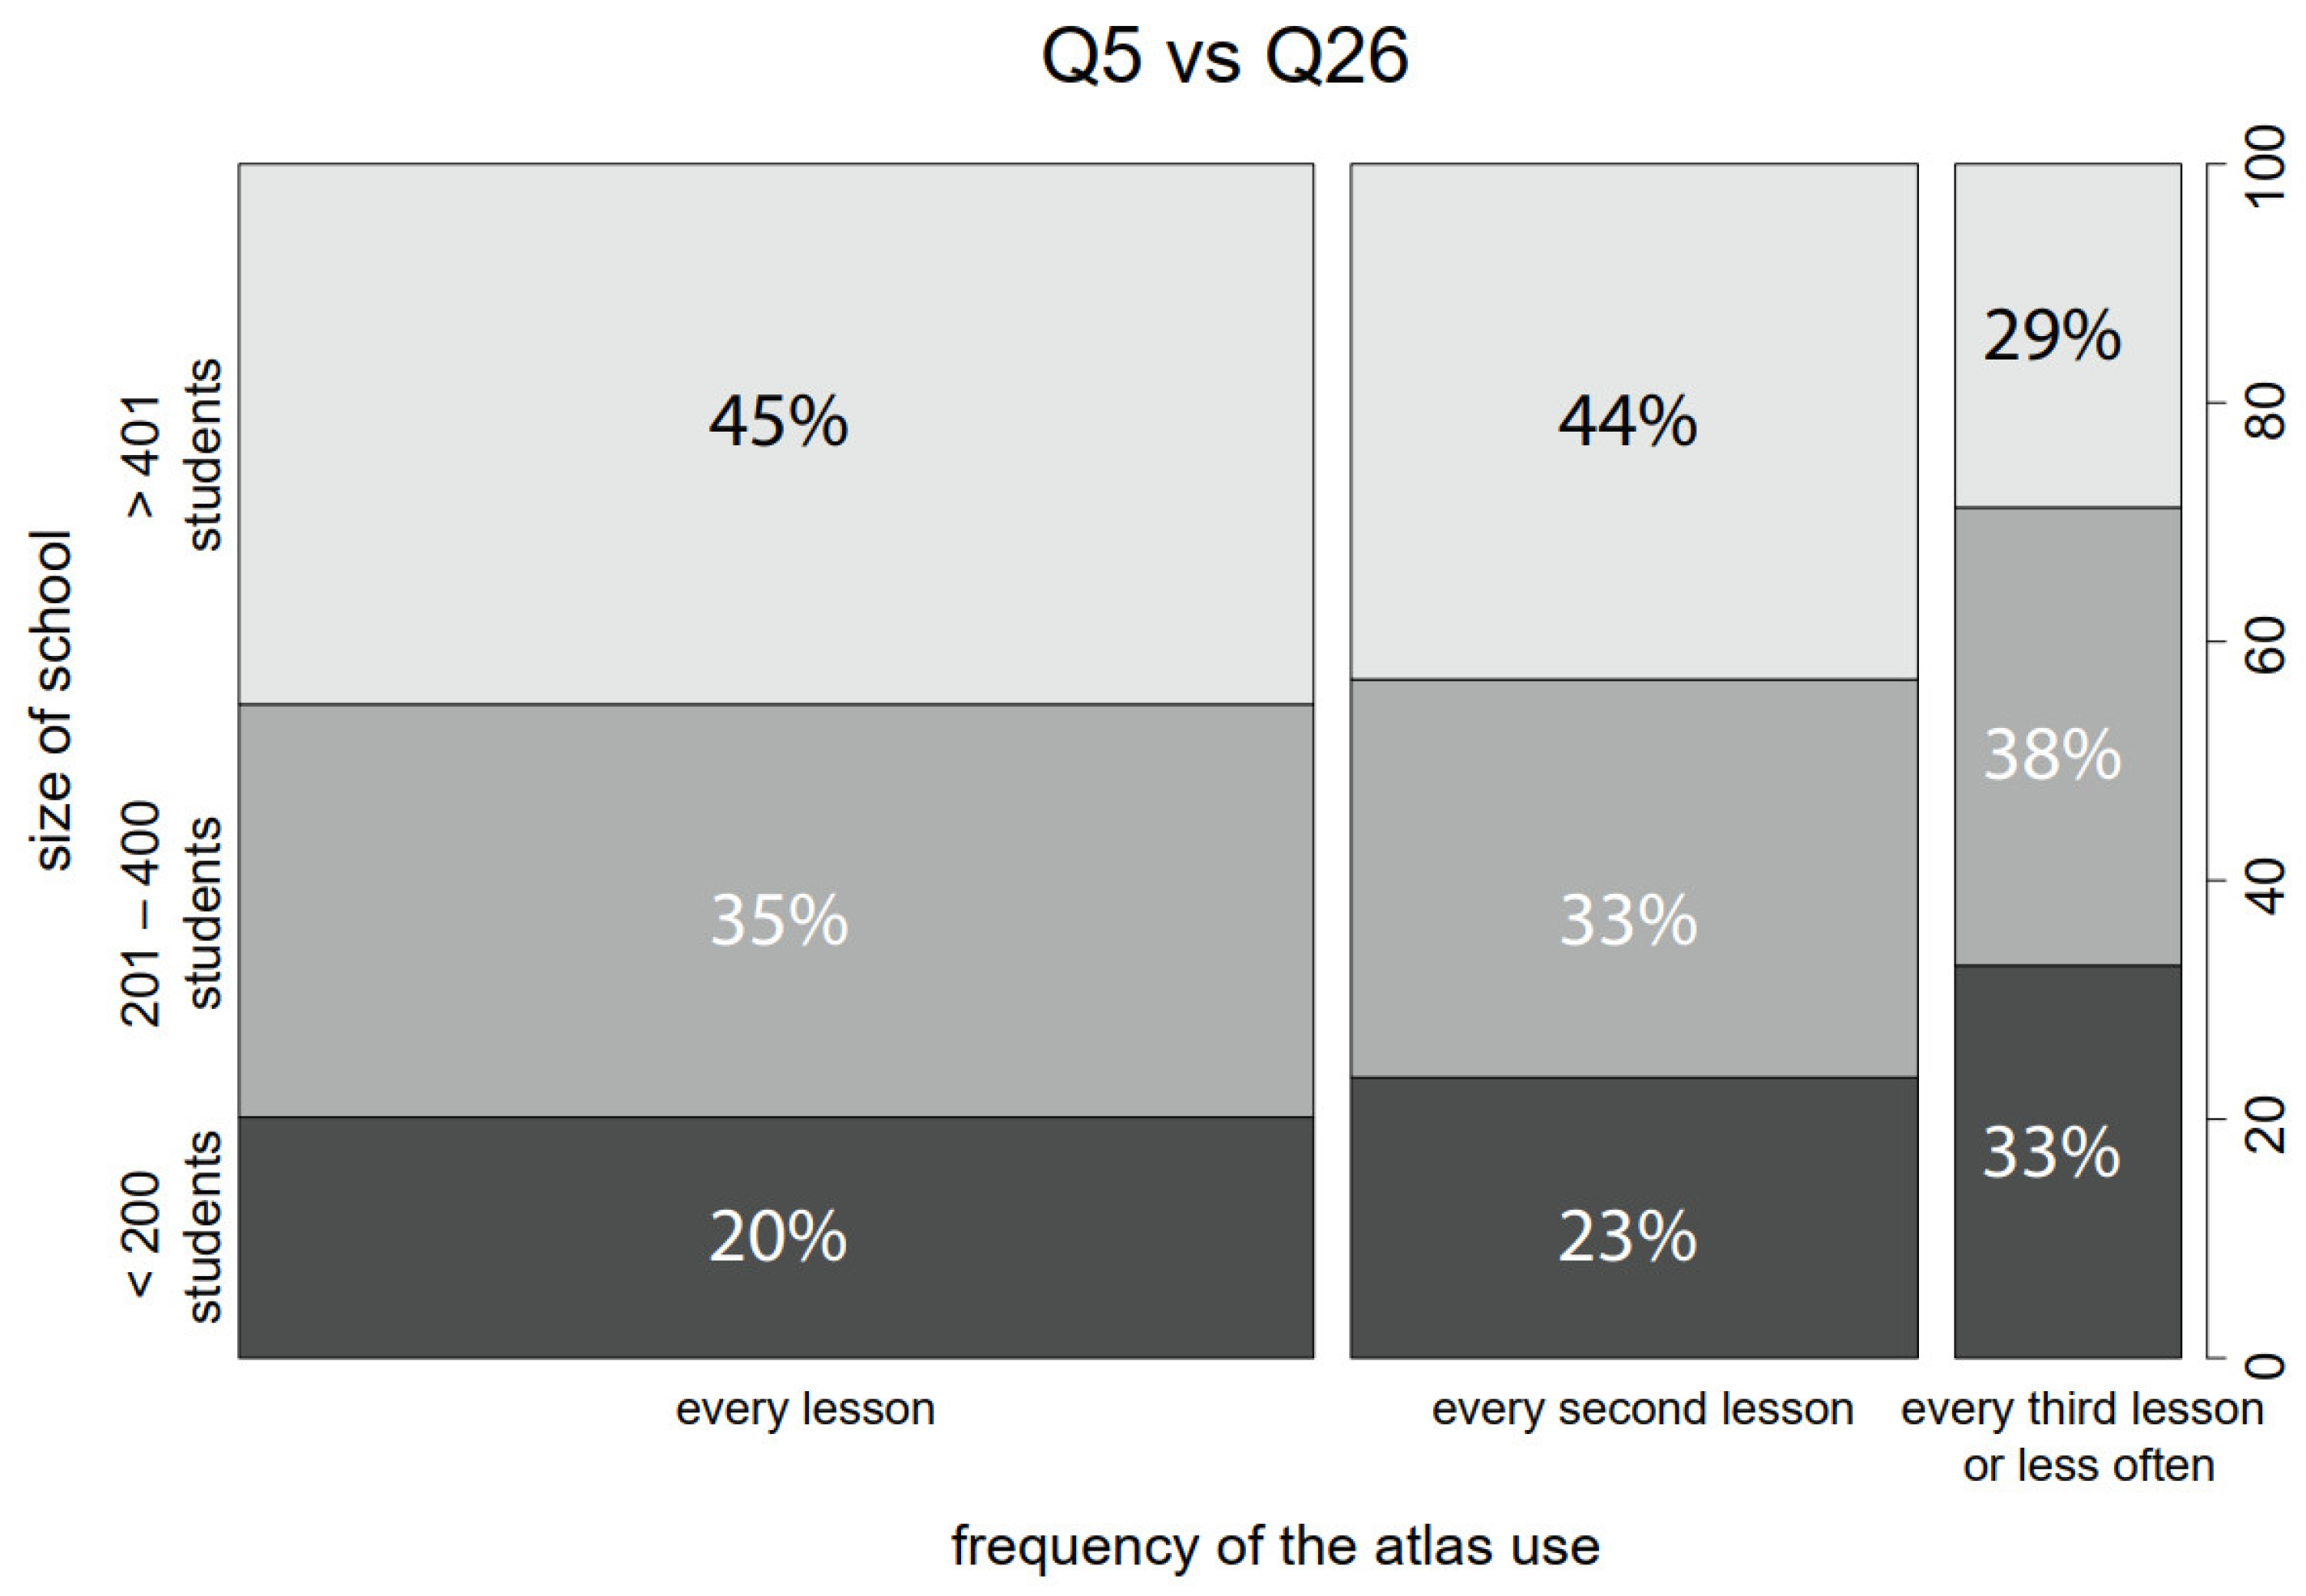
One of the key questions in the survey was the frequency of atlas use (
Q5). As mentioned above, it was found that women work with the atlas more often than men and rather more experienced teachers than novices. A significant trend appeared concerning
Q26 (the size of the school). It can be seen in
Figure 13 that teachers from larger schools tend to work with atlases more often than those from smaller ones (
Q5 vs.
Q26;
p = 0.008).
Teachers who work with the atlas more often are also more aware of a digital version of the atlas (Q5 vs. Q14; p = 0.021). The teachers who are more aware of the digital version are more likely to work in larger schools (Q14 vs. Q26; p = 0.012) and use GIS in teaching (Q14 vs. Q22; p = 0.002). A similar situation could be observed with Q15 (usage of the digital version). Teachers who use the digital version work more often with GIS (Q15 vs. Q22; p < 0.001) and also work more often with digital devices (Q15 vs. Q17; p = 0.003). The odds of using other map resources are about four times (OR = 4.03) higher for teachers who use GIS (Q19 vs. Q22; p < 0.001). Teachers who use other map sources are also about twice (OR = 1.97) more likely to be willing to participate in the future (Q19 vs. Q29; p = 0.005). The odds for future participation are about three times higher (OR = 3.10) for those who use GIS (Q29 vs. Q22; p = 0.002) than for those who do not use GIS or use it just a little.
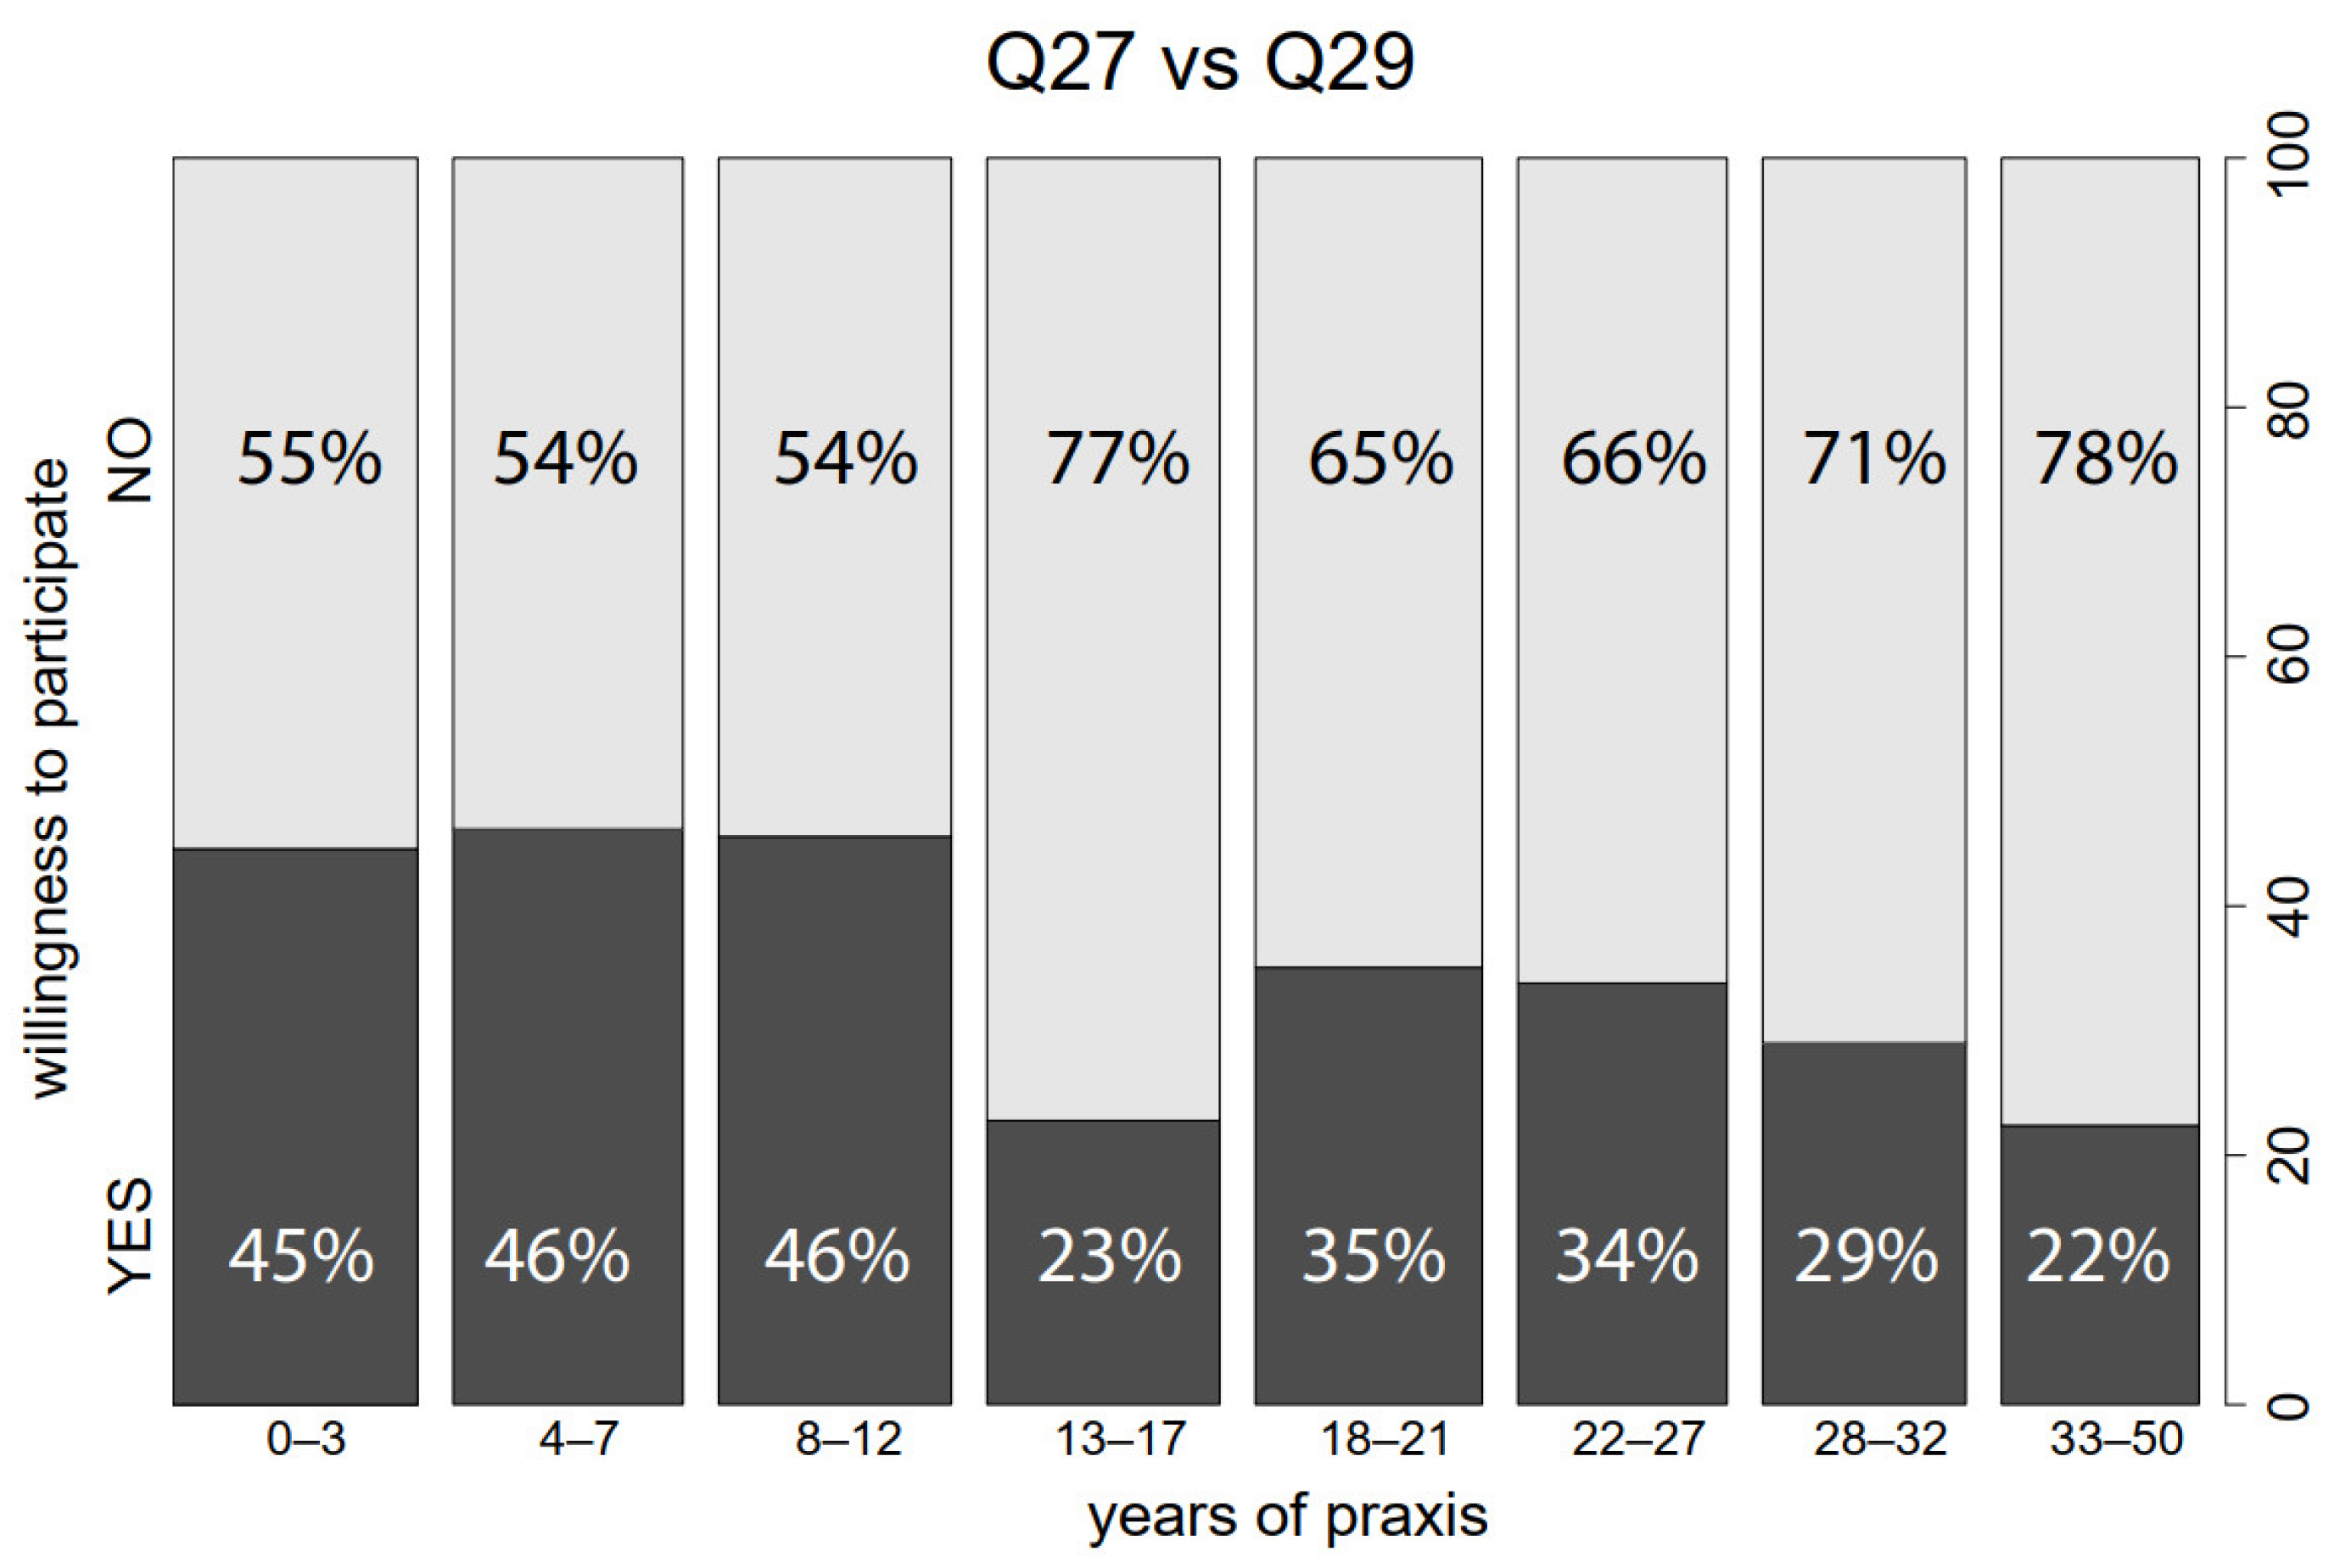
The willingness to participate is also influenced by the number of years of praxis (
Q27 vs.
Q29;
p < 0.001). Higher interest in participation can be observed in the first three categories of years taught (0–12 years), then interest decreases dramatically. For more experienced teachers, interest stabilises, but towards the end of a geography teacher’s career, interest gradually declines again, as can be seen from the graph in
Figure 14.
4. Discussion
The role of the teacher in geography education with a school atlas is crucial. The teacher determines how students work with an atlas and shows them how to understand maps and can also influence their cartographic literacy skills. The authors of the present paper, therefore, conducted a survey of teachers, applying a quantitative approach to generalise the teachers’ individual responses. Nevertheless, in many cases, the authors attempted to balance the quantitative results with qualitative ones.
We would like to describe the lessons we learned during the research. Although much emphasis was placed on the design phase of the survey and testing the questionnaire through pilot study, it was impossible to analyse the three questions as originally intended. In Q24, teachers had to state the importance an ideal atlas would have in their teaching. The hypothetical nature of the question created a misunderstanding on the part of the teachers. This is sufficient reason to avoid questions aimed at an indirect experience in the future. The open-ended question concerning the age of atlases (Q4) was also not ideal. Because teachers often work with atlases of several editions, it was difficult for them to state a specific year. Evaluation of this question was therefore problematic. The Q23 (improvement of teaching) was not evaluated. This question did not bring any interesting findings. It was formulated too widely, placed at the end when the respondents were already tired, so they mostly just chose from the listed options.
Q7 was designed to determine the proportion of tasks with atlases according to different tiers of Bloom’s taxonomy of educational objectives. Unfortunately, this direct question did not lead to the expected results since most teachers do not use this concept in practice. The authors considered that the distribution of tasks in various tiers of Bloom’s taxonomy was an important indicator of the fulfilment of the atlas’ potential. From this reasoning, an alternative approach was applied. Verbs were identified from the answers to Q6 (tasks with atlases) using linguistics methods. These verbs were assigned to the individual tiers of Bloom’s taxonomy with the aid of a list of action verbs published by Newton et al. (2020). The list summarises the assignment of over 400 action verbs according to 47 different approaches at 35 universities in the United Kingdom. Despite the use of this source, the assignment of action verbs was not simple in some cases. The reason was that atlases are specific teaching aids, and some commonly used verbs have different meanings in relation to maps. An example might be the verb to determine (geographical position).
The teachers should determine the importance of the atlases in the survey’s first question (Q1). The average of 8.2 indicates that the atlases are important. However, it might be beneficial to ask the teachers to compare the importance of the atlases with other teaching aids (e.g., textbooks) as Gerber (2001) [
6] did. According to his results, the atlases were very important, but the textbooks were used more extensively.
As mentioned above, the relationships between the questions were also analysed. Several interesting relationships emerged. One of the survey’s most important findings showed that teachers with longer experience (and therefore older) use atlases more often than their less experienced (and younger) colleagues. Further research revealed that younger teachers are using other map sources (Internet). This finding was identified as most crucial for education with maps because the teachers cannot guarantee the quality of the maps they use. It may influence the process of cartographic communication and the student’s understanding of phenomena.
Another surprising finding was that more experienced (older) teachers tend to work with the digital version more than younger teachers. This might be because younger teachers tend to look for maps on the Internet. This is confirmed by the above-mentioned findings. It would be interesting to conduct research on faculties of education to find out how teachers are led to use atlases. It also should be mentioned that some of the findings may be influenced by the dominance of the Kartografie PRAHA atlas.
Today, the predominant manner of use of maps is viewing on screens [
30]. By contrast, very few geography teachers use digital versions of atlases. If this is already the case, then the digital version only replaces the wall map. According to teachers, slow-responding and non-intuitive controls are significant problems. However, the teachers also highlighted interactive content as the most attractive for students. Unfortunately, the digital versions contain only a little of this content (only a few images or links to videos). The analysis of the responses showed that the potential of digital versions has not been fully exploited. It appears that teachers would appreciate a completely new product, such as a fully digital interactive atlas. However, the specification of this product, differences to the printed atlas, suitable tasks and methods of incorporation into teaching, and the relationship to the geography textbook is a question for further research.
5. Conclusions
The article’s aim was to measure the importance of the school world atlas in geography teaching at Czech schools, find out the types of tasks students solve with the atlas, and identify the other cartographic aids used in geography lessons. To achieve this aim, three research questions were specified. To answer these questions, a survey of geography teachers was conducted. The results were derived from an analysis of over 600 responses, which corresponds to approximately 15% of all geography teachers in Czech primary and secondary schools.
The majority of existing research on geography education has used surveys as an investigation method. However, most of the authors of this research used only basic statistical summaries during the analysis of the results. The authors of the present paper attempted to use a complex approach. Bloom’s taxonomy of educational objectives was analysed. Linguistic methods were used in the analysis of open-ended questions. The relationships between the individual questions were evaluated using statistical analysis. Some of the results were visualised interactively using the Flourish tool.
The first research question aimed to
identify the atlases used in teaching and determine their importance. The most frequently used school atlas in the Czech Republic is indisputably the School World Atlas by Kartografie PRAHA, used by almost 94% of teachers. This information has never previously been quantified, and the distribution of atlases was only estimated according to the number of copies. Over 90% of teachers responded that they used the atlas in either every lesson or every second lesson. This high level of use has shown that teachers are aware of the importance of this school aid. The high frequency of atlas use is in contrast with the study by Wiegand [
5], where teachers reported that they used atlases only in a quarter of lessons, and with the study by Sandford [
3], who stated that atlases were used only seldom in 1985 in Britain. The most important factor that affects the use of atlases is the degree of the experience of the teacher. Those with more years of praxis use atlases more often. Female teachers tend to use atlases more often than their male colleagues. It might be interesting to conduct a similar study in the future to discover how the situation has been affected by remote teaching (due to the COVID-19 pandemic), the emergence of digital atlases, new generations of teachers, and other factors.
Teachers also stated that they subjectively evaluated the importance of the atlas in teaching as very high. The median response was nine on a ten-point scale. This result agrees with the findings of Green, Skryzhevska, and Toops [
8], where 92% of respondents considered atlases as very important teaching aids. However, teachers also noted several shortcomings of the atlases. Specifically, they complained about insufficient coverage of topics in thematic maps. Thematic maps, in general, have proven the main problem in current school atlases. Some teachers respond to the lack of suitable thematic maps by creating their own maps. This approach is admirable, but the teacher’s primary role should be to teach students to use maps. Cartographers should be responsible for the map creation. Another frequently discussed problem was the frequent changes of content between editions, making teaching difficult for teachers. The solution to this problem could be summarising the changes attached to the new edition by the publisher.
The second research question focused on the
tasks that students solve with atlases. It was found that teachers often work with thematic maps, which they also consider the most important component in atlas content. The vast majority of maps are used for simple tasks such as finding specific information. However, many teachers work with thematic maps in a sophisticated manner. Students compare multiple thematic maps with or the relationships between thematic and physical maps. One of the most frequently mentioned tasks was working with blank maps, even though blank maps are not part of the atlases. The most popular tasks among students are searching, crossword puzzles, and competitions. By contrast, tasks for determining geographical location, finding context, and analytical tasks, in general, are unpopular. In the classification of tasks according to Bloom’s taxonomy, it was found that the vast majority of tasks belong in the first category (knowledge). The most common task is simply to find information on the map. This result agrees with the findings of Sandford [
3], who stated that atlases are mainly used as gazetteers. Other categories were represented only in a minority of the responses, which suggests that the potential of school atlases is not fully exploited. The above findings show the prevalence of the commemorative teaching style, but it does not develop students’ geographical thinking.
The third research question related to other aids used in geography teaching. Both analogue and digital aids and map sources were analysed. It was found that many teachers use the atlas produced in the Czech Republic by Kartografie PRAHA. Other responses included a combination of map sheets, wall maps, and globes. Teachers also work mainly with digital aids such as PCs or interactive whiteboards.
The findings of the survey could be useful to several groups of readers. The results may help geography teachers obtain a general overview of the use of atlases and possibly as inspiration. Cartographic publishers will receive direct feedback on their products, gain insight into users’ needs, and find out how school atlases are used, how geography teachers perceive them, and what is missing in them. Geographers, in general, cannot be neglected because the primary interest should focus on the quality of geography education, which must be based on high-quality teaching aids.
Maps and atlases indisputably contribute to the fields of geography and geography education. For the future development of geography skills and cartographic literacy of students, it is essential to establish permanent and active communication between geography teachers, cartographers, and didactic researchers. The results of this paper could be a great aid in extending engagement in this communication.


 ,
, 


