Article

An Integrated Decision Support System for Improving Wildfire Suppression Management

1
Department of Electrical Engineering, NOVA School of Science and Technology, 2825-149 Caparica, Portugal
2
Centre for Technologies and Systems (CTS)—Uninova, 2825-149 Caparica, Portugal
3
Instituto de Telecomunicações, 1049-001 Lisboa, Portugal
4
Instituto Politécnico de Beja, 7800-295 Beja, Portugal
5
Esri Portugal, 1990-506 Lisboa, Portugal
*
Author to whom correspondence should be addressed.
ISPRS Int. J. Geo-Inf. 2021, 10(8), 497; https://doi.org/10.3390/ijgi10080497
Submission received: 28 May 2021 / Revised: 3 July 2021 / Accepted: 19 July 2021 / Published: 23 July 2021

Abstract

:
Wildfires are expected to increase in number, extent, and severity due to climate change. Hence, it is ever more important to integrate technological developments and scientific knowledge into fire management aiming at protecting lives, infrastructure, and the environment. In this paper, a decision support system (DSS) adapted to the Portuguese context and based on multi-sensor technologies and geographic information system (GIS) functionalities is proposed to leverage operational data, enabling faster and more informed decisions to reduce the impact of wildfires. Here we present a flexible and reconfigurable DSS composed of three components: an ArcGIS online feature service that provides operational data and enables a collaborative environment of users that share operational data in near real-time; a mobile client application to interact with the system, enabling the use of GIS technology and visualization dashboards; and a multi-sensor device that collects field data providing value to external services. The design and validation of this system benefitted from the feedback of wildfire management specialists and a partnership with an end-user in the municipality of Mação that also helped establish the system requirements. The validation results demonstrated that a robust system was achieved with fully interoperable components that fulfill the defined system requirements.

1. Introduction

Wildfire incidents have a severe impact on communities by claiming lives, destroying property, and damaging the environment. Due to aging populations and the heightened severity and frequency of disasters aggravated by climate change, the role of the fire agencies has become more demanding and complex. The response to these increasingly complex events has a strong impact on municipal budgets, local economies, and the communities that are served by fire and emergency response personnel. The wellbeing of a community depends on the effective operation of its public safety agencies, and geographic information system (GIS) technology can improve that effectiveness as it optimizes emergency services delivery. To maintain public safety in communities, a high level of resilience is required through preparedness, response, and recovery operations coordinated across the various entities involved in wildfire response [1].
Portugal has been severely affected by large wildfires, with almost three million hectares burnt in the last 20 years, resulting in dramatic consequences for its social, economic, and environmental domains. The largest burned area in the last 10 years occurred in 2017, with over 500,000 hectares burnt, representing over 21,000 fires, in which 67 human lives were lost [2]. The impact of wildfires in Portugal is greatly influenced by its favorable climate, which ranges from rainy periods to extreme drought and hot temperatures, together causing an increased development of biomass that leads to large wildfires [3]. Several factors exacerbate this phenomenon, such as climate change, the aging and depopulation of rural areas, as well as poor forest management policies which include the decrease of agricultural and pastoralism, consequently contributing to an increase of wildland fuel [4,5].
Appropriate data analysis and its communication to agency personnel, elected officials, decision-makers, and the public can impact the outcome of an incident in terms of its social, economic, and environmental consequences. GIS technology can help fire agencies’ personnel, technology, and processes work together in a coordinated and collaborative way by allowing them to view, understand, and interpret incident data in ways that reveal relationships, patterns, and trends. It can aggregate data from multiple sources into one comprehensive view for effective decision-making, thus helping to answer questions and solve problems by looking at data in a way that is quickly understood and easily shared with any agency, promoting the delivery of emergency services with greater efficiency and economy.
Several research teams have been developing approaches based on GIS technology to allow the support of interventions and the management of firefighting assets during wildfire events [6]. Others simulate scenarios, to produce realistic spatial patterns that may predict when or where a critical situation may occur with a certain probability, thus enabling timely allocation of firefighting assets to those locations that present high fire risks [7]. GIS technology brings additional power to a fire-fighting response, whereby dangers and risks are evaluated, the necessary service demands are analyzed, and necessary resources are deployed.
The current fire-fighting system in Portugal centralizes much of the information at the command centers [8]. In the field, commanders in chief are heavily reliant on the connection established with the command centers and often have no computer support for the assessment and planning of the response strategies, nor access to historical and current data from the wildfire such as the terrain characteristics, road accesses, or the water supply locations in the vicinity. Thus, the support with technological tools and scientific knowledge is critical for informed decision-making, accurate fire behavior forecasting services and effective natural resource management [9], which should be envisioned in an integrated way that aggregates not only the fire management domain but also the weather, forestry, community, and fire risk assessments [10] for a more holistic and informed response.
The Portuguese firefighting system, thanks to the continued improvement on forest fire detection, its vigilance, and combat strategies, has managed to improve its initial attack phase (ATI), resulting in a 96% reduction of ignitions that turn into forest fires greater than 10ha. Despite this significant improvement, the concentration in 2 to 3 weeks of the year of only 4% of uncontrolled ignitions explains more than 90% of the burned area: it is known that the most demanding situations are concentrated in a few days of the year when the ideal weather conditions greatly impact ignition, progression, prevention effectiveness, and combat success [11,12].
These large fires pose major challenges especially when they span multiple municipalities, thus increasing the complexity of its management. To address the limitations of current solutions available in Portugal—and given the growing need to integrate technological means into fire suppression—in this paper we present an innovative DSS solution. This DSS is based on a mobile application and integrates GIS technology, enabling decision-making through the analysis of spatial and temporal data using a comprehensive visualization of informative dashboards and maps, which conceals the complexity of GIS technology from users to provide a frictionless user experience and enable faster responses. With the usage of GIS technology, data collected from the emergency scenarios can be promptly analyzed and displayed in different arrangements in order to allow the finding of trends and patterns that are expected to emerge. With GIS technology, it is possible to save more lives, as it is possible to have even quicker access to data must be processed before it can shorten the decision-making process.
The paper is divided into two initial sections, Introduction and State of the Art, where the problem is outlined and the current state-of-the-art in firefighting is presented. Following this we present Section 3, Proposed Solution, wherein our system requirements are established alongside the architecture and the description of each component. Afterwards follows a Results and Discussion section in which the results attained from each component of the system are presented and discussed. Finally, we report our conclusions in which the contribution of this work to addressing the initial problem is presented.

2. State of the Art

A DSS is an information system designed to assist decision-makers in solving structured or unstructured problems. It seeks to improve the quality of decisions by providing an environment to analyze problems, simulate processes and display relevant data in a comprehensive and easily interpretable way [13,14]. These systems are not intended to replace the role of decision-makers, but rather to help them create efficiencies in the decision-making process. GIS can be part of these DSSs for acquiring, storing, retrieving, analyzing, and displaying spatial and non-spatial data. They can analyze (geo)spatial data and organize layers of information into visualizations, using mapping tools that allow deeper insight into the data itself, such as patterns and relationships, helping users to make smarter and more informed decisions [15]. Spatial decision support systems (SDSS), a particular type of DSSs, have considerable overlap with GIS. For our purposes, SDSSs are information systems that allow decision-makers to manage and analyze all the data coming from heterogenous sources in a wildfire scenario.
There has been extensive work, worldwide, to develop better DSSs for wildfire response management using GIS technology. In Greece, VirtualFire was proposed in 2013 [16], which integrates land cover land use (LCLU) maps and fire spread predictions (FSP), and, later in 2020, the same research team proposed AEGIS [17] as a WebGIS Tool, to manage wildland fire hazards by providing online access to information that is critical for wildfire management. It integrates spatial and map data, and other features such as early fire warning, fire planning, fire control, and coordination of firefighting forces. The Wideland Fire Decision Support System (WFDSS) [18,19] is used in the US, which has some similarities with the VirtualFire system, but also includes a module for economic risk analysis. In Portugal, a GIS was proposed in [20] to support the forest firefighting in the municipality of Águeda, aimed at complementing an existing approach that is based essentially on empirical information with geographic information, facilitating communication between the various agents involved in firefighting. This system is composed of three distinct modules: (i) a WebGIS application, which will be the main module and will allow the visualization of assets on the ground; (ii) an application for mobile devices, for assets on the ground to be able to report their location periodically and automatically; (iii) and an application for mobile devices onboard of aircraft (helicopters and Canadair’s airplanes), which will allow them to find locations for water supply. Another Portuguese initiative is the MacFIRE Project, a WebGIS launched by the municipality of Mação, integrating map data, vehicle location, fire front severity classification and location, and ignition points of fire among other features [21]. This DSS also has the real-time GPS positions of operational resources and manual definitions of the fire perimeter and fire front intensity. MacFIRE, although being innovative in the Portuguese context, lacks an integrated visualization interface to gather all the research-based information sources: field meteorological data, updated imagery and LCLU maps, and FSP.
Existing decision support systems (DSS) in Europe, USA and Australia are mainly focused on early fire detection [13], lacking the support for managing resources for fire suppression, a critical issue when tackling extreme wildfires. Other types of early warning systems aim to forecast potential favorable weather conditions for wildfires to propagate, producing longer lead prediction for resources to be more efficiently allocated [22]. In Europe, several of these DSSs are based on costly high-resolution cameras, Light Detection and Ranging (LIDAR) sensors and infrared (IR) cameras [23,24]. A DSS comparative table is shown in Table 1, where recent solutions converge to the integration and fusion of multiple sources of information into the DSS.
Currently, there are no operational DSSs with real-time data from local wireless sensor networks (WSN), since it requires significant human and equipment resources, which are very limited during wildfires. The integration of weather data on some DSSs can provide valuable support for estimating fire progression, however, some of the existing solutions consume data from local weather stations that may not be updated and be located far away from the occurrence site, possibly disregarding the microclimate created by the fire. On top of that, WSNs can automatically provide critical data about the resources present in the theater of operations without having to manually insert the data into the system, thus helping decision-makers have a more holistic view about circumstances in the field. With the expected increase in the impact of wildfires and on the allocation of fire management resources due to future climate change [25], it is vital to handle this problem with a multidisciplinary approach that demands the integration of several expertise areas to support decision making.

3. Proposed SOLUTION

3.1. System Requirements

It was important to design several functionalities that meet the real needs of the users, ensure the least possible hassle for the operational response, and provide relevant information. Thus, the following functionalities were implemented:
  • Displaying Feature Layers, developed on ArcGIS Desktop and published on ArcGIS Online’s feature services, allowing users to work locally with various operational data shown in layers;
  • Working offline and synchronizing modifications at any time with ArcGIS Online’s feature services;
  • Allowing the open/add/removing of attachments associated with features (for example, pictures);
  • Connecting to a multi-sensor device in real-time;
  • Visualization of data from a multi-sensor device on the user interface (UI);
  • Generation alerts based on the real-time data;
  • Use of GIS functionalities to support the management of fire-fighting assets.

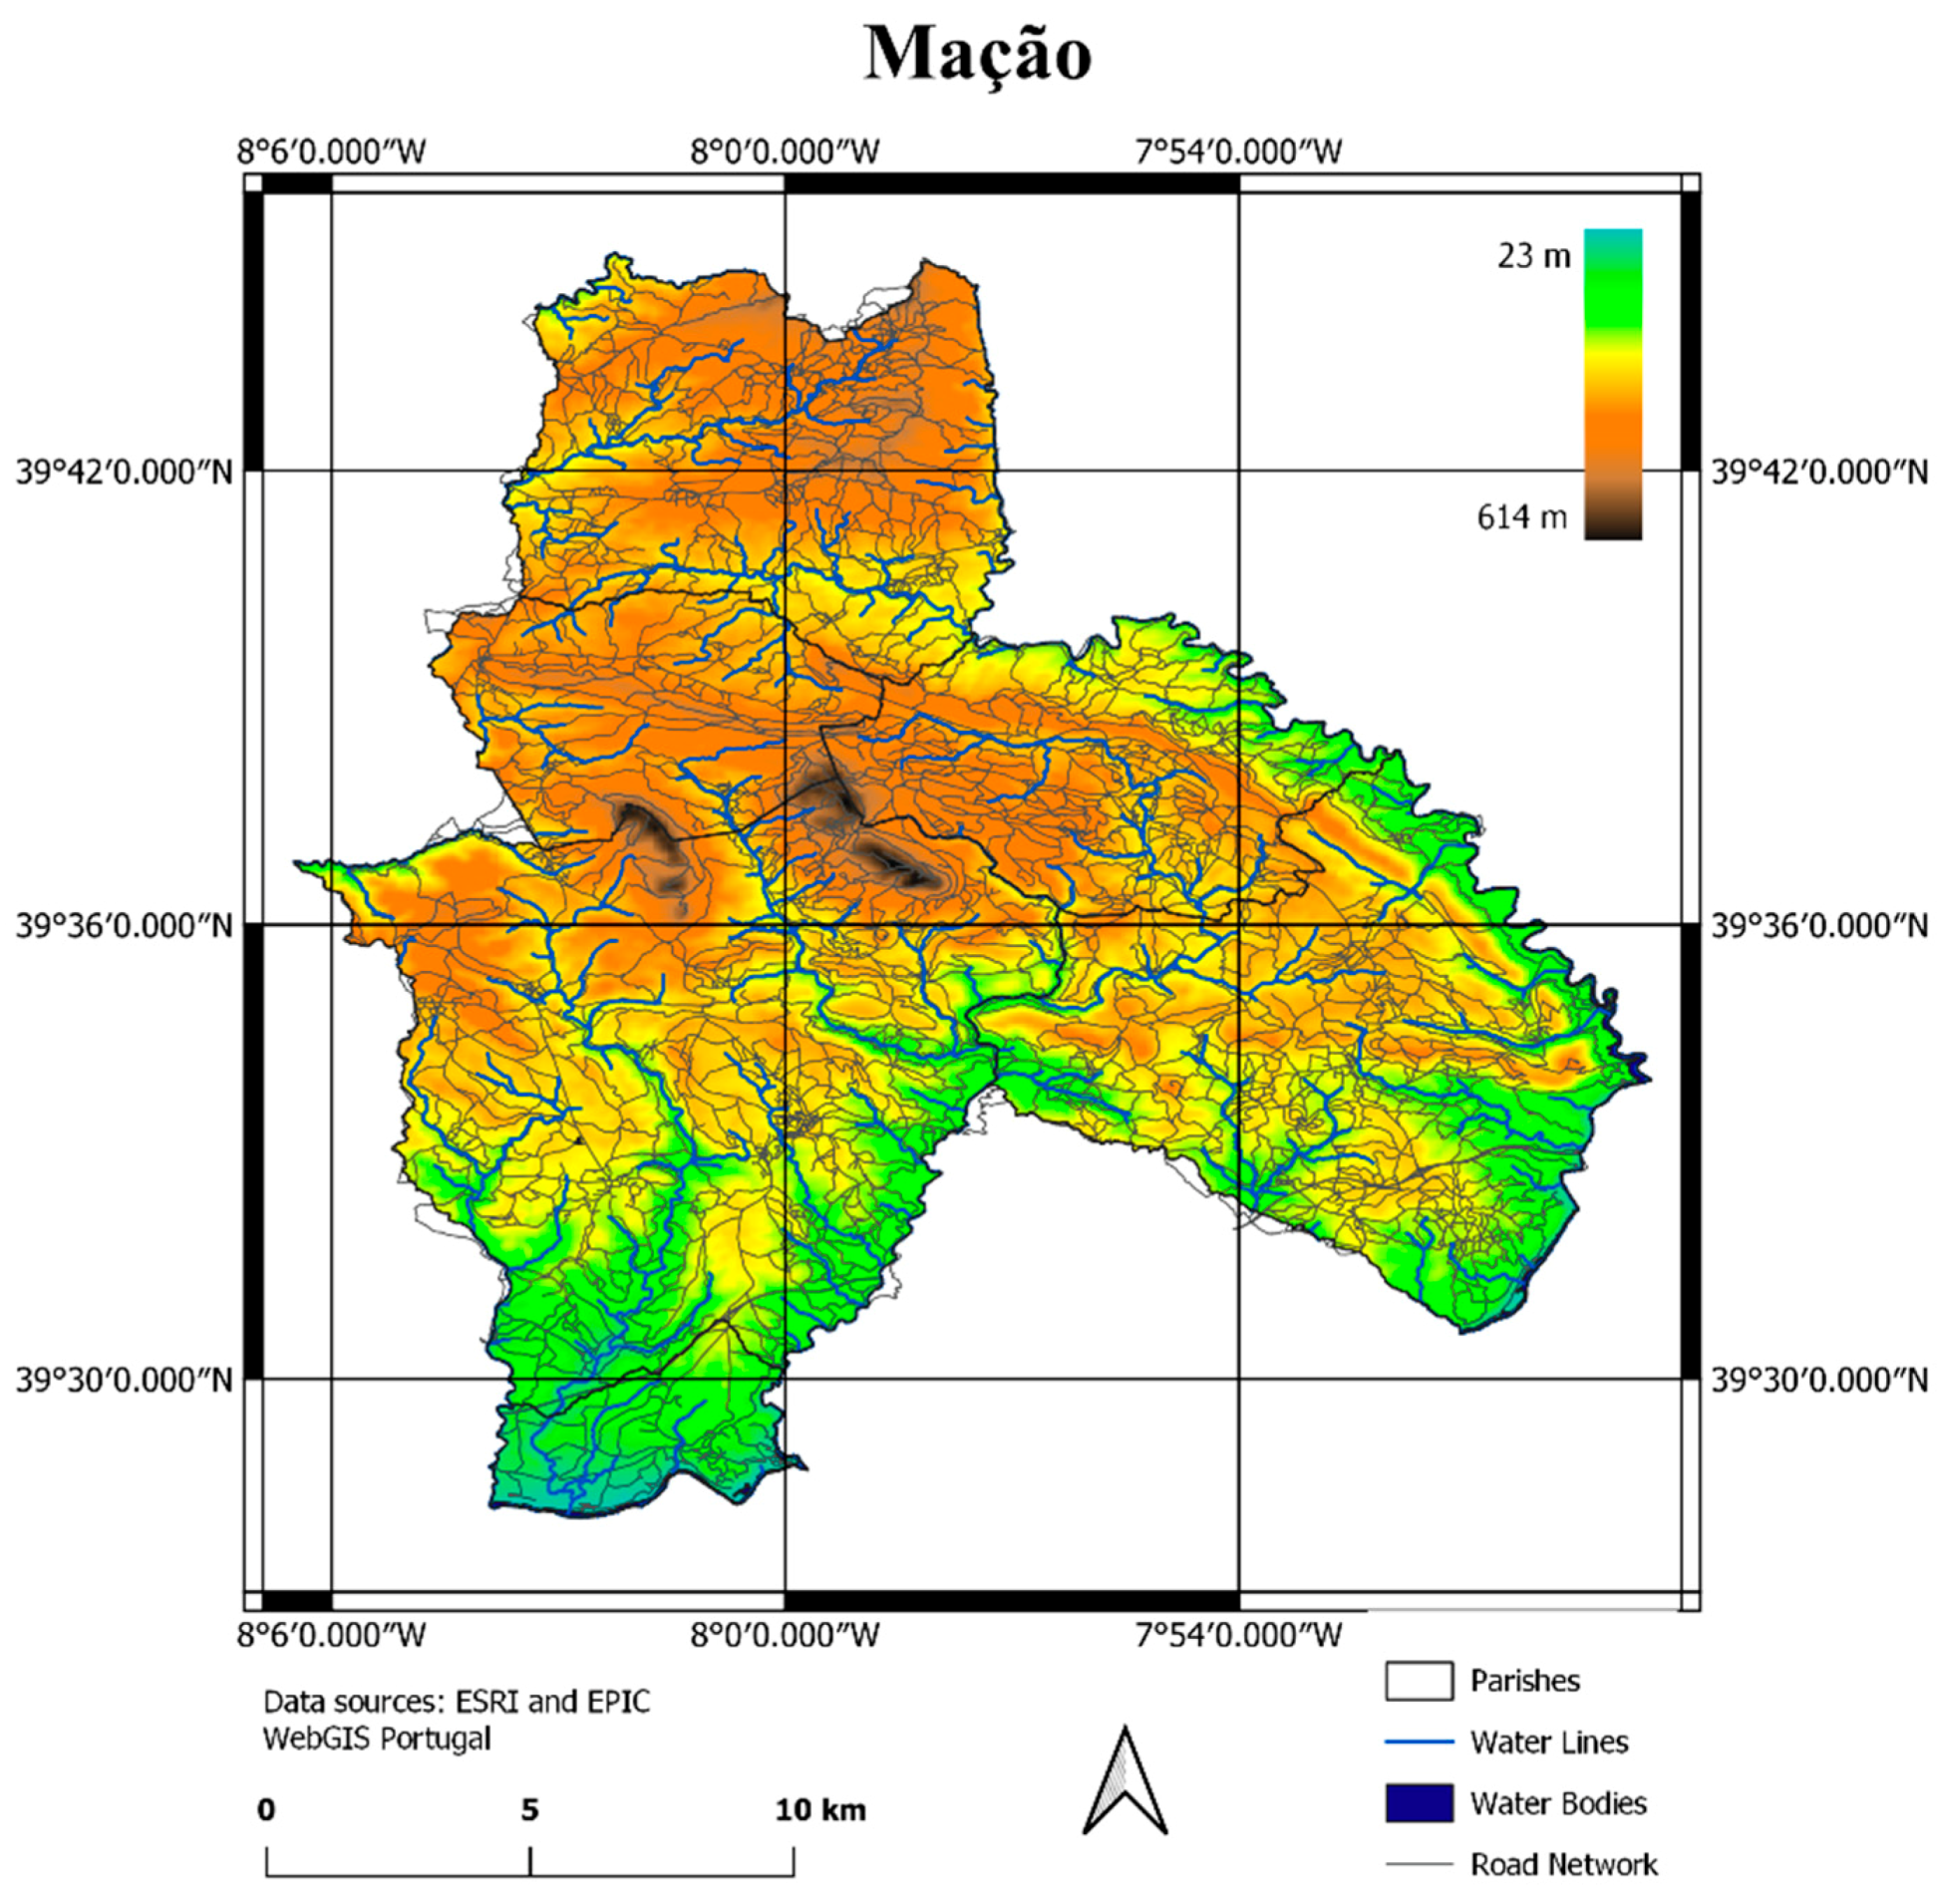
3.2. Study Area and Data

The Portuguese municipality of Mação belongs to the district of Santarém, located in the Centre Region (NUT II), Médio-Tejo Sub-Region (NUT III), and has an area of 399.98 km2. It consists of six parishes: Amêndoa, Cardigos, Carvoeiro, Envendos, the Union of parishes of Mação, Penhascoso and Aboboreira, and Ortiga. This region is mainly characterized by natural vegetation and forest which accounts for approximately 84% of its area, while land use for agricultural purposes is approximately 10%, thus 94% of the total area of Mação is used for natural vegetation, forest, and agriculture. This represents a high risk, as most of the forest biomass is highly combustible species such as pine trees, eucalyptus, and bushes [26].
Multiple factors turn Mação into a vulnerable region for wildfires, especially in the summer season. These factors include a sharp decline of approximately 26% of the population in the last 20 years [27], an aging the resident population, and a significant shift in the region’s economic activity in which most of the population moved from the primary sector, greatly focused on rural activities, to the tertiary sector, focused on a service-oriented economy. This further reinforced the loss of significance of the rural properties to the region’s economic activity, thus leading to abandonment and a reduction in pastoral activities that contribute to the accumulation of plant biomass and, in turn, larger and more intense fires [28].
We can conclude that the combined action of these factors, which include demographic and socioeconomic components, together with meteorology, land use, topography, and the influence of a wet–arid climate cycle, dramatically increased the forest fire risk of this area and potentially resulted in devastating forest fires in the years 1991, 2003, 2005, 2017, and 2019 in this territory; over these years the burnt area rose 200% [26] in comparison to previous years. These factors, together with partnership from the public authorities of Mação, led us to choose this area for study.
An OpenStreetMap shapefile dataset, containing the administrative boundaries of all the municipalities and parishes and the entire road network of Portugal, was downloaded from the GeoFabrik website, from which the study area was extracted. A network dataset was created with the ArcGIS Desktop software, by using the downloaded road network to which was conducted some previous topological corrections. This network dataset was prepared to be stored on mobile devices, allowing users to generate routes between multiple places or to determine the shortest path to the closest water supply location, even without an internet connection. Figure 1 shows the study area of Mação.

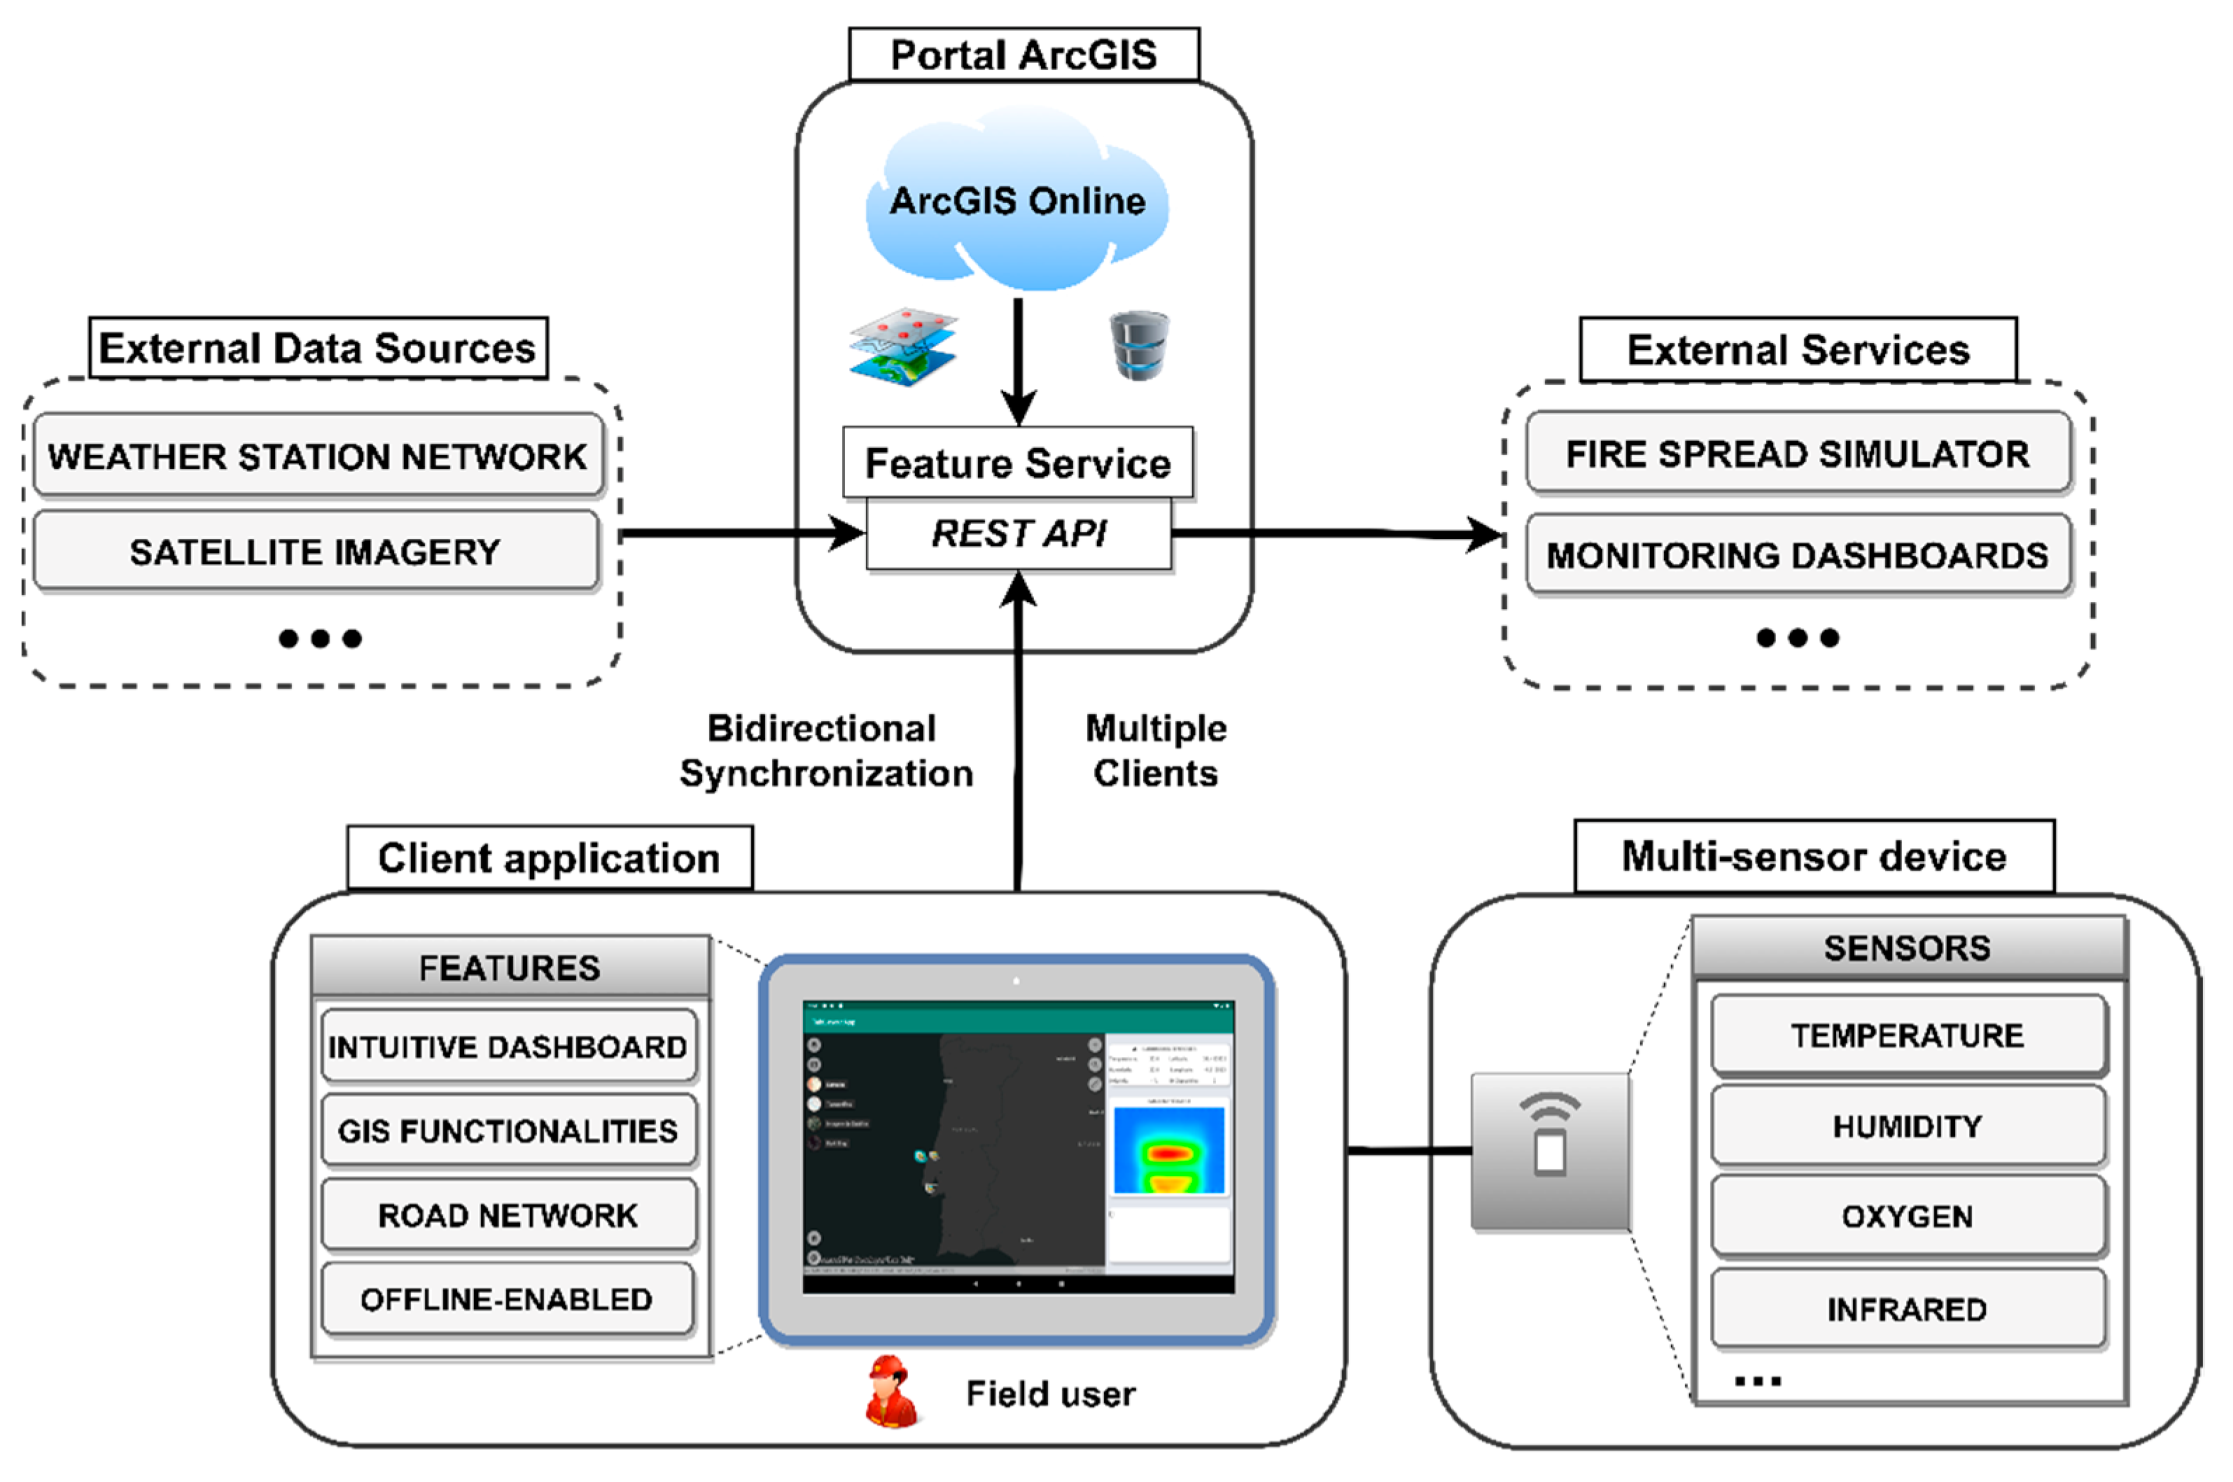
3.3. Architecture of the Decision Support System

The proposed DSS system is divided into three main components: (1) maps and Feature Layers; (2) a mobile client application; (3) and a portable multi-sensor device. The system architecture is shown in Figure 2.
(1)
The maps and Feature Layers are hosted on ArcGIS Online. An ArcGIS Online feature service was published using the ArcGIS Desktop software suite, with Feature Layers designed to store operational data. By providing an API, it can be used by multiple client applications establishing a collaborative platform of users that share data between themselves in near real-time, which is critical in a wildfire scenario. This API will also be critical for integrating external services that can benefit from the provided data, such as FSP that can improve their accuracy with its data, or monitoring dashboard that will offer a different visualization experience. Its Feature Layers store multiple types of data, such as: (i) the obstacles on the road that might influence routes generation; (ii) the vehicles position and state, represented by different symbology for whether a certain vehicle is in a normal state or in danger; (iii) the water supply locations that are important during fire fighting for vehicles to refuel, and; (iv) the fire-front severity and location;
(2)
The mobile application synchronizes itself with the ArcGIS Online feature service and allows the user to interact with the operational data providing GIS functionalities to properly analyze and manage this data. It also provides dashboards to let the user visualize the operational data and make a better assessment of the circumstances related to a wildfire, as well as alerts on the safety of firefighting assets. A road network dataset was developed using the ArcGIS Desktop software which is provided in a file geodatabase stored on the client application device’s local storage, to allow the user to generate routes between multiples places or find the closest water supply location, even without an internet connection. Everything is stored on a local sync-enabled geodatabase file that is periodically synchronized with the ArcGIS Online’s feature services to pull or push the most recent data. This is critical for ensuring that the client application can work in a disconnected environment, so as to not compromise the operational response;
(3)
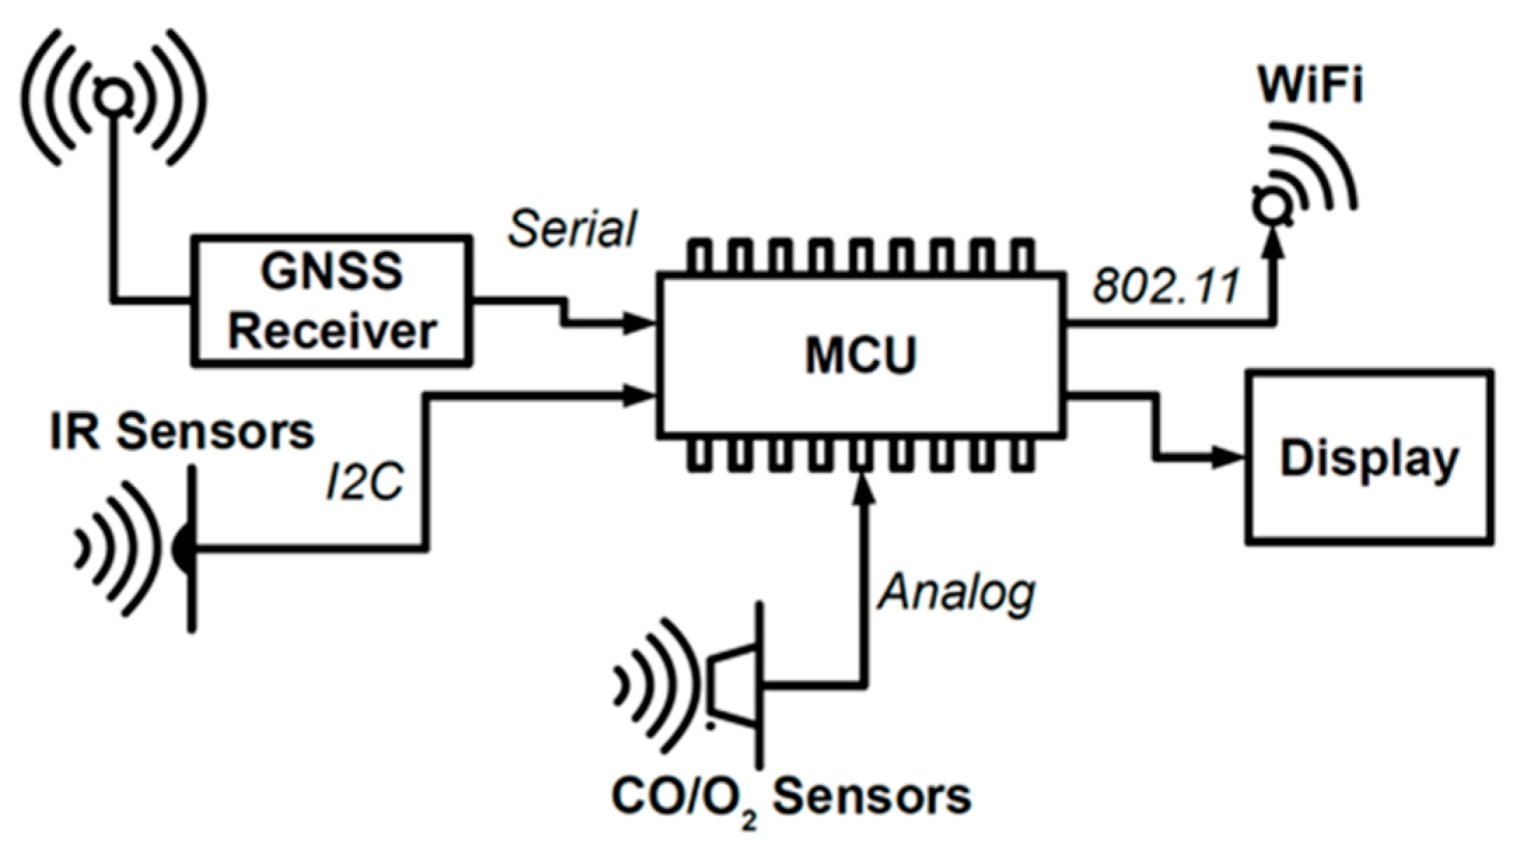
The multi-sensor device is an important part of this system that provides critical sensor data to help assess current circumstances in the field. Its main use-case is to geolocate firefighting assets whilst monitoring parameters, such as the concentrations of oxygen and carbon monoxide inside the vehicle and its surroundings, air temperature, and humidity. It also acquires infrared data, generating thermal images from a region affected by a wildfire to identify potential reignition spots. The client application generates alerts based on this sensor data that can be lifesaving in some situations, for example, a tractor operator working in a low-oxygen environment.

3.4. Overview of the Mobile Client Application and Feature Service

The fundamental block of the proposed system is the application that bridges every component of the system presented and serves as the gateway for the user.
Its GIS functionality was developed using the ArcGIS Runtime SDK for Android from ESRI [29]. This SDK provides a set of tools and support documentation to implement the necessary GIS features in a customized application, tailored for the user’s needs. One of the key advantages for its use is seamless integration with the ArcGIS ecosystem, which offers a wide range of tools for geographical data creation, management, and storage.
An initial assessment was conducted to determine the system requirements for the users’ needs. Based on this assessment, the architecture was designed to meet the requirements and to be developed in a modular way to allow seamless integration of new features.
One of the key requirements of the application was to be able to work offline, since internet connectivity may not always be available on the field, which would compromise the operational response. The ArcGIS SDK supports different implementation workflows, deployed according to the availability of internet access and the needs of connectivity of the application [29].
The “Always connected” workflow requires that the apps have constant access to online map and layer services. Should the internet connection be compromised, and the application lose access to these services, the result may be a loss of data and, possibly, an application failure.
The “Occasionally connected” workflow, which is used when the apps have occasional internet access, can download maps locally when internet is available, thus allowing to work when the device is disconnected. Upon restoration of the internet connection, any changes in operational data can be synchronized with online services. This workflow can be implemented in two ways:
  • the “pre-planned workflow”, where the map author defines a map area and generates an offline map ahead of time that can be later downloaded and taken to the field bullet; or
  • the “On-demand workflow”, where the field users can specify the map areas to which they want offline access, together with the details and a base map that can be download to their device in advance. This can be done at any connectivity moment, without the need to previously prepare map areas.
Lastly, there is the “fully disconnected” workflow where apps can operate totally independently from an internet connection by use of mobile map packages or mobile scene packages. These read-only packages can be shared within an organization or distributed across multiple field-user devices. However, this workflow is suitable for read-only apps that do not require regular data updates, thus rendering itself unusable for use cases where new data must be created, edited, or shared between multiple users at great frequency.
After a careful analysis of these workflows with reference to system requirements, it was determined that an “occasionally connected” type of workflow was needed for this system, given that the application was required to work offline, but periodically would connect to the internet to synchronize its work with online services and retrieve any updates from other users. Therefore, the “occasionally connected” workflow was also developed, which does not requires the pre-planning of map areas as they can be downloaded for offline use, a very useful feature of the system specially if the availability of internet connection is scarce or inexistent in a firefighting scenario.
Rather, this application is prepared to work offline following a geodatabase workflow. In this workflow, a geodatabase is created on the mobile device running the application and synchronizes its data with a sync-enabled ArcGIS feature service. From that moment, every modification made by the user is stored locally on that geodatabase. When the internet connection is restored, changes on the local geodatabase are synchronized with the online feature service, allowing other clients to pull them into their devices running the application. The synchronization process can be configured to run manually upon user interaction or set to occur periodically within a pre-defined time period set by the user on the application’s settings.
By opting with this workflow, there is no need to create maps and pre-planned map areas ahead of time. The user has access to feature services and creates the map locally on their device. It also avoids the problem of the “on-demand” workflow’s need for constant internet availability, given that despite the user does not need to have a constant active internet connection in this workflow, they nonetheless may need to be able to connect at any time to retrieve specified map areas; and, due to the nature of their working conditions, they frequently might not have internet availability.
One other key aspect of the application is the user interface that needs to deliver an easy-to-use and integrated data visualization experience for the user to quickly provide situational awareness about field conditions. To meet this requirement, the UI is organized into three areas:
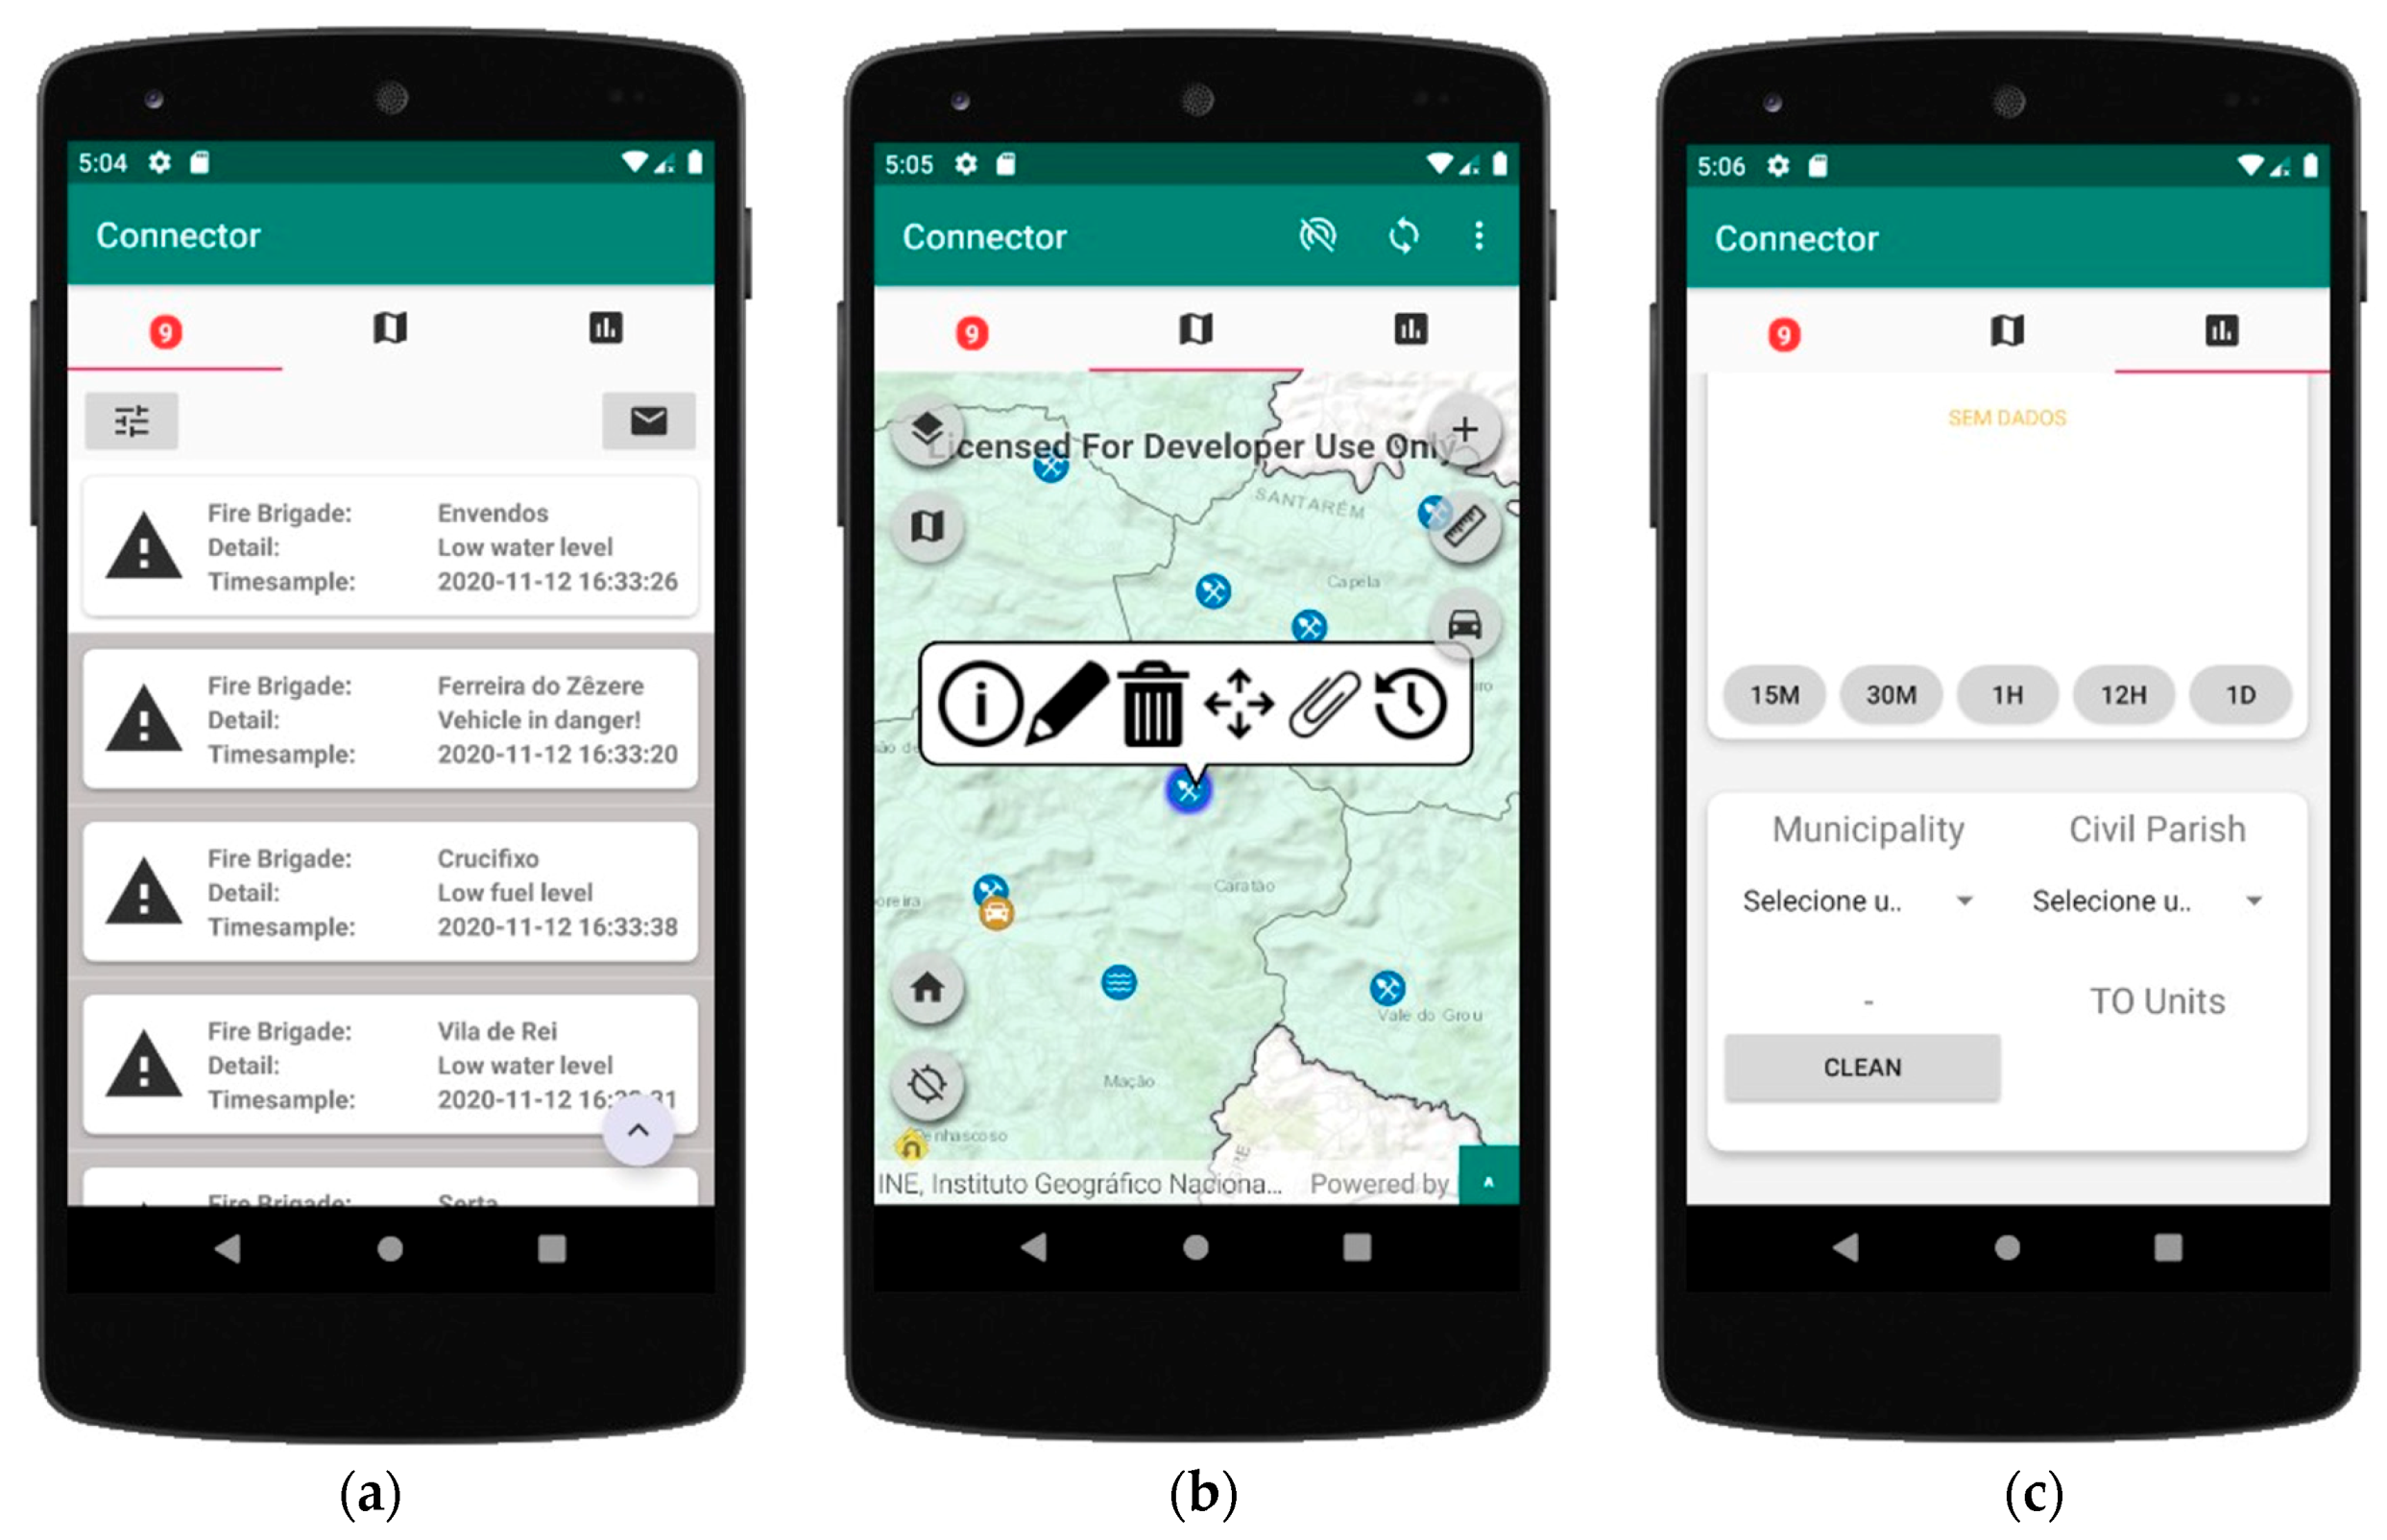
  • Alerts area: allows the user to get access to alerts regarding vehicles in danger or abnormal sensor readings from the multi-sensor device, possibly indicating dangerous situations.
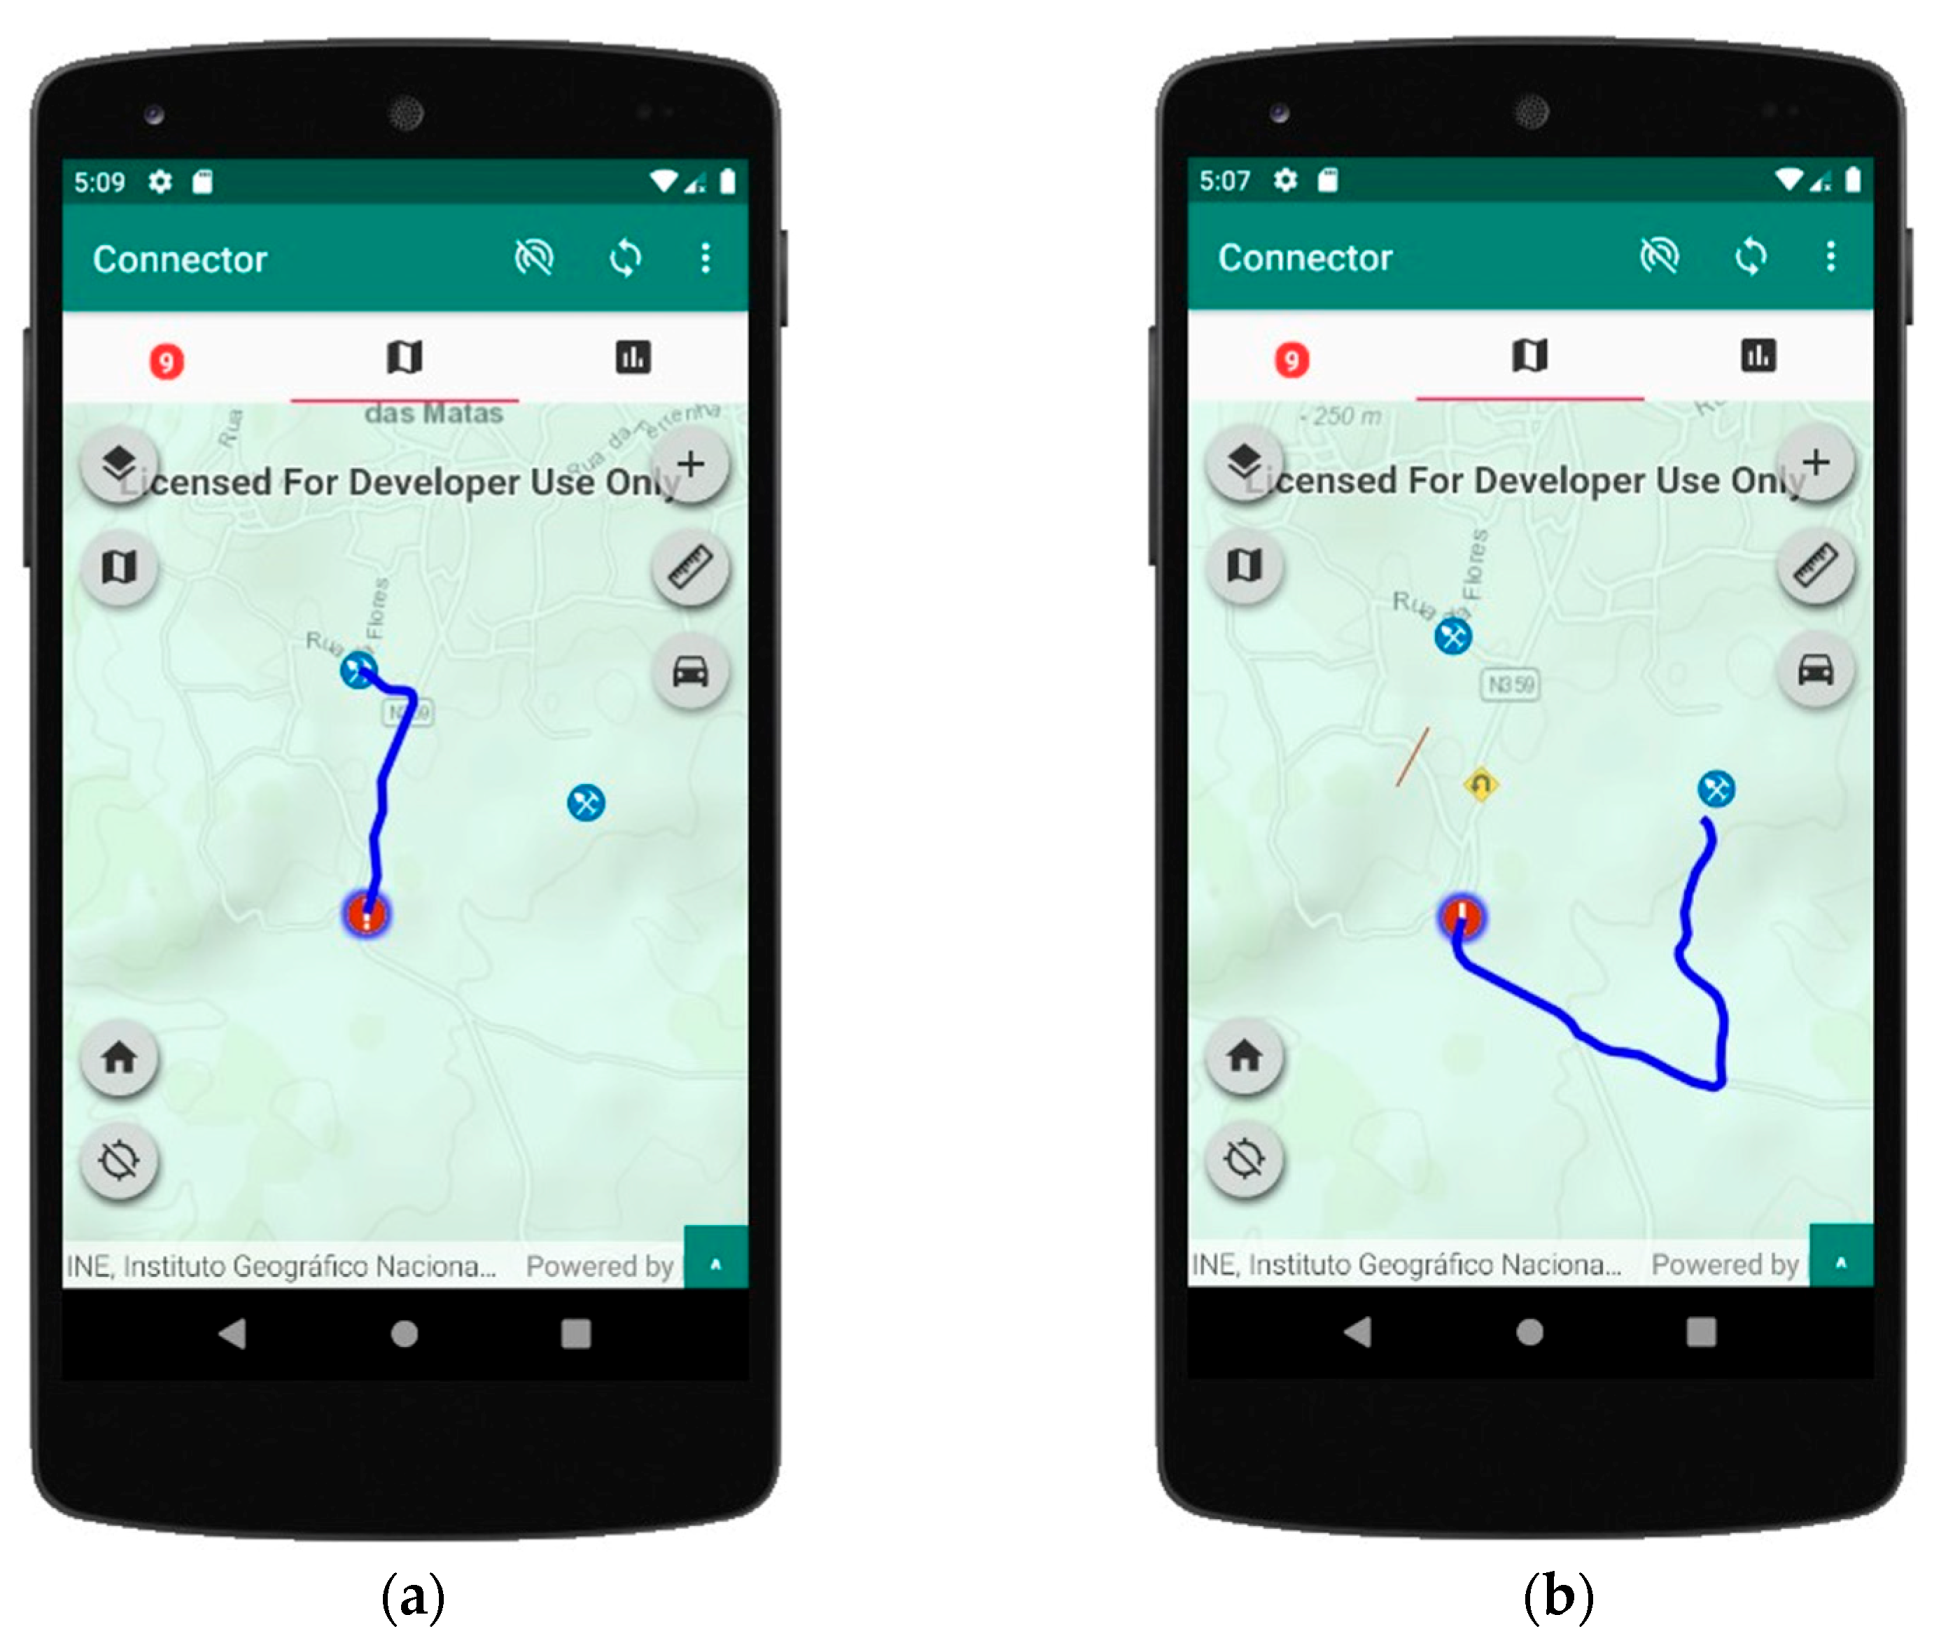
  • Map area: displays a map and provides a set of GIS features that allow the user to manipulate geographical data associated with it, such as adding, editing, or deleting features, adding or removing attachments, generating routes between locations, etc.
  • Data Visualization area: allows the visualization of data associated with features on the map. It is prepared to display data, such as sensor readings, from the multi-sensor device and information about the vehicles associated with features on the map. It also allows for generating some relevant statistics, such as the number of vehicles in a particular county.

3.5. Overview of the Multi-Sensor Device

The multi-sensor device is an important part of the system that provides insight into the current circumstances of the theater of operations. Its main objective is to be able to geolocate firefighting vehicles, whilst monitoring parameters such as temperature, humidity, oxygen and carbon monoxide concentrations inside the vehicle, and the temperature surrounding it. It also has the capability of collecting thermal data to create thermal images by scanning the region affected by a wildfire during aftermath analysis. This device is equipped with multiple sensors and has two main operating modes.
  • Alarm mode: in this operating mode, the multi-sensor device is used to monitor the status of the vehicle equipped, i.e., the O2 and CO levels inside and outside the vehicle, the O2 levels in the engine admission, and the temperatures surrounding the vehicle.
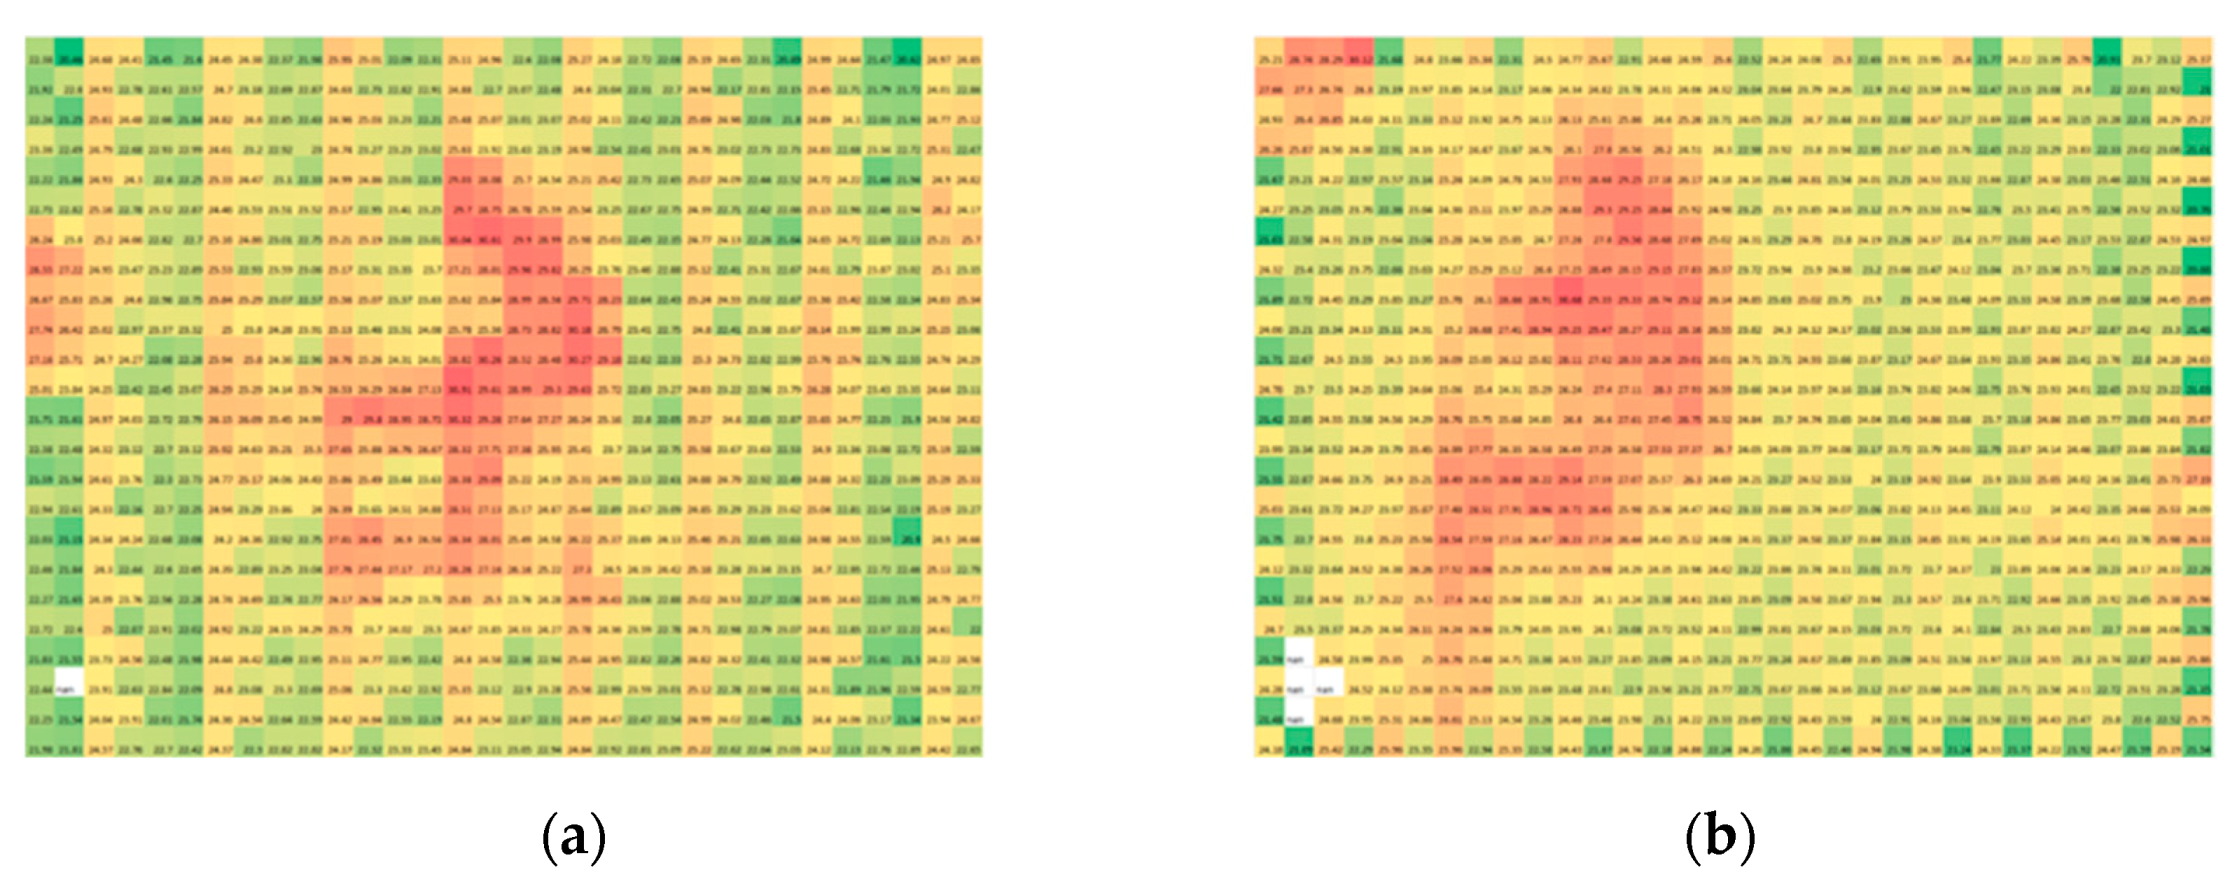
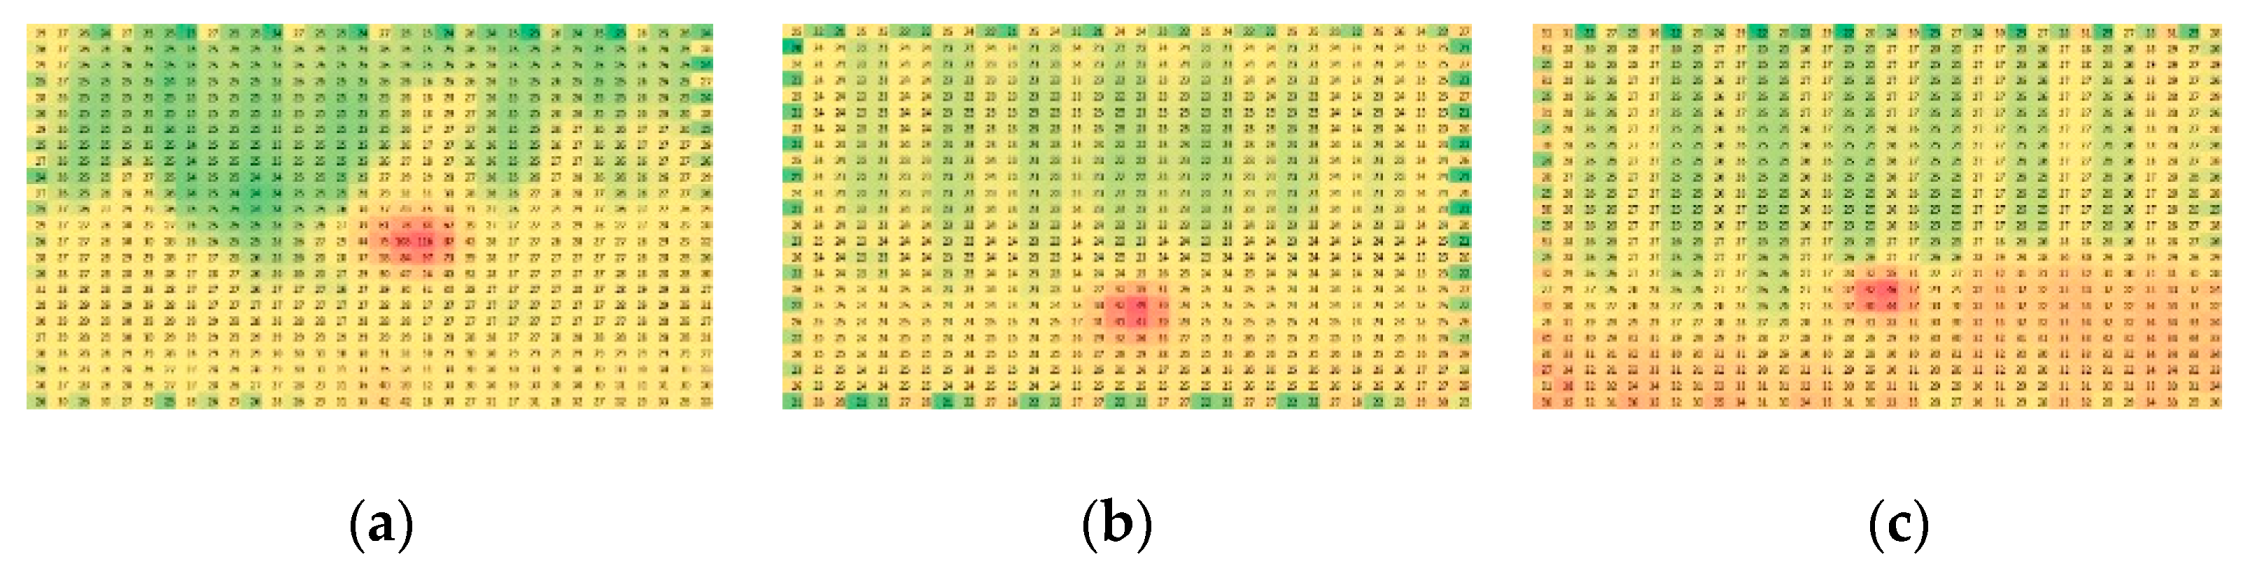
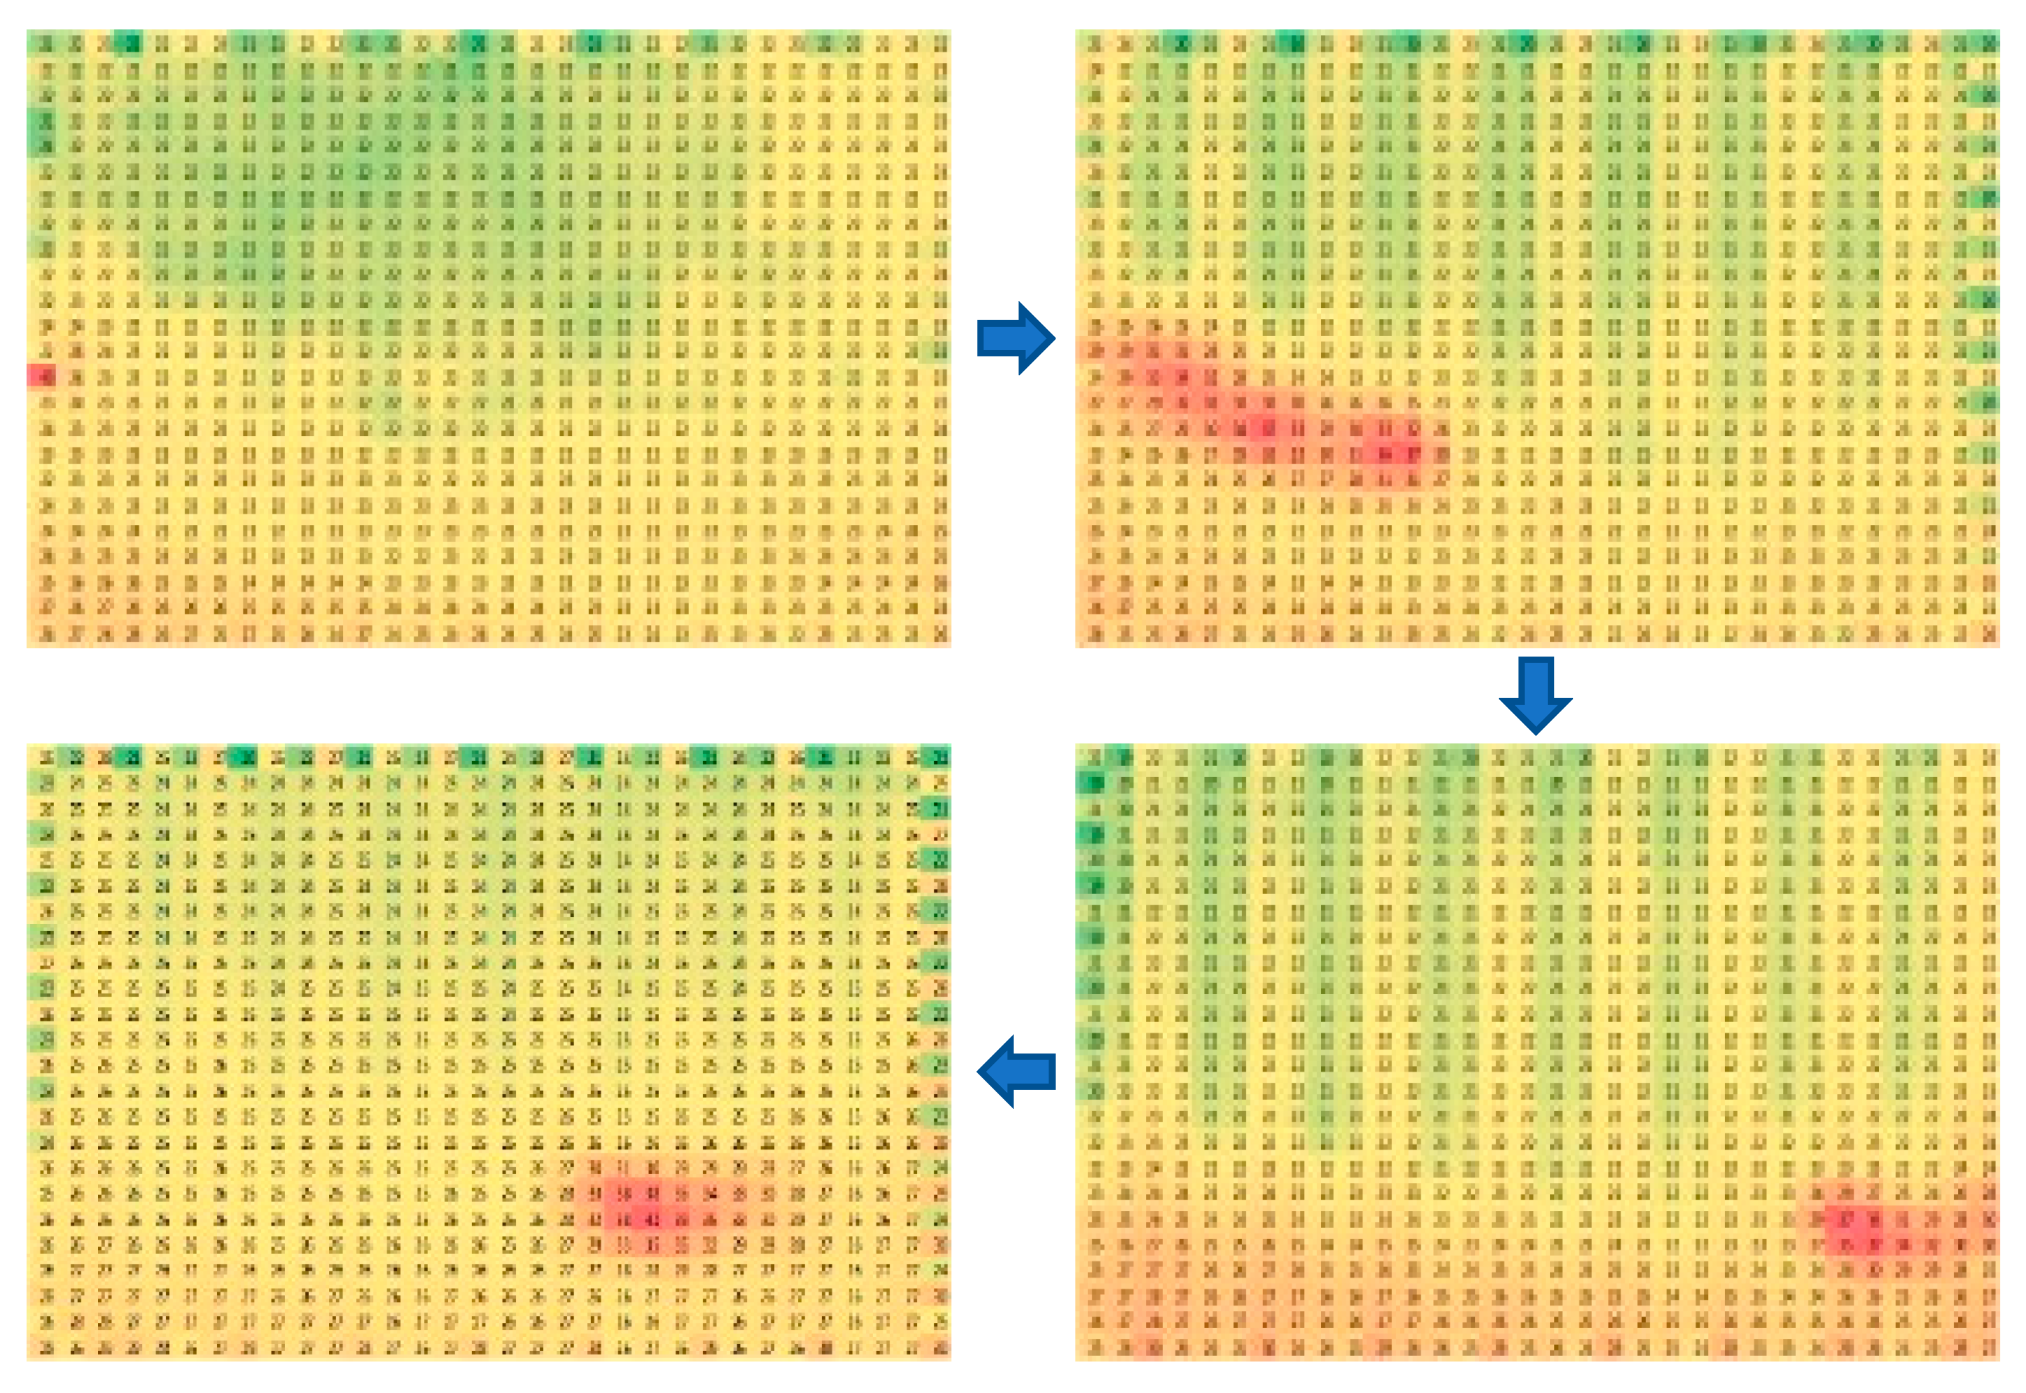
  • Thermal Mapping mode: in this operating mode, the module is used to find reignition spots. It does that by using a multi-pixel thermal IR sensor, capable of providing an array of temperatures that are later used to generate a thermal map of the area it is pointed at.
This module was developed using an ESP32 development board that can be programmed using the Arduino IDE software, allowing easy prototyping and reconfiguration. It communicates with the application via wi-fi by creating a local webserver that provides all the sensor readings. Figure 3 shows the simplified architecture of the multi-sensor device developed.

4. Results and Discussion

4.1. The Application

One of the most important functionalities of the mobile client application is to be able to work offline. In this solution, that functionality was made possible by implementing a geodatabase workflow. When the application starts up, it checks for an existing geodatabase and in case it does not exist, it creates a sync-enabled geodatabase from a sync-enabled previously configured ArcGIS Online feature service. All the work done is saved on the local geodatabase, and, when the user decides to, their work can be synchronized back with the ArcGIS Online feature service that will update its state with the new modifications. The synchronization process can be done either manually or automatically, in pre-defined time intervals that the user can configure in the application settings. This is an essential feature in an environment where internet connectivity may have disruptions, consequently undermining operational response.
A challenge arises in the synchronization process regarding data integrity when two different clients execute changes on the feature service in the same feature. To address this situation, the ArcGIS Runtime SDK itself provides three options regarding the synchronization direction. The first option is called “Upload” where the user sends its changes, overriding any previous data on the feature service. The second option is the “Download” option, where the user overrides whatever work he has done on their device with the data on the feature service. Finally, the third option is called “Bidirectional” where the API itself ensures that the latest data is always propagated in both directions, either from a user’s device to the feature service, or vice-versa. All the above three options are available on the settings page, and it is up to the user and the organization to decide which one is appropriate to be active and for which users.
Concerning the UI, the dimensions of the platform used to run the application dictate how it should be designed to ensure a comprehensive data visualization and seamless user experience. A smartphone has a significantly smaller screen size compared to a tablet, thus many limitations arise in attempting to display data in a readable way. To address this limitation, three tabs were implemented that show each of the three areas mentioned above in the smartphone’s UI. The swipe ability was disabled to not interfere with map interaction on the Map tab, so the tab change is done by clicking on the tab header. Figure 4 shows the UI of the three available tabs.
The left tab, displayed in Figure 4a, refers to the Alerts area. On the tab header, a red circle is displayed with the number of unread alerts so that whenever the user has another tab selected, he is aware of the existence of new alerts without having to be on the Alerts tab. The alerts are displayed in a list, with some basic information made available. The user can press an alert to get more information and a dialog with more details about it is displayed. In this dialog, there is also one button available to center the map on the location of the alert, allowing the user to visualize where it is located and if it is near their location. The features on the map also have a different symbology according to their state, which helps quickly visualize vehicles in danger. Vehicles in an alert state are represented by a red circle with an exclamation point while features on a normal state have a yellow circle with a vehicle icon. Whenever an alert is selected, its background color is changed from grey to white, indicating that it has already been read. The user has the option to mark all alerts as read with the top-right button. The top-left button allows filtering the alerts list, by either county, parish or time interval, restricting the list to only the relevant alerts.
The center tab, displayed in Figure 4b, is related to the Map area. In this tab, an ArcGIS map is displayed with all the relevant Feature Layers from the organization’s feature services. Interaction with the features on the map triggers a popup menu to appear over the selected feature with some available options. The first option lets the user get more information about that feature. When pressed, it redirects the user to the right tab and displays all the information regarding the selected feature. The second option allows the user to edit the data from that feature. This data is then stored on the local file geodatabase and later propagated to ArcGIS Online’s feature services when the application is synced with it. The third option lets the user delete the selected feature. The fourth option allows the change of the feature’s location on the map. The fifth option displays all the selected feature’s photo attachments and allows the user to manage them by either adding new attachments or delete existing ones. To add new photo attachments, the user can choose if he wants to take a new photo with the device’s camera application or to pick an existing one from the gallery app. Finally, the sixth option enables the visualization of historical data regarding the selected feature. It provides the user with the history of the feature’s locations, as well their data at a specific instant in a pre-defined date interval. This is especially important if the user wants to know where a particular vehicle has been during a firefighting operation. By pressing this option, a bottom sheet appears where the user can select either one of the pre-defined time intervals or choose a specific date and time interval. This sheet also provides a seek bar to slide across the selected time interval and query the selected feature’s historical data. In this context, the historical data is only shown to the selected feature, however, this functionality is also available for querying all map features. To enable this, the user must press the bottom-right square button to show the same bottom sheet, but this time to query all the map features instead of only the selected one. Finally, the map UI also provides some buttons to change the basemap and active layers, add features to the map, center the map either to the device’s location or to a pre-defined area, make length and area measurements in the map, and provide routing functionalities that will be further discussed in this article.
The right tab displayed in Figure 4c refers to the Data Visualization area. This tab is divided into several sections that allow the visualization of different types of data. The Section 1 is related to the vehicle’s data, such as its location, the fire brigade it belongs to, and whether it is in an alert state or not. The Section 2 displays the current sensors’ readings from the multi-sensor device, such as the temperature, humidity, and oxygen in the area, and other parameters like available water and fuel levels of the fire truck. The Section 3 is used to display a thermal image. This image is created with the array of temperatures provided by the multi-pixel thermal IR sensor used to find reignition spots. Finally, the Section 4 allows the user to query the number of vehicles by county or by the parish.
One other key functionality of this application is the ability to generate routes between locations with consideration for obstacles that may appear on the road. In the core of this functionality, there is a network dataset that contains a road network of an area of interest. This network dataset was created in the ArcMap and ArcCatalog software based on an OpenStreetMap shapefile dataset, downloaded from the GeoFabrik website. This dataset was edited to extract only the area of the municipality of Mação.
Further work was conducted to correct some topological errors present in the data set that would prevent the creation of the network dataset. To provide the network dataset to the client application, there were two options to be considered: the first option was to provide it through a web service that would require an internet connection upon its use; the second option was to be available through a geodatabase on the device. Considering the nature of the circumstances, wherein internet connectivity may not always be available, the second option was selected, thus the network dataset was created and provided through a geodatabase to be stored on the local device’s storage.
The application provides two main functionalities that make use of the network dataset. The first one lets the user find the closest water supply spot on the map relative to their location. During firefighting operations, sometimes vehicles may run out of water and thus it is essential to know where to resupply in order to quickly resume the operation. These water supply spots are represented in a particular Feature Layer and classified as either fixed water supply, which includes lakes, damns or reservoirs, or mobile water supply, which includes pump trucks. Time is a critical component of a successful firefighting operation, so if a vehicle takes too long to resupply, the fire may gain some significant ground and represent a larger threat; therefore, a vehicle must be able to find the closest route to the nearest water supply. To generate a route in a reliable way, it is important to consider that sometimes obstacles may appear on the road such as fallen trees, and these shall have a representation on the map to be considered upon the route generation process. To achieve this, a particular Feature Layer was designated to contain the obstacles that may appear on the road, and, it is used, to calculate the closest new route. Figure 5 displays two different scenarios of the use of the closest water supply route generation functionality, where the presence of an obstacle may yield very different results.
In Figure 5 the impact of obstacles on route generation is evident. In the first scenario represented in Figure 5a, the closest water supply functionality is executed, resulting in the shortest route to that water supply being displayed on the screen, whereas in the second scenario visible in Figure 5b, the same functionality yields a different result based on the existence of obstacles in the road, represented as the yellow rhombus and red line. This may have a significant impact since the closest route may resort to an unavailable road, and thus, if not taken into consideration, may result in a significant amount of time lost before continuing the operation, or even in putting the vehicles and their passengers in dangerous situations.
It is important to address that all the functionalities previously discussed, as well as the data provided by the multi-sensor device, may not be all significant to a particular user, thus different accesses can be created to only provide the functionalities and data needed for certain user demands. Three different profiles can be thought of for this application, which includes a “Commander” profile, where the user has access to all the functionalities and data available on the device; a “Scout” profile, for users responsible for gathering information in the aftermath of a fire to assess, for instance, possible reignition spots, thus having to focus more on the GIS functionalities and multi-sensor device data, in particular, than thermal data; and an “Operator” profile, tailored to individuals that operate land clearing tractors, who may need minor access to GIS functionalities but have a more significant demand for the multi-sensor device data, particularly to the oxygen sensor data and alarm mode, since they may work in conditions where this gas level may experience a significant decrease.

4.2. The Multi-Sensor Device

A multi-sensor device was developed to provide important local data to the system. The ESP32 development board was used as the microcontroller that reads the data from the sensors and provides it over a local webserver to be requested by the application. This node currently hosts a temperature and humidity sensor, a GNSS receiver to acquire the device’s location, a CO sensor to measure this gas concentration, and IR sensors to measure the surrounding temperature.
Validation of the multi-sensor device focused on assessing the reliability of the multi-pixel IR thermal sensor. This sensor produces 768 temperature values organized in a 24 × 32 matrix that go through a first phase of pre-processing. Firstly, a non-uniform mean filter is applied to smoothen the data. This type of filter gives greater weight to pixels closer to the center and less wait to the border pixels, which turn out to be more susceptible to noise. This process resulted in a more homogeneous image.
A second phase of pre-processing aimed to solve the issue of NaN values that are visible on the bottom-left corner in Figure 6. To address this problem, whenever the algorithm detects the presence of NaN values in a pixel of the array, it will replace that pixel value with the mean value of the sum of the pixel values above and below that pixel. After the pre-processing phase is conducted, the sensor was put to test in a prepared scenario with a barbecue fire.
In the initial phase of the test, the objective was to validate the detection of heat sources without moving. Measurements were taken at three different distances to assess the impact of distance on the quality of data. In Figure 7, the results of this experiment are shown at (a) a distance of 10 m, (b) a distance of 20 m, and (c) a distance of 30 m from the fire.
In this scenario, the impact of distance in the segmentation of the heat source is quite visible. With a greater distance, the heat source becomes less prominent in relation to the background temperature, thus it is harder to identify it.
The second phase of the test focuses on validating the detection of heat sources while moving at different speeds. Three different scenarios were tested, where a car carrying the sensor was moving parallel to the heat source. Figure 8 shows one of the scenarios where the car was moving at 30 km/h at a distance of 20 m from the heat source and the four images were taken targeting the heat source.
The results of this test show that the greater the speed and distance, the more significant the impact on the heat source identification accuracy; nevertheless, it demonstrates that the chosen multi-pixel IR thermal sensor performs well under the test conditions used for the multi-sensor device. Further testing was conducted on the multi-sensor device to assess the proper functioning of the remaining sensors. The last component of its validation was to test the web server that would be created on the ESP32 to provide the sensor data in a JSON format, that would be updated regularly depending on the sampling frequency. The ESP32 was configured to work as an Access Point (AP) to which the device running the client application would connect to and perform GET requests to the webserver to get the sensors’ data. The connection between the multi-sensor device and the device running the client application worked seamlessly, thus validating this system component.

5. Conclusions

Seamless communication between firefighting personnel is essential for a coordinated and effective operational response. A platform infrastructure based on reliable and redundant communication systems, that can ensure a collaborative environment where sharing data and communication can be effectively done, will help a seamless flow of information across its users and allow decision-makers to have a more comprehensive insight into what’s happening on the ground.
Recent technological advancements in remote sensing, multi-sensor technologies, and artificial intelligence open a window of opportunity for tackling major challenges in the prevention, forecasting, mitigation, and suppression of major wildfires.
The firefighting system in Portugal still lacks significant support from technological tools that integrate several scientific areas related to wildfires. Most of these tools are available only in command centers, therefore it is necessary to have an easy-to-use system in place (wildfire locations), capable of integrating scientific knowledge and good fire-fighting practices, to become an important decision support tool to be used by entities involved in fire suppression.
To address this requirement, a system adapted to the Portuguese wildfire reality was proposed to be the first step in the integration of several modules that seek to support informed decisions. This system leverages existing robust GIS technology and integrates new functionalities that turn it into an important tool for helping to manage firefighting assets on the field and enable a fast and accurate situational awareness about circumstances related to wildfires. Moreover, it provides accurate information and intelligence to the commanders-in-chief before they make tactical decisions. The proposed system provides a set of maps that are used for communicating operational assignments and potential spread scenarios, considered as an important visual reference to the personnel located at the command centers.
As part of this system, a mobile client application was developed that integrates GIS functionalities to allow the manipulation of geographical data. A route-generating functionality was also implemented that allows the user to get the closest path between multiple locations and the closest water supply location relative to the user’s position. Furthermore, dashboards were implemented to enable a comprehensive visualization of operational data. This application lets the user to work in a mixed online and offline environment, thus not undermining the operational response.
A feature service was created that intermediates the access from the users to the operational data stored on ArcGIS Online. It allows the creation of a multi-client collaborative environment, where every user can co-operate by sharing operational data across the system through the mobile client application, in near real-time.
Finally, a multi-sensor device was designed to host multiple sensors that give insight into weather conditions and the firefighting asset status on the field. This data gives the insight to assess the situation in the field and can be leveraged for more accurate fire propagation simulations.
One of the key innovative aspects of the proposed system compared to the existing solutions studied is the integration of real-time sensor data coming from the local occurrences. This is critical to assess the situation in the field, and provide important data for FSP, which can account for the potential microclimate created by wildfires. This is also essential to ensure accurate predictions that can support decision-making.
In the future, we expect to implement more functionalities and integrate external services that will increase the utility of this DSS. We also plan on improving the network dataset to dynamically adjust to the vehicle type and dimensions, which will yield different routes according to road characteristics. A new fire georeferencing functionality is being developed that will enable users to automatically georeference wildfires using their smartphones/tablets. By leveraging citizen involvement in fire detection, we can contribute to building resilient and involved communities that help mitigate social, economic, and ecological losses, thus we will explore the use of crowdsourcing and citizen science in this functionality.
Finally, we will be conducting field testing after the wildfire season in the Médio-Tejo region and demonstrate it as a scalable platform that can be extended to the entire Portuguese main territory.
The preliminary validation results demonstrated that a robust system was achieved with fully interoperable components that fulfill the defined system requirements.

Author Contributions

Conceptualization, Miguel Lourenço, Luís B. Oliveira, João P. Oliveira, André Mora, Henrique Oliveira and Rui Santos; methodology, Miguel Lourenço, Luís B. Oliveira, and Henrique Oliveira; software, Miguel Lourenço and Henrique Oliveira; validation, Miguel Lourenço, Luís B. Oliveira, André Mora, Henrique Oliveira and Rui Santos; formal analysis, Miguel Lourenço, Luís B. Oliveira, João P. Oliveira, André Mora, Henrique Oliveira and Rui Santos; investigation, Miguel Lourenço, Luís B. Oliveira, João P. Oliveira, André Mora, and Henrique Oliveira; resources, Luís B. Oliveira, Henrique Oliveira and Rui Santos; data curation, Miguel Lourenço and Henrique Oliveira; writing—original draft preparation, Miguel Lourenço, Luís B. Oliveira, André Mora and Henrique Oliveira; writing—review and editing, Miguel Lourenço, Luís B. Oliveira, João P. Oliveira, André Mora, Henrique Oliveira and Rui Santos; supervision, Luís B. Oliveira, João P. Oliveira, André Mora, Henrique Oliveira and Rui Santos; project administration, Luís B. Oliveira, André Mora and Henrique Oliveira; funding acquisition, Luís B. Oliveira, André Mora and Henrique Oliveira. All authors have read and agreed to the published version of the manuscript.

Funding

This work was financially supported by FCT (National Foundation of Science and Technology) within the Research Unit CTS—Centre of Technology and Systems, UIDB/00066/2020, and the Project forester (PCIF/SSI/0102/2017).

Institutional Review Board Statement

Not applicable.

Informed Consent Statement

Not applicable.

Data Availability Statement

All data and materials in this article can be obtained by contacting the corresponding author, Henrique Oliveira ([email protected]).

Acknowledgments

We would like to thank the authorities from the municipality of Mação, in particular to Engineer António Louro, for the valuable support in establishing the user requirements and the feedback for the system’s validation. Special thanks to the Adjunct of National Operations in the National Command of Security Operations (CNOS) part of the National Authority of Civil Protection (ANPC) Alexandre Penha, for their input in the early stages of this work.

Conflicts of Interest

The authors declare no conflict of interest.

References

  1. Why GIS Is Important for Fire and EMS Agencies. [ebook] ESRI. 2021. Available online: https://www.esri.com/en-us/lg/industry/public-safety/fire-service-ebook (accessed on 22 May 2021).
  2. PORDATA—Rural Fires and Burnt Area—Mainland. Available online: https://www.pordata.pt/en/Portugal/Rural+fires+and+burnt+area+-+Mainland-1192 (accessed on 22 May 2021).
  3. Ferreira-Leite, F.; Ganho, N.; Bento-Gonçalves, A.; Botelho, F. Iberian atmospheric dynamics and large forest fires in mainland Portugal. Agric. For. Meteorol. 2017. [Google Scholar] [CrossRef]
  4. Chuvieco, E.; Mouillot, F.; van der Werf, G.R.; San Miguel, J.; Tanase, M.; Koutsias, N.; García, M.; Yebra, M.; Padilla, M.; Gitas, I.; et al. Historical background and current developments for mapping burned area from satellite Earth observation. Remote Sens. Environ. 2019, 225, 45–64. [Google Scholar] [CrossRef]
  5. Pereira-Pires, J.E.; Aubard, V.; Ribeiro, R.A.; Fonseca, J.M.; Silva, J.M.N.; Mora, A. Semi-Automatic Methodology for Fire Break Maintenance Operations Detection with Sentinel-2 Imagery and Artificial Neural Network. Remote Sens. 2020, 12, 909. [Google Scholar] [CrossRef] [Green Version]
  6. Pultar, E.; Raubal, M.; Cova, T.J.; Goodchild, M.F. Dynamic GIS Case Studies: Wildfire Evacuation and Volunteered Geographic Information. Trans. GIS 2009. [Google Scholar] [CrossRef]
  7. Smith, A.K.; Dragićević, S. A four-dimensional agent-based model: A case study of forest-fire smoke propagation. Trans. GIS 2019. [Google Scholar] [CrossRef]
  8. Diretiva Operacional Nacional. Dispositivo Especial de Combate a Incêndios Rurais 2021. Available online: http://www.prociv.pt/bk/PROTECAOCIVIL/LEGISLACAONORMATIVOS/OUTROSNORMATIVOSDIRETIVAS/Documents/DON_2_DECIR_2021.pdf (accessed on 29 June 2021).
  9. Filkov, A.; Duff, T.; Penman, T. Improving Fire Behaviour Data Obtained from Wildfires. Forests 2018, 2, 81. [Google Scholar] [CrossRef] [Green Version]
  10. Beighley, M.; Hyde, A. Portugal Wildfire Management in a New Era: Assessing Fire Risks, Resources and Reforms 2018. Available online: https://www.isa.ulisboa.pt/files/cef/pub/articles/2018-04/2018_Portugal_Wildfire_Management_in_a_New_Era_Engish.pdf (accessed on 29 June 2021).
  11. Pereira, M.G.; Trigo, R.M.; da Camara, C.C.; Pereira, J.M.; Leite, S.M. Synoptic patterns associated with large summer forest fires in Portugal. Agric. For. Meteorol. 2005, 129, 11–25. [Google Scholar] [CrossRef]
  12. Trigo, R.M.; Sousa, P.M.; Pereira, M.G.; Rasilla, D.; Gouveia, C.M. Modelling wildfire activity in Iberia with different atmospheric circulation weather types. Int. J. Climatol. 2016, 36, 2761–2778. [Google Scholar] [CrossRef]
  13. Sakellariou, S.; Tampekis, S.; Samara, F.; Sfougaris, A.; Christopoulou, O. Review of state-of-the-art decision support systems (DSSs) for prevention and suppression of forest fires. J. For. Res. 2017. [Google Scholar] [CrossRef]
  14. Abedi Gheshlaghi, H.; Feizizadeh, B.; Blaschke, T.; Lakes, T.; Tajbar, S. Forest fire susceptibility modeling using hybrid approaches. Trans. GIS 2021, 25, 311–333. [Google Scholar] [CrossRef]
  15. Zhu, L.; Song, W.; Li, Q. Construction of Emergency Decision System Based on GIS. In Proceedings of the 2009 Pacific-Asia Conference on Knowledge Engineering and Software Engineering, Shenzhen, China, 19–20 December 2009; pp. 171–174. [Google Scholar] [CrossRef]
  16. Kalabokidis, K.; Athanasis, N.; Gagliardi, F.; Karayiannis, F.; Palaiologou, P.; Parastatidis, S.; Vasilakos, C. Virtual Fire: A web-based GIS platform for forest fire control. Ecol. Inform. 2013, 16, 62–69. [Google Scholar] [CrossRef]
  17. Kalabokidis, K.; Ager, A.; Finney, M.; Athanasis, N.; Palaiologou, P.; Vasilakos, C. AEGIS: A Wildfire Prevention and Management Information System. Nat. Hazards Earth Syst. Sci. 2016, 16, 643–661. Available online: https://www.fs.usda.gov/treesearch/pubs/52996 (accessed on 29 June 2021). [CrossRef] [Green Version]
  18. Noble, P.; Paveglio, T.B. Exploring Adoption of the Wildland Fire Decision Support System: End User Perspectives. J. For. 2020, 118, 154–171. [Google Scholar] [CrossRef]
  19. Noonan-Wright, E.K.; Opperman, T.S.; Finney, M.A.; Zimmerman, G.T.; Seli, R.C.; Elenz, L.M.; Calkin, D.E.; Fiedler, J.R. Developing the US wildland fire decision support system. J. Combust. 2011. [Google Scholar] [CrossRef]
  20. Calvão, A.R.; Carvalho, F.; Marques, F. Decision support system for forest fires firefighting in Águeda municipality. In Proceedings of the 2015 10th Iberian Conference on Information Systems and Technologies, Aveiro, Portugal, 17–20 June 2015. [Google Scholar] [CrossRef] [Green Version]
  21. MacFire, ESRI StoryMaps, ESRI Portugal. Available online: https://www.arcgis.com/apps/Cascade/index.html?appid=2d2506bde8a943c191544191058be4bc (accessed on 29 June 2021).
  22. Farahmand, A.; Stavros, E.N.; Reager, J.T.; Behrangi, A. Introducing Spatially Distributed Fire Danger from Earth Observations (FDEO) Using Satellite-Based Data in the Contiguous United States. Remote Sens. 2020, 12, 1252. [Google Scholar] [CrossRef] [Green Version]
  23. Bee2FireDetection. Available online: https://www.ceb-solutions.com/products/bee2firedetection/ (accessed on 29 June 2021).
  24. Gandia, A.; Criado, A.; Rallo, M. El Sistema BOSQUE, Alta Tecnologia en Defensa del Medio Ambiente. DYNA 1994, 6, 34–38. [Google Scholar]
  25. Laurenti, A.; Neri, A. Remote Sensing, Communications and Information Technologies for Vegetation Fire Emergencies. In Proceedings of the TIEMEC’96: International Emergency Management and Engineering Conference 1996, Montreal, QC, Canada, 28–31 May 1996. [Google Scholar]
  26. Fernandes, P. Análise dos Incêndios Florestais em Mação num Período de 30 anos. Efeitos no Sequestro de Carbon; Universidade do Algarve: Faro, Portugal, 2018. [Google Scholar]
  27. INE. Censos em Portugal. INE, Instituto Nacional de Estatística: Lisboa, Portugal, 2021. Available online: https://www.ine.pt/xportal/xmain?xpgid=censos21_hist_pt&xpid=CENSOS21&xlang=pt (accessed on 28 June 2021).
  28. Ferreira-Leite, F.; Bento-Gonçalves, A.; Lourenço, L. Grandes incêndios florestais em Portugal Continental. Da história recente à atualidade. Cad. Geogr. 2011, 30–31, 81–86. [Google Scholar] [CrossRef] [Green Version]
  29. ArcGIS Runtime API for Android. Available online: https://developers.arcgis.com/android (accessed on 25 June 2021).
Figure 1. The study area, the municipality of Mação.
Ijgi 10 00497 g001
Figure 2. The architecture of the proposed decision support system.
Ijgi 10 00497 g002
Figure 3. The architecture of the proposed multi-sensor device.
Ijgi 10 00497 g003
Figure 4. The mobile client application UI with three tabs: (a) the alerts area; (b) the map area; (c) and the data visualization area.
Ijgi 10 00497 g004
Figure 5. Demonstration of the closest water supply location functionality: (a) without and (b) with obstacles.
Ijgi 10 00497 g005
Figure 6. The thermal image (a) before and (b) after the pre-processing phase, where a non-uniform mean filter is applied, and the NaN values are removed.
Ijgi 10 00497 g006
Figure 7. Experiment conducted at a distance of (a) 10 m; (b) 20 m; and (c) 30 m, respectively.
Ijgi 10 00497 g007
Figure 8. Experiment conducted at a distance of 20 m from the heat source, moving at 30 km/h. Sequence of four images targeting the heat source: 1st (top-left), 2nd (top-right), 3rd (bottom-right) and 4th (bottom-left).
Ijgi 10 00497 g008
Table 1. A comparative table of existing DSS.
CountryDSSMulti-Sensor SystemsSatellite Image ProcessingFire Spread Simulation
PortugalMacFIREGPS position of vehicles in operationGoogle Earth datano
Ciclopehigh-resolution cameras for detection (visible, infrared)nono
Bee2firedetectionhigh-resolution cameras for detection (visible, infrared); weather monitoringnono
SpainBOSQUEhigh-resolution cameras for detection (visible, infrared)nono
ItalyBSDShigh-resolution cameras for detection (visible, infrared)nono
GermanyFIRE-WATCHhigh-resolution cameras for detection (visible, infrared)nono
USAWFDSShigh-resolution cameras for detection (visible, infrared); weather data and forecastsatellite images, land cover maps fuel condition, before and after firesfire propagation modelling and simulation
AustraliaAIIMShigh-resolution cameras for detection (visible, infrared); GPS position, weather forecast and local observationssatellite images, land cover maps fuel condition, before and after firesfire propagation modelling and simulation
GreeceVirtual-Firehigh-resolution cameras for detection (visible, infrared)satellite images, land cover mapsfire propagation modelling and simulation
Publisher’s Note: MDPI stays neutral with regard to jurisdictional claims in published maps and institutional affiliations.

