
Hotspot Detection and Spatiotemporal Evolution of Catering Service Grade in Mountainous Cities from the Perspective of Geo-Information Tupu


Abstract
:1. Introduction
2. Data and Methods
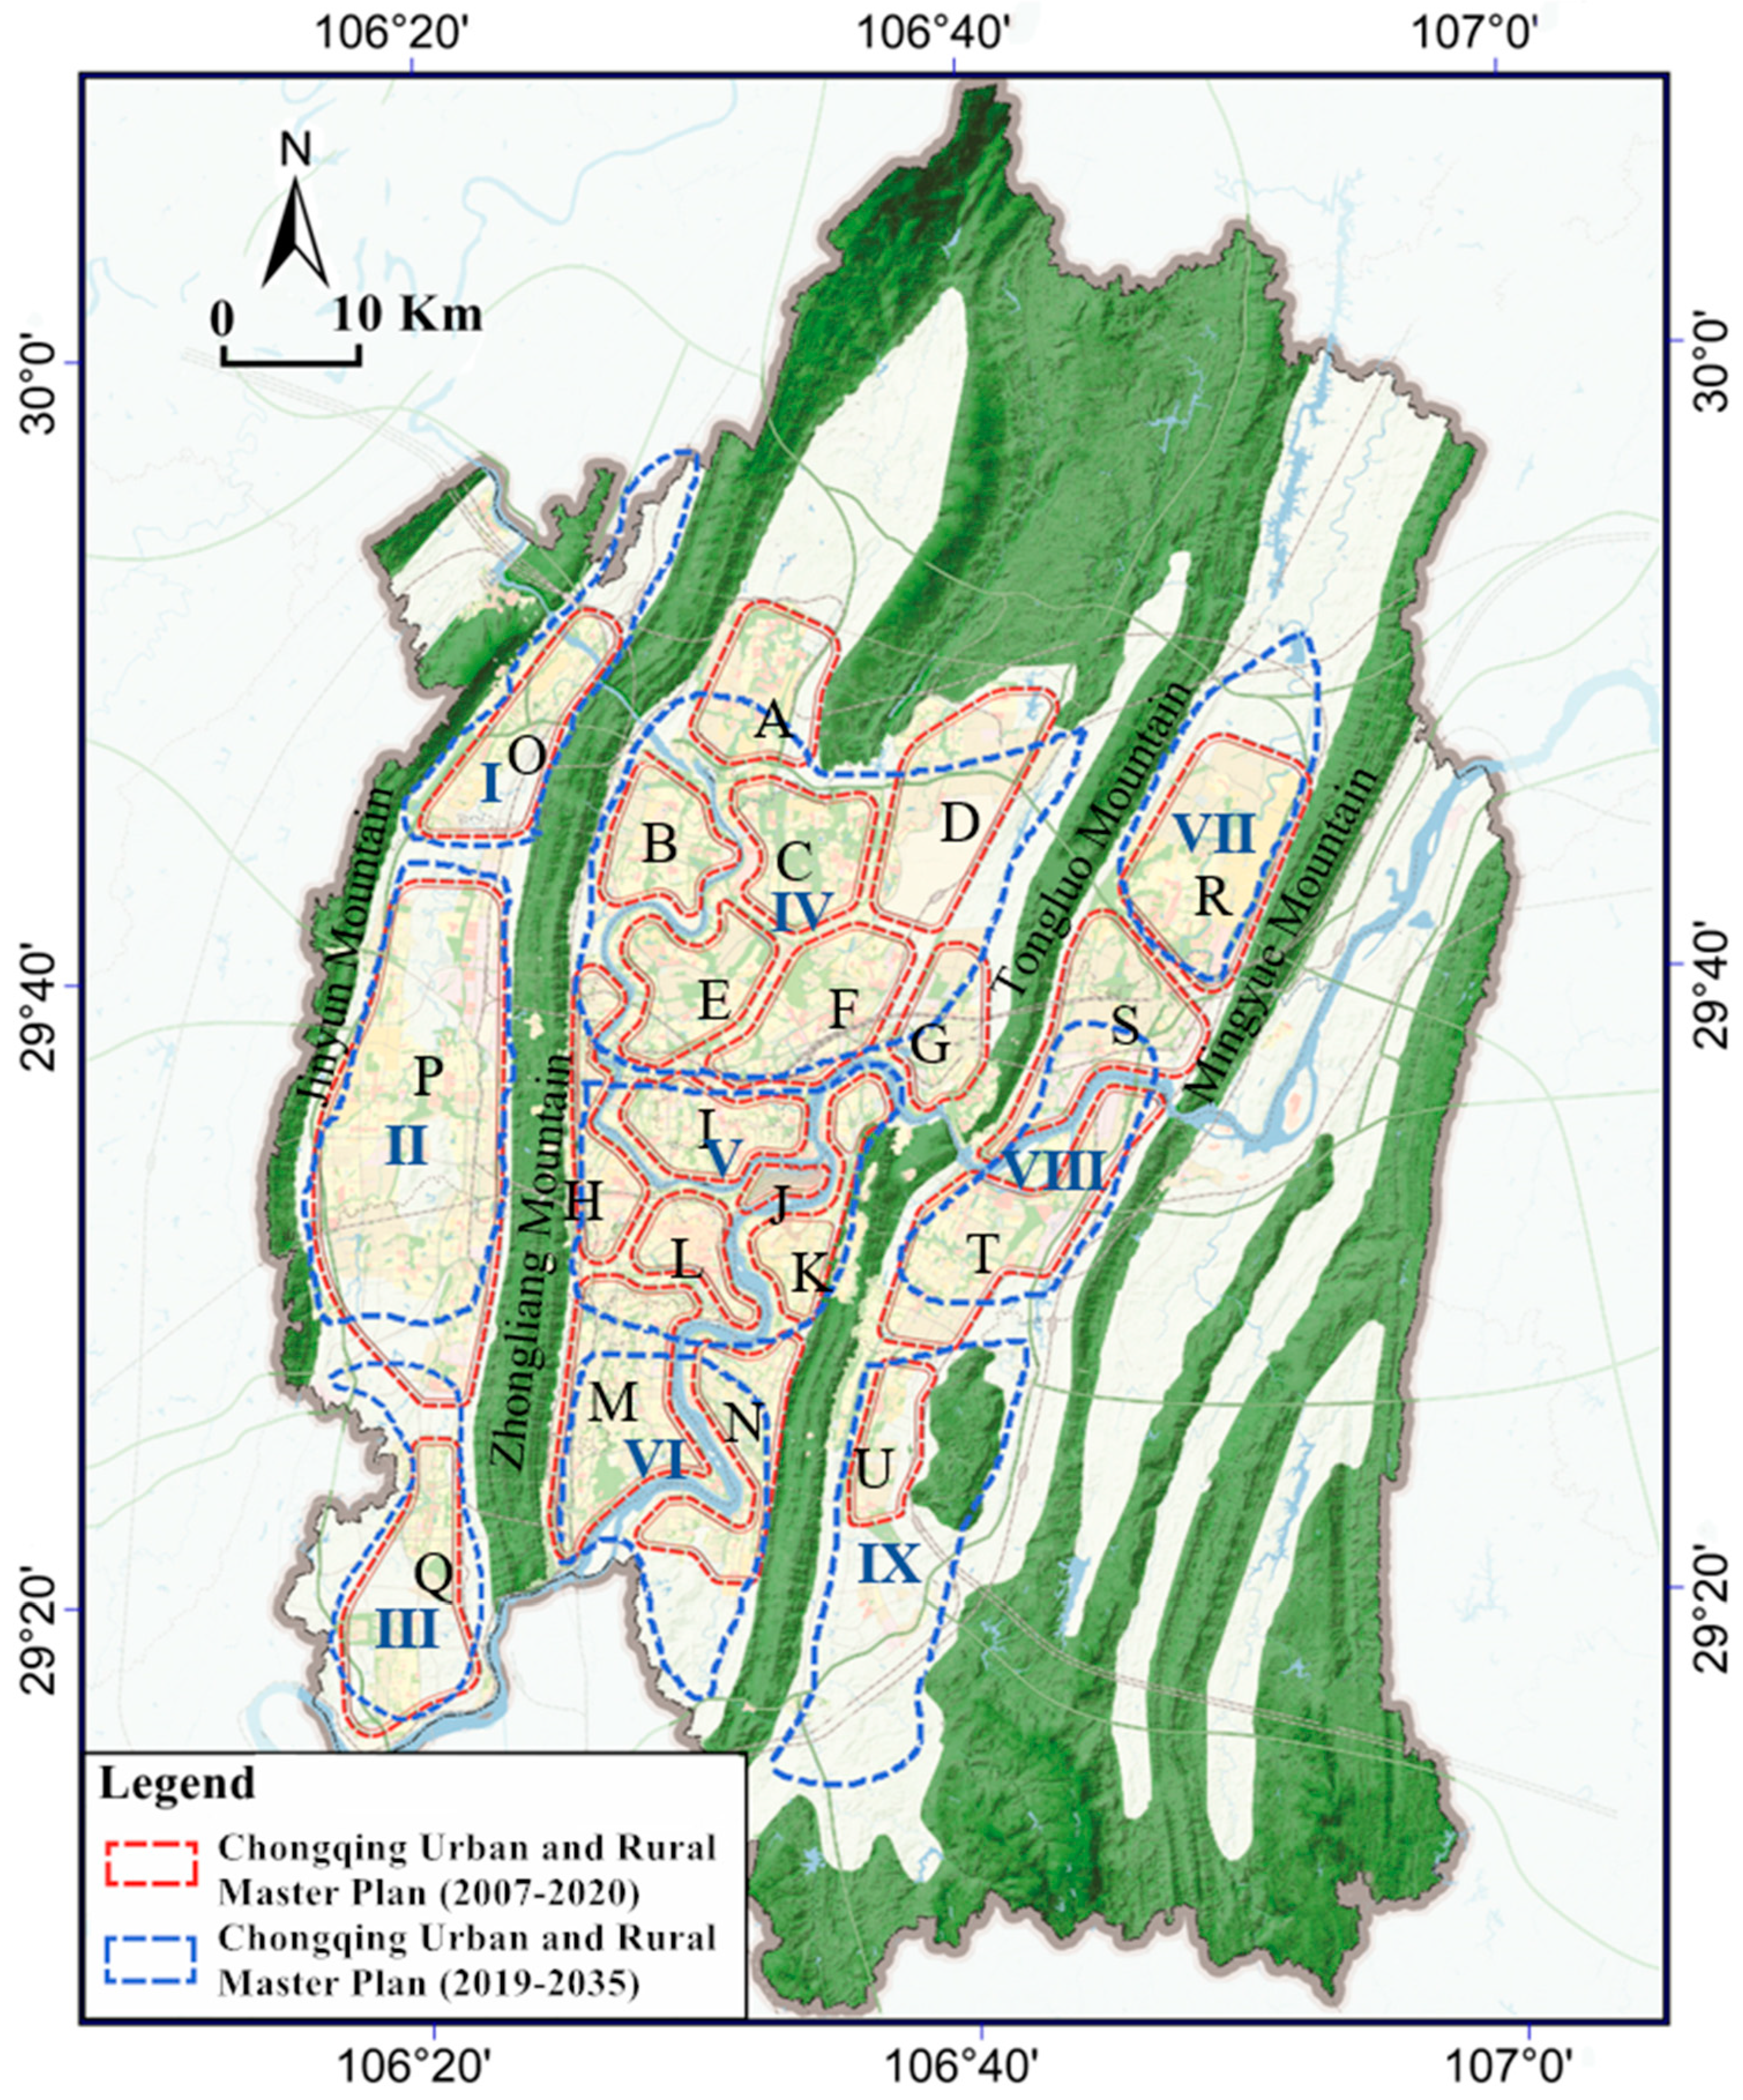
2.1. Study Area
2.2. Data Sources and Processing
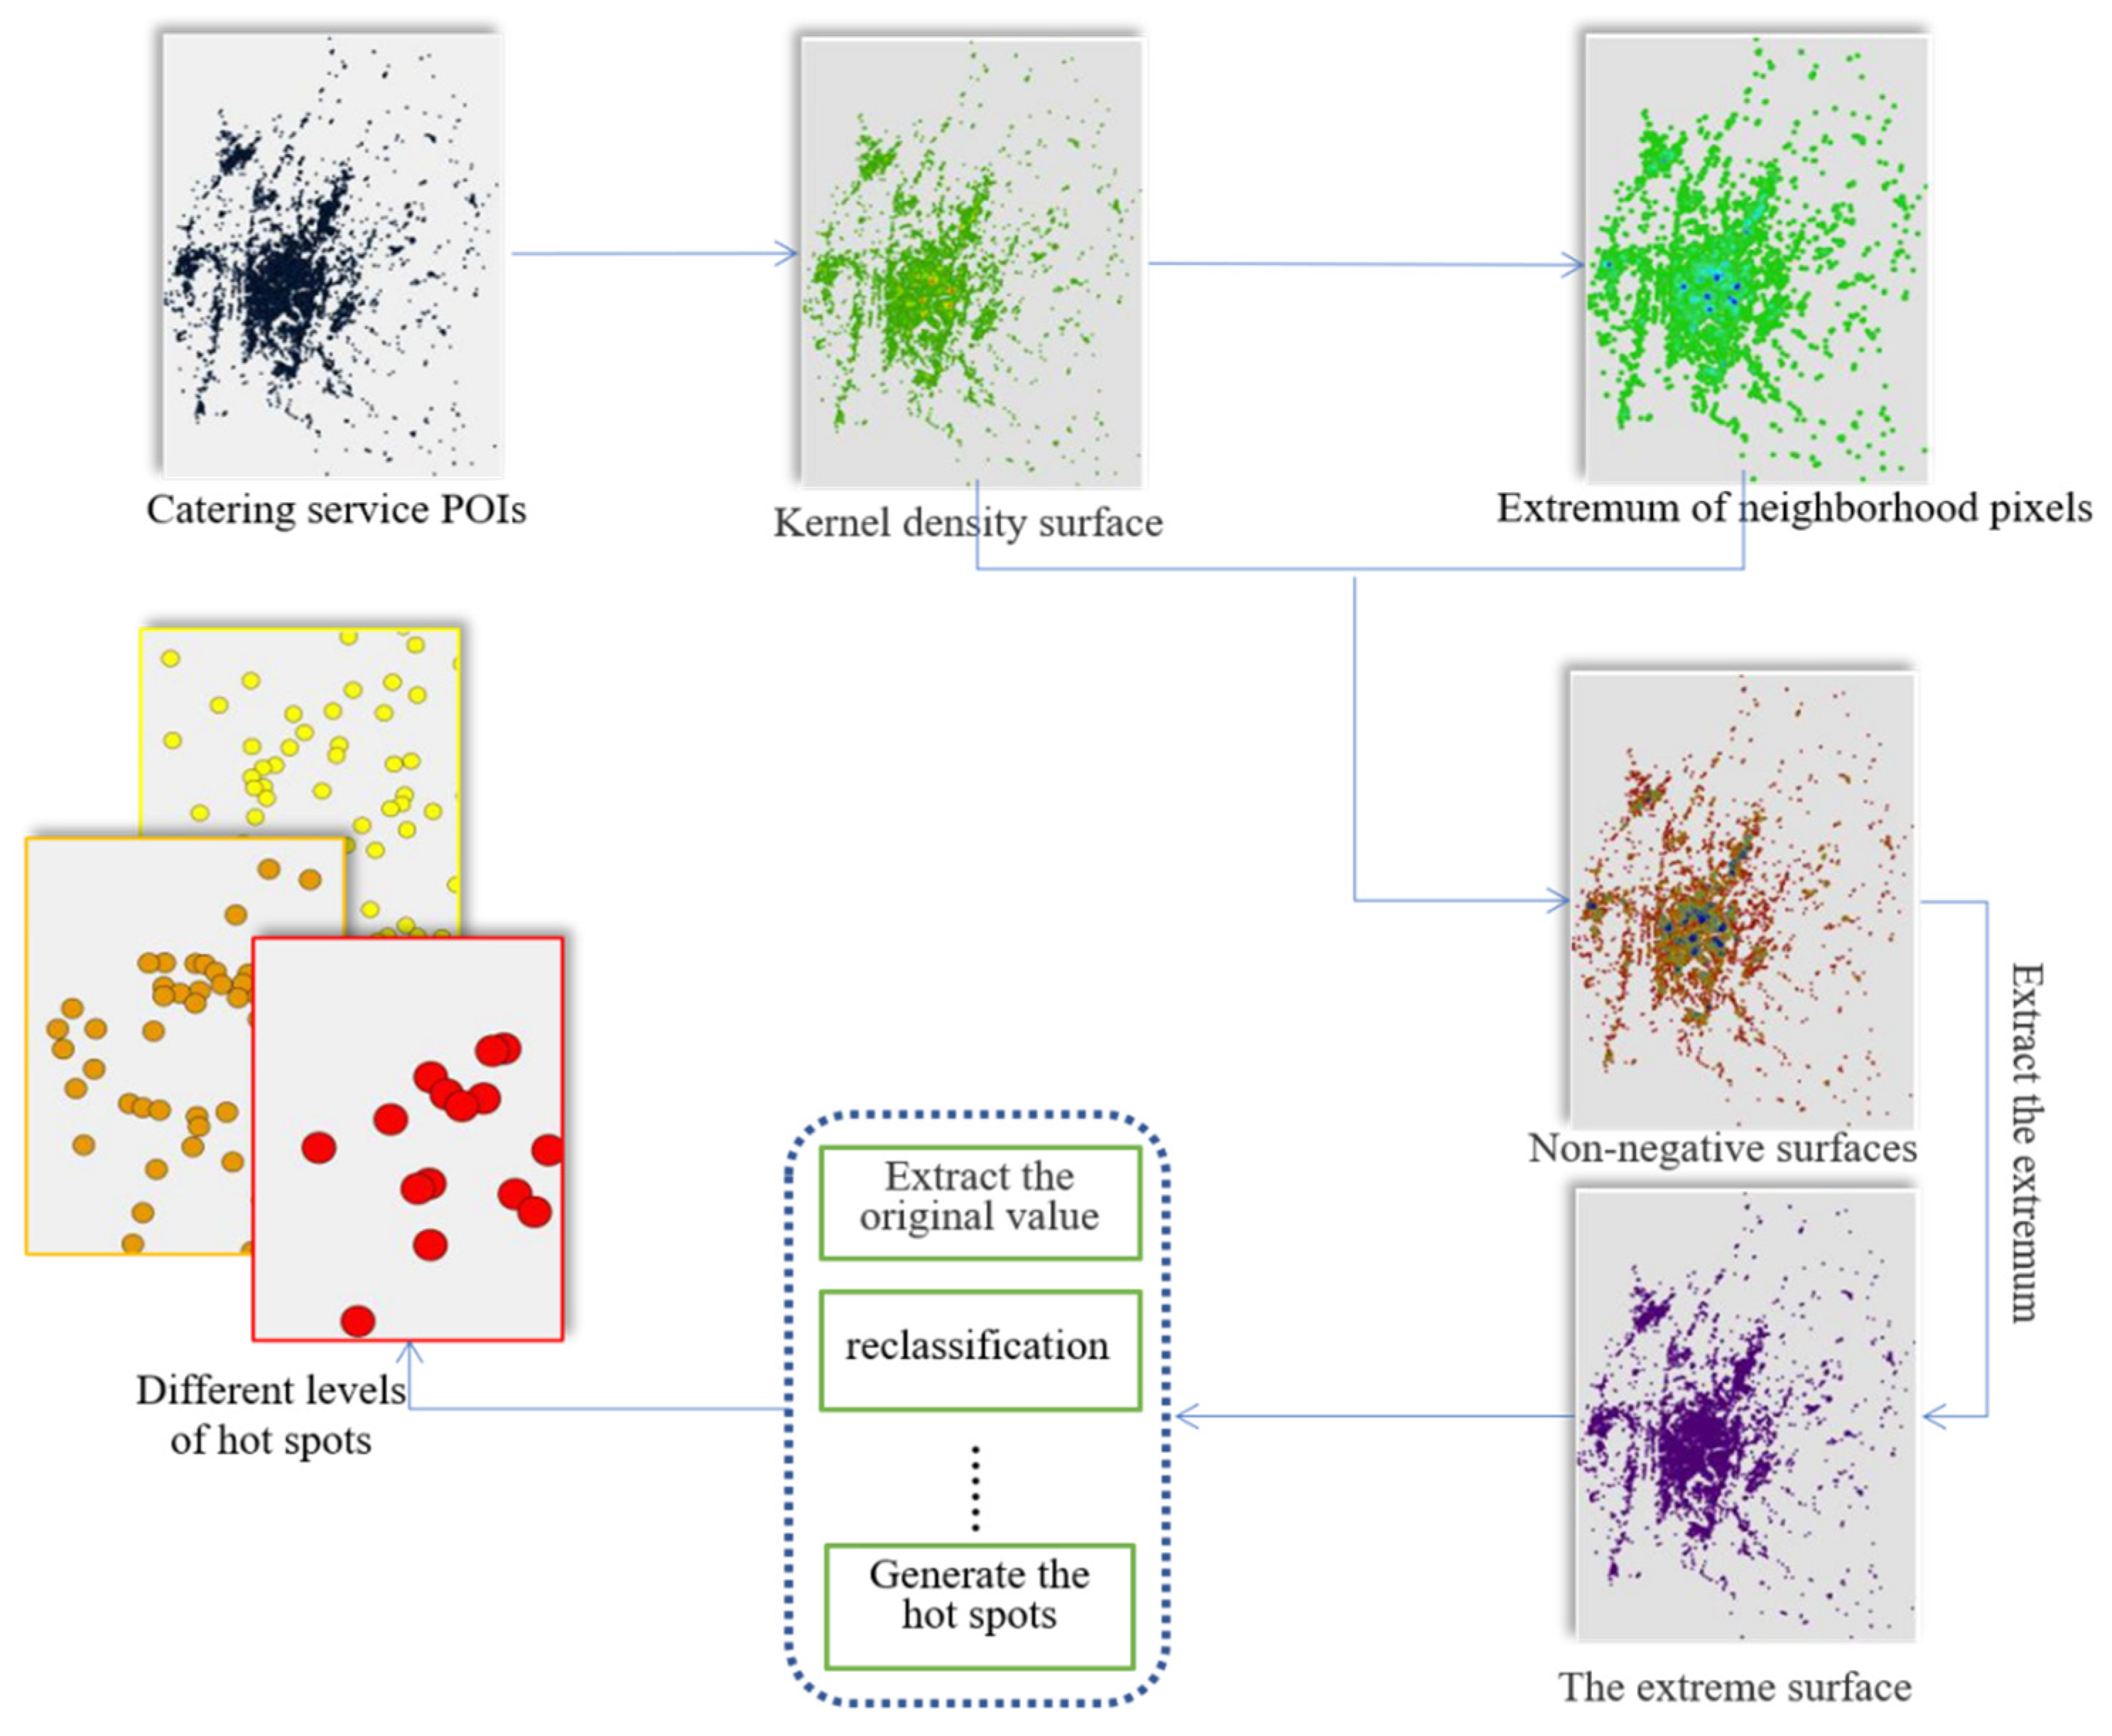
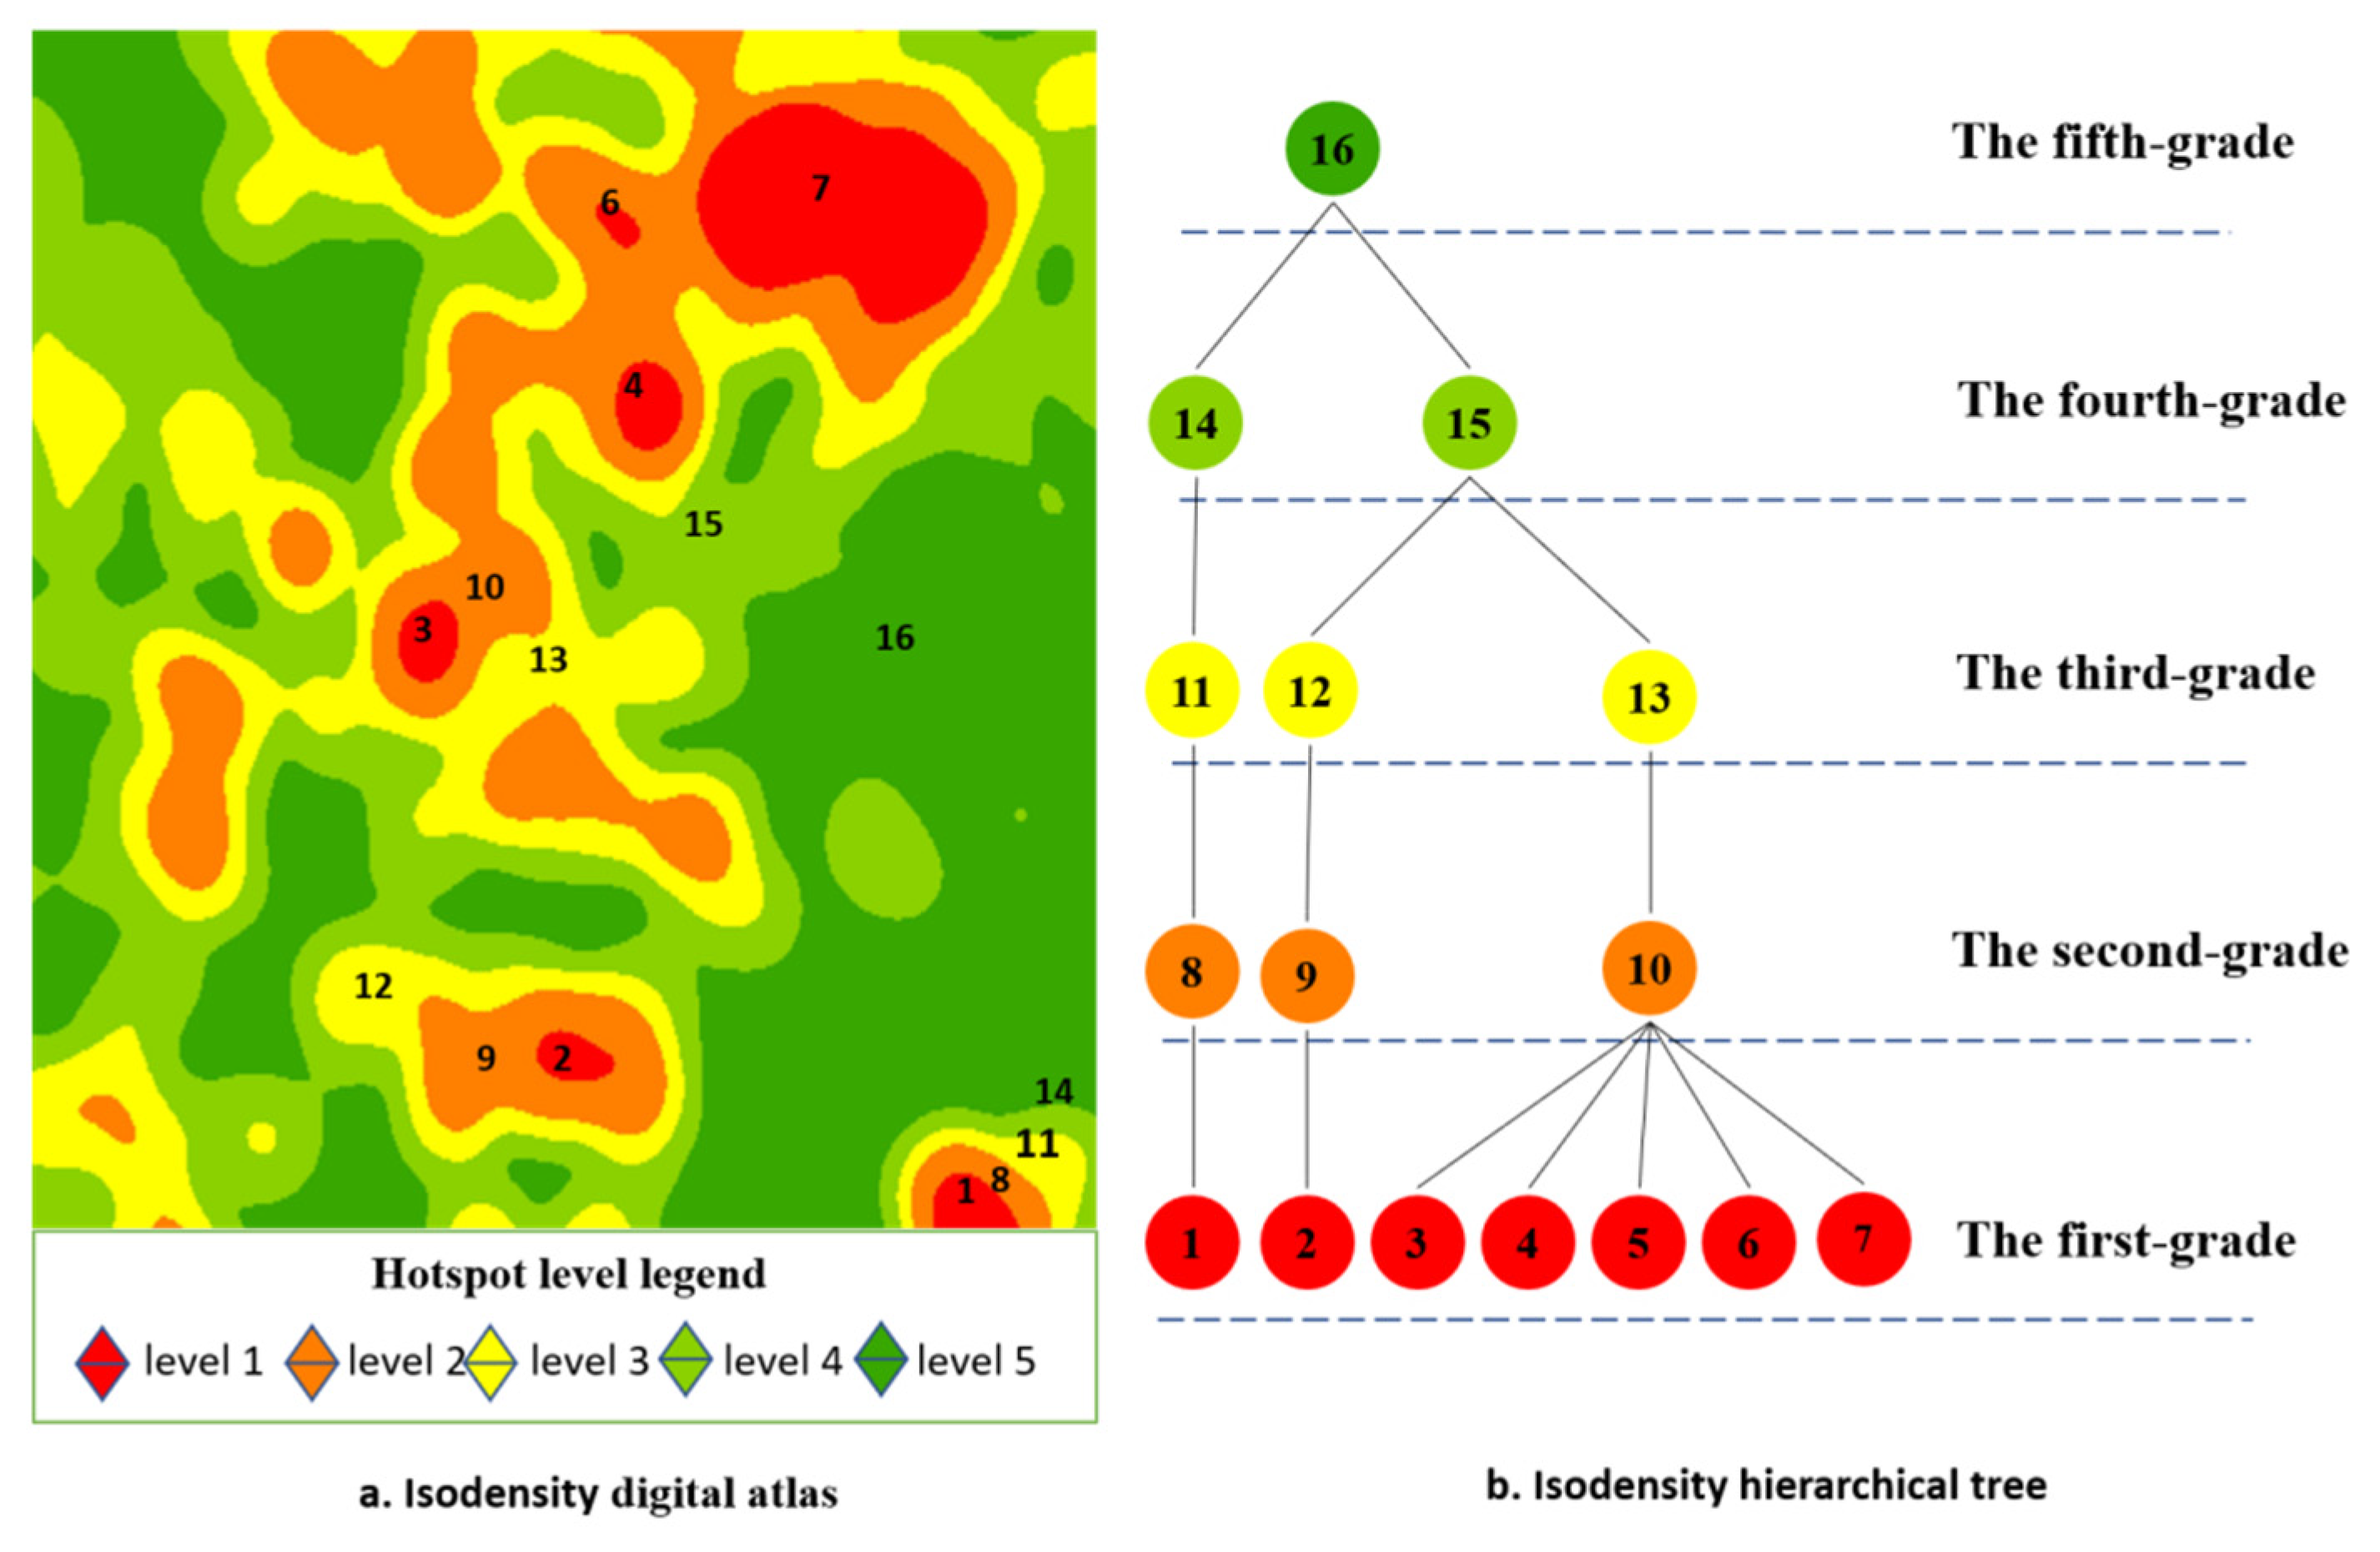
2.3. Construction of Service Hotspot Grade Map
2.3.1. Generation of Density Surface
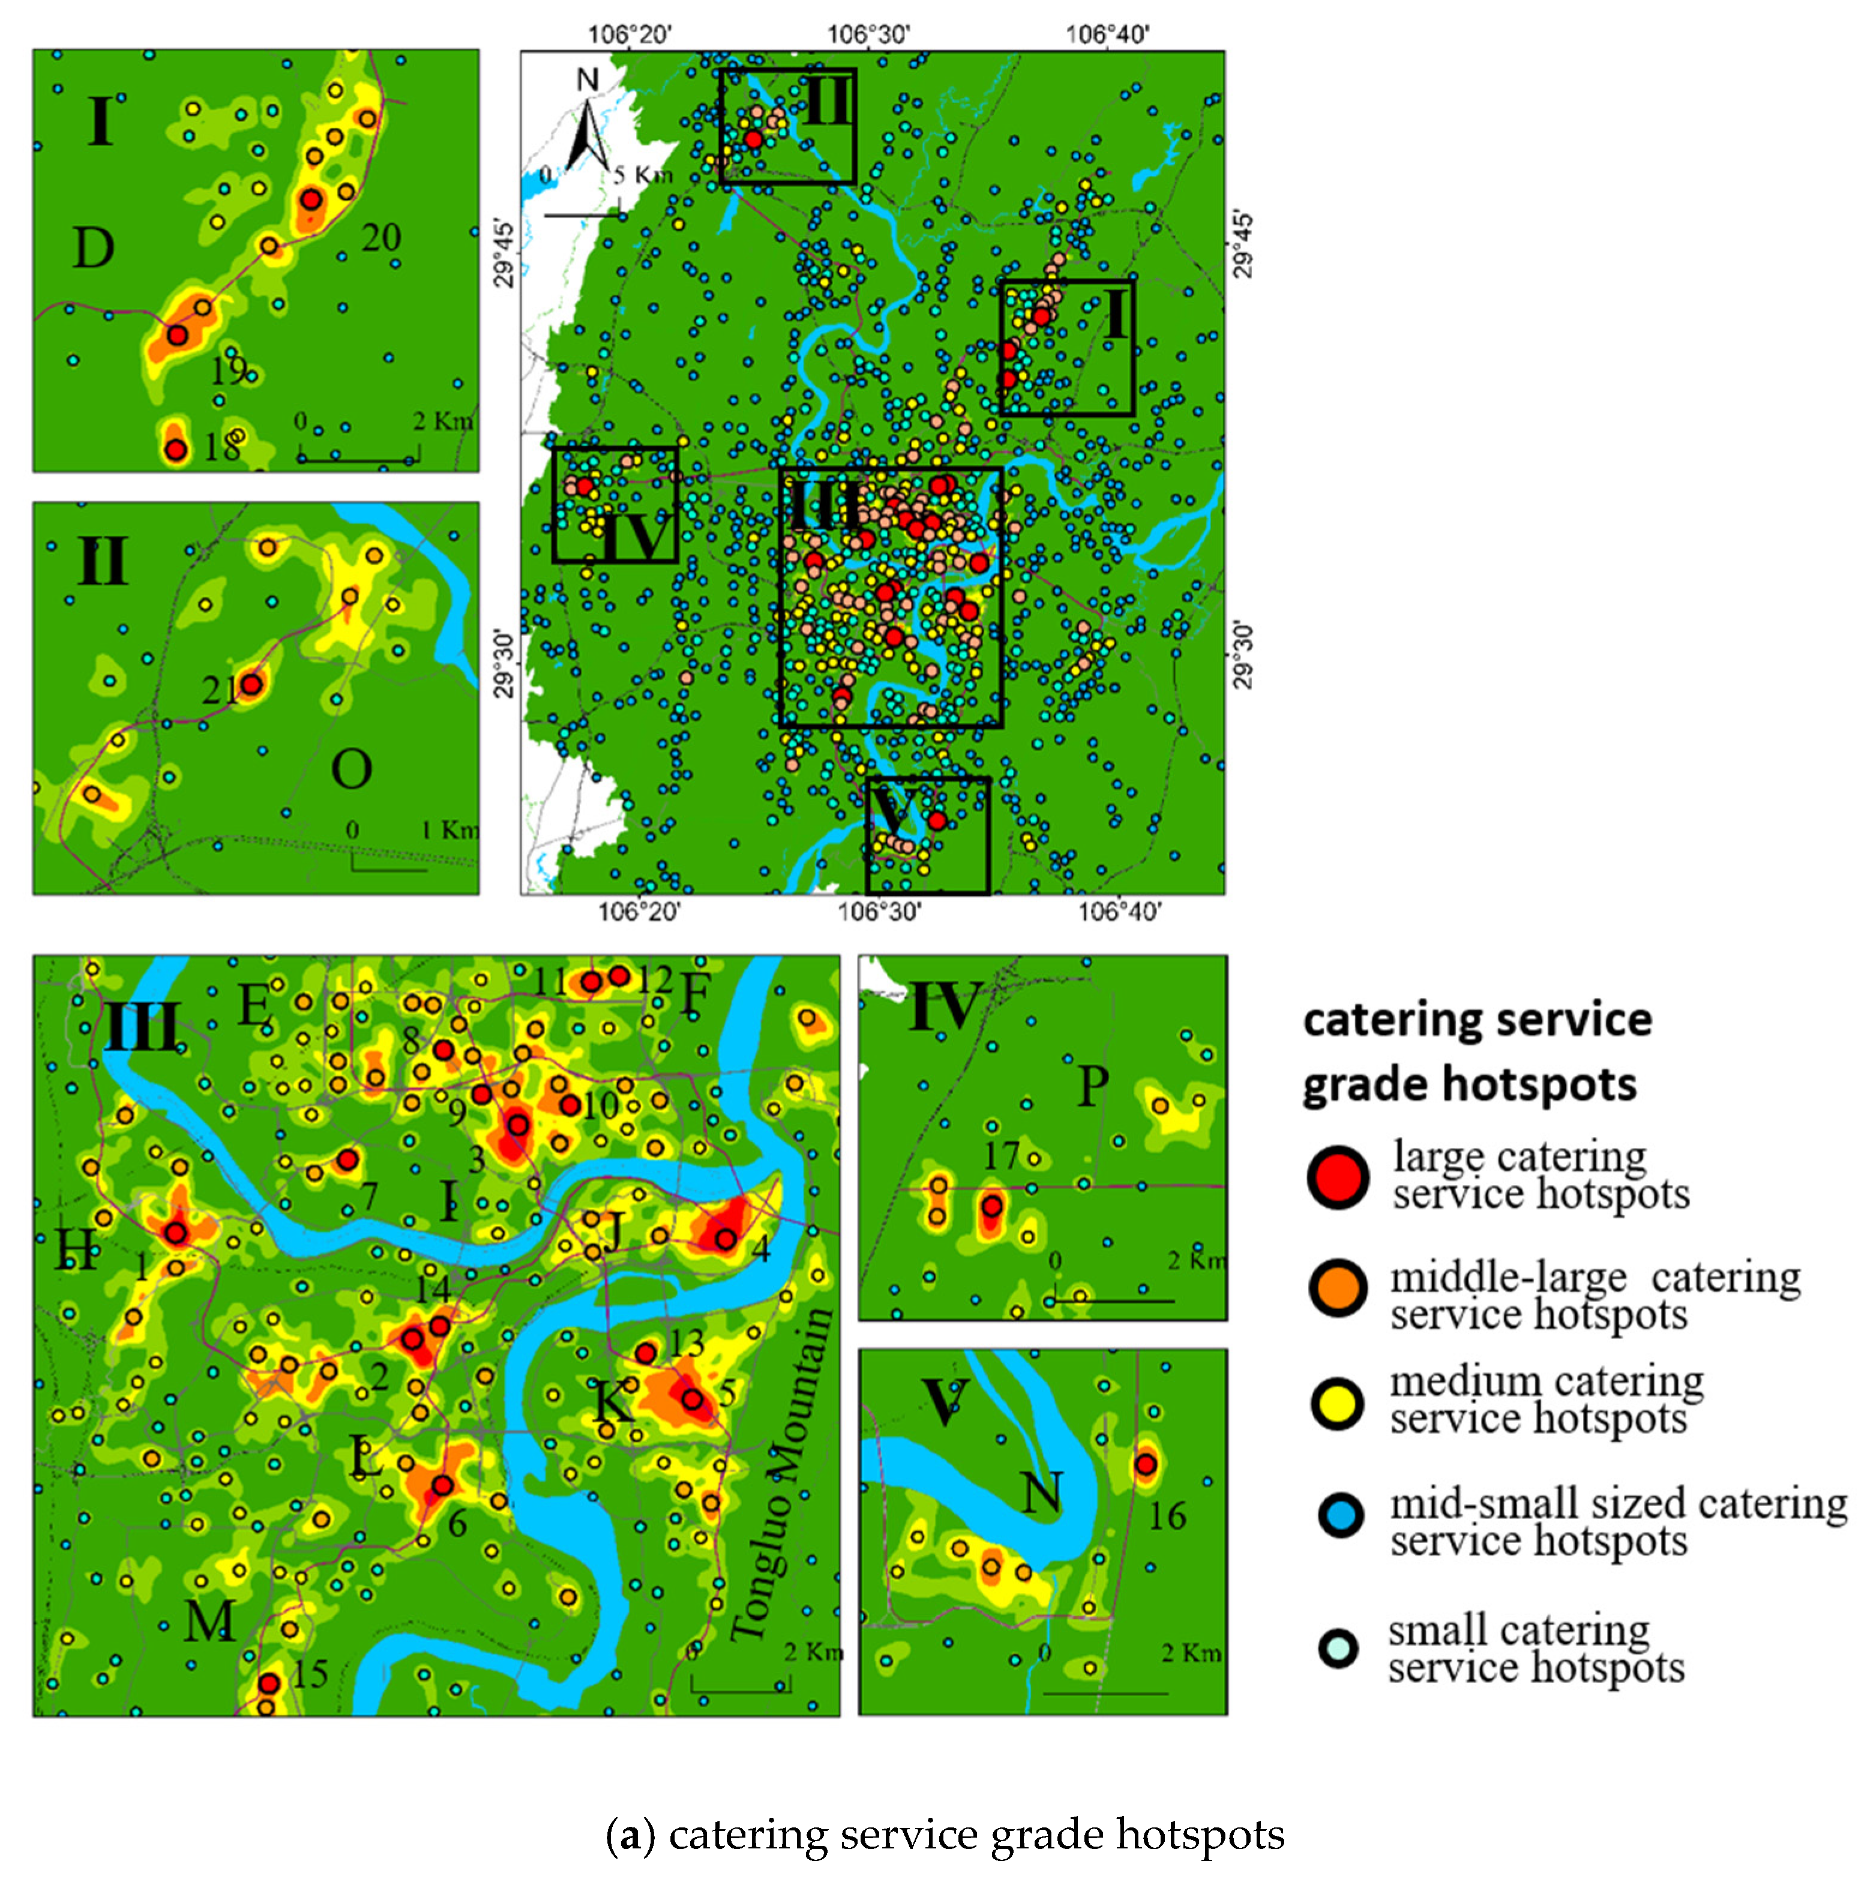
2.3.2. Obtainment of Catering Service Grade Hotspot
2.4. Spatial Structure Analysis Method
3. Results
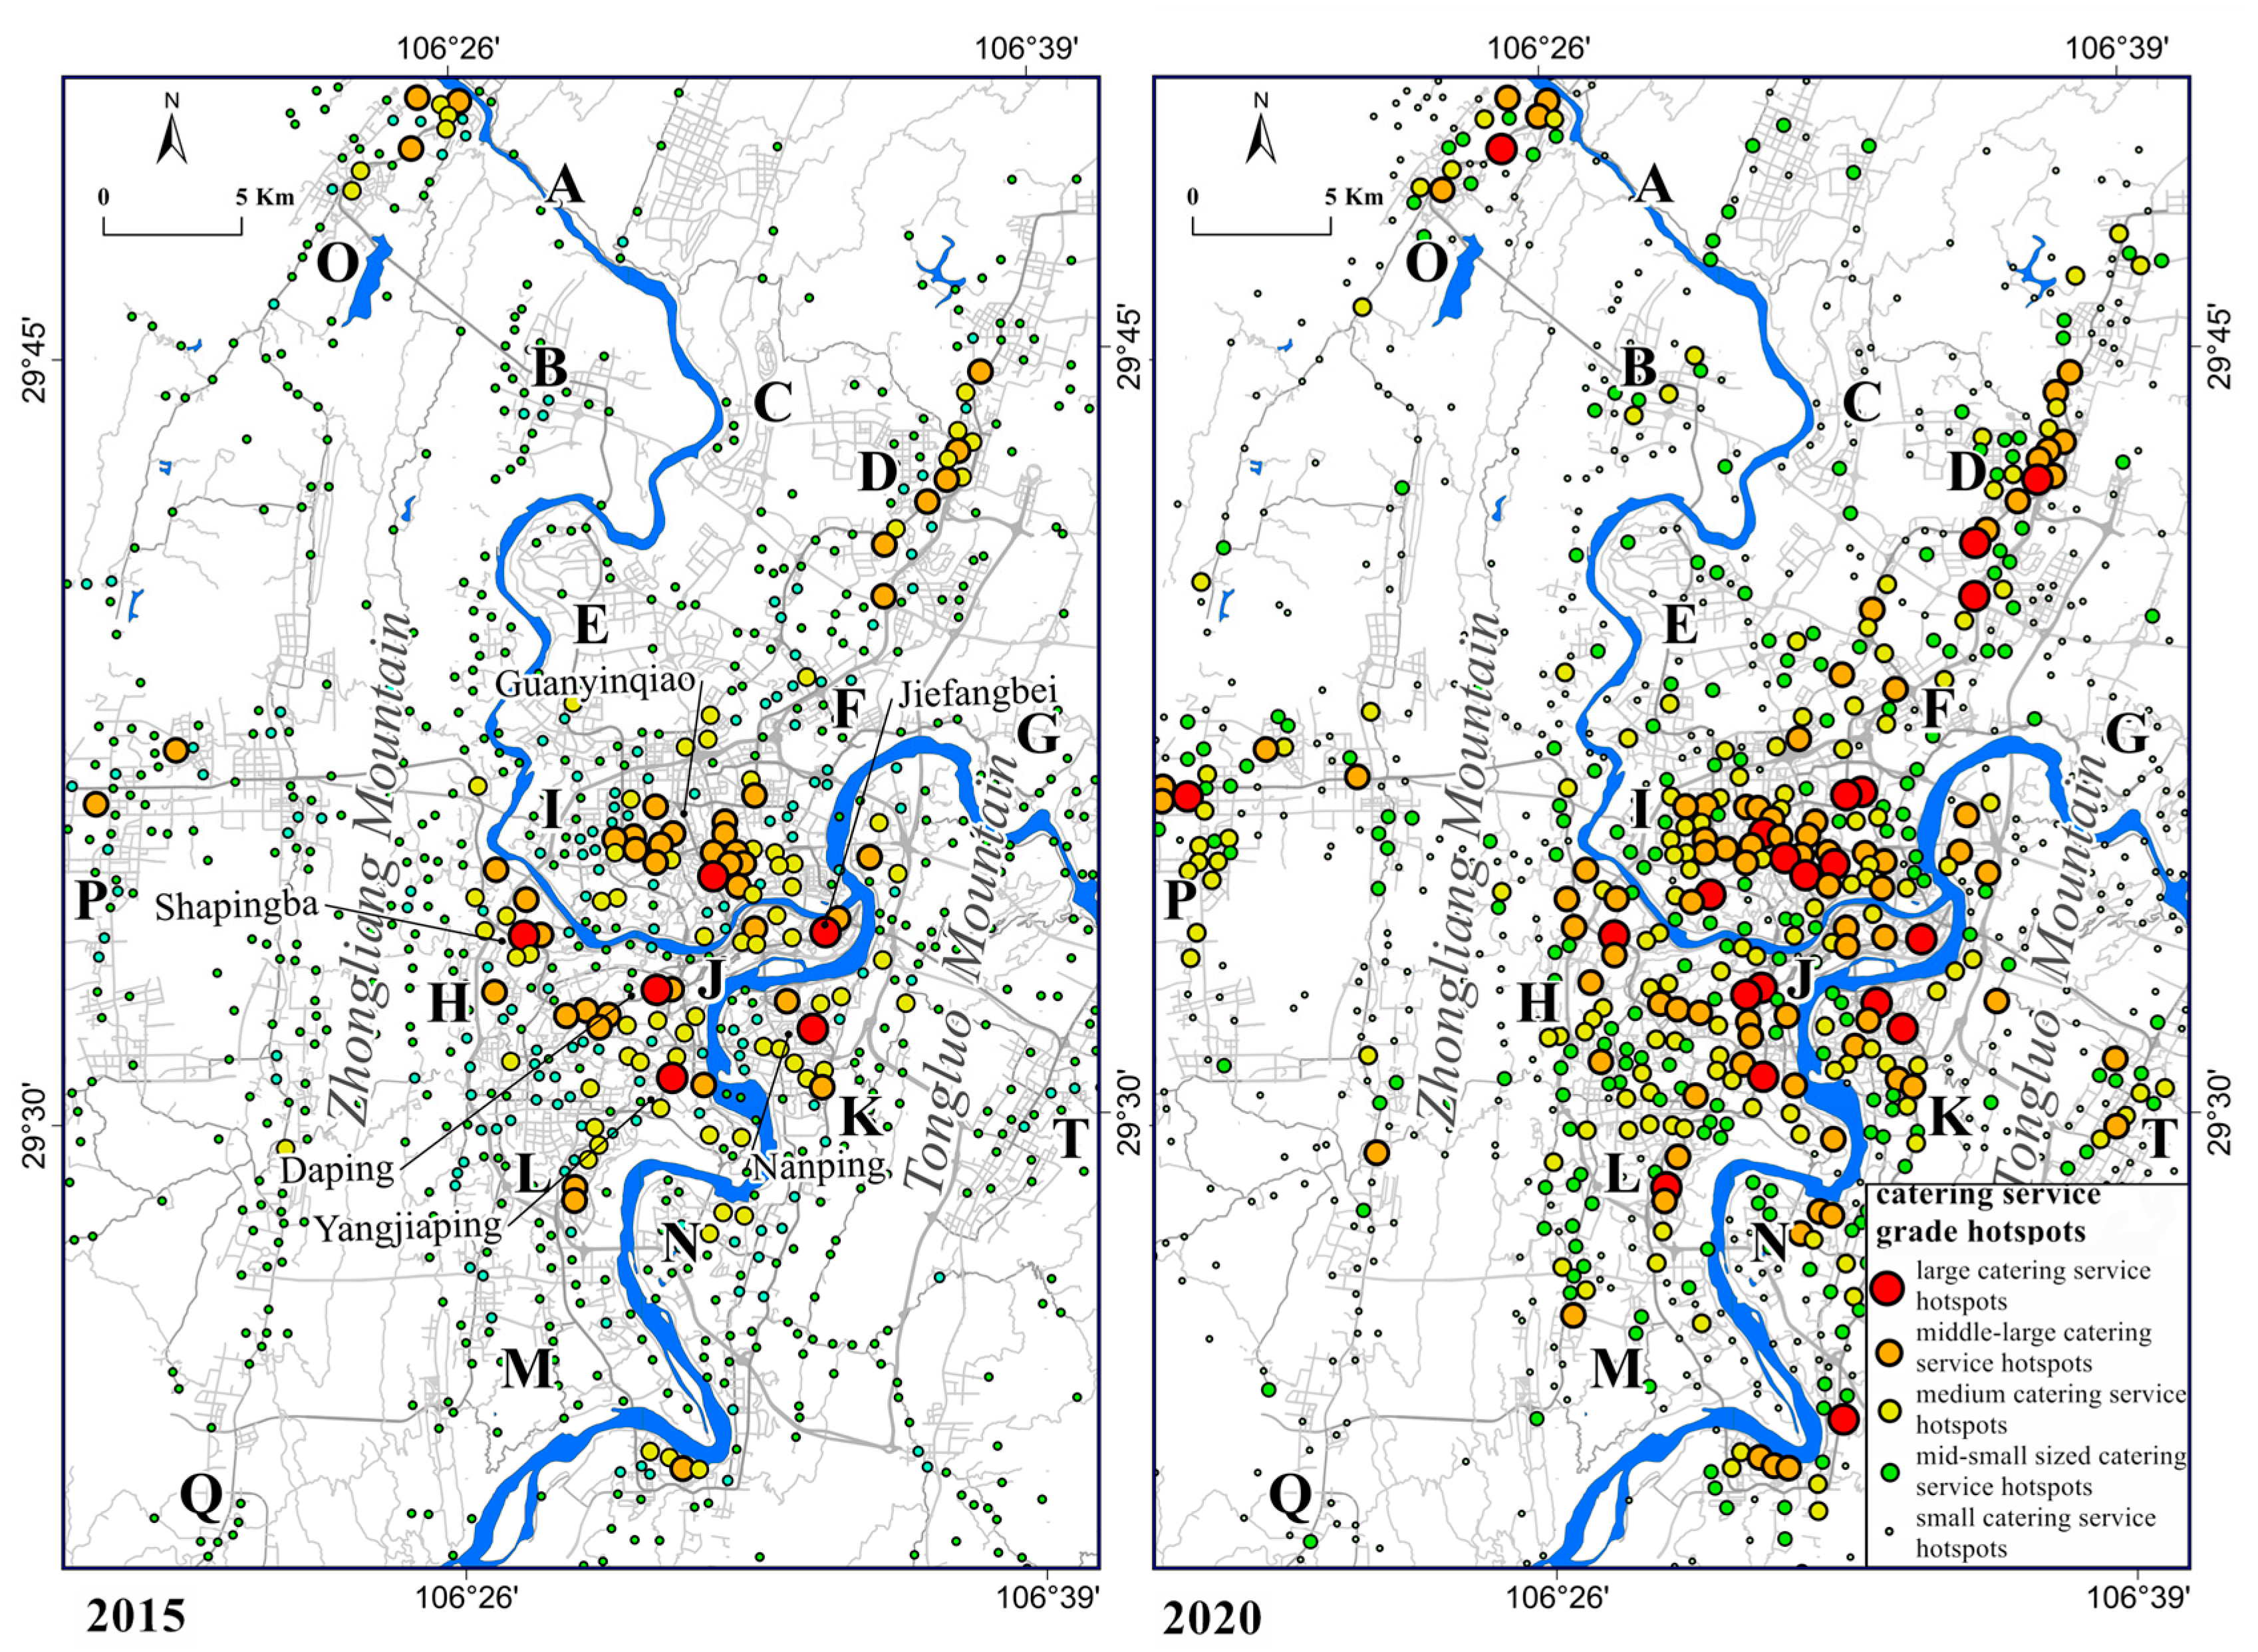
3.1. Urban Catering Service Hotspot Detection and Time Series Comparison
3.2. Analysis of Urban Structure and Evolution Based on Catering Service Hotspots
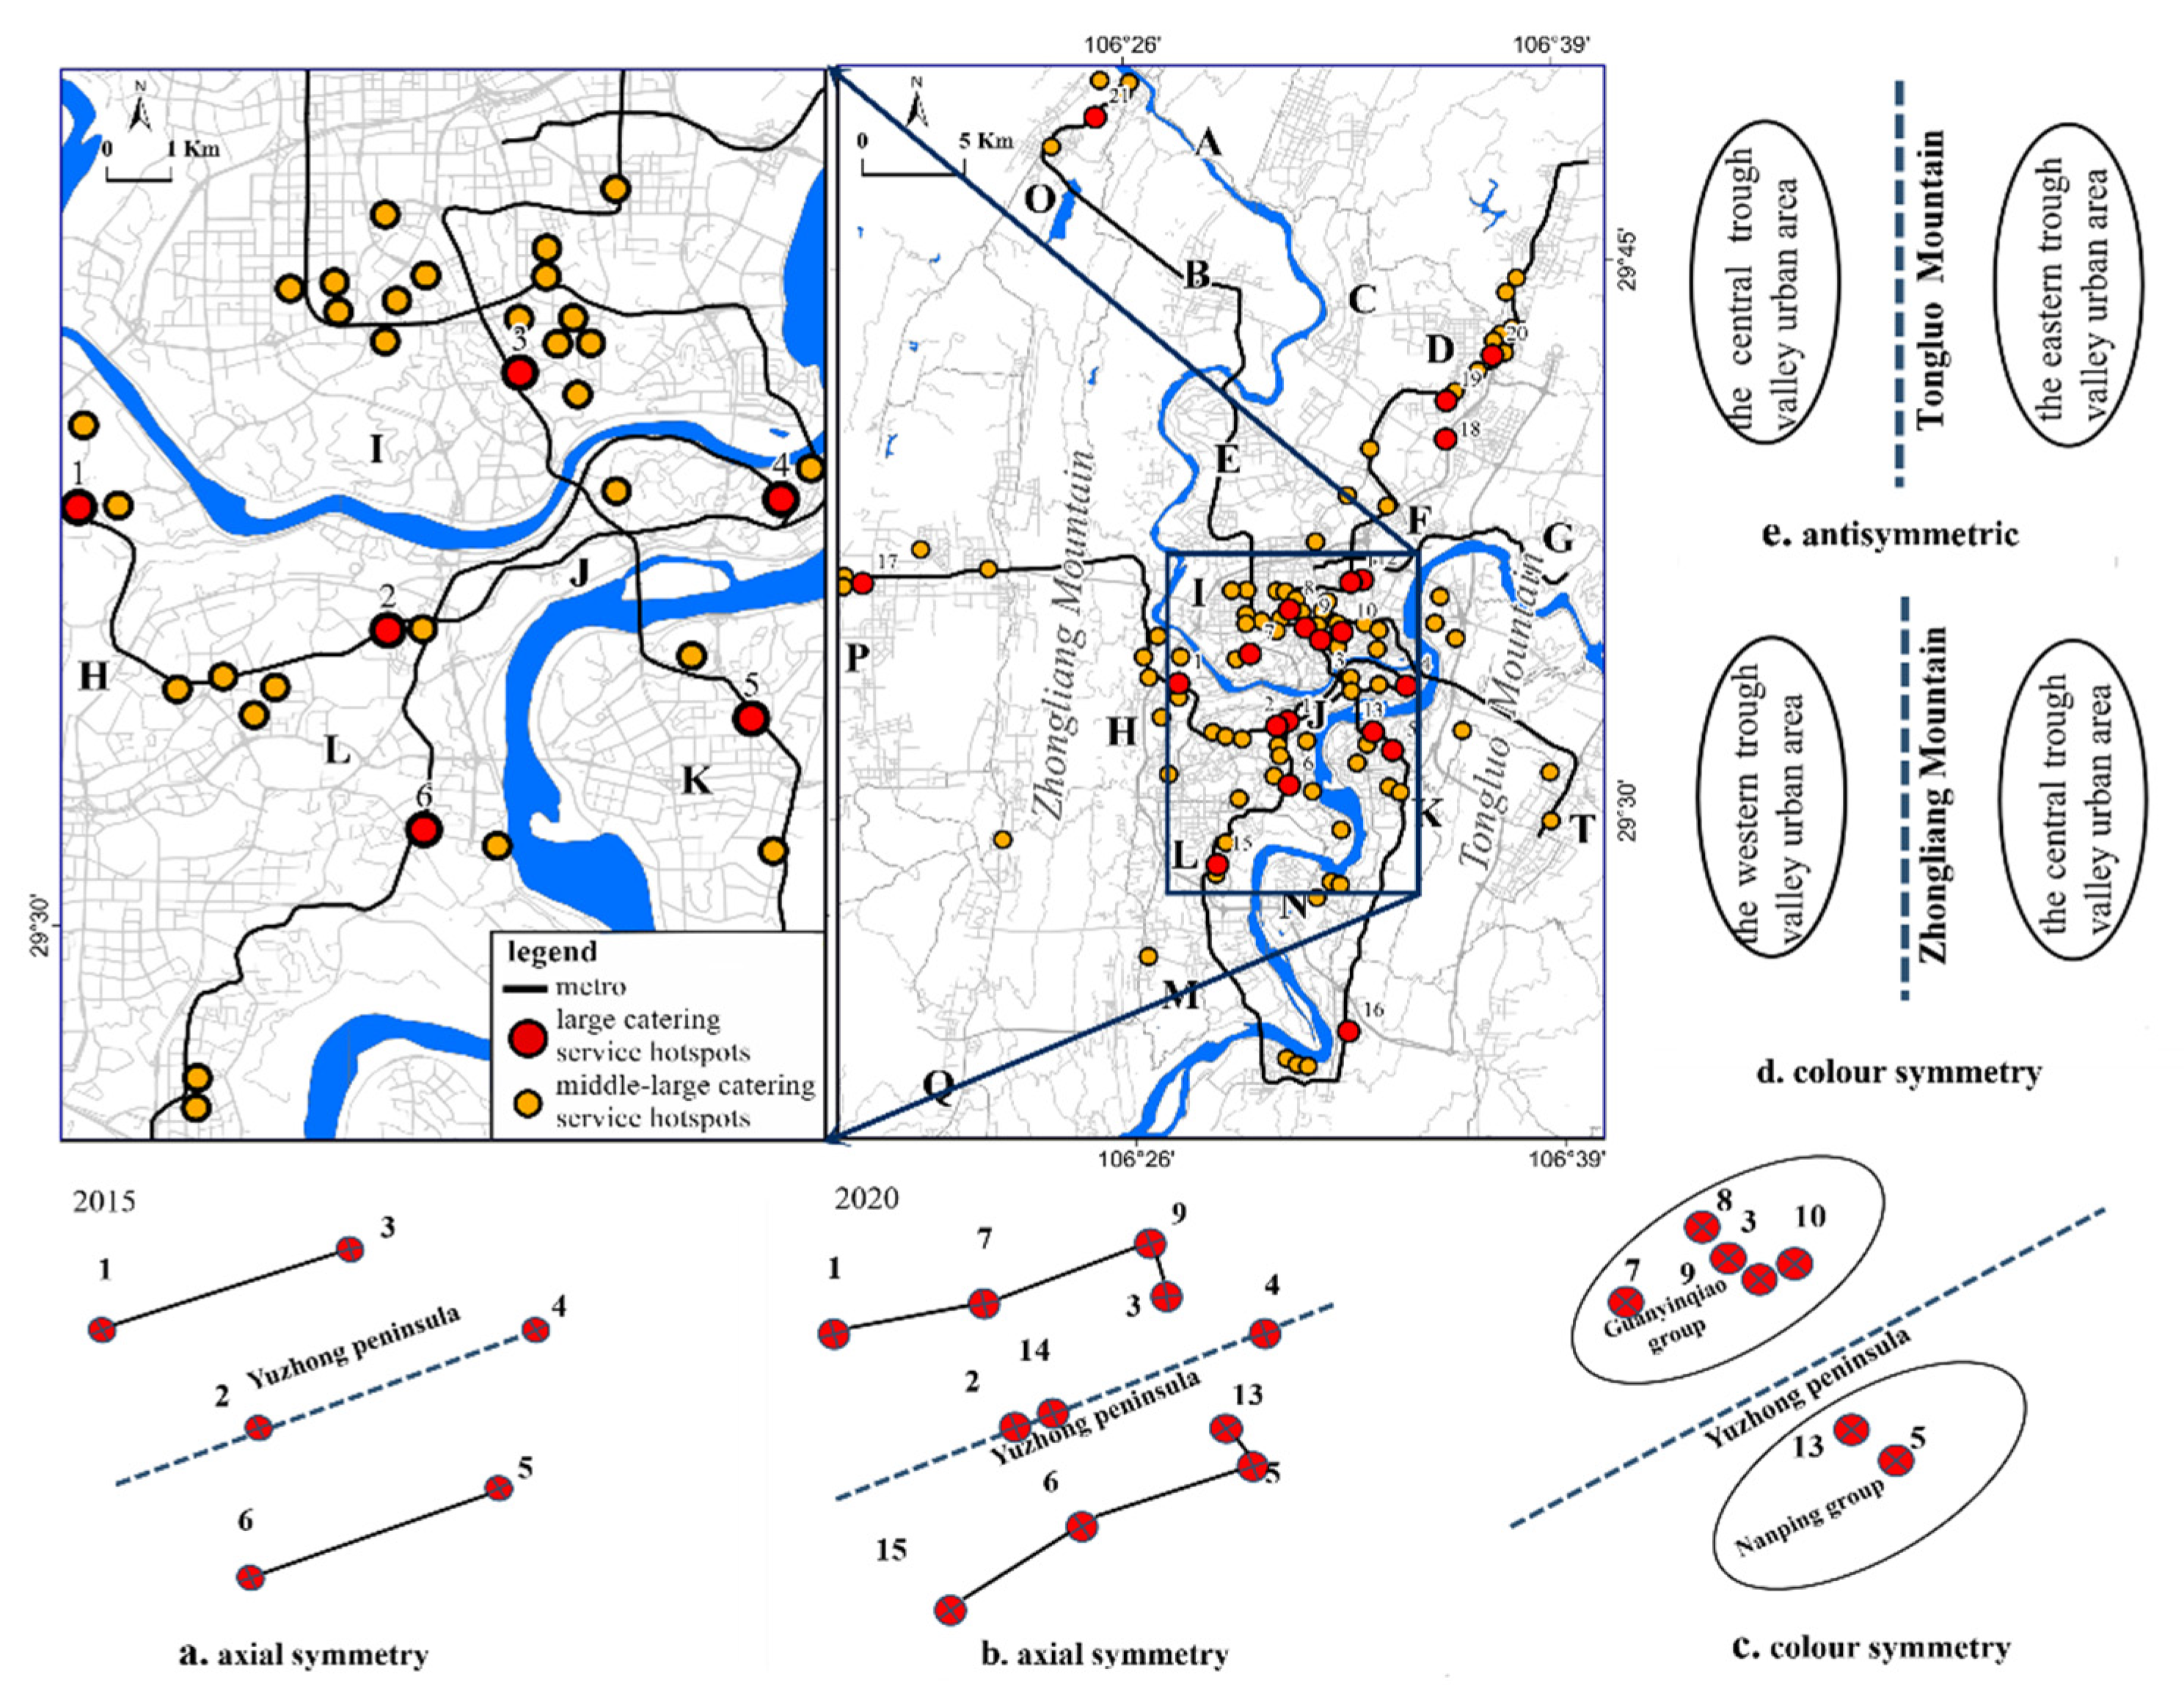
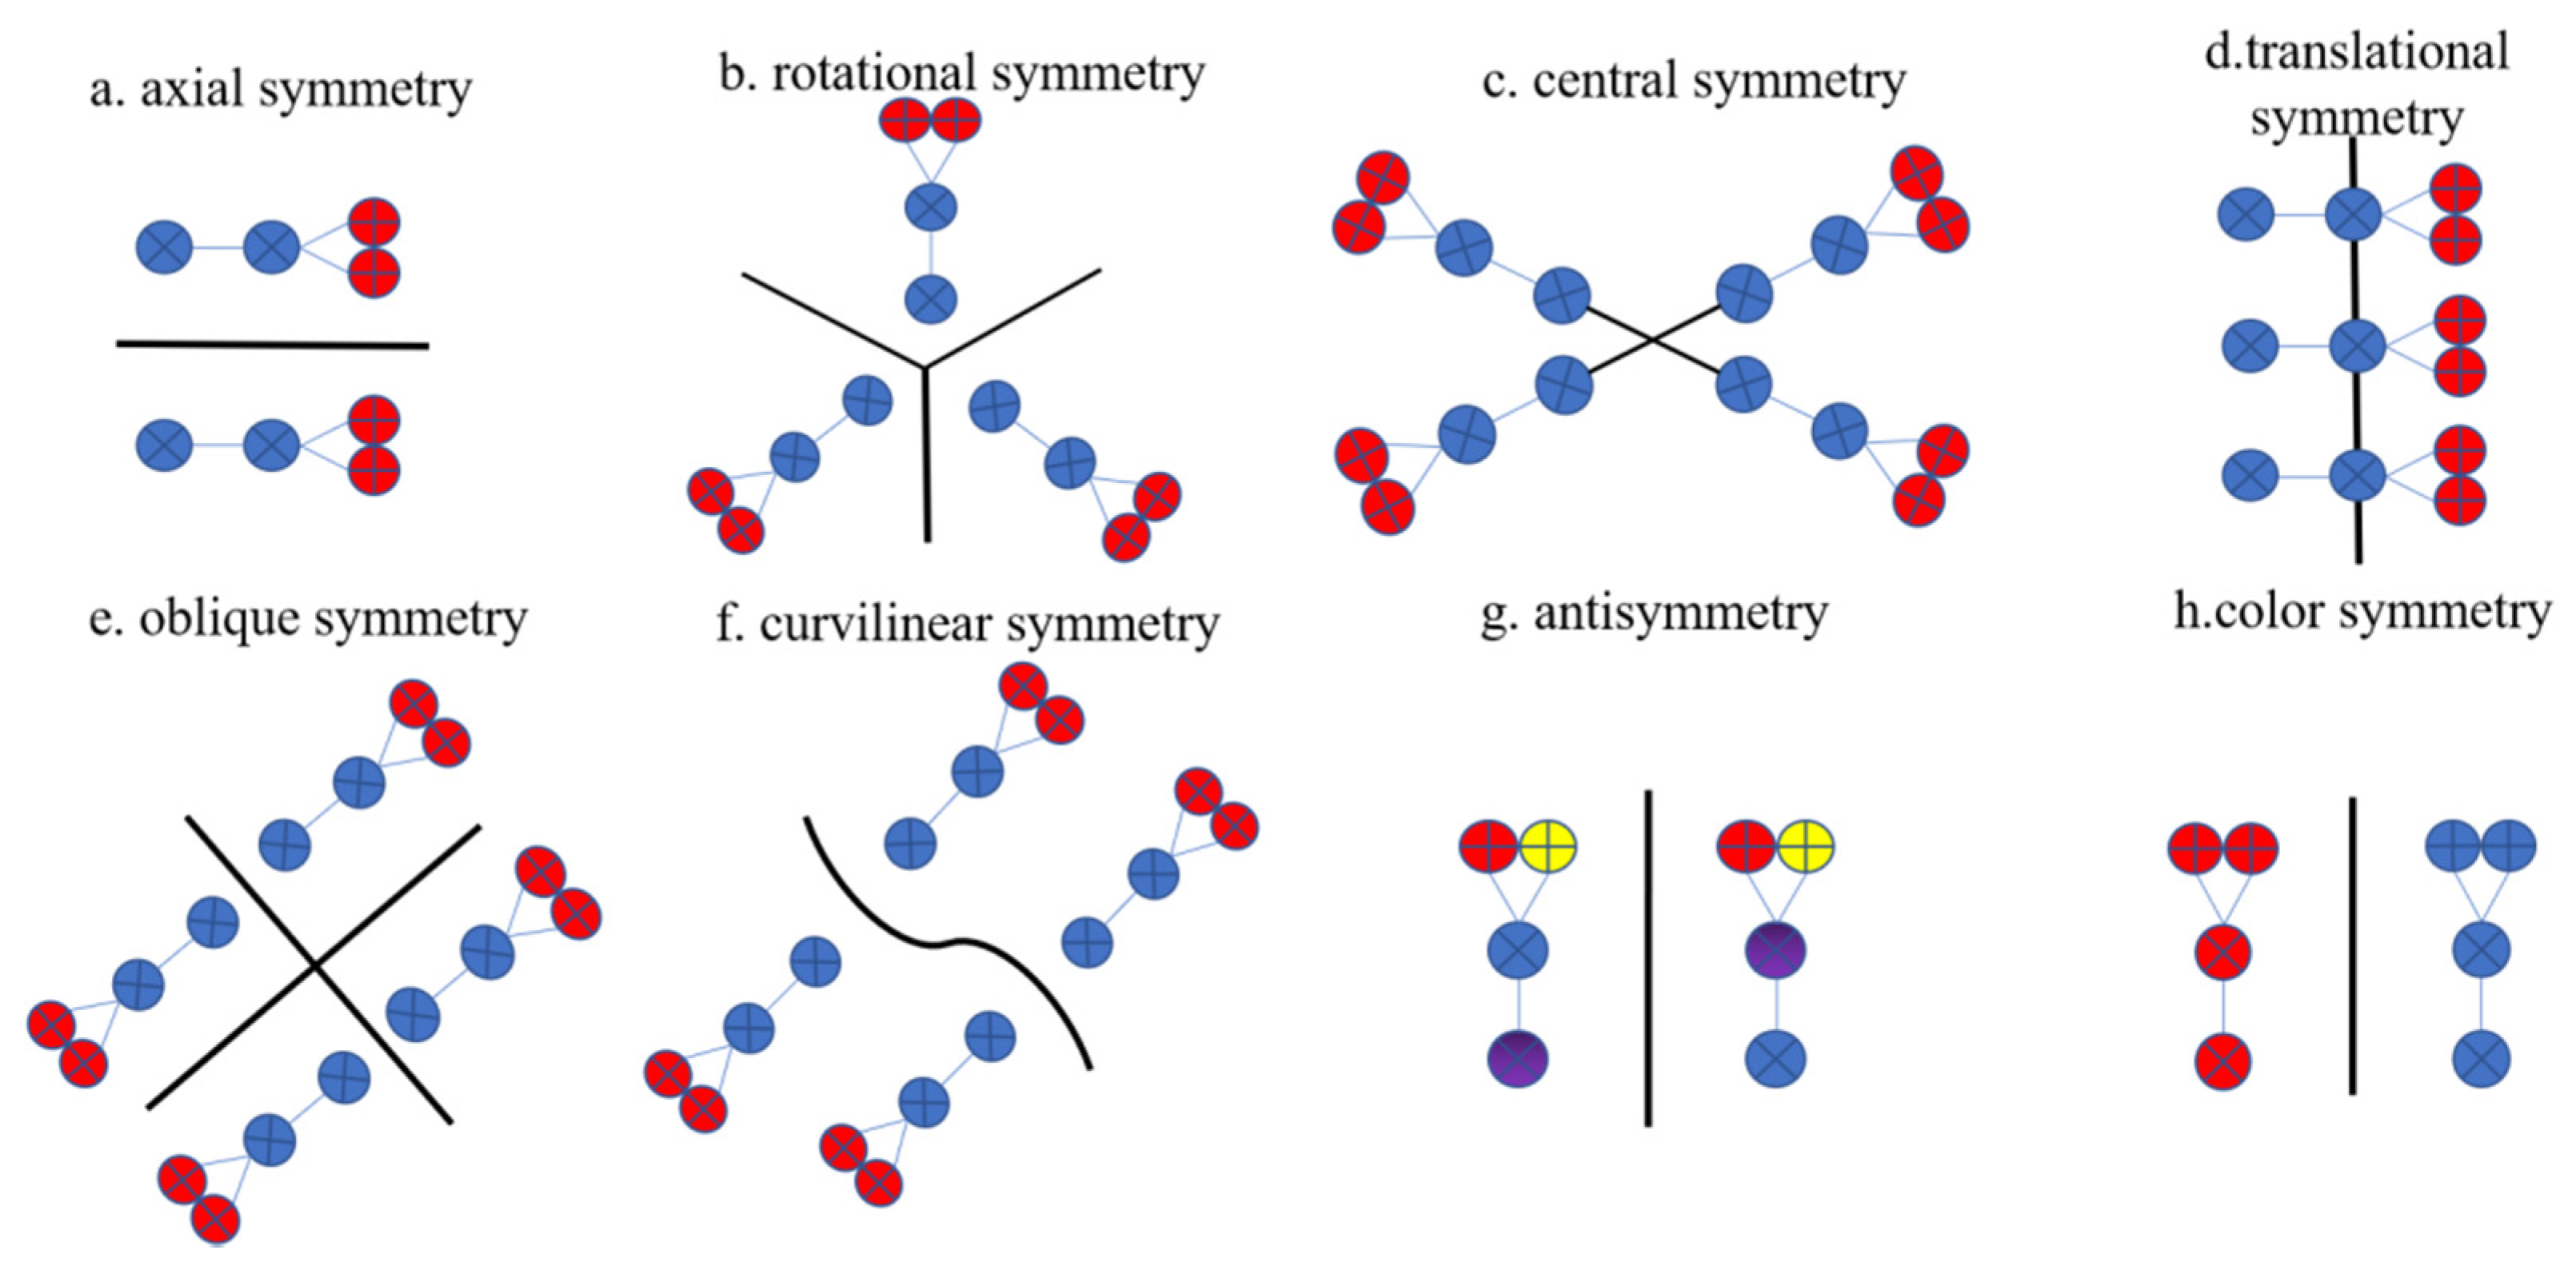
3.2.1. The Perspective of Generalized Symmetric Structure Tupu
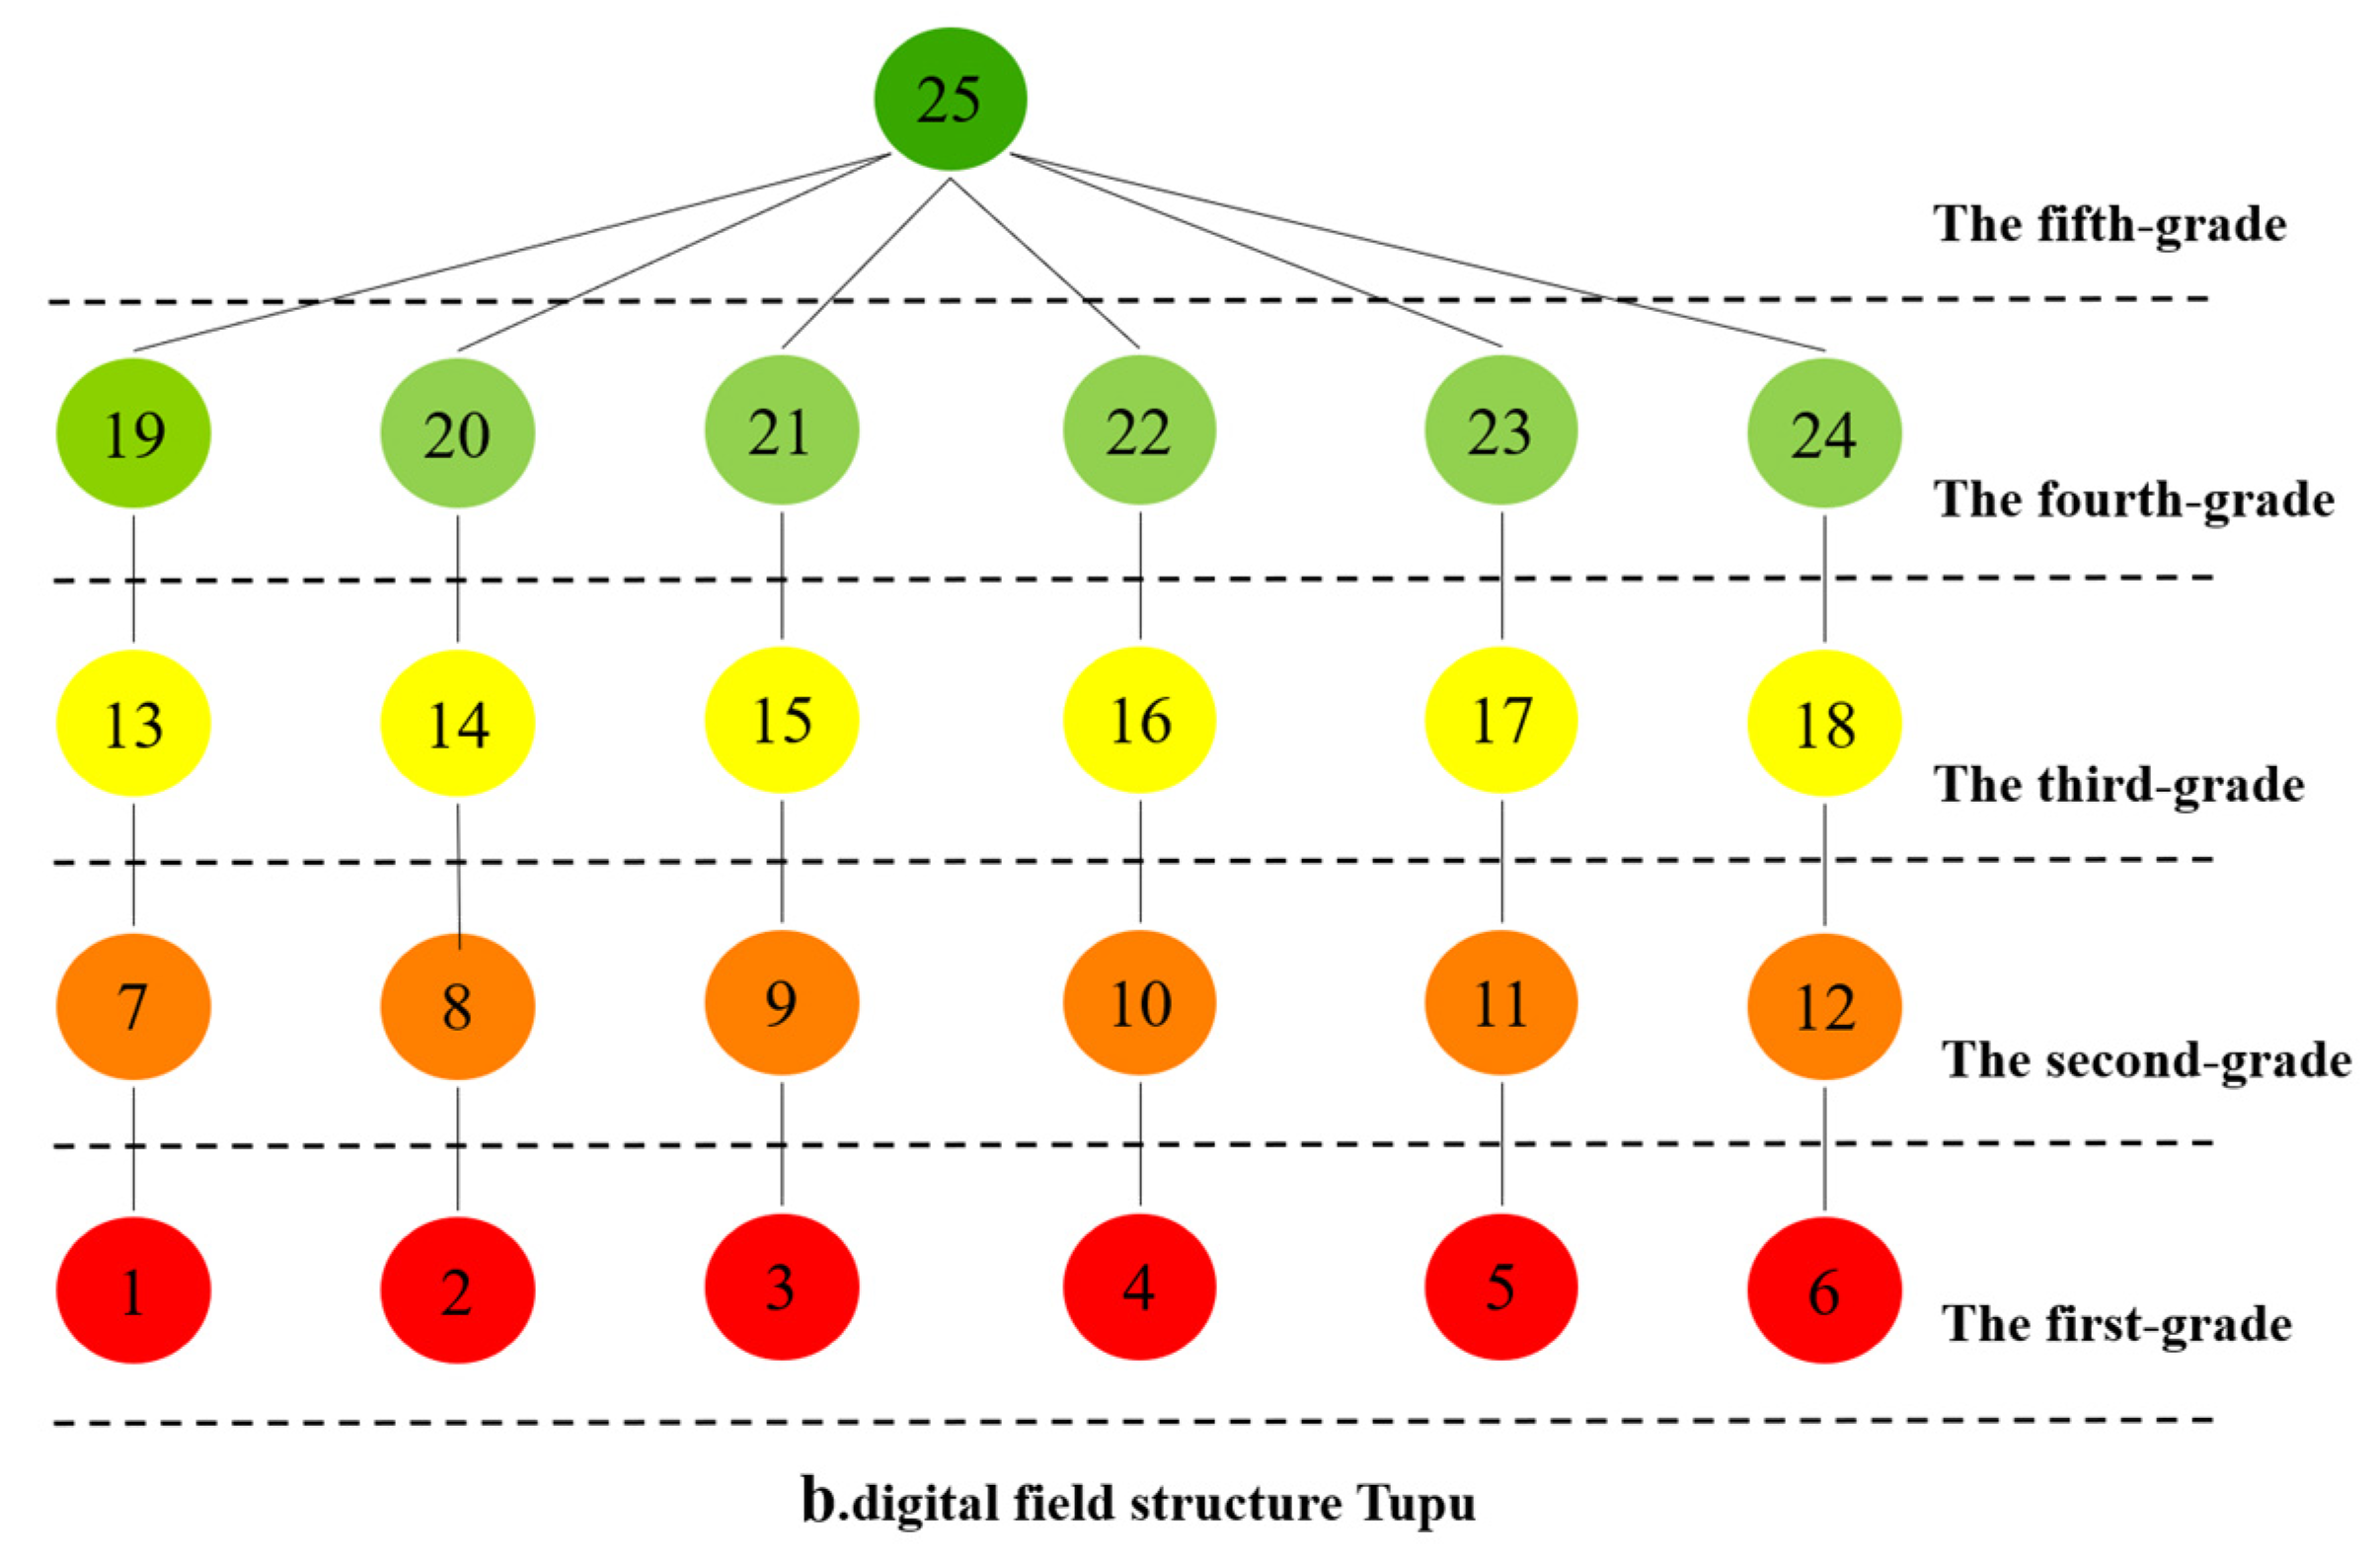
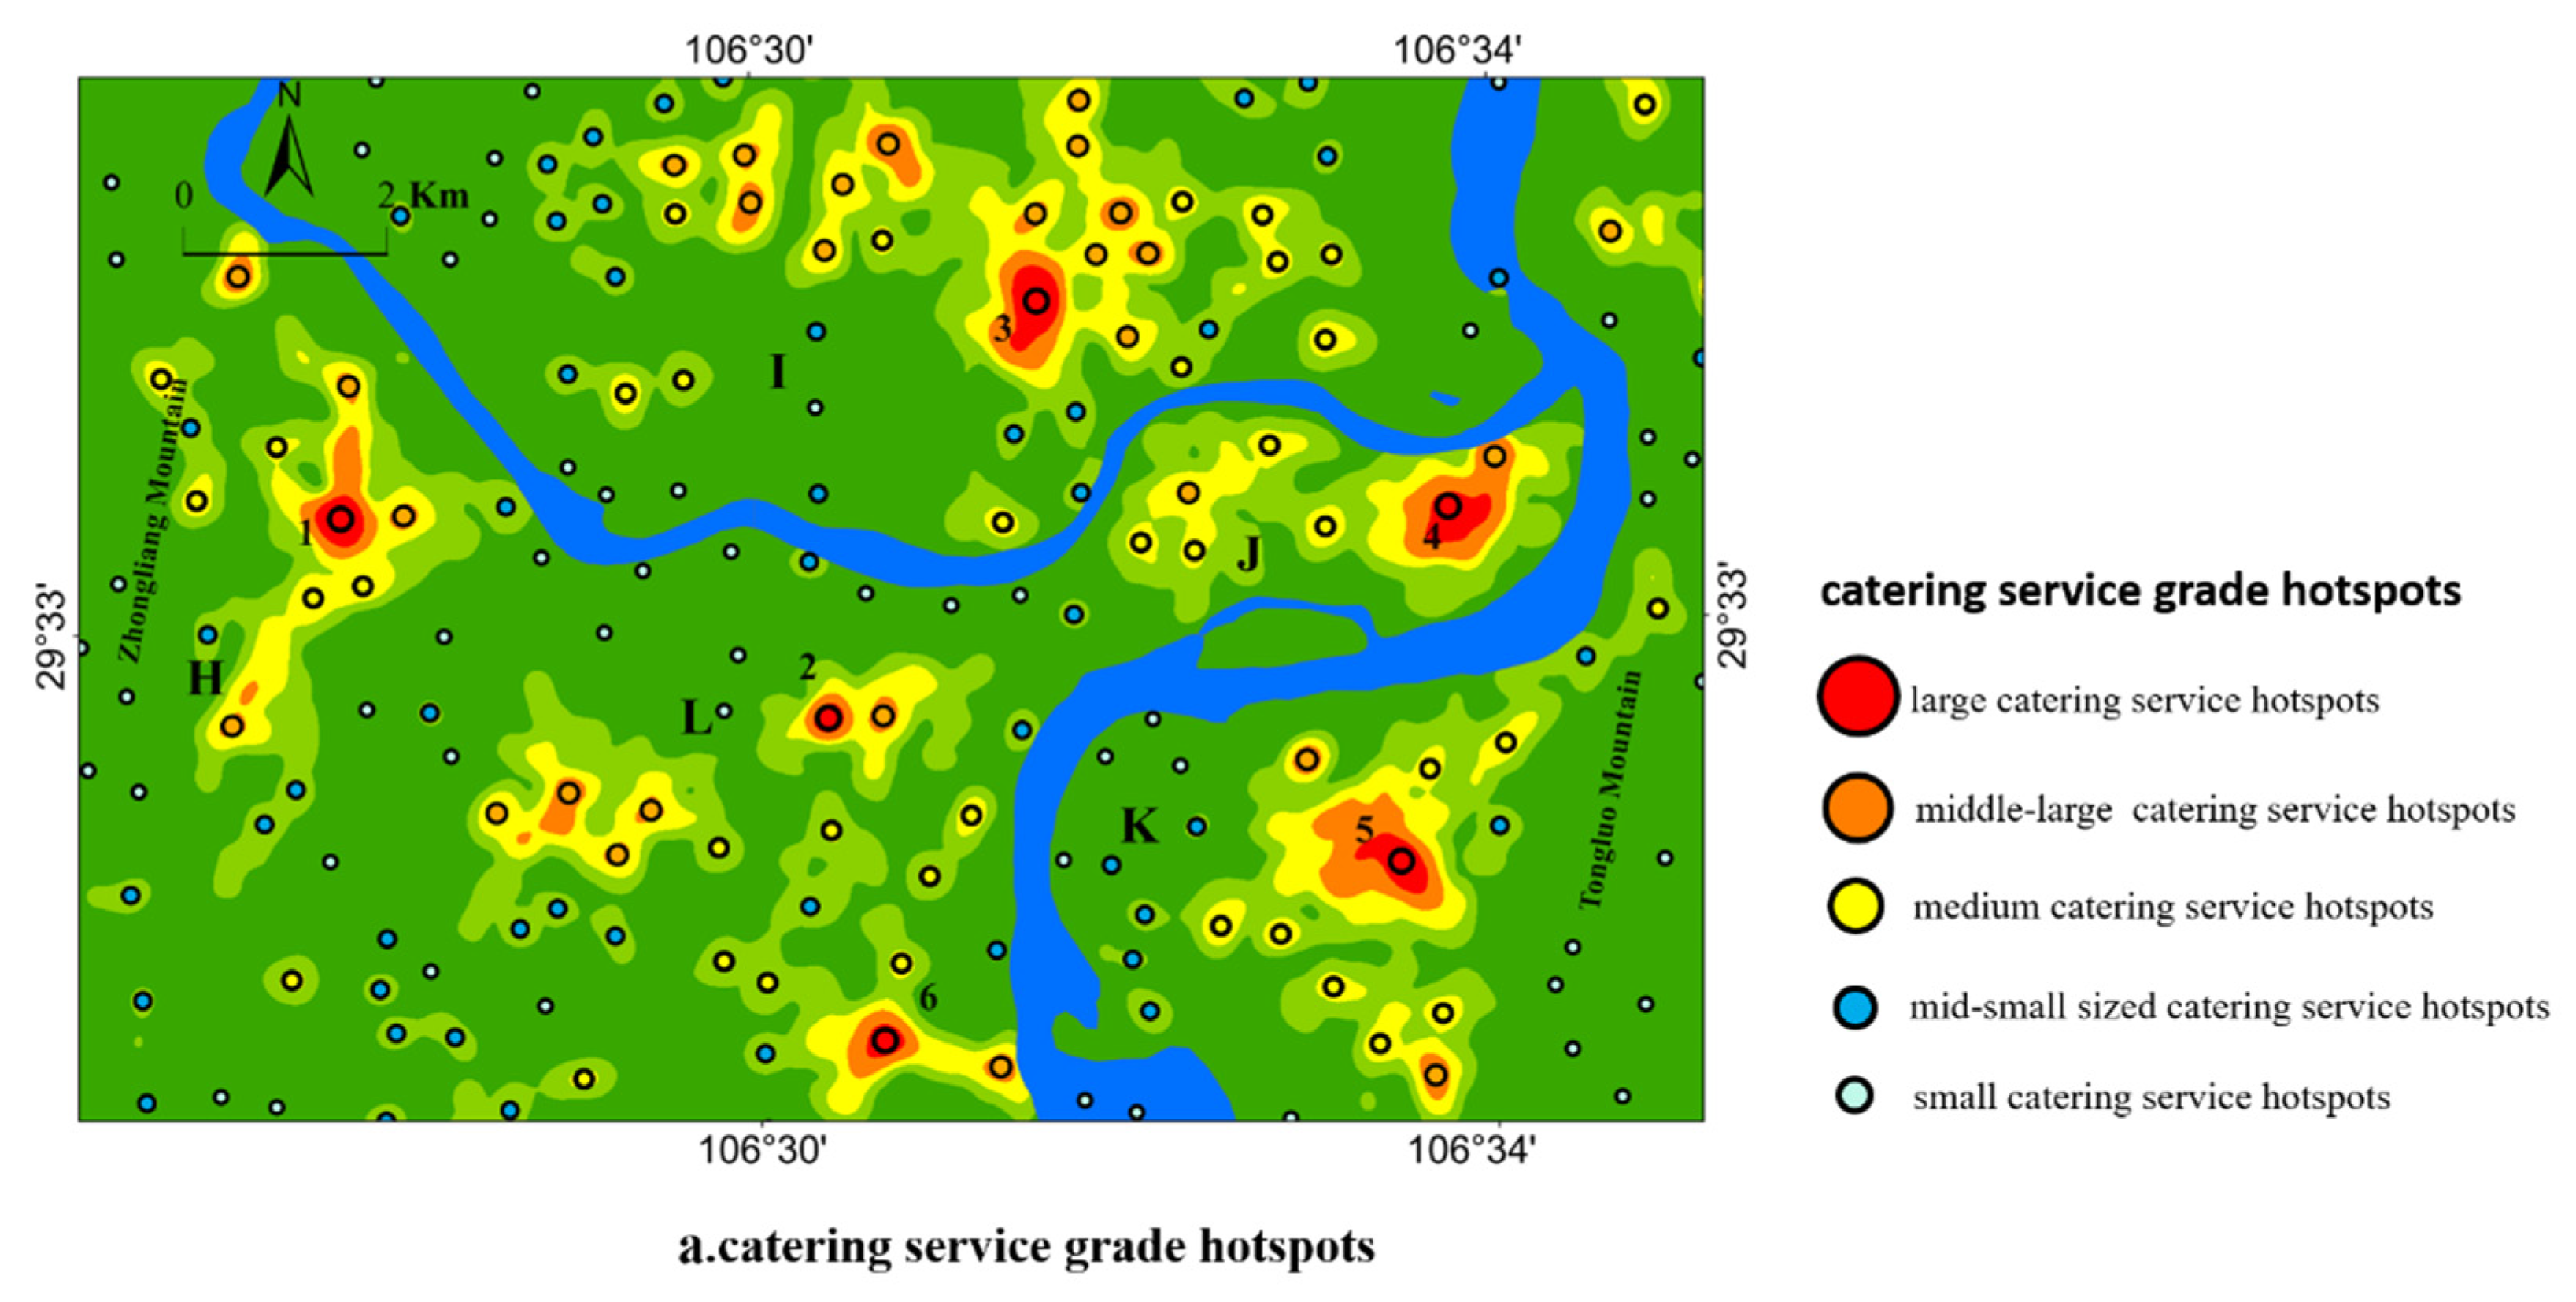
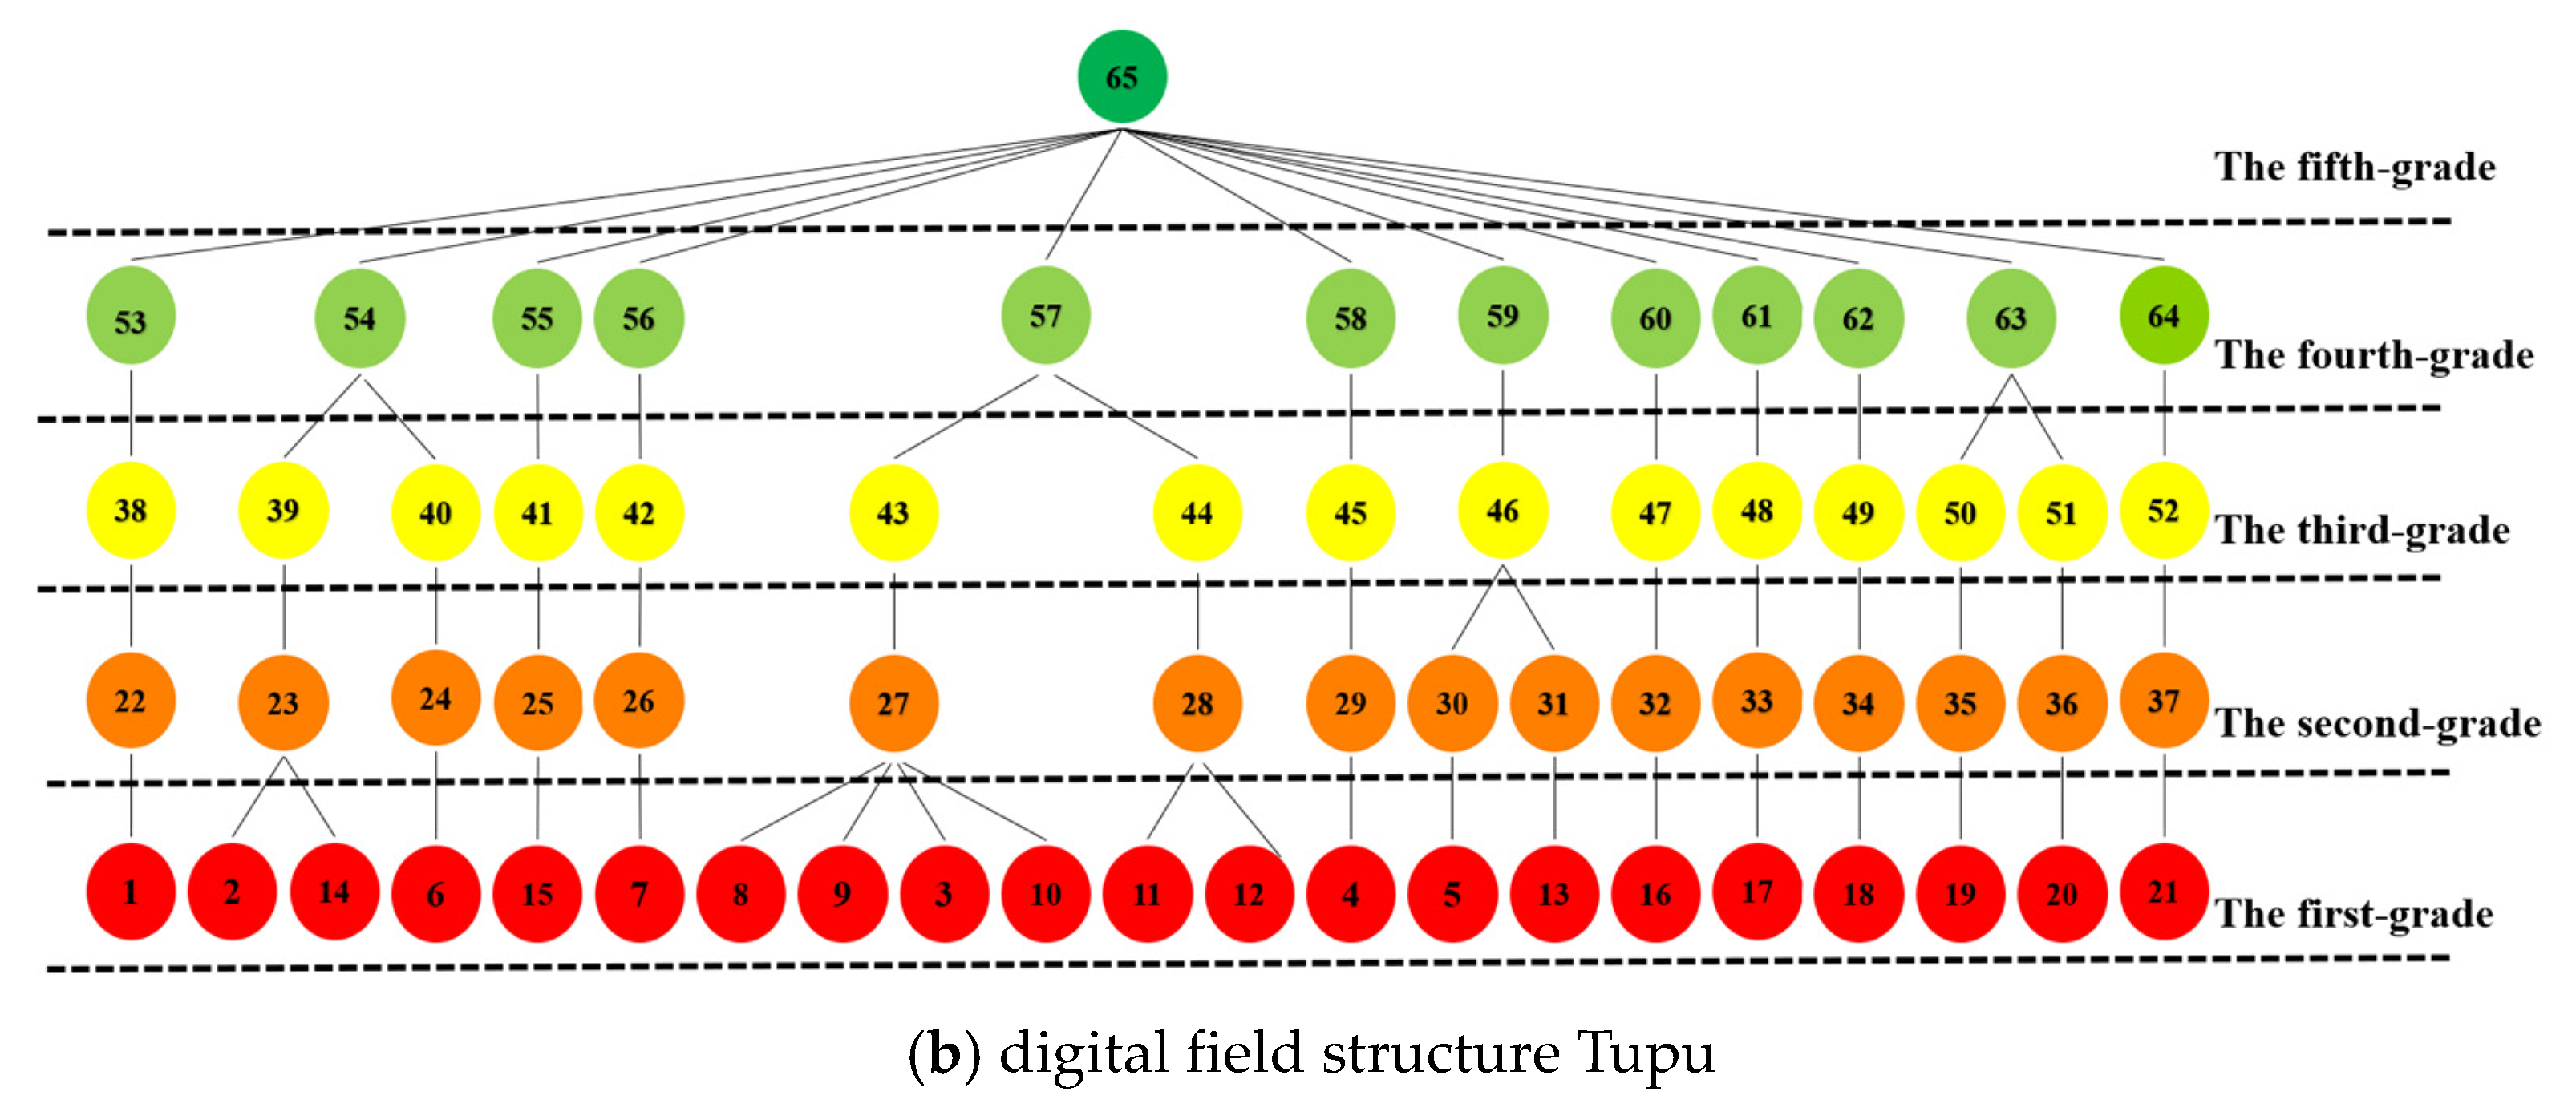
3.2.2. The Perspective of Digital Field Structure Tupu
4. Discussion
4.1. Thinking about the Results
4.2. Merits of Proposed Methods
4.3. Limitations and Future Research
5. Conclusions
Author Contributions
Funding
Data Availability Statement
Conflicts of Interest
References
- Zhou, C.; Ye, C. Progress on studies of urban spatial structure in China. Prog. Geogr. 2013, 32, 1030–1038. [Google Scholar]
- Zhang, H.; Zhou, X.; Tang, G.; Zhou, L.; Ye, X. Hotspot discovery and its spatial pattern analysis for catering service in cities based on field model in GIS. Geogr. Res. 2020, 39, 354–369. [Google Scholar]
- Zhen, F.; Wang, B. Rethinking human geography in the age of big data. Geogr. Res. 2015, 34, 803–811. [Google Scholar]
- Baumont, C.; Ertur, C.; Gallo, J.L. Spatial analysis of employment and population density: The case of the agglomeration of dijon 1999. Geogr. Anal. 2003, 36, 146–176. [Google Scholar] [CrossRef]
- Krehl, A. Urban subcentres in German city regions: Identification, understanding, comparison. Pap. Reg. Sci. 2016, 97, S79–S104. [Google Scholar] [CrossRef]
- Dadashpoor, H.; Alidadi, M. Towards decentralization: Spatial changes of employment and population in Tehran Metropolitan Region, Iran. Appl. Geogr. 2017, 85, 51–61. [Google Scholar] [CrossRef]
- Chen, X.; Xu, F.; Wang, W.; Du, Y.; Li, M. Geographic big data’s applications in retailing business market. Adv. Geogr. Inf. Sci. 2017, 15, 157–176. [Google Scholar] [CrossRef]
- Ting, C.-Y.; Ho, C.C.; Yee, H.J.; Matsah, W.R. Geospatial analytics in retail site selection and sales prediction. Big Data 2018, 6, 42–52. [Google Scholar] [CrossRef]
- Lloyd, A.; Cheshire, J. Deriving retail centre locations and catchments from geo-tagged Twitter data. Comput. Environ. Urban Syst. 2017, 61, 108–118. [Google Scholar] [CrossRef] [Green Version]
- Li, L.; Goodchild, M.F.; Xu, B. Spatial, temporal, and socioeconomic patterns in the use of Twitter and Flickr. Cartogr. Geogr. Inf. Sci. 2013, 40, 61–77. [Google Scholar] [CrossRef]
- Long, Y.; Liu, X. Automated identification and characterization of parcels (AICP) with OpenStreetMap and points of interest. Environ. Plan. B 2016, 43, 498–510. [Google Scholar]
- Wu, Q.; Liu, H.; Wang, S.; Yu, B.; Beck, R.; Hinkel, K. A localized contour tree method for deriving geometric and topological properties of complex surface depressions based on high-resolution topographical data. Int. J. Geogr. Inf. Sci. 2015, 29, 2041–2060. [Google Scholar] [CrossRef]
- Deng, Y.; Liu, J.; Luo, A. Detecting Urban Polycentric Structure from POI Data. ISPRS Int. J. Geo-Inf. 2019, 8, 283. [Google Scholar] [CrossRef] [Green Version]
- Xu, Z.; Gao, X. A novel method for identifying the boundary of urban built-up areas with POI data. Acta Geogr. Sin. 2016, 71, 928–939. [Google Scholar]
- Cao, F.; Qiu, Y.; Zou, Y. A fast extraction method of built-up area based on H/T breaks method and POI data. Geogr. Geo-Inf. Sci. 2020, 36, 54–60. [Google Scholar]
- Okabe, A.; Satoh, T.; Sugihara, K. A kernel density estimation method for networks, its computational method and a GIS-based tool. Int. J. Geogr. Inf. Sci. 2009, 23, 7–32. [Google Scholar] [CrossRef]
- Neal, Z.P. Culinary deserts, gastronomic oases: A classification of US cities. Urban Stud. 2006, 43, 1–21. [Google Scholar] [CrossRef]
- Schiff, N. Cities and product variety: Evidence from restaurants. J. Econ. Geogr. 2015, 15, 1085–1123. [Google Scholar] [CrossRef] [Green Version]
- Dock, J.P.; Song, W.; Lu, J. Evaluation of dine-in restaurant location and competitiveness: Applications of gravity modeling in Jefferson County, Kentucky. Appl. Geogr. 2015, 60, 204–209. [Google Scholar] [CrossRef]
- Ayatac, H.; Dokmeci, V. Location patterns of restaurants in Istanbul. Curr. Urban Stud. 2017, 5, 202–216. [Google Scholar] [CrossRef] [Green Version]
- Prayag, G.; Landré, M.; Ryan, C. Restaurant location in Hamilton, New Zealand: Clustering patterns from 1996 to 2008. Int. J. Contemp. Hosp. Manag. 2012, 24, 430–450. [Google Scholar] [CrossRef]
- Cui, X.; Cui, H.; Liu, Z. Evolution characteristics and influencing factors of restaurant distribution in Guangzhou. Econ. Geogr. 2019, 39, 143–151. [Google Scholar]
- Zhang, X.; Xu, Y. Study on the distribution in space of urban caterings and its influencing factors: A case study of Nanjing. Trop. Geogr. 2009, 29, 362–367. [Google Scholar]
- Chen, C. The culture of Chinese diet: Regional differentiation and developing trends. Acta Geogr. Sin. 1994, 49, 226–235. [Google Scholar]
- Lan, Y. The reasons and distribution of pungent flavour districts in China’s dietetics. Geogr. Res. 2001, 20, 229–237. [Google Scholar]
- Gu, Q.; Zhang, H.; Zhou, X.; Zhao, P. Geographical distribution and diffusion effect of eight Chinese cuisines: An empirical analysis based on big data. Zhejiang Acad. J. 2019, 5, 47–53. [Google Scholar]
- Hu, Z.; Zhang, Z. Spatial layout analysis of urban hotels—A case study of Nanjing. Econ. Geogr. 2002, 22, 106–110. [Google Scholar]
- Guo, H.; Guo, Y.; Feng, C. Research on comprehensive rating and spatial distribution of hotel inside Beijing’s sixth ring road based on multivariate. Data Areal Res. Dev. 2020, 39, 64–69. [Google Scholar]
- Wu, L.; Liu, L.; Tian, Y.; Xiao, C.; Liu, L. Analysis of distribution patterns of geographical objects based on network K function method—Taking the spatial pattern of catering industry on Hong Kong Island as an example. Geogr. Geo-Inf. Sci. 2013, 29, 7–11. [Google Scholar]
- LI, Y.; Liu, H.; Wang, L. Spatial distribution pattern of the catering industry in a tourist city: Taking Lhasa city as a case. J. Resour. Ecol. 2020, 11, 191–205. [Google Scholar]
- Zeng, G.; Lu, R. Spatial expansion mode and its influencing factors of Starbucks in mainland of China. Geogr. Res. 2017, 36, 188–202. [Google Scholar]
- Lan, T.; Yu, M.; Xu, Z.; Wu, Y. Temporal and spatial variation characteristics of catering facilities based on POI data: A case study within 5th ring road in Beijing. Procedia Comput. Sci. 2018, 131, 1260–1268. [Google Scholar] [CrossRef]
- Yang, F.; Xu, J.; Zhou, L. DBSCAN based spatial clustering for the identification and spatial feature analysis of Guangzhou urban catering cluster. Econ. Geogr. 2016, 36, 110–116. [Google Scholar]
- Xia, L.; Liu, Y.; Liu, G. Distribution pattern and influencing factors of China’s prefecture-level urban catering industry—An empirical study based on the data of Dianping.com. Econ. Geogr. 2018, 38, 133–141. [Google Scholar]
- Tu, J.; Tang, S.; Zhang, Q.; Wu, Y.; Luo, Y. Spatial heterogeneity of the effects of mountainous city pattern on catering industry location. Acta Geogr. Sin. 2019, 74, 1163–1177. [Google Scholar]
- Lu, B.; Chen, Z.; Yuan, K.; Wang, H. Construction and analysis of Shanxi provincial urban and transportation TUPU. Geo-Inf. Sci. 2007, 9, 96–100. [Google Scholar]
- Li, J. Aanalysis of neighborhood patterns and ecological model in Xinjiang. Geo-Inf. Sci. 2004, 6, 115–119. [Google Scholar]
- Guo, Y.; Qi, Q.; Jiang, L.; Zhang, A.; Ren, J.; Wang, X. Research on the theoretic method and application of the urban form information TUPU. J. Geo-Inf. Sci. 2011, 13, 781–787. [Google Scholar] [CrossRef]
- Zhang, H.; Zhou, X.; Gu, X.; Zhou, L.; Ji, G.; Tang, G. Method for the analysis and visualization of similar flow hotspot patterns between different regional groups. ISPRS Int. J. Geo-Inf. 2018, 7, 328. [Google Scholar] [CrossRef] [Green Version]
- Gong, Z.; Qi, Q.; Xia, X. Research on urban system evolution information TUPU based on China modern map. Sci. Surv. Mapp. 2014, 39, 103–110. [Google Scholar]
- Yu, Y.-H.; Li, Z.-J.; Lin, J.-K.; Liu, J.-Y.; Wang, S. TUPU characteristics of spatiotemporal variation for land use in the Yihe River Basin. J. Nat. Resour. 2019, 34, 975–988. [Google Scholar] [CrossRef]
- Du, C.; Liu, Y.; Guo, X.; Xu, C. Analysis and research on the temporal and spatial changes of land use in Zhaozhou County based on geo-information TUPU. IOP Conf. Ser. Earth Environ. Sci. 2020, 510, 1–6. [Google Scholar]
- Lu, X.; Shi, Y.; Chen, C.; Yu, M. Monitoring cropland transition and its impact on ecosystem services value in developed regions of China: A case study of Jiangsu Province. Land Use Policy 2017, 69, 25–40. [Google Scholar] [CrossRef]
- Yin, D.; Li, X.; Li, G.; Zhang, J.; Yu, H. Spatio-temporal evolution of land use transition and its eco-environmental effects: A case study of the Yellow River Basin, China. Land 2020, 9, 514. [Google Scholar] [CrossRef]
- Chen, Z.; Huang, Y.B.; Zhu, Z.P.; Zheng, Q.Q.; Que, C.X.; Dong, J.W. Landscape pattern evolution along terrain gradient in Fuzhou City, Fujian Province, China. Ying Yong Sheng Tai Xue Bao (J. Appl. Ecol.) 2018, 29, 4135–4144. [Google Scholar]
- Yie, Q.; Chen, S.; Huang, C.; Xue, Y.; Tian, G.; Chen, S.; Shi, Y.; Liu, Q.; Liu, G. The characteristics of the modern landscape information map of the Yellow River Delta and its sub swing body development. Sci. China Ser. D Earth Sci. 2007, 37, 813–823. [Google Scholar]
- Tang, G.; Song, X.; Li, F.; Zhang, Y.; Xiong, L. Slope spectrum critical area and its spatial variation in the Loess Plateau of China. J. Geogr. Sci. 2015, 25, 1452–1466. [Google Scholar] [CrossRef] [Green Version]
- Zhou, C.; Sun, J.; Su, F.; Yang, X.; Pei, T.; Ge, Y.; Yang, Y.; Zhang, A.; Liao, X.; Lu, F.; et al. Geographic information science development and technological application. Acta Geogr. Sin. 2020, 75, 2593–2609. [Google Scholar]
- Chu, H.-J.; Liau, C.-J.; Lin, C.-H.; Su, B.-S. Integration of fuzzy cluster analysis and kernel density estimation for tracking typhoon trajectories in the Taiwan region. Expert Syst. Appl. 2012, 39, 9451–9457. [Google Scholar] [CrossRef]
- Tobler, W.R. A computer movie simulating urban growth in the Detroit Region. Econ. Geogr. 1970, 46, 234. [Google Scholar] [CrossRef]
- Smith, M.J.; Goodchild, M.F.; Longley, P.A. Geospatial Analysis—A Comprehensive Guide, 3rd ed.; Publishing House of Electronics Industry: Beijing, China, 2009. [Google Scholar]
- Chen, S.; Yue, T.; Li, H. Studies on geo-informatic TUPU and its application. Geogr. Res. 2000, 19, 337–343. [Google Scholar]
- Qi, Q. Methodology of Geographical Information Science; China Social Science Press: Beijing, China, 2016. [Google Scholar]
- Chen, S. Exploration and Research for Geo-Informatic TUPU; The Commercial Press: Beijing, China, 2001. [Google Scholar]
- Duan, Y.; Liu, Y.; Liu, X.; He, D. Measuring polycentric urban structure using Easy go big data: A case study of Chongqing metropolitan area. Prog. Geogr. 2019, 38, 1957–1967. [Google Scholar] [CrossRef]
- Duan, Y.; Liu, Y.; Liu, X.; Wang, H. Identification of polycentric urban structure of central Chongqing using points of interest big data. J. Nat. Resour. 2018, 5, 788–800. [Google Scholar]
- Luo, J.; Liu, Y.; Yue, W.; Huang, J. Evolution of urban spatial structure in a mountainous city: Transforming from linear expansion along valleys to polycentric urban development. Econ. Geogr. 2013, 33, 61–67. [Google Scholar]
- Chen, J.; Liu, Y.; He, D. Characteristics of urban sprawl in mountainous cities: A case of Chongqing. Mt. Res. 2018, 36, 432–440. [Google Scholar]


| First Class | Number of Second Class | Type of Second Class | Proportion (%) | ||
|---|---|---|---|---|---|
| 2015 | 2020 | ||||
| 1 | Chinese restaurant | 24 | Comprehensive, Sichuan cuisine, Northeast cuisine | 61.83 | 51.97 |
| 2 | Foreign restaurant | 18 | Americancuisine, Japanese and Korean cuisine, Indian cuisine | 1.59 | 1.69 |
| 3 | Fast food restaurant | 12 | KFC, McDonald’s, Yonghe Soy Milk | 6.06 | 11.45 |
| 4 | Leisure catering | 1 | Leisure catering places | 0.39 | 0.18 |
| 5 | Café | 5 | UCC Ueshima, Starbucks | 1.92 | 1.19 |
| 6 | Tea house | 1 | Restaurants featuring tea art | 6.75 | 4.66 |
| 7 | Cold drink shop | 1 | Beverage shops with cold drinks | 0.89 | 1.34 |
| 8 | Pastry shop | 1 | Shops featuring various kinds of pastries in China and abroad | 2.29 | 1.95 |
| 9 | Dessert shop | 1 | Shops featuring desserts | 1.54 | 0.52 |
| 10 | Catering-related place | 1 | Other physical restaurants registered on Gaud Map | 16.74 | 25.06 |
| Grade of Catering Service Hotspots | Quantity | Proportion | Mean Density | |||
|---|---|---|---|---|---|---|
| 2015 | 2020 | 2015 | 2020 | 2015 | 2020 | |
| Large | 6 | 21 | 0.51% | 1.50% | 4772.47 | 4616.21 |
| Medium to large | 44 | 81 | 3.81% | 5.81% | 1656.04 | 1729.55 |
| Medium | 74 | 139 | 6.41% | 9.98% | 924.38 | 894.49 |
| Medium to small | 171 | 259 | 14.81% | 18.60% | 401.71 | 406.69 |
| Small | 859 | 892 | 74.43% | 64.08% | 41.88 | 44.24 |
Publisher’s Note: MDPI stays neutral with regard to jurisdictional claims in published maps and institutional affiliations. |
© 2021 by the authors. Licensee MDPI, Basel, Switzerland. This article is an open access article distributed under the terms and conditions of the Creative Commons Attribution (CC BY) license (https://creativecommons.org/licenses/by/4.0/).
Share and Cite
Zhang, Y.; Min, J.; Liu, C.; Li, Y. Hotspot Detection and Spatiotemporal Evolution of Catering Service Grade in Mountainous Cities from the Perspective of Geo-Information Tupu. ISPRS Int. J. Geo-Inf. 2021, 10, 287. https://doi.org/10.3390/ijgi10050287
Zhang Y, Min J, Liu C, Li Y. Hotspot Detection and Spatiotemporal Evolution of Catering Service Grade in Mountainous Cities from the Perspective of Geo-Information Tupu. ISPRS International Journal of Geo-Information. 2021; 10(5):287. https://doi.org/10.3390/ijgi10050287
Chicago/Turabian StyleZhang, Yu, Jie Min, Chunxia Liu, and Yuechen Li. 2021. "Hotspot Detection and Spatiotemporal Evolution of Catering Service Grade in Mountainous Cities from the Perspective of Geo-Information Tupu" ISPRS International Journal of Geo-Information 10, no. 5: 287. https://doi.org/10.3390/ijgi10050287