Article

Monte Carlo Simulation of γγ Correlation Functions

1
Physics Department, Faculty of Science, Assiut University, Assiut 71516, Egypt
2
Institute of Advanced Energy, Kyoto University, Uji, Kyoto 611-0011, Japan
*
Authors to whom correspondence should be addressed.
Submission received: 1 January 2020 / Revised: 31 January 2020 / Accepted: 4 February 2020 / Published: 10 February 2020
(This article belongs to the Section Atomic, Molecular and Nuclear Spectroscopy and Collisions)

Abstract

:
γ γ correlation functions are mathematical expressions that describe the angular distribution of cascade γ -rays emitted from an atomic nucleus. Cascade transitions may occur in either a two-step deexcitation or through an excitation-deexcitation process of a particular energy level inside the nucleus. In both cases, the nucleus returns to its ground energy state. Spin and parity of the excited state can be determined experimentally using the asymmetry of the angular distribution of the emitted radiation. γ γ correlation functions are only valid for point-like targets and detectors. In the real experiments, however, neither the target nor the detector is point-like. Thus, misassignment of the spin-parity of energy levels may easily take place if only the analytical equations are considered. Here, we develop a new Monte Carlo simulation method of the γ γ correlation functions to account for the extended target and detector involved in spin-parity measurements using nuclear resonance fluorescence of nuclei. The proposed simulation tool can handle arbitrary geometries and spin sequences. Additionally, we provide numerical calculations of a parametric study on the influence of the detection geometry on the angular distribution of the emitted γ -rays. Finally, we benchmark our simulation by comparing the simulation-estimated asymmetry ratios with those measured experimentally. The present simulation can be employed as a kernel of an implementation that simulates the nuclear resonance fluorescence process.

1. Introduction

Resonance fluorescence of an atom or a nucleus is one of the richest sources of our information about the structure of these too-small-to-see systems. Many aspects of quantum theory have been proven by X-ray and γ -ray spectroscopies. The availability and developments of photon sources with polarization capabilities have provided accurate means to measure the spin and parity of the nuclear energy levels in the laboratory. As an example, the polarized γ -rays generated by laser Compton scattering (LCS) are being used in nuclear structure studies that focus on the determination of spin and parity [1,2]. The technique of using polarized γ -ray beams offers an unambiguous estimation of the spin and parity, while the main detection system is simply γ -ray spectroscopy. Furthermore, many applications rely on the resonance fluorescence, especially in nuclear safeguards and nuclear security [3,4,5].
Owing to the significance of the nuclear resonance fluorescence (NRF), many simulation works were conducted [6,7,8]. For example, Jordan and Warren [7] and Hayakawa et al. [8] developed a Monte Carlo simulation for the NRF process. More recently, Vavrek et al. [9,10] have upgraded the simulation model of Jordan and Warren to enhance its accuracy. They have tested the simulation model, which lowered the discrepancy between the simulation and experiment to approximately 15 % . However, all of these attempts considered the scattering of unpolarized photons limited by the specific resonances of some nuclei. Other simulation works were performed by Omer and Hajima [11,12] and Turturica et al. [13] on the elastic scattering as a beam background. Nonetheless, the literature is missing a Monte Carlo simulation for γ γ correlation functions, which are crucial for the nuclear decays.
Monte Carlo simulation is an indispensable tool to represent the extended volumes of the targets and detectors correctly. Here, we develop a Monte Carlo calculation framework of γ γ correlation functions as the basic constituent of the formalism of NRF interactions. The simulation is then exploited to conduct a parametric study to investigate the effect of the detection geometry on the spin-parity assignment of nuclear levels. We demonstrate that at certain geometries, the anisotropic parameters may be changed by a factor of ≥100%, which certainly can lead to misassignment of the spin-parity of the levels. Although our simulation focuses on γ γ correlation functions, it can be extended to include other correlation functions, such as α γ or β γ correlations.
In the following section, we briefly introduce the formalism of the angular correlation involved in the NRF interaction. Then, we show in detail how we implement a Monte Carlo simulation-based of this formalism. We discuss some examples of the simulation in Section 3. These examples are carefully selected to match real NRF experiments. Finally, we summarize the results of the simulation and provide an outlook for applying the simulation in future research works.

2. Method

2.1. Angular Correlation Formalism

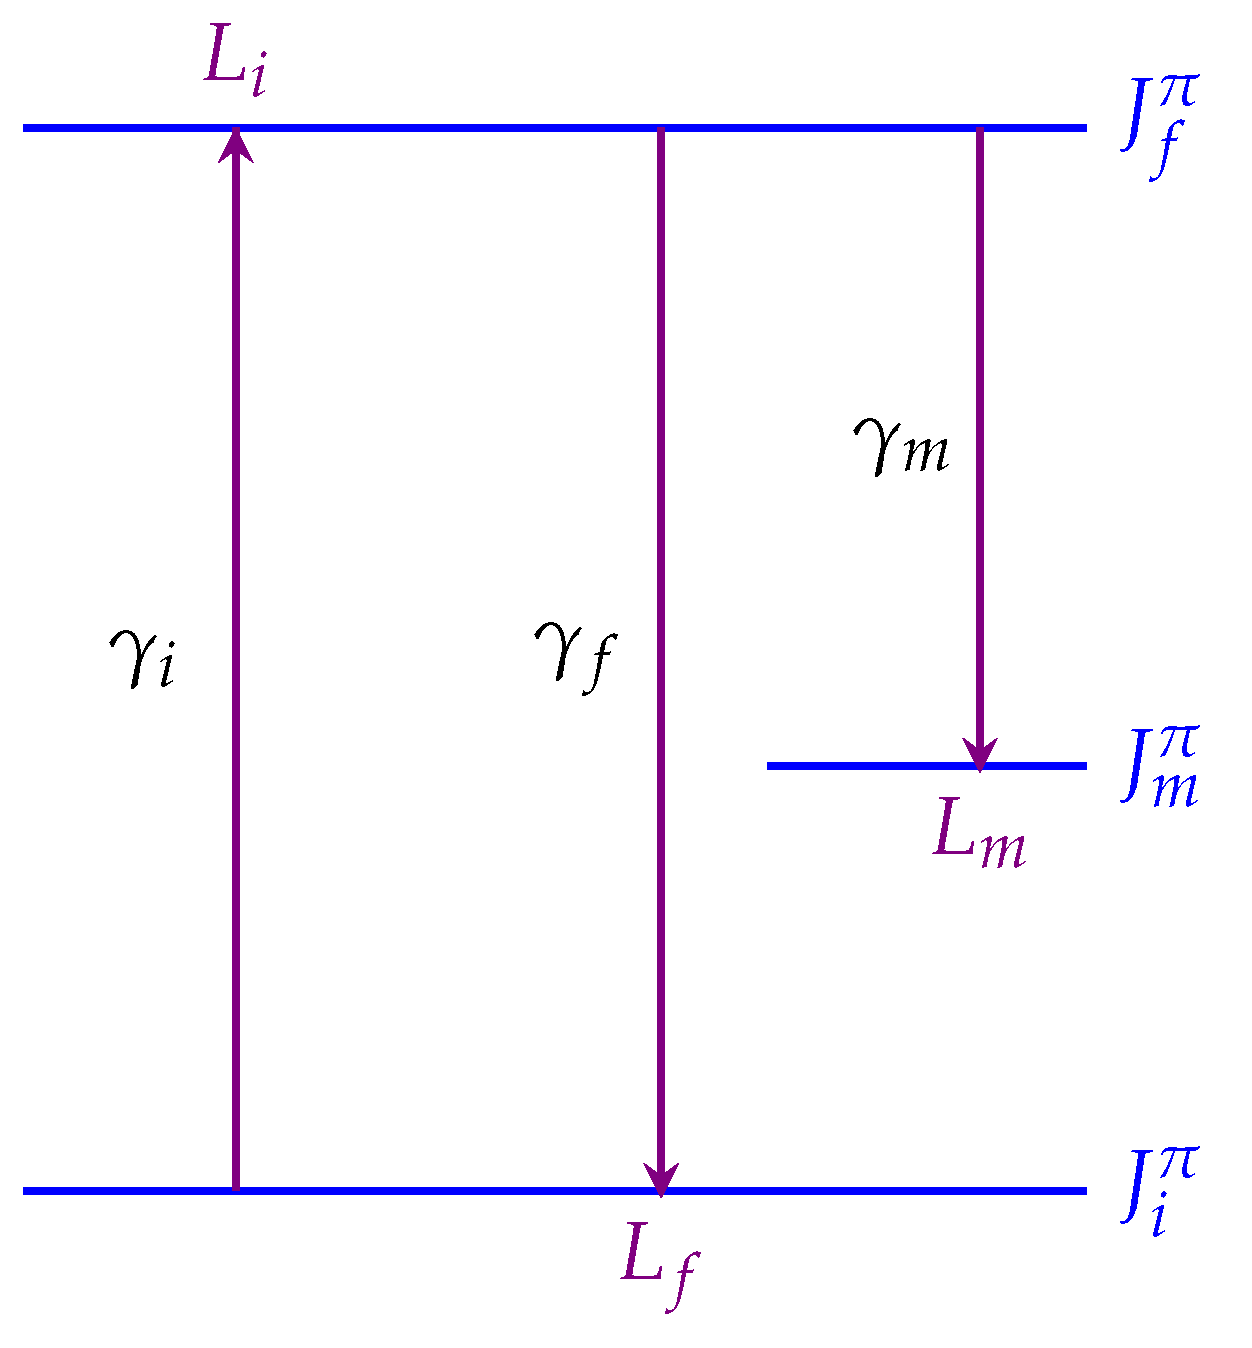
The spins of the ground and excited states and the multipolarity involved in the transition are fundamental quantities constructing the angular correlation function of the emitted photons. The level diagram, shown in Figure 1, is a general case of an excitation involved in an NRF measurement. The initial state J i π represents the ground state of the nucleus, while J f π is the final state stemming from excitation of a multipolarity L i . After populating the final state, it deexcites either to the ground state again or to a low-lying energy level. In the latter case, the nucleus may deexcite to an intermediate level with a spin of J m π . In such a situation, the NRF excitation is said to have a probability to deexcite to a low-lying energy level, likely the first excited state. The multipolarity of the deexcitation is L f .
When the nucleus is excited with a well polarization-defined γ -ray photon, the angular distribution of the re-emitted photons is given by [14]
W ( θ , ϕ ) = k = 0 , 2 A k ( γ i ) A k ( γ f ) P k ( cos θ ) + ( ± ) L cos 2 ϕ k = 0 , 2 B k ( γ i ) A k ( γ f ) P k 2 ( cos θ ) ,
where θ is the angle between the direction of the first radiation γ i and the second radiation γ f , denoted here by the scattering angle. In the NRF process, γ i and γ f are simply the incident and re-emitted (or scattered) photons, respectively.
P k ( cos θ ) and P k 2 ( cos θ ) are the ordinary and associated Legendre polynomials of the order k respectively. The two summations of Equation (1) over k are over all even numbers for which the transition coefficients, A k γ , and linear polarization coefficient, B k γ , do not vanish. The factor ( ± ) L is the parity coefficient, which is 1 for the magnetic dipole transition M 1 , and + 1 for the electric dipole transition E 1 . ϕ is the angle between the polarization of the incident photon and the scattering plane, which is formed by the momentum direction of the incident and the scattered photons. It should be noted that the first term of Equation (1) is the angular distribution function, W θ , in case that the incident photon is unpolarized. The excitation transition coefficient A k γ i is given by
A k ( γ i ) = F k L i L i j i j f + 2 δ F k L i L i j i j f + δ 2 F k L i L j i j f 1 + δ 2
where δ is the mixing ratio of the two multipolarities L i and L i = L i + 1 . For a pure dipole or quardupole transition, δ = 0 . This leads to A k ( γ i ) = F k ( L i L i j i j f ) where F k ( L i L i j i j f ) are the F-coefficients, which may be given as
F k L i L i j i j f = 1 j f + j i 1 2 L i + 1 ( 2 j f + 1 ) 2 k + 1 1 / 2 L i L i k 1 1 0 3 j symbol j f j f k L i L i j f 6 j symbol
General expressions for the 3j-and 6j-symbol can be found in references [15,16], and are given by Equations (4) and (5), respectively.
j 1 j 2 j 3 m 1 m 2 m 3 = 1 j 1 j 2 m 3 × j 1 + j 2 j 3 ! j 1 j 2 + j 3 ! j 1 + j 2 + j 3 ! j 1 + m 1 ! j 1 m 1 ! j 2 + m 2 ! j 2 m 2 ! j 3 + m 3 ! j 3 m 3 ! j 1 + j 2 + j 3 ! 1 / 2 × k 1 k k ! j 1 + j 2 j 3 k ! j 1 m 1 k ! j 2 + m 2 k ! j 3 j 2 + m 1 + k ! j 3 j 1 m 2 + k ! .
j 1 j 2 j 3 m 1 m 2 m 3 = 1 j 1 + j 2 + m 1 + m 2 Δ j 1 j 2 j 3 Δ m 1 m 2 j 3 Δ m 1 j 2 m 3 Δ j 1 m 2 m 3 × k 1 k j 1 + j 2 + m 1 + m 2 + 1 k k ! j 1 + j 2 j 3 k ! m 1 + m 2 j 3 k ! m 1 + j 2 m 3 k ! j 1 m 1 + j 3 + k ! j 2 m 2 + j 3 + k ! ,
where
Δ x y z = x + y z ! x y + z ! x + y + z ! x + y + z + 1 ! 1 / 2
Similarly, one can easily write the deexcitation transition coefficient as A k ( γ f ) = F k ( L f L f j f j i ) . Finally, to determine the polarization coefficient, it is convenient to use the expression B k ( γ i ) = κ ( L i L i ) F k ( L i L i j i j f ) , where the coefficient κ ( L i L i ) can be found in references [14,17].

2.2. Anisotropy

Anisotropy of the angular distribution of the emitted γ -rays is the key factor to identify the spin of the excited states. The anisotropy is estimated by the experimental observables, which include the asymmetry ratio A and the angular distribution ratio R . The asymmetry requires two simultaneous measurements at a particular scattering angle. The first measurement is parallel to the polarization plane of the incident photon ( ϕ = 0 ), while the other one is orthogonal to the polarization plane ( ϕ = π / 2 ). The asymmetry ratio is simply the ratio between the difference and the summation of the two measurements,
A θ = W θ , 0 W θ , π / 2 W θ , 0 + W θ , π / 2
Unlike the asymmetry ratio, the angular distribution ratio requires four simultaneous measurements with two of them at a scattering angle of θ 1 parallel and orthogonal to the polarization plane, while the other two follow the same manner at a different scattering angle, θ 2 . R θ 1 , θ 2 is then defined by ratio of the summations over the parallel direction to the summation of the orthogonal direction,
R θ 1 , θ 2 = W θ 1 , 0 + W θ 1 , π / 2 W θ 2 , 0 + W θ 2 , π / 2
Interestingly, the symmetry properties of Legendre polynomials dictate that R θ 1 , θ 2 is independent on the azimuth angle ϕ . Consequently, it can be used either in the case that the incident beam is linearly polarized [18] or in the case that the incident beam in unpolarized [19]. In the latter case, estimating R θ 1 , θ 2 requires only two simultaneous measurements at two different angles within the scattering plane.
We calculated the angular correlation functions (see Appendix A for the final formulas) using the method illustrated in the previous subsection. For the even-even nuclei, the spin of the ground state is j i = 0 + . The allowed transitions involved in the NRF interaction are limited to dipole and quadrupole. The probability of magnetic quadrupole transition, M 2 , is too small to be considered. Therefore, the spin of the excited state is j f = 1 ± for dipole or j f = 2 + for quadrupole transition. Ideal asymmetries and radiation patterns of M 1 and E 2 transitions are shown in Figure 2. The  E 1 transition is identical to the M 1 transition but rotated by 90. Therefore, M 1 and E 1 transitions can be easily distinguished by A θ = π / 2 which is + 1 for M 1 and 1 for E 1 . However, A θ = π / 2 cannot be used to distinguish M 1 from E 2 because A θ = π / 2 = + 1 for both. In this case, A θ = 3 π / 4 = 1 + 1 3 for quadrupole (dipole) can be exploited. Similarly, R θ can distinguish dipoles from quadrupole transitions, but this is not the case for M 1 and E 1 .
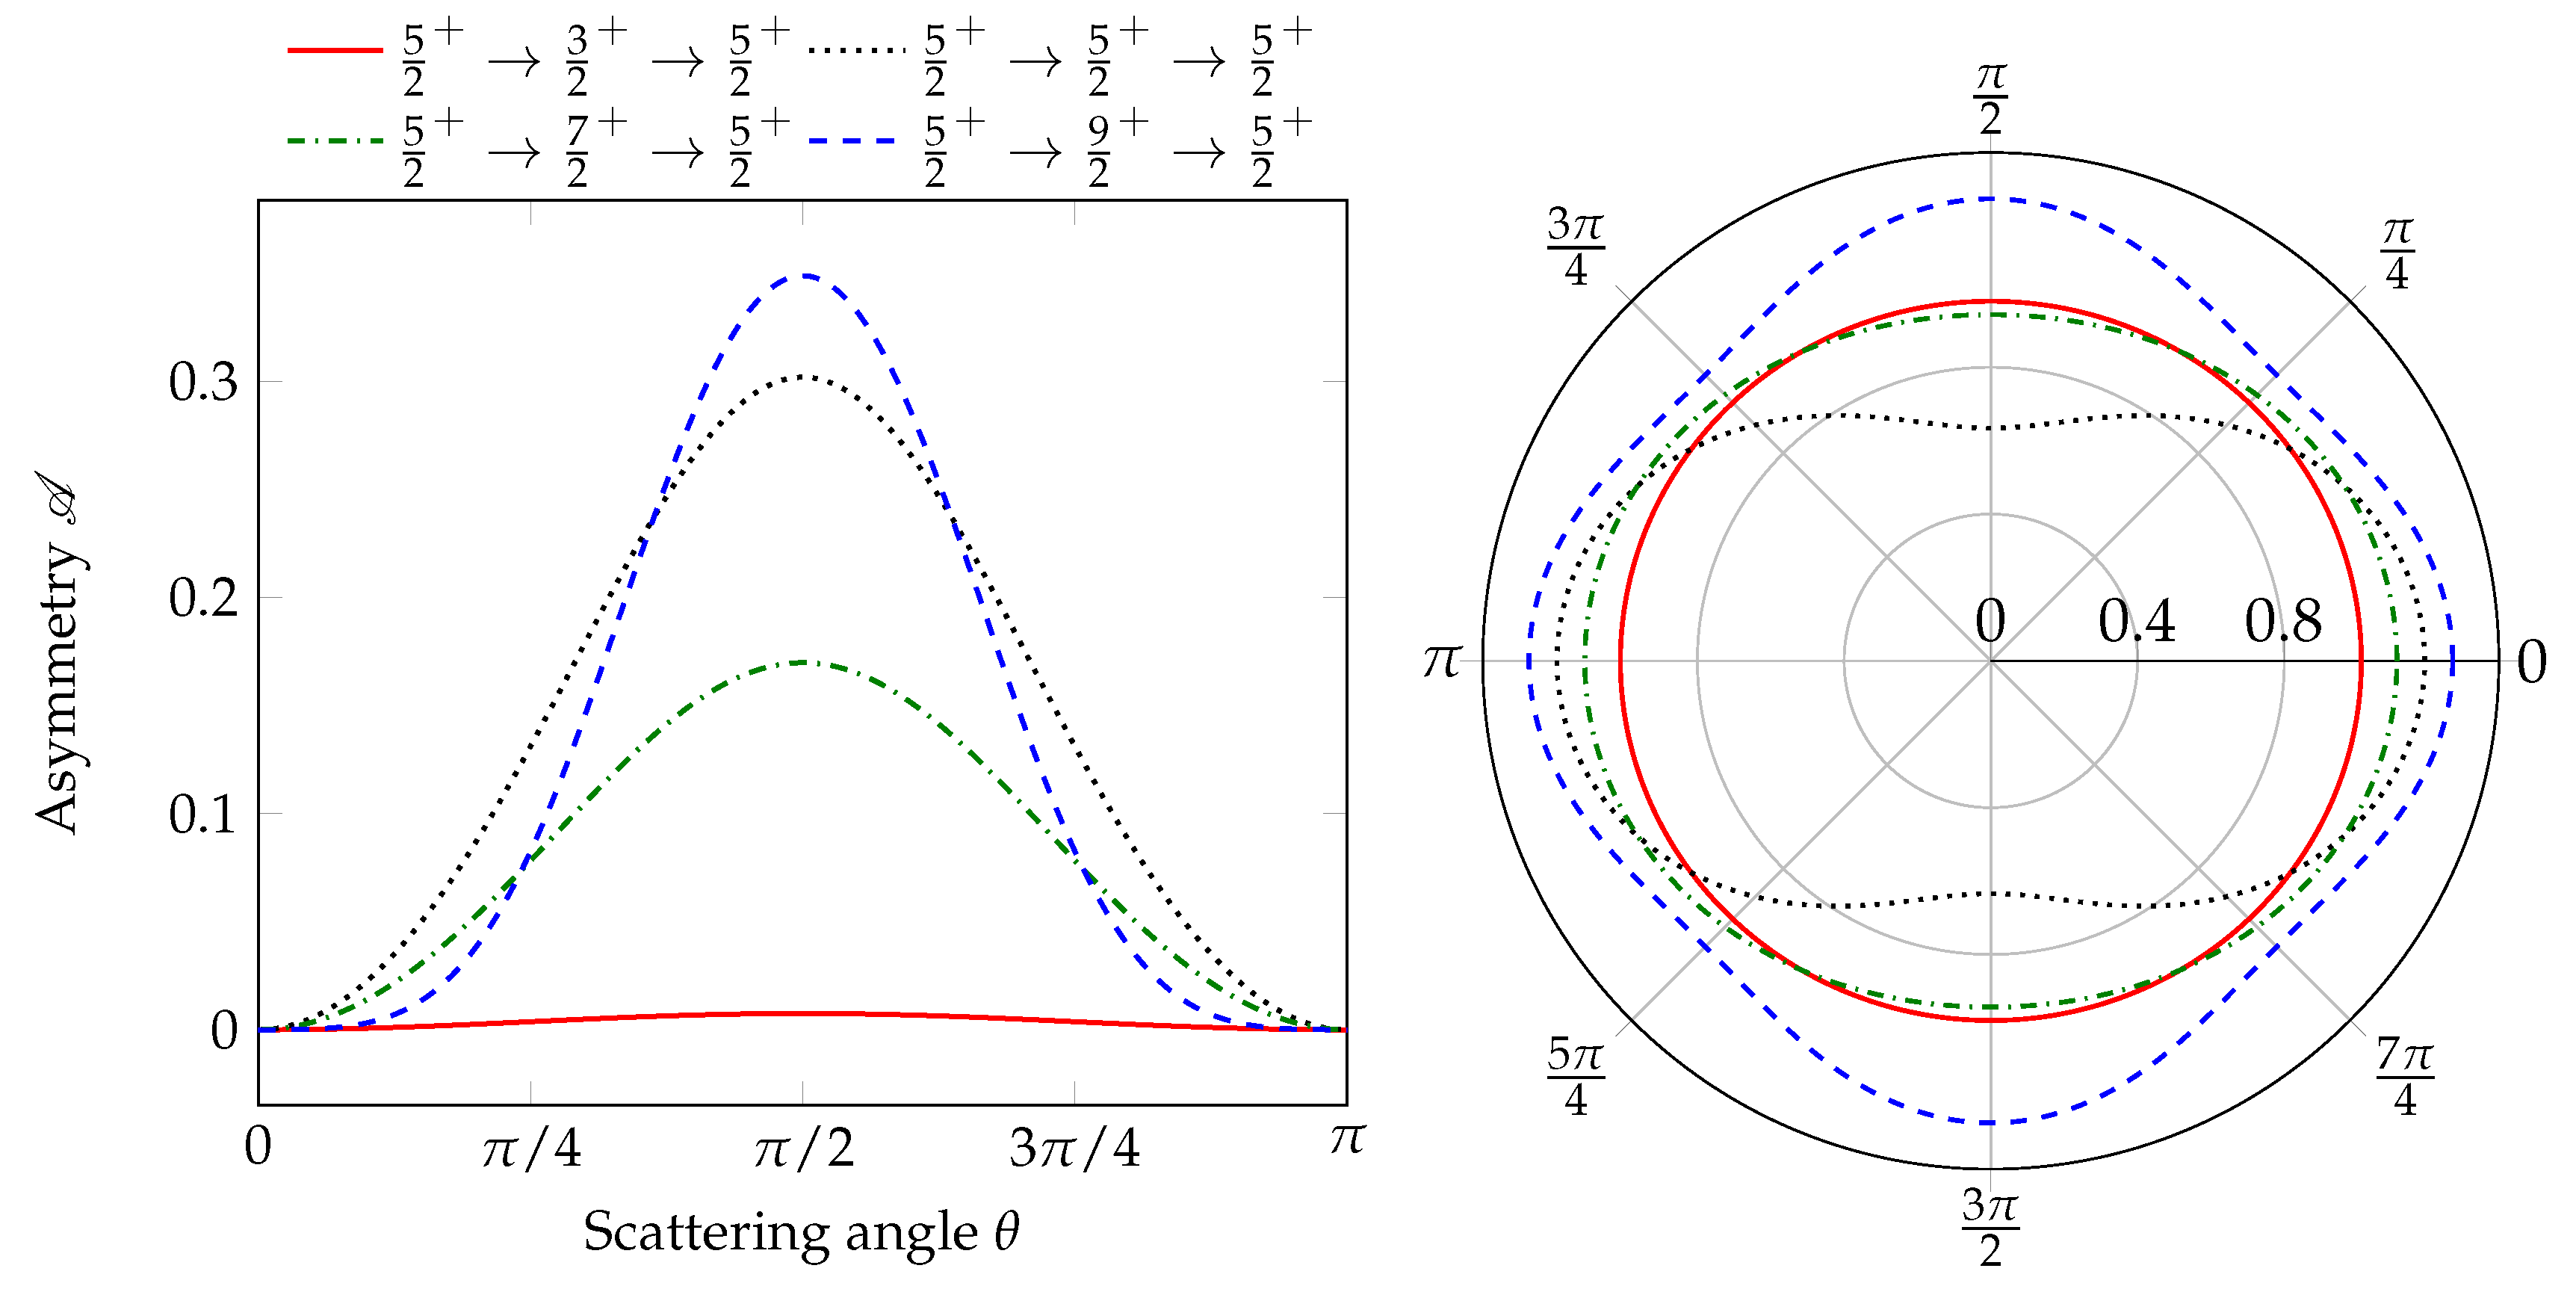
The situation is more complicated with odd nuclei, which are characterized by half-integer ground state spin. Figure 3 demonstrates A θ and patterns of four possible transitions of a nucleus with a ground state spin of 5 2 . The allowed spins of the excited state include 3 2 , 5 2 , or 7 2 for dipole and 9 2 for quadrupole. Except for the spin sequence 5 2 3 2 5 2 with almost isotropic angular distribution, it is easy to distinguish the parity of the dipole transition. In contrast, the sensitivity of A θ and R θ to differentiate the dipole from the quadrupole transitions of the excited state is lower than the even-even nuclei. For example, A θ = π / 2 for the spin sequence of 5 2 5 2 5 2 is 0.302 , while it is 0.349 for the spin sequence of 5 2 9 2 5 2 . Furthermore, A θ = 3 π / 4 for the two spin sequences 5 2 7 2 5 2 and 5 2 9 2 5 2 is equal. Nonetheless, the closer the angular distributions of the spin sequences, the more probability to misassign the spin and parity of a certain level and the greater the need to accurately account for the geometrical conditions by Monte Carlo simulation.

2.3. Monte Carlo Simulation

Geant4 [20] is a powerful Monte Carlo simulation toolkit dedicated to simulating particle transport in matter. In Geant4, all particle interactions with matter are tracked. Parameters of the particle, such as position, momentum, and energy, can be retrieved at almost every step from the generation of the particle to the point where the particle is made to dump. Our procedure for the simulation model of γ γ correlation functions consisted of three major steps. The first step was to prepare the prerequisites for the simulation. Then, we modeled the event generator. Finally, we modeled the detection geometry and computed the asymmetries as a function of the scattering geometry and spin sequence.

2.3.1. Prerequisites

In the design of the simulation model, we considered that the geometrical parameters of the NRF process were known prior to the simulation. The parameters include the following:
  • Spin sequence of the expected NRF transition, which means the spin of the ground and excited states.
  • Dimensions of the target and the detectors.
  • Detection geometry, including target and detector sizes and their positions with respect to each other.
We introduced a new class within the frame of the Geant4 toolkit; namely, FCoefficients class. The class returns F-coefficients based on the spin sequence, according to Equation (3). It should be emphasized that we tested the FCoefficients class for the F-coefficients with all constituents, e.g., 3j- and 6j-symbols, and compared them with the tabulated data of references [15,16]. We found no differences between our coded calculations and the reference values.

2.3.2. Event Generator

We developed a new class, which is inherited from the Geant4 event generation class; namely, G4PrimaryGeneratorAction. In this class, we introduced two functions aimed at generating the position and momentum of photons emitted from the target. One function was dedicated to generating the dipole transition patterns depending on the desired spin sequence, while the other function was responsible for the generation of quadrupole patterns. In both functions, we employed the rejection sampling method to sample the momentum of the emitted photons randomly.
The shape and size of the target were controlled by the G4PrimaryGeneratorAction class. The positions from which the emitted photons started were homogeneously sampled over the whole size of the target. In the present study, we considered a cylindrical target of radius R t and length λ t whose axis coincides with the z-axis. However, the target shape may be changed to match any specific experimental setup.
We adapted the G4PrimaryGeneratorAction class such that the emitted particles were of the geantino virtual photons. Hence, there were no interactions considered through the virtual photons’ transport. The virtual photons, geantinos, are identical to the mathematical vectors. The particles were generated at the beginning of the simulation and continued to move in straight lines until they were counted by a detector located at the desired position.

2.3.3. Detection Geometry

In our simulation, we employed the G4DetectorConstruction class to build a detection geometry similar to those usually used in typical NRF measurements [1,18]. In such detection geometry, we positioned four detectors, each of radius R d and length λ d , such that their surfaces were at a distance d from the center of the target. Furthermore, the center of the target was located at the center of the detection system. The four detectors were positioned at θ , ϕ of π / 2 , 0 , π / 2 , π / 2 , 3 π / 4 , π , and 3 π / 4 , 3 π / 2 . The numbers of geantinos arriving at each detector, C θ , ϕ , were counted at the end of the simulation. Then, the simulation-expected values of the asymmetry ratios A Sim π / 2 and A Sim 3 π / 4 , and the angular distribution ratio R Sim π / 2 , 3 π / 4 , were calculated from
A Sim π / 2 = C π / 2 , 0 C π / 2 , π / 2 C π / 2 , 0 + C π / 2 , π / 2
A Sim 3 π / 4 = C 3 π / 4 , π C 3 π / 4 , 3 π / 2 C 3 π / 4 , π + C 3 π / 4 , 3 π / 2
R Sim π / 2 , 3 π / 4 = C π / 2 , 0 + C π / 2 , π / 2 C 3 π / 4 , π + C 3 π / 4 , 3 π / 2
The relative statistical uncertainty at a 95 % confidence level of each count was calculated from the following relation [21],
Δ C ( θ , ϕ ) C ( θ , ϕ ) = 1.96 N C ( θ , ϕ ) N × C ( θ , ϕ ) 1 / 2
where N is the number of the simulated events. In fact, depending on the geometric conditions and the spin sequence of the transition, the number of the simulated events ranged from 1 × 10 7 to 5 × 10 9 such that the relative uncertainty was ≤1%.

3. Results and Discussion

Our method described in the previous section can generally be used for arbitrary spin sequences and detection geometries. Here we show the results of Monte Carlo simulation of four examples. Two of them are for the dipole and quadrupole transitions of even-even nuclei as examples of ground states with integer spins. The spin sequences 0 1 0 and 0 2 0 are discussed. The other two examples illustrate how the detection geometry affects the observed quantities for nuclei of ground state with a spin of 5 2 , as example for ground states with half-integer spins. The spin sequences 5 2 5 2 5 2 and 5 2 9 2 5 2 are described.

3.1. Integer-Spin Ground States

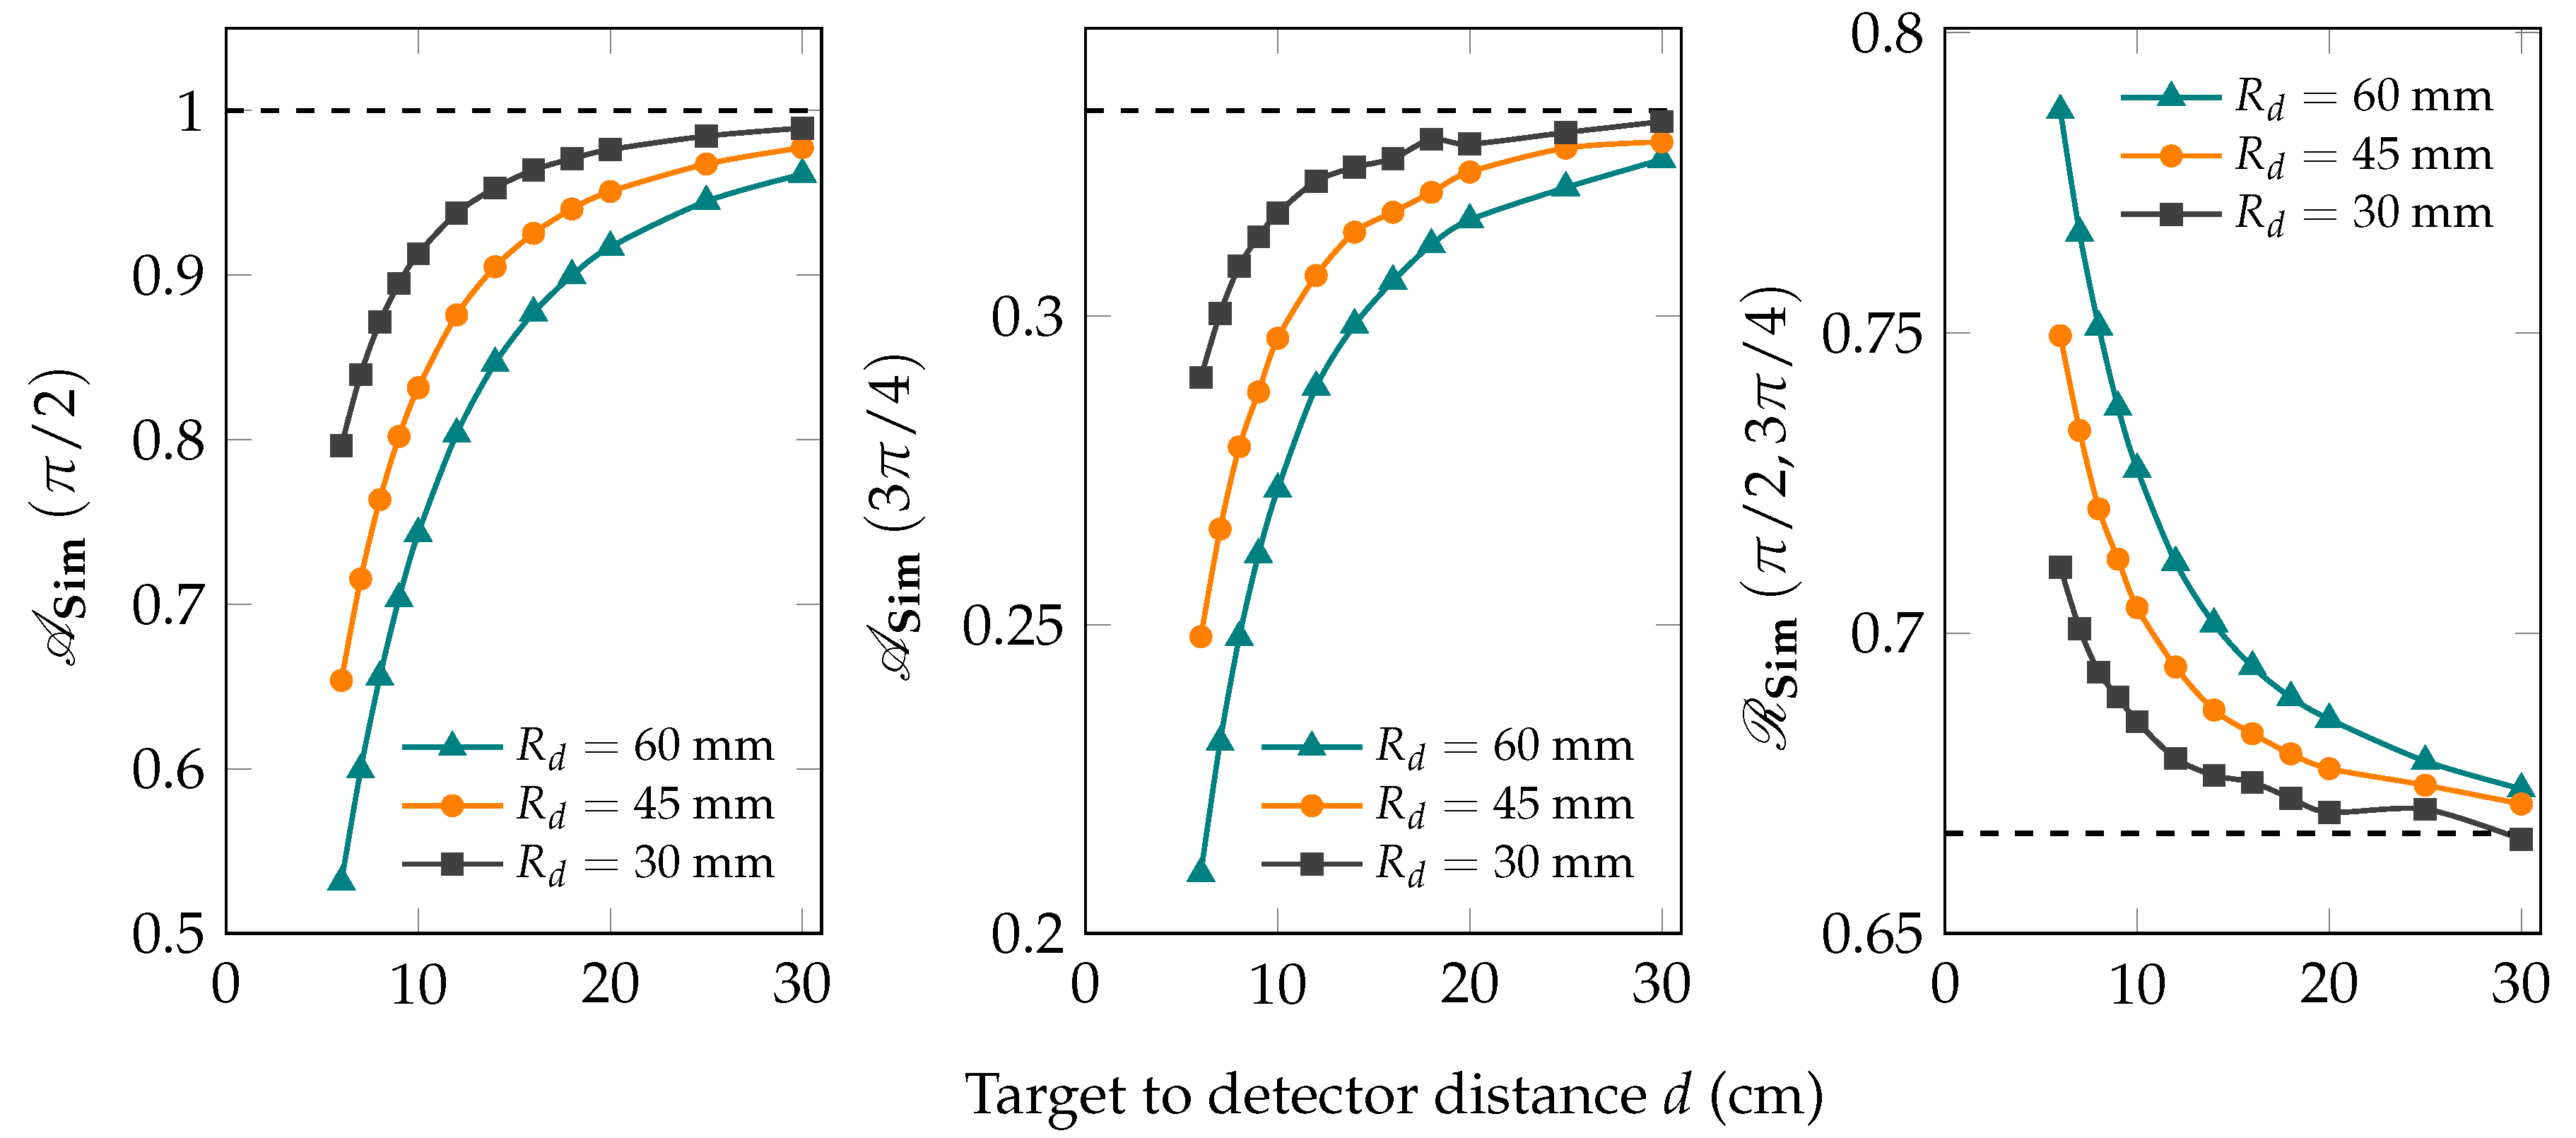
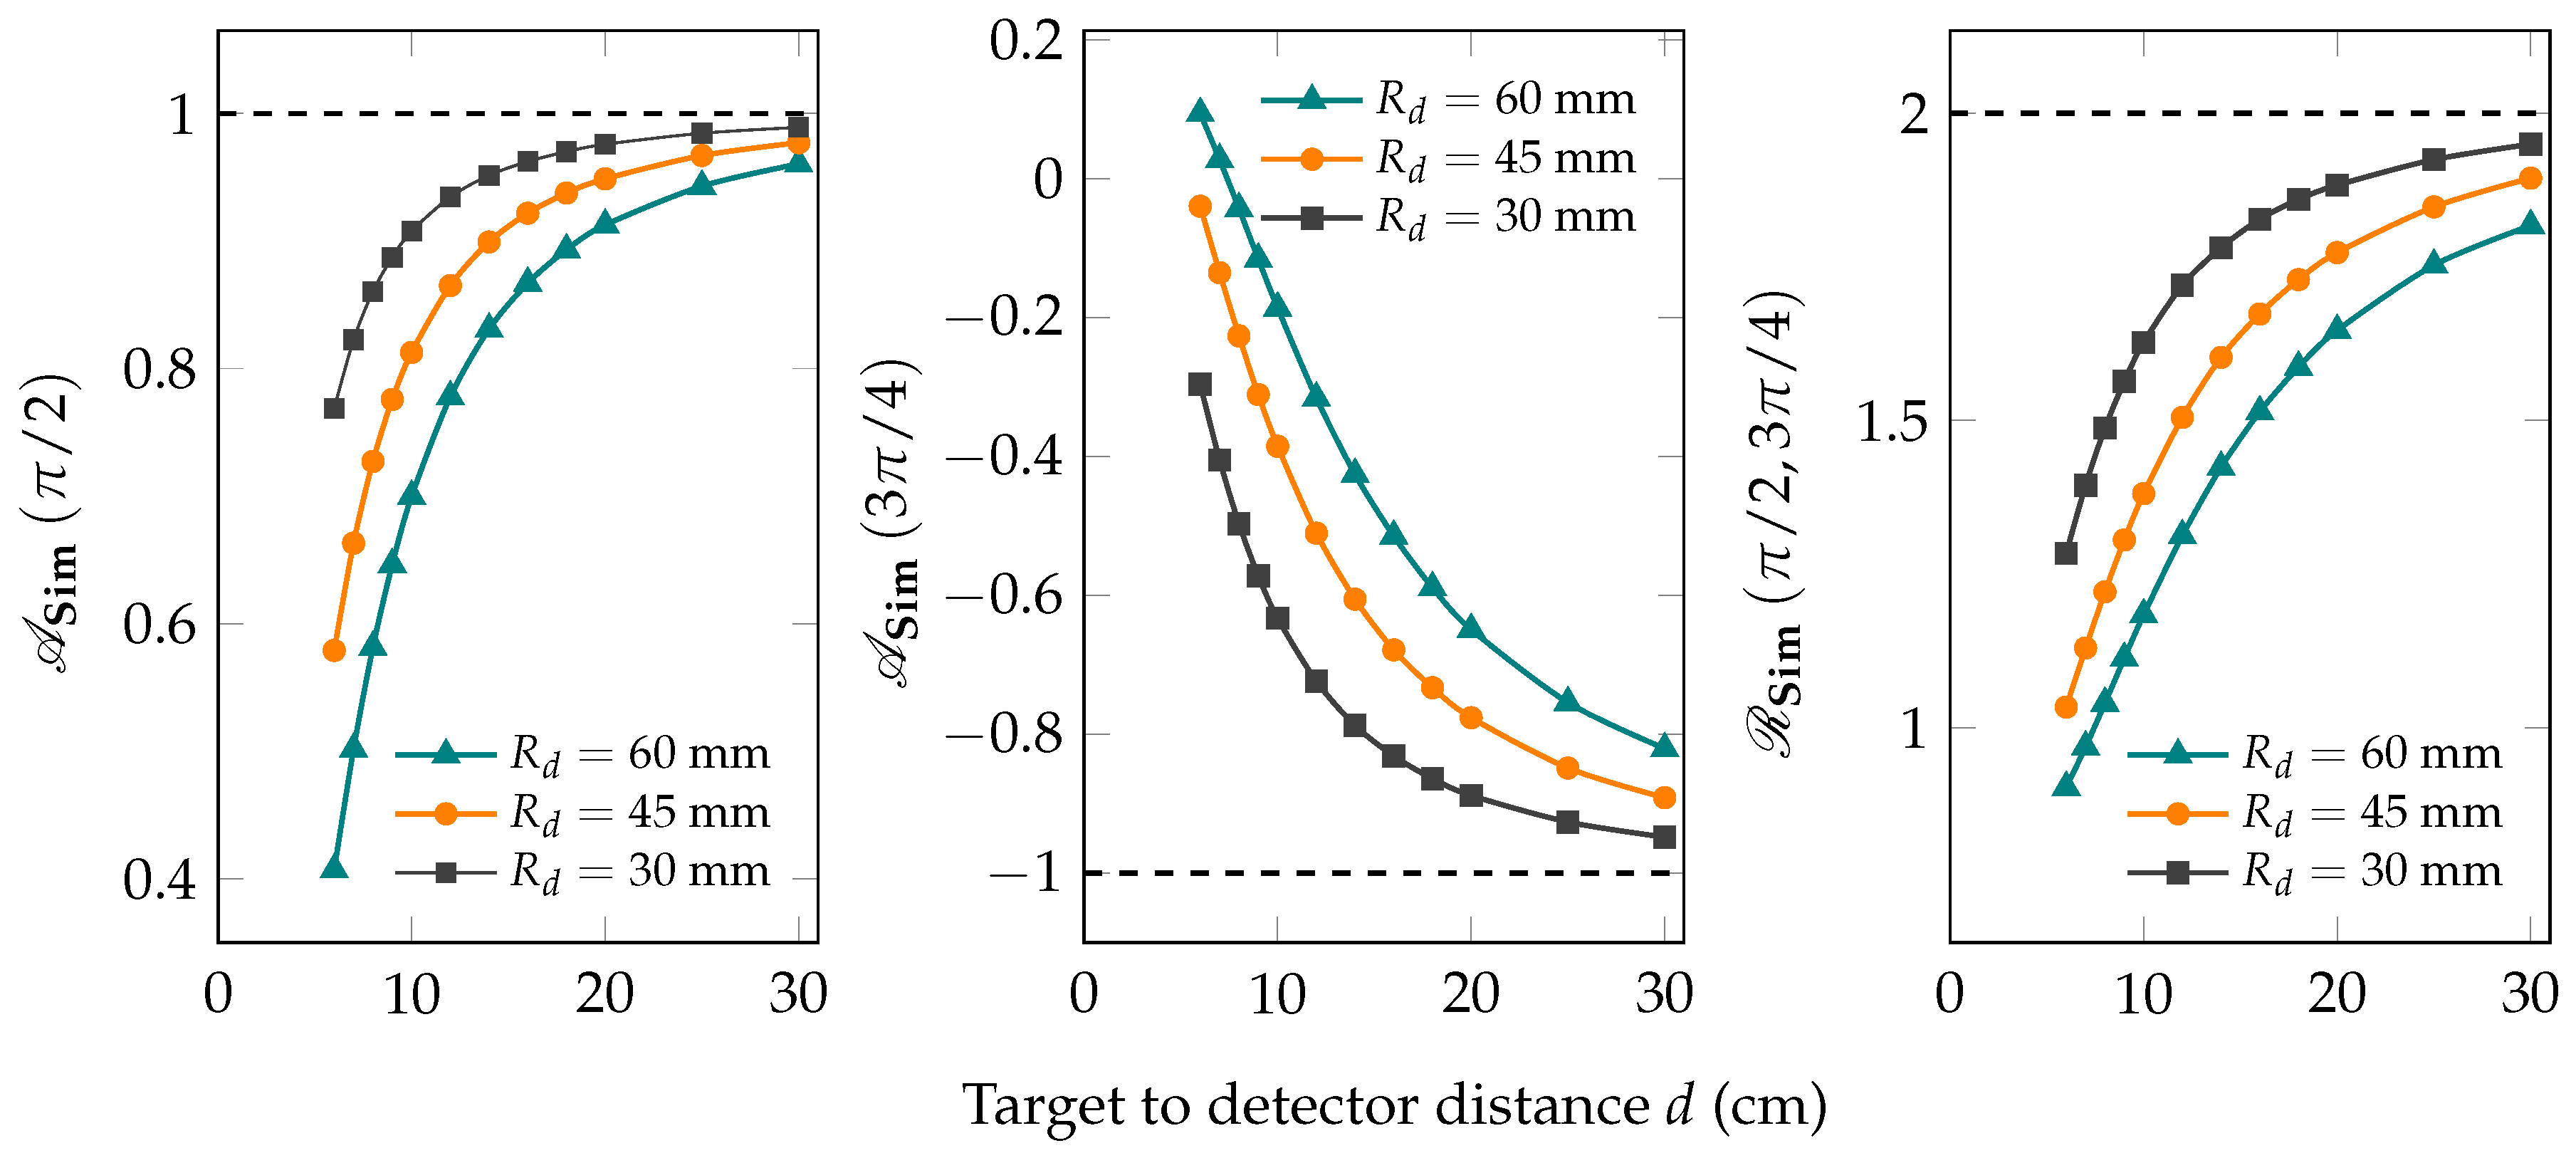
To demonstrate the effect of the detection geometry on the angular distribution in an NRF measurement, we performed a large number of simulations at different geometrical conditions. Figure 4 shows how the asymmetry and angular distribution ratios of the dipole transition corresponding to the spin sequence 0 1 0 are affected by the detector radius and target-to-detector distance. Generally, the asymmetry ratios decreases as the target-to-detector distance decreases. This is because when the distance between the target and the detector decreases, the solid angle that the target subtends the detector increases. Thus, the number of photons counted within the detector are not only those photons emitted at an angle of θ but also photons emitted at θ ± Δ θ , where Δ θ is the angular acceptance of the detector as seen by the target. However, the decrease of A Sim ( π / 2 ) is faster than A Sim ( 3 π / 4 ) when decreasing the target-to-detector distance. For example, when the detector radius is 30 mm, A Sim ( π / 2 ) decreases to 80 % of the ideal value when the d changes from 5 to 30 mm, while A Sim ( 3 π / 4 ) decreases only to 87 % of the ideal value by the change over the same distance. This difference arises from the fact that at π / 2 , there is a maximum value of A Sim ( θ ) , which means A Sim ( θ ) has lower values at either side; that is, A Sim ( θ < π / 2 ) < A Sim ( θ = π / 2 ) > A Sim ( θ > π / 2 ) , as shown in Figure 2. On the contrary, at 3 π / 4 there is no maxima which leads to A Sim ( θ < 3 π / 4 ) < A Sim ( θ = 3 π / 4 ) < A Sim ( θ < π / 2 ) . In practice, an NRF experiment may be conducted using a close geometry with small target-to-detector distance and big detector aiming at enhancing the counting rates. For such close geometry ( d = 6 mm and R d = 60 mm) A Sim ( θ = π / 2 ) drops to 53 % of its ideal value, while A Sim ( θ = 3 π / 4 ) drops to 63 % of its ideal value. This reduction reflects the significance of taking the extended detector into consideration.
In contrast to the asymmetry ratios, the angular distribution ratio R Sim ( π / 2 , 3 π / 4 ) increases when the distance d gets shorter. From the definition of R Sim ( π / 2 , 3 π / 4 ) , Equations (7) and (10), the second term of the numerator, W ( π / 2 , π / 2 ) , vanishes for the dipole transition with spin sequence 0 1 0 . But for the extended detector, W ( π / 2 , π / 2 ) 0 and gets larger for larger solid angles. Therefore, R Sim ( π / 2 , 3 π / 4 ) increases at larger solid angle (smaller target-to-detector distance).
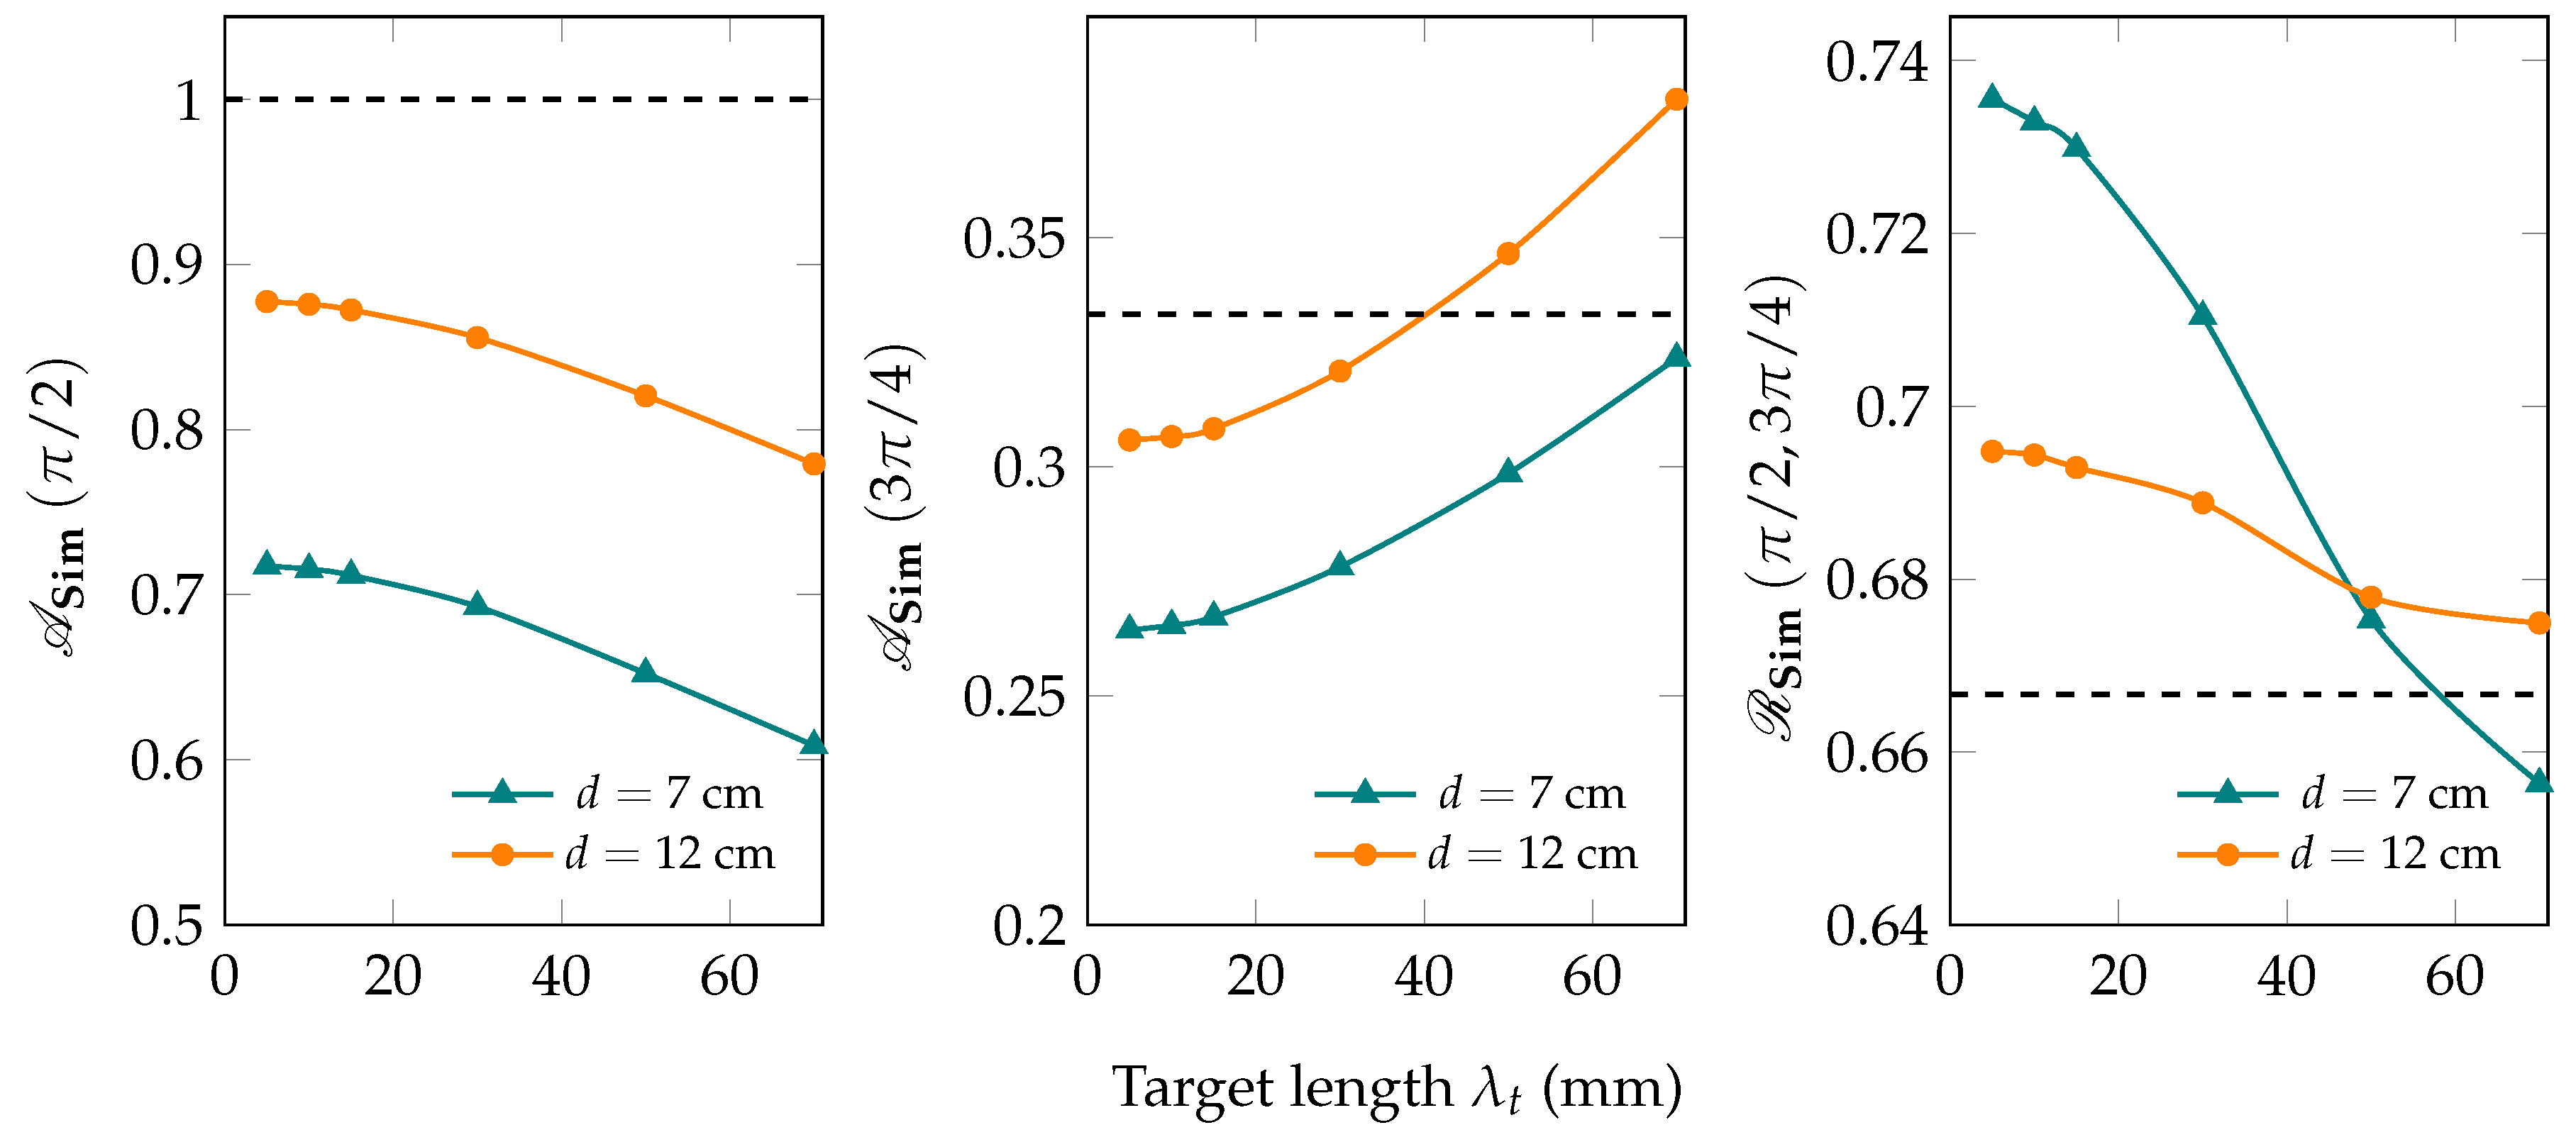
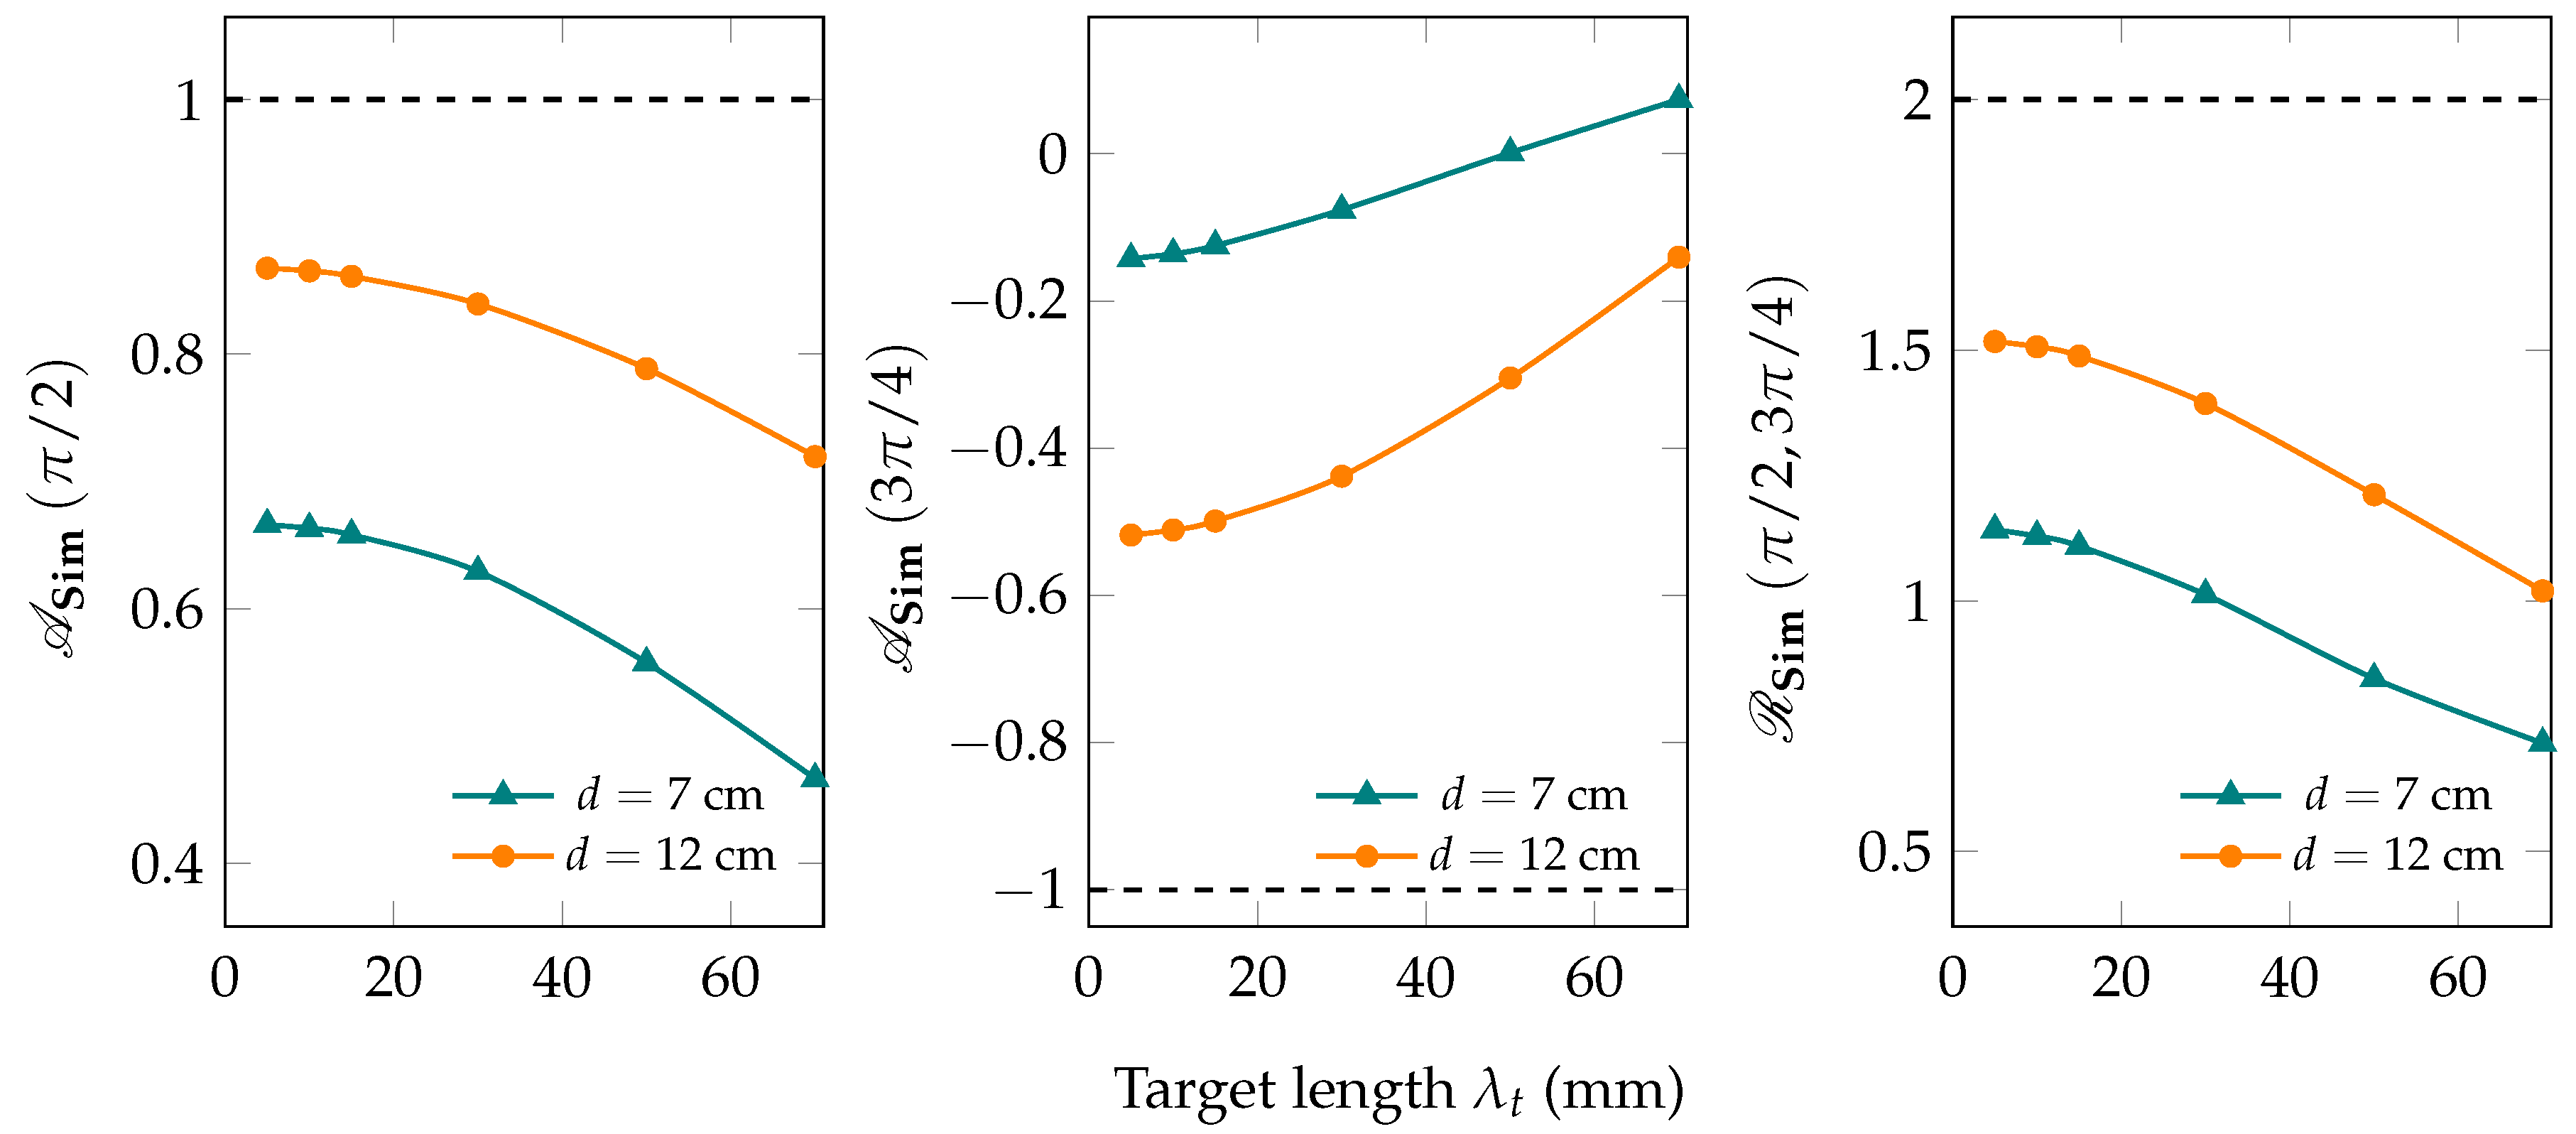
To demonstrate the effect of the dimensions of the target, we carried out some simulations at different target lengths and radii while fixing the detector radius at 45 mm. Figure 5 shows the variation of the asymmetry and angular distribution ratios when the target length is changed from 5 to 70 mm. It should be emphasized that, in real experiments, the target length is selected based on the density of the target and the expected counting rates of the detectors. For dense targets, e.g., Pb or Ta, several-millimeter-long targets are usually sufficient to produce reasonable counting rates in NRF experiments. However, if the target is of low density, e.g., Al or Sn, several-centimeter-long targets are usually used. Therefore, the range of target lengths shown in Figure 5 represents a wide range of values that are used by the experiment. The target length decreases A Sim ( π / 2 ) by a factor of 15 % over the whole range of target lengths considered in the present study. The effect of target length is smaller at a greater target-to-detector distance (decrease of 15 % and 11 % at d = 7 and d = 12 cm, respectively). R Sim ( π / 2 , 3 π / 4 ) decreases as well with the increase of the target length by a factor of 17 % at d = 7 and 8 % at d = 12 cm. Opposing A Sim ( π / 2 ) , A Sim ( 3 π / 4 ) increases by a factor of approximately 20 % , almost independent of d, with the increase of the target length. This may be explained in terms of the inclined position of the detector located at 3 π / 4 with respect to the target.
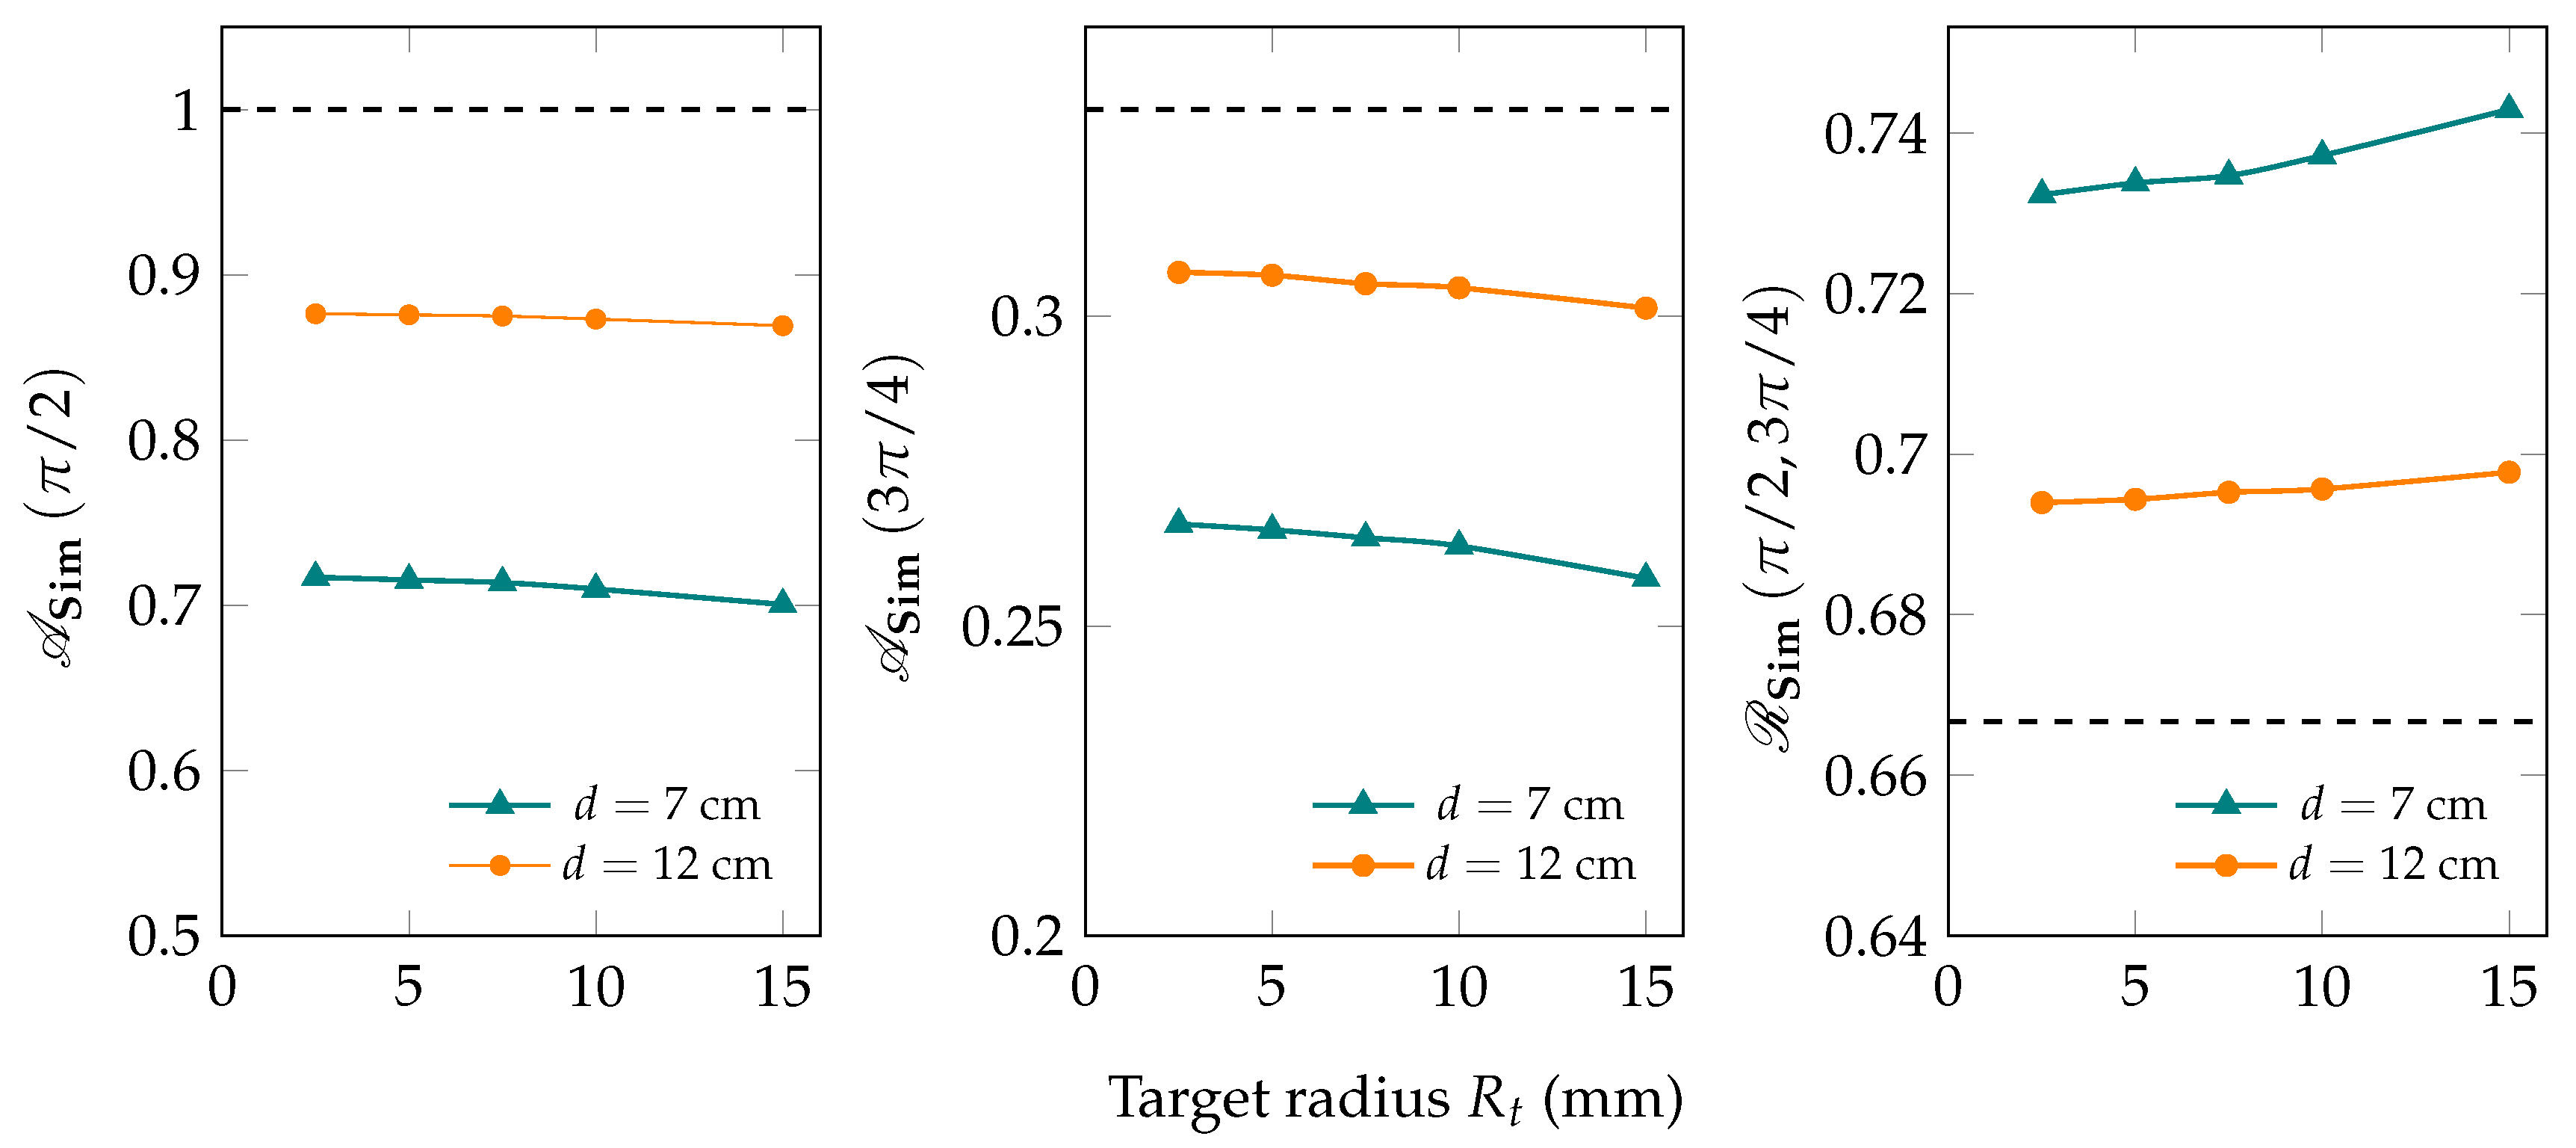
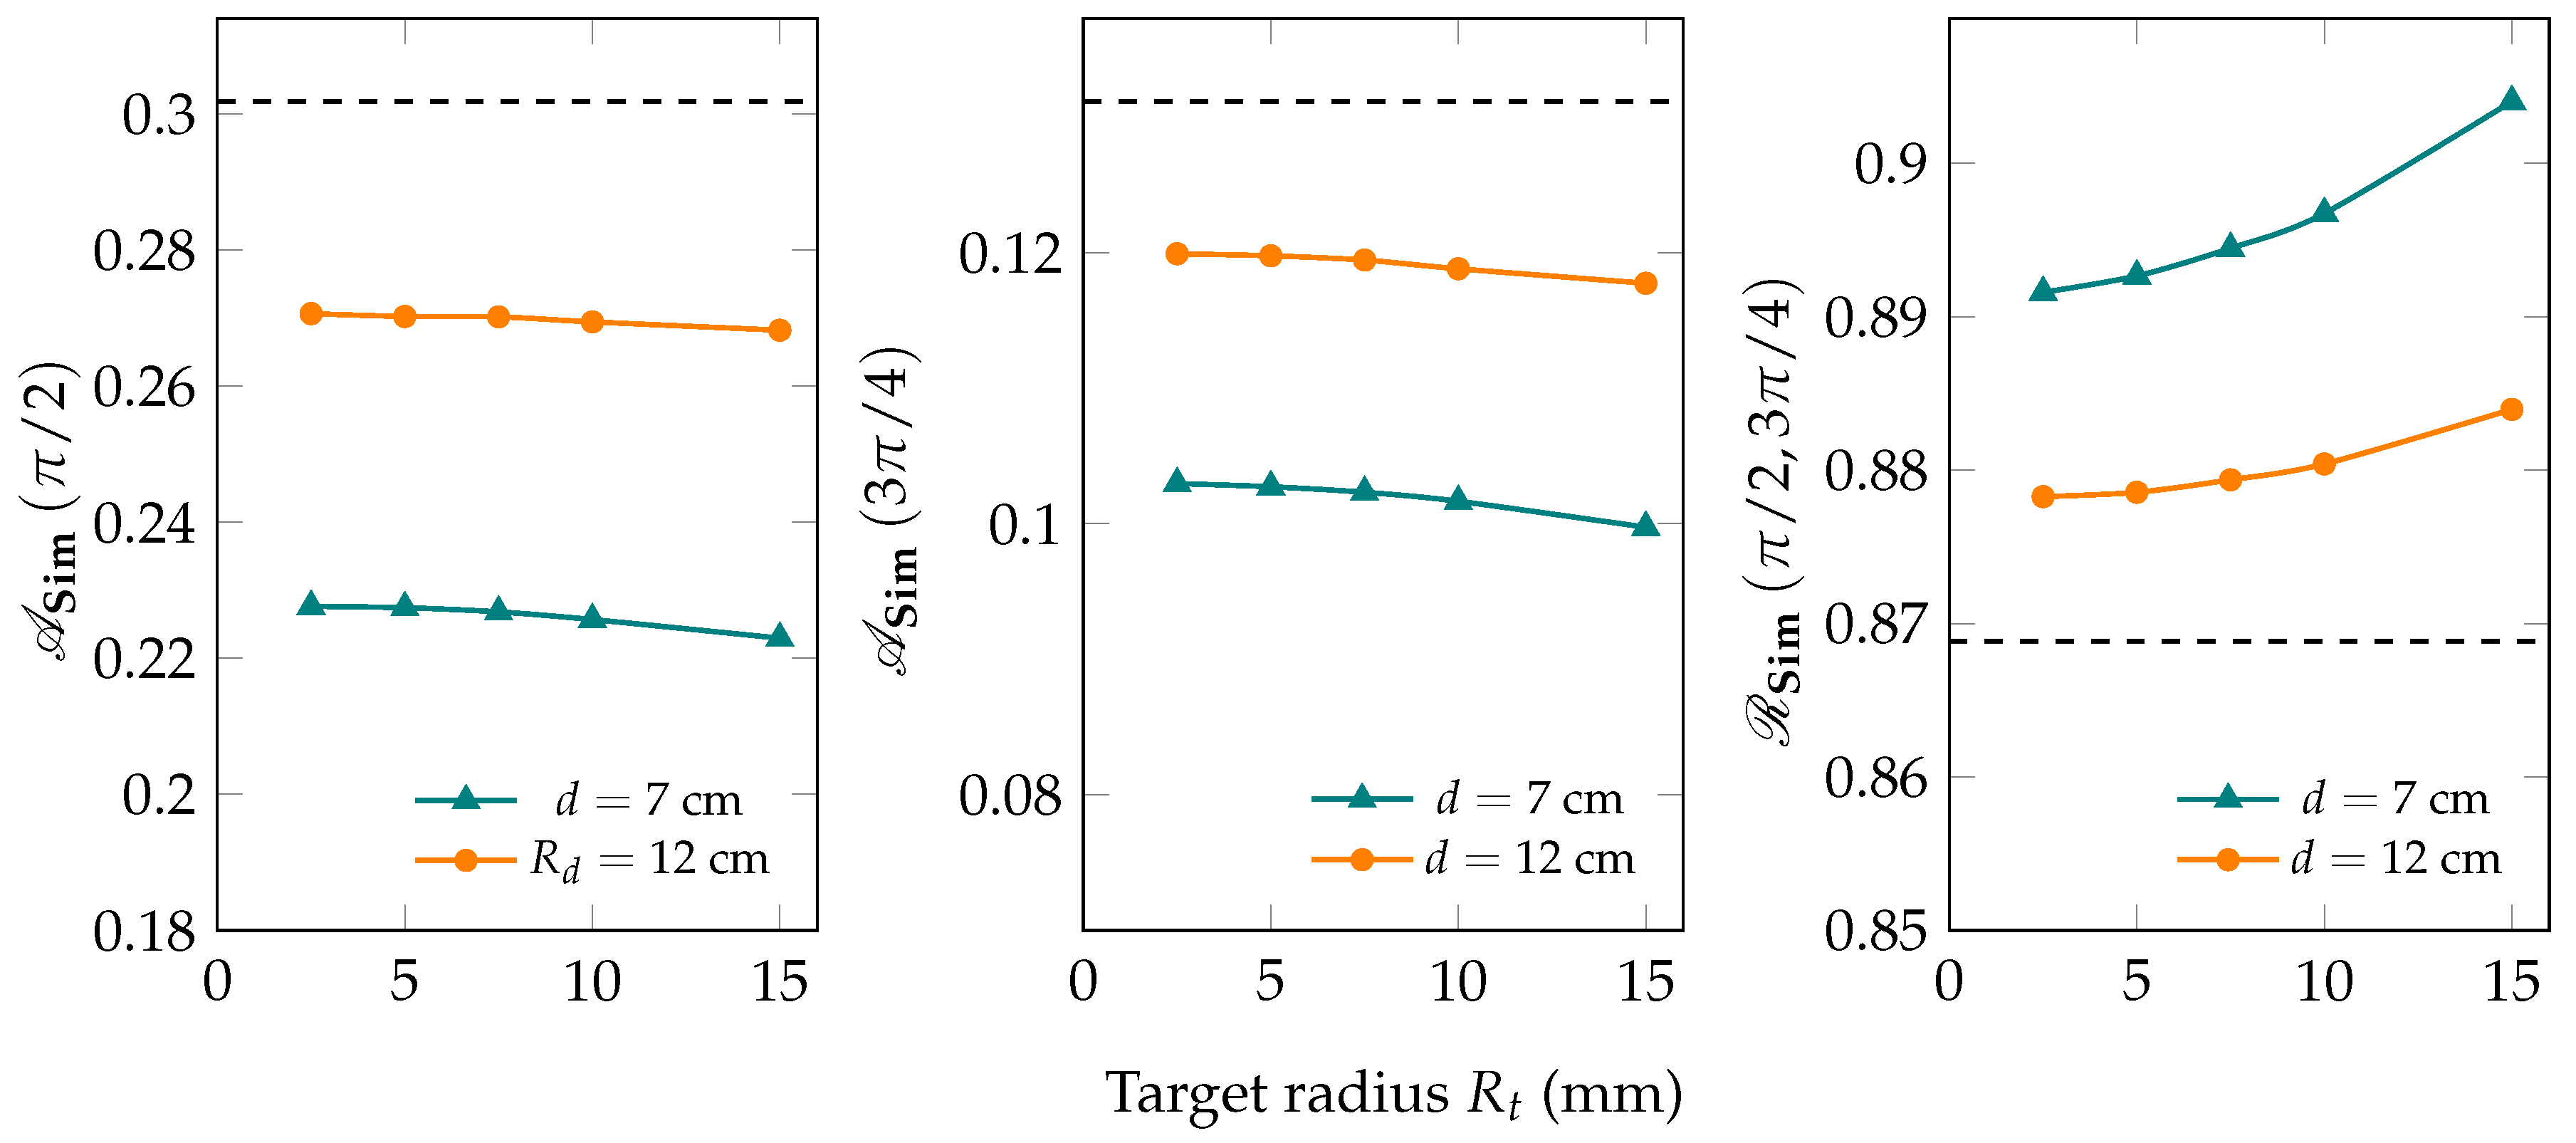
Figure 6 demonstrates that the target radius has almost no effect on the asymmetry and the angular distribution ratios. Only a change of <3.5% occurs when the target radius changes from 2.5 to 15 mm. Actually, this change is too small to be observed experimentally because the experimental uncertainties accompanying NRF experiments are in the order of 5–8%. The negligible effect of the target radius may be due to the symmetry of the target shape with respect to the radiation pattern of the transition. Further study is required to investigate the effect of the target shape. The present Monte Carlo simulation can be used to extract information about the effect of the target shape.
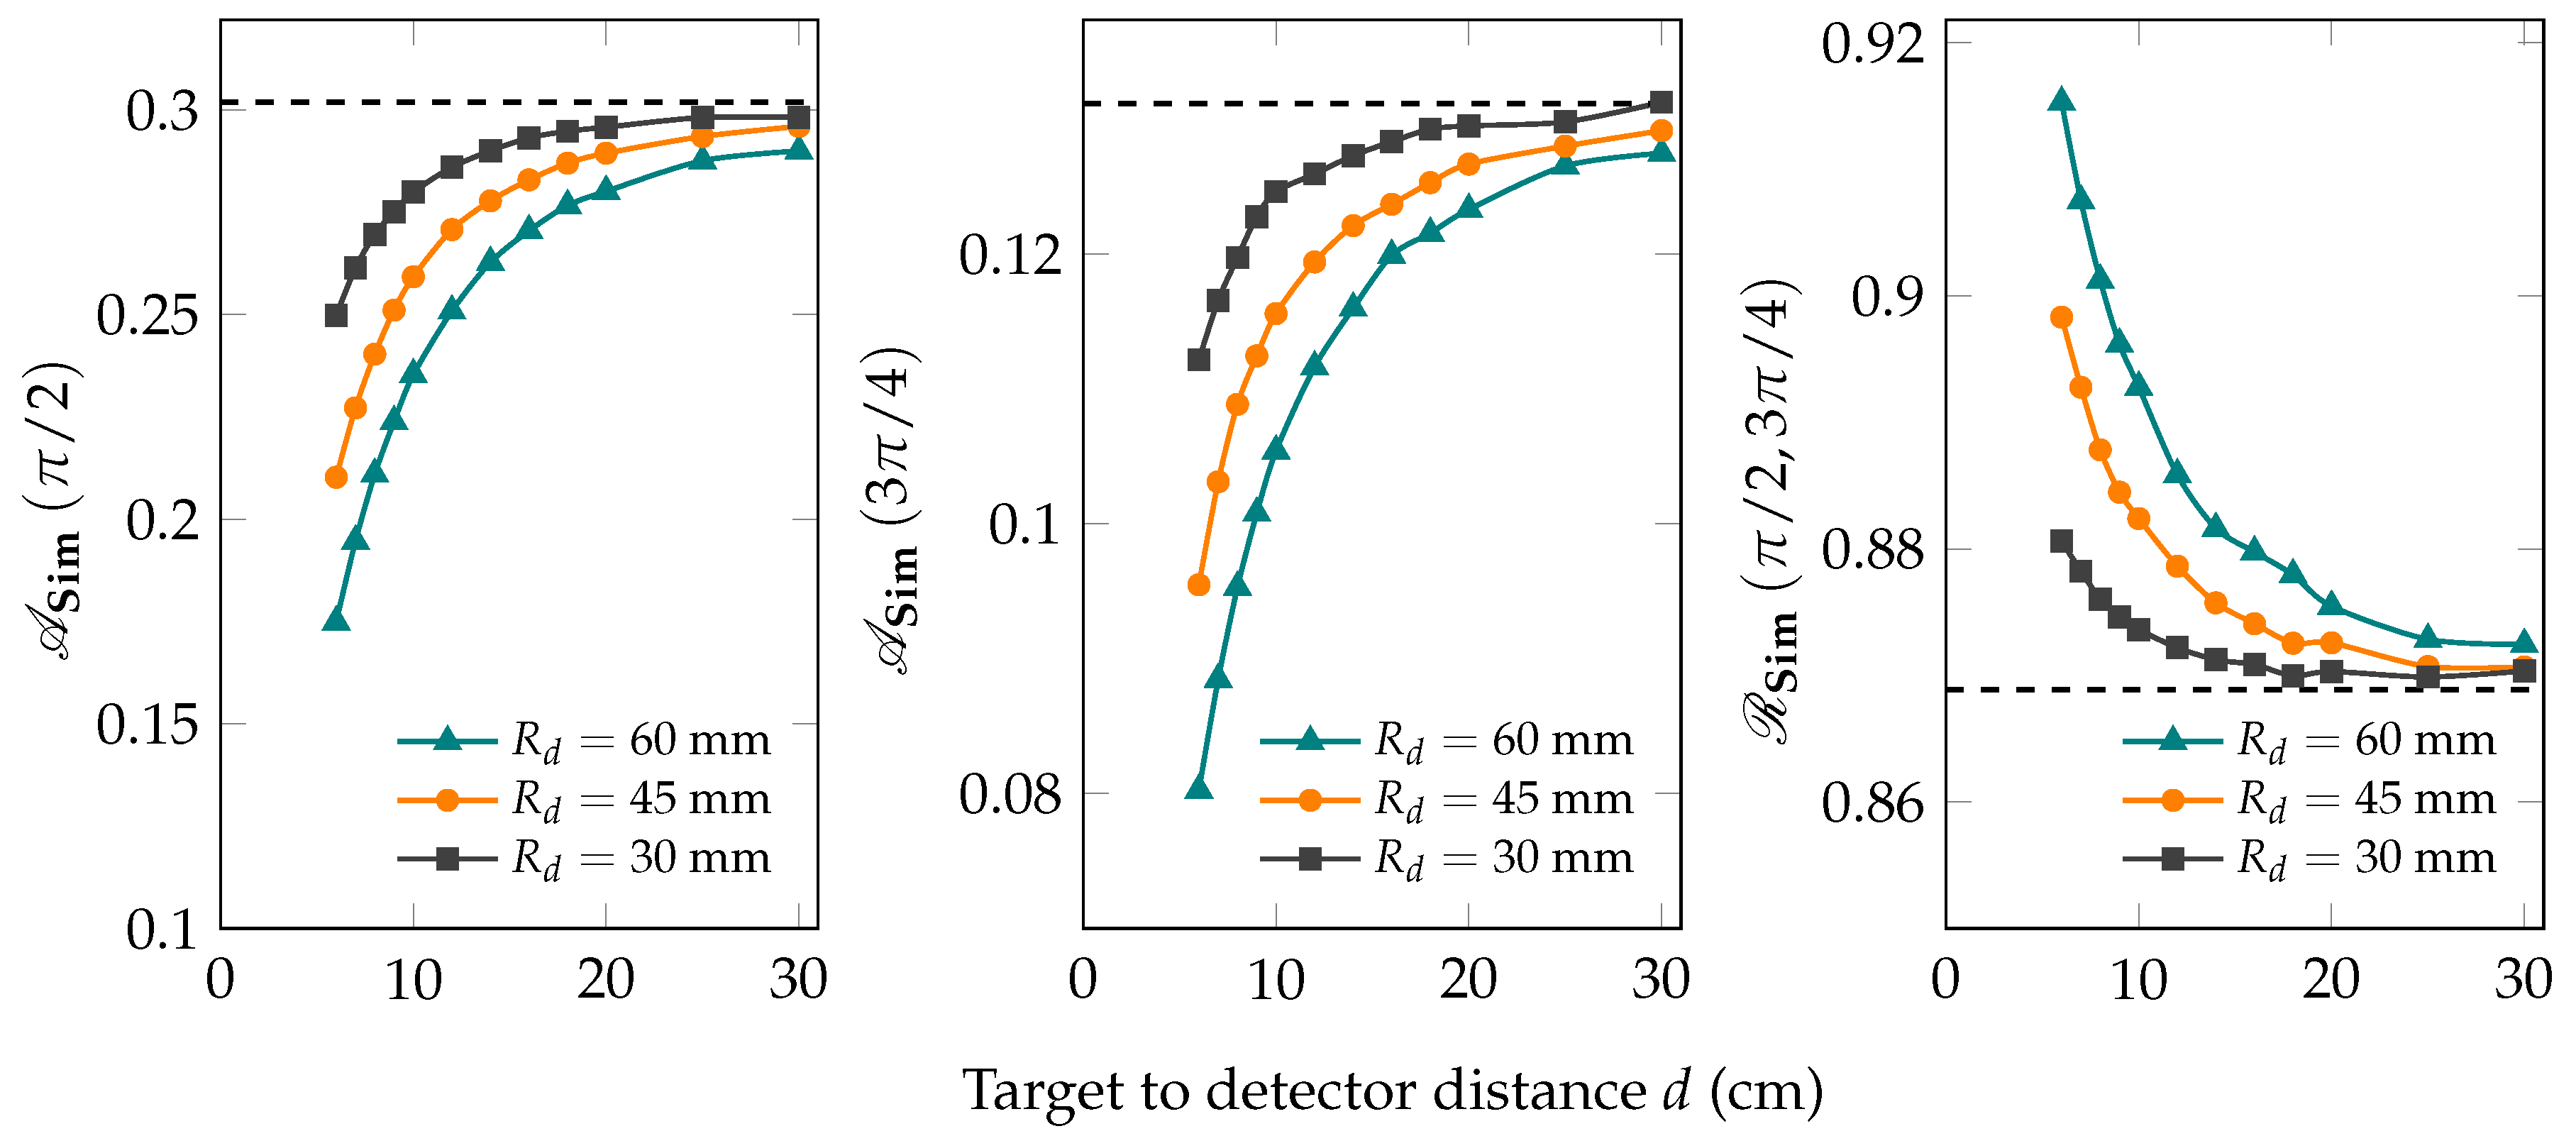
Similarly, the effects of the geometrical conditions on the angular distribution of the quadrupole transition with a spin sequence of 0 2 0 are shown in Figure 7, Figure 8 and Figure 9. As indicated in Figure 7, both asymmetry ratios depart from the ideal values with shorter target-to-detector distances, following the same trend of the dipole transition. However, A Sim ( 3 π / 4 ) decreases at much faster pace than A Sim ( π / 2 ) , which is just the opposite to the case of spin sequence 0 1 0 . Repeatedly, this can be accounted for by the aid of Figure 2 in which the asymmetry of the quadrupole transition exhibits almost a flat-top near π / 2 while it changes rapidly near the minimum at 3 π / 4 . For the close geometry A Sim ( π / 2 ) , it drops to 41 % of its ideal value. The reduction is greater than that which occurs for the dipole radiation. This can be understood in terms of the versatility of directions that the quadrupole transition is emitted in. Note that the ideal dipole transition is emitted within the scattering plane while the quadrupole transition is emitted in two orthogonal planes.
Interestingly, at d = 6 mm and R d = 60 mm, A Sim ( 3 π / 4 ) is changed from the ideal value of 1 (point detector) to + 0.1 (extended detector) which represents a change of a factor of 110 % . More importantly, this value is very close to that of the dipole transition under the same conditions, A Sim ( 3 π / 4 ) | 0 1 0 = 0.2 . This indicates that unless the counting statistics are sufficiently high, it is possible to misassign the spin-parity. Note that A Sim ( π / 2 ) cannot be used to differentiate dipoles and quadrupoles, as mentioned earlier. Furthermore, it would be more difficult to use the angular distribution ratio in this case too. This is because, at the same conditions mentioned above, R Sim ( π / 2 , 3 π / 4 ) | 0 1 0 = 0.79 , which is very close to R Sim ( π / 2 , 3 π / 4 ) | 0 2 0 = 0.9 . It is clear that it would be too difficult to assign spin-parity using the angular distribution functions only correctly. Indeed, in such close geometries, Monte Carlo simulation is necessary.
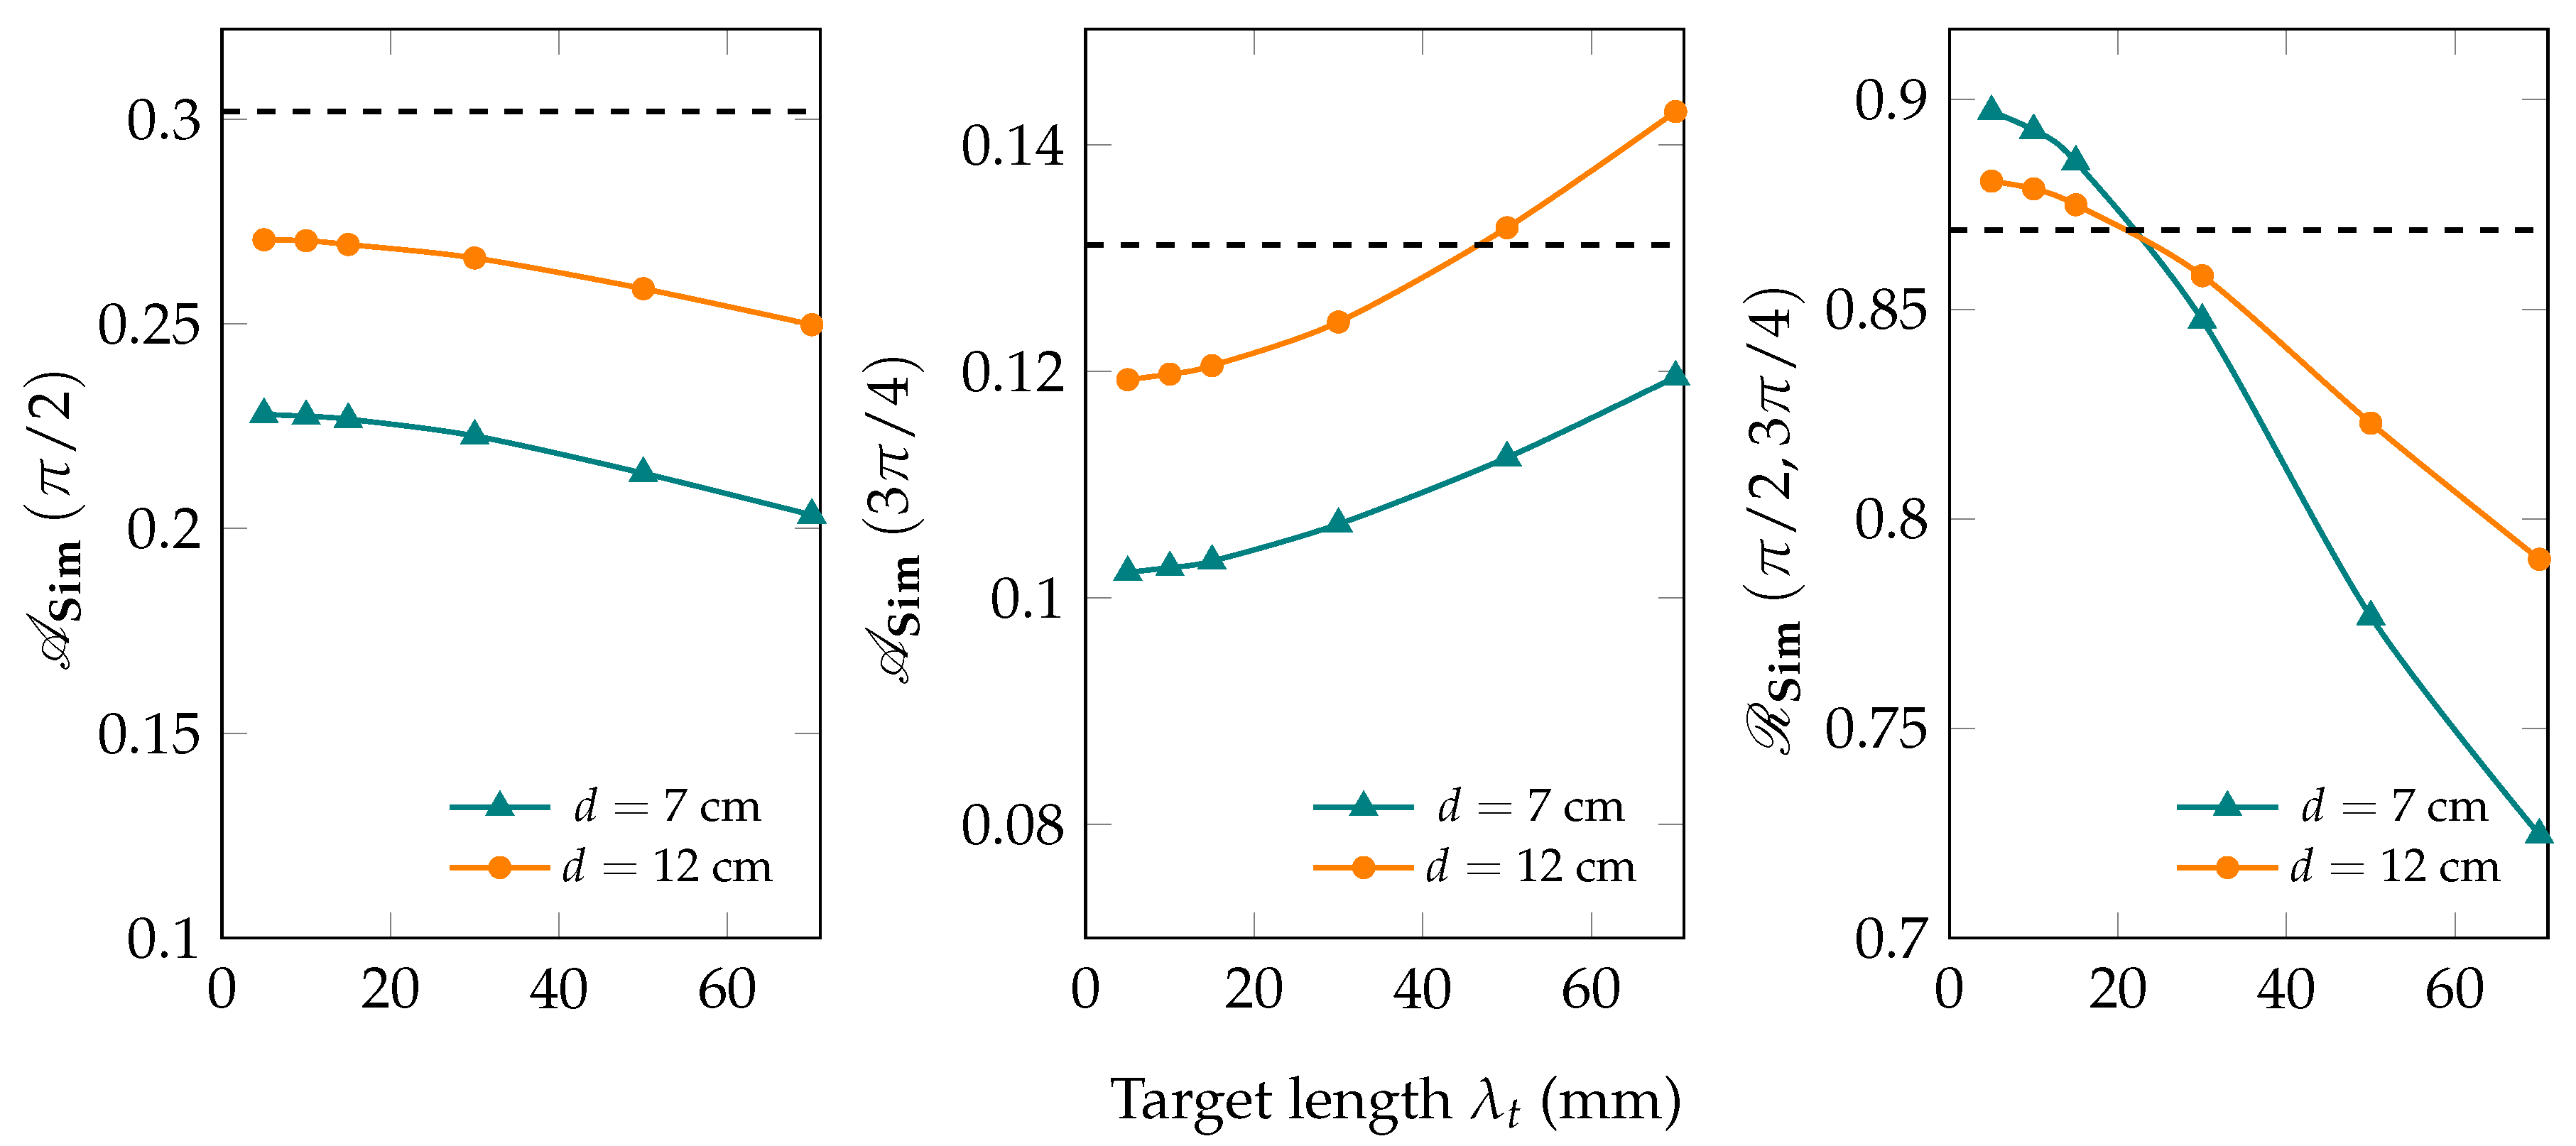
Unlike the dipole case, R Sim ( π / 2 , 3 π / 4 ) decreases when the target-to-detector distance decreases. This can be interpreted in terms of the difference between the radiation patterns of the dipole and quadrupole transitions. The radiation pattern of the dipole is limited to the scattering plane. But the radiation pattern of the quadrupole includes the orthogonal plane in addition to the scattering plane. Consequently, W ( π / 2 , π / 2 ) does not vanish and is affected by the target-to-detector distance similar to W ( π / 2 , 0 ) . The effect of the target length becomes more apparent for the quadrupole case. As shown in Figure 8, changing the target length from 5 mm to 70 mm causes an approximate change of 30 % in A Sim ( π / 2 ) when d = 7 cm and 18 % at d = 12 cm, which is close to twice the change occurred for the dipole transition at fixed detector radius. Furthermore, A Sim ( 3 π / 4 ) | R d = 60 mm changes from 0.14 to 0.07 over the considered range of target lengths. Additionally, the change of the target length decreases R Sim ( π / 2 , 3 π / 4 ) by a factor of approximately 30 % . Finally, the quadrupole transition exhibits identical behavior to that of the dipole transition regarding the effect of the target radius. The change over the target radius only alters the asymmetry ratios by ≤2.7%.

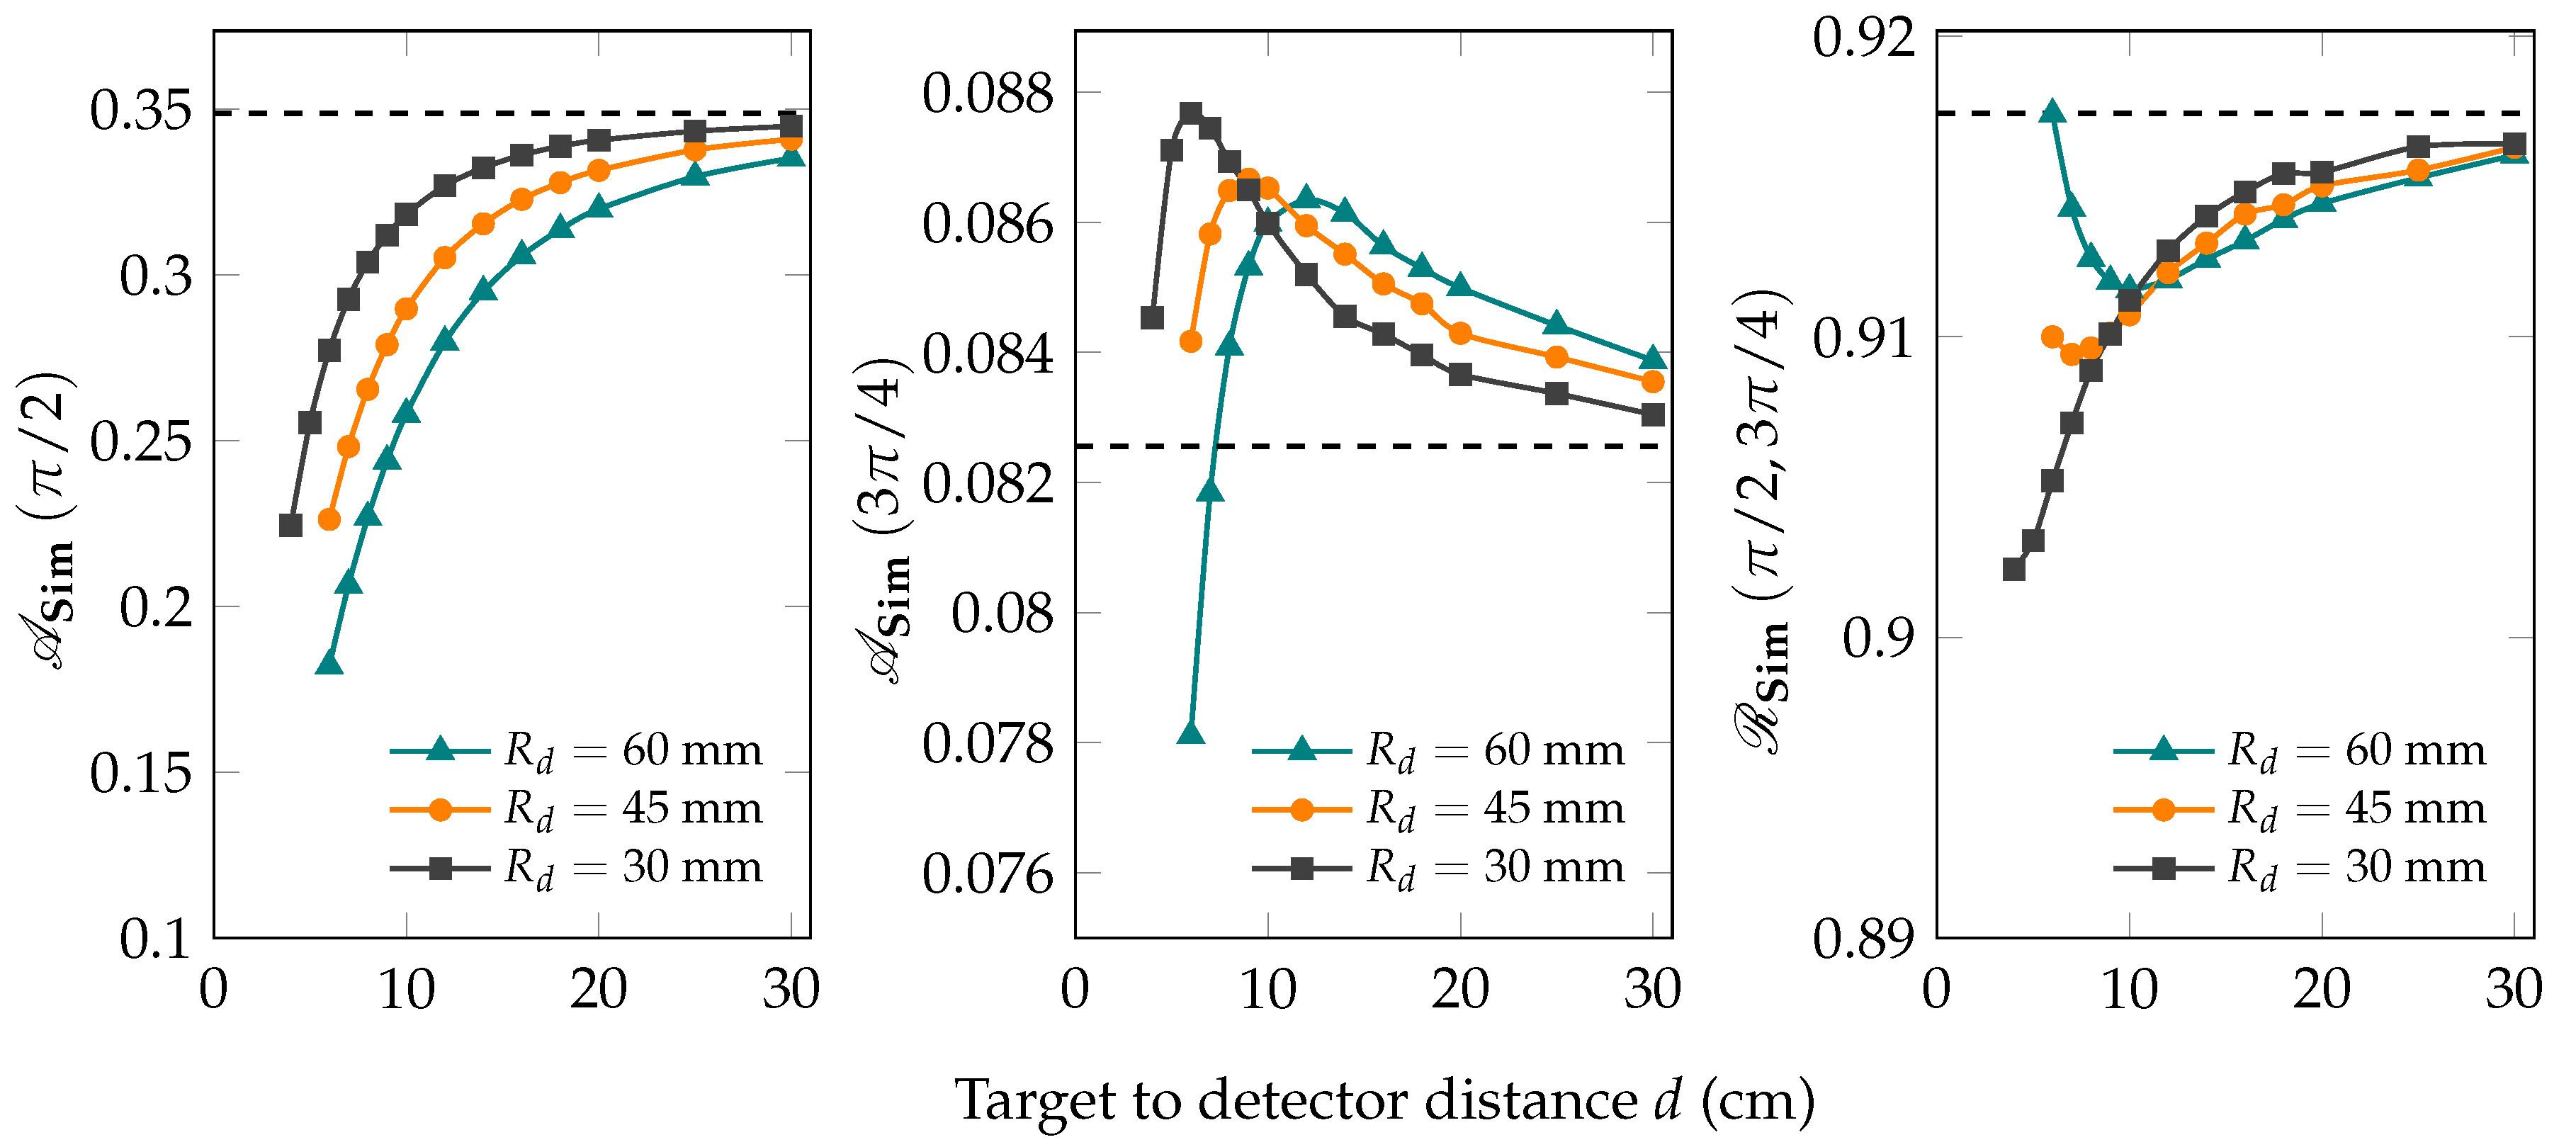
3.2. Half-Integer-Spin Ground States

The effects of the geometrical parameters for the dipole transition with spin sequence of 5 2 5 2 5 2 follow the same trend of the even-even nuclei as is indicated in Figure 9, Figure 10, Figure 11 and Figure 12. The asymmetry ratios decrease with decreasing the target-to-detector distance, and also with increasing the detector radius. The opposite occurs for the angular distribution ratio. Generally, it is clear that A Sim ( θ ) A Ideal ( θ ) , while R Sim ( θ 1 , θ 2 ) R Ideal ( θ 1 , θ 2 ) for the to dipole transitions regardless the spin sequence. However, in odd nuclei, the ideal values of the asymmetry and angular distribution ratios are often lower than those of even-even nuclei. Moreover, the selection rules of dipole transitions in odd nuclei increase the possibilities of excitation to various levels with different spins. The ground state spin of 5 2 may be excited to a state of spin 3 2 , which is almost isotropic.
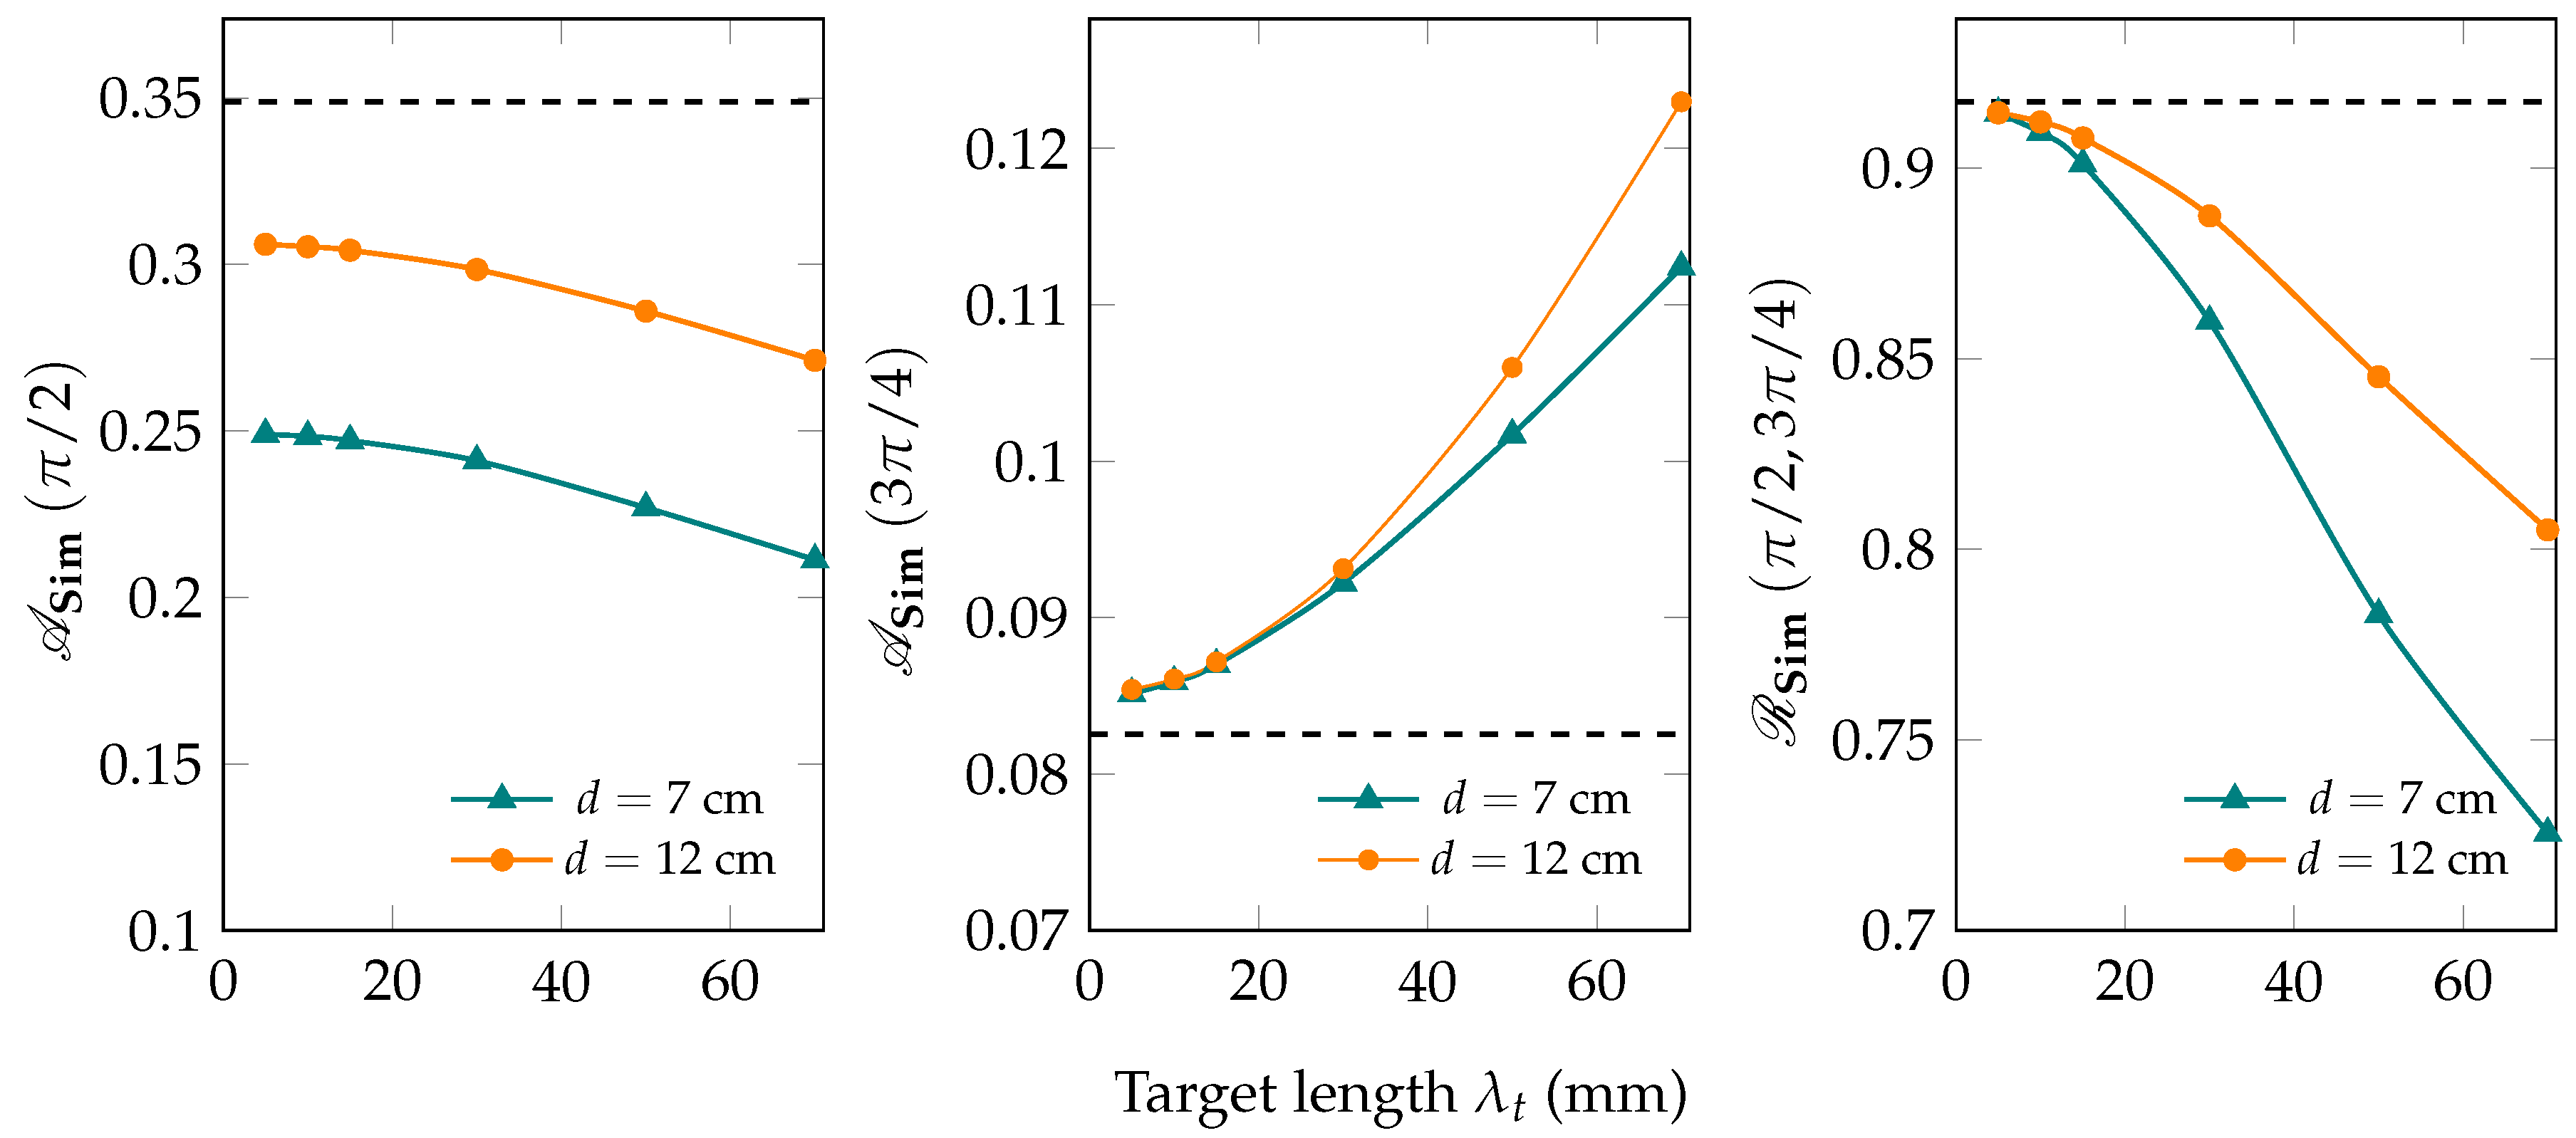
The quadrupole transition with a spin sequence of 5 2 9 2 5 2 manifests a rather complicated dependence on the geometrical parameters, as indicated in Figure 13, Figure 14 and Figure 15. While A Sim ( π / 2 ) is similar to previously discussed quadrupole transition of even-even nuclei, A Sim ( 3 π / 4 ) shows a dramatic difference in comparison with the case of spin sequence 0 2 0 . At small distances, A Sim ( 3 π / 4 ) increases with increasing target-to-detector distance. Then, at a distance that depends on the detector radius, it decreases with increasing the target-to-detector distance. This behavior is more distinctive than the case of 0 2 0 , which showed a monotonic decrease with the target-to-detector distance. The irregular trend of A Sim ( 3 π / 4 ) may be explained by nature of the quadrupole transition associated with spin sequence 5 2 9 2 5 2 . There is a minimum value of the angular correlation function at W ( 3 π / 4 , 0 ) , (see for example Equation (A6)). The effect of this minimum value may be propagated at large solid angles when the detector is close to the target.
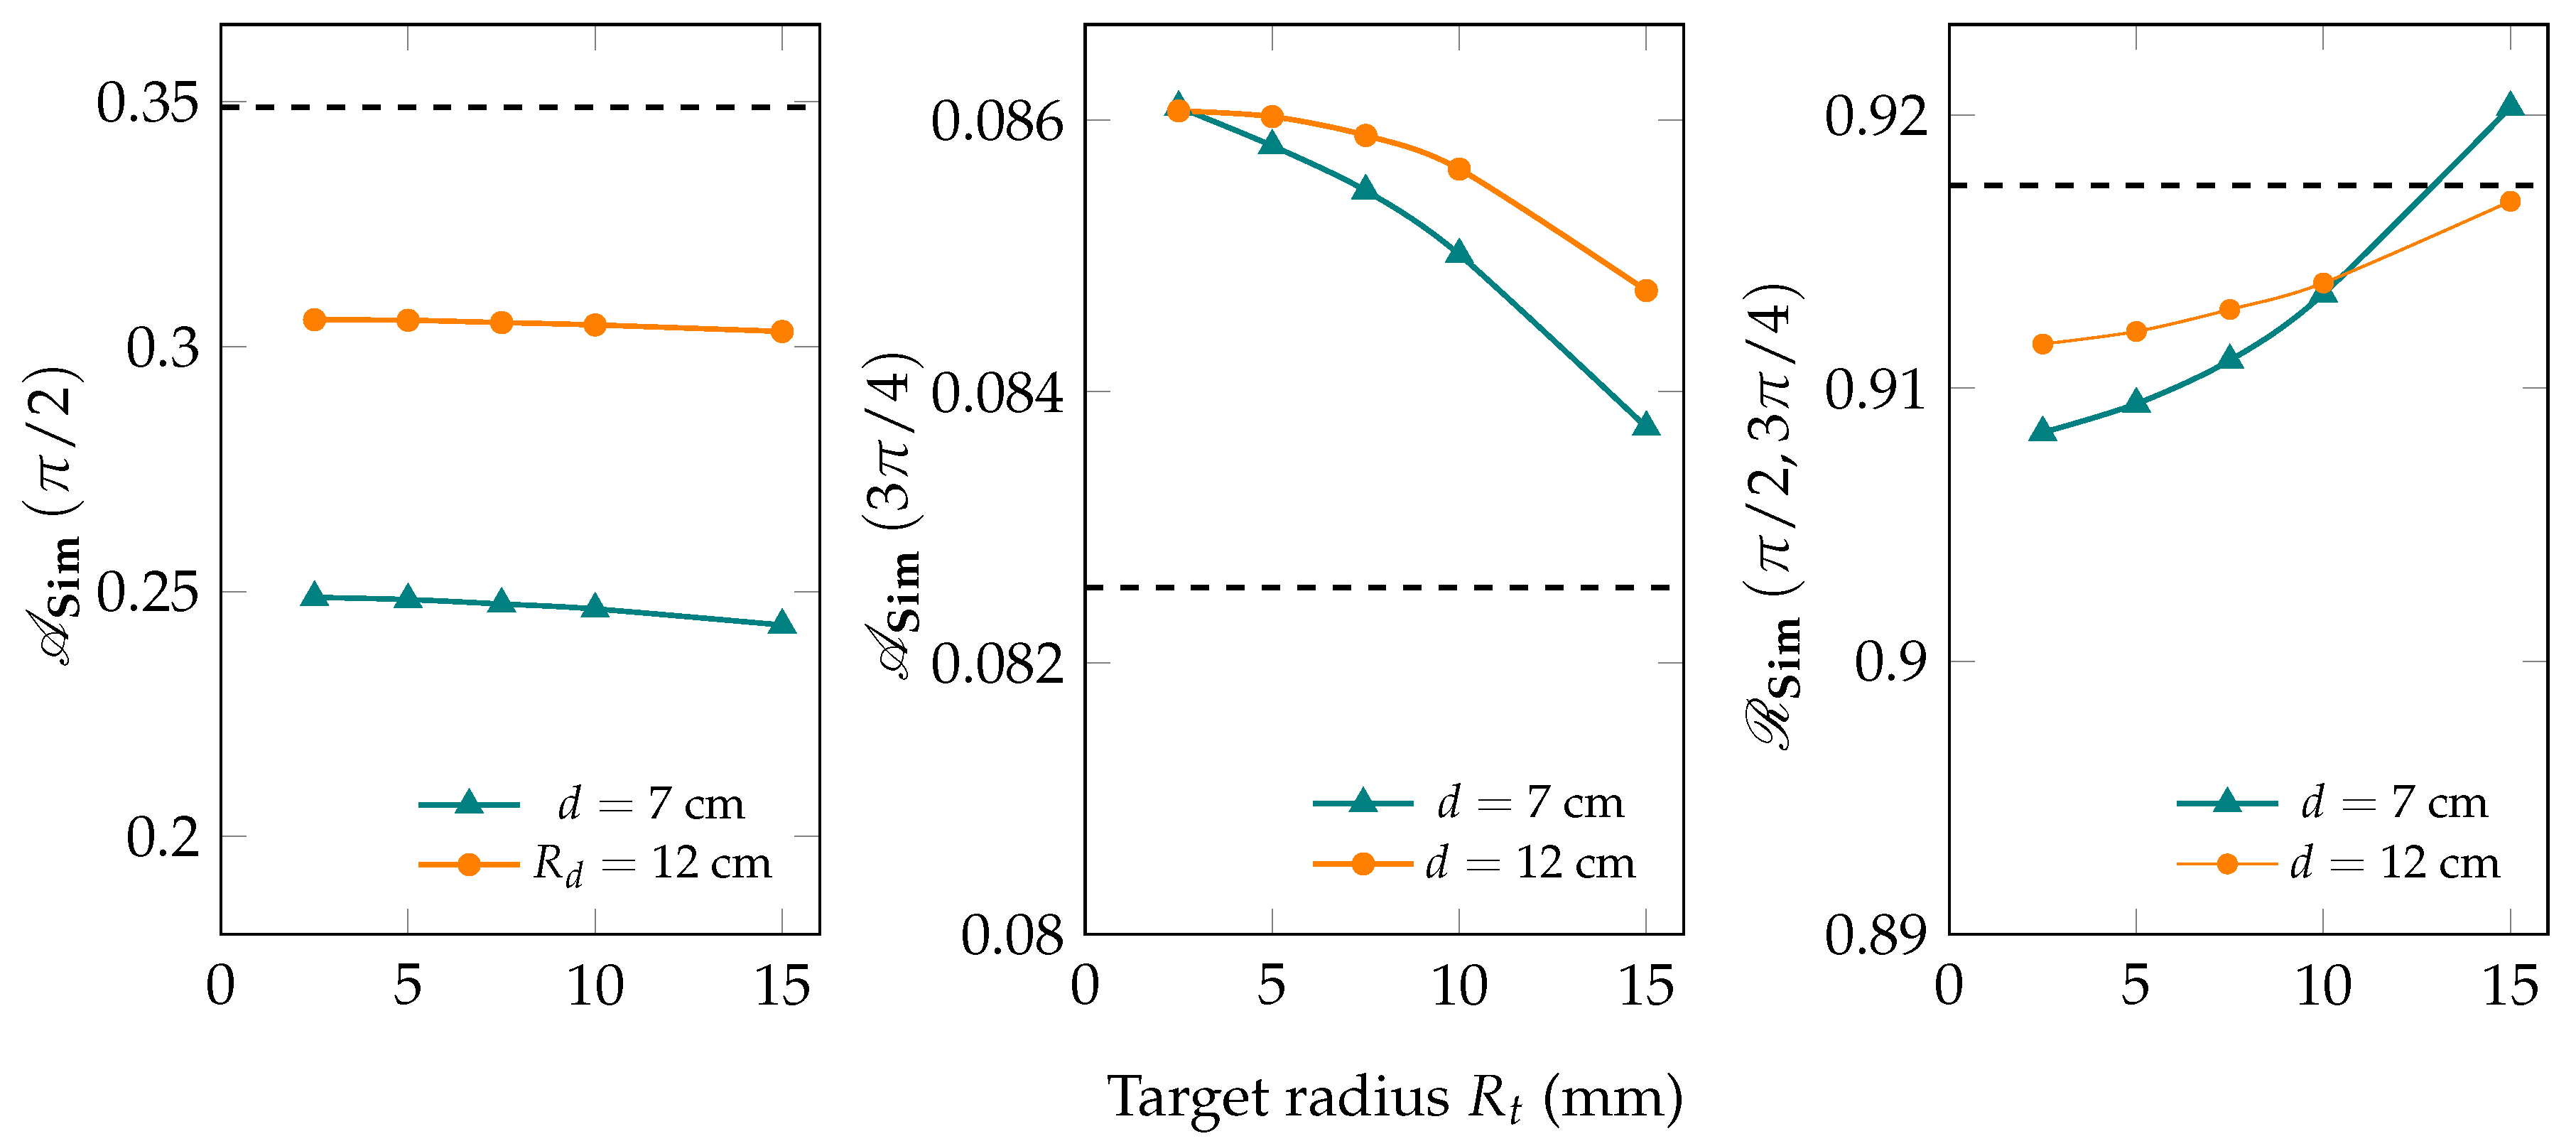
We performed further simulations with an asymmetry ratio at a different angle, which was A Sim ( 2 π / 3 ) , where the angular correlation function shows no minima. The results of our simulations are depicted in Table 1, along with those of A Sim ( π / 2 ) and A Sim ( 3 π / 4 ) . The data of Table 1 demonstrates that both A Sim ( π / 2 ) and A Sim ( 2 π / 3 ) show the same trend, while only A Sim ( 3 π / 4 ) is different. As a result, it is obvious that A Sim ( 3 π / 4 ) is a special case, and therefore, its irregular trend may be reasonable. The minimum value of the angular correlation function at 3 π / 4 also affects the angular distribution ratio for the present quadrupole transition, as inferred from Figure 13. The effects of the target length and target radius are similar to even-even nuclei, either for the case of the dipole or the quadrupole transitions.
The irregular behavior of A Sim ( 3 π / 4 ) affirms the significance of the Monte Carlo simulation as a beneficial tool that strongly affects the success of experiments involving spin-parity assignments. The spin-parity assignment of odd nuclei is a difficult task using NRF interaction [19]. Only a few experimental works have investigated odd nuclei, such as Rusev et al. [22] and Shizuma et al. [1]. However, the present simulation tool opens the door to study the spin and parity of odd nuclei by providing a precise estimation of the required geometry prior to the experiment. Furthermore, the present Monte Carlo method of the γ γ correlation functions has the advantages of simplicity, generality, and, at the same time, accuracy over previously implemented methods based on mapping [23] or parametrization [24,25]. It worth noting that the present study is limited to pure transitions. An upgrade would be required to implement a simulation tool that can handle the phenomenon of multipole mixing.

3.3. Benchmarking against Experimental Data

To validate our simulation, we compared the simulation-estimated asymmetry ratios with those determined experimentally for 52 Cr and 40 Ar as examples of even nuclei, and for 27 Al and 11 B as examples of odd nuclei. In each case, we could extract the dimensions of the target and the detector from the corresponding reports, and then we precisely simulated the experimental setups. In a recent study, Wilhelmy et al. [26] assigned 35 parity quantum numbers of 52 Cr to either M 1 or E 1 transition. The asymmetry ratios A Exp ( π / 2 ) averaged 0.878 ( 313 ) overall assignments. The simulation-estimated A Sim ( π / 2 ) for the corresponding setup is 0.888 , which agrees with measured asymmetry ratios within the experimental uncertainty.
Using the results of previous experiments on 40 Ar [27,28], the effect of the target length could be appropriately benchmarked. In these experiments, a target of pressurized 40 Ar of length 12 cm and radius 6 cm was exploited in NRF measurements while the detector radius was 32 mm. The first experiment on 40 Ar reported that 17 dipole transitions with average A Exp ( π / 2 ) = 0.544 ( 126 ) , while the second measurement resulted in assignments of 18 dipole transitions with A Exp ( π / 2 ) = 0.638 ( 171 ) . Our simulation showed that A Sim ( π / 2 ) = 0.616 and 0.619 for the first and second experiments, respectively. The small difference between the simulation of the two experiments is due to the difference between the diameters of collimators used to define the γ -ray beam size ( 2.54 cm for the first experiment and 1.91 cm for the second experiment). Nonetheless, the asymmetry ratios predicted by the simulation agree within the experimental uncertainty with the measured counterparts.
Shizuma et al. [1] have recently assigned the spin and parity of the 2.982 and 3.004 MeV levels of 27 Al. The first level was assigned to be M 1 transition via a spin sequence of 5 2 3 2 5 2 with A Exp ( π / 2 ) = 0.02 ( 5 ) . The simulation-calculated value of this level is A Sim ( π / 2 ) = 0.015 . For the 3.004 MeV level, an E 2 transition was identified, having A Exp ( π / 2 ) = 0.34 ( 5 ) with a spin sequence of 5 2 9 2 5 2 . This demonstrates a reasonable consistency with the value predicted by the proposed simulation ( A Sim ( π / 2 ) = 0.331 ). Furthermore, the angular distribution ratio R Exp ( π / 2 , 3 π / 4 ) was determined from the experiment amounted as R Exp ( π / 2 , 3 π / 4 ) = 0.98 ( 7 ) for the spin sequence 5 2 3 2 5 2 and R Exp ( π / 2 , 3 π / 4 ) = 0.95 ( 7 ) for the spin sequence 5 2 9 2 5 2 . Again, the simulation-estimated angular distribution ratio is R Sim ( π / 2 , 3 π / 4 ) = 0.97 and R Sim ( π / 2 , 3 π / 4 ) = 0.91 for dipole and quadruple transitions, respectively.
Another example of the odd nuclei is the experiment performed by Rusev et al. [22] on 11 B. In this experiment the level at 8.916 MeV was assigned as M 1 transition with A Exp ( π / 2 ) = 0.215 ( 20 ) . The spin sequence of this transition was found to be 3 2 5 2 3 2 . Our simulation resulted in a consistent asymmetry ratio ( A Sim ( π / 2 ) = 0.223 ) for the given spin sequence.
A general feature of spin-parity measurements is the symmetry of the detection geometry. Usually, two identical detectors are positioned at the same distance from the center of the target, with one of them being parallel to the polarization plane while the other is perpendicular to the polarization plane. In such geometry, NRF photons emitted from the target travel the same distance within the target and through the target-to-detector distance before arriving at the detector. Therefore, the effects of self-attenuation of photons within the target cancel each other out when asymmetry and angular distribution ratios are calculated. This scenario enabled the proposed simulation to calculate the asymmetry and angular distribution ratios without the need to track the propagation of photons through the target. The consistency between the experimental observation of the asymmetry and angular distribution ratios with the simulated-estimated values strengthens the fact that the proposed simulation can be used as a planning utility prior to the experiment. Another utilization of the proposed simulation is to estimate the corrections of angular distribution functions after the experiment as an indispensable part of the data analysis procedure. More importantly, the present simulation can be employed to sample the final states through a complete implementation that simulates the whole NRF interaction. In this case, the angular distribution functions are invoked by the simulation code only for the interacting nuclei. The simulation run within the Geant4 toolkit will then track the propagation of NRF photons in detail.
4. Conclusions

In summary, we developed a new Monte Carlo simulation of the γ γ correlation functions. Our simulation is capable of accounting for the effects of detection geometry encountered in the spin-parity assignments using NRF. The simulation can handle arbitrary shapes and sizes of the target and detector, and spin sequences. We showed that the spin-parity assignment is very sensitive to detection geometry. Consequently, incorrect spin-parity, particularity for odd-nuclei, may be assigned unless the detection geometry is carefully planned using the proposed method. The simulation provides a tool to plan and predict the sufficient statistics for correct assignment of the spins and parities of the nuclear energy states. In addition, we provided simulation examples for different geometrical conditions and spin sequences. The effects of the target and detector sizes and target-to-detector distance may lead to a deviation of the order of ≥100% of the ideal values of the γ γ correlation functions. Finally, we validated our simulation model by comparing the results of our simulations with the observable quantities involved in spin-parity measurements using NRF; namely, asymmetry and angular distribution ratios. Our validation against experimental data included a variety of detection geometries and spin sequences.

Author Contributions

All authors contributed equally to this research. All authors have read and agreed to the published version of the manuscript.

Funding

This research received no external funding.

Conflicts of Interest

The authors declare no conflict of interest.

Abbreviations

The following abbreviations are used in this manuscript:
E1Electric dipole transition
E2Electric quadrupole transition
Geant4GEometry ANd Tracking: a particle transport simulation toolkit [20]
LCSLaser Compton scattering
NRFNuclear resonance fluorescence
M1Magnetic dipole transition
M2Magnetic quadrupole transition

Appendix A. Angular Distribution Functions

Appendix A.1. Ground State Spin = 0

W ( θ , ϕ ) 0 1 0 = 3 4 ( cos 2 θ + 1 ) + ( ± ) L 3 4 1 cos 2 θ cos 2 ϕ
W ( θ , ϕ ) 0 2 0 = 5 4 ( 1 3 cos 2 θ + 4 cos 4 θ ) + ( ± ) L 5 4 1 5 cos 2 θ + 4 cos 4 θ cos 2 ϕ

Appendix A.2. Ground State Spin = 5 2

W ( θ , ϕ ) 5 2 3 2 5 2 = 1 200 ( 3 cos 2 θ + 199 ) + ( ± ) L 3 200 1 cos 2 θ cos 2 ϕ
W ( θ , ϕ ) 5 2 5 2 5 2 = 1 175 ( 48 cos 2 θ + 159 ) + ( ± ) L 48 175 1 cos 2 θ cos 2 ϕ
W ( θ , ϕ ) 5 2 7 2 5 2 = 1 56 ( 9 cos 2 θ + 53 ) + ( ± ) L 9 56 1 cos 2 θ cos 2 ϕ
W ( θ , ϕ ) 5 2 9 2 5 2 = 5 1323 ( 247 + 11 4 cos 2 θ + 1001 12 cos 4 θ ) + ( ± ) L 5 1323 517 6 2035 12 cos 2 θ + 1001 12 cos 4 θ cos 2 ϕ

References

  1. Shizuma, T.; Omer, M.; Hajima, R.; Shimizu, N.; Utsuno, Y. Spin and parity determination of the 3.004-MeV level in 27Al: Its low-lying multiplet structure. Phys. Rev. C 2019, 100, 014307. [Google Scholar] [CrossRef]
  2. Pietralla, N.; Berant, Z.; Litvinenko, V.N.; Hartman, S.; Mikhailov, F.F.; Pinayev, I.V.; Swift, G.; Ahmed, M.W.; Kelley, J.H.; Nelson, S.O.; et al. Parity Measurements of Nuclear Levels Using a Free-Electron-Laser Generated γ-Ray Beam. Phys. Rev. Lett. 2001, 88, 012502. [Google Scholar] [CrossRef] [PubMed]
  3. Omer, M.; Negm, H.; Zen, H.; Daito, I.; Kii, T.; Masuda, K.; Ohgaki, H.; Hajima, R.; Shizuma, T.; Hayakawa, T.; et al. Nuclear Resonance Fluorescence of 235U Measured with High-Resolution LaBr3(Ce) Scintillation Detectors. Jpn. J. App. Phys. 2013, 52, 106401. [Google Scholar] [CrossRef]
  4. Angell, C.; Hajima, R.; Hayakawa, T.; Shizuma, T.; Karwowski, H.; Silano, J. Demonstration of a transmission nuclear resonance fluorescence measurement for a realistic radioactive waste canister scenario. Nucl. Instrum. Methods Phys. Res. Sect. B 2015, 347, 11–19. [Google Scholar] [CrossRef]
  5. Omer, M.; Negm, H.; Ohgaki, H.; Daito, I.; Hayakawa, T.; Bakr, M.; Zen, H.; Hori, T.; Kii, T.; Masuda, K.; et al. Analysis of nuclear resonance fluorescence excitation measured with LaBr3(Ce) detectors near 2 MeV. Nucl. Instrum. Methods Phys. Res. Sect. A 2013, 729, 102–107. [Google Scholar] [CrossRef]
  6. Lakshmanan, M.N.; Harrawood, B.P.; Rusev, G.; Agasthya, G.A.; Kapadia, A.J. Simulations of nuclear resonance fluorescence in Geant4. Nucl. Instrum. Methods Phys. Res. Sect. A 2014, 763, 89–96. [Google Scholar] [CrossRef]
  7. Jordan, D.V.; Warren, G.A. Simulation of nuclear resonance fluorescence in Geant4. In Proceedings of the 2007 IEEE Nuclear Science Symposium Conference Record, Honolulu, HI, USA, 27 October–3 November 2007; pp. 1185–1190. [Google Scholar] [CrossRef]
  8. Hayakawa, T.; Kikuzawa, N.; Hajima, R.; Shizuma, T.; Seya, M.; Ohgaki, H.; Kii, T.; Omer, M. Development of simulation code for NDA using nuclear resonance fluorescence with laser Compton scattering gamma-rays. In Proceedings of the INMM 52th Annual Meeting Proceeding, Palm Desert, CA, USA, 17–21 July 2011; pp. 17–21. [Google Scholar]
  9. Vavrek, J.R.; Henderson, B.S.; Danagoulian, A. High-accuracy Geant4 simulation and semi-analytical modeling of nuclear resonance fluorescence. Nucl. Instrum. Methods Phys. Res. Sect. B 2018, 433, 34–42. [Google Scholar] [CrossRef] [Green Version]
  10. Vavrek, J.R.; Henderson, B.S.; Danagoulian, A. Validation of Geant4’s G4NRF module against nuclear resonance fluorescence data from 238U and 27Al. Nucl. Instrum. Methods Phys. Res. Sect. B 2019, 459, 188–195. [Google Scholar] [CrossRef] [Green Version]
  11. Omer, M.; Hajima, R. Including Delbrück scattering in GEANT4. Nucl. Instrum. Methods Phys. Res. Sect. B 2017, 405, 43–49. [Google Scholar] [CrossRef]
  12. Omer, M.; Hajima, R. Validating polarization effects in γ-rays elastic scattering by Monte Carlo simulation. New J. Phys. 2019, 21, 113006. [Google Scholar] [CrossRef]
  13. Turturica, G.; Iancu, V.; Suliman, G.; Ur, C. Implementation of photon elastic scattering in GEANT4. Nucl. Instrum. Methods Phys. Res. Sect. B 2018, 436, 68–73. [Google Scholar] [CrossRef]
  14. Fagg, L.W.; Hanna, S.S. Polarization Measurements on Nuclear Gamma Rays. Rev. Mod. Phys. 1959, 31, 711–758. [Google Scholar] [CrossRef]
  15. Hamilton, W. The Electromagnetic Interaction in Nuclear Spectroscopy; North-Holland: Amsterdam, The Netherlands, 1975. [Google Scholar]
  16. Appel, H. Numerical Tables for Angular Correlation Computations in Alpha-, Beta-, Gamma-Spectroscopy: 3j-, 6j-, 9j-Symbols, F-and Gamma-Coefficients; Springer: Berlin/Heidelberg, Germany, 1968. [Google Scholar] [CrossRef]
  17. Pietralla, N.; Li, T.C.; Fritzsche, M.; Ahmed, M.W.; Savran, D.; Tonchev, A.P.; Tornow, W.; Weller, H.R.; Werner, V. Spin and parity assignments to dipole excitations of the odd-mass nucleus 207Pb from nuclear resonance fluorescence experiments with linearly-polarized γ-ray beams. J. Phys. Conf. Ser. 2010, 205, 012036. [Google Scholar] [CrossRef]
  18. Shizuma, T.; Hayakawa, T.; Ohgaki, H.; Toyokawa, H.; Komatsubara, T.; Kikuzawa, N.; Tamii, A.; Nakada, H. Fine structure of the magnetic-dipole-strength distribution in 208Pb. Phys. Rev. C 2008, 78. [Google Scholar] [CrossRef]
  19. Kneissl, U.; Pitz, H.; Zilges, A. Investigation of nuclear structure by resonance fluorescence scattering. Prog. Part. Nucl. Phys. 1996, 37, 349–433. [Google Scholar] [CrossRef]
  20. Agostinelli, S.; Allison, J.; Amako, K.; Apostolakis, J.; Araujo, H.; Arce, P.; Asai, M.; Axen, D.; Banerjee, S.; Barrand, G.; et al. Geant4—A simulation toolkit. Nucl. Instrum. Methods Phys. Res. Sect. A 2003, 506, 250–303. [Google Scholar] [CrossRef] [Green Version]
  21. Zhang, J.; Chen, X.; Zhang, C.; Li, G.; Xu, J.; Sun, G. Development of a software package for solid-angle calculations using the Monte Carlo method. Nucl. Instrum. Methods Phys. Res. Sect. A 2014, 736, 40–45. [Google Scholar] [CrossRef]
  22. Rusev, G.; Tonchev, A.P.; Schwengner, R.; Sun, C.; Tornow, W.; Wu, Y.K. Multipole mixing ratios of transitions in 11B. Phys. Rev. C 2009, 79. [Google Scholar] [CrossRef]
  23. Procida Veissid, V.; Kenchian, G.; da Cruz, M. Experimental solid-angle correction for gamma angular correlations. Nucl. Instrum. Methods Phys. Res. Sect. A 1991, 309, 222–226. [Google Scholar] [CrossRef]
  24. Feingold, A.M.; Frankel, S. Geometrical Corrections in Angular Correlation Measurements. Phys. Rev. 1955, 97, 1025–1030. [Google Scholar] [CrossRef]
  25. Verheul, H.; Blok, J.; Boddendijk, H.; Vonck, B. Geometrical corrections for angular correlation measurements with a large source and small detectors. Physica 1965, 31, 565–572. [Google Scholar] [CrossRef]
  26. Wilhelmy, J.; Brown, B.A.; Erbacher, P.; Gayer, U.; Isaak, J.; Krishichayan, F.; Löher, B.; Müscher, M.; Pai, H.; Pietralla, N.; et al. Investigation of J = 1 states and their γ-decay behavior in 52Cr. Phys. Rev. C 2018, 98, 034315. [Google Scholar] [CrossRef] [Green Version]
  27. Gayer, U.; Beck, T.; Bhike, M.; Isaak, J.; Pietralla, N.; Ries, P.C.; Savran, D.; Schilling, M.; Tornow, W.; Werner, V. Experimental M1 response of 40Ar as a benchmark for neutrino-nucleus scattering calculations. Phys. Rev. C 2019, 100, 034305. [Google Scholar] [CrossRef]
  28. Li, T.C.; Pietralla, N.; Tonchev, A.P.; Ahmed, M.W.; Ahn, T.; Angell, C.; Blackston, M.A.; Costin, A.; Keeter, K.J.; Li, J.; et al. First evidence for spin-flip M1 strength in 40Ar. Phys. Rev. C 2006, 73, 054306. [Google Scholar] [CrossRef]
Figure 1. Level diagram of an nuclear resonance fluorescence (NRF) process. γ i is the absorption line, while the emission line may only be γ f or γ f and its branching to a low-lying level γ m . L i , L f , and L m are the multipolarities associated with the transitions.
Atoms 08 00006 g001
Figure 2. Ideal asymmetry ratios of magnetic dipole M 1 (solid line), and electric quadrupole E 2 (dashed line) transitions in even-even nuclei (left). Polar patterns of the dipole and quadrupole radiations (right).
Atoms 08 00006 g002
Figure 3. Ideal asymmetry ratios of possible magnetic dipole M 1 (solid, dotted, and dotted-dashed lines) and electric quadrupole E 2 (dashed line) transitions in an odd nucleus of a 5 2 + ground state (left). Polar patterns of the possible dipole and quadrupole radiations (right).
Atoms 08 00006 g003
Figure 4. Dependence of the asymmetries A Sim π / 2 and A Sim 3 π / 4 , and the angular distribution ratios R Sim π / 2 , 3 π / 4 on the target-to-detector distance at different detector radii for the dipole transition with a spin sequence of 0 1 0 , while λ t = 10 mm and R t = 5 mm. The exact values corresponding to the point target and point detector are expressed by dashed lines.
Atoms 08 00006 g004
Figure 5. Dependence of the asymmetries A Sim π / 2 and A Sim 3 π / 4 , and the angular distribution ratios R Sim π / 2 , 3 π / 4 on the target length at different target-to-detector distances for the dipole transition with a spin sequence of 0 1 0 . The detector radius is fixed at R d = 45 mm while R t = 5 mm. The exact values corresponding to the point target and point detector are expressed by dashed lines.
Atoms 08 00006 g005
Figure 6. Dependence of the asymmetries A Sim π / 2 and A Sim 3 π / 4 , and the angular distribution ratios R Sim π / 2 , 3 π / 4 on the target length at different target-to-detector distances for the dipole transition with a spin sequence of 0 1 0 . The detector radius is fixed at R d = 45 mm while λ t = 5 mm. The exact values corresponding to the point target and point detector are expressed by dashed lines.
Atoms 08 00006 g006
Figure 7. The same as Figure 4 for the quadrupole transition with a spin sequence of 0 2 0 .
Atoms 08 00006 g007
Figure 8. The same as Figure 5 for the quadrupole transition with a spin sequence of 0 2 0 .
Atoms 08 00006 g008
Figure 9. The same as Figure 6 for the quadrupole transition with a spin sequence of 0 2 0 .
Atoms 08 00006 g009
Figure 10. The same as Figure 4 for the dipole transition with a spin sequence of 5 2 5 2 5 2 .
Atoms 08 00006 g010
Figure 11. The same as Figure 5 for the dipole transition with a spin sequence of 5 2 5 2 5 2 .
Atoms 08 00006 g011
Figure 12. The same as Figure 6 for the dipole transition with a spin sequence of 5 2 5 2 5 2 .
Atoms 08 00006 g012
Figure 13. The same as Figure 4 for the quadrupole transition with a spin sequence of 5 2 9 2 5 2 .
Atoms 08 00006 g013
Figure 14. The same as Figure 5 for the quadrupole transition with a spin sequence of 5 2 9 2 5 2 .
Atoms 08 00006 g014
Figure 15. The same as Figure 6 for the quadrupole transition with a spin sequence of 5 2 9 2 5 2 .
Atoms 08 00006 g015
Table 1. A comparison among A Sim ( π / 2 ) , A Sim ( 2 π / 3 ) , and A Sim ( 3 π / 4 ) for the spin sequence 5 2 9 2 5 2 as affected by the target-to-detector distance d. The other parameters are fixed such that R d = 60 mm, λ t = 10 mm, and R t = 10 mm. Numbers in parentheses are the uncertainties referred in the least significant digit(s).
d cm A Sim ( π / 2 ) A Sim ( 2 π / 3 ) A Sim ( 3 π / 4 )
6 0.18216 ( 6 ) 0.12650 ( 8 ) 0.07810 ( 3 )
7 0.20651 ( 7 ) 0.13845 ( 7 ) 0.08184 ( 4 )
8 0.22689 ( 3 ) 0.14784 ( 3 ) 0.08409 ( 4 )
9 0.24395 ( 7 ) 0.15535 ( 9 ) 0.08532 ( 6 )
10 0.25809 ( 8 ) 0.16121 ( 06 ) 0.08599 ( 5 )
12 0.27981 ( 11 ) 0.16971 ( 14 ) 0.08635 ( 8 )
14 0.29502 ( 14 ) 0.17549 ( 10 ) 0.08614 ( 9 )
16 0.30585 ( 16 ) 0.17946 ( 13 ) 0.08564 ( 18 )
18 0.31378 ( 22 ) 0.18224 ( 3 ) 0.08529 ( 10 )
20 0.31993 ( 18 ) 0.18380 ( 87 ) 0.08499 ( 10 )
25 0.32970 ( 19 ) 0.18765 ( 25 ) 0.08441 ( 82 )
30 0.33528 ( 15 ) 0.18925 ( 13 ) 0.08388 ( 14 )
Ideal value 0.3489 0.1937 0.0826