Another Approach to Track Reconstruction: Cluster Analysis


Wigner Research Centre for Physics, 1525 Budapest, Hungary
Universe 2019, 5(5), 105; https://doi.org/10.3390/universe5050105
Submission received: 19 March 2019
/
Revised: 26 April 2019
/
Accepted: 3 May 2019
/
Published: 6 May 2019
(This article belongs to the Special Issue The Zimányi School and Analytic Hydrodynamics in High Energy Physics)
Abstract
:A novel combination of data analysis techniques is introduced for the reconstruction of primary charged particles and of daughters of photon conversions, created in high energy collisions. Instead of performing a classical trajectory building or an image transformation, efficient use of both local and global information is undertaken while keeping competing choices open. The measured hits in silicon-based tracking detectors are clustered with the help of a k-medians clustering. It proceeds by alternating between the hit-to-track assignment and the track-fit update steps, until convergence. The clustering is complemented with the possibility of adding new track hypotheses or removing unnecessary ones. A simplified model of a silicon tracker is employed to test the performance of the proposed method, showing good efficiency and purity characteristics.
1. Introduction
The reconstruction of charged particles, of their trajectories, is an active area of research in high energy particle and nuclear physics. The task is usually computationally difficult (NP-hard). Detectors at today’s particle colliders mostly employ large surface silicon-based tracking devices, which sample the trajectory of the emitted charged particles at several locations. When a charged particle crosses the semiconducting material, it deposits energy and creates a hit by exciting electrons to the valence band, producing electron-hole pairs. The electrons or holes, or both, are transported with an applied electric field, and their charge is read out, amplified, and digitized.
The silicon-based trackers are highly segmented; they consist of several millions of tiny pixels (dimensions of ∼100 m) and of narrow, but long strips (∼10 cm in length). In a high energy collision event, several thousands of pixel and strip hits are created. Our task is to solve a mathematical puzzle: the goal is to identify particle trajectories by associating most of these hits with a limited number of true trajectories. The default solution for this problem is the combinatorial track finding and fitting [1] via the Kalman filter [2]. On the one hand, classical trajectory building utilizes mostly local information by extending the trajectory and picking up compatible hits. On the other hand, image transformation methods (e.g., variants of the Hough transform [3]) collect global information on the parameters of potential track candidates [4]. In the following, elements of an alternative track reconstruction method are outlined, with the aim of efficiently using both local and global information at the same time.
One of the goals of this study is to develop a reasonably efficient reconstruction method for converted photons, this way paving the way for a potential two-photon Bose–Einstein correlation measurement at LHC energies.
2. Methods
The k-medians clustering is a robust classification method [5,6]. It aims to partition the observations into k clusters where each observation belongs to the cluster with the nearest center. In our case, the observations are the pixel or strip hits, and the centers are the track candidates with parameters , where is the pseudorapidity, q is the electric charge, is the momentum in the transverse plane, is the initial azimuth angle, and is the longitudinal, while is the radial coordinate of the emission point. The method consists of two alternating steps. First, each hit is assigned to the closest track candidate, and then, the parameters of the track candidates are updated by refitting their associated hits to an analytic model. The process is stopped if there are no hits changing their association (convergence) or if the number of steps exceeds a given limit.
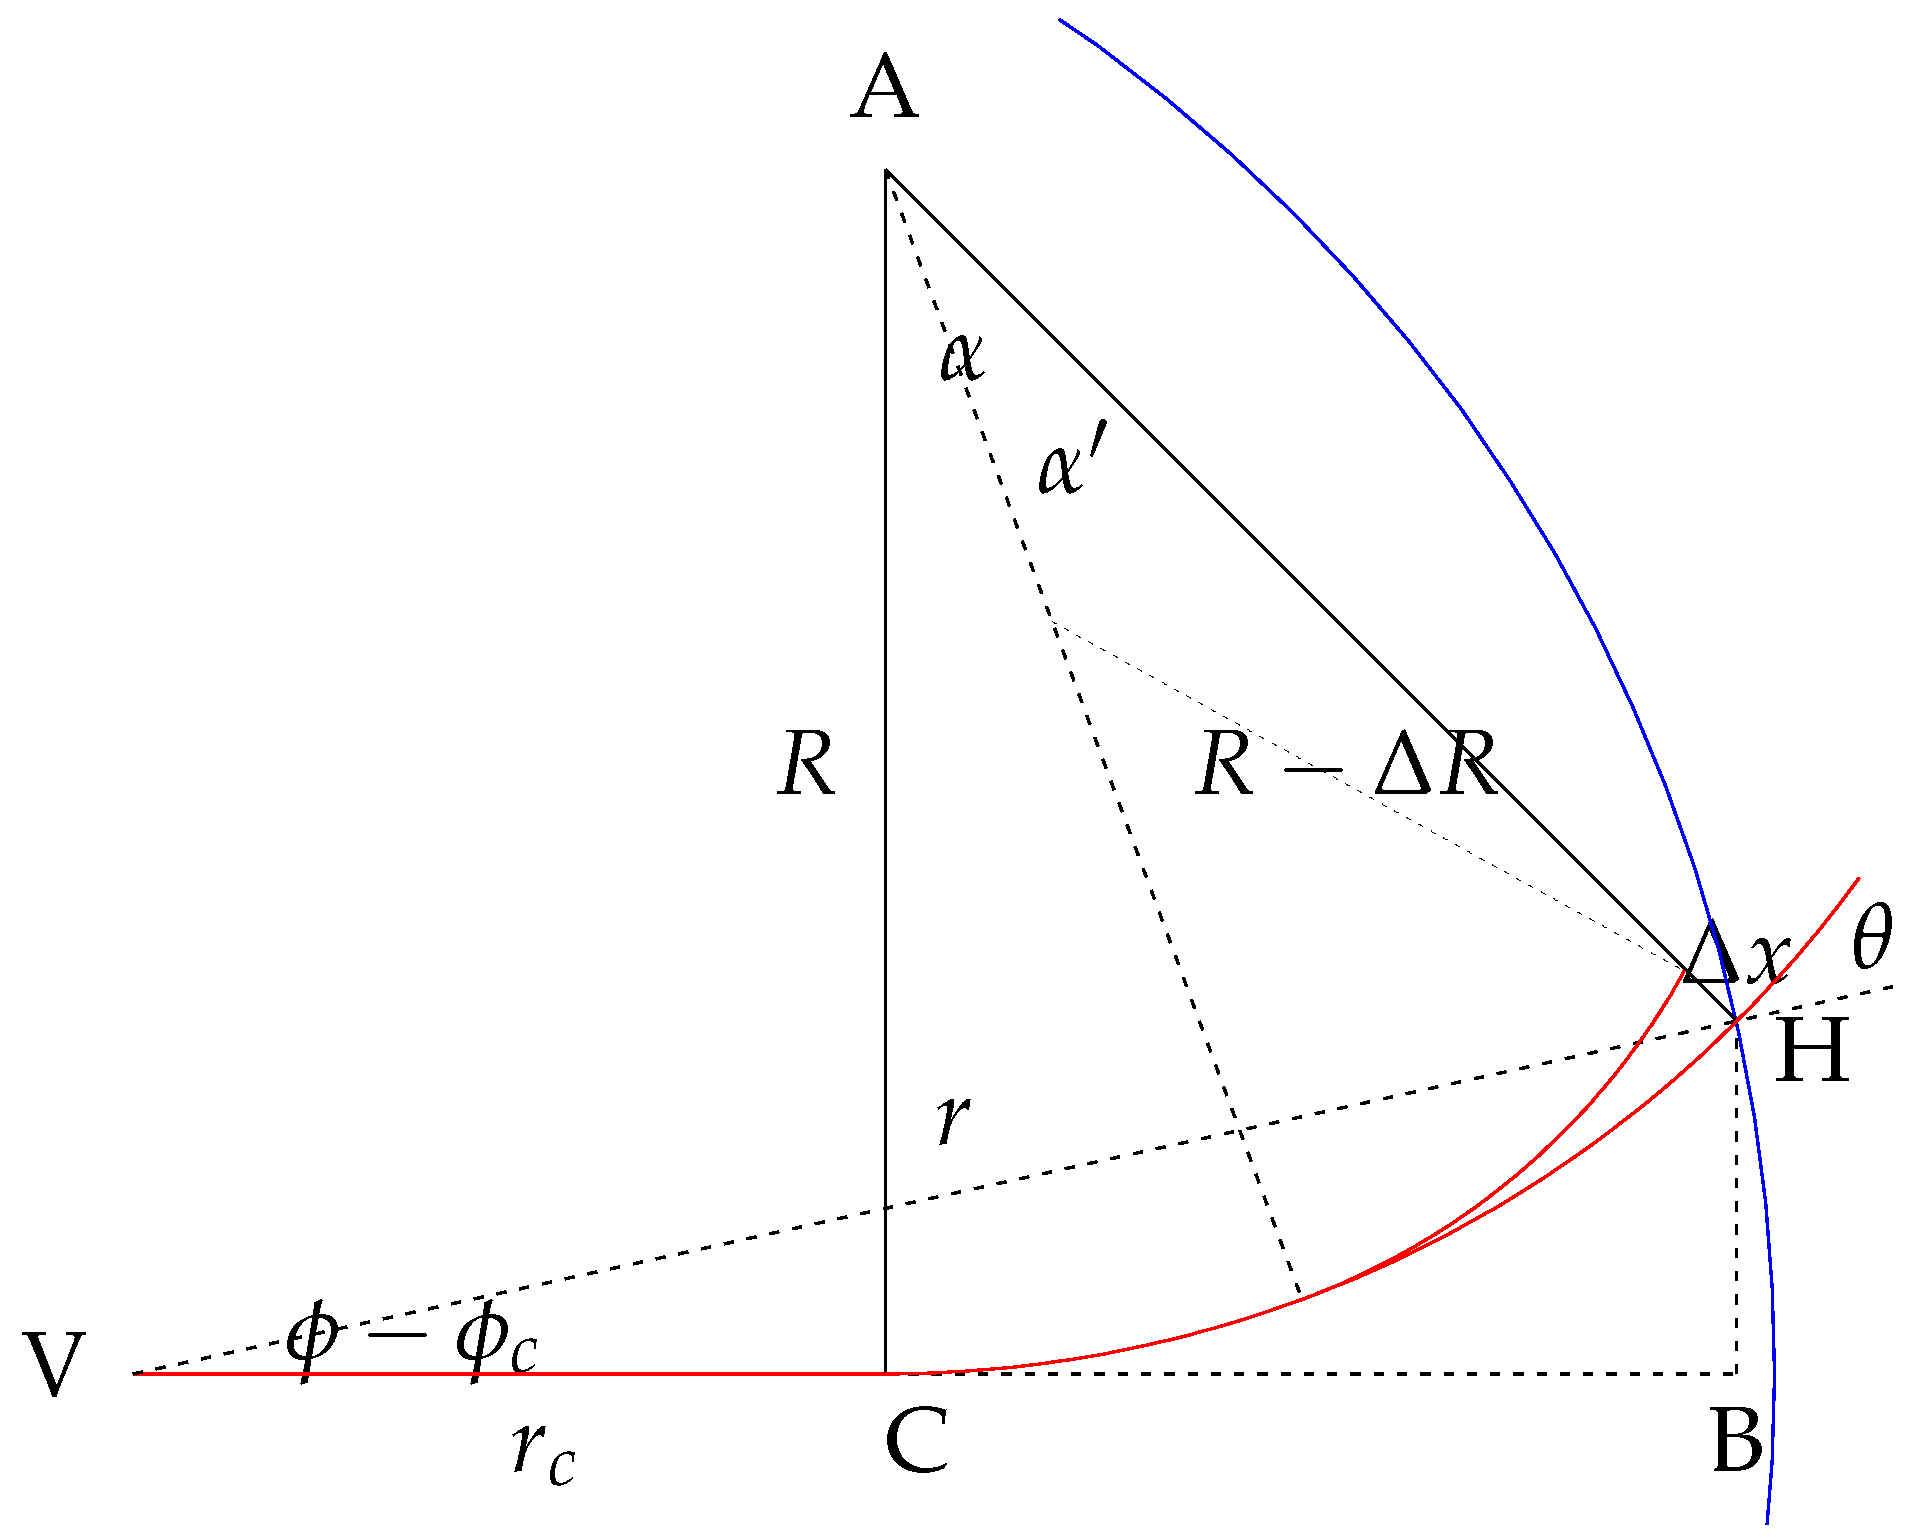
It is important to choose a suitable measure of proximity. Because of outlier hits, the use of the sum of normalized hit-to-track distances (instead of the ordinary ) provides a more robust method. In our implementation, the normalized distances are calculated through the global covariance of the measured hits; this way, no classical trajectory building through the Kalman filter is needed. This approach requires an analytic, but precise description of the main physical processes, such as multiple scattering, continuous energy loss, and bremsstrahlung, with conversion to electron-positron pairs for photons [7]. Details of such a setup are sketched in Figure 1. A photon created at point V is converted to electron-positron pair at point C, and one of the daughters is detected at point H on a cylindrical layer of the silicon detector.
The locations of trajectory hits are obviously highly correlated. The covariance between hits in layers i and j decays roughly proportionally to , where . With that approximation, the inverse of the covariance matrix (in the example below with four hits) is:
As can be seen, the inverse is tridiagonal, and in the calculation of the goodness-of-fit measure (), only the differences between hits on neighboring layers have to be taken into account. Track fit to the associated hits is best accomplished by the downhill simplex method of Nelder and Mead [8]. It employs no function derivatives, but only function evaluations at the vertices of a simplex, in our case a five-simplex.
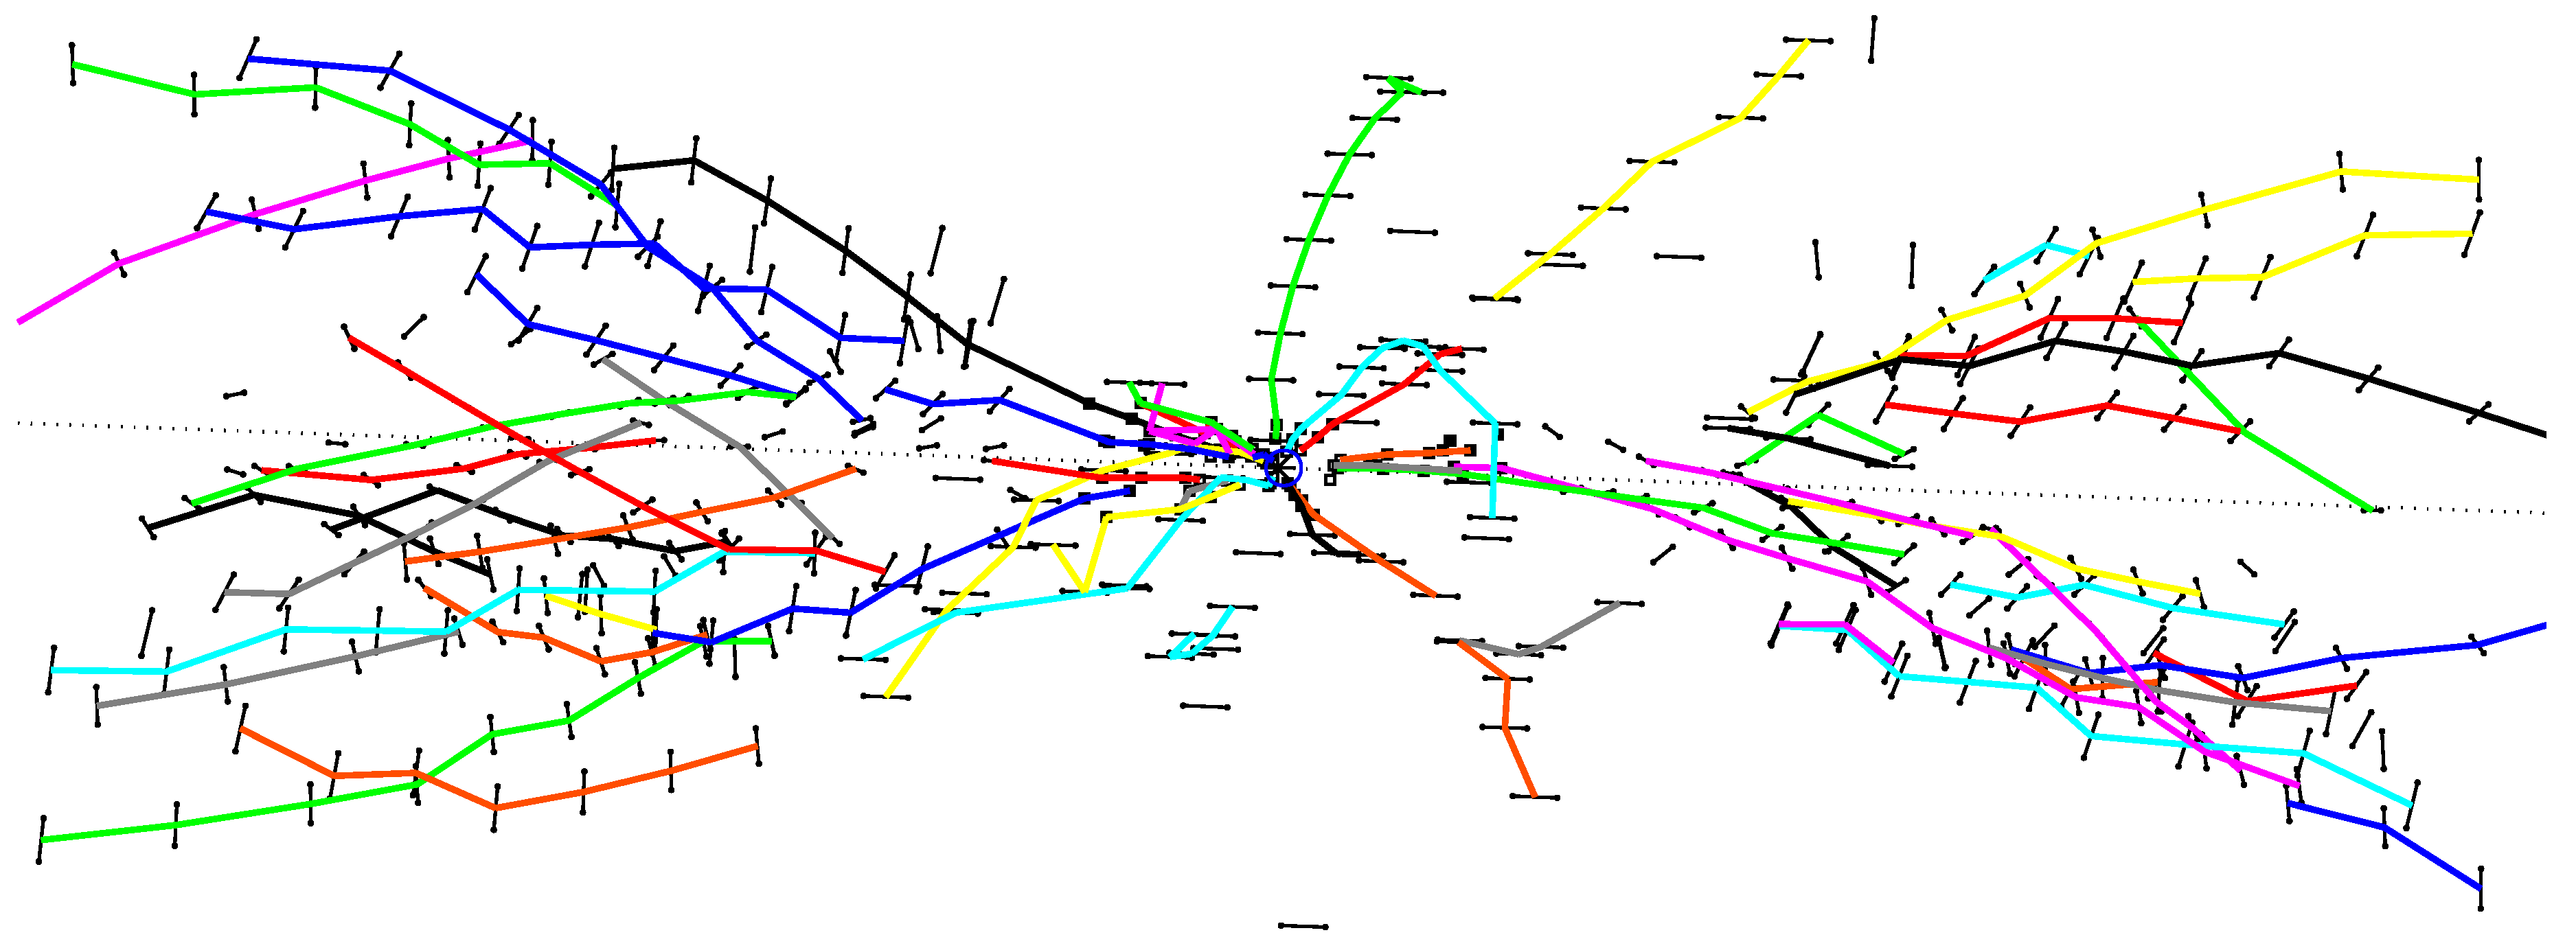
The choice for initial clusters (tracks) is an important one. The initial tracks could be chosen randomly, but much better performance can be achieved. We first find all mutual nearest hit neighbors in the angular distance, with respect to the nominal interaction point (center of the detector). Then, we take the chains of connected hits as initial clusters (Figure 2).
3. Simulation Results
The above ideas are demonstrated on a very simple detector model, with cylindrical and disk-type layers of pixel and strip silicon sensors, in a barrel-and-end-cap layout (Table 1). The tracker detector was immersed in a homogeneous magnetic field of 3.8 T, where z was in the beam direction. Altogether, a thousand collision events with 24, 48, or 96 primary charged particles, and half as many converted photons, were generated. The primary interaction points were chosen on the z-axis, according to a normal distribution with a standard deviation of 5 cm.
The generated charged particles had a uniform distribution in pseudorapidity in the range and in azimuthal angle . Their distribution was proportional to , where was chosen to be 0.2 GeV/c. Photons were generated with similar , , and distributions, but with 0.1 GeV/c. Their conversion points were picked randomly in the active volume of the detector, while the momentum distribution of their conversion products (electrons are positrons) was chosen according to the simplified Tsai’s formula [7].
The layer-to-layer tracking of charged particles in the homogeneous magnetic field was performed by piecewise helices. This time, instead of dealing with the details of the physical processes, the uncertainties were limited to the resolution of the local position measurement, which was modeled according to a normal distribution with a standard deviation of 1 mm. The efficiency of hit finding was taken to be 98%.
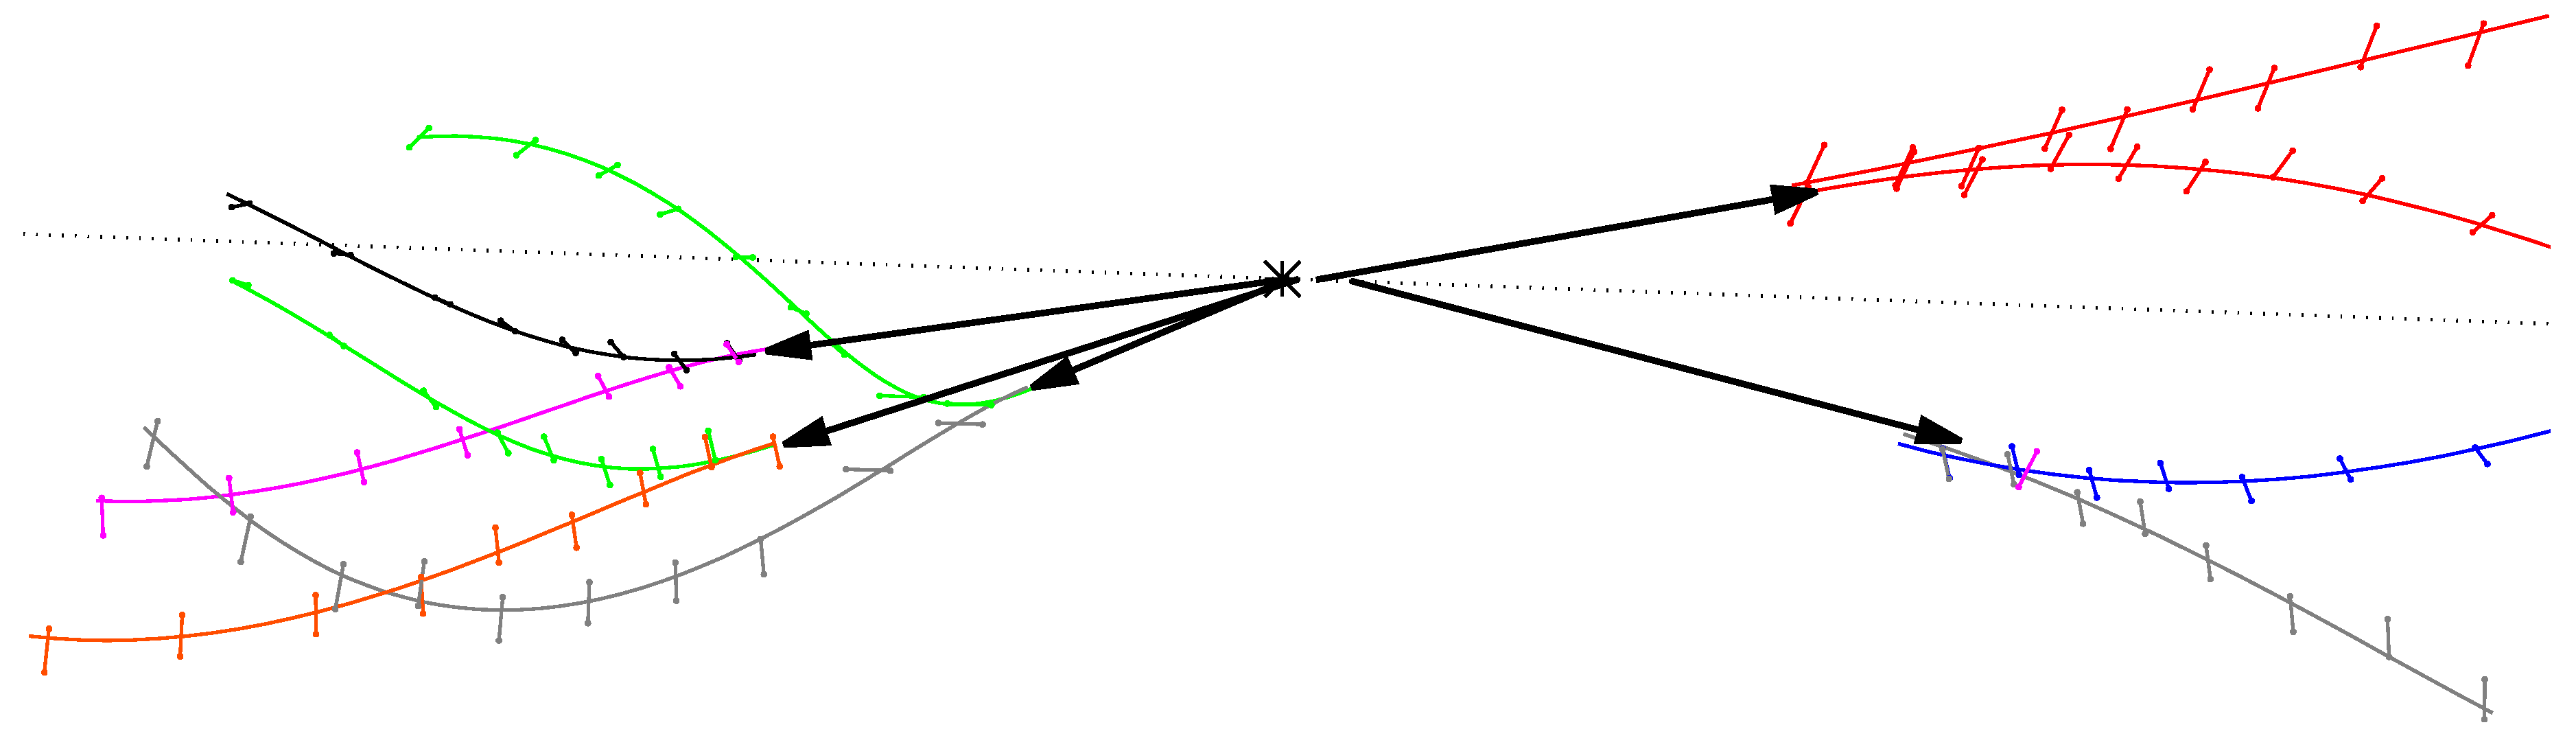
As the results of the track finding steps outlined in Section 2, hits and track candidates and their trajectories, after the first and the 30th (final) k-medians iterations, are shown in Figure 3. For primary particles, the tracking efficiency in the range 0.5 GeV/c was observed to be around of 90–95%. It decreased towards very low transverse momenta and reached 50% near 0.2 GeV/c. The purity was around 90%, independent of . Photon conversions were found by searching for close positively- and negatively-charged track candidates in the space (Figure 4), and the corresponding electron and positron tracks are plotted in Figure 5. For conversion electrons (and positrons), the tracking efficiency in the range 0.6 GeV/c was around 70%, with a slight decrease towards lower transverse momenta, and it reached 30% near 0.2 GeV/c.
According to these simple tests, the measures mentioned above were independent of the number of primary charged particles in the studied multiplicity range. The performance can be further increased by using elements from a more sophisticated Metropolis–Hastings MCMC algorithm [9], namely by sometimes adding new track hypotheses and removing unnecessary ones during the iteration process.
4. Conclusions
A novel combination of data analysis techniques was proposed for the reconstruction of all tracks of primary charged particles, as well as of daughters of displaced vertices, created in high energy collisions. Instead of performing a classical trajectory building or an image transformation, an efficient use of both local and global information was undertaken while keeping competing choices open.
The measured hits of adjacent tracking layers were clustered first with the help of a mutual nearest neighbor search in the angular distance. The resulting chains of connected hits were used as initial clusters and as input for a cluster analysis algorithm, the robust k-medians clustering. This latter proceeded by alternating between the hit-to-track assignment and the track-fit update steps, until convergence. The calculation of the hit-to-track distance and that of the track-fit was performed through the global covariance of the measured hits. The clustering was complemented with elements from a more sophisticated Metropolis–Hastings MCMC algorithm, with the possibility of adding new track hypotheses or removing unnecessary ones.
Preliminary studies show that the proposed method provided reasonable efficiency and purity for the reconstruction of converted photons; this way, it opens the way towards an efficient identification of low momentum converted photons.
Funding
This work was supported by the National Research, Development and Innovation Office of Hungary (K 128786).
Conflicts of Interest
The author declares no conflict of interest. The funders had no role in the design of the study; in the collection, analyses, or interpretation of data; in the writing of the manuscript; nor in the decision to publish the results.
References
- Frühwirth, R. Application of Kalman filtering to track and vertex fitting. Nucl. Instrum. Meth. A 1987, 262, 444–450. [Google Scholar] [CrossRef]
- Kalman, R.E. A new approach to linear filtering and prediction problems. J. Basic Eng. 1960, 82, 35–45. [Google Scholar] [CrossRef]
- Hough, P.V.C. Method and Means for Recognizing Complex Patterns. U.S. Patent 3069654, 18 December 1962. [Google Scholar]
- Siklér, F. A combination of analysis techniques for efficient track reconstruction of high multiplicity events in silicon detectors. Eur. Phys. J. A 2018, 54, 113. [Google Scholar] [CrossRef]
- Steinhaus, H. Sur la division des corps matériels en parties. Bull. Acad. Pol. Sci. CL. III 1957, 4, 801–804. [Google Scholar]
- MacQueen, J. Some methods for classification and analysis of multivariate observations. In Proceedings of the Fifth Berkeley Symposium on Mathematical Statistics and Probability, Volume 1: Statistics; University of California Press: Berkeley, CA, USA, 1967; pp. 281–297. [Google Scholar]
- Tanabashi, M.; Hagiwara, K.; Hikasa, K.; Nakamura, K.; Sumino, Y.; Takahashi, F.; Tanaka, J.; Agashe, K.; Aielli, G.; Amsler, C.; et al. Review of Particle Physics. Phys. Rev. D 2018, 98, 030001. [Google Scholar] [CrossRef]
- Nelder, J.A.; Mead, R. A simplex method for function minimization. Comput. J. 1965, 7, 308–313. [Google Scholar] [CrossRef]
- Hastings, W.K. Monte Carlo Sampling Methods Using Markov Chains and Their Applications. Biometrika 1970, 57, 97–109. [Google Scholar] [CrossRef]
Figure 1.
Geometry of a photon conversion in the plane transverse to the beam line.

Figure 2.
Chains of connected hits, taken as initial clusters in the k-medians clustering method.

Figure 3.
Hits and track candidates and their trajectories (colored curves), after the first iteration (top), and after the 30th iteration (bottom). The event is identical to the one displayed in Figure 2.
Figure 3.
Hits and track candidates and their trajectories (colored curves), after the first iteration (top), and after the 30th iteration (bottom). The event is identical to the one displayed in Figure 2.

Figure 4.
Identification of photon conversions in the space of track candidates.

Figure 5.
Hits and track candidates and their trajectories, corresponding to electron or positron tracks (colored curves) coming from photon conversions (thick black arrows). The event is identical to the one displayed in Figure 3.
Figure 5.
Hits and track candidates and their trajectories, corresponding to electron or positron tracks (colored curves) coming from photon conversions (thick black arrows). The event is identical to the one displayed in Figure 3.

Table 1.
Main characteristics of tracking detector (silicon layers) used in the simulation. For the barrel layers, the layer type is shown along with the radii (r) of the concentric cylinders and their longitudinal extent (–) in the beam direction. For the end-cap layers, the layer type is shown along with their positions and with the inner () and outer radii () of their disks.
| Barrel | r (cm) | (cm) |
| pixels | 4, 7, 10 | 25 |
| strips | 20, 30, 40, 50 | 55 |
| strips | 60, 70, 80, 90, 100, 110 | 55 |
| End-Cap | (cm) | –(cm) |
| pixels | 35, 45 | 5–15 |
| strips | 75, 90, 105 | 20–50 |
| strips | 125, 140, 155 | 20–110 |
| strips | 170, 185, 200 | 30–110 |
| strips | 220, 245 | 40–110 |
| strips | 270 | 50–110 |
© 2019 by the author. Licensee MDPI, Basel, Switzerland. This article is an open access article distributed under the terms and conditions of the Creative Commons Attribution (CC BY) license (http://creativecommons.org/licenses/by/4.0/).
Share and Cite
MDPI and ACS Style
Siklér, F. Another Approach to Track Reconstruction: Cluster Analysis. Universe 2019, 5, 105. https://doi.org/10.3390/universe5050105
AMA Style
Siklér F. Another Approach to Track Reconstruction: Cluster Analysis. Universe. 2019; 5(5):105. https://doi.org/10.3390/universe5050105
Chicago/Turabian StyleSiklér, Ferenc. 2019. "Another Approach to Track Reconstruction: Cluster Analysis" Universe 5, no. 5: 105. https://doi.org/10.3390/universe5050105
Note that from the first issue of 2016, this journal uses article numbers instead of page numbers. See further details here.