
Effect of Light Emitting Diodes (LED) Exposure on Vitreous Metabolites-Rodent Study
 , ,
, ,
Abstract
:1. Introduction
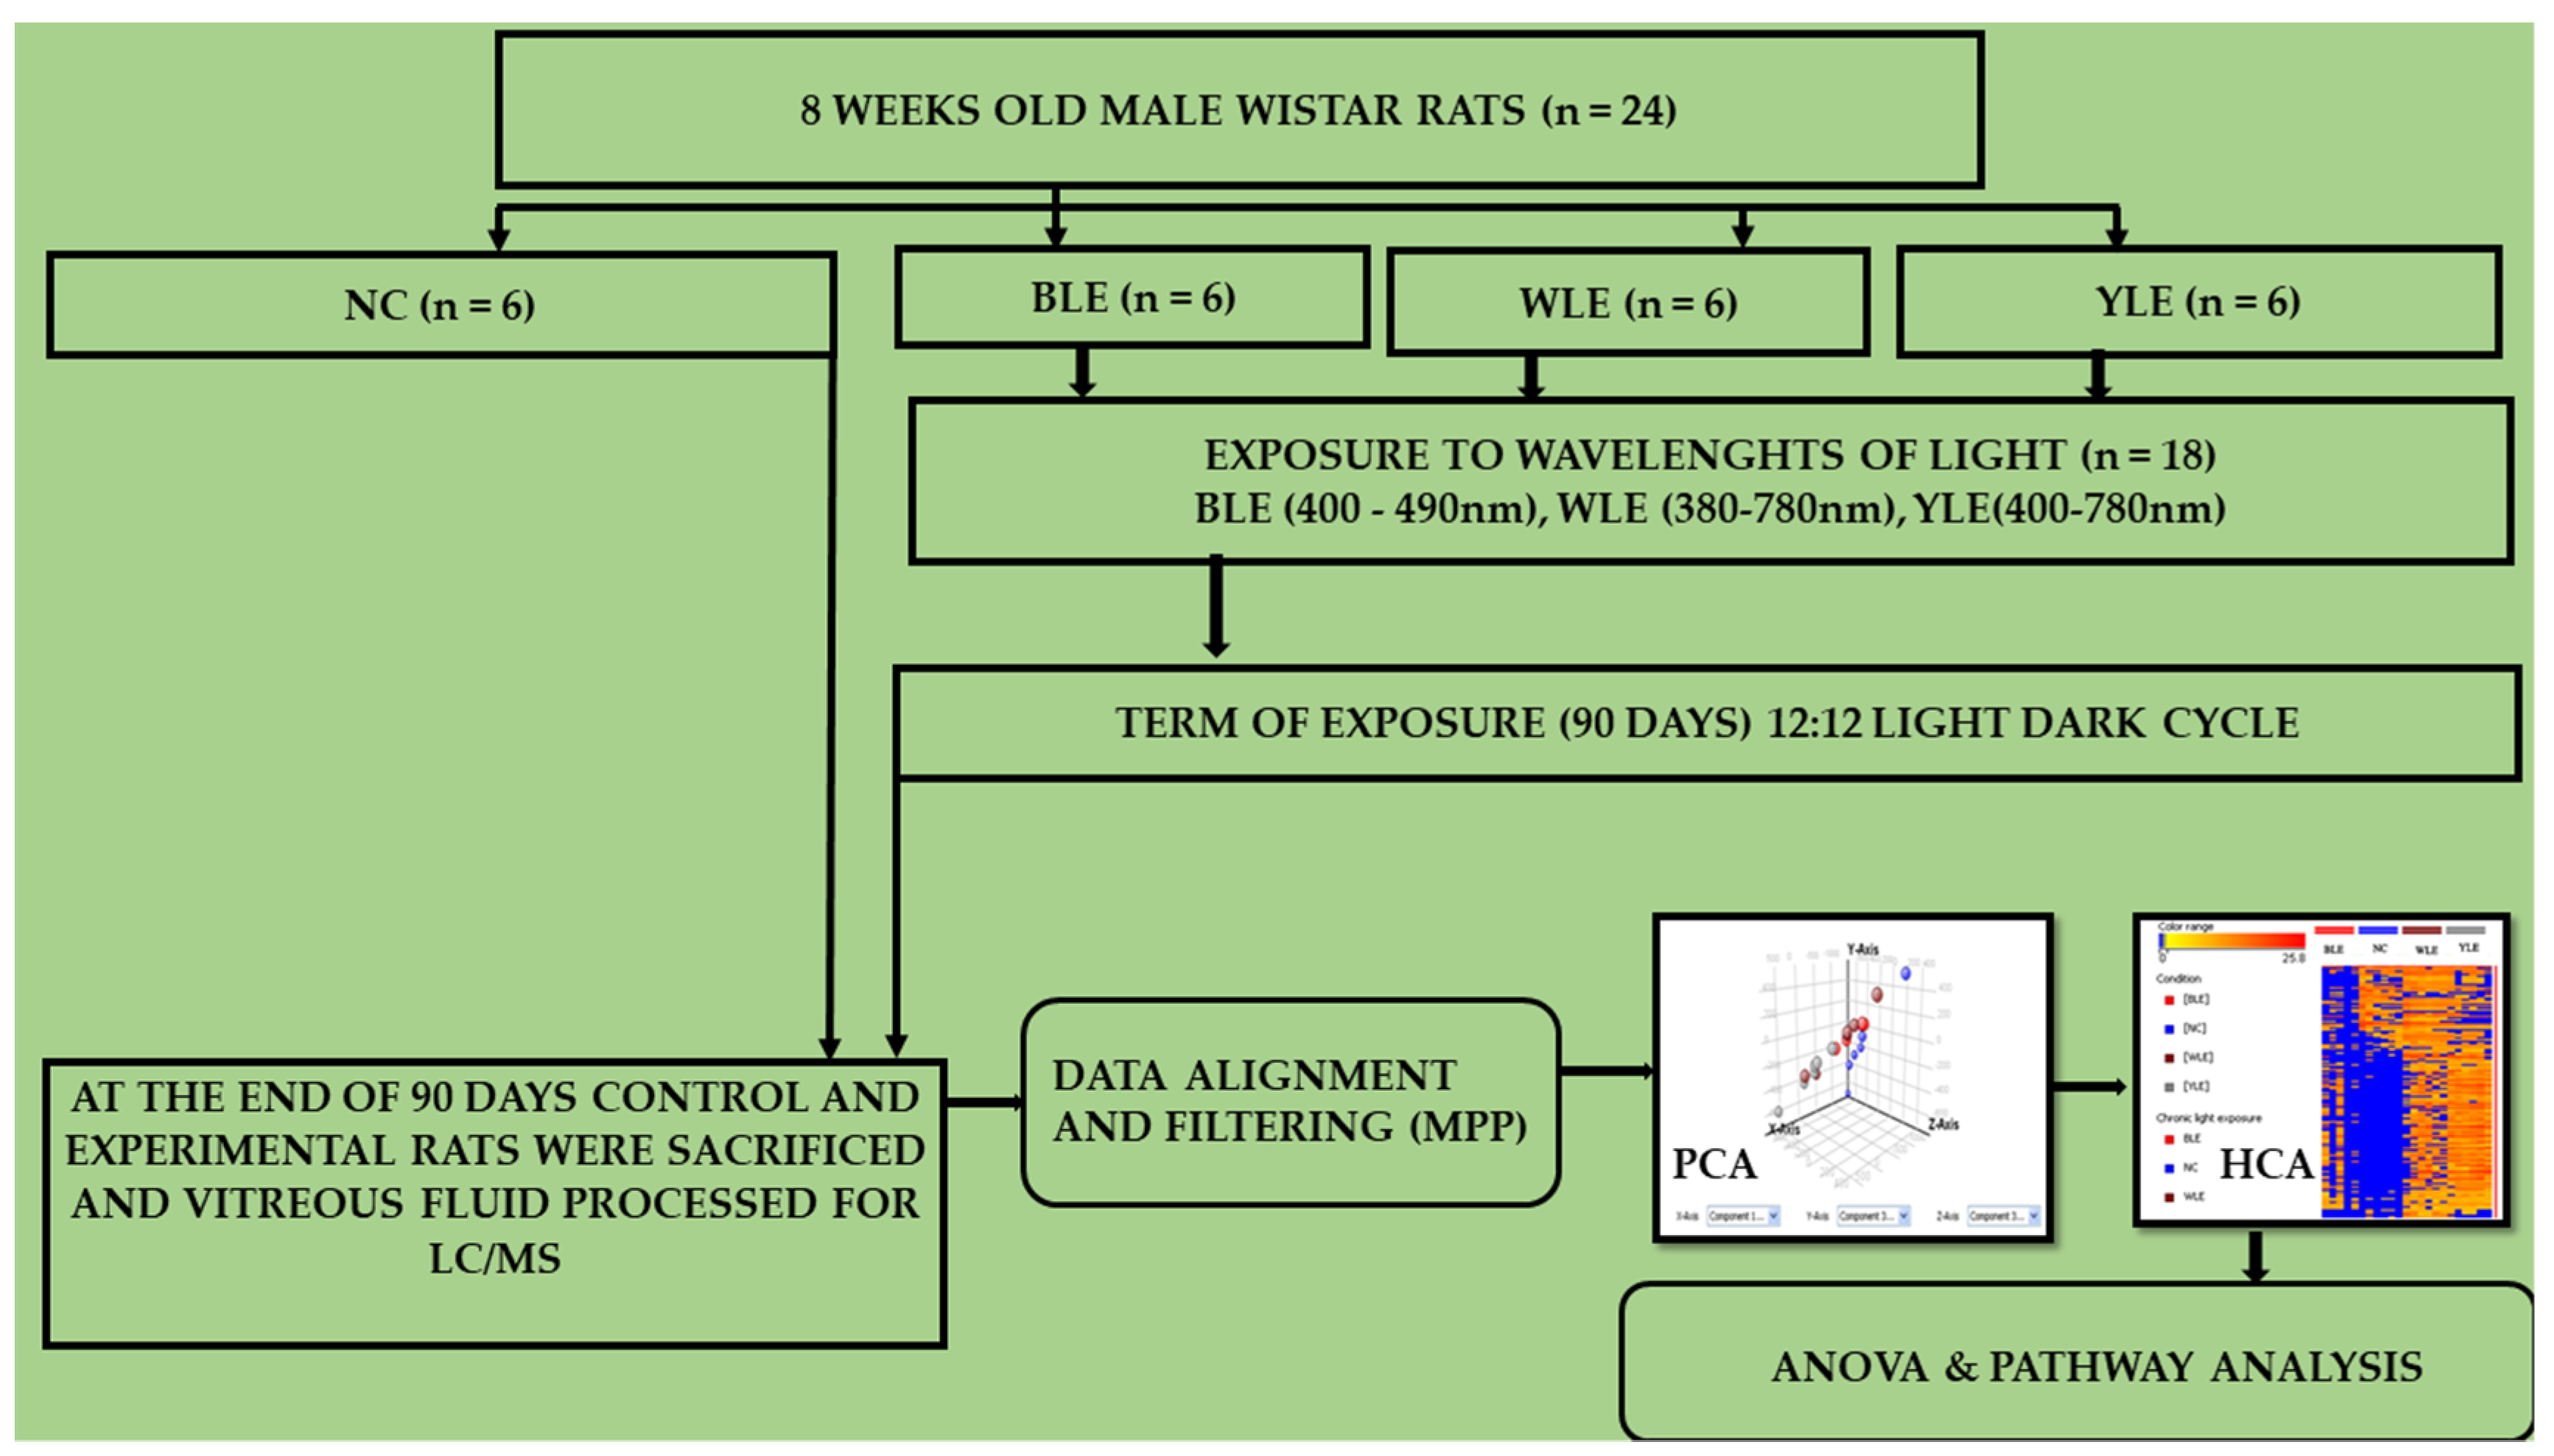
2. Methodology
2.1. Rat Whole Vitreous
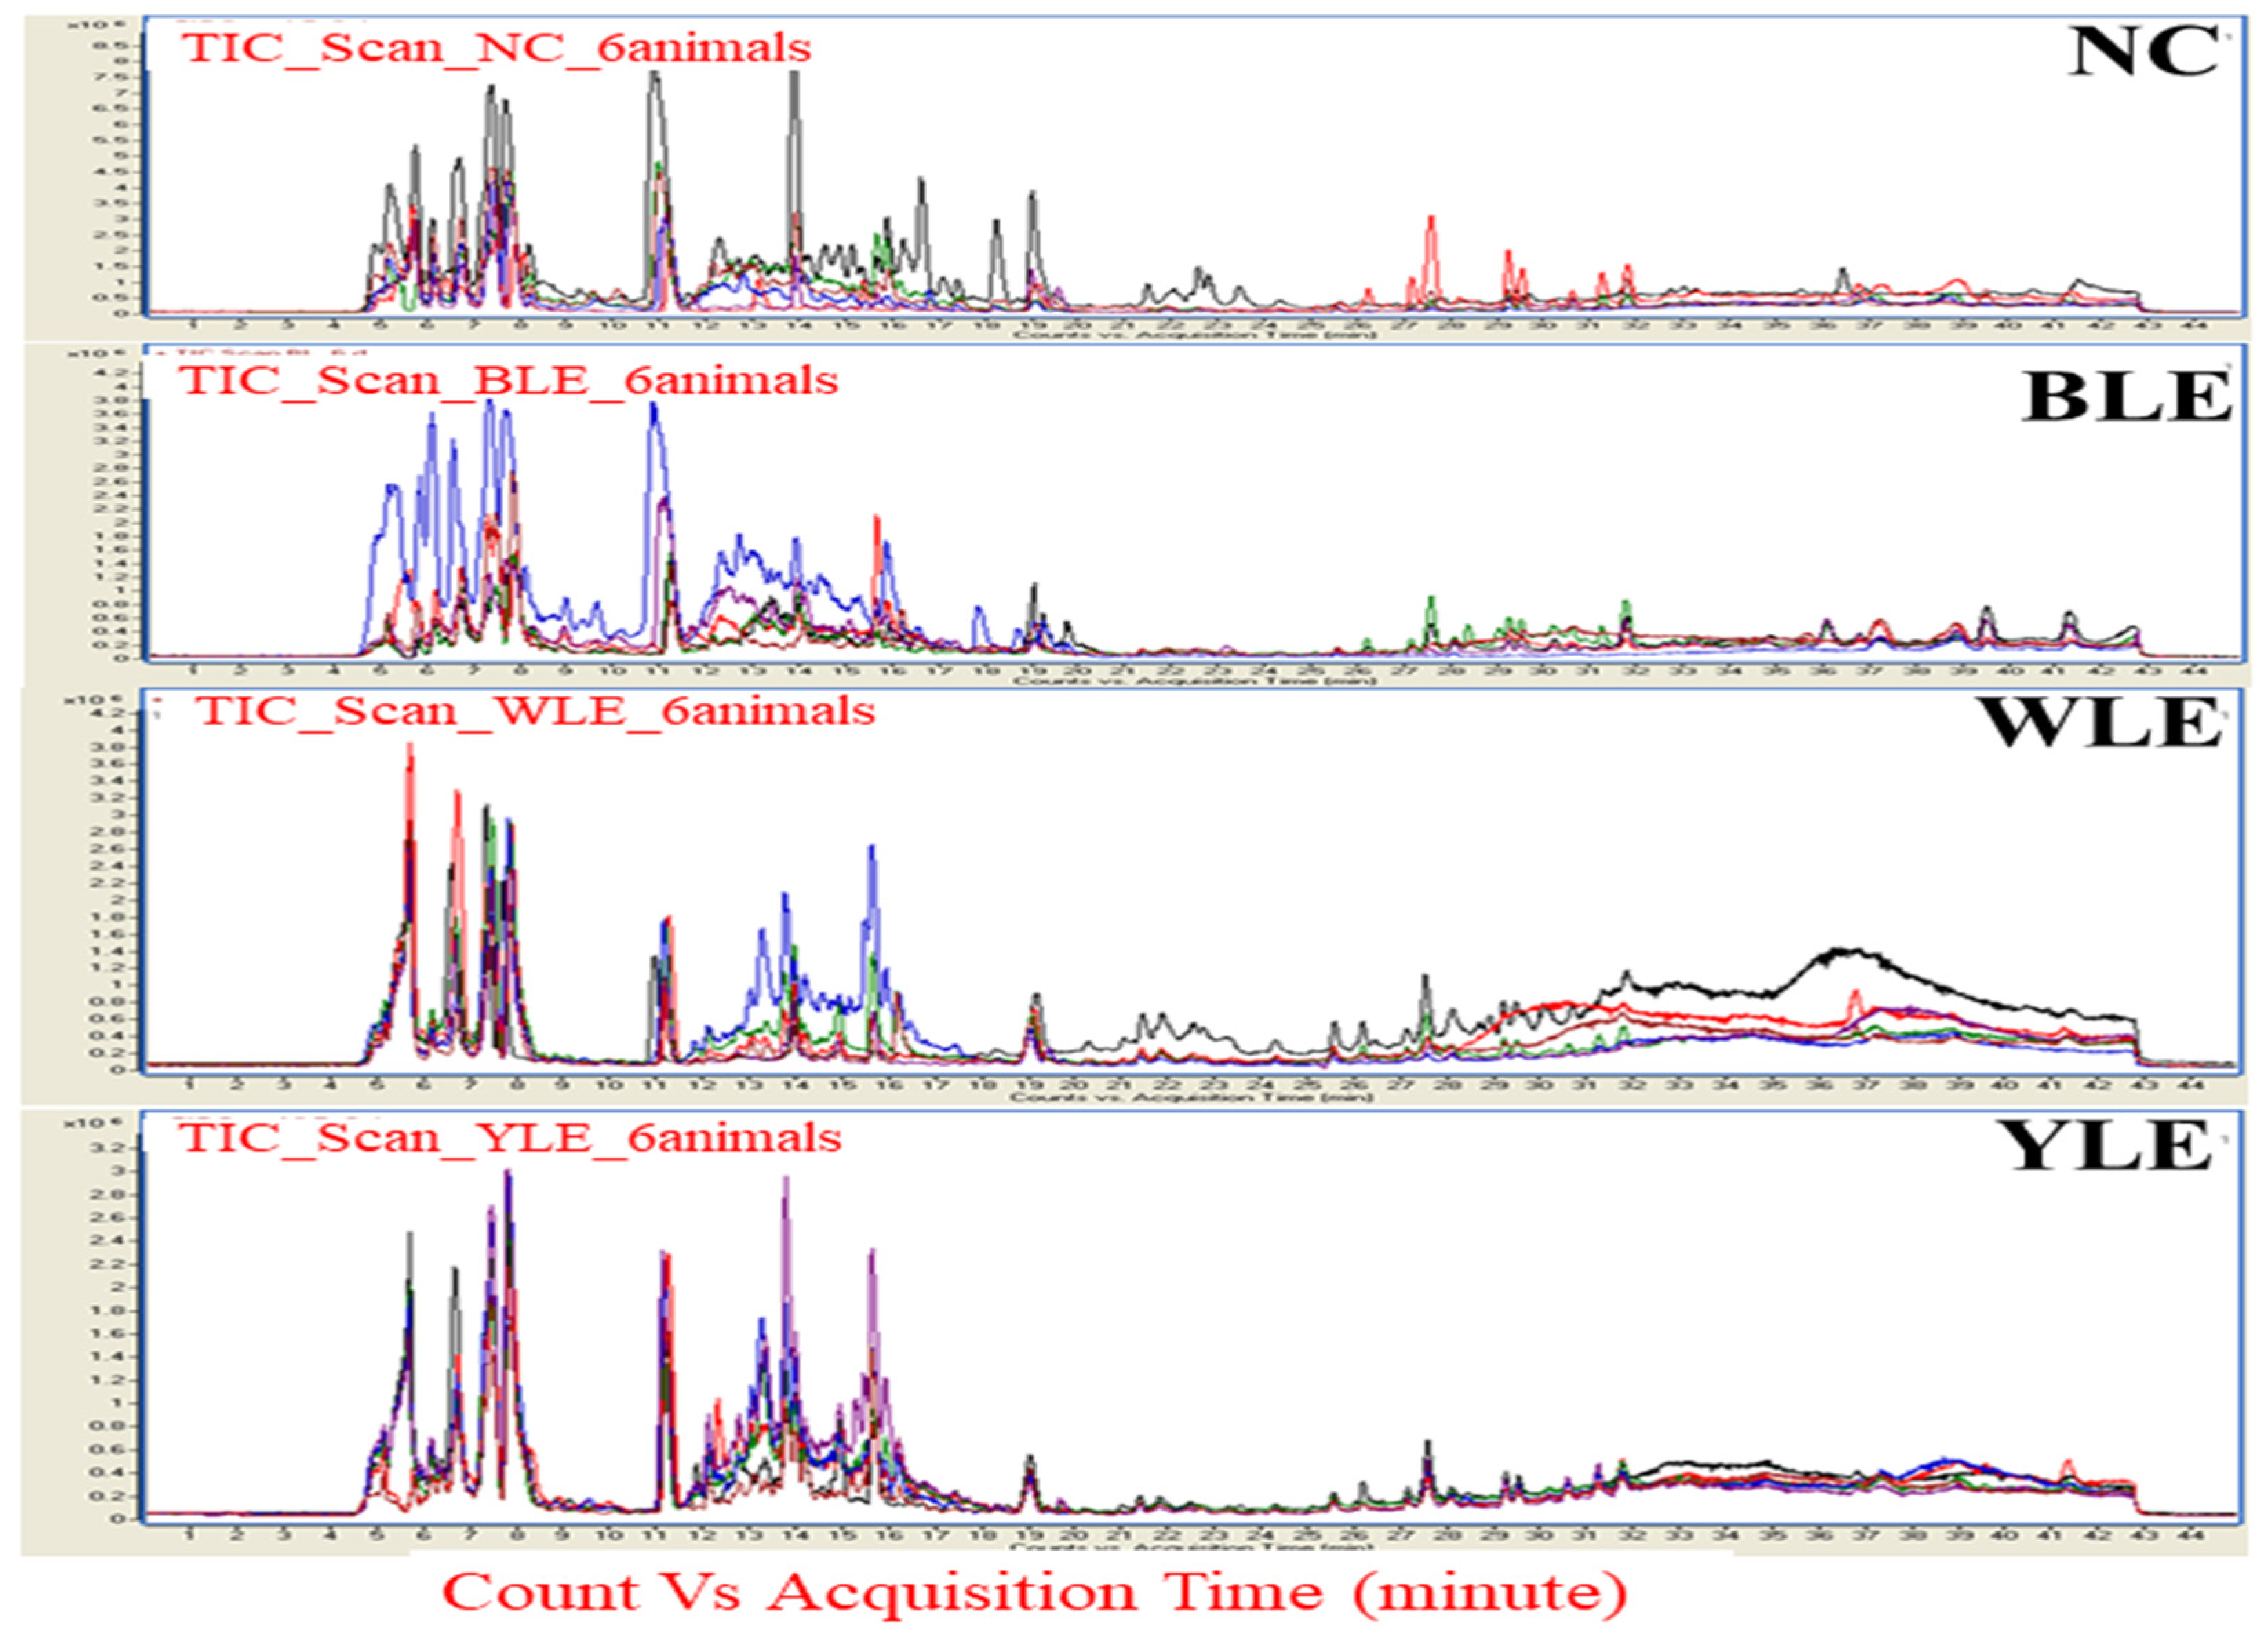
2.2. Vitreous Metabolomic Analysis
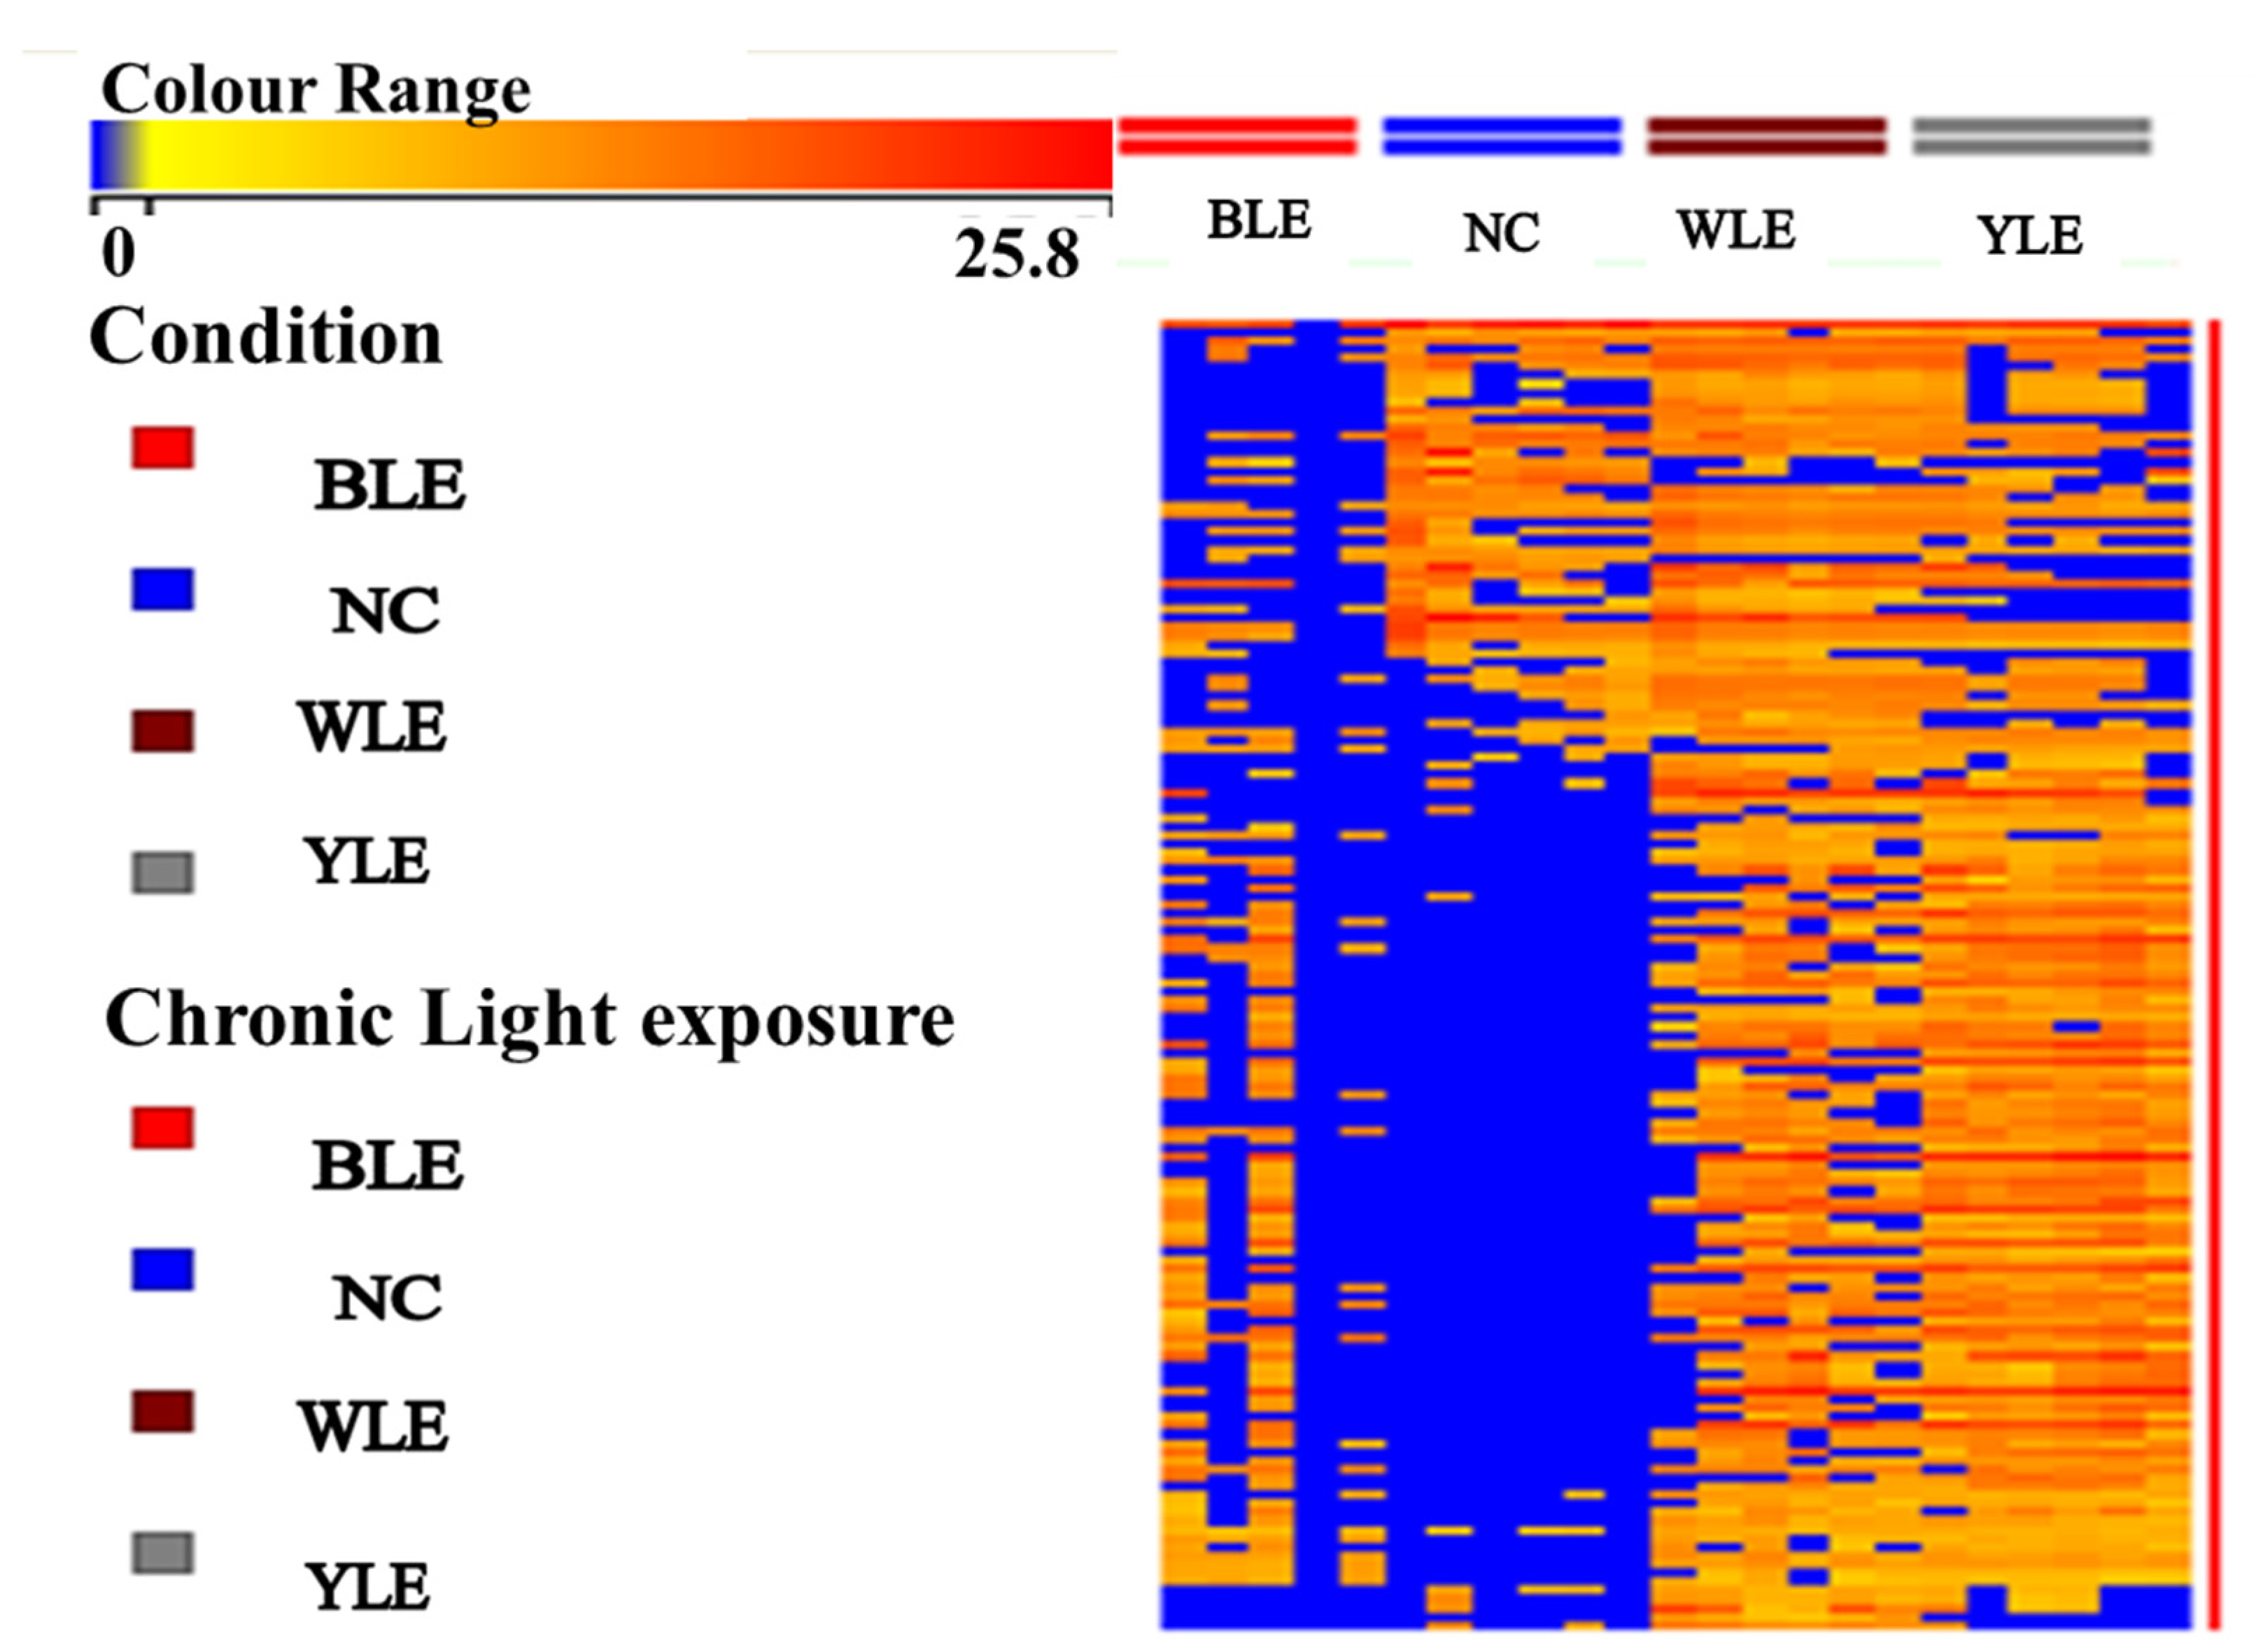
2.3. Data Processing and Analysis
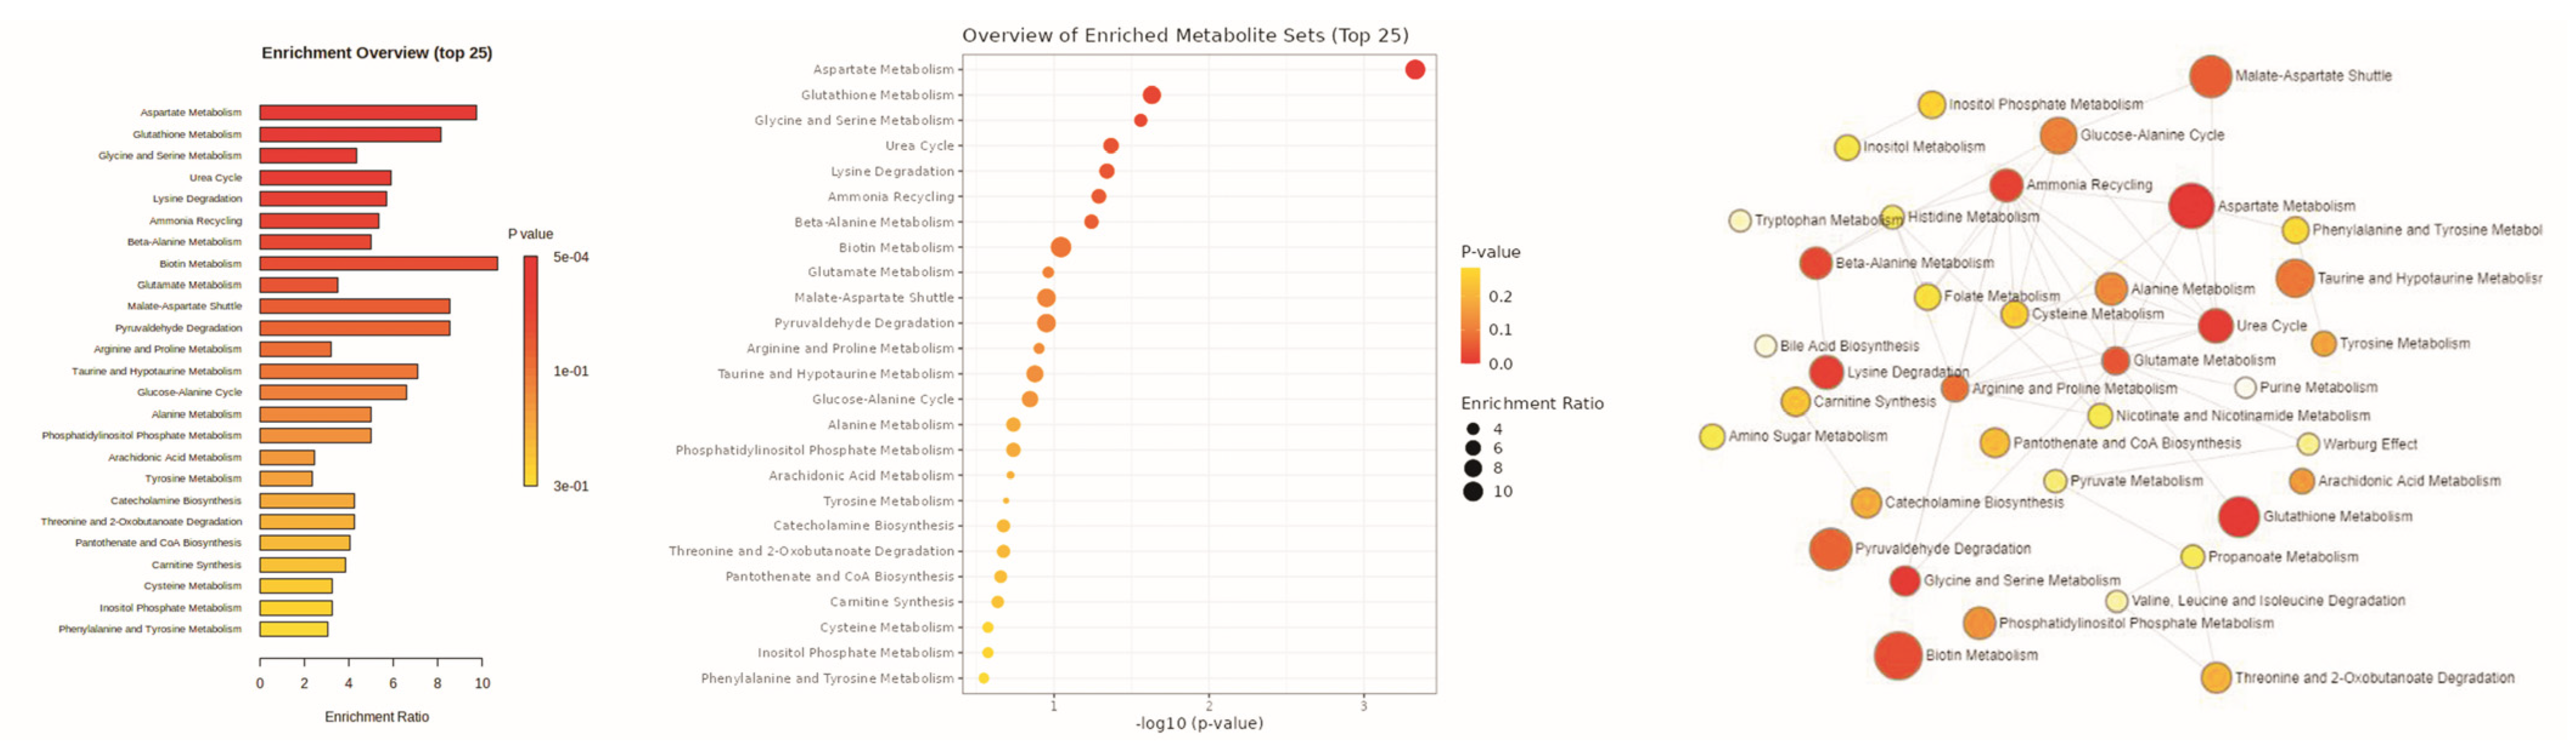
3. Results
3.1. Metabolomic Amendment of Chronic Light Exposure and Reprogramming
3.2. PCA and PLS-DA
4. Discussion
5. Conclusions
Supplementary Materials
Author Contributions
Funding
Institutional Review Board Statement
Informed Consent Statement
Data Availability Statement
Conflicts of Interest
References
- Boettner, E.A. Transmission of the Ocular Media. Investig. Ophthalmol. Vis. Sci. 1962, 1, 776–783. [Google Scholar]
- Bailes, H.J.; Lucas, R.J. Human melanopsin forms a pigment maximally sensitive to blue light (λmax ≈ 479 nm) supporting activation of Gq/11 and Gi/o signalling cascades. Proc. R. Soc. B Biol. Sci. 2013, 280, 20122987. [Google Scholar] [CrossRef] [PubMed] [Green Version]
- Al-Karawi, D.; Jubair, L. Bright light therapy for nonseasonal depression: Meta-analysis of clinical trials. J. Affect. Disord. 2016, 198, 64–71. [Google Scholar] [CrossRef] [PubMed]
- Turner, P.L.; Van Someren, E.J.W.; Mainster, M.A. The role of environmental light in sleep and health: Effects of ocular aging and cataract surgery. Sleep Med. Rev. 2010, 14, 269–280. [Google Scholar] [CrossRef]
- Setlow, R.B.; Grist, E.; Thompson, K.; Woodhead, A.D. Wavelengths effective in induction of malignant melanoma. Proc. Natl. Acad. Sci. USA 1993, 90, 6666–6670. [Google Scholar] [CrossRef] [Green Version]
- Shang, Y.M.; Wang, G.S.; Sliney, D.H.; Yang, C.H.; Lee, L.L. Light-emitting-diode induced retinal damage and its wavelength dependency in vivo. Int. J. Ophthalmol. 2017, 10, 191–202. [Google Scholar]
- Sparrow, J.R.; Miller, A.S.; Zhou, J. Blue light-absorbing intraocular lens and retinal pigment epithelium protection in vitro. J. Cataract Refract. Surg. 2004, 30, 873–878. [Google Scholar] [CrossRef]
- Ecker, J.L.; Dumitrescu, O.N.; Wong, K.Y.; Alam, N.M.; Chen, S.; LeGates, T.; Renna, J.M.; Prusky, G.T.; Berson, D.M.; Hattar, S. Cellular diversity and role in pattern vision. Neuron 2011, 67, 49–60. [Google Scholar] [CrossRef] [Green Version]
- Grimm, C.; Wenzel, A.; Williams, T.P.; Rol, P.O.; Hafezi, F.; Remé, C.E. Rhodopsin-Mediated Blue-Light Damage to the Rat Retina: Effect of Photoreversal of Bleaching. Retin. Cell Biol. 2018, 42, 497–505. [Google Scholar]
- Roehlecke, C.; Schumann, U.; Ader, M.; Knels, L.; Funk, R.H.W. Influence of blue light on photoreceptors in a live retinal explant system. Mol. Vis. 2011, 17, 876–884. [Google Scholar]
- Wahnschaffe, A.; Haedel, S.; Rodenbeck, A.; Stoll, C.; Rudolph, H.; Kozakov, R.; Schoepp, H.; Kunz, D. Out of the Lab and into the Bathroom: Evening Short-Term Exposure to Conventional Light Suppresses Melatonin and Increases Alertness Perception. Int. J. Mol. Sci. 2013, 14, 2573–2589. [Google Scholar] [CrossRef] [PubMed]
- Cheung, I.N.; Zee, P.C.; Shalman, D.; Malkani, R.G.; Kang, J. Reid Morning and Evening Blue-Enriched Light Exposure Alters Metabolic Function in Normal Weight Adults. PLoS ONE 2016, 11, e0155601. [Google Scholar] [CrossRef] [PubMed] [Green Version]
- Ham, W.T.; Mueller, H.A.; Sliney, D.H. Retinal sensitivity to damage from short wavelength light. Nature 1976, 260, 153–155. [Google Scholar] [CrossRef] [PubMed]
- De la Barca, J.M.C.; Huang, N.; Jiao, H.; Tessier, L.; Gadras, C.; Simard, G.; Natoli, R.; Tcherkez, G.; Reynier, P.; Valter, K. Retinal metabolic events in preconditioning light stress as revealed by wide-spectrum targeted metabolomics. Metabolomics 2017, 13, 22. [Google Scholar] [CrossRef] [PubMed]
- Youssef, P.N.; Sheibani, N.; Albert, D.M. Retinal light toxicity. Eye 2011, 25, 1–14. [Google Scholar] [CrossRef] [PubMed] [Green Version]
- Mainster, M.A.; Ham, W.T.; Delori, F.C. Potential Retinal Hazards: Instrument and Environmental Light Sources. Ophthalmology 1983, 90, 927–932. [Google Scholar] [CrossRef]
- Natoli, R.; Jiao, H.; Barnett, N.L.; Fernando, N.; Valter, K.; Provis, j.; Rutar, M. A model of progressive photo-oxidative degeneration and inflammation in the pigmented C57BL/6J mouse retina. Exp. Eye Res. 2016, 147, 114–127. [Google Scholar] [CrossRef] [Green Version]
- Jaadane, I.; Rodriguez, G.V.; Boulenguez, P.; Carré, S.; Dassieni, I.; Lebon, C.; Chahory, S.; Behar-Cohen, F.; Martinsons, C.; Torriglia, A. Retinal phototoxicity and the evaluation of the blue light hazard of a new solid-state lighting technology. Sci. Rep. 2020, 10, 6733. [Google Scholar] [CrossRef] [Green Version]
- Chamorro, E.; Bonnin-Arias, C.; Pérez-Carrasco, M.J.; de Luna, J.M.; Vázquez, D.; Sánchez-Ramos, C. Effects of light-emitting diode radiations on human retinal pigment epithelial cells in vitro. Photochem. Photobiol. 2013, 89, 468–473. [Google Scholar] [CrossRef]
- Hockberger, P.E.; Skimina, T.A.; Centonze, V.E.; Lavin, C.; Chu, S.; Dadras, S.; Reddy, J.K.; White, J.G. Activation of flavin-containing oxidases underlies light-induced production of H2O2 in mammalian cells. Proc. Natl. Acad. Sci. USA 1999, 96, 6255–6260. [Google Scholar] [CrossRef] [Green Version]
- Contín, M.A.; Arietti, M.M.; Benedetto, M.M.; Bussi, C.; Guido, M.E. Photoreceptor damage induced by low-intensity light: Model of retinal degeneration in mammals. Mol. Vis. 2013, 19, 1614–1625. [Google Scholar]
- Kuse, Y.; Ogawa, K.; Tsuruma, K.; Shimazawa, M.; Hara, H. Damage of photoreceptor-derived cells in culture induced by light emitting diode-derived blue light. Sci. Rep. 2014, 4, 5223. [Google Scholar] [CrossRef] [PubMed] [Green Version]
- Smick, K. Blue Light Hazard: New Knowledge, New Approaches to Maintaining Ocular Health; Essilor: Charenton-le-Pont, France, 2013; pp. 1–12. [Google Scholar]
- Boulton, M.; Rózanowska, M.; Rózanowski, B. Retinal photodamage. J. Photochem. Photobiol. B Biol. 2001, 64, 144–161. [Google Scholar] [CrossRef] [PubMed]
- Godley, B.F.; Shamsi, F.A.; Liang, F.; Jarrett, S.G.; Davies, S.; Boulton, M. Blue light induces mitochondrial DNA damage and free radical production in epithelial cells. J. Biol. Chem. 2005, 280, 21061–21066. [Google Scholar] [CrossRef] [PubMed] [Green Version]
- Nagarajan, T.N.; Joshi, M.B.; Ballae Ganeshrao, S.; Valiathan, M.; Surendran, S. Blue LED light exposure induces metabolic rewiring in vitreous tissues in rat models. J. King Saud Univ.-Sci. 2022, 34, 101986. [Google Scholar] [CrossRef]
- Nagarajan, T.N.; Sudarshan, S.; Joshi Manjunath, B.; Valiathan, M.; Ganeshrao, S.B. Blue light-induced alterations in visual cortex layer5pyramidal neuron and amelioration by Blue light blocking lenses (BBLs) in-Wistar rats. Investig. Ophthalmol. Vis. Sci. 2021, 62, 621. [Google Scholar]
- Theruveethi, N.; Bui, B.V.; Joshi, M.B.; Valiathan, M.; Ganeshrao, S.B.; Gopalakrishnan, S.; Kabekkodu, S.P.; Bhat, S.S.; Surendran, S. Blue Light-Induced Retinal Neuronal Injury and Amelioration by Commercially Available Blue Light-Blocking Lenses. Life 2022, 12, 243. [Google Scholar] [CrossRef]
- Tosini, G.; Ferguson, I.; Tsubota, K. Effects of blue light on the circadian system and eye physiology. Mol. Vis. 2016, 22, 61–72. [Google Scholar]
- Van Norren, D.; Schellekens, P. Blue light hazard in rat. Vision Res. 1990, 30, 1517–1520. [Google Scholar] [CrossRef]
- Behar-Cohen, F.; Martinsons, C.; Viénot, F.; Zissis, G.; Barlier-Salsi, A.; Cesarini, J.P.; Enouf, O.; Garcia, M.; Picaud, S.; Attia, D. Light-emitting diodes (LED) for domestic lighting: Any risks for the eye? Prog. Retin. Eye Res. 2011, 30, 239–257. [Google Scholar] [CrossRef]
- Liu, X.; Zhou, Q.; Lin, H.; Wu, J.; Wu, Z.; Qu, S.; Bi, Y. The protective effects of blue light-blocking films with different shielding rates: A rat model study. Transl. Vis. Sci. Technol. 2019, 8, 19. [Google Scholar] [CrossRef] [PubMed] [Green Version]
- Thoreson, W.B.; Witkovsky, P. Glutamate receptors and circuits in the vertebrate retina. Prog. Retin. Eye Res. 1999, 18, 765–810. [Google Scholar] [CrossRef] [PubMed]
- Izumi, Y.; Shimamoto, K.; Benz, A.M.; Hammerman, S.B.; Olney, J.W.; Zorumski, C.F. Glutamate transporters and retinal excitotoxicity. Glia 2002, 39, 58–68. [Google Scholar] [CrossRef] [PubMed]
- Ishikawa, M. Abnormalities in Glutamate Metabolism and Excitotoxicity in the Retinal Diseases. Scientifica 2013, 2013, 528940. [Google Scholar] [CrossRef] [Green Version]
- Sucher, N.J.; Lipton, S.A.; Dreyer, E.B. Molecular Basis of Glutamate Toxicity Ganglion Cells in Retinal. Vision Res. 1997, 37, 3483–3493. [Google Scholar] [CrossRef] [Green Version]
- Choi, D.W.; Maulucci-Gedde, M.; Kriegstein, A.R. Glutamate neurotoxicity in cortical cell culture. J. Neurosci. 1987, 7, 357–368. [Google Scholar] [CrossRef]
- Laíns, I.; Gantner, M.; Murinello, S.; Lasky-Su, J.A.; Miller, J.W.; Friedlander, M.; Husain, D. Metabolomics in the study of retinal health and disease. Prog. Retin. Eye Res. 2018, 69, 57–79. [Google Scholar] [CrossRef]
- Faktorovich, E.G.; Steinberg, R.H.; Yasumura, D.; Matthes, M.T.; LaVail, M.M. Photoreceptor degeneration in inherited retinal dystrophy delayed by basic fibroblast growth factor. Nature 1990, 347, 83–86. [Google Scholar] [CrossRef]
- Wen, R.; Cheng, T.; Song, Y.; Matthes, M.T.; Yasumura, D.; LaVail, M.M.; Steinberg, R.H. Continuous exposure to bright light upregulates bFGF and CNTF expression in the rat retina. Curr. Eye Res. 1998, 17, 494–500. [Google Scholar] [CrossRef]
- Song, W.; Zhang, Y.; Liu, F.; Chai, Z.; Ding, F.; Qian, X.; Park, S.C. Taking advantage of multi-regions-based diagonal texture structure descriptor for image retrieval. Expert Syst. Appl. 2018, 96, 347–357. [Google Scholar] [CrossRef]
- Organisciak, D.T.; Darrow, R.M.; Barsalou, L.; Kutty, R.K.; Wiggert, B. Susceptibility to retinal light damage in transgenic rats with rhodopsin mutations. Investig. Ophthalmol. Vis. Sci. 2003, 44, 486–492. [Google Scholar] [CrossRef] [PubMed] [Green Version]
- Paul, K.N.; Saafir, T.B.; Tosini, G. The role of retinal photoreceptors in the regulation of circadian rhythms. Rev. Endocr. Metab. Disord. 2009, 10, 271–278. [Google Scholar] [CrossRef] [PubMed] [Green Version]
- Barbe, M.F.; Tytell, M.; Gower, D.J.; Welch, W.J. Hyperthermia protects against light damage in the rat retina. Science 1988, 241, 1817–1820. [Google Scholar] [CrossRef] [PubMed]
- Valderrama, C.M.; Li, R.; Liu, J.H.K. Direct effect of light on 24-h variation of aqueous humor protein concentration in Sprague-Dawley rats. Exp. Eye Res. 2008, 87, 487–491. [Google Scholar] [CrossRef] [Green Version]
- Stastna, M.; Behrens, A.; Noguera, G.; Herretes, S.; McDonnell, P.; van Eyk, J.E. Proteomics of the aqueous humor in healthy New Zealand rabbits. Proteomics 2007, 7, 4358–4375. [Google Scholar] [CrossRef]
- Lavail, M.M.; Unoki, K.; Yasumura, D.; Matthes, M.T.; Yancopoulos, G.D.; Steinberg, R.H. Multiple growth factors, cytokines, and neurotrophins rescue photoreceptors from the damaging effects of constant light (light damage/retinal degeneration/photoreceptor rescue/neurotrophic factor/basic fibroblast growth factor). Neurobiology 1992, 89, 11249–11253. [Google Scholar]
- Sparrow, J.R.; Boulton, M. RPE lipofuscin and its role in retinal pathobiology. Exp. Eye Res. 2005, 80, 595–606. [Google Scholar] [CrossRef]
- Wolf, G. Lipofuscin and macular degeneration. Nutr. Rev. 2003, 61, 342–346. [Google Scholar] [CrossRef]
- Pawlak, A.; Różanowska, M.; Zareba, M.; Lamb, L.E.; Simon, J.D.; Sarna, T. Action spectra for the photoconsumption of oxygen by human ocular lipofuscin and lipofuscin extracts. Arch. Biochem. Biophys. 2002, 403, 59–62. [Google Scholar] [CrossRef]
- Thomas, B.B.; Seiler, M.J.; Aramant, R.B.; Samant, D.; Qiu, G.; Vyas, N.; Arai, S.; Chen, Z.; Sadda, S.R. Visual Functional Effects of Constant Blue Light in a Retinal Degenerate Rat Model. Photochem. Photobiol. 2007, 83, 759–765. [Google Scholar] [CrossRef] [Green Version]
- Delori, F.C.; Goger, D.G.; Dorey, C.K. Age-related accumulation and spatial distribution of lipofuscin in RPE of normal subjects. Investig. Ophthalmol. Vis. Sci. 2001, 42, 1855–1866. [Google Scholar]
- Taylor, H.R.; West, S.; Muñoz, B.; Rosenthal, F.S.; Bressler, S.B.; Bressler, N.M. The Long-term Effects of Visible Light on the Eye. Arch. Ophthalmol. 1992, 110, 99–104. [Google Scholar] [CrossRef] [PubMed]
- Narimatsu, T.; Negishi, K.; Miyake, S.; Hirasawa, M.; Osada, H.; Kurihara, T.; Tsubota, K.; Ozawa, Y. Blue light-induced inflammatory marker expression in the retinal pigment epithelium-choroid of mice and the protective effect of a yellow intraocular lens material in vivo. Exp. Eye Res. 2015, 132, 48–51. [Google Scholar] [CrossRef] [PubMed]


| S.No | Mass | Metabolites | p-Value-ANOVA | Tukey HSD Post-Hoc Analysis | |||||
|---|---|---|---|---|---|---|---|---|---|
| NC-BLE | BLE-WLE | BLE-YLE | NC-WLE | NC-YLE | WLE-YLE | ||||
| 1 | 89.0932 | D-Alanine | 0.013 | 0.02 | 1 | 0.753 | 0.021 | 0.146 | 0.773 |
| 2 | 105.0926 | D-Serin | 0.009 | 0.091 | 0.016 | 0.014 | 0.84 | 0.811 | 1 |
| 3 | 119.1192 | L-Threonine | <0.001 | 0.002 | 0.503 | 0.629 | <0.001 | <0.001 | 0.997 |
| 4 | 125.147 | Taurine | 0.006 | 0.861 | 0.006 | 0.16 | 0.032 | 0.509 | 0.401 |
| 5 | 128.172 | Lysine | 0.001 | 0.014 | 0.733 | 0.89 | 0.001 | 0.003 | 0.989 |
| 6 | 132.1577 | L-Asparagine | 0.011 | 0.051 | 0.987 | 0.943 | 0.025 | 0.016 | 0.996 |
| 7 | 133.1027 | D-Aspartic acid | 0.012 | 0.122 | 0.975 | 0.021 | 0.25 | 0.818 | 0.05 |
| 8 | 147.13 | L-Glutamic acid | <0.001 | <0.001 | 0.509 | 0.857 | 0.009 | 0.002 | 0.926 |
| 9 | 153.1784 | Dopamine | 0.009 | 0.091 | 0.016 | 0.014 | 0.84 | 0.811 | 1 |
| 10 | 175.188 | Citrulline | <0.001 | <0.001 | 0.734 | 0.995 | 0.002 | <0.001 | 0.596 |
| 11 | 219.237 | Pantothenate | 0.017 | 0.096 | 0.92 | 0.94 | 0.026 | 0.03 | 1 |
| 12 | 228.245 | Hydroxyprolyl-Proline | 0.004 | 0.053 | 0.619 | 0.975 | 0.004 | 0.022 | 0.851 |
| 13 | 231.249 | L-Asparaginyl-L-Valine | 0.004 | 0.979 | 0.994 | 0.02 | 0.999 | 0.008 | 0.012 |
| 14 | 231.296 | α-(γ-Aminobutyryl)-Lysine | 0.02 | 0.338 | 0.414 | 0.778 | 0.017 | 0.064 | 0.923 |
| 15 | 284.272 | L-Glutamyl-L-Histidine | 0.038 | 0.22 | 0.849 | 0.46 | 0.049 | 0.956 | 0.131 |
| 16 | 307.32 | Glutathione | 0.012 | 1 | 0.019 | 0.743 | 0.02 | 0.757 | 0.144 |
| 17 | 317.3398 | L-Hydroxyprolyl-L-Tryptophan | <0.001 | 0.002 | 0.965 | 0.999 | 0.001 | 0.001 | 0.989 |
| 18 | 364.5619 | 2-Arachidonylglycerol | 0.041 | 0.067 | 0.999 | 0.87 | 0.05 | 0.263 | 0.802 |
| 19 | 420.0956 | Inositol 1,4,5-Trisphosphate | 0.029 | 0.176 | 0.826 | 0.935 | 0.033 | 0.059 | 0.993 |
| 20 | 579.7895 | Lysophosphatidylcholine | 0.011 | 0.819 | 0.01 | 0.139 | 0.066 | 0.514 | 0.598 |
Disclaimer/Publisher’s Note: The statements, opinions and data contained in all publications are solely those of the individual author(s) and contributor(s) and not of MDPI and/or the editor(s). MDPI and/or the editor(s) disclaim responsibility for any injury to people or property resulting from any ideas, methods, instructions or products referred to in the content. |
© 2023 by the authors. Licensee MDPI, Basel, Switzerland. This article is an open access article distributed under the terms and conditions of the Creative Commons Attribution (CC BY) license (https://creativecommons.org/licenses/by/4.0/).
Share and Cite
Theruveethi, N.; Joshi, M.B.; Jathanna, J.S.; Valiathan, M.; Kabekkodu, S.P.; Bhandarkar, M.; Thomas, R.H.; Thangarajan, R.; Bhat, S.S.; Surendran, S. Effect of Light Emitting Diodes (LED) Exposure on Vitreous Metabolites-Rodent Study. Metabolites 2023, 13, 81. https://doi.org/10.3390/metabo13010081
Theruveethi N, Joshi MB, Jathanna JS, Valiathan M, Kabekkodu SP, Bhandarkar M, Thomas RH, Thangarajan R, Bhat SS, Surendran S. Effect of Light Emitting Diodes (LED) Exposure on Vitreous Metabolites-Rodent Study. Metabolites. 2023; 13(1):81. https://doi.org/10.3390/metabo13010081
Chicago/Turabian StyleTheruveethi, Nagarajan, Manjunath B. Joshi, Judith S. Jathanna, Manna Valiathan, Shama Prasada Kabekkodu, Manasa Bhandarkar, R. Huban Thomas, Rajesh Thangarajan, Shailaja S. Bhat, and Sudarshan Surendran. 2023. "Effect of Light Emitting Diodes (LED) Exposure on Vitreous Metabolites-Rodent Study" Metabolites 13, no. 1: 81. https://doi.org/10.3390/metabo13010081