Running on Empty: A Metabolomics Approach to Investigating Changing Energy Metabolism during Fasted Exercise and Rest

 , ,
, ,
Abstract
:1. Introduction
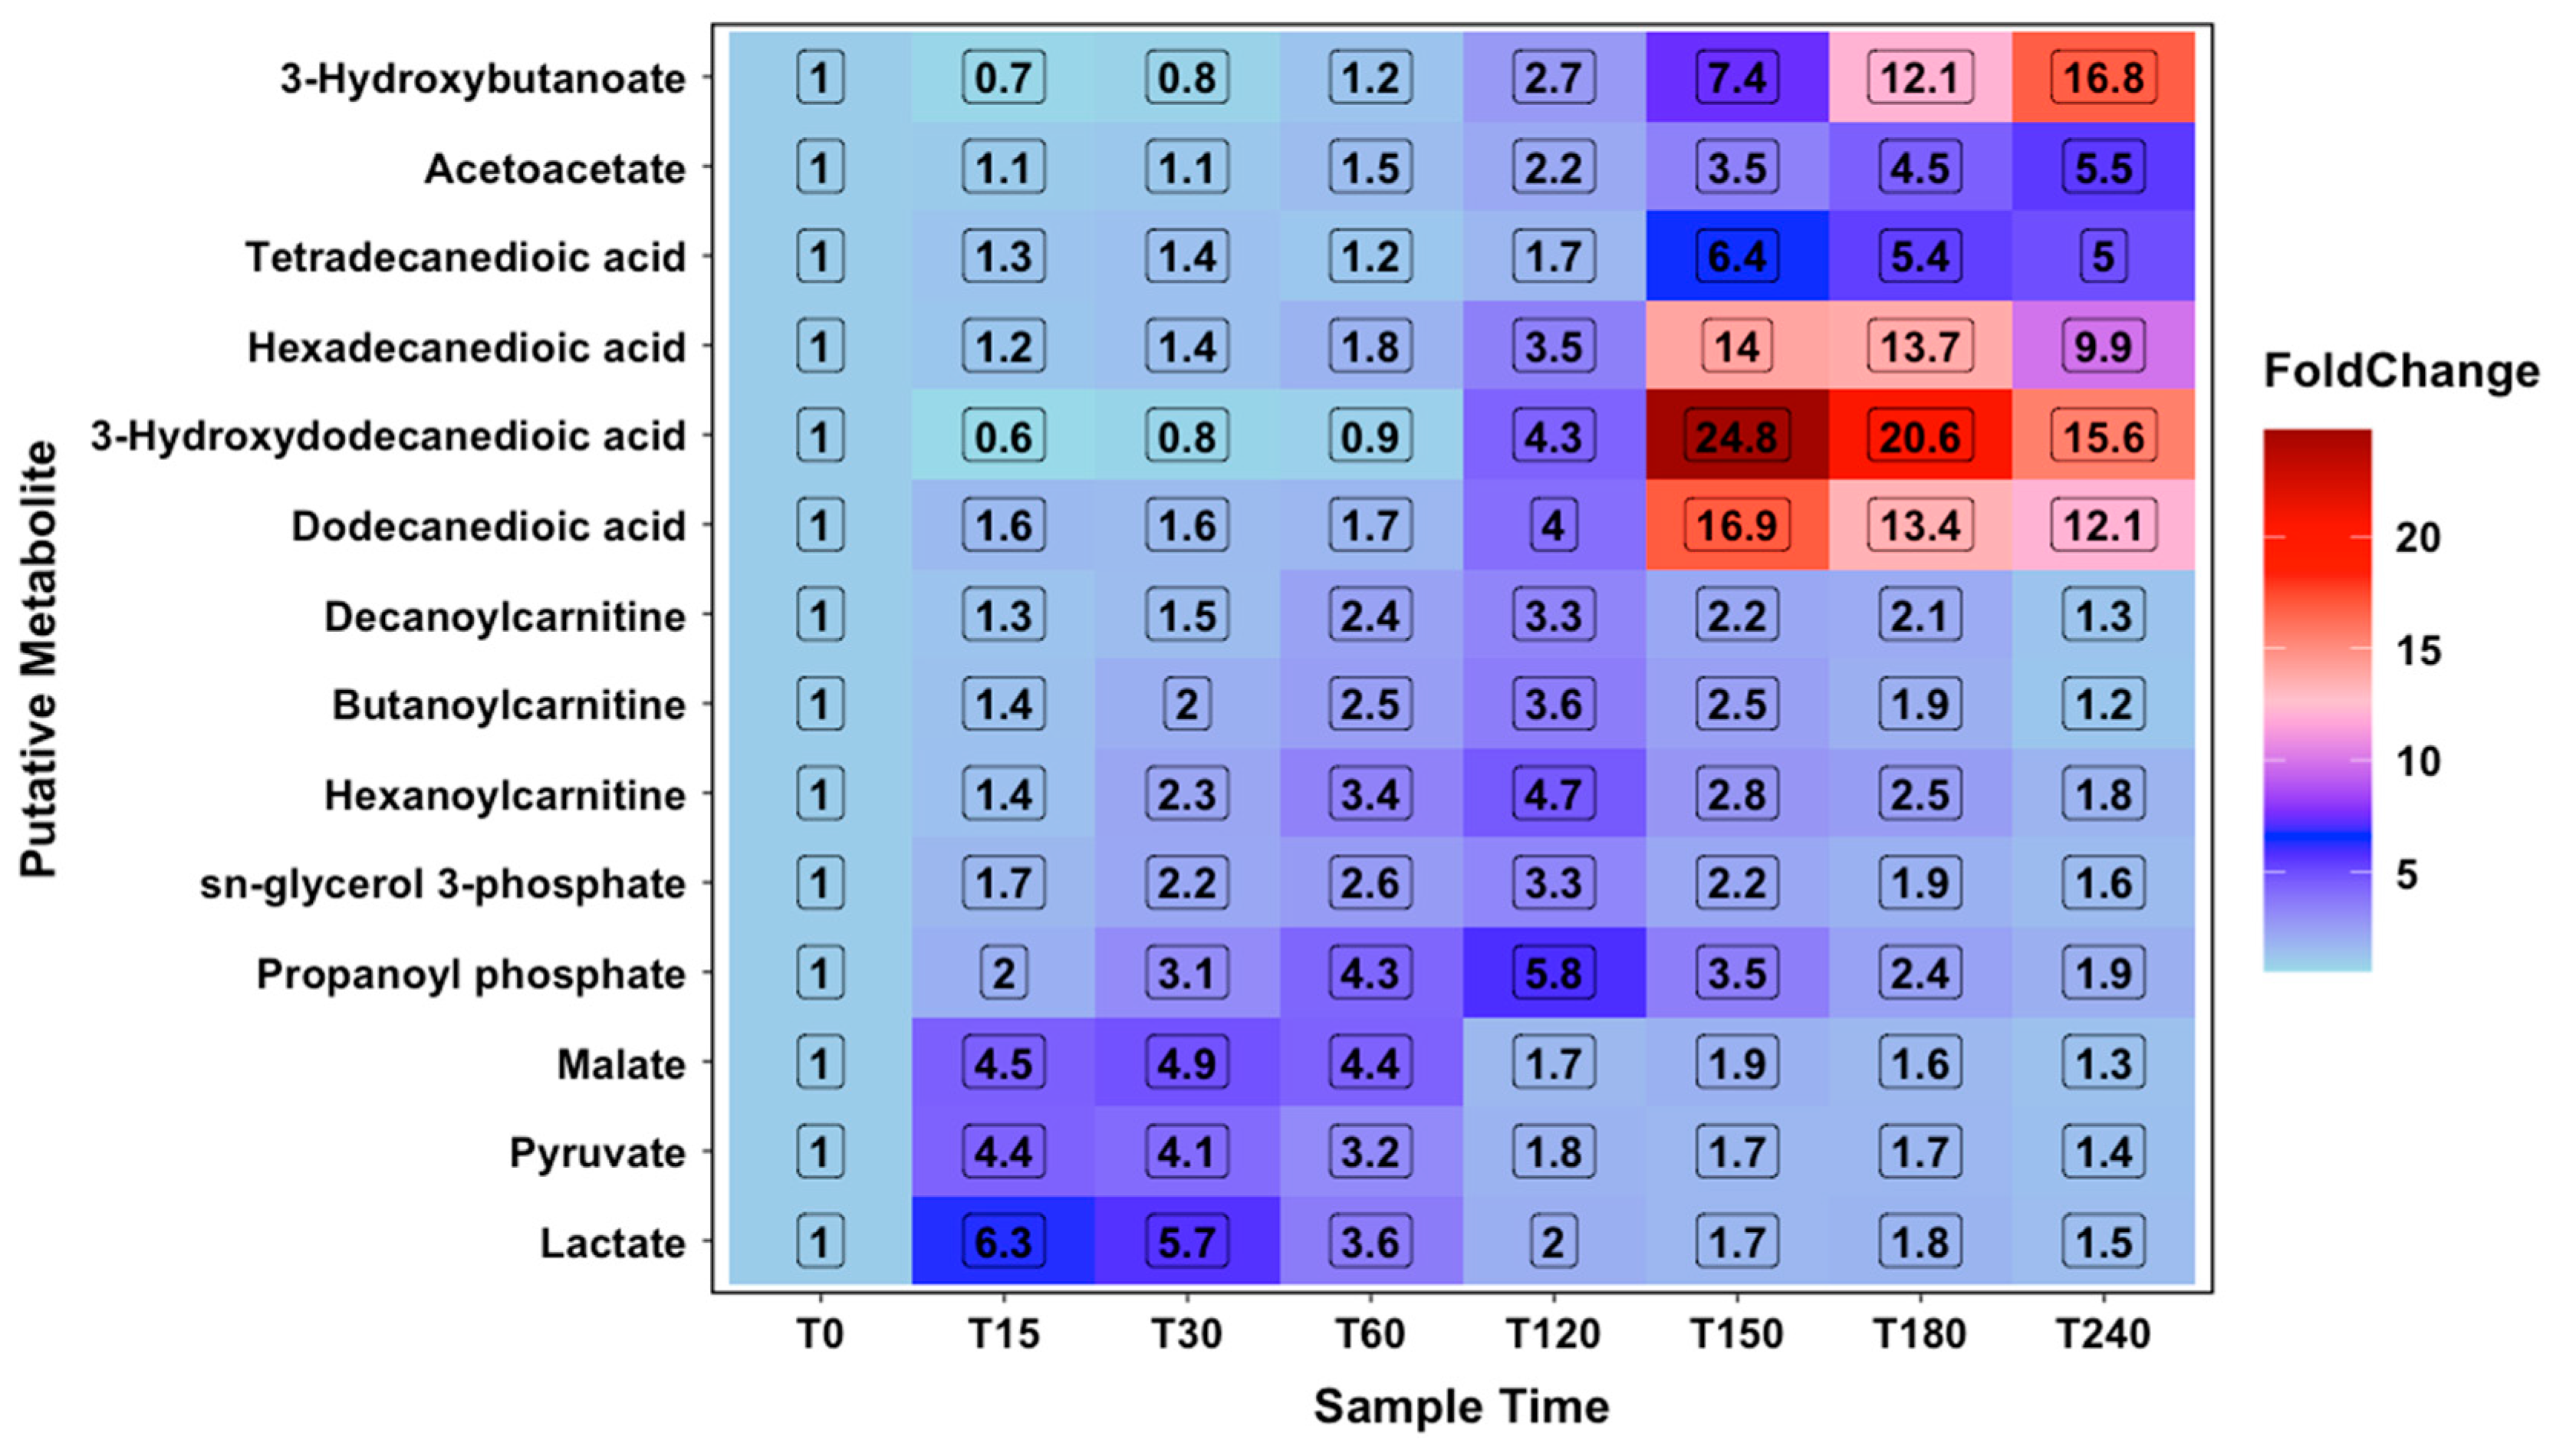
2. Results
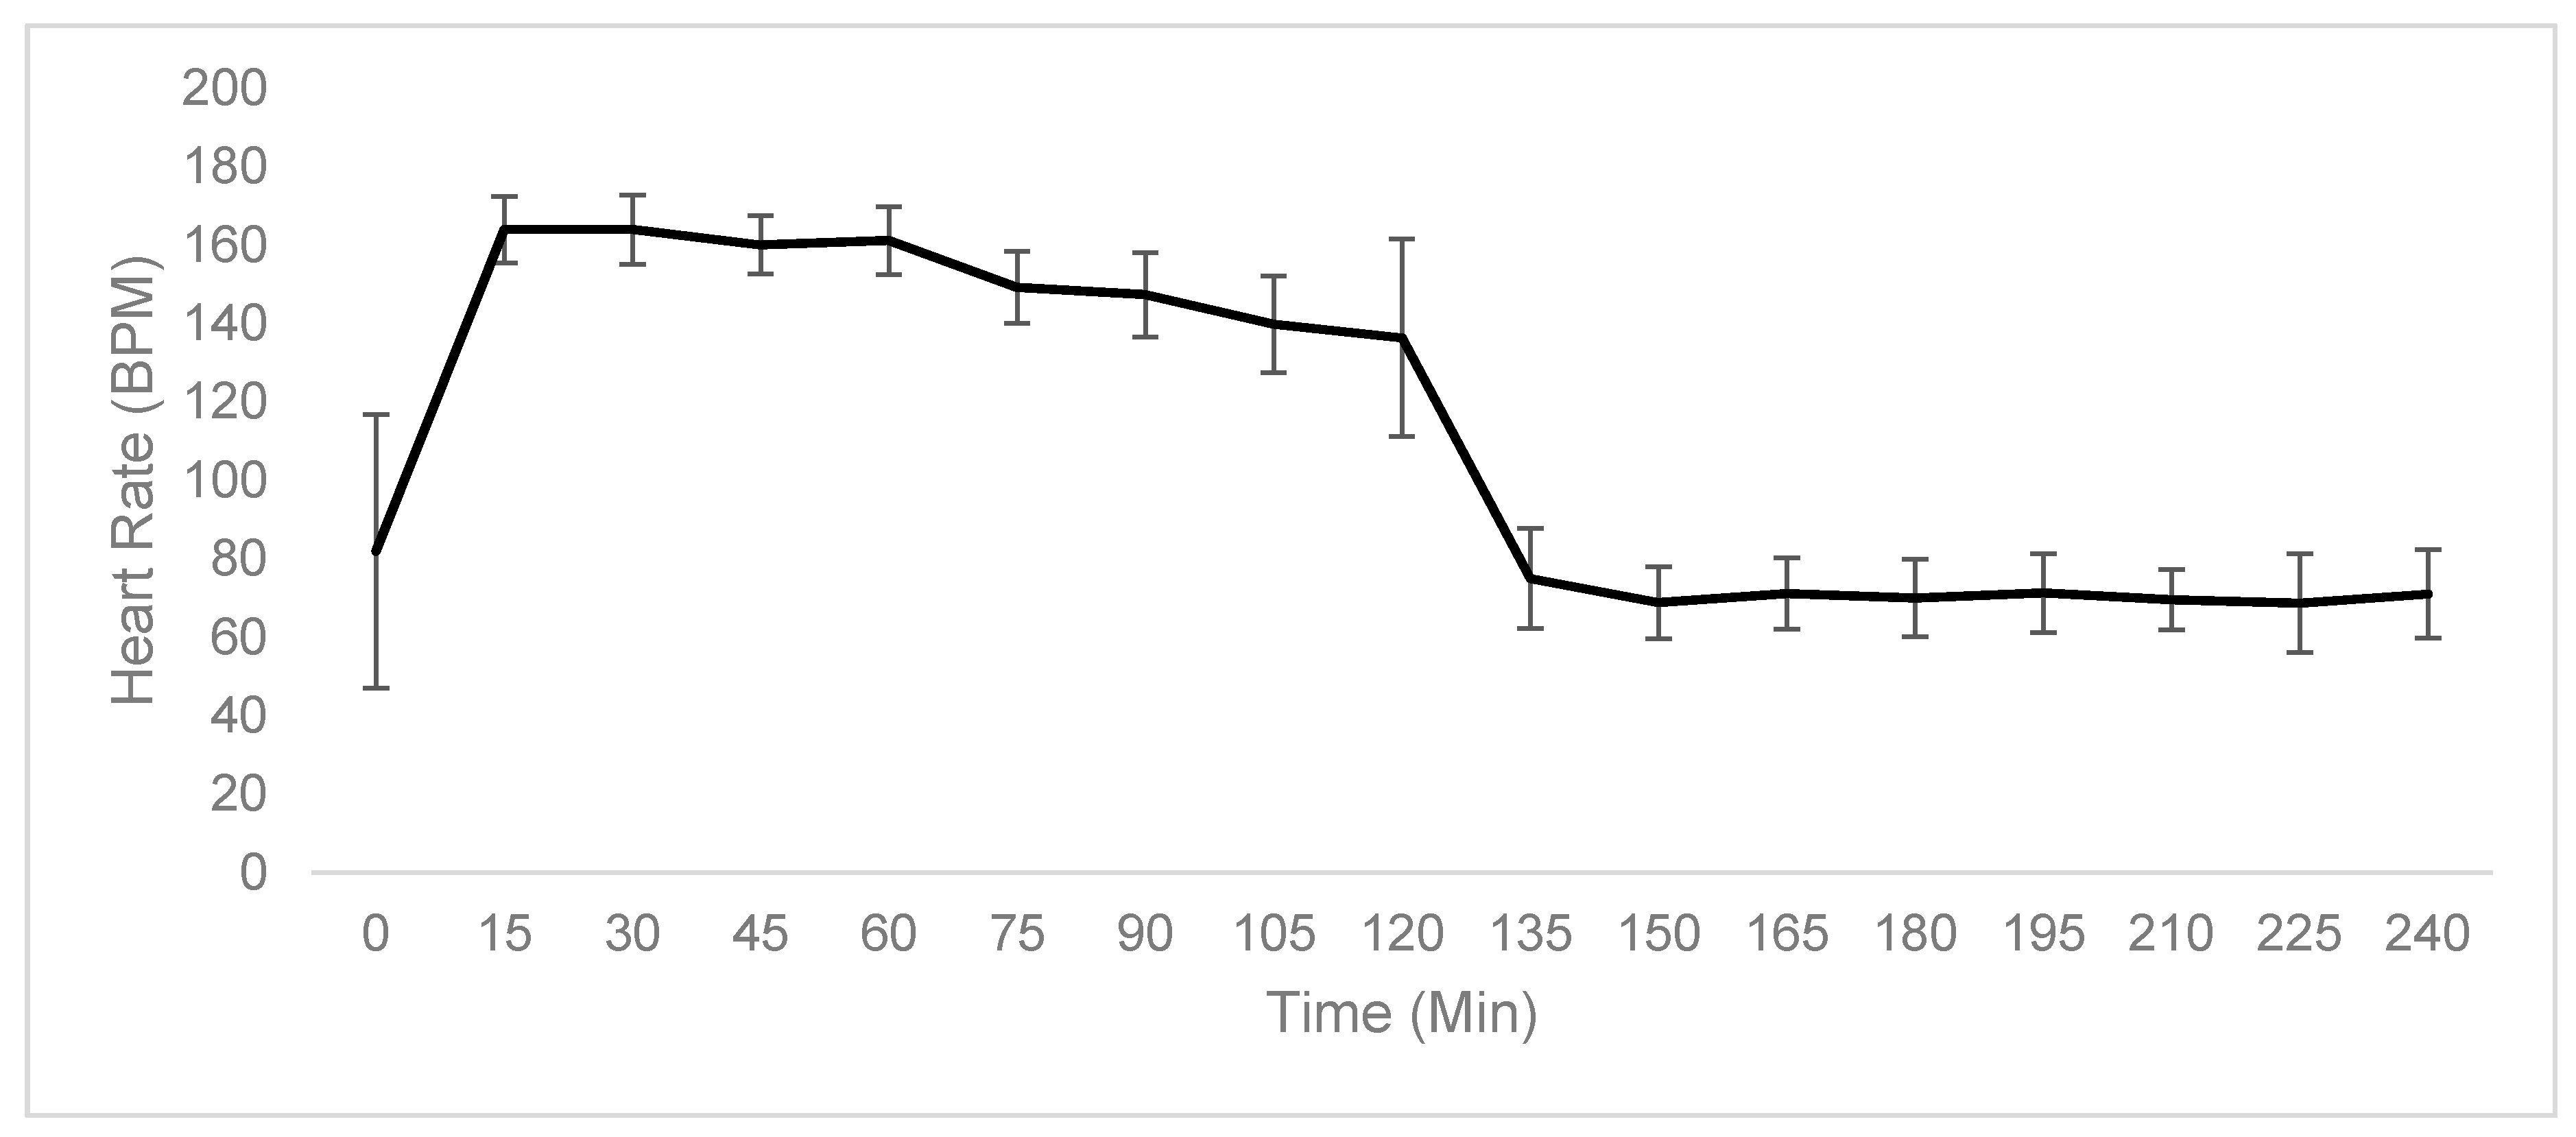
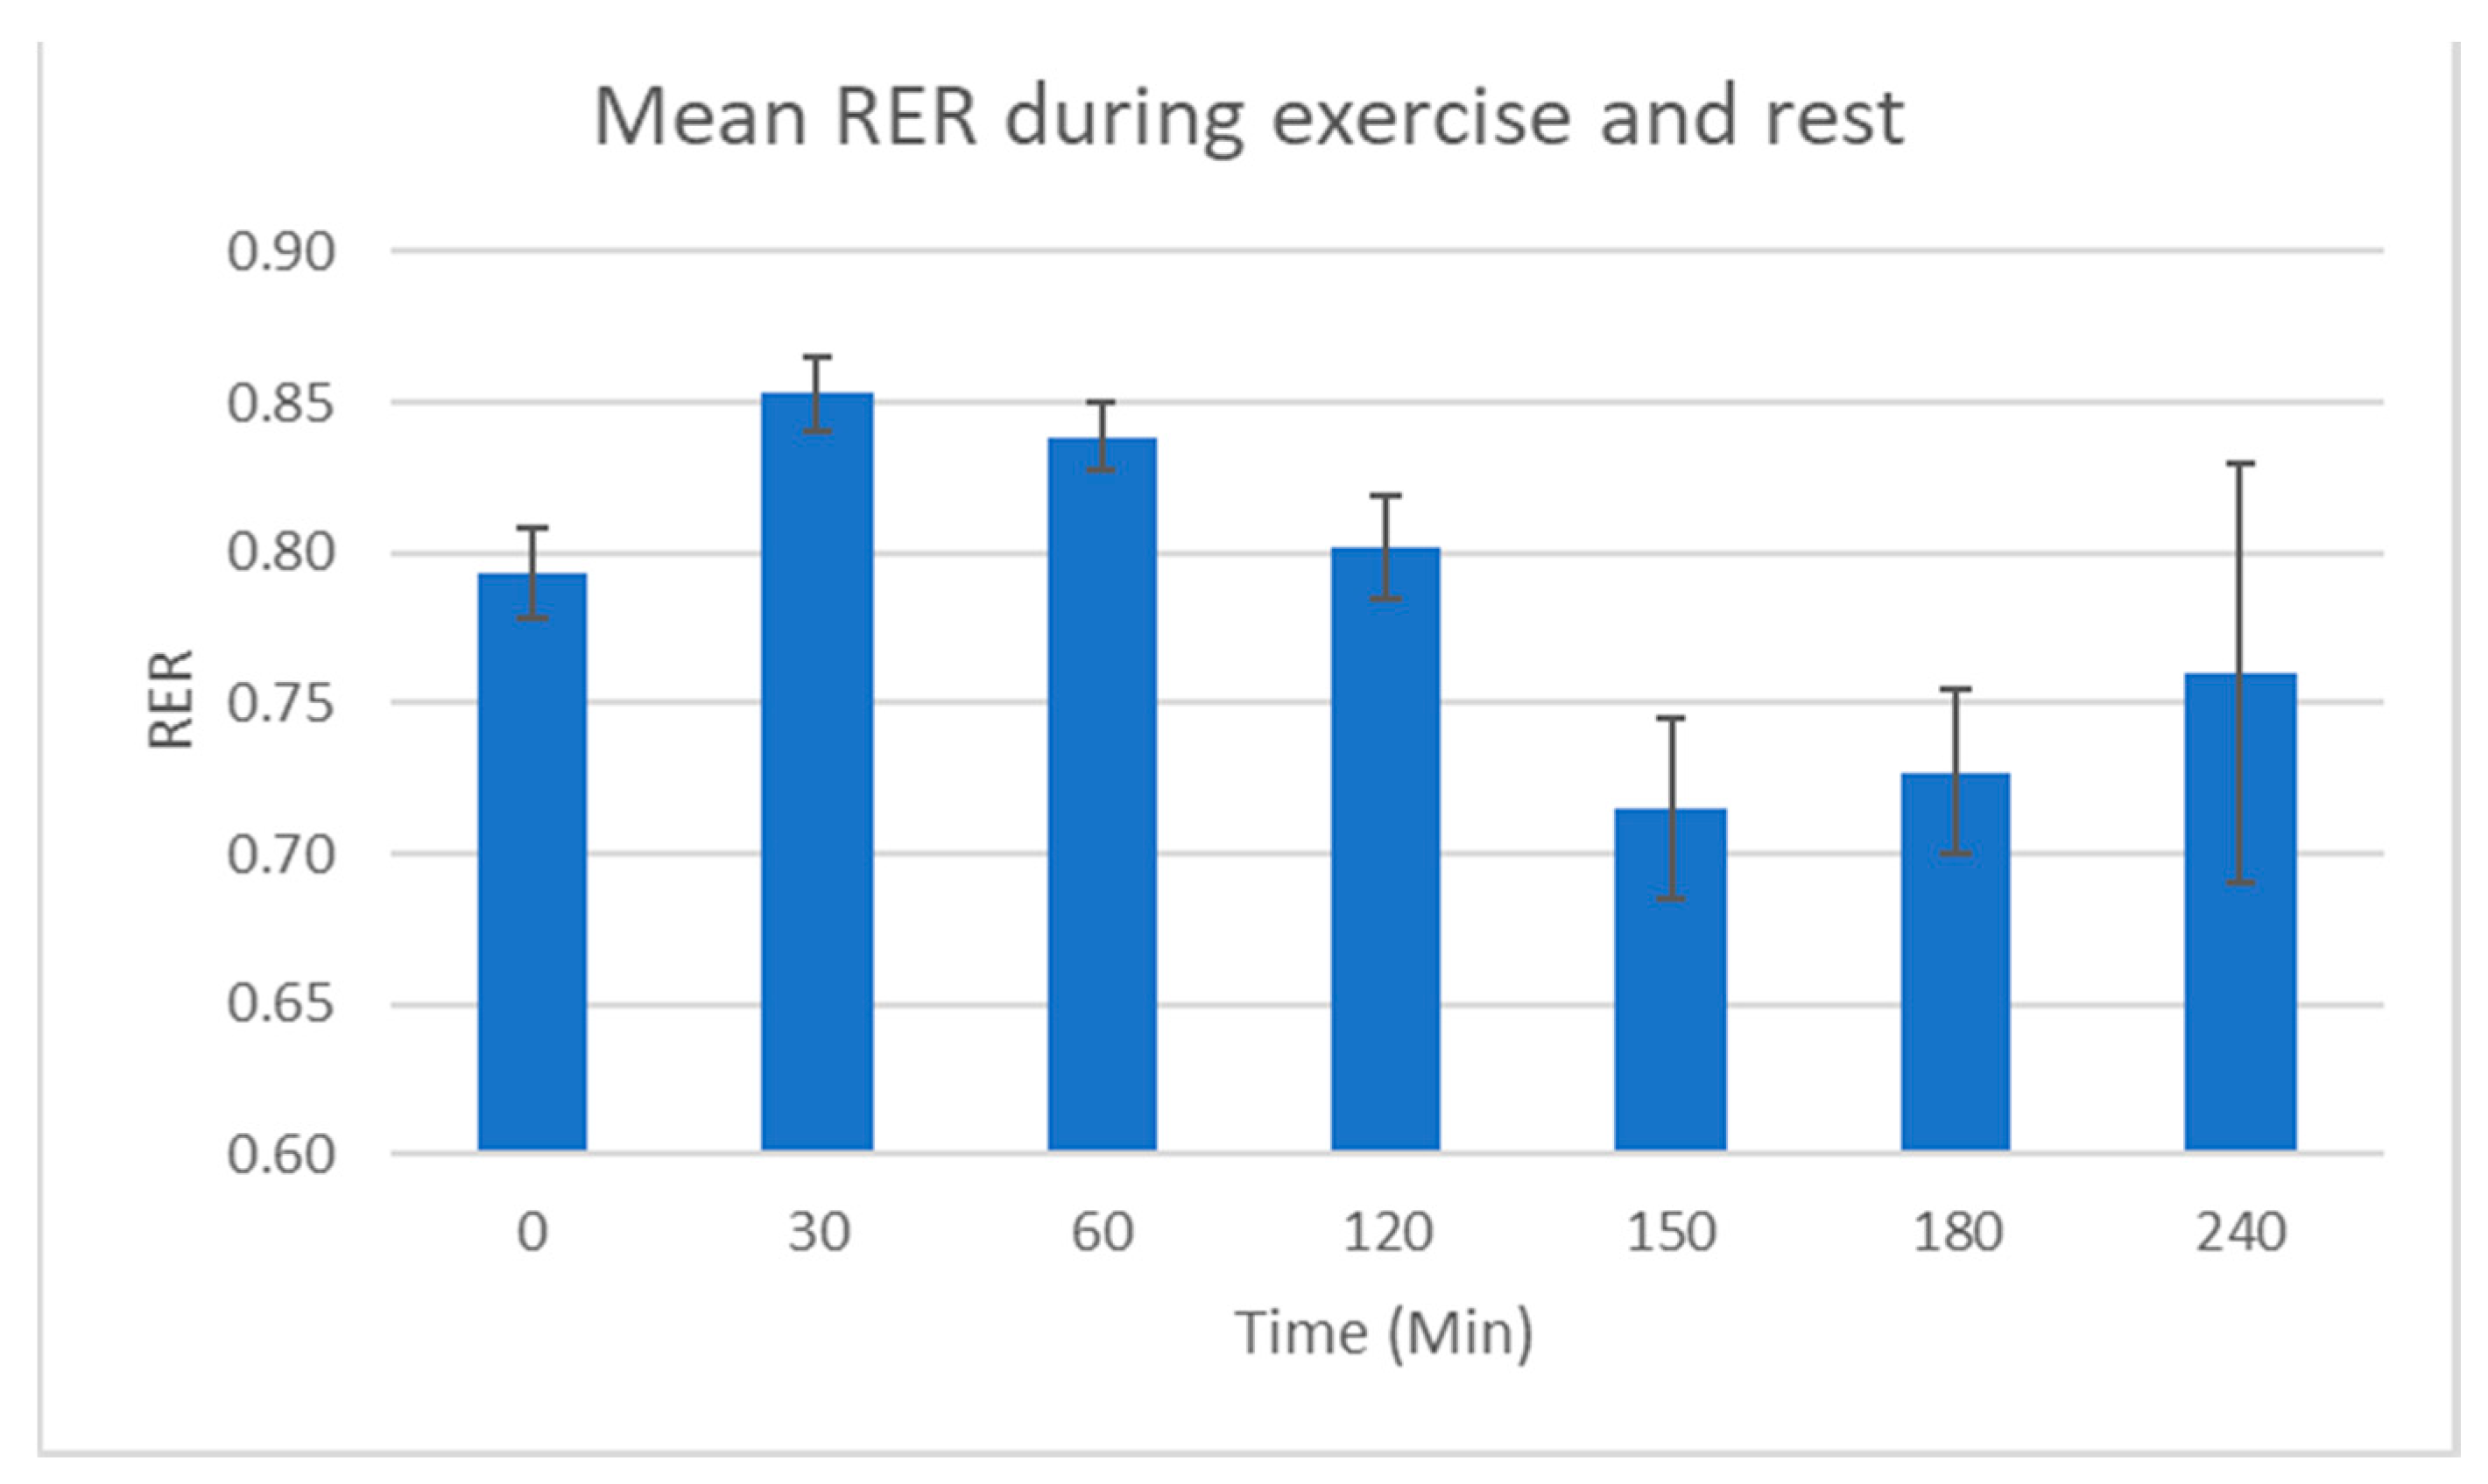
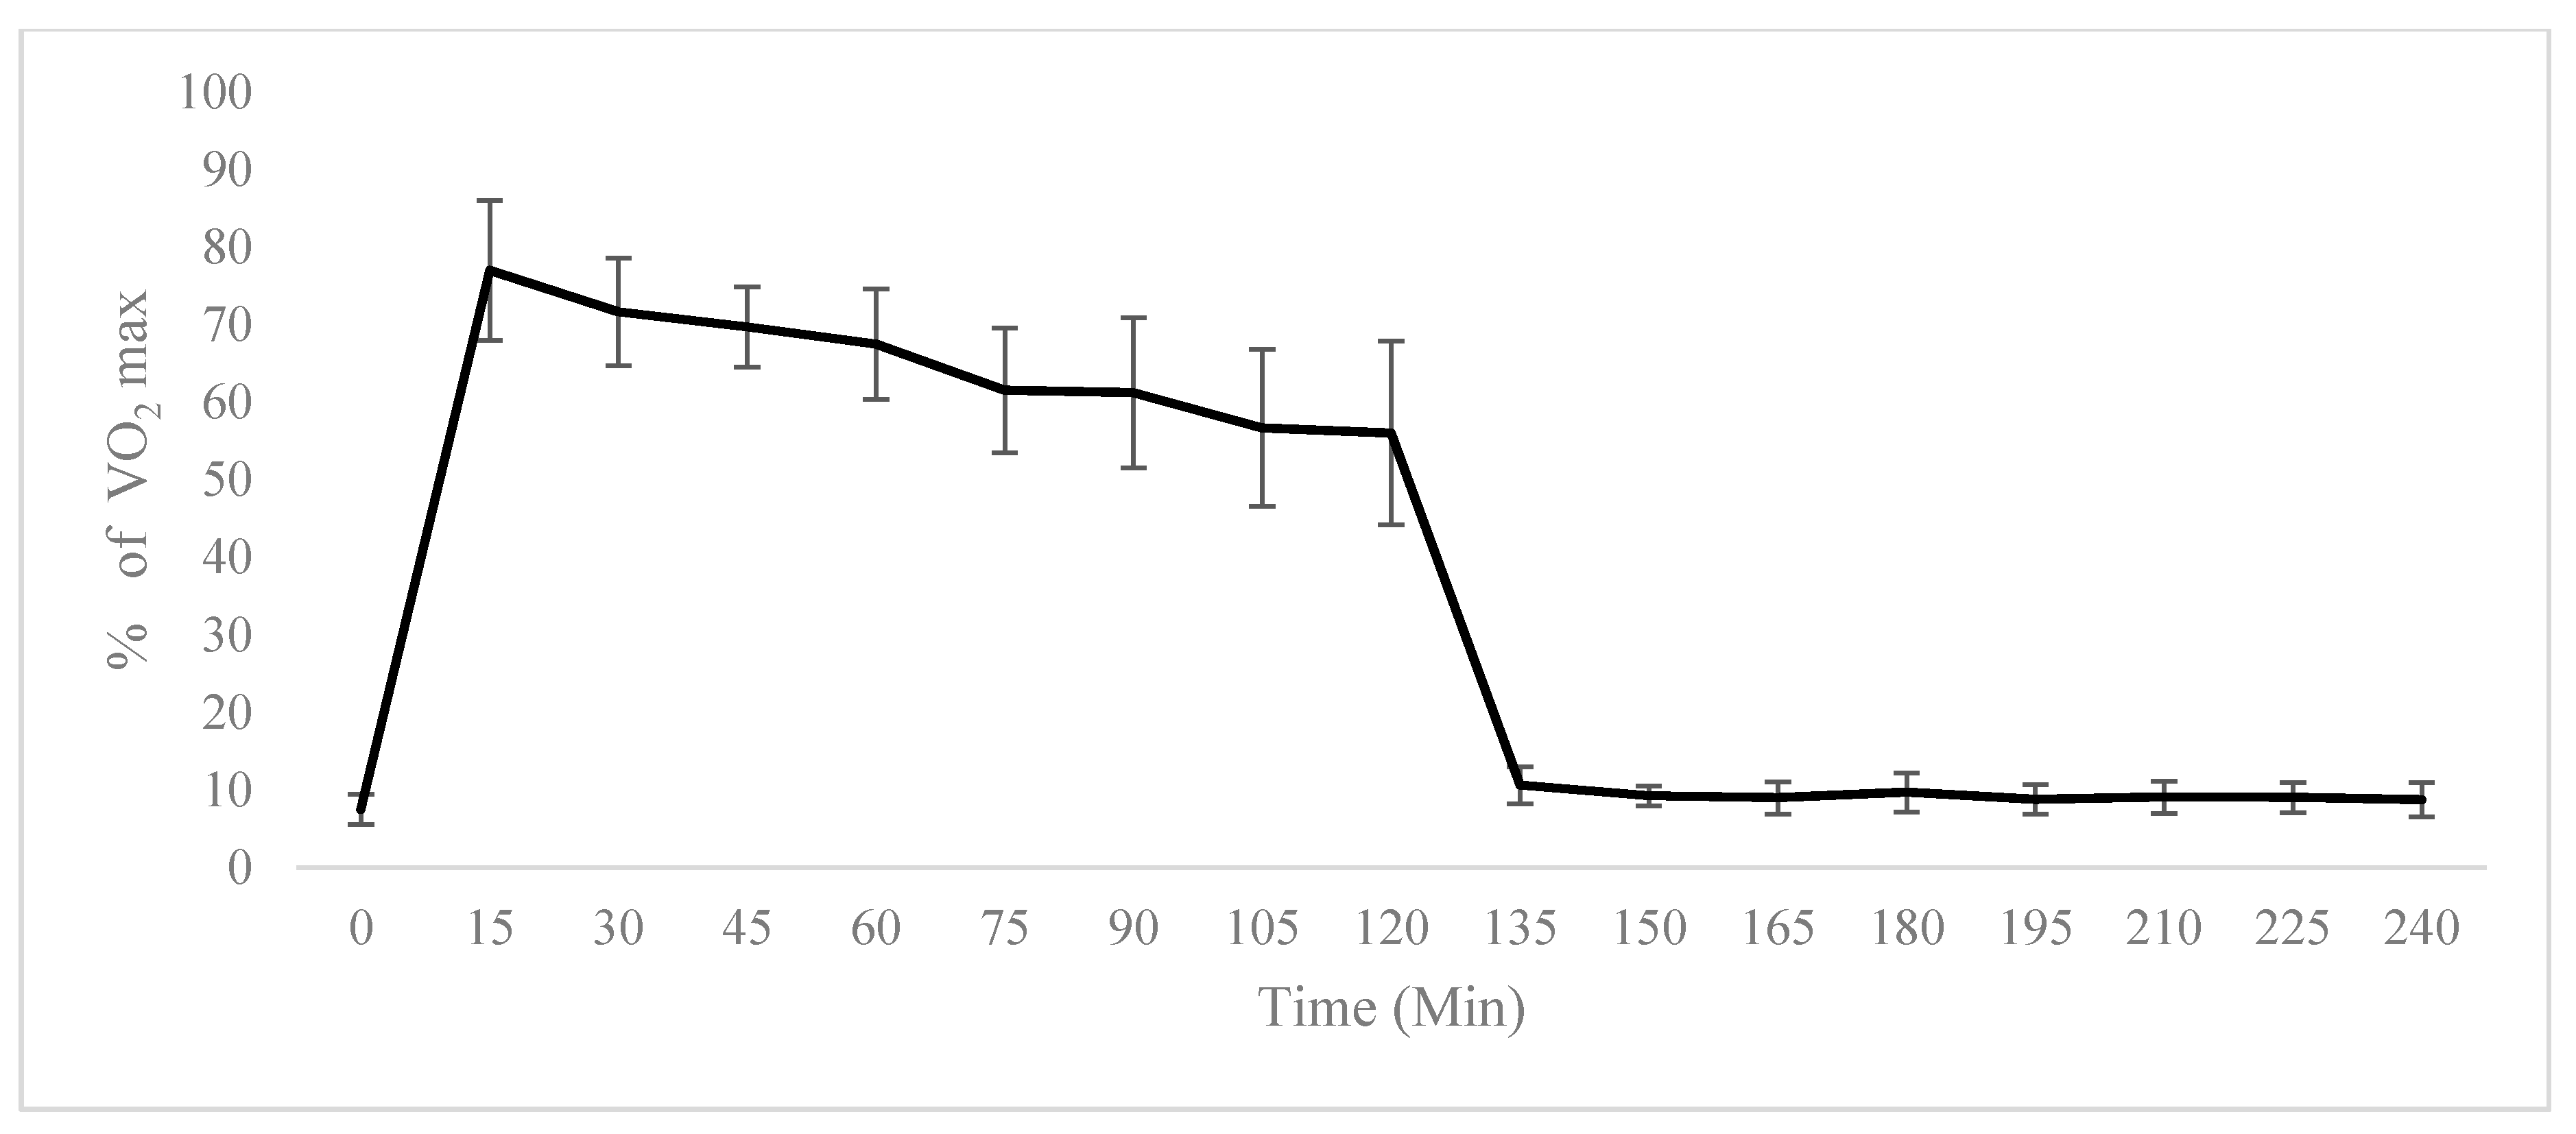
2.1. Physiological Testing
2.2. Metabolomic Analysis
2.3. Constant Load Phase
2.4. Time Trial Phase
2.5. Recovery Phase
2.6. Amino Acid Energy Metabolism
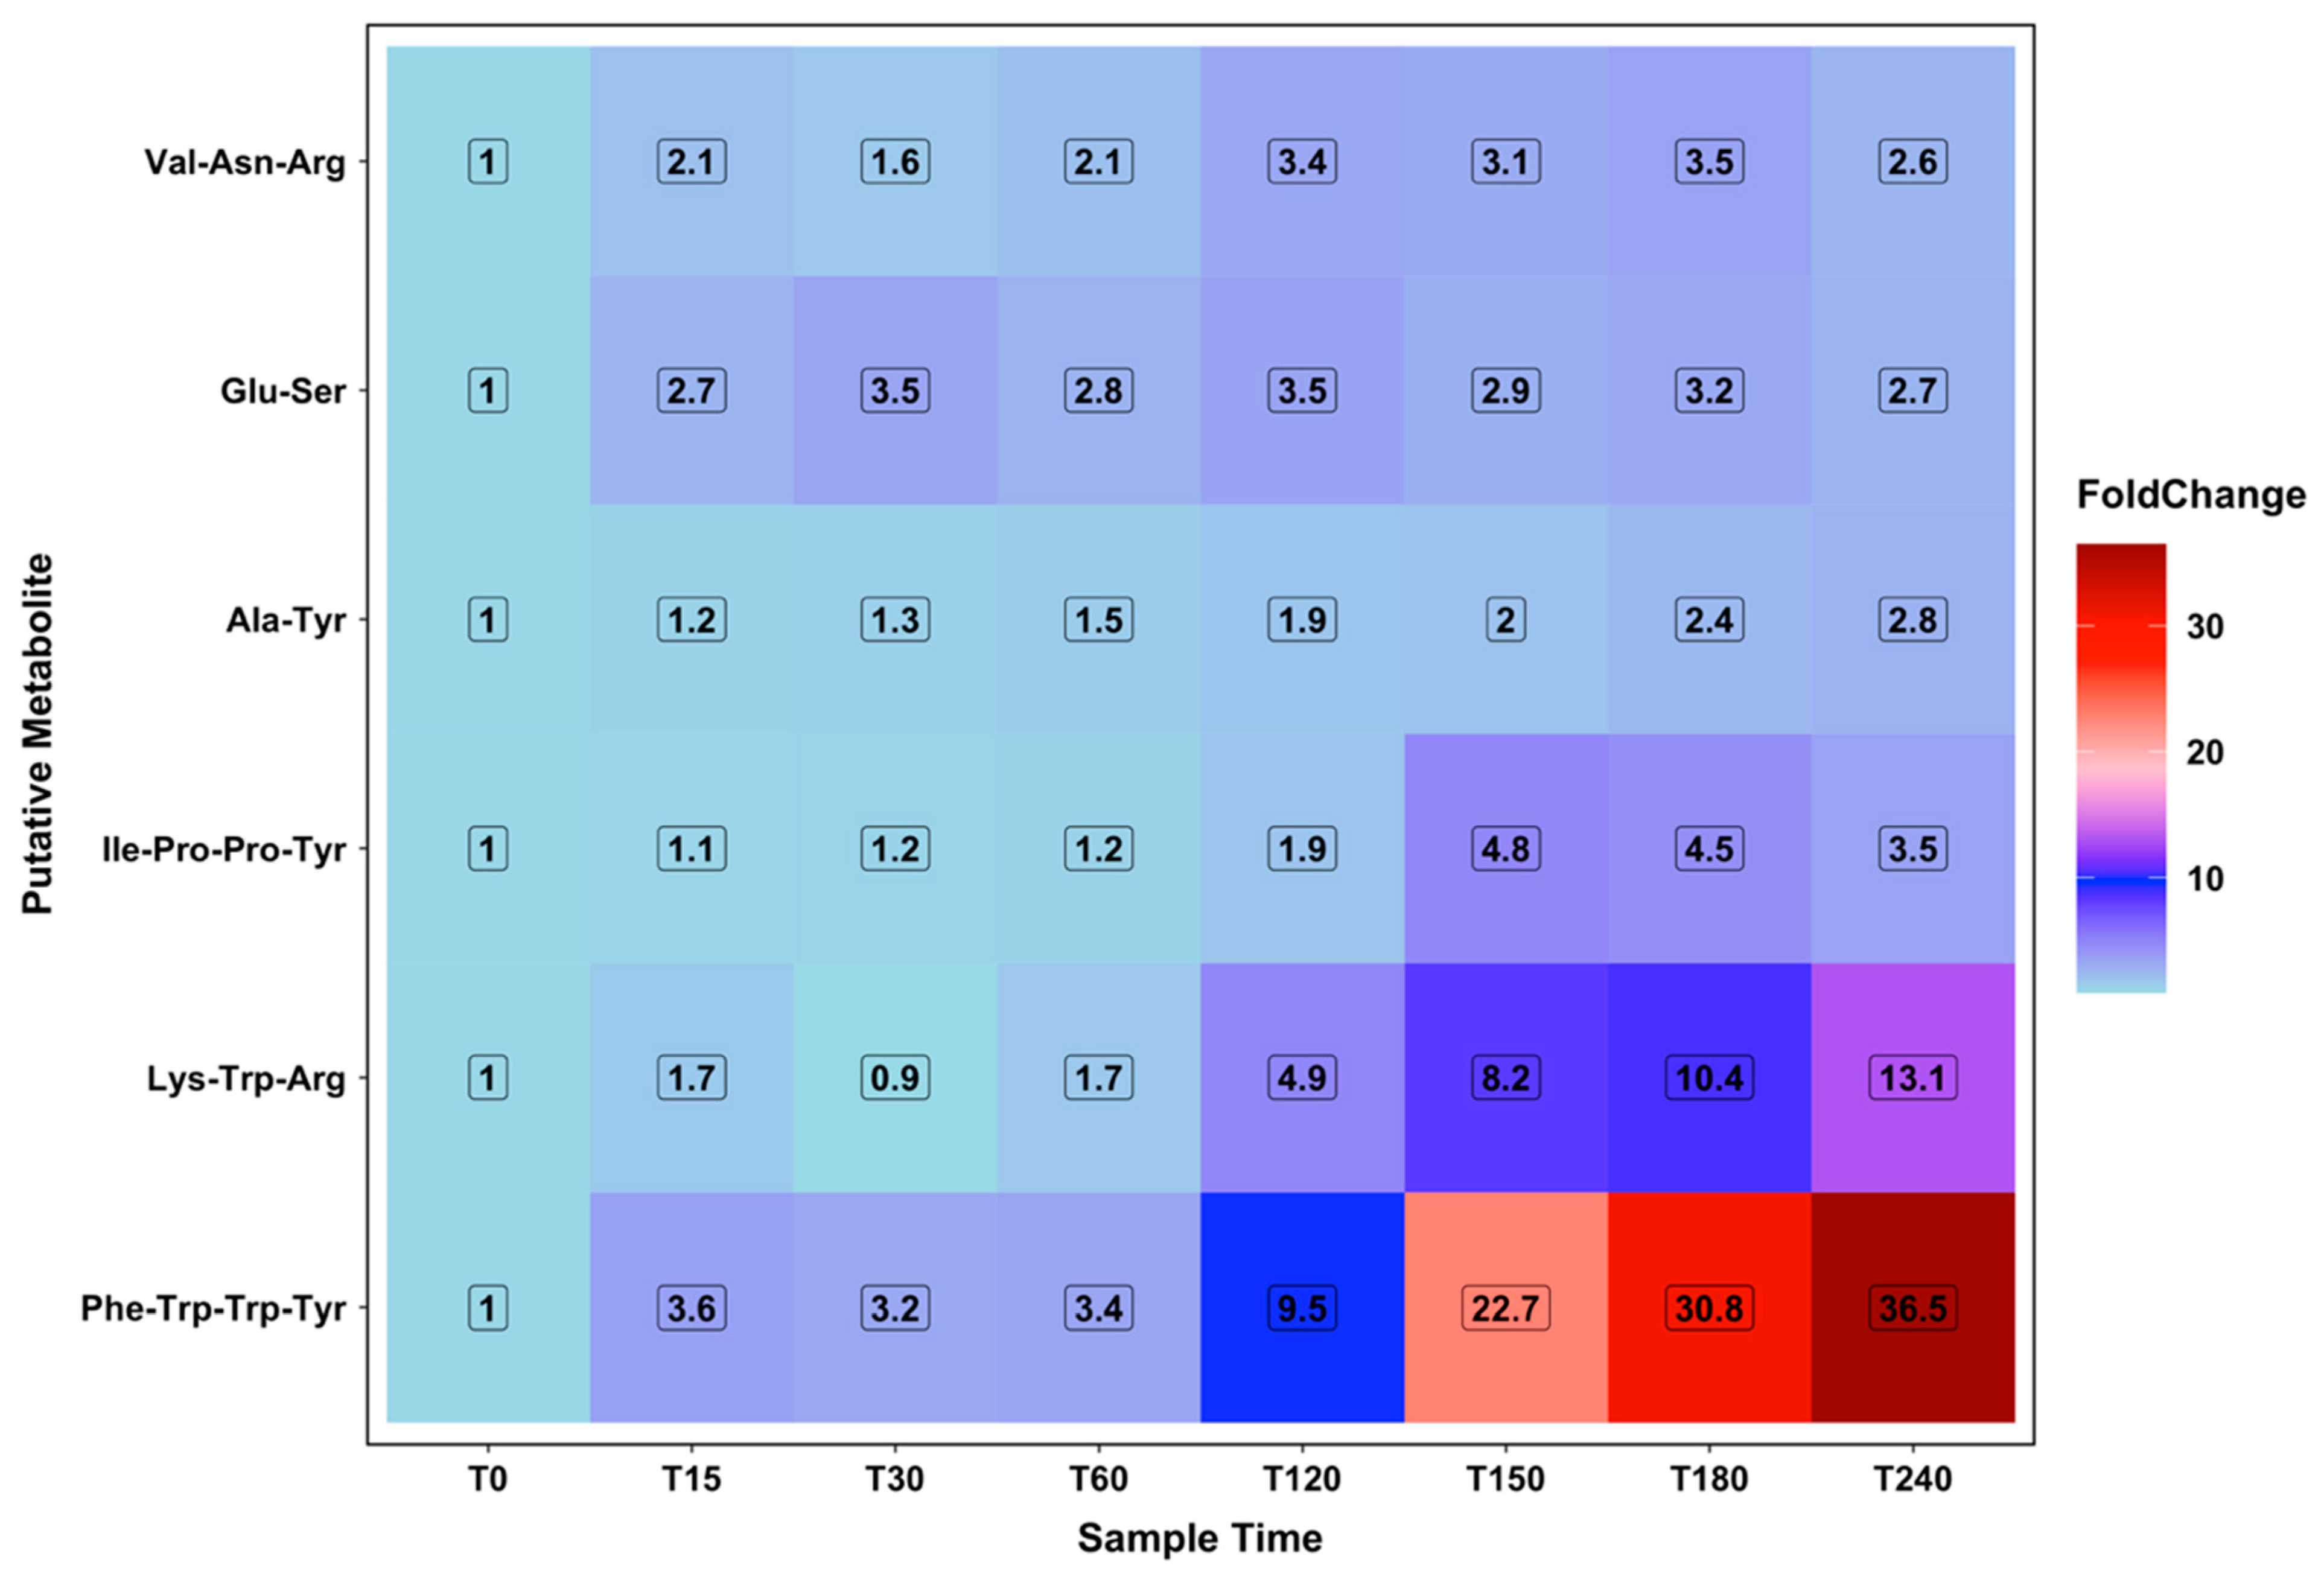
2.7. Novel Peptides Changing with Increasing Ketolytic Metabolites
3. Discussion
4. Materials and Methods
4.1. Subject Recruitment and Selection Criteria
4.2. VO2 Max Determination Protocol
4.3. Fasted Constant Load Session Phase
4.4. Fasted Rest Phase
4.5. Metabolomic Analysis
5. Conclusions
Supplementary Materials
Author Contributions
Funding
Acknowledgments
Conflicts of Interest
References
- Egan, B.; Hawley, J.A.; Zierath, J.R. SnapShot: Exercise Metabolism. Cell Metabolism. Cell Press 2016, 24, 342. [Google Scholar]
- Lewis, G.D.; Farrell, L.; Wood, M.J.; Martinovic, M.; Arany, Z.; Rowe, G.C.; Souza, A.; Cheng, S.; McCabe, E.L.; Yang, E.; et al. Metabolic signatures of exercise in human plasma. Sci. Transl. Med. 2010, 2, 33ra37. [Google Scholar] [CrossRef] [PubMed] [Green Version]
- Van Hall, G.; Jensen-Urstad, M.; Rosdahl, H.; Holmberg, H.C.; Saltin, B.; Calbet, J.A.L. Leg and arm lactate and substrate kinetics during exercise. Am. J. Physiol. Endocrinol. Metab. 2003, 284, E193–E205. [Google Scholar] [CrossRef] [PubMed]
- Gibala, M.J.; MacLean, D.A.; Graham, T.E.; Saltin, B. Tricarboxylic acid cycle intermediate pool size and estimated cycle flux in human muscle during exercise. Am. J. Physiol. 1998, 275, E235–E242. [Google Scholar] [CrossRef] [PubMed]
- Heaney, L.M.; Deighton, K.; Suzuki, T. Non-targeted metabolomics in sport and exercise science. J. Sports Sci. 2019, 37, 959–967. [Google Scholar] [CrossRef] [PubMed]
- Nieman, D.C.; Shanely, R.A.; Luo, B.; Meaney, M.P.; Dew, D.A.; Pappan, K.L. Metabolomics approach to assessing plasma 13-and 9-hydroxy-octadecadienoic acid and linoleic acid metabolite responses to 75-km cycling. Am. J. Physiol. Regul. Integr. Comp. Physiol. 2014, 307, R68–R74. [Google Scholar] [CrossRef] [PubMed] [Green Version]
- Nieman, D.C.; Shanely, R.A.; Gillitt, N.D.; Pappan, K.L.; Lila, M.A. Serum Metabolic Signatures Induced by a Three-Day Intensified Exercise Period Persist After 14 h of Recovery in Runners. J. Proteome Res. 2013, 12, 4577–4584. [Google Scholar] [CrossRef] [PubMed]
- Krug, S.; Kastenmüller, G.; Stückler, F.; Rist, M.J.; Skurk, T.; Sailer, M.; Johannes Raffler, W.; Römisch-Margl, J.; Adamski, C.; Prehn, T.; et al. The dynamic range of the human metabolome revealed by challenges. FASEB J. 2012, 26, 2607–2619. [Google Scholar] [CrossRef] [PubMed]
- Malkar, A.; Devenport, N.A.; Martin, H.J.; Patel, P.; Turner, M.A.; Watson, P.; Maughan, R.J.; Reid, H.J.; Sharp, B.L.; Thomas, C.L.P.; et al. Metabolic profiling of human saliva before and after induced physiological stress by ultra-high performance liquid chromatography–ion mobility–mass spectrometry. Metabolomics 2013, 9, 1192–1201. [Google Scholar] [CrossRef] [Green Version]
- Scott, S.N.; Cocks, M.; Andrews, R.C.; Narendran, P.; Purewal, T.S.; Cuthbertson, D.J.; Wagenmakers, A.J.M.; Shepherd, S.O. Fasted High-Intensity Interval and Moderate-Intensity Exercise Do Not Lead to Detrimental 24-Hour Blood Glucose Profiles. J. Clin. Endocrinol. Metab. 2019, 104, 111–117. [Google Scholar] [CrossRef] [PubMed]
- Creek, D.J.; Jankevics, A.; Breitling, R.; Watson, D.G.; Barrett, M.P.; Burgess, K.E.V. Toward Global Metabolomics Analysis with Hydrophilic Interaction Liquid Chromatography–Mass Spectrometry: Improved Metabolite Identification by Retention Time Prediction. Anal. Chem. 2011, 83, 8703–8710. [Google Scholar] [CrossRef] [PubMed] [Green Version]
- Sumner, L.W.; Amberg, A.; Barrett, D.; Beale, M.H.; Beger, R.; Daykin, C.A.; Fan, T.W.-M.; Fiehn, O.; Goodacre, R.; Griffin, J.L.; et al. Proposed minimum reporting standards for chemical analysis: Chemical Analysis Working Group (CAWG) Metabolomics Standards Initiative (MSI). Metabolomics 2007, 3, 211–221. [Google Scholar] [CrossRef] [PubMed] [Green Version]
- Lemon, P.W.R.; Nagle, F.J. Effects of exercise on protein and amino acid metabolism. Med. Sci. Sports Exerc. 1981, 13, 141–149. [Google Scholar] [CrossRef]
- Wagenmakers, A.J.; Brookes, J.H.; Coakley, J.H.; Reilly, T.; Edwards, R.H. Exercise-induced activation of the branched-chain 2-oxo acid dehydrogenase in human muscle. Eur. J. Appl. Physiol. Occup. Physiol. 1989, 59, 159–167. [Google Scholar] [CrossRef] [PubMed]
- Pirnay, F.; Lacroix, M.; Mosora, F.; Luyckx, A.; Lefebvre, P. Effect of glucose ingestion on energy substrate utilization during prolonged muscular exercise. Eur. J. Appl. Physiol. Occup. Physiol. 1977, 36, 247–254. [Google Scholar] [CrossRef] [PubMed]
- Smith, C.A.; Want, E.J.; O’Maille, G.; Abagyan, R.; Siuzdak, G. XCMS: Processing mass spectrometry data for metabolite profiling using nonlinear peak alignment, matching, and identification. Anal. Chem. 2006, 78, 779–787. [Google Scholar] [CrossRef] [PubMed]
- Scheltema, R.A.; Jankevics, A.; Jansen, R.C.; Swertz, M.A.; Breitling, R. PeakML/mzMatch: A File Format, Java Library, R Library, and Tool-Chain for Mass Spectrometry Data Analysis. Anal. Chem. 2011, 83, 2786–2793. [Google Scholar] [CrossRef] [PubMed] [Green Version]
- Creek, D.J.; Jankevics, A.; Burgess, K.E.V.; Breitling, R.; Barrett, M.P. IDEOM: An Excel interface for analysis of LC–MS-based metabolomics data. Bioinformatics 2012, 28, 1048–1049. [Google Scholar] [CrossRef] [PubMed]
- Gloaguen, Y.; Morton, F.; Daly, R.; Gurden, R.; Rogers, S.; Wandy, J.; Wilson, D.; Barret, M.; Burgess, K. PiMP my metabolome: An integrated, web-based tool for LC-MS metabolomics data. Bioinformatics 2017, 33, 4007–4009. [Google Scholar] [CrossRef] [PubMed] [Green Version]
- Rattigan, K.M.; Pountain, A.W.; Regnault, C.; Achcar, F.; Vincent, I.M.; Goodyear, C.S.; Barret, M.P. Metabolomic profiling of macrophages determines the discrete metabolomic signature and metabolomic interactome triggered by polarising immune stimuli. Ahmad A, editor. PLoS ONE 2018, 13, e0194126. [Google Scholar] [CrossRef] [PubMed]


| Subject ID | Gender | Age (Years) | Height (cm) | Weight (kg) | BMI (kg/m2) | Max. Oxygen Uptake (ml/kg/min) | Max. Power (Watts) |
|---|---|---|---|---|---|---|---|
| Metab-001 | F | 19 | 167.0 | 62.5 | 22.6 | 46.8 | 240 |
| Metab-003 | M | 22 | 183.0 | 80.2 | 23.9 | 64.8 | 430 |
| Metab-005 | F | 26 | 164.0 | 55.7 | 20.8 | 47.8 | 230 |
| Metab-006 | M | 34 | 180.0 | 73.6 | 22.8 | 60.4 | 370 |
| Metab-008 | M | 26 | 183.0 | 71.0 | 21.2 | 43.8 | 250 |
| Metab-009 | M | 27 | 177.0 | 69.5 | 22.3 | 65.7 | 370 |
| Metab-010 | M | 26 | 186.0 | 87.0 | 25.2 | 54.7 | 410 |
| Mean | 26 | 177.0 | 71.4 | 22.7 | 54.9 | 329 | |
| SD | 5 | 8.5 | 9.7 | 1.5 | 9.0 | 86 |
© 2020 by the authors. Licensee MDPI, Basel, Switzerland. This article is an open access article distributed under the terms and conditions of the Creative Commons Attribution (CC BY) license (http://creativecommons.org/licenses/by/4.0/).
Share and Cite
Blackburn, G.; Hay, J.; Skagen, C.; Paul, E.; Achcar, F.; Wilson, J.; Best, C.; Manson, E.; Burgess, K.; Barrett, M.P.; et al. Running on Empty: A Metabolomics Approach to Investigating Changing Energy Metabolism during Fasted Exercise and Rest. Metabolites 2020, 10, 399. https://doi.org/10.3390/metabo10100399
Blackburn G, Hay J, Skagen C, Paul E, Achcar F, Wilson J, Best C, Manson E, Burgess K, Barrett MP, et al. Running on Empty: A Metabolomics Approach to Investigating Changing Energy Metabolism during Fasted Exercise and Rest. Metabolites. 2020; 10(10):399. https://doi.org/10.3390/metabo10100399
Chicago/Turabian StyleBlackburn, Gavin, Joshua Hay, Christine Skagen, Elizabeth Paul, Fiona Achcar, John Wilson, Cameron Best, Erin Manson, Karl Burgess, Michael P. Barrett, and et al. 2020. "Running on Empty: A Metabolomics Approach to Investigating Changing Energy Metabolism during Fasted Exercise and Rest" Metabolites 10, no. 10: 399. https://doi.org/10.3390/metabo10100399