A Case Study on the Promising Product Selection Indicators for Small and Medium-Sized Enterprises (SMEs)


Korea Institute of Science and Technology Information (KISTI), 66 Hoegi-ro, Dongdaemun-gu, Seoul 02456, Korea
*
Author to whom correspondence should be addressed.
J. Open Innov. Technol. Mark. Complex. 2018, 4(4), 56; https://doi.org/10.3390/joitmc4040056
Submission received: 20 June 2018
/
Revised: 9 November 2018
/
Accepted: 15 November 2018
/
Published: 22 November 2018
Abstract
:This case study used a technology readiness level (TRL), market attractiveness level (MAL), and customer readiness level (CRL) to measure the prospect of promising products. The TRL, MAL, and CRL were measured using Delphi methods. A TRL is composed of basic research as well as experimental, prototype, practical, and commercial stages. A market attractiveness level is made up of global market size, global market growth rate, and government policy suitability. A customer readiness level was measured using consumer preference. The promising products were mainly selected as information communication and software related products. Among the technologies and products announced by domestic and foreign organizations, products suitable for research and development tasks of small and medium-sized enterprises were selected. The results of this case study are expected to be committed for the enhancement of the success rate of commercialization for small and medium-sized enterprises by being dedicated to the R&D planning of small and medium-sized enterprises in the ICT (Information and Communication Technology)/SW (Software)) field and proposing a direction to pursue the business. The purpose of this paper is to propose an approach to measure the prospect of promising products by using three levels: TRL, MAL, and CRL, which are measured using Delphi methods. This approach aims to enhance the success rate of commercialization for small and medium-sized enterprises (SMEs).
1. Introduction
Along with keener competition between companies including small and medium-sized enterprises, it was perceived very important to discover promising products for the future and develop relevant technologies with limited resources. However, most of the small and medium-sized enterprises have not been able to operate a planning department to select a promising product suitable for those companies. Since SMEs are not able to select promising business areas due to the lack of information, case studies are expected to contribute to finding promising business areas based on data. For large companies and/or established companies, promising technologies are selected in consideration of technology traits, market traits, government policy, and suitability to their companies. In determining “suitability to their companies,” small and medium-sized enterprises take the reliability of stable profit rather than long-term investment and large profits most importantly compared with large companies [1,2,3,4].
Small and medium-sized enterprises tend to consider the products that can penetrate into the “relevant market” to the currently ongoing business as promising. These companies consider products promising that can make an impact on the “niche market” rather than the major market with many competitors and the “expending market” where short-term profits can be obtained after preoccupying the market with a high growth rate despite the market being in the initial stage when compared with a mature market. This also includes the “monopoly market for small supply” that ensures a market for large companies. Small and medium-sized enterprises prefer to invest in new product development or invest in quality and production process improvement to reduce costs while enhancing profits. Small and medium-sized enterprises are in an important position in the Korean economy as well as in the world economy and are expected to be committed to national economic growth during the process of exploring, discovering, and realizing promising technologies. First world countries and Korea have withdrawn promising technologies utilizing a technology/patent literature analysis, professional Delphi analysis, and a big data analysis with the inclusion of a large amount of data found on the Internet [5,6,7,8,9,10,11,12,13,14].
Overseas advanced countries have been dealing with promising technologies from a macro perspective while, in Korea, promising technologies have been discovered by each of the government ministries and relevant research and development have been supported. The current Korean government plans to support the 4th industrial revolution-related technologies intensively in consideration of an institutional aspect. For the sustainable growth of small and medium-sized enterprises, an effort to detect promising technologies have continued to be driven by the Ministry of SMEs and Startups. However, research into the systemic establishment of a clear discovery process regarding the discovery of promising technologies have not been satisfying.
A technology readiness level (TRL) introduced by Ray Chase and implemented by NASA has been defined and expanded officially in other industrial fields by John Mankins in 1995 [15]. Mankins established a framework to measure consistently TRL among the various types of technologies. Not only NASA and the US Department of Defense but also institutions including the Ministry of Energy and the Department of Homeland Security that utilize TRL in research and development projects have been increasing in number. A TRL assessment has been utilized as an official tool to analyze, assess, and manage the technical risk in research and development by the US government institutes. As a scale to demonstrate the readiness level of the critical technology element (CTE), the US Department of Defense has used the TRL. It is classified into nine steps from level 1 to level 9. In each step, requirements to satisfy each of the steps are defined. The higher the TRL of the CTE, the greater the perfection of the CTEs that can be applied to product development. Since technology development is considered as a key driving force in company innovation and sustainable company growth, more effort and resources are needed for research and development. The existing method of studying the innovation level of the individual company has focused on the technological aspect of development. Since the importance of preparation for the market has been perceived lately, it is necessary to define properly relevant risks by monitoring company innovation in the consideration of market potential and to ensure timely appropriate resources. The TRL was developed as a tool useful for the monitoring of technology development. A Technology Readiness Assessment (TRA) is an assessment method proposed as a quantitative indicator to measure CTEs to see how much they are completed for commercialization. A CTE refers to technology that becomes a determent in fulfilling a goal such as competence, cost, and schedule for product development [16].
The US Department of Defense defined a TRA as a “systematic and quantitative procedure of assessing the readiness of technology, which is called a critical technology element used for a product.” A CTE is specific technology that has a decisive influence in developing a competence goal within a given schedule and at limited costs. A TRA can be defined as a method to assess objectively and quantitatively how much a CTE is ready by research and the development project. Sauser et al. proposed a framework of a system readiness level (SRL) based on a TRL and an integration readiness level (IRL) [17]. An SRL was designed to make up for any issue mentioned only for technology itself. At the same time, for an SRL framework, individual TRL and IRL were considered together in relation to a system integration to assess interoperability of the entire system [18].
The purpose of this paper is to propose an approach to measure the prospect of promising products by using TRL, MAL, and CRL, which are measured using Delphi methods. This approach aims to enhance the success rate of commercialization for small and medium-sized enterprises (SMEs). Using the results of the case study, we plan to carry out research to help SMEs to increase the probability of successful commercialization and to select promising R&D projects effectively.
2. Research Methods
Florin Paun proposed a framework of readiness with which any gap between a technology push caused by TRL and a market pull that features a demand readiness level (DRL) can be explained (Table 1) [19].
Florin Paun proposed a DRL to collect information in decision-making approach and to predict a condition of implementation and commercialization of technology using a concept of “Technology Push” and “Market Pull.” Florin Paun perceived DRL as a step of conceptualizing necessary elements in the market and defined as a new scale to be proposed by a company, which is a subject of innovation as a solution to assess the readiness of evolving requirements of the market [20]. A DRL was composed to correspond to a TRL.
Florin Paun mentioned that a technology transfer contract could be available only when DRL + TRL is over 10. Florin Paun ONERA (Office National d’ Etudes et de Recherches Aérospatiales) used extensively a DRL coupled with a TRL to promote technology commercialization by creating the ecology for relevant small and medium-sized enterprises.
A market readiness level (MRL) was used as an indicator to measure the impact of market pull against technology push regarding a TRL. An MRL is based on a DRL of Florin Paun (DRL) [12]. However, it features the consideration of the impact of technology push and market pull as well. An integration readiness level (IRL) was defined to play an important connecting role between technology and an external environment so that a problem solution can “fit.”
Regarding “market risk” in consideration of TRL capacity, a “market readiness level” is required along with a need for a means to monitor and control technology development. In addition, it is necessary to monitor an innovation procedure that involves relevant “technology risk” to technology development through market research and analysis.
Tao, L., Probert, D., and Phaal, R. introduced a business approach to innovation through introduction of an innovation readiness level (IRL) [21]. An IRL is a framework of describing the advancement of innovation during the life cycle of product innovation. Five major measurement elements of innovation include technology, market, organization, partnership, and risk and they have an effect on the effective execution of innovation in many steps of the life cycle of innovation. Lan Tao et al. proposed that technology and market are key driving forces and the rest of the three includes organization, partnership, and risk. “Market risk” appears when technology under development fails to meet the market demand. In technology development, “technology risk” is managed by monitoring and a control process through a TRL while relevant “market risk” is not considered in many cases [21].
Promising technologies and promising products (895 item) presented by 45 domestic and overseas institutions are organized by sector. Similar products were analyzed using text mining techniques when considering market penetration and a commercialization possibility. The three indicators for selecting prospective products suitable for SMEs are presented by experts. Three indicators were determined by Technology Readiness Level (TRL), the Market Attractiveness Level (MAL), and the Customer Readiness Level (CRL). The Delphi analyzes were performed on 20 experts in each field.
In this case study, technology readiness, market attractiveness, and customer needs readiness were proposed as three indicators to select promising products suitable for small and medium-sized enterprises. Based on the proposed three indicators, promising products to be considered in commercialization by small and medium-sized enterprises in the ICT/SW field were selected with a Delphi analysis utilizing professionals. To select promising product candidates, 355 promising technologies in the ICT/SW field announced by 45 institutions at home and abroad were summarized. Regarding the technology readiness level (TRL), the assessment standards were defined with nine steps from stage 1 (Basic theory/test) to stage 9 (Commercialization) referring to data at home and abroad (Table 2).
A market attractiveness level (MAL) was defined as global market size, a global market growth rate, and policy suitability and the global market size was estimated given the market size expected for 2021 (Table 3).
Customer readiness level (CRL) was defined by measuring the needs for promising products (Table 4).
The Delphi method is a panel-based research methodology that predicts the future when the generalized or standardized data and data are not available. It is also designed to remove the sources of various distorted communication that appear in committee or expert discussions or other types of group discussions. In other words, it is used to solve various problems such as the phenomenon that the discussion process is dominated by a small number of people, the pressure to follow the peer group opinion, the personality difference, and the conflict between the participants. The Delphi method has the usefulness of anonymity, iteration with controlled feedback, and statistical group response to participants’ responses. In order to achieve the desired goal in the study using the Delphi technique, the most important thing is to select the experts and determine the number of rounds. Since the Delphi technique aims to derive rational results by relying on subjective and intuitive judgment of experts, selection is very important. Therefore, it is the most appropriate approach to select the experts who are engaged in the research field. In this case, the subjects to be surveyed should carefully consider the representativeness, appropriateness, expertise of the participant, sincerity of participation, and the number of participants. It is also important to decide not only the number of experts but also the number of steps to be taken. In other words, it is important to determine how many rounds is most reasonable to take to reach consensus, which is the goal of the Delphi technique [22].
3. Analysis Results
A Delphi analysis was carried out two times in order to find promising product candidates for 20 professionals in the ICT/SW field. As items subject to the analysis, the technology readiness level (TRL), the market attractiveness level (MAL, global market size, global market growth rate, and policy suitability), and the customer readiness level (CRL) were proposed. Then, 46 promising products out of the promising product candidates were analyzed through a Delphi analysis two times. In addition, a Google trends analysis was undertaken utilizing key words for relevant products from 1 January, 2011 to 31 December, 2015 and a compound annual growth rate (CAGR) over five years were calculated (Table 5).
The deviation between the maximum value (9.0) and the minimum value (2.6) of TRL of the entire 26 promising products was found to be high at 6.4 and the deviation between the maximum value and the minimum value of MAL and CRL was discovered to be small at 2.4. A product of which basic performance was verified in a lab was selected as a promising product.
3.1. Analysis of Top 10 Promising Products in the ICT/SW
Any change of interest in 10 promising products of which the total of TRL, MAL, and CRL is over 19 over time was analyzed with google trends. As a result of calculating the accumulated number of searches on a Google site from 1 January, 2011 to 31 December, 2015, virtual reality (VR) was searched most frequently recording 15,200,000 in numbers. Regarding the compound annual growth rate (CAGR) of the number of searched over the past five years, UHD TV showed the most rapid increase, recording 147%, which was analyzed to show a quickly rising interest of consumers (Table 6).
3.2. An Analysis of TRL-MAL of Major Top Promising Products in Google Trends (over 20% of CAGR)
Out of 15 products of which the CAGR was over 20%, 14 products including big data analysis, Internet of things (IoT), and connected cars belonged to an A zone with high marketability (over five points of TRL and over four points of MAL). In order to commercialize products that belong to a B zone (1~5 of TRL, over four points of MAL), which is a basic research stage despite high marketability that was 4D printing. In addition, relevant research and development to enhance sustainable technology readiness should be conducted (Figure 1).
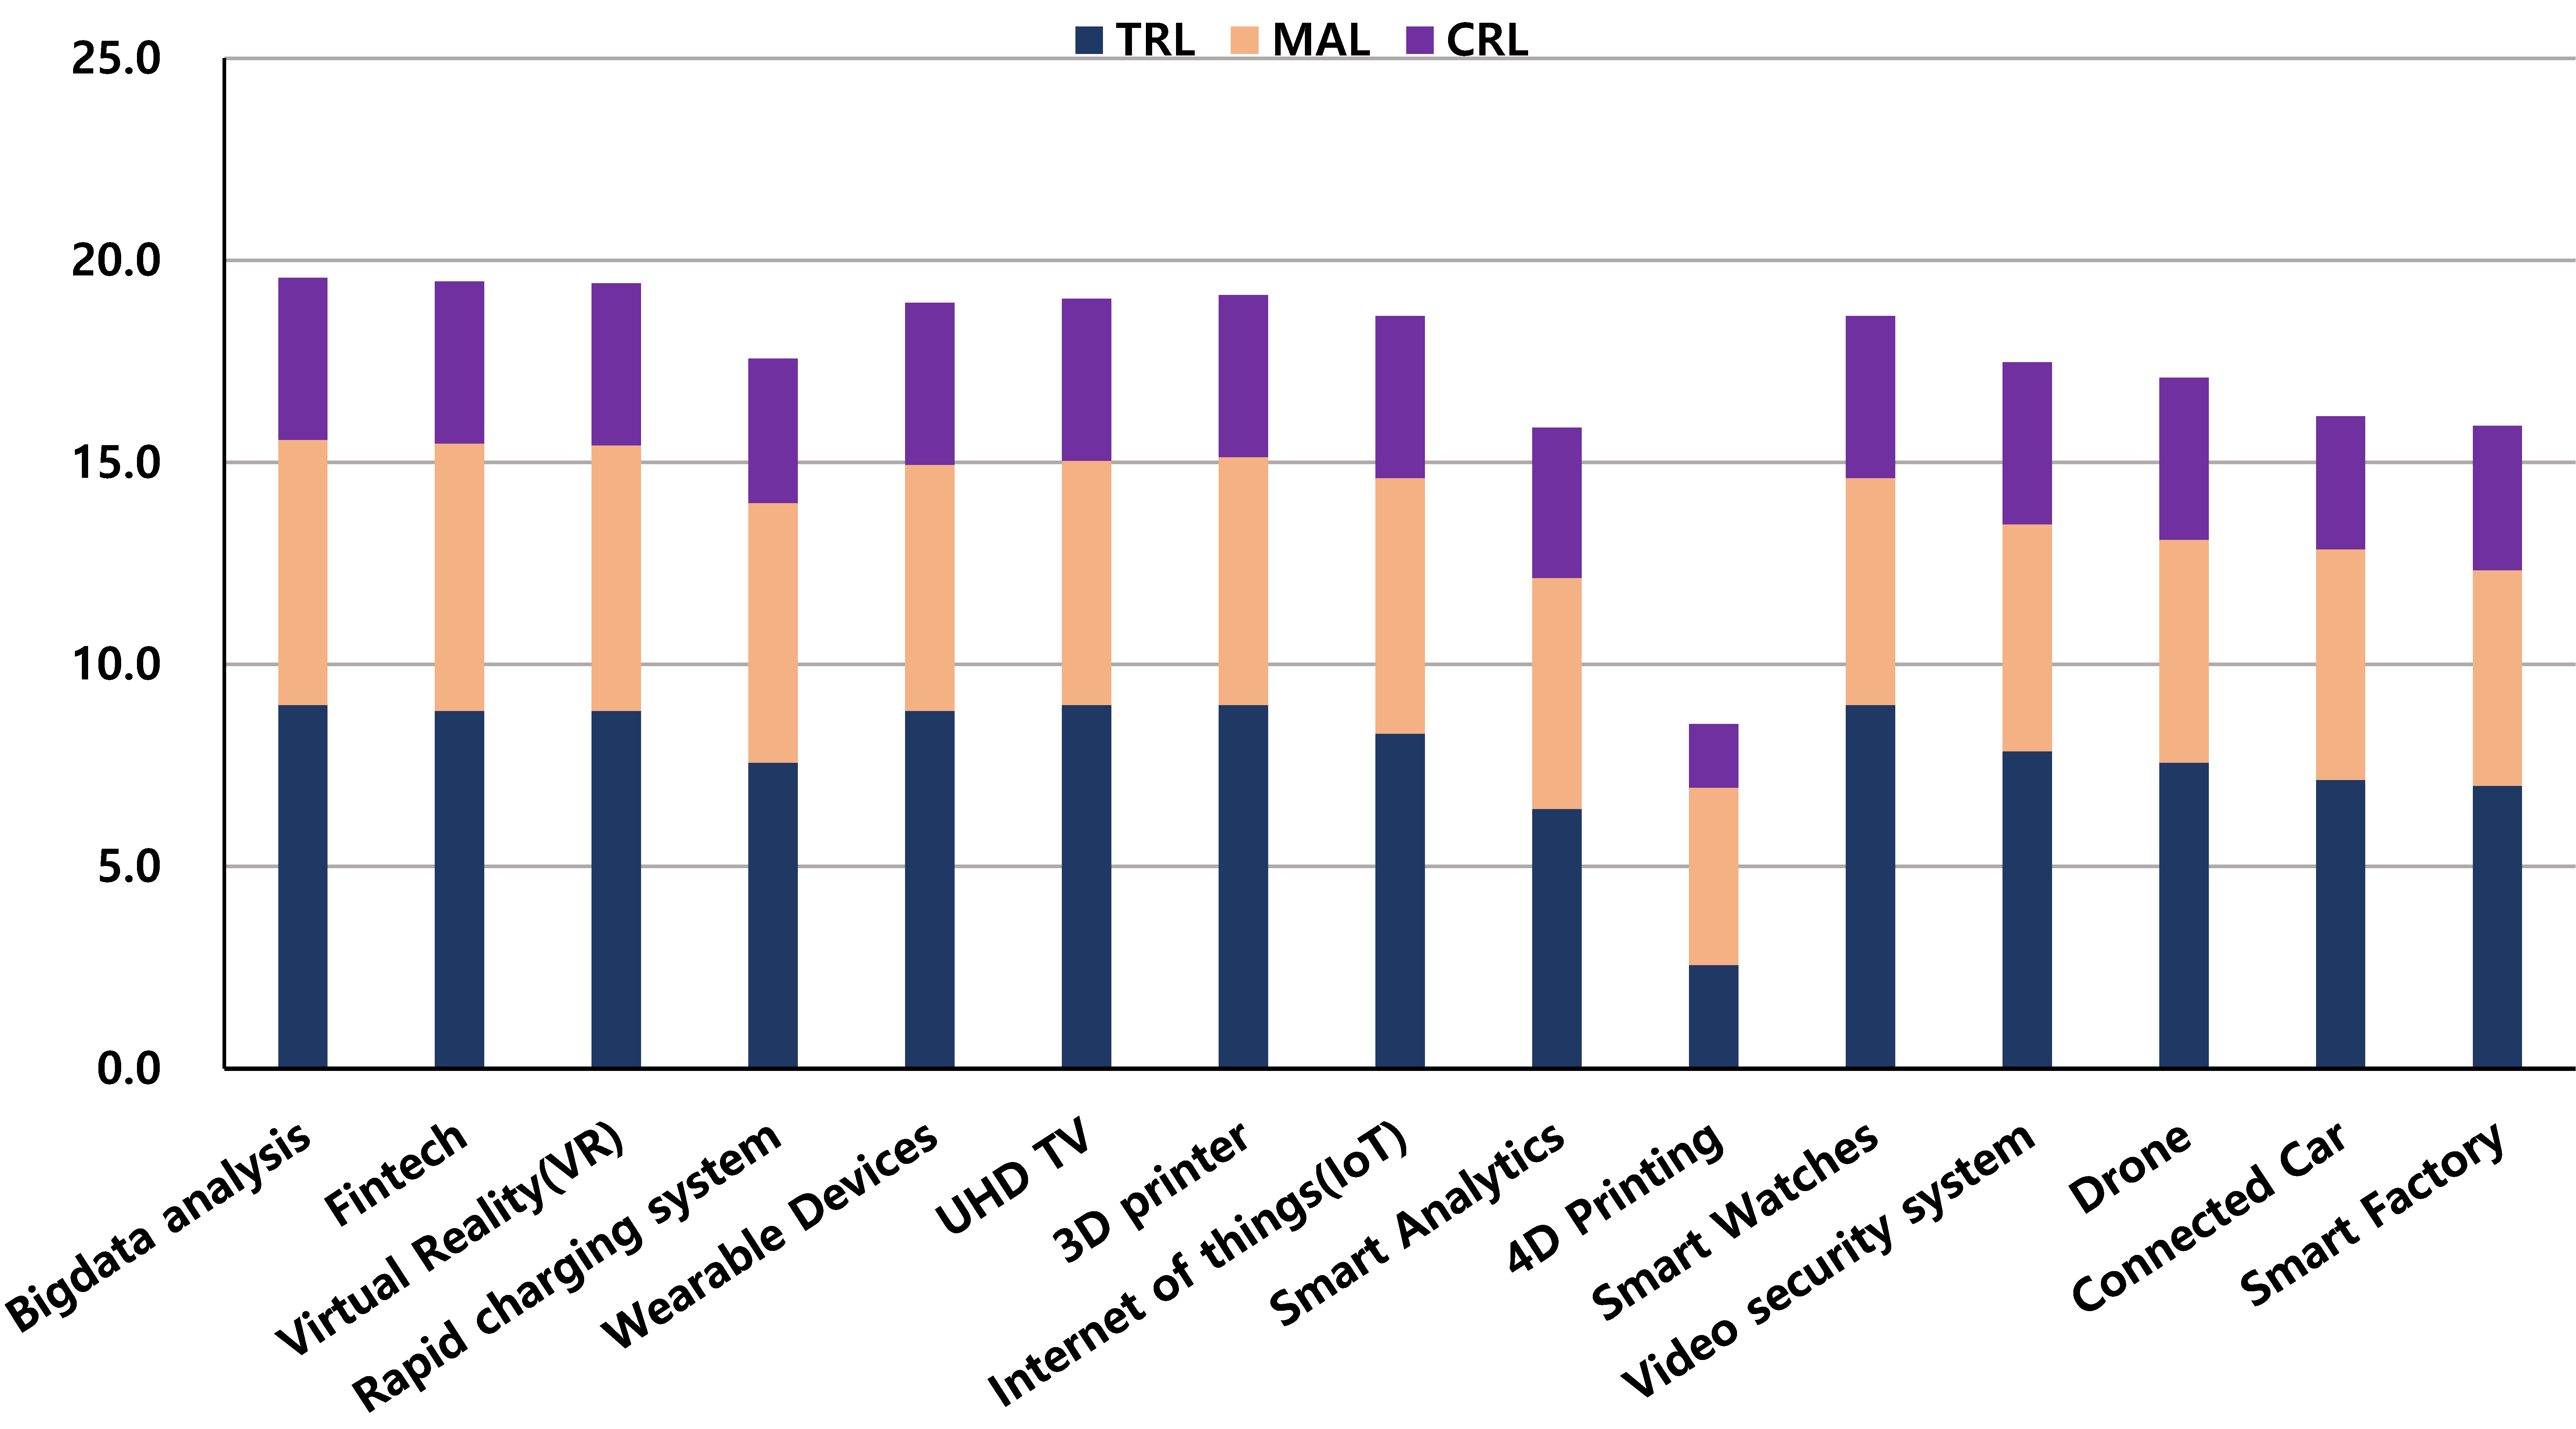
The total of the TRL (9.0), MAL (6.6), and CRL (4.0) of a big data analysis was 19.6, which was the greatest and it was analyzed to be greater than MAL (4.4), TRL (2.6), and CRL (1.6) of 4D printing (Figure 2 and Figure 3).
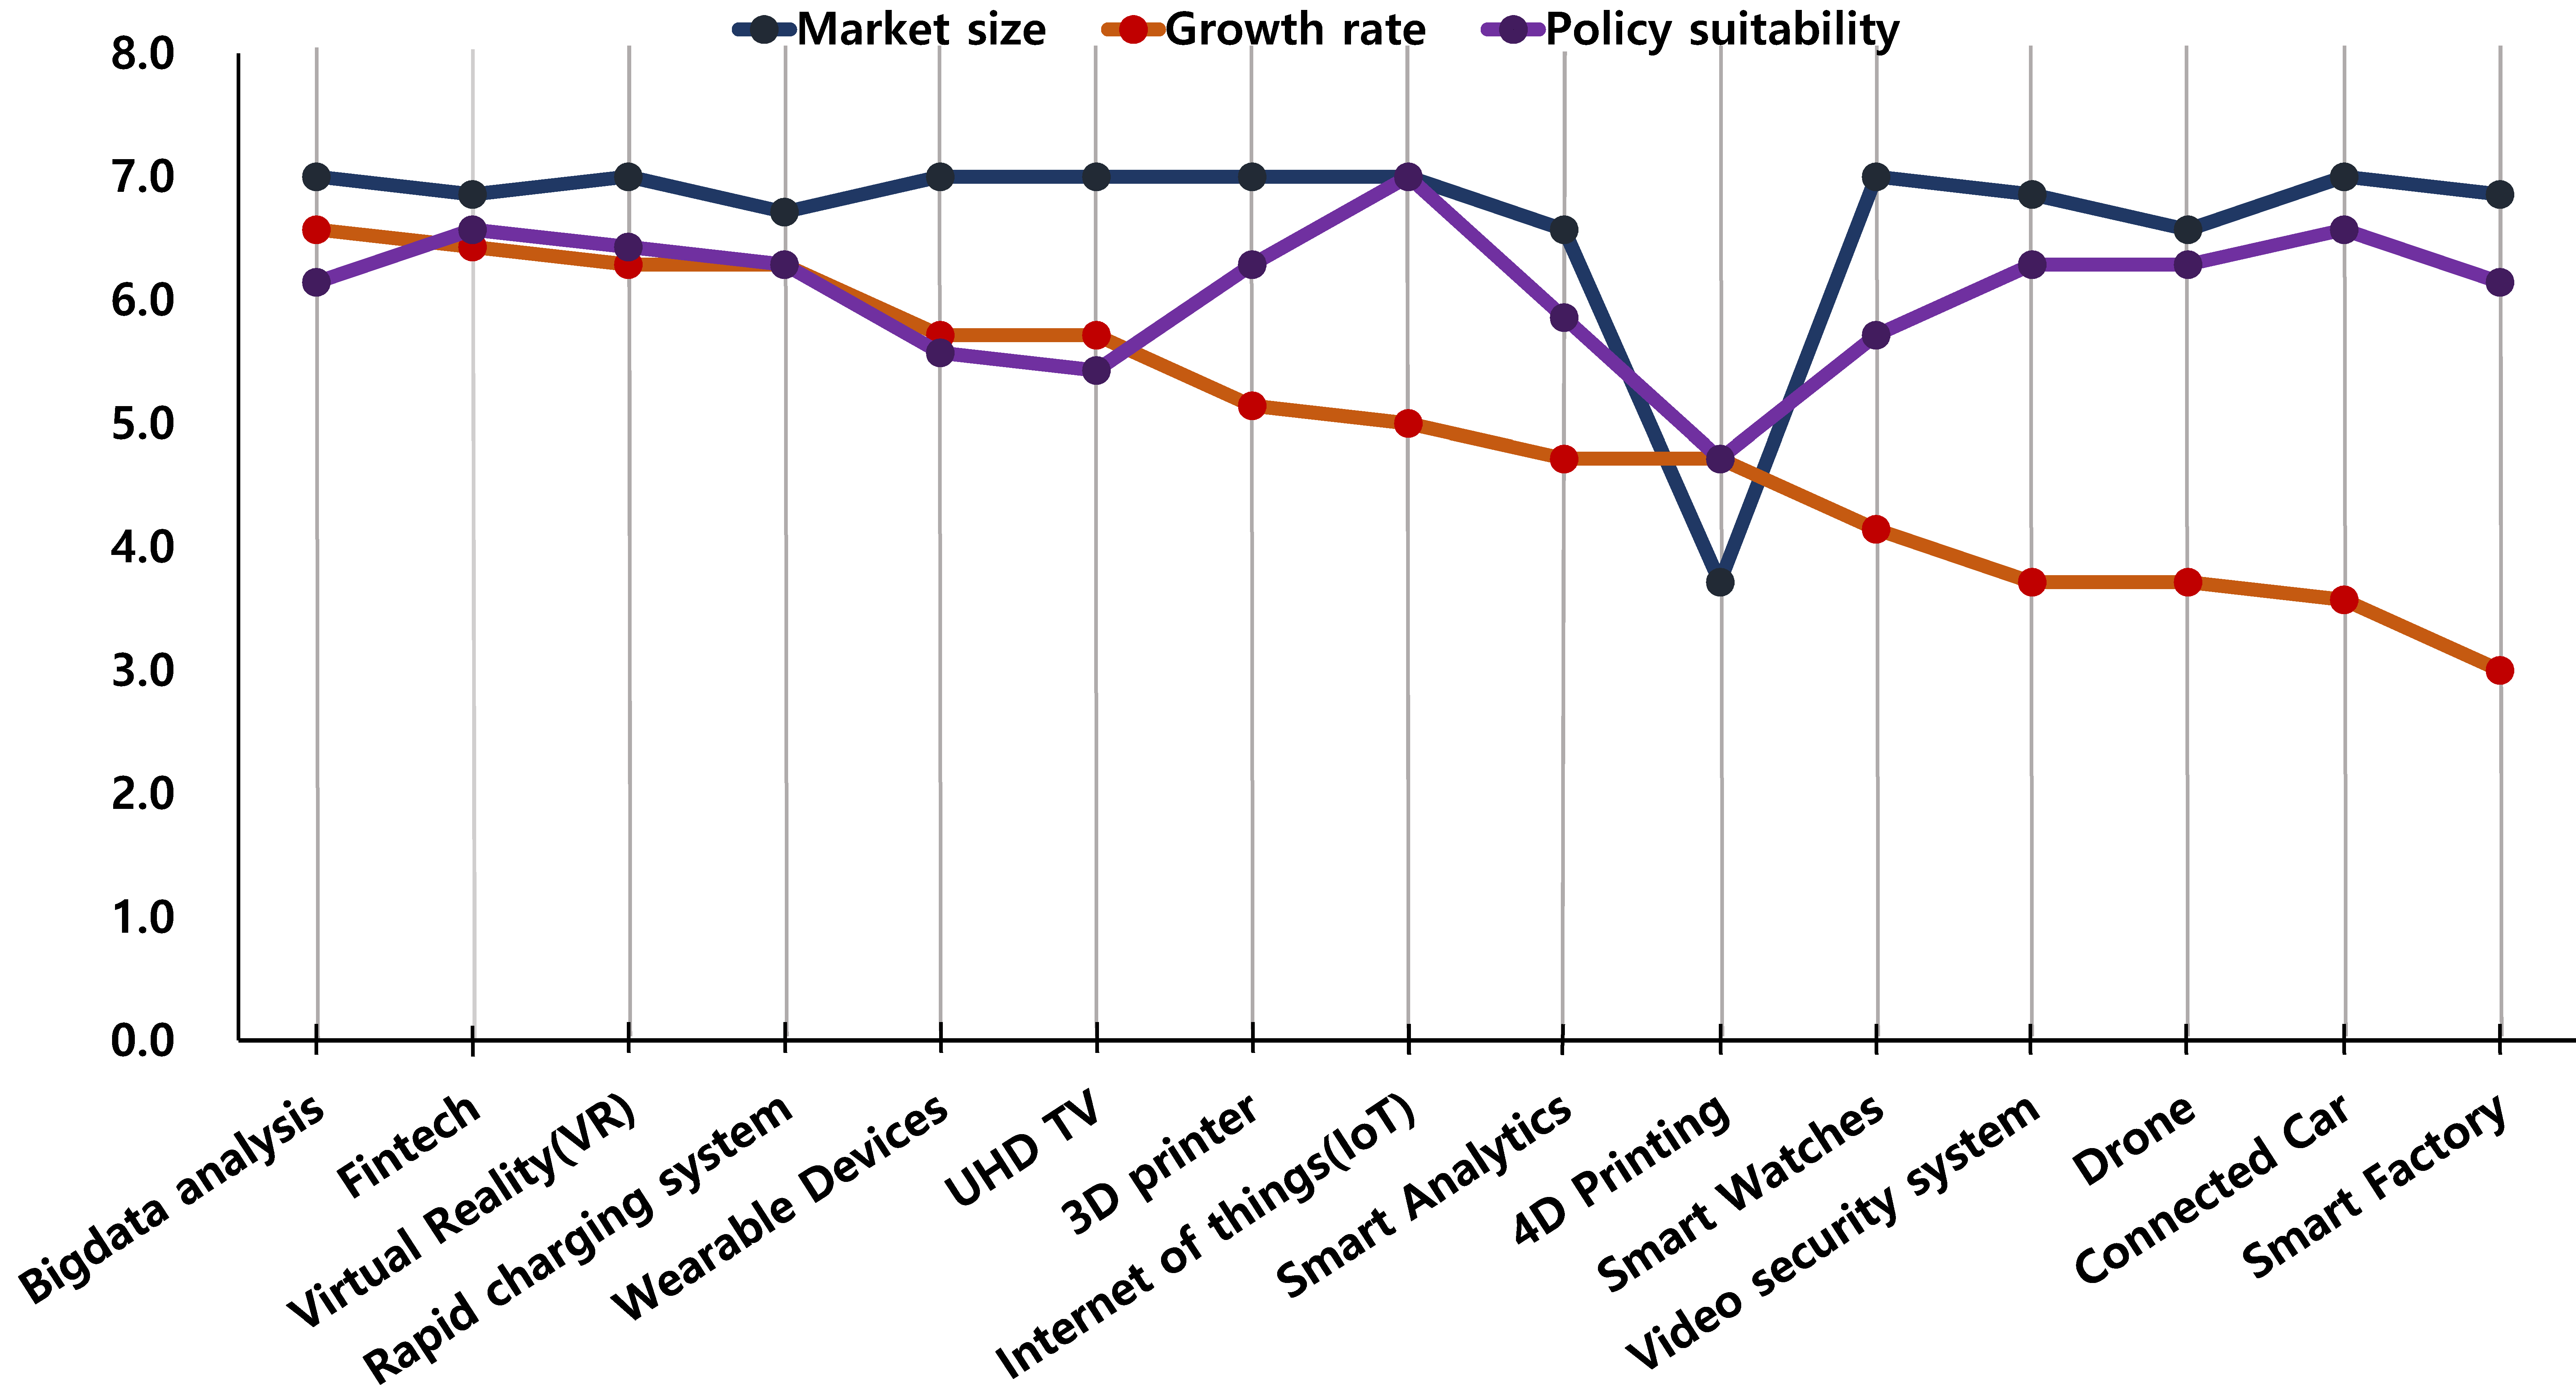
MAL that averaged the market size (7.0), growth rate (6.6), and policy suitability (6.1) of a big data analysis was 6.6 while MAL of Fintech and Virtual Reality was discovered as being high at 6.6. However, the growth rate and policy suitability of 4D printing was 4.7 each. Its market size was analyzed to be 3.7. In addition, as an MAL that averaged three factors and had been analyzed to be as low as 4.4, it will take a considerable amount of time to commercialize the products (Figure 4).
3.3. A TRL-MAL Analysis of Major Top Promising Products in Google Trends (Less than 20% of CAGR)
Out of 15 products of which the CAGR is less than 20%, all of the 15 products that belonged to an A zone (over five points of TLR and over four points of MAL) with high marketability included artificial intelligence (AI), online to offline platform (O2O Platform), automotive senor, and MEMS sensor. Since the TRL and MAL of all of the 15 products are high, consistent commercialization is expected until 2021 (Figure 5).
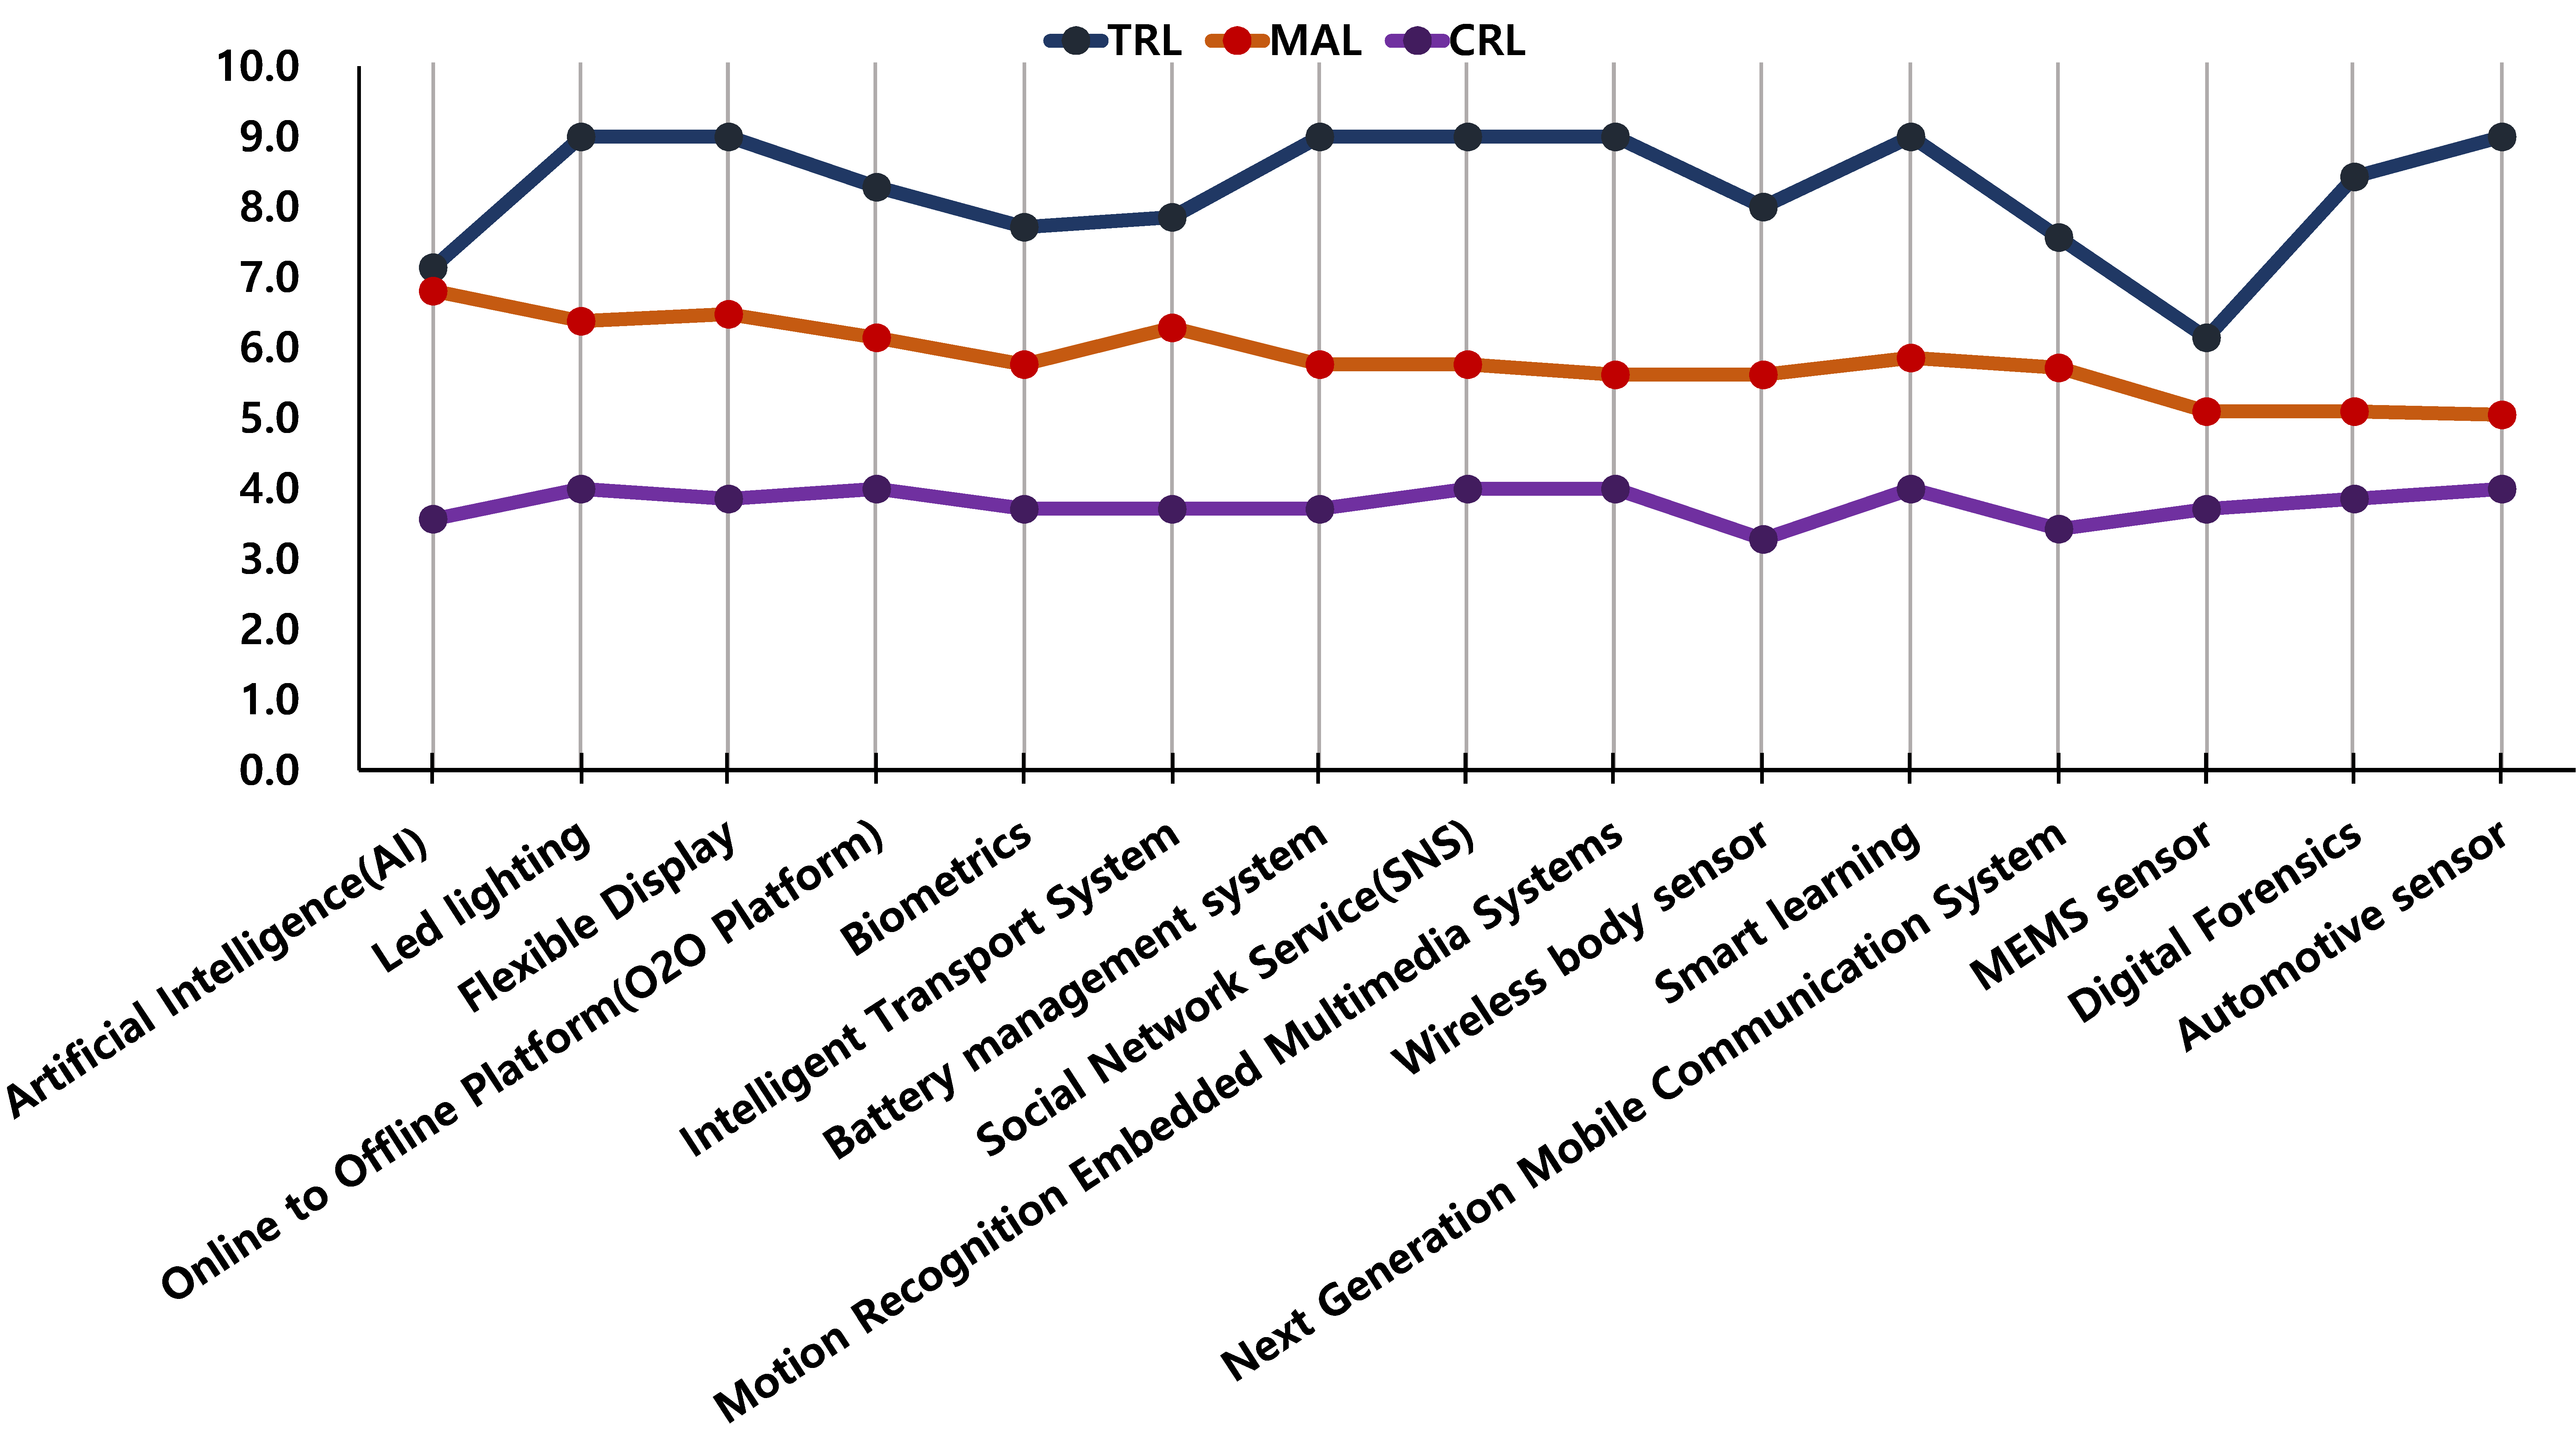
The total of the TRL (9), MAL (6.4), and CRL (4.0) of LED lighting was the highest at 19.4 while the total of the TRL (6.1), MRL (5.1), and CRL (3.7) of MEMS sensor was low at 15.0 (Figure 6 and Figure 7).
The MAL that averaged the market size (6.9), growth rate (6.7), and policy suitability (6.9) of artificial intelligence (AI) was discovered high at 6.8 (average value of the MAL) (Figure 8).
Although the MAL that averaged the market size (6.9), growth rate (2.1), and policy suitability (6.1) of automotive sensor appeared low at 5.0 (average value of the MAL), which is consistent market growth that is expected once the commercialization of the autonomous vehicle becomes advanced.
4. Conclusions
Aimed at promising product candidates for technology commercialization in the ICT/SW field, a process of selecting promising products strategically in response to changes in technology, market, and demand was used. A case study on the indicators to select promising products was conducted to identify promising products in the ICT/SW field.
In this case study, three indicators including technology readiness (technology development step), market attractiveness (market size, market growth rate, and policy suitability), and customer needs readiness (maturity level of consumer needs) were proposed. Based on the proposed three indicators, promising products in the ICT/SW field were selected with a Delphi analysis utilizing professionals. A Delphi analysis was carried out two times employing 20 professionals in the ICT/SW field and 46 promising products out of the promising product candidates were analyzed.
The Google trends of 10 promising products of which the total of TRL, MAL, and CRL was over 19 were analyzed and, due to calculating the accumulated number of searches from 2011 to 2015, virtual reality (VR) was most frequently searched, which recorded 15,200,000 searches. Regarding the CAGR of searches over the past five years, UHD TV posted 147%, which exhibited a rapidly increasing interest among consumers.
Out of 15 products of which the CAGR was over 20%, 14 products that belonged to an A zone with high marketability involved big data analysis, Internet of things (IoT), and connected car while a product that belonged to a B zone, which is at a basic research stage despite high marketability, was discovered as 4D printing. The total of TRL, MAL, and CRL was the highest at 19.6 (sum value of MAL, TRL, CRL) for big data analysis (Table 6), (Figure 3). Meanwhile, MAL was found higher than TRL and CRL for 4D printing. MAL that averaged market size, market growth rate, and policy suitability of big data analysis, Fintech, and Virtual Reality (VR) was high at 6.6 (value of MAL). On the other hand, as the MAL of 4D printing was low at 4.4 (value of MAL), it is expected to take quite a while until the market matures for commercialization (Table 5), (Figure 2).
Out of 15 products of which the CAGR was less than 20%, 15 products that belong to an A zone with high marketability included artificial Intelligence (AI), an online to offline platform (O2O platform), automotive sensor, and MEMS sensor and, because of the high TRL and MAL of those 15 products, commercialization is anticipated to continue actively until 2021. The total of the TRL, MAL, and CRL of LED lighting was the highest at 19.4 (sum value of MAL, TRL, CRL) whereas the total of the TRL, MAL, and CRL of MEMS sensor was low at 15.0 (Table 6), (Figure 7). The MAL that averaged the market size, market growth rate, and policy suitability of artificial intelligence (AI) was high at 6.8 (value of MAL). while the MAL that averaged the market size, market growth rate, and policy suitability of an automotive sensor was low at 5.0 (value of MAL) (Table 5), (Figure 6). Regarding an automotive sensor, consistent market growth is anticipated along with active commercialization of the autonomous vehicle.
Suggestive implications were deduced utilizing indicators such as policy suitability and consumer preferences based on the domestic industry in accordance with technology readiness and market attractiveness for promising products in the ICT/SW field.
The results of this case study are expected to commit to the enhancement of the success rate of commercialization for small and medium-sized enterprises by being dedicated to the R&D planning of small and medium-sized enterprises in the ICT/SW field and proposing a direction to pursue the business.
Research Limitations/Implications
This case study used the Delphi method, which depends on the opinions of experts, and it is expected that more objective results will be obtained if the quantitative analysis method is applied in the future. In future research, it is necessary to improve the reliability of data analysis by deliberately designing the MAL (Market attractiveness level) criteria and performing Delphi analysis.
Author Contributions
Conceptualization, Y.-I.K. and J.-K.S.; Methodology, Y.-I.K. and J.-K.S.; Validation, Y.-I.K. and J.-K.S.; Formal analysis, Y.-I.K.; Data curation, Y.-I.K.; Writing—original draft preparation, Y.-I.K.; Writing—review and editing, Y.-I.K. and J.-K.S.; Funding acquisition, Y.-I.K. and J.-K.S.
Funding
This research was funded by Korea Institute of Science and Technology Information (KISTI). The fund was utilized for employing Delphi participants.
Acknowledgments
This research was supported by Korea Institute of Science and Technology Information (KISTI) (K-16-L04-C02-S02, K-18-L13-C04-S01).
Conflicts of Interest
The authors declare no conflict of interest.
References
- Zhou, J.; Jiao, H.; Li, J. Providing Appropriate Technology for Emerging Markets: Case Study on China’s Solar Thermal Industry. Sustainability 2017, 9, 178. [Google Scholar] [CrossRef]
- Wolbring, G.; Diep, L.; Yumakulov, S.; Ball, N.; Yergens, D. Social Robots, Brain Machine Interfaces and Neuro/Cognitive Enhancers: Three Emerging Science and Technology Products through the Lens of Technology Acceptance Theories, Models and Frameworks. Technologies 2013, 1, 3–25. [Google Scholar] [CrossRef]
- Yun, J.H.J.; Won, D.; Jeong, E.; Park, K.; Lee, D.; Yigitcanlar, T. Dismantling of the Inverted U-Curve of Open Innovation. Sustainability 2017, 9, 1423. [Google Scholar] [CrossRef]
- Yun, J.H.J.; Yigitcanlar, T. Open Innovation in Value Chain for Sustainability of Firms. Sustainability 2017, 9, 811. [Google Scholar] [CrossRef]
- Kim, G.; Bae, J. A novel approach to forecast promising technology through patent analysis. Technol. Forecast. Soc. Chang. 2017, 117, 228–237. [Google Scholar] [CrossRef]
- Joung, J.; Kim, K. Monitoring emerging technologies for technology planning using technical keyword based analysis from patent data. Technol. Forecast. Soc. Chang. 2017, 114, 281–292. [Google Scholar] [CrossRef]
- Niemann, H.; Moehrle, M.G.; Frischkorn, J. Use of a new patent text-mining and visualization method for identifying patenting patterns over time: Concept, method and test application. Technol. Forecast. Soc. Chang. 2017, 115, 210–220. [Google Scholar] [CrossRef]
- Suominen, A.; Toivanen, H.; Seppänen, M. Firms’ knowledge profiles: Mapping patent data with unsupervised learning. Technol. Forecast. Soc. Chang. 2017, 115, 131–142. [Google Scholar] [CrossRef]
- Park, Y.; Yoon, J. Application technology opportunity discovery from technology portfolios: Use of patent classification and collaborative filtering. Technol. Forecast. Soc. Chang. 2017, 118, 170–183. [Google Scholar] [CrossRef]
- Seo, W.; Yoon, J.; Park, H.; Coh, B.; Lee, J.-M.; Kwon, O.-J. Product opportunity identification based on internal capabilities using text mining and association rule mining. Technol. Forecast. Soc. Chang. 2016, 105, 94–104. [Google Scholar] [CrossRef]
- Song, K.; Kim, K.; Lee, S. Identifying promising technologies using patents: A retrospective feature analysis and a prospective needs analysis on outlier patents. Technol. Forecast. Soc. Chang. 2017, 119, 200–214. [Google Scholar] [CrossRef]
- Park, I.; Lee, K.; Yoon, B. Exploring Promising Research Frontiers Based on Knowledge Maps in the Solar Cell Technology Field. Sustainability 2015, 7, 13660–13689. [Google Scholar] [CrossRef] [Green Version]
- Lee, W.S.; Sohn, S.Y. Identifying Emerging Trends of Financial Business Method Patents. Sustainability 2017, 9, 1670. [Google Scholar] [CrossRef]
- Yun, J.H.J.; Jeong, E.; Lee, C.; Park, J.; Zhao, X. Effect of Distnace on Open Innovation: Differences among Institutions According to Patent Citation and Referecne. Sustainability 2017, 9, 1478. [Google Scholar] [CrossRef]
- Mankins, J.C. Technology Readiness Levels; White Paper; Advanced Concepts Office, Office of Space Access and Technology, NASA (The National Aeronautics and Space Administration): Washington, DC, USA, 1995. [Google Scholar]
- Fast-Berglund, A.; Bligård, L.O.; Åkerman, M.; Karlsson, M. Using the TRL-methodology to Design Supporting ICT-tools for Production Operators. Procedia CIRP 2014, 17, 726–731. [Google Scholar] [CrossRef]
- Sauser, B.; Verma, D.; Ramirez-Maquez, J.; Grove, R. From TRL to SRL: The concept of systems readiness levels. In Proceedings of the Conference on Systems Engineering Research, Los Angeles, CA, USA, 7–8 April 2006; pp. 6–7. [Google Scholar]
- Dent, D.; Pettit, B. Technology and Market Readiness Levels; Dent Associates White Paper 11-01; Dent Associates Ltd.: Winchester, UK, 2011; p. 3. [Google Scholar]
- Paun, F. The Demand Readiness Level Scale as New Proposed Tool to Hybridize Market Pull with Technology Push Approaches in Technology Transfer Practices. In Technology Transfer in a Global Economy; Audretsch, D.B., Lehmann, E.E., Link, A.N., Starnecker, A., Eds.; Springer: New York, NY, USA, 2012; Volume 28, pp. 353–366. [Google Scholar]
- Paun, F. “Demand Readiness Level” (DRL) a New Tool to Hybridize Market Pull and Technology Push Approaches: Evolution of Practices and Actors of Eco-Innovation; ANR-ERANET Workshop: Paris, France, 2011; p. 3. [Google Scholar]
- Tao, L.; Probert, D.; Phaal, R. Towards an integrated framework for managing the process of innovation. R&D Manag. 2009, 40, 19–30. [Google Scholar]
- Gupta, U.G.; Clarke, R.E. Theory and Applications of the Delphi Technique: A bibliography (1975–1994). Technol. Forecast. Soc. Chang. 1996, 53, 185–211. [Google Scholar] [CrossRef]
Figure 1.
TRL-MAL of major top promising products in Google trends (over 20% of CAGR). A Zone: high marketability, ongoing commercialization, B Zone: high marketability, basic research stage, C Zone: low marketability, basic research stage, D Zone: low marketability, ongoing commercialization.
Figure 1.
TRL-MAL of major top promising products in Google trends (over 20% of CAGR). A Zone: high marketability, ongoing commercialization, B Zone: high marketability, basic research stage, C Zone: low marketability, basic research stage, D Zone: low marketability, ongoing commercialization.
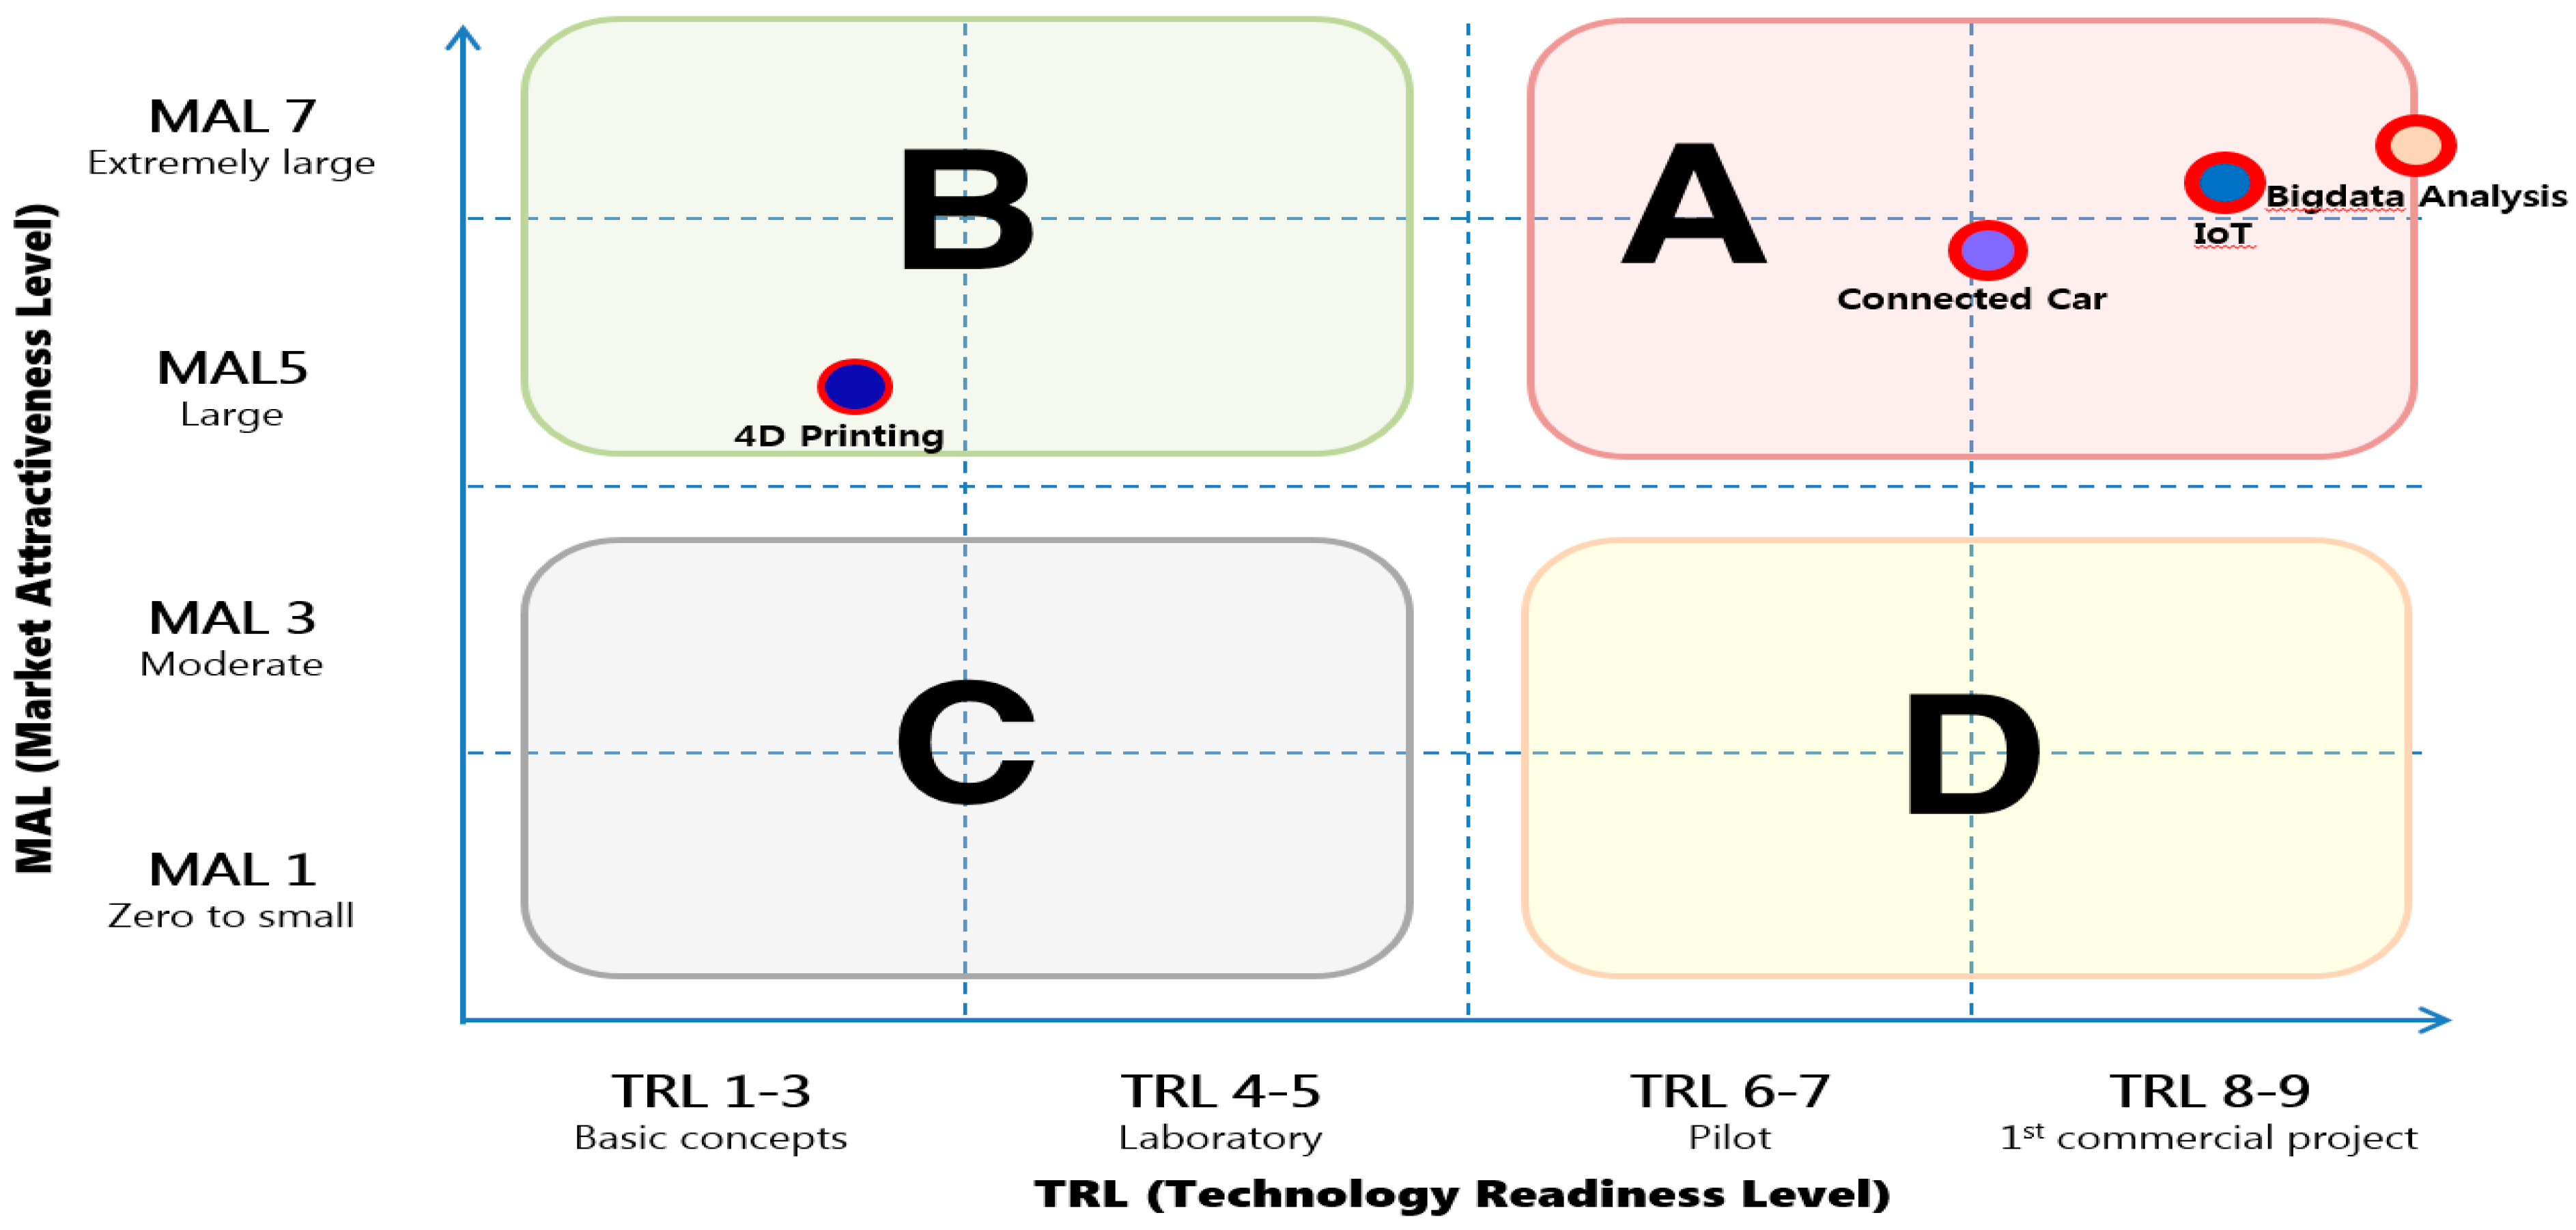
Figure 2.
TRL-MAL-CRL of major top promising products in Google trends (over 20% of CAGR).
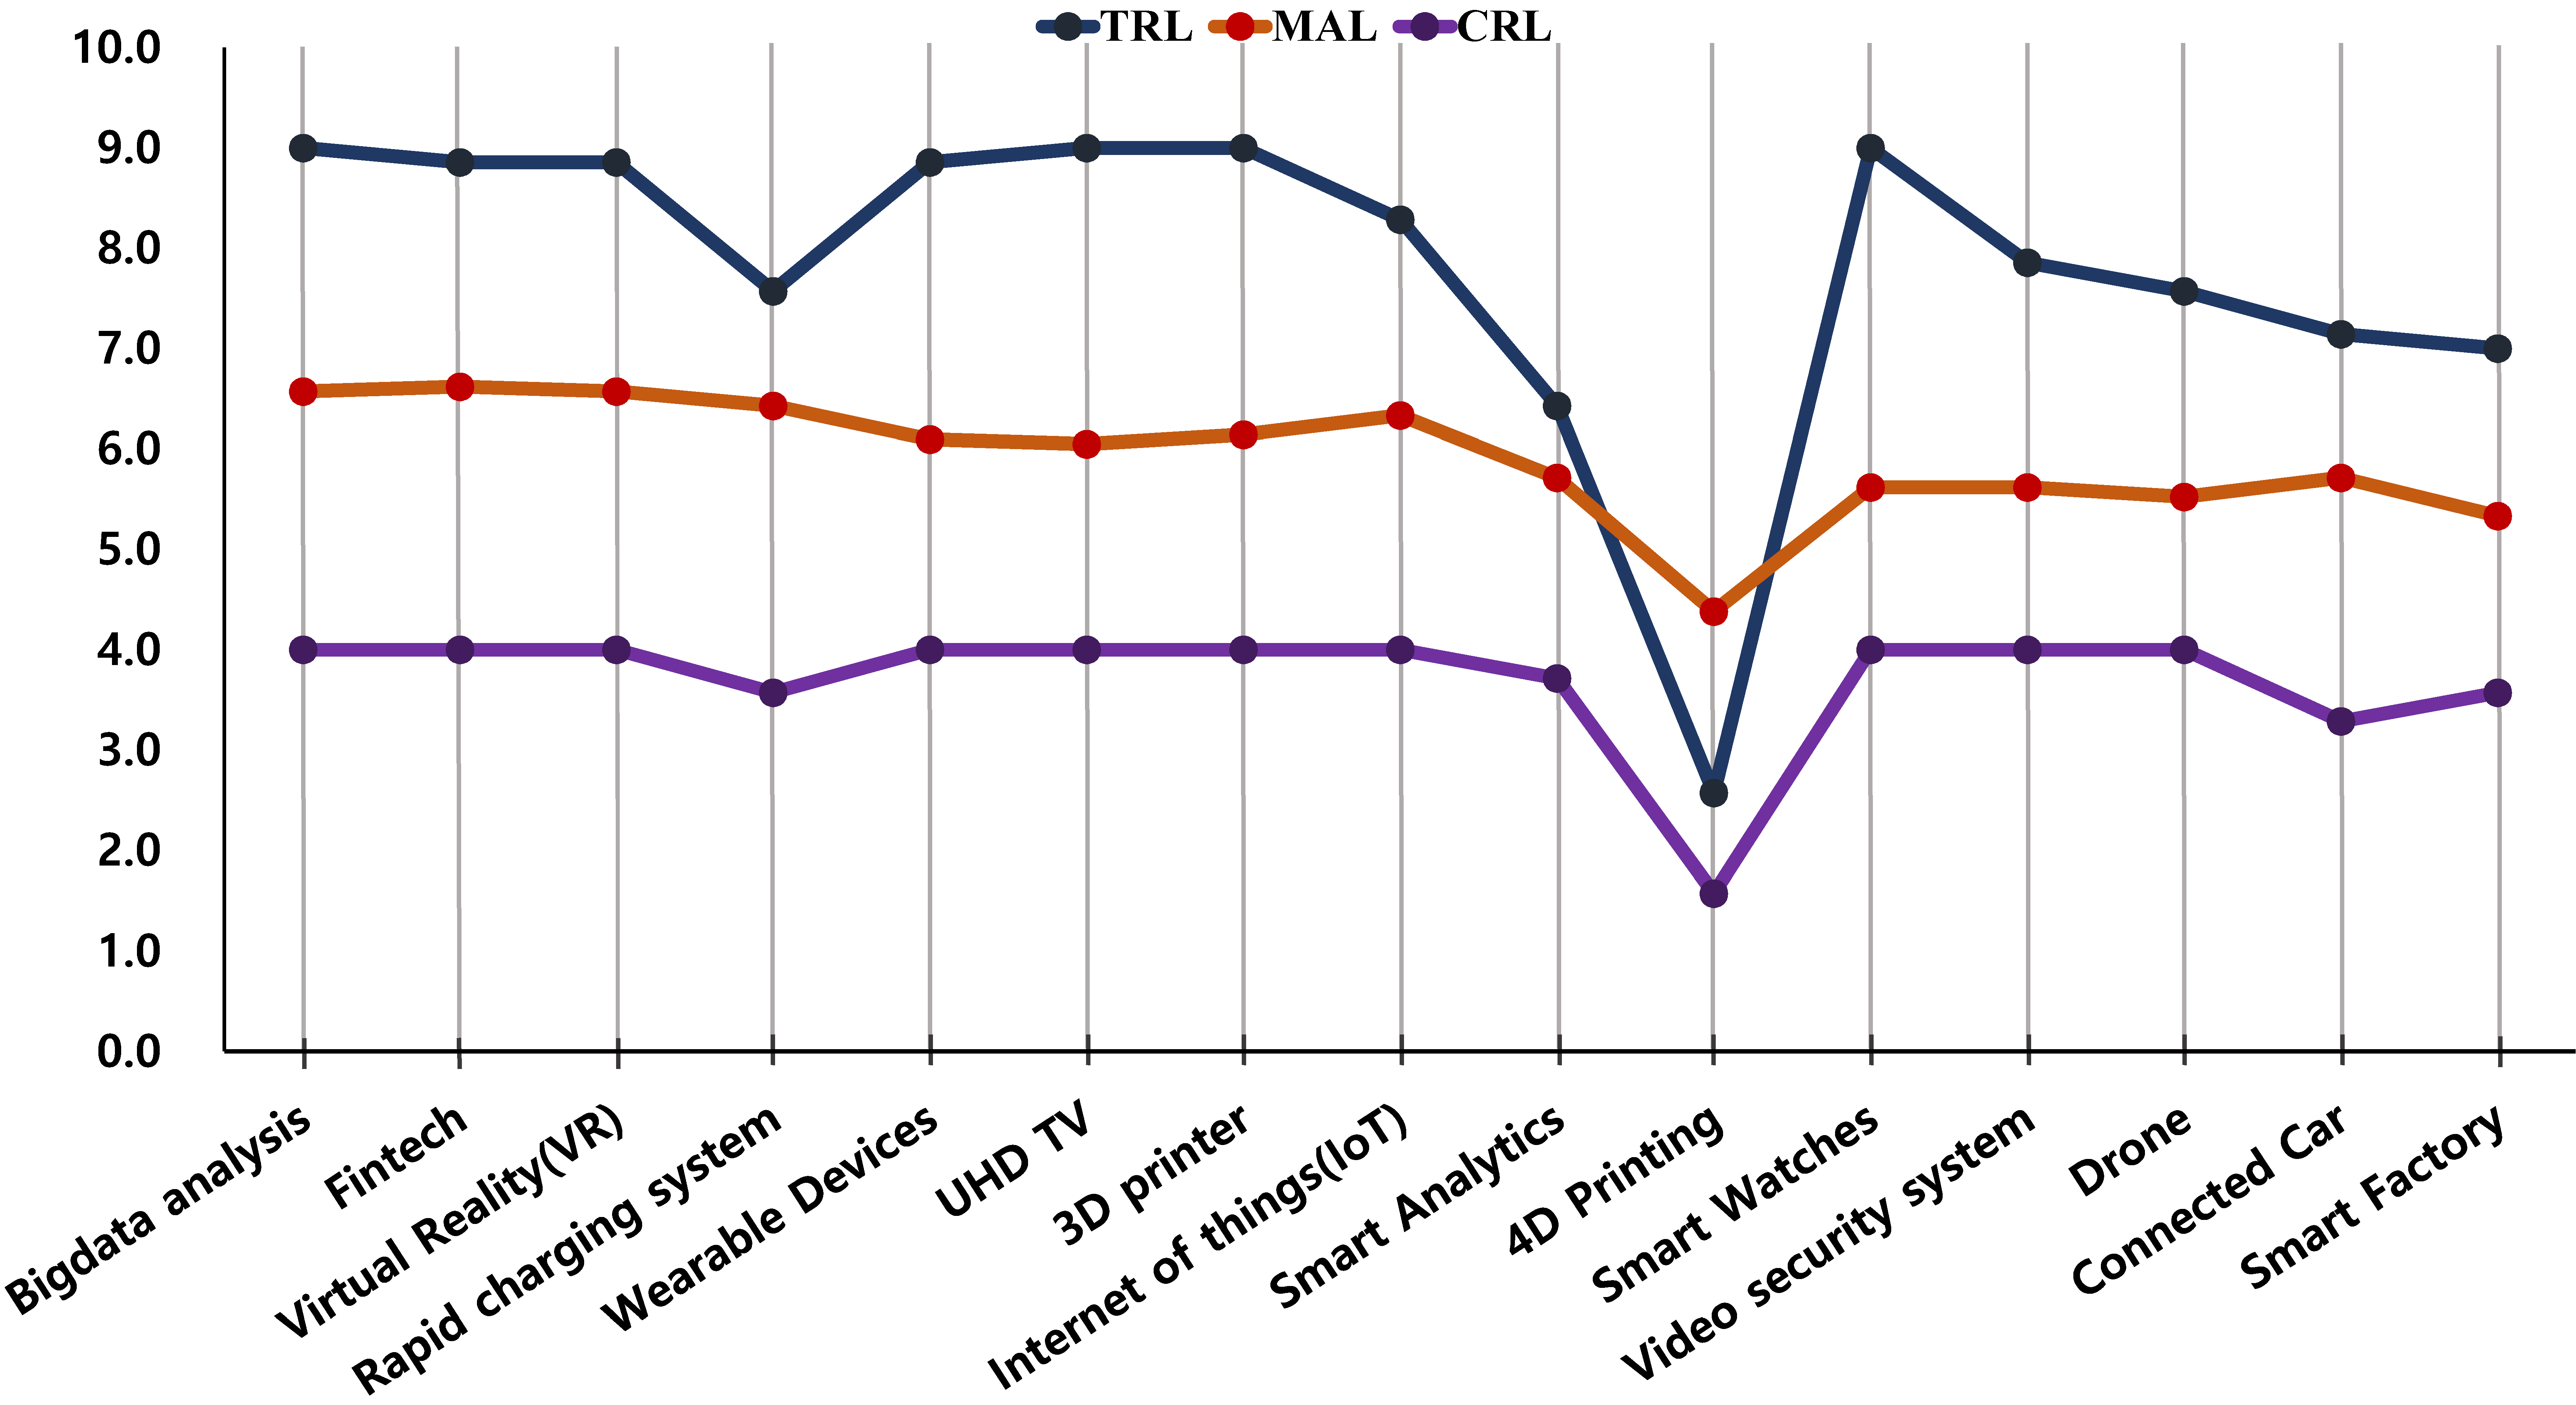
Figure 3.
Accumulated graph of the TRL-MAL-CRL of major top promising products in Google trends (over 20% of CAGR).
Figure 3.
Accumulated graph of the TRL-MAL-CRL of major top promising products in Google trends (over 20% of CAGR).

Figure 4.
Market attractiveness level (MAL) of major top promising products in Google trends (over 20% of CAGR).
Figure 4.
Market attractiveness level (MAL) of major top promising products in Google trends (over 20% of CAGR).

Figure 5.
The TRL-MAL of major top promising products in Google trends (less than 20% of CAGR).
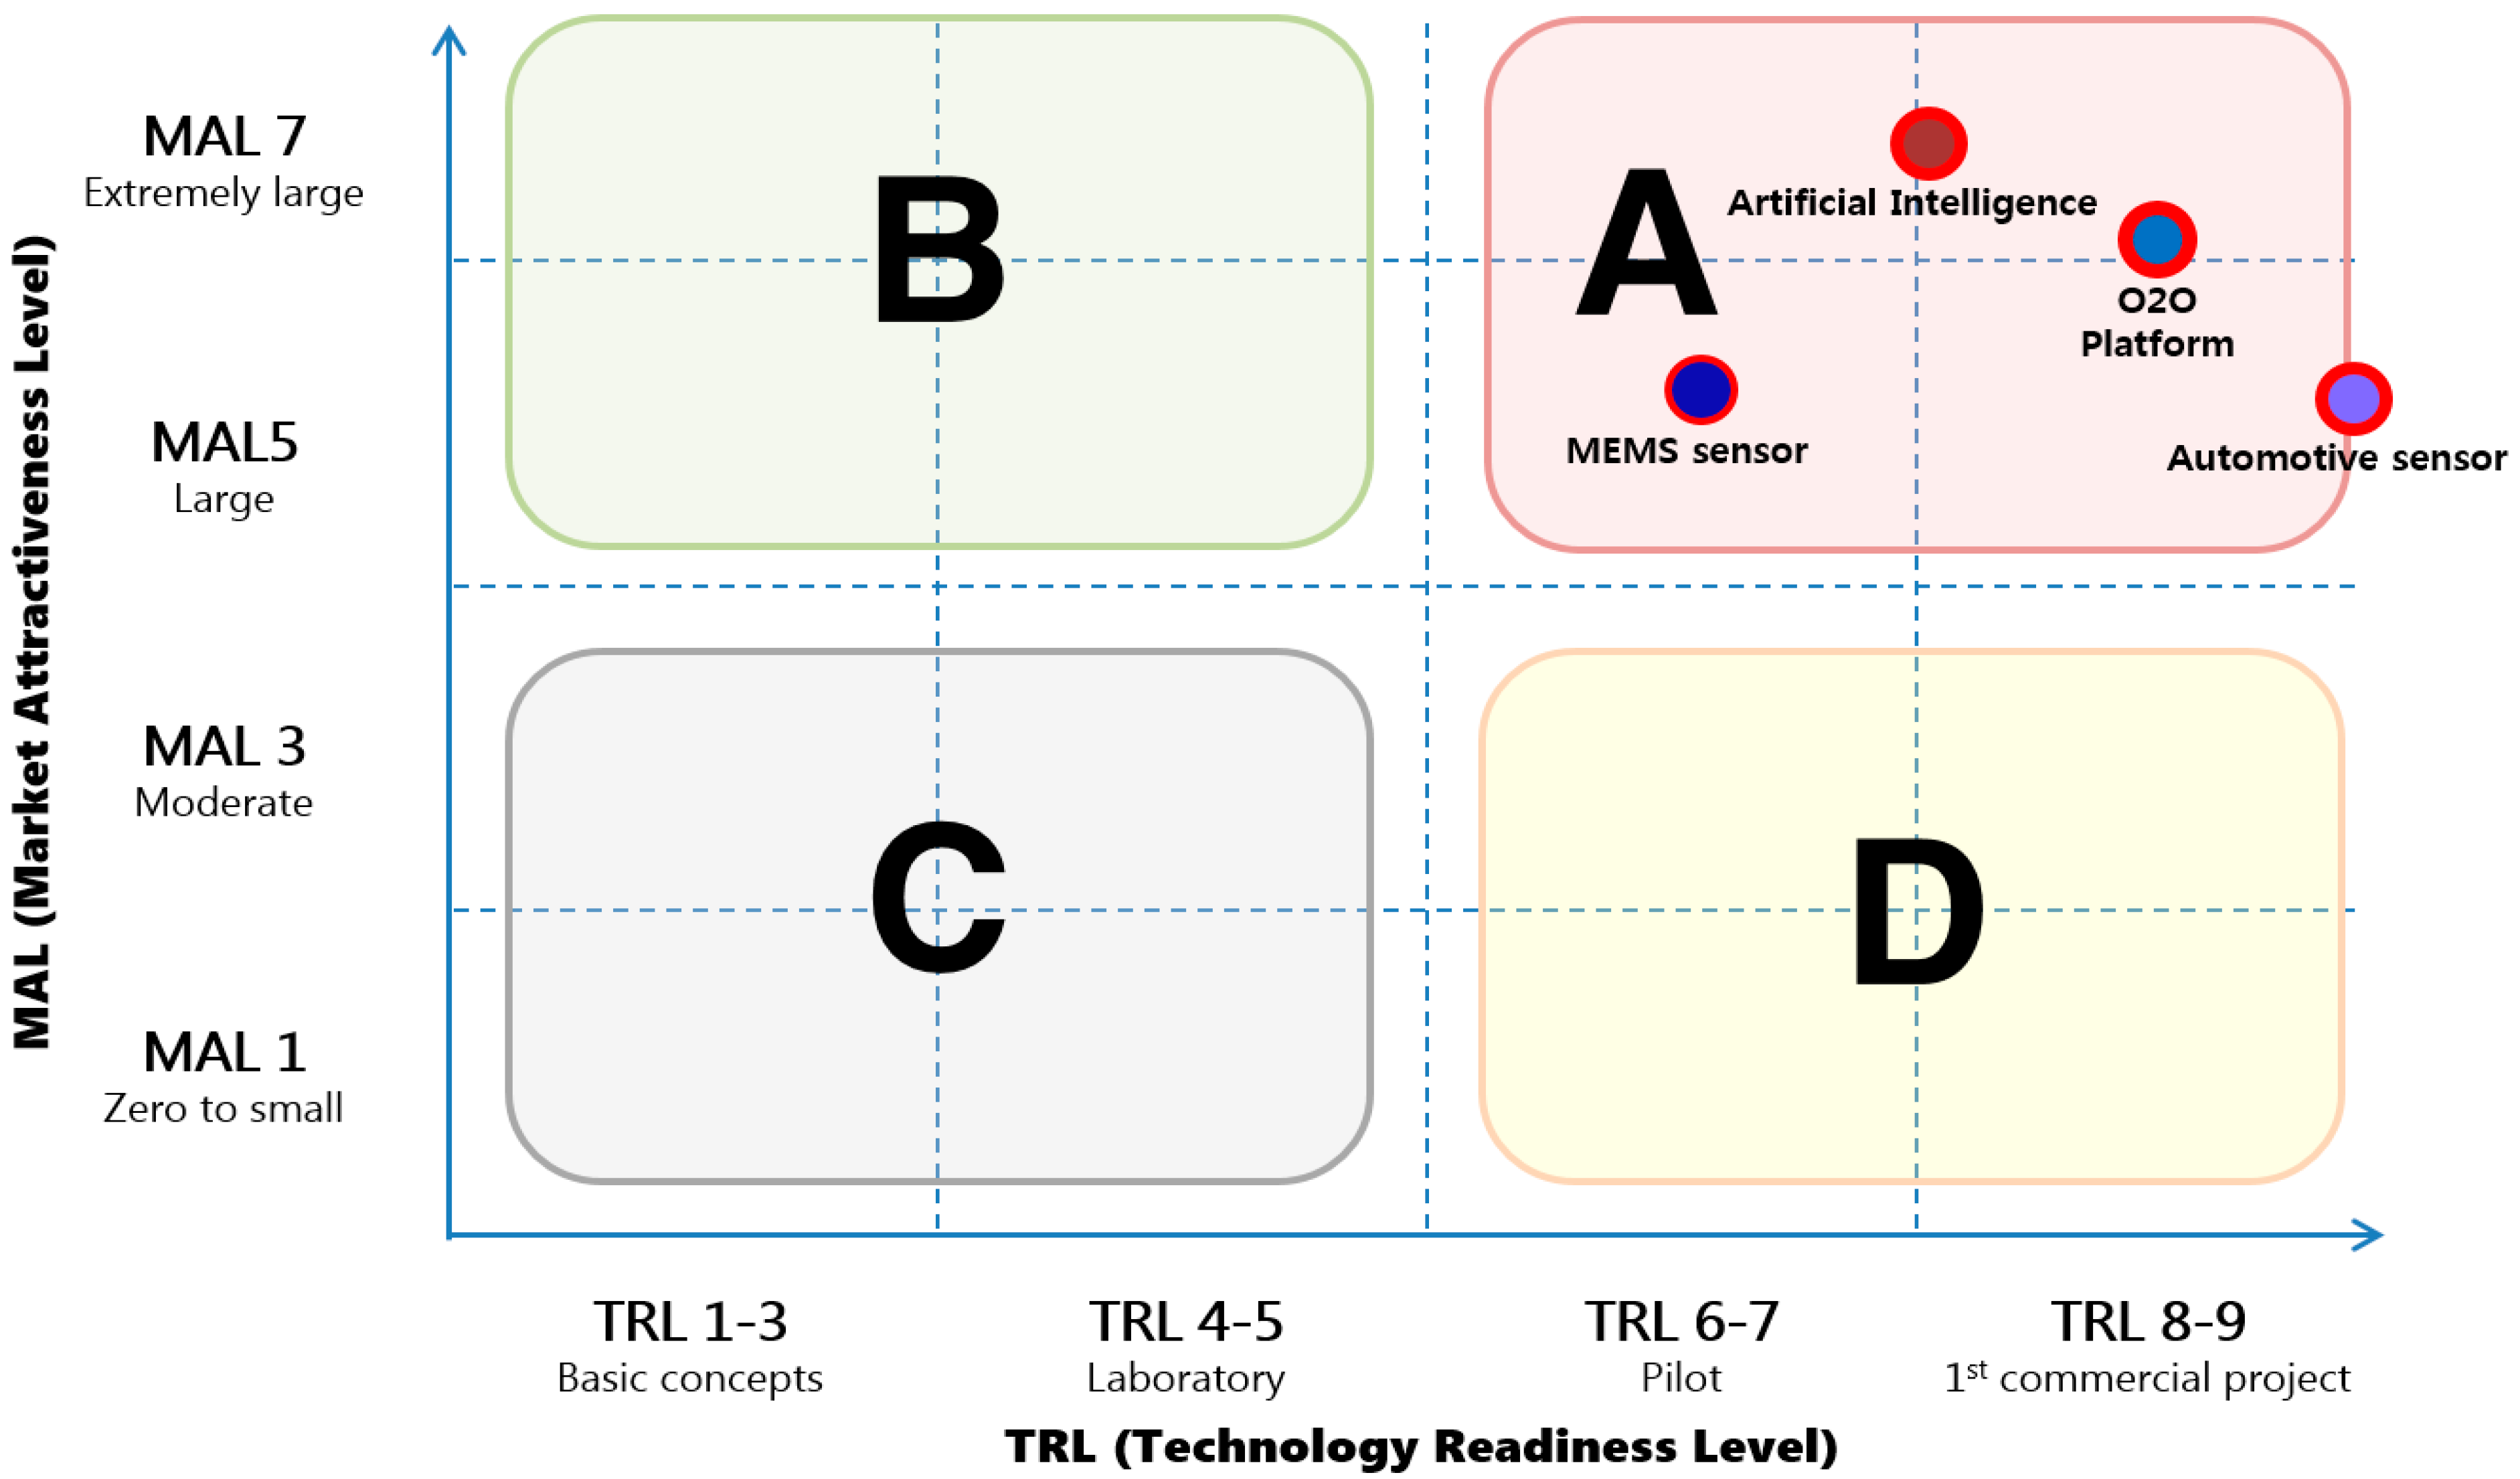
Figure 6.
TRL-MAL-CRL of major top promising products in Google trends (less than 20% of CAGR).

Figure 7.
The accumulated graph of TRL-MAL-CRL of major top promising products in Google trends (less than 20% of CAGR).
Figure 7.
The accumulated graph of TRL-MAL-CRL of major top promising products in Google trends (less than 20% of CAGR).
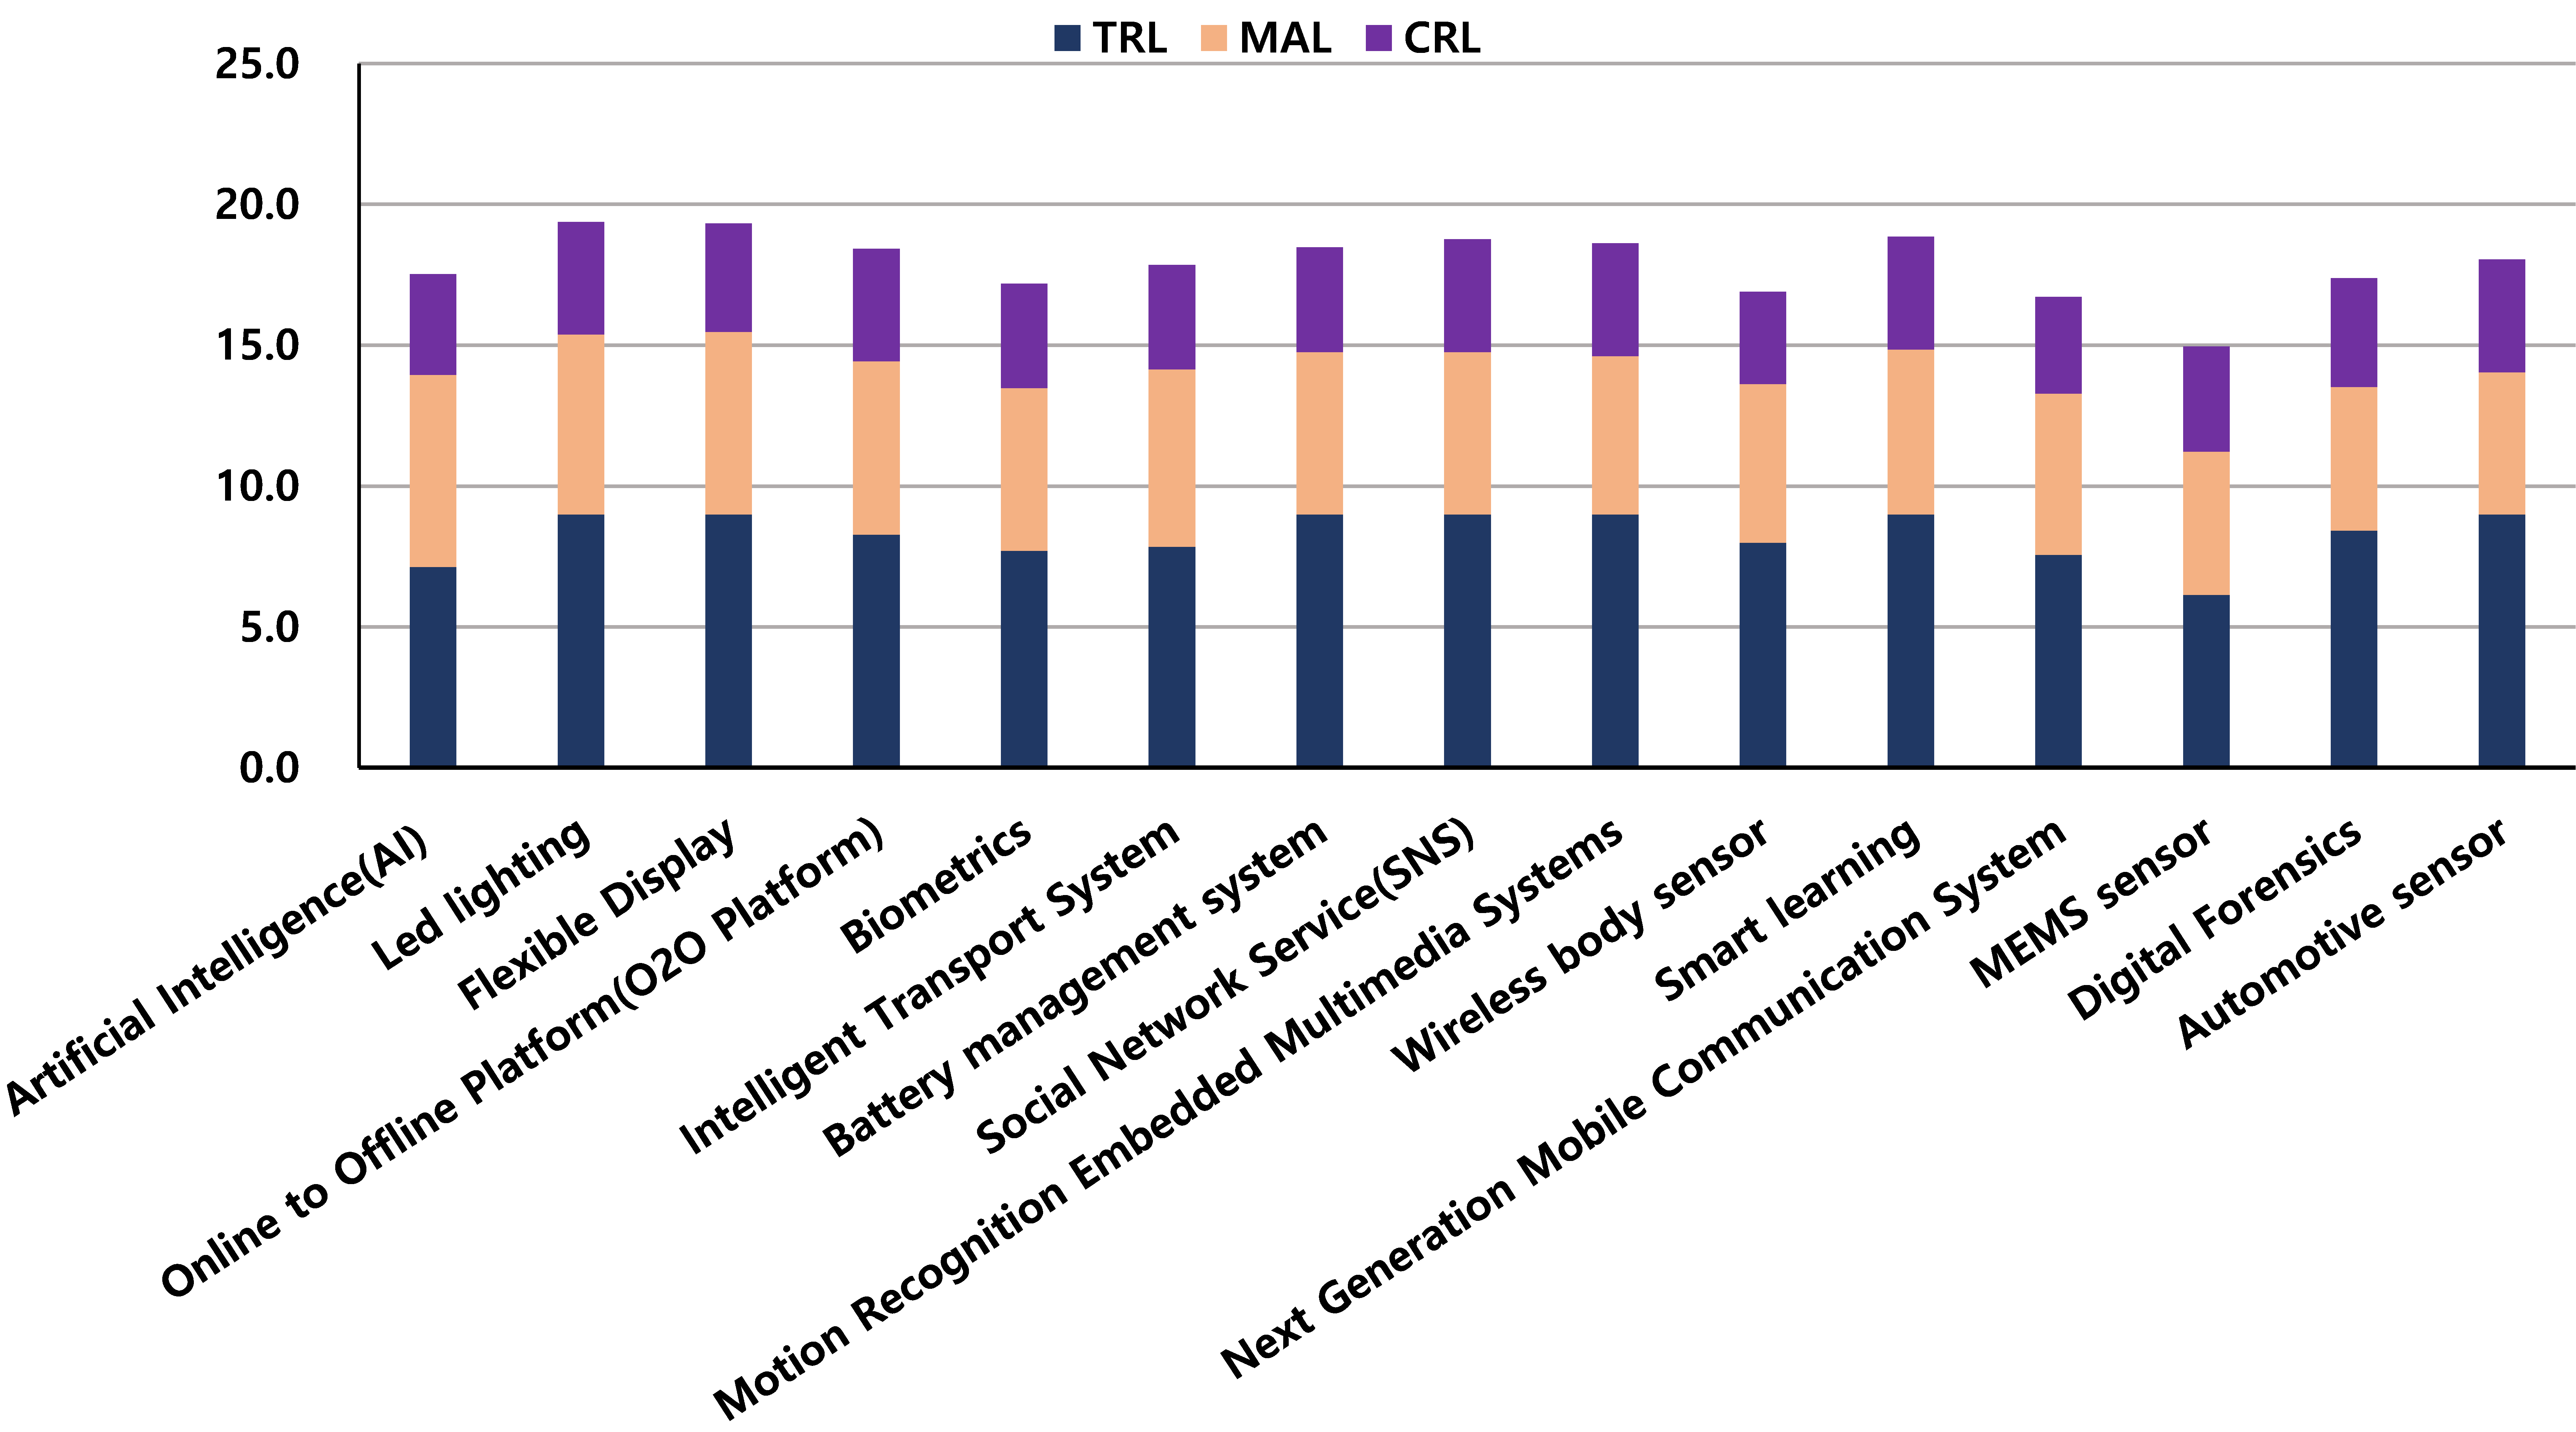
Figure 8.
The MAL of major top promising products in Google trends (less than 20% of CAGR).


Table 1.
Demand readiness level (DRL) and descriptions paired with technology readiness level (TRL).
Table 1.
Demand readiness level (DRL) and descriptions paired with technology readiness level (TRL).
| DRL | DRL Description | TRL Description | TRL |
|---|---|---|---|
| 1 | Occurrence of feeling “something is missing” | Market Certification and Sales Authorization | 9 |
| 2 | Identification of specific need | Product Industrialization | 8 |
| 3 | Identification of the expected functionalities for a new product/service | Industrial Prototype | 7 |
| 4 | Quantification of expected functionalities | Field demonstration of whole system | 6 |
| 5 | Identification of system capabilities | Technology Development | 5 |
| 6 | Translation of the expected functionalities into needed capabilities to build the response | Laboratory Demonstration | 4 |
| 7 | Definition of the necessary and sufficient competencies and resources | Research to prove feasibility | 3 |
| 8 | Identification of the experts possessing the competencies | Applied Research | 2 |
| 9 | Building the adapted answer to the expressed need in the market | Fundamental Research | 1 |
Table 2.
Technology readiness level (TRL) assessment standards.
| Classification | Stage | Definition | Explanation |
|---|---|---|---|
| Basic research | 1 | Basic theory/test | Establishment of basic theory |
| 2 | Establishment of concept of ideas, patents, etc. for practical purpose | Establishment of the concept of technology development and patent application for ideas | |
| Experimental | 3 | Verification of lab-sized basic performances | Verification of basic performance through test or computing simulation in a lab environment Ensuring of a basic design drawing of part/system to be developed |
| 4 | Assessment of lab-sized material/part/system core performance assessment | Completion of an assessment of key performance by manufacturing a test sample Selection of the optimal result out of various results withdrawn in step 3 Completion of optimization when computer simulation is available | |
| Prototype | 5 | Manufacturing and performance assessment of determined material/part/system pilot product | Completion of manufacturing and performance assessment of a lab pilot product of determined material/part/system Less than 1~several numbers of a pilot product samples manufactured despite designing in consideration of production of developed product Achievement of target performance to be commercialized in consideration only of the key performance of technology without consideration of economic efficiency |
| 6 | Manufacturing and performance assessment of pilot-sized product | Completion of manufacturing and assessment of a pilot-sized (several quantities~1/10 of mass production) pilot product Proposal of production, production capacity, and defective rate of pilot-sized products Large investment for pilot production Satisfying the target performance by conducting an independent field test similar to an environment to apply to consumers by the producer Ensuring a test score by a certification authority for the result of a performance assessment | |
| Practical | 7 | Reliability assessment and consumer assessment | Verification of performance in an environment for actual use In case of part and material development, a pilot product is assessed by a consumer on the spot (performance and reliability assessment) Submission of a reliability assessment result report of a certification authority |
| 8 | Pilot product approval and standardization | Acquisition of standardization and approval/license | |
| Commercial | 9 | Commercialization | Full-fledged mass production and commercialization Quality control including 6-Sigma |
Table 3.
Market attractiveness level (MAL) assessment standards (Unit: million $, %).
| Global market size | Less than 9.9 | 10~49.9 | 50~99.9 | 100~499.9 | 500~999.9 | 1000~9000 |
| 1 | 2 | 3 | 4 | 5 | 6 | |
| Global market growth rate | Less than 4.9 | 5~9.9 | 10~14.9 | 15~19.5 | 20~24.9 | 25~29.9 |
| 1 | 2 | 3 | 4 | 5 | 6 | |
| Policy suitability | Very small | Small | Slightly small | Medium | Slightly big | Big |
| 1 | 2 | 3 | 4 | 5 | 6 |
Table 4.
Customer readiness level (CRL) assessment standards.
| There will be needs for such products in 5 years. | There will be needs for such products within 1~5 years. | At least 1 person will buy such products at present. | Multiple number of people will buy such products at present. |
| 1 | 2 | 3 | 4 |
Table 5.
Promising products in the ICT/SW field.
| Promising Product | TRL | MAL | CRL | CAGR (%) | ||||
|---|---|---|---|---|---|---|---|---|
| Market Size | Growth Rate | Policy Suitability | Average | |||||
| 1 | Smart watches | 9.0 | 7.0 | 4.1 | 5.7 | 5.6 | 4.0 | 151.1 |
| 2 | UHD TV | 9.0 | 7.0 | 5.7 | 5.4 | 6.0 | 4.0 | 147.0 |
| 3 | Wearable devices | 8.9 | 7.0 | 5.7 | 5.6 | 6.1 | 4.0 | 87.2 |
| 4 | Big data analysis | 9.0 | 7.0 | 6.6 | 6.1 | 6.6 | 4.0 | 86.0 |
| 5 | Drone | 7.6 | 6.6 | 3.7 | 6.3 | 5.5 | 4.0 | 61.9 |
| 6 | Fintech | 8.9 | 6.9 | 6.4 | 6.6 | 6.6 | 4.0 | 61.9 |
| 7 | Rapid charging system | 7.6 | 6.7 | 6.3 | 6.3 | 6.4 | 3.6 | 56.8 |
| 8 | Internet of things (IoT) | 8.3 | 7.0 | 5.0 | 7.0 | 6.3 | 4.0 | 50.5 |
| 9 | 3D printer | 9.0 | 7.0 | 5.1 | 6.3 | 6.1 | 4.0 | 50.1 |
| 10 | Connected car | 7.1 | 7.0 | 3.6 | 6.6 | 5.7 | 3.3 | 42.7 |
| 11 | Virtual reality (VR) | 8.9 | 7.0 | 6.3 | 6.4 | 6.6 | 4.0 | 40.9 |
| 12 | Smart factory | 7.0 | 6.9 | 3.0 | 6.1 | 5.3 | 3.6 | 37.2 |
| 13 | 4D printing | 2.6 | 3.7 | 4.7 | 4.7 | 4.4 | 1.6 | 37.0 |
| 14 | Smart analytics | 6.4 | 6.6 | 4.7 | 5.9 | 5.7 | 3.7 | 24.8 |
| 15 | Video security system | 7.9 | 6.9 | 3.7 | 6.3 | 5.6 | 4.0 | 24.0 |
| 16 | Led lighting | 9.0 | 6.9 | 6.4 | 5.9 | 6.4 | 4.0 | 7.8 |
| 17 | Artificial Intelligence (AI) | 7.1 | 6.9 | 6.7 | 6.9 | 6.8 | 3.6 | 4.3 |
| 18 | Smart learning | 9.0 | 7.1 | 4.3 | 6.1 | 5.9 | 4.0 | 4.2 |
| 19 | Battery management system | 9.0 | 6.0 | 5.0 | 6.3 | 5.8 | 3.7 | 3.7 |
| 20 | Online to Offline Platform (O2O platform) | 8.3 | 6.9 | 5.7 | 5.9 | 6.1 | 4.0 | 3.3 |
| 21 | Digital Forensics | 8.4 | 5.7 | 3.0 | 6.6 | 5.1 | 3.9 | 3.3 |
| 22 | Wireless body sensor | 8.0 | 6.9 | 4.4 | 5.6 | 5.6 | 3.3 | 2.7 |
| 23 | Motion recognition embedded multimedia systems | 9.0 | 6.6 | 4.6 | 5.7 | 5.6 | 4.0 | 2.6 |
| 24 | Next generation mobile communication system | 7.6 | 7.0 | 3.6 | 6.6 | 5.7 | 3.4 | 2.5 |
| 25 | Automotive sensor | 9.0 | 6.9 | 2.1 | 6.1 | 5.0 | 4.0 | 1.5 |
| 26 | Flexible display | 9.0 | 7.0 | 5.9 | 6.6 | 6.5 | 3.9 | 0.0 |
| 27 | MEMS sensor | 6.1 | 6.9 | 3.0 | 5.4 | 5.1 | 3.7 | −0.2 |
| 28 | Intelligent transport system | 7.9 | 7.0 | 5.0 | 6.9 | 6.3 | 3.7 | −0.3 |
| 29 | Social Network Service (SNS) | 9.0 | 7.0 | 4.6 | 5.7 | 5.8 | 4.0 | −0.4 |
| 30 | Biometrics | 7.7 | 6.0 | 5.6 | 5.7 | 5.8 | 3.7 | −1.4 |
| 31 | Fuel cell | 9.0 | 7.0 | 7.0 | 6.4 | 6.8 | 4.0 | −6.3 |
| 32 | Advanced computing | 8.0 | 6.1 | 3.9 | 5.1 | 5.0 | 3.4 | −7.0 |
| 33 | Digital Security | 9.0 | 7.0 | 3.1 | 6.3 | 5.5 | 3.9 | −7.3 |
| 34 | Inertial navigation system | 9.0 | 6.9 | 3.0 | 4.9 | 4.9 | 4.0 | −7.4 |
| 35 | Structural health monitoring | 8.9 | 6.1 | 4.3 | 5.6 | 5.3 | 4.0 | −8.4 |
| 36 | Supercomputers | 8.7 | 6.4 | 2.6 | 5.1 | 4.7 | 3.6 | −9.1 |
| 37 | Mobile game | 9.0 | 7.0 | 4.4 | 5.6 | 5.7 | 4.0 | −9.2 |
| 38 | Photonics | 9.0 | 6.9 | 6.9 | 5.6 | 6.4 | 4.0 | −10.6 |
| 39 | Location based service | 8.3 | 6.7 | 5.0 | 5.3 | 5.7 | 3.9 | −11.2 |
| 40 | Speech recognition device | 9.0 | 6.0 | 6.3 | 5.9 | 6.0 | 3.7 | −11.3 |
| 41 | Memristor | 5.3 | 6.3 | 6.9 | 5.3 | 6.1 | 2.3 | −13.5 |
| 42 | Explosives detection system | 7.3 | 6.1 | 3.0 | 6.0 | 5.0 | 4.0 | −14.3 |
| 43 | Smart grid | 6.7 | 7.0 | 4.3 | 6.0 | 5.8 | 3.7 | −16.1 |
| 44 | Wireless energy transfer | 8.6 | 6.7 | 6.0 | 5.9 | 6.2 | 3.7 | −16.1 |
| 45 | Cloud computing | 8.3 | 7.0 | 5.0 | 6.3 | 6.1 | 3.7 | −18.6 |
| 46 | Real time translator system | 7.1 | 6.9 | 3.3 | 5.4 | 5.2 | 3.3 | −20.8 |
| Average | 8.1 | 6.7 | 4.8 | 6.0 | 5.8 | 3.7 | 17.5 | |
| Min | 2.6 | 3.7 | 2.1 | 4.7 | 4.4 | 1.6 | −20.8 | |
| Max | 9.0 | 7.1 | 7.0 | 7.0 | 6.8 | 4.0 | 151.1 | |
| Difference | 6.4 | 3.4 | 4.9 | 2.3 | 2.4 | 2.4 | 171.9 | |
Table 6.
Top 10 promising products in the ICT/SW field.
| Promising Product | TRL | MAL | CRL | Sum | Google Trends | |
|---|---|---|---|---|---|---|
| No. of Cases | CAGR (%) | |||||
| Virtual Reality (VR) | 8.9 | 6.6 | 4.0 | 19.4 | 15,200,000 | 40.9 |
| Photonics | 9.0 | 6.4 | 4.0 | 19.4 | 6,340,000 | −10.6 |
| Led lighting | 9.0 | 6.4 | 4.0 | 19.4 | 4,510,000 | 7.8 |
| 3D printer | 9.0 | 6.1 | 4.0 | 19.1 | 3,520,000 | 50.1 |
| Fintech | 8.9 | 6.6 | 4.0 | 19.5 | 3,350,000 | 61.9 |
| Fuel cell | 9.0 | 6.8 | 4.0 | 19.8 | 3,070,000 | −6.3 |
| UHD TV | 9.0 | 6.0 | 4.0 | 19.0 | 384,000 | 147.0 |
| Wearable devices | 8.9 | 6.1 | 4.0 | 19.0 | 375,000 | 87.2 |
| Big data analysis | 9.0 | 6.6 | 4.0 | 19.6 | 108,000 | 86.0 |
| Flexible display | 9.0 | 6.5 | 3.9 | 19.3 | 72,800 | 0.0 |
© 2018 by the authors. Licensee MDPI, Basel, Switzerland. This article is an open access article distributed under the terms and conditions of the Creative Commons Attribution (CC BY) license (http://creativecommons.org/licenses/by/4.0/).
Share and Cite
MDPI and ACS Style
Kwon, Y.-I.; Son, J.-K. A Case Study on the Promising Product Selection Indicators for Small and Medium-Sized Enterprises (SMEs). J. Open Innov. Technol. Mark. Complex. 2018, 4, 56. https://doi.org/10.3390/joitmc4040056
AMA Style
Kwon Y-I, Son J-K. A Case Study on the Promising Product Selection Indicators for Small and Medium-Sized Enterprises (SMEs). Journal of Open Innovation: Technology, Market, and Complexity. 2018; 4(4):56. https://doi.org/10.3390/joitmc4040056
Chicago/Turabian StyleKwon, Young-Il, and Jong-Ku Son. 2018. "A Case Study on the Promising Product Selection Indicators for Small and Medium-Sized Enterprises (SMEs)" Journal of Open Innovation: Technology, Market, and Complexity 4, no. 4: 56. https://doi.org/10.3390/joitmc4040056